Optimal Rescue Ship Locations Using Image Processing and Clustering

1
Department of Marine Science and Production, Kunsan National University, Gunsan 54150, Jeonbuk, Korea
2
Mokpo Maritime University, Mokpo 58628, Jeonnam, Korea
*
Author to whom correspondence should be addressed.
Symmetry 2019, 11(1), 32; https://doi.org/10.3390/sym11010032
Submission received: 15 October 2018
/
Revised: 7 December 2018
/
Accepted: 11 December 2018
/
Published: 2 January 2019
(This article belongs to the Special Issue Symmetry in Computing Theory and Application)
Abstract
:Currently, globalization of the world economy has also resulted in a shipping volume increase. However, this growth in maritime traffic has led to increased risk of marine accidents. These accidents have a higher probability of occurring in regions where geographical features such as islands are present. Further, the positioning of rescue ships in a particular ocean region with a high level of maritime activity is critical for rescue operations. This paper proposes a method for determining an optimal set of locations for stationing rescue ships in an ocean region with numerous accident sites, such as in the Wando islands of South Korea. The computational challenge in this problem is identified as the positioning of numerous islands of varying sizes located in the region. Thus, the proposed method combines a clustering-based optimization method and an image processing approach that incorporates flood filling to calculate the shortest pixel value between two points in the ocean that detours around the islands. Experimental results indicate that the proposed method reduces the distance between rescue ships and each accident site by 5.0 km compared to the original rescue ship locations. Thus, rescue time is reduced.
1. Introduction
Approximately 90% of the world’s trade is conducted by sea, and the volume of cargo and the number of ships entering and leaving ports continues to increase with economic growth [1]. Concomitant with this growth in maritime traffic is the increased risk of marine accidents [2]. The occurrence of marine accidents is higher in regions closer to shore, primarily because of the increased ocean traffic and the resulting collisions. This is also affected by geographical features such as islands. Studies have shown that human error continues to be the dominant factor in maritime accidents [3].
On the other hand, there is an issue about search and rescue operations for migrants at sea [4,5,6]. In most cases, it is possible to save lives and cargo through appropriately managed rescue operations. Search and rescue operations are of vital importance to address this situation and for the safety of passengers and cargo.
The success of a rescue operation primarily depends on the time required for a rescue ship to reach an accident site. Thus, the positioning of rescue ships in a particular region of the ocean is critical for rescue operations. The selection of a particular location for the placement of a rescue ship depends on two main factors. First, the suitability of the location for a rescue operation should be analyzed considering the regional geography and the availability of resources. Secondly, there must be a scientific measure of the effectiveness of locating a rescue ship. However, until now, only a small number of scientific studies have focused on the problem of the effective positioning of rescue ships. Further, rescue ship positioning is predominantly carried out in a subjective manner without scientific or statistical support. The analysis of present rescue ship locations shows that they are in fact situated far away from the clusters of accident sites, i.e., locations with historically recorded incidents. However, as the distance from an accident site affects the effectiveness of rescue operations, it is important to assess this factor statistically and scientifically.
Numerous studies have focused on the general subject of rescue operation optimization, but only a few studies have focused on the optimization of operations based on the location of rescue ships. Astbury [7] investigated search area determination and search unit deployment. This is a meaningful study in terms of the spatial deployment of search and rescue forces after an accident. However, the study does not examine where to ordinarily deploy rescue ships at sea for emergency situations. Trim [8] developed a method for improving the radar visibility of search and rescue transponder responses, and Díaz et al. [9] proposed that very high frequency (VHF) radio direction finders and infrared detectors are essential on rescue ships. These are studies of the equipment required for performing an efficient search. Azofra et al. [10] discussed the problem with a view of sharing resources for rescue with regional and national governments in places of possible conflicts of interest. Afshartous et al. [11] investigated the uncertainty of the accuracy of distress call detection in addition to resource allocation. Stone et al. [12] proposed a method of optimization in rescue operations that optimally predicts accident sites based on distress calls. However, they focused on modeling and simulation-based approaches and did not explicitly deal with the positioning of rescue ships, which is a major factor. Zarandi et al. [13] considered the problem as a large-scale maximal covering location problem and viewed locations as nodes characterized by a set of attributes in a multiconnected graph. Akbari et al. [14] conducted optimization based on mean access time from rescue ship stations to accident site locations using data from the Atlantic coastline region of Canada. In contrast to the studies cited above, our study primarily focused on the optimization of rescue ship locations based on physical location and the realistic navigable distance between these locations and accident-prone areas.
Our study focused on the optimization of the distance from rescue ships to accident sites in the study area. The contributions of this study can be summarized as follows: (1) This was the first attempt of using an image processing approach to calculate the shortest distance between two points in the ocean that detours around islands. (2) The flood-filling algorithm was employed to estimate the shortest distance between two points. (3) A clustering method based on the combinations of the number of rescue ship location candidates was applied to assign rescue ships. Consequently, it will be possible to optimally arrange limited rescue ships using the technique developed in this study to ensure fast rescue in a region of numerous islands.
2. Related Works
In this section, we review the related works on optimal rescue ships.
2.1. Shoreline and Sea-Land Segmentation
There are a variety of methods for the extraction of shorelines. Billa and Pradhan [15] presented a method that used satellite images. Zhang et al. [16] also proposed the extraction of coastlines in aquaculture coasts from satellite images. Dang et al. [17] extracted shorelines based on the tide model from satellite stereo images. However, there is one disadvantage of satellite images; extraction of the shoreline from satellite images is affected by weather conditions.
Sea-land segmentation is an important step for experiments. Previous studies mostly addressed the problems related to sea-land segmentation using satellite images. Ren et al. [18] proposed a sea-land segmentation method for optical remote sensing images. Cheng et al. [19] performed sea–land segmentation using seeds learning and edge-directed graph cut. Zhuang et al. [20] used the middle wave infrared remote technology for sea–land segmentation. However, these methods experience the problem that a ship in a satellite or lidar image can be recognized as an island during image processing. Removing ships from the satellite images of the ocean is a cumbersome process. In addition, it is technically difficult owing to the complex texture and uneven gray value of land in satellite images [21]. This problem can be solved by simply extracting coastline information without using satellite or lidar images.
A navigator can easily access interesting information using electronic navigational charts (ENC) to monitor the path of a ship and to assess the situation based on the constant display of the ship’s position. In accordance with the International Hydrographic Organization (IHO) standards, an ENC should include all necessary information related to safe navigation. One of the essential information is about coastlines [22].
2.2. Estimation of Optimal Location of Rescue Ships
Previous studies mostly considered Euclidean distance. Afshartous et al. [11] and Zarandi et al. [10] measured Euclidean distance. Yoo and Jung [23] applied the K-means method for the optimal arrangement of rescue ships. They calculated the Euclidean distance between a rescue ship and an accident site in open sea. However, the K-means method can be applied only to open sea without islands. In addition, Euclidean distance cannot be applied if there are numerous islands because there is an issue in using straight or direct route calculation in this case.
Moroni et al. [24] and Pieri et al. [25] developed information systems for detecting and monitoring environmental endangering situations such as oil spills at sea. Risk maps can help in deploying rescue ships in the most hazardous areas, but efficient deployment should be considered with limited number of resources such as two and three.
3. Methods
The proposed method comprises four stages. In the first stage, the rectangular study area is converted to an image with pixel values marked as “0” (black) for land and “1” (white) for water. In the second stage, a set of candidates for rescue ship locations are defined and the shortest distance from each accident site to each rescue ship location candidate is calculated using the flood-filling algorithm. In the third stage, the best combination of rescue ship locations is selected. The fourth stage compares and evaluates the suitability of the optimal locations found in the third stage.
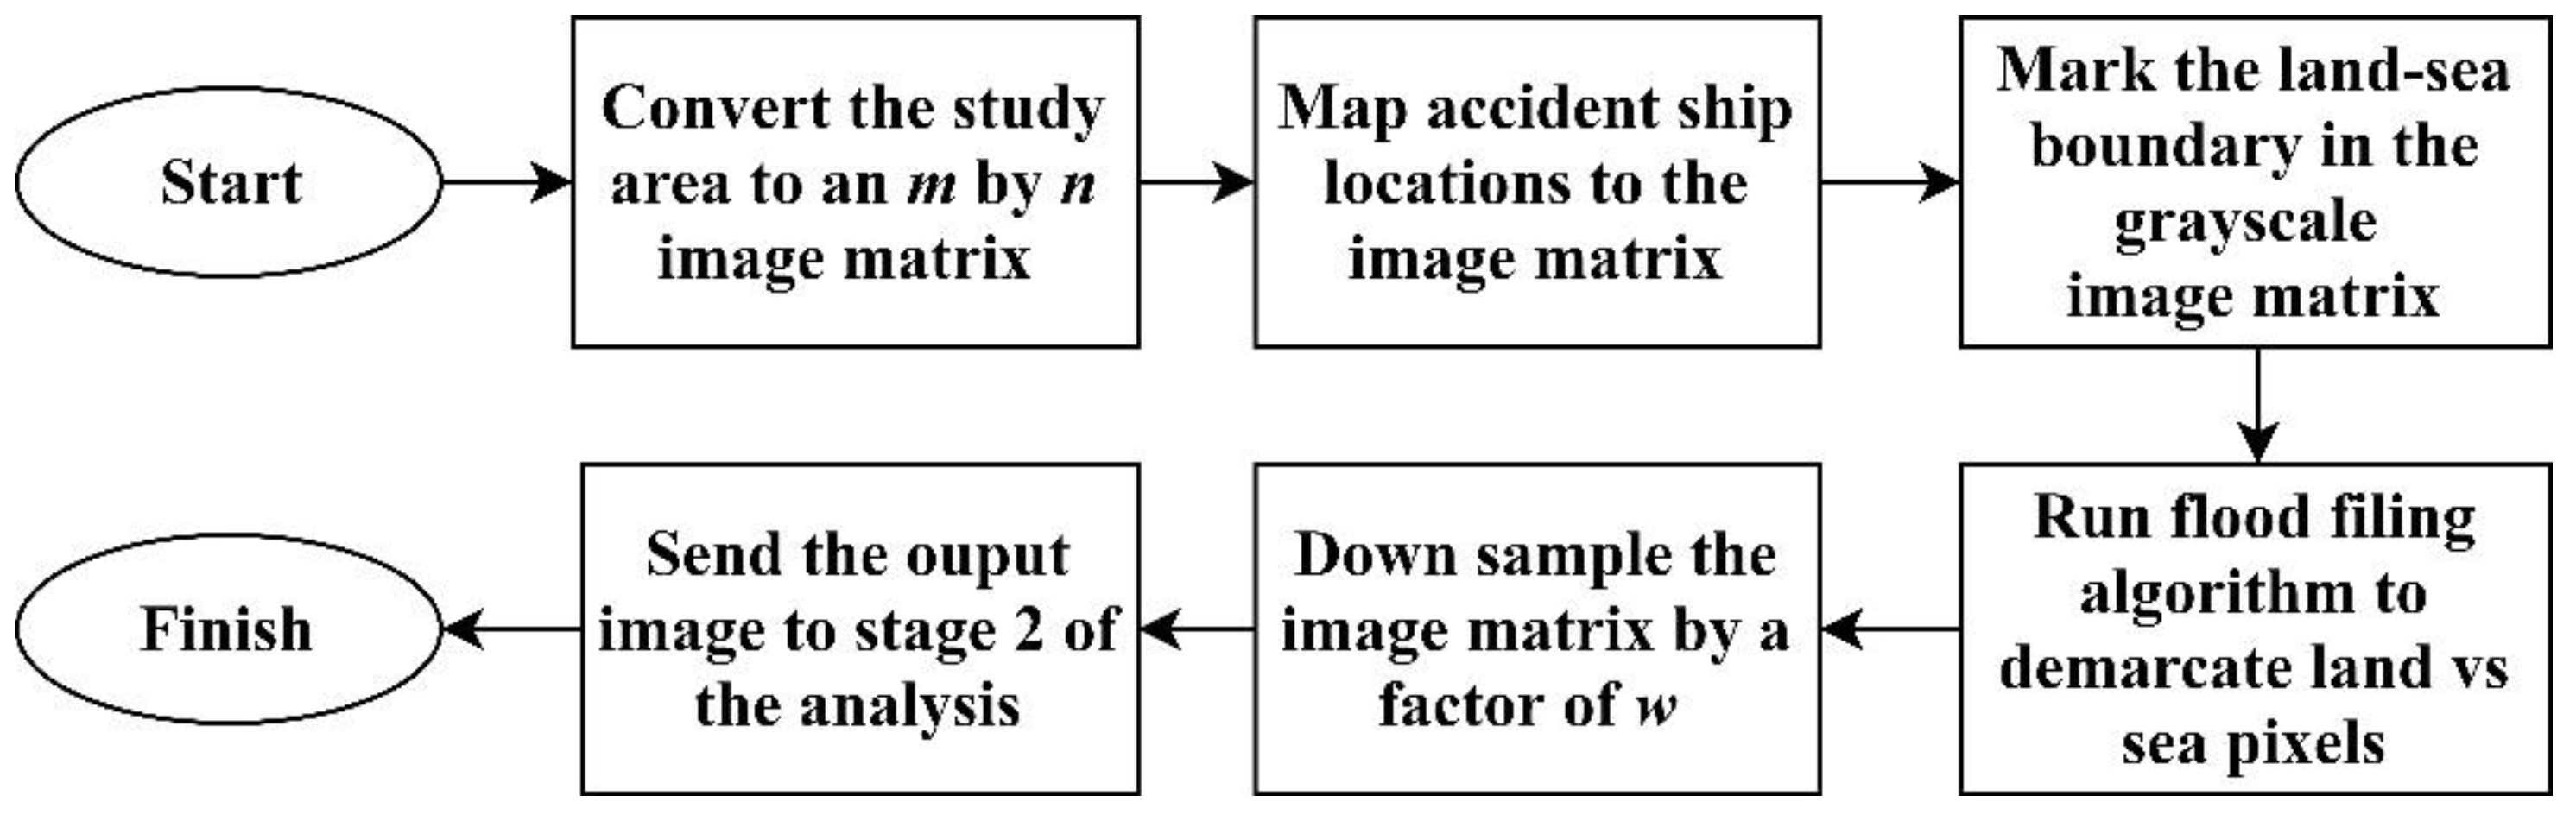
3.1. Stage 1: Converting the Study Area to Image Format
The challenge of finding the true optimum location for rescue ships in the study area is that the ships must detour around several islands. As a result, an approach where a large number of islands is neglected and Euclidean distances are used for the optimization of the location of rescue ships would be inaccurate and misleading because rescue ships cannot navigate across islands.
Thus, to mitigate this problem, we represent the study area as an image by vectorizing it into a matrix of dimensions m × n using Equation (1). A large grid size provides more accurate results but increases computation time. Thus, a grid size of 1000 is selected for a suitable balance between accuracy and computation time. With this choice, a pixel in the image matrix corresponds to a distance of 221 m in the original study area, which is acceptable in terms of ship navigation.
Each accident site (i) and the original rescue ship locations are also transformed into the matrix format using Equation (2). The objective is to reduce the size of the matrix to be as small as possible with a view of minimizing computation time. To ensure that this matrix includes all accident sites in the study area, the boundaries of the study area are defined by the maximum and minimum latitudes and longitudes. The transformation in Equation (2) maps the maximum latitude and minimum longitude to the first row and column of the matrix, respectively. The last row and column correspond to the minimum latitude and maximum longitude of the accident sites, respectively. The resulting matrix is the smallest matrix that includes all accident sites.
The obtained RGB image is converted to grayscale using Equation (3) to enable further processing as an image [26,27].
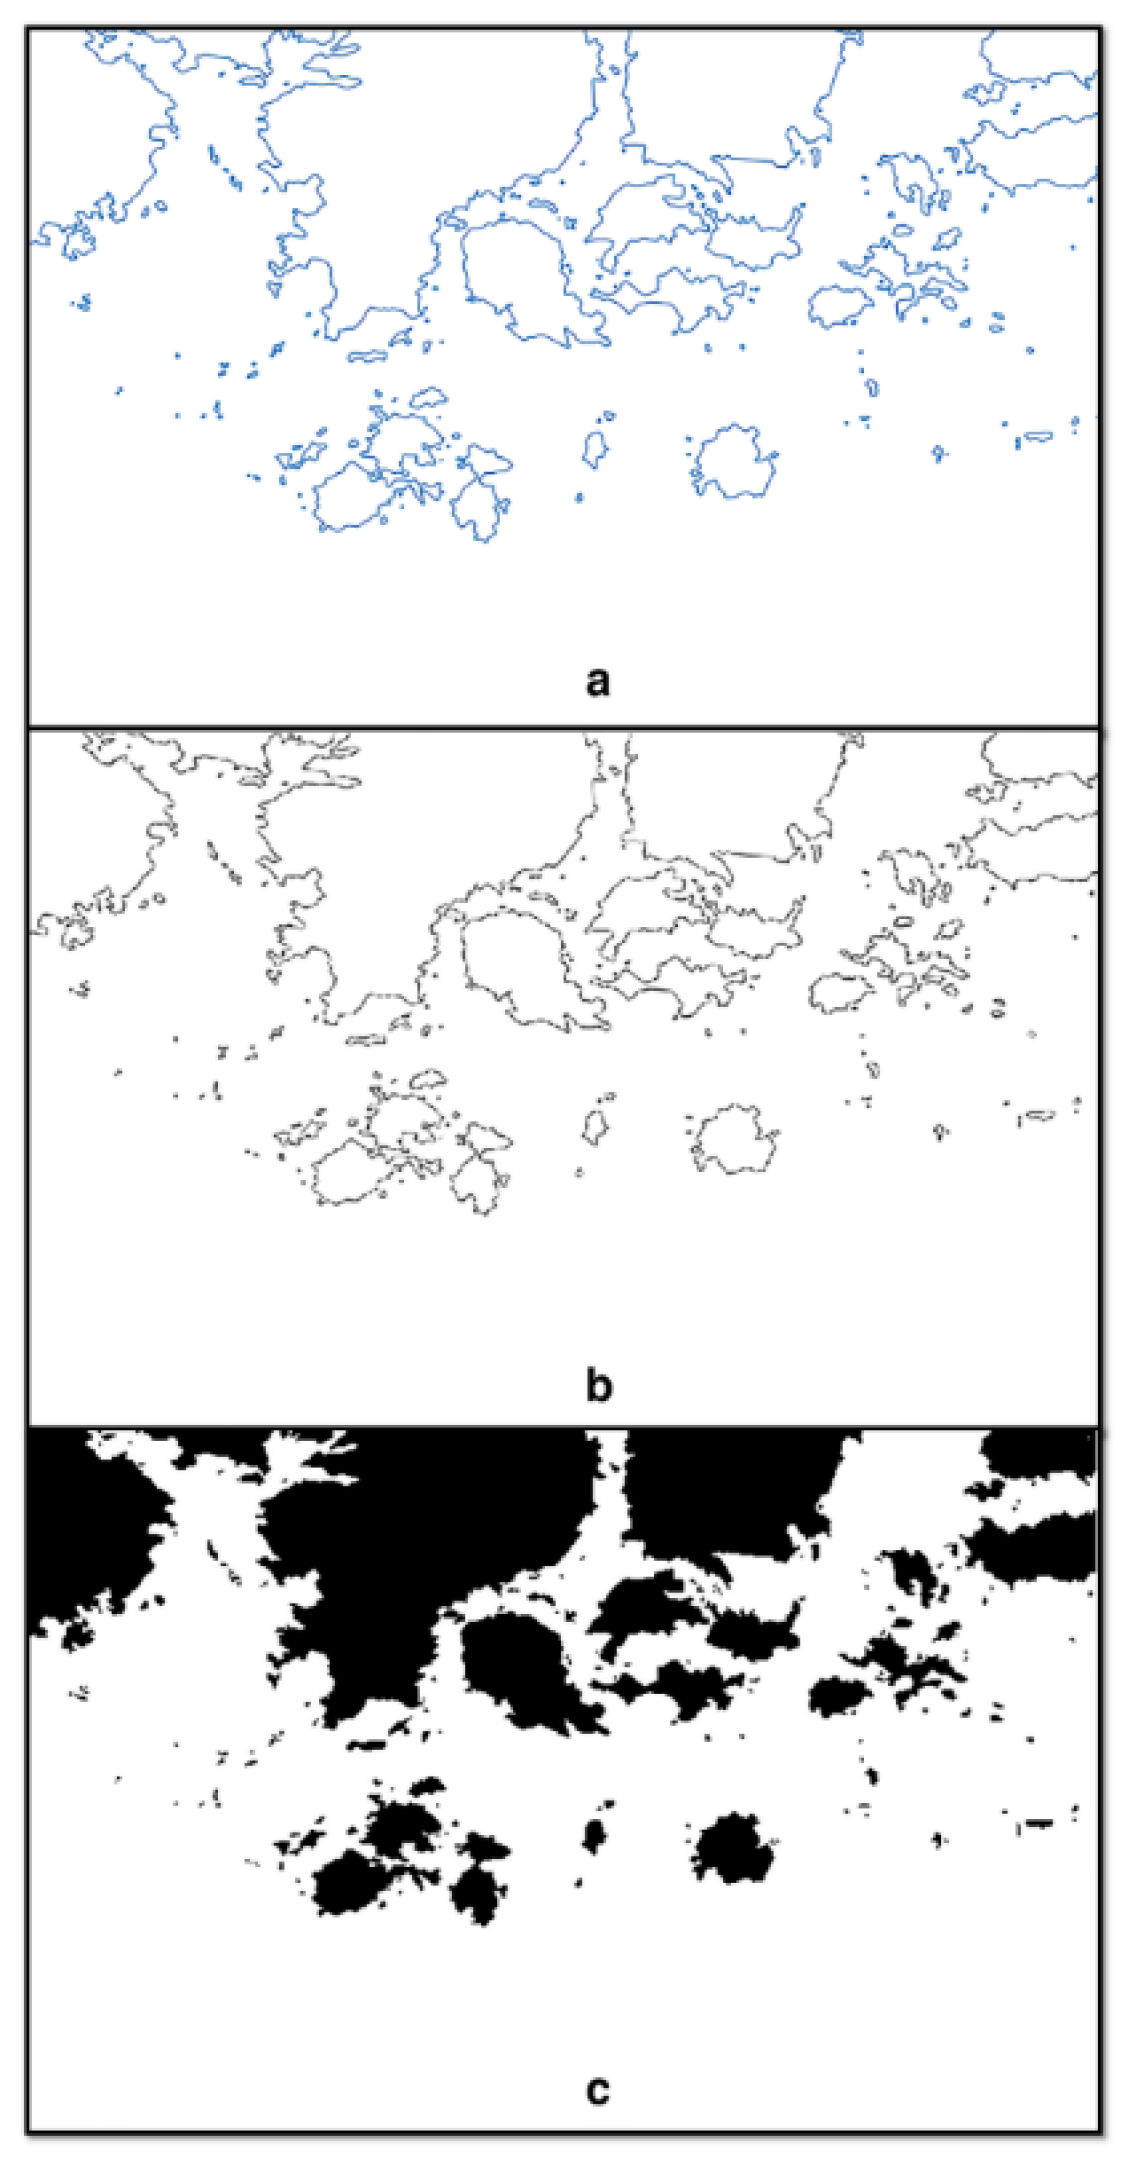
Further, the boundaries of the islands are corrected to ensure that they become closed images. Then, the flood-filling algorithm is used to identify the land and sea areas and denote them in the matrix as “0” (black) and “1” (white), respectively. The resulting image is a binary image comprising black and white pixels represented by a matrix of zeros and ones. The image matrix is reduced by a factor of w = 2 to decrease the required computation time. This is done by selecting each alternating pixel so that the new dimension of the image matrix is (m/w) × (n/w). The flowchart in Figure 1 describes this image processing stage.
3.2. Stage 2: Flood-Filling Algorithm
In the proposed method, the flood-filling algorithm [28,29,30] is used to find the shortest path from each candidate (explained in Stage 3) for a rescue ship location to each accident site. The same algorithm is also used to identify the land and sea areas of the map matrix.
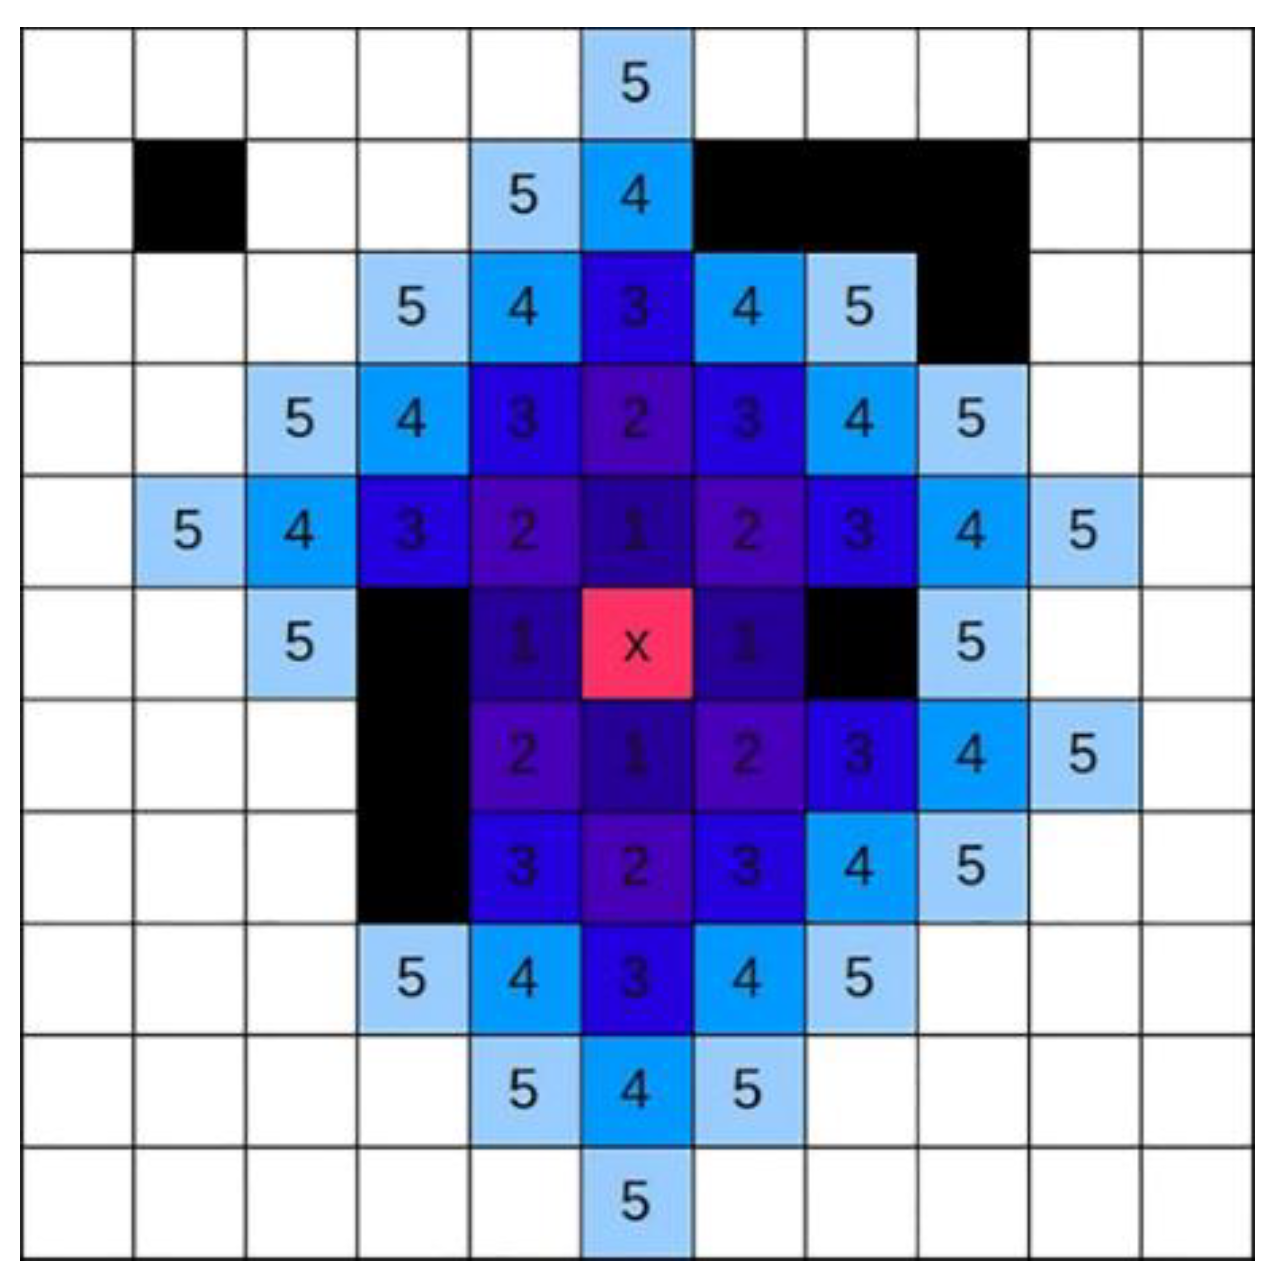
When a starting point (seed) with pixel coordinates (i, j) is selected in the matrix (which is a sea location), each of the four surrounding pixels that can immediately be accessed and that are not land pixels is assigned a value of “1.” Then, each of the pixels that were assigned a value of “1” is selected as the seed in the next iteration. The pixel coordinates are appended to the queue of seeds that must be used as the seed in the next iteration. The pixels immediately adjacent to the pixels that were assigned a value of “1” are assigned a value of “2” in the next iteration. This process is carried out until all sea pixels are assigned a number, as shown in Figure 2.
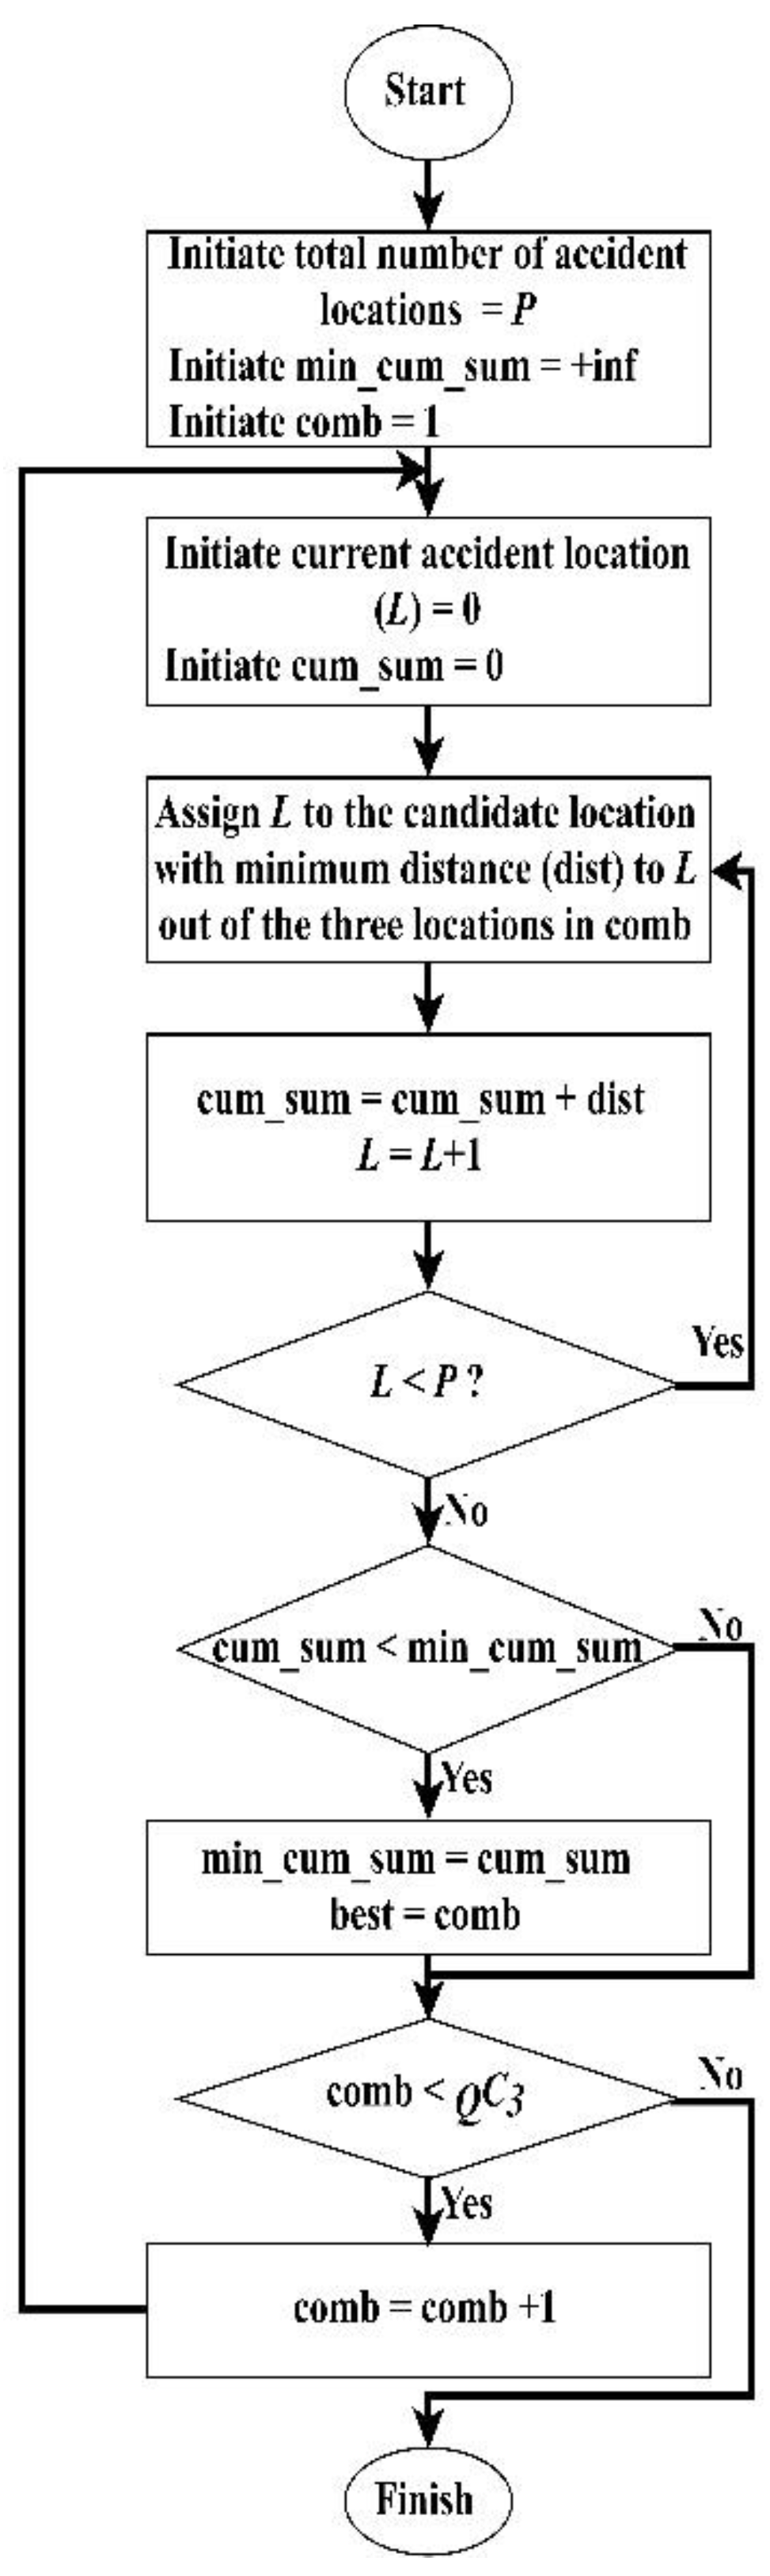
The algorithm for this process is described by the flowchart in Figure 3. This algorithm is used to calculate the pixel value from each of the P accident sites to all sea pixels in the region of the map by setting the seed pixel to the accident site. The set of P maps generated in this manner is stored in a structure to be used in Stages 3 and 4.
3.3. Stage 3: Optimal Location Search
Three rescue ships are stationed in the sea area at any one time. A clustering method based on the combinations of three out of all rescue ship location candidates is applied to assign rescue ships. The optimum set of three rescue ship locations should be selected such that the cumulative distance from the three rescue ship locations to the accident sites is minimized. To reduce the complexity of the optimization process, we select k × k equally spaced locations in the study area and mark each of them as a potential candidate for rescue ship locations if they are on the sea. The problem is reduced to finding the best three rescue ship locations out of the candidate combinations. Q increases with k. Consequently, as Q increases, the size of the combination is naturally increased. Therefore, a set of candidate combinations of three out of Q (QC3) is created. The best candidate is calculated using Equation (4), where is the pixel value based on the Manhattan distance from a rescue ship location to an accident site, is the location of the -th accident site, and (, ) is the first (second, third) rescue ship location out of the c-th combination. Each accident site is assigned to the rescue ship situated closest to it out of the combination of three rescue ship locations. This procedure is carried out for all QC3 sets of candidate locations, and the cumulative pixel value for each set is calculated. The best candidate is obtained by the minimum pixel value among the cumulative pixel values. The flowchart in Figure 4 describes this algorithm.
3.4. Stage 4: Evaluation
The cumulative pixel values between the accident sites assigned to each current rescue ship location and the optimal locations found in Stage 3 are compared. The minimum cumulative pixel value for the current rescue ship locations is detected using the pixel values generated in Stage 2. As shown in Figure 5, the difference between these two cumulative pixel values is calculated.
4. Results and Discussion
4.1. Study Area
In this study, we analyzed the marine accidents that have occurred in the numerous islands of Wando County in South Korea during the period from 1997–2016. The study area—Wando County in South Korea—consists of a group of 264 islands. A national marine park is situated in the coastal waters of Wando, Jeollanam Province. This park is an actively cultivated seaweed farm in coastal waters in South Korea. Wando County also accounts for 80% of the abalone production in South Korea [31]. Thus, there are a large number of fishing vessels in this area, with 8100 ships registered.
The open sea of Wando in the southern sea of Korea is one of the most important shipping areas of the world, connecting major economies such as China, Japan, Russia, and South Korea. An increase in foreign trade in the region has led to an increase in vessel traffic volume, which in turn has led to a commensurate increase in the incidents of marine accidents.
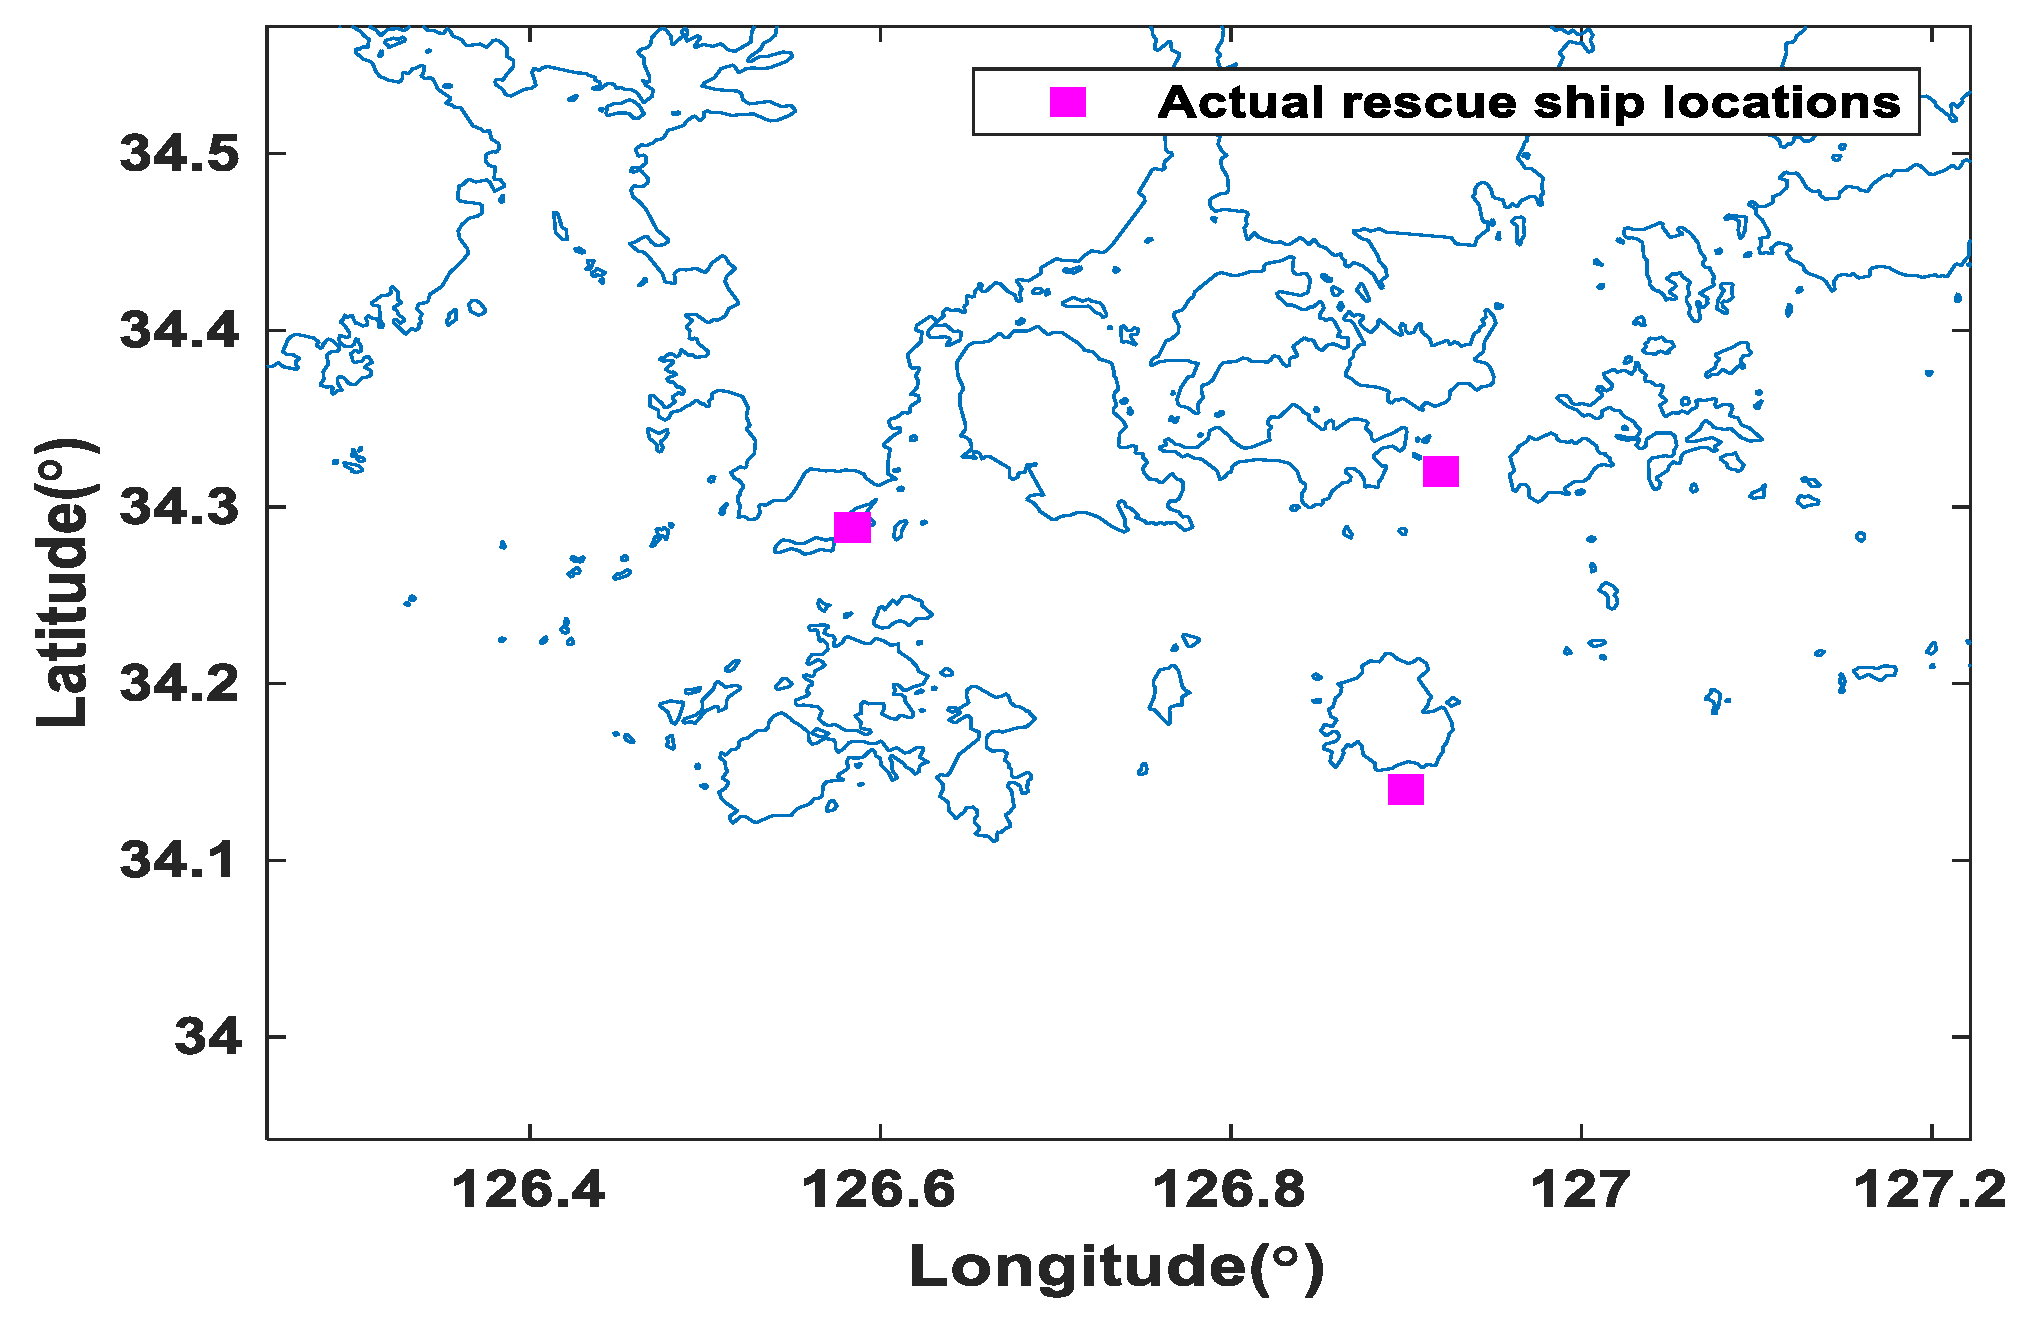
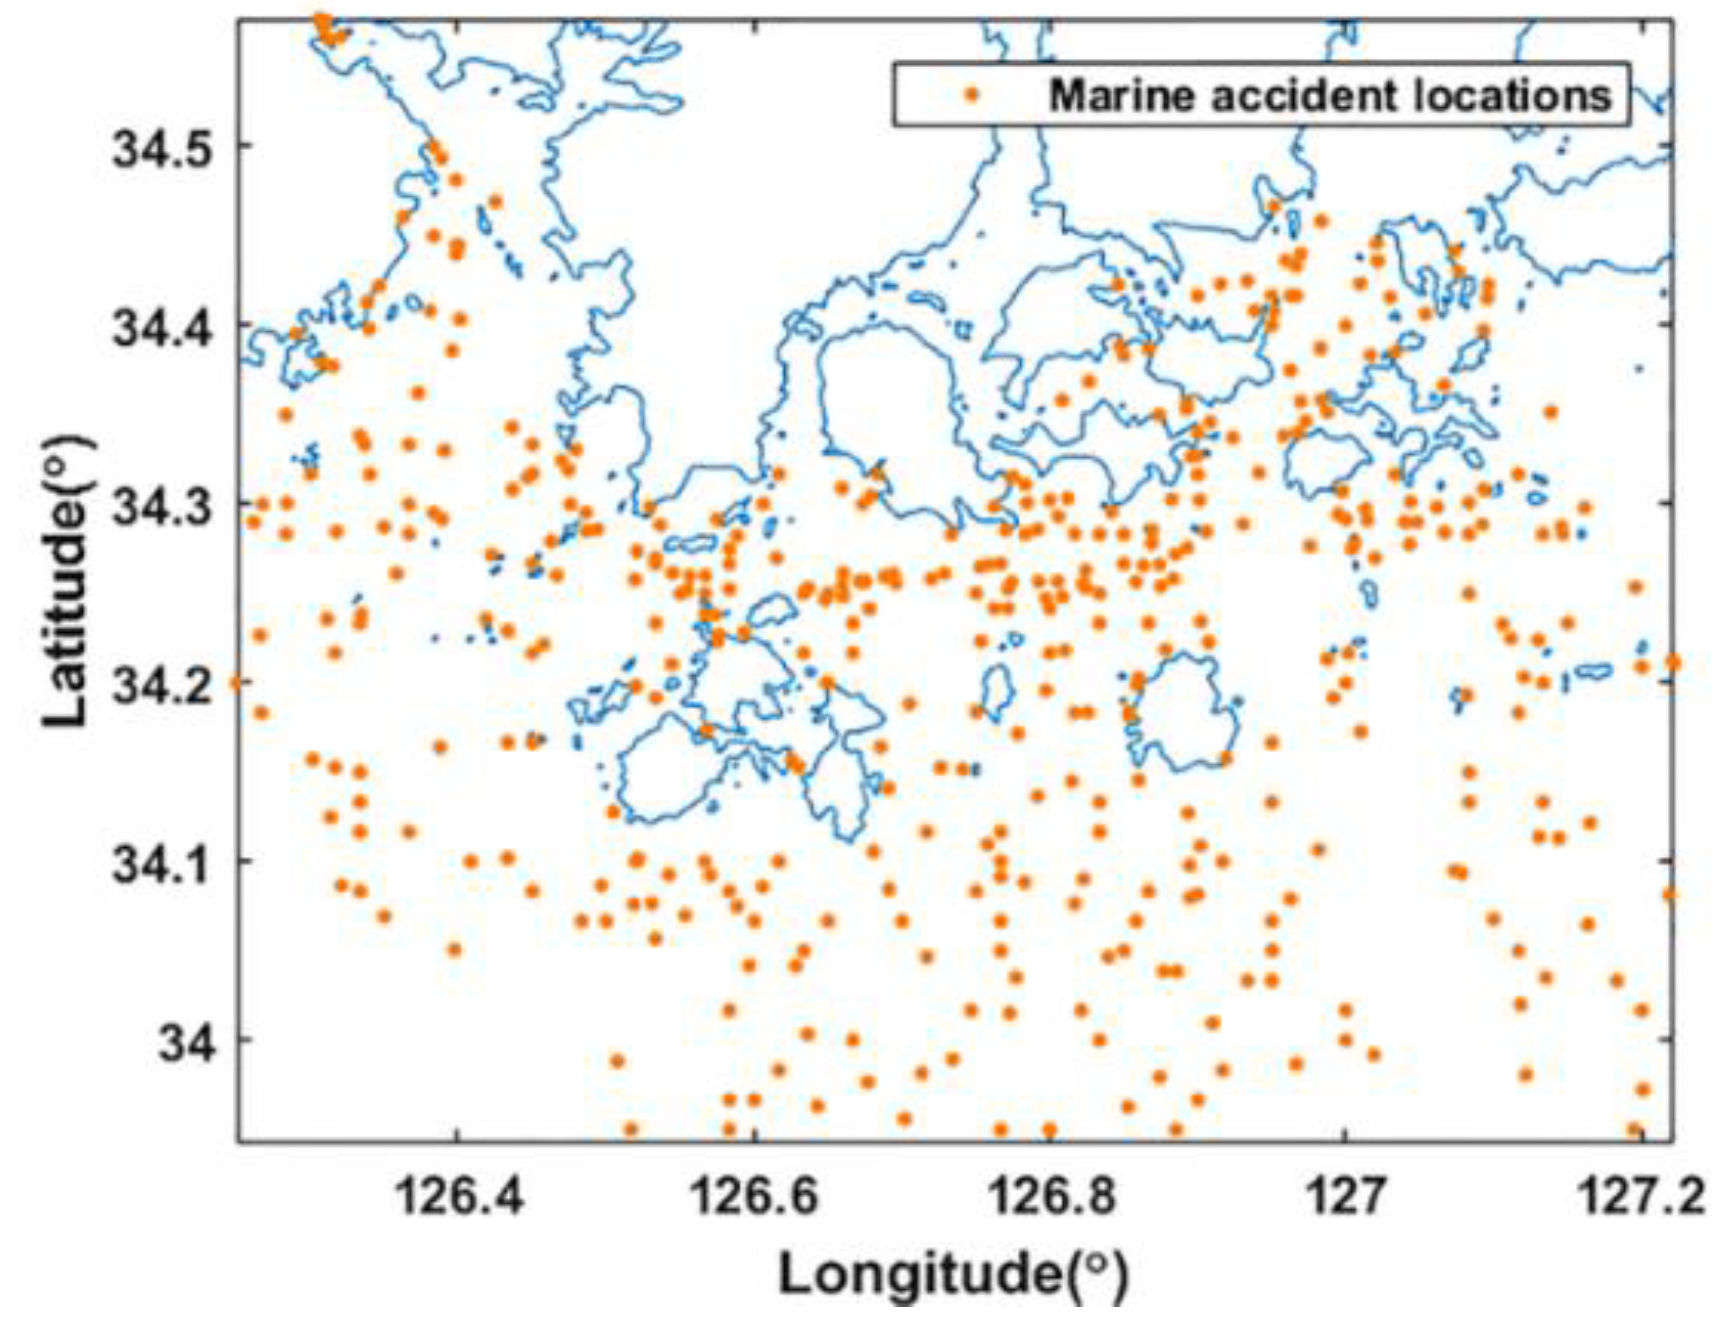
As shown in Figure 6, the study area comprises numerous islands and a complex coastline and covers an area located between latitudes 33.9°–34.6° N and longitudes 126.2°–127.2° E. The shoreline of the study area is extracted from an ENC. Shoreline points are extracted in terms of longitude and latitude. Korea Hydrographic and Oceanographic Administration (KHOA) produced ENC accordance with IHO S-57 from paper navigational charts. At any one time, three rescue ships of the Wando Coast Guard are stationed in this sea area (shown in Figure 6) specifically for search and rescue.
4.2. Materials
Figure 7 shows the distribution of marine accident sites in the study area over a 20-year period (1997–2016) [32]. Four-hundred-and-thrity-nine marine accidents, including collisions, groundings, fires, and marine pollution, have occurred in this study area over the past 20 years. When a marine accident occurs, one of the three closest rescue ships is assigned the task of rescue and proceeds to the accident site posthaste.
4.3. Results
The proposed method was evaluated using a scenario involving the positioning of three rescue ships in the Wando islands of South Korea, with a set of 429 accident site locations clustered into three groups. We set k as 50 in our study, owing to running time complexity. Q is 1902, subtracted by the number of candidates on land or islands. Consequently, a set of candidate combinations of three out of Q is created with 1902C3 1.1 billion. The algorithm was coded in MATLAB, which was run on a PC with an Intel Xeon E5 2650 v3 CPU and 8 × 16 GB DDR4 2.3 GHz RAM. It required 1 day with 10 extended parallel computing multicores.
The conversion of the study area to the image format is illustrated in Figure 8. Figure 8a shows the obtained RGB image that is converted to grayscale. Figure 8b shows boundaries converted to grayscale. Figure 8c shows the resulting image is a binary image comprising black and white pixels.
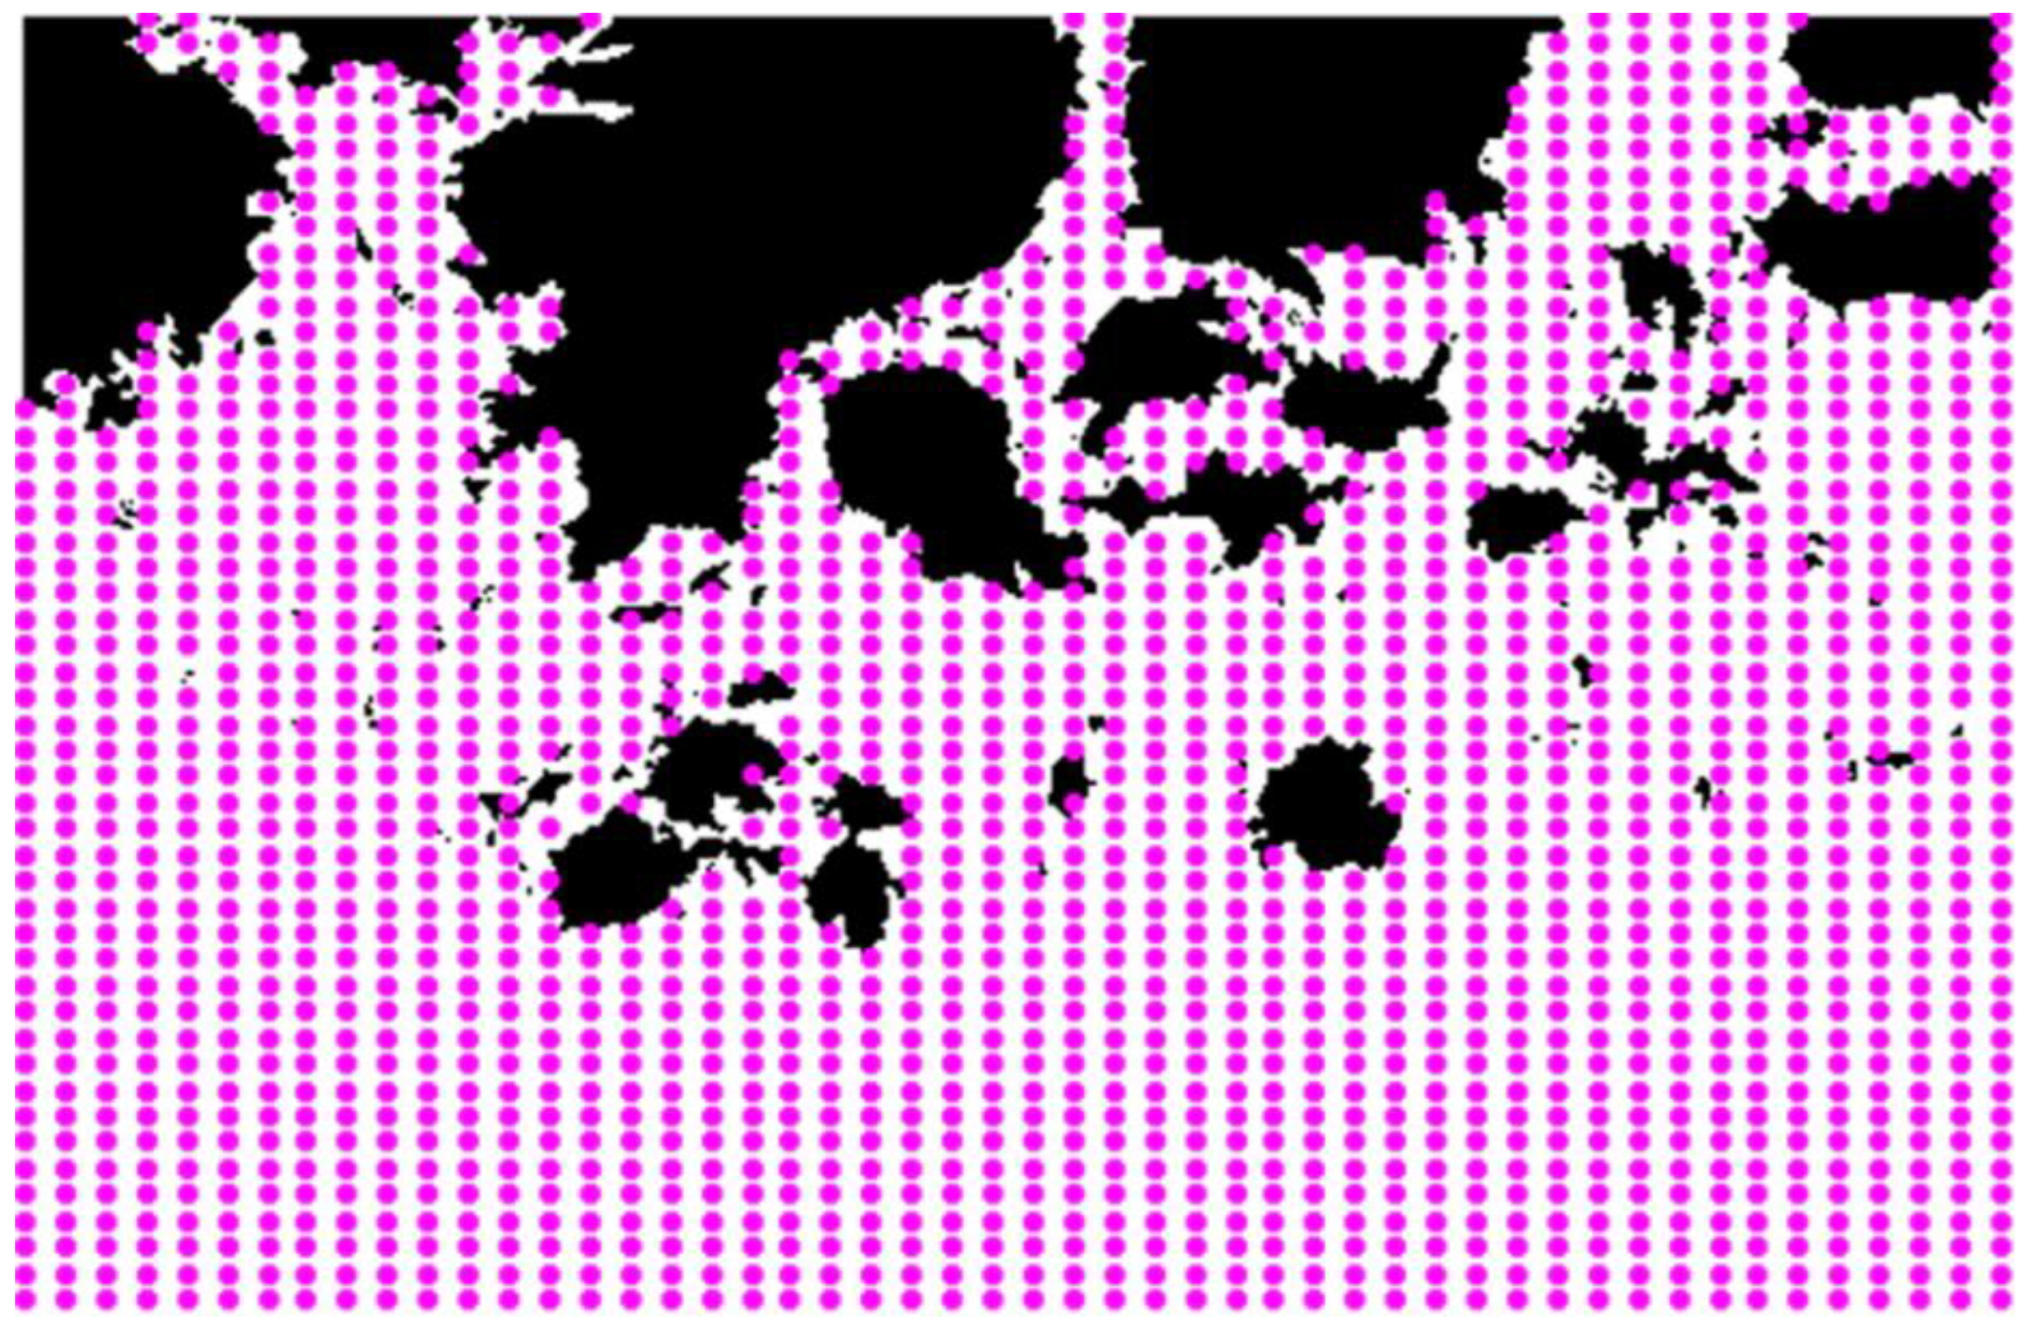
As shown in Figure 9, this results in Q rescue ship location candidates.
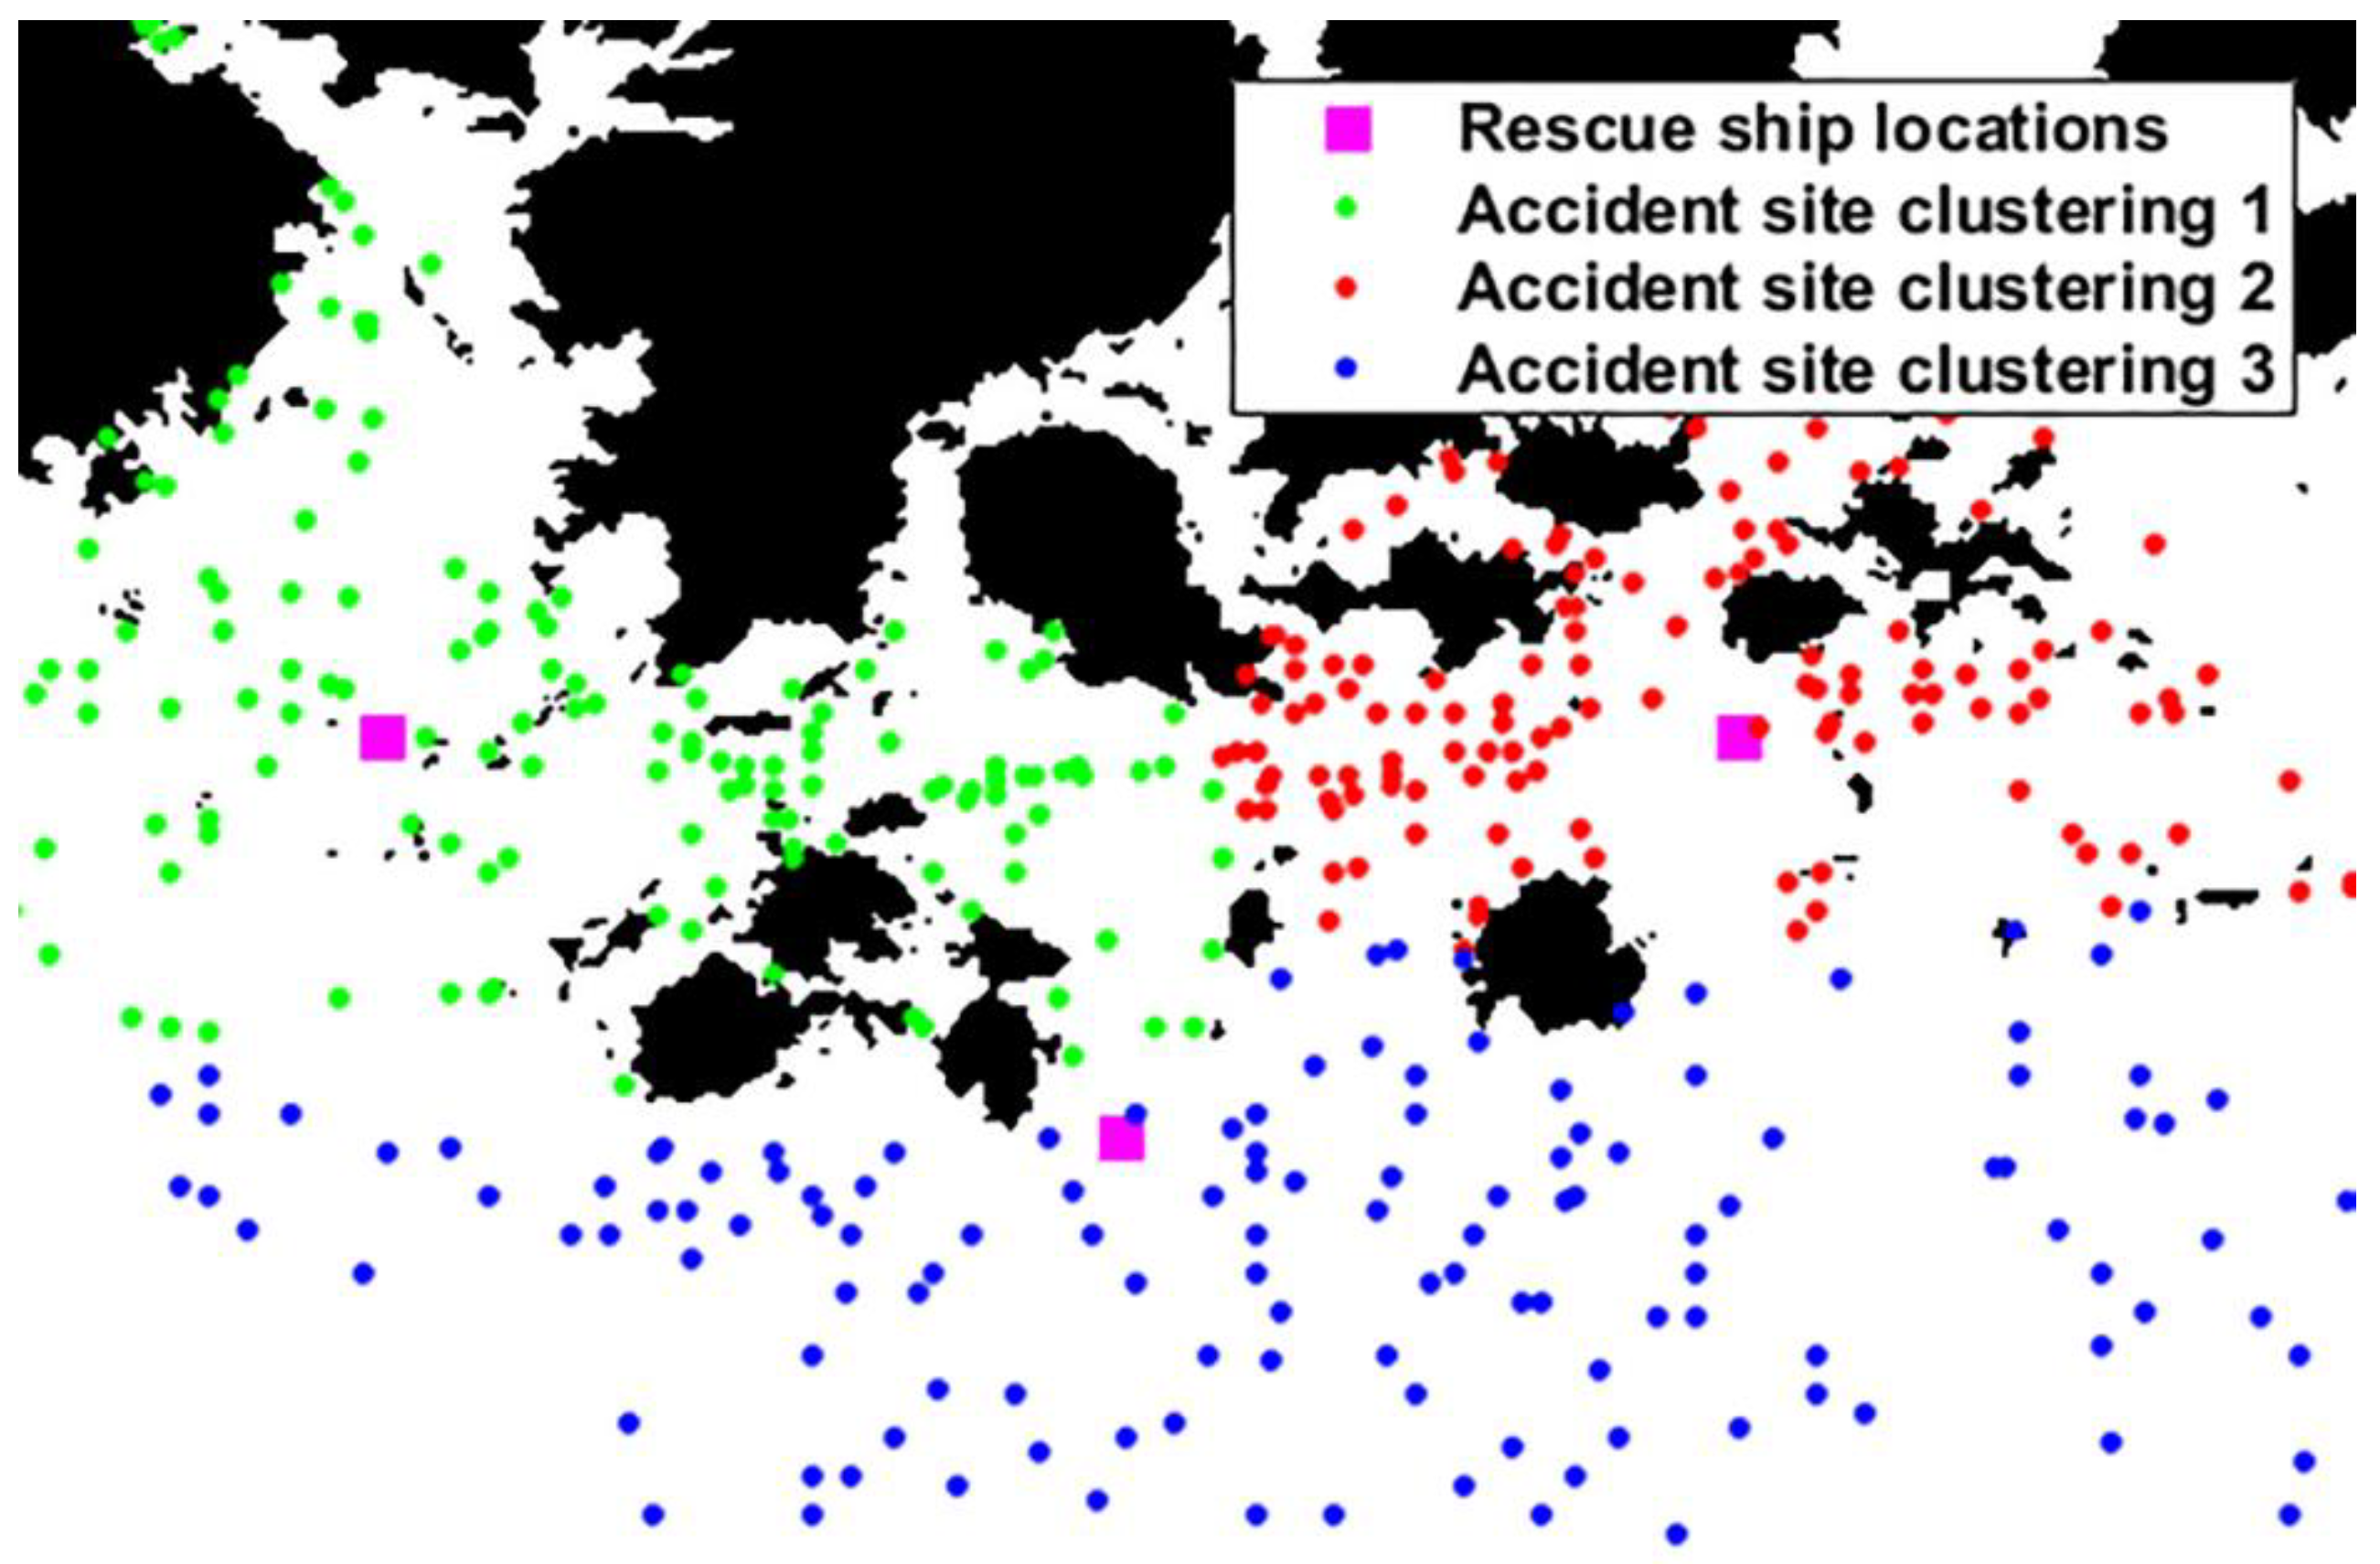
The optimum rescue ship locations and the accident site clusters generated by the proposed method are shown in Figure 10. The ship locations are shown in magenta, and the clusters of accident sites are depicted in red, green, and blue. The figure clearly shows that the allocation of accident sites has been performed while considering the presence of islands in the area.
The selection of the optimum locations of the rescue ships to be stationed using our method results in decreased cumulative pixel value. We also evaluated the increase in effectiveness for the new placement of rescue ships by calculating the cumulative pixel value of each accident site from its allocated rescue ship location. The cumulative pixel value from the current rescue ship locations was 49,569 in the study area image, which corresponds to an actual distance of 10,954.7 km. The optimized locations provided a cumulative pixel value of 39,866, which corresponds to a distance of 8810.4 km. This represents a decrease of 9703 pixels or 2144.4 km, which is a reduction of 19.6% from the current rescue ship location. On average, each rescue ship location is 5.0 km closer to its allocated accident sites compared to the current allocation. Assuming that the speed of a rescue vessel is 15 knots, rescue time is reduced by approximately 10 min per accident.
4.4. Discussion
In this paper, we proposed an image processing approach to optimally locate rescue ships and allocate ocean regions where numerous accidents occur at each of these locations. The optimization problem was solved by minimizing the cumulative pixel value from each allocated rescue ship location to historically reported accident sites.
Distance minimization was implemented using the flood-filling algorithm based on Manhattan distance. This was because rescue ships cannot navigate across land or islands. Using the Euclidean distance from accident sites to rescue ship locations was deemed to be unrealistic for this reason. This issue could be solved by combining the Manhattan distance and Euclidean distance such that routes include only ocean areas. Even though our approach used only Manhattan distance, this could be achieved by a simple modification of our approach by employing the flood-filling algorithm to diagonally propagate. A distance compensation factor of √2 was required in diagonal movements in comparison with lateral and longitudinal movements.
The optimization was performed using a set k × k of rescue ship locations. This discretization of the problem is an inherent limitation of the proposed computational approach. Therefore, the allocation of extremely few accident sites close to the boundary between regions could be affected by the errors caused by this discretization. This could lead them to be assigned to rescue ship locations slightly farther than the optimum location. However, the approach successfully minimized the cumulative pixel value and average rescue time. We set k as 50 in our study to decrease time complexity while achieving significant improvement. However, with higher k, we can expect that the proposed method will produce even better optimization with reduced possibility of such discretization errors. If k is set as greater than 50, it is inefficient for the strategic aim of this study because running time exceeds 1 day. Even when extracting the best from the number of combinations far exceeding one billion, the change in the distance of the optimal locations of the rescue ships is relatively short.
The scaling down of the original problem using a factor of w = 2 can affect accuracy because it decreases the resolution of the paths calculated in the map. However, the effect of this is minimal because the size of a pixel in the image corresponds to a smaller distance of 221 m in the original study area.
Further optimization can be performed by successive iterations of this procedure and by selecting candidate rescue ship locations that are closer to and that surround the locations identified in this study.
This study was conducted using historical ship accident site locations. However, the practical requirements of the application of this approach could be more dynamic. Accident site locations could be affected by dynamic factors such as weather and traffic. The locations of rescue ships could also be constrained owing to several factors that were not examined in this approach. These limitations can be addressed by dynamically weighting the distance calculated between locations to include factors other than physical distance that affect the optimality of rescue ship locations. However, the lack of such data limits further analysis.
5. Conclusions
This paper proposed a method that uses image processing and the flood-filling algorithm to produce accurate minimum distances from rescue ships to accident sites in the presence of intervening islands. The results provided by the proposed method can be considered to be more accurate compared to methods in which the positioning of islands is not considered. The decrease in the cumulative pixel value compared to current ship locations is evidence of the effectiveness of the proposed method. Thus, the proposed method, which has been applied to the case of rescue ships in the Wando islands of South Korea, satisfies our objective of obtaining a set of optimal rescue ship locations based on the pixel value.
However, the method is limited because it only considers the distance in determining optimal rescue ship locations. Therefore, the effects of other factors, such as the availability of resources and the nature of accidents, must be included in future studies for obtaining more accurate results. Furthermore, tidal current and wind direction were not considered. Clearly, as the maritime traffic from these sources can have a significant impact on the access and availability of the rescue ships to be deployed, their effect must be incorporated in future research. Another limitation of this work is related to the fact that we developed the optimization model assuming that rescue ship locations are stationary and ships are readily available for rescue missions when called. However, in real life scenarios, rescue ships could actually be in surrounding regions and not at desired locations. Therefore, the scheduling and timing of these operations must be studied.
The algorithm used to evaluate accident site locations and to allocate them to rescue ships may be scalable in terms of quantity and variety. For example, a larger region of study can be broken down into smaller regions and the algorithm can be successively applied on selected parts to increase accuracy. In addition, a weight factor can be applied to these accident sites to account for other factors in addition to the distance factor before further analysis. In future work, we will focus on sourcing additional data to facilitate the extension of the proposed method.
Author Contributions
All authors have contributed equally to this paper. The individual responsibilities and contribution of all authors are as follows: The idea of this paper was proposed by C.Y., and he completed the preparatory work of the paper. S.L. analyzed the data and wrote the paper.
Funding
This research received no external funding.
Conflicts of Interest
The authors declare no conflict of interest.
Nomenclature
| (, ) | first (second, third) rescue ship location out of the c-th combination |
| c | total number of combinations |
| k | potential candidates for rescue ship locations, equally spaced locations |
| L | current accident site |
| latitude for each accident site and rescue ship location | |
| longitude for each accident site and rescue ship location | |
| m, n | row and column for matrix |
| P | total number of accident sites |
| latitude transformed to matrix format | |
| longitude transformed to matrix format | |
| Q | number of effective rescue ship location candidates |
| QC3 | combinations of three out of Q |
| w | factor for decreasing resolution |
References
- UNCTAD (United Nations Conference on Trade and Development). Review of Maritime Transport 2014; United Nations: Geneva, Switzerland, 2014. [Google Scholar]
- EMSA (European Maritime Safety Agency). Annual Overview of Marine Casualties and Incidents 2015; European Maritime Safety Agency: Lisboa, Portugal, 2016.
- Baker, C.C.; Seah, A.K. Maritime accidents and human performance: The statistical trail. In Proceedings of the MARTECH, Singapore, 22–24 September 2004. [Google Scholar]
- Cusumano, E. Emptying the sea with a spoon? Non-governmental providers of migrants search and rescue in the Mediterranean. Mar. Policy 2017, 75, 91–98. [Google Scholar] [CrossRef]
- Cuttitta, P. Repoliticization through search and rescue? Humanitarian NGOs and migration management in the central Mediterranean. Geopolitics 2018, 23, 632–660. [Google Scholar] [CrossRef]
- Del Valle, H. Search and rescue in the Mediterranean Sea: Negotiating political differences. Refug. Surv. Q. 2016, 35, 22–40. [Google Scholar] [CrossRef]
- Astbury, J. Search area determination and search unit deployment. J. Navig. 1987, 40, 63–72. [Google Scholar] [CrossRef]
- Trim, R.M. A technique for improving the radar visibility of search and rescue transponder responses. J. Navig. 1996, 49, 284–285. [Google Scholar] [CrossRef]
- Díaz, A.B.; Mora, A.P.; Armas, I.P. Search and rescue location and identification: Experience with SARTs. J. Navig. 2002, 55, 65–74. [Google Scholar]
- Azofra, M.; Pérez-Labajos, C.A.; Blanco, B.; Achutegui, J.J. Optimum placement of sea rescue re-sources. Saf. Sci. 2007, 45, 941–951. [Google Scholar] [CrossRef]
- Afshartous, D.; Guan, Y.; Mehrotra, A. US Coast Guard air station location with respect to distress calls: A spatial statistics and optimization based methodology. Eur. J. Oper. Res. 2009, 196, 1086–1096. [Google Scholar] [CrossRef]
- Stone, L.D.; Kratzke, T.M.; Frost, J.R. Search modeling and optimization in USCG’s search and rescue optimal planning system (SAROPS). In Proceedings of the Safer Seas Conference, Brest, France, 10 May 2011. [Google Scholar]
- Zarandi, M.F.; Davari, S.; Sisakht, S.H. The large scale maximal covering location problem. Sci. Iran 2011, 18, 1564–1570. [Google Scholar] [CrossRef]
- Akbari, A.; Pelot, R.; Eiselt, H.A. A modular capacitated multi-objective model for locating maritime search and rescue vessels. Ann. Oper. Res. 2017, 267, 1–26. [Google Scholar] [CrossRef]
- Billa, L.; Pradhan, B. Semi-automated procedures for shoreline extraction using single RADARSAT-1 SAR image. Estuar. Coast. Shelf Sci. 2011, 95, 395–400. [Google Scholar]
- Zhang, T.; Yang, X.; Hu, S.; Su, F. Extraction of coastline in aquaculture coast from multispectral remote sensing images: Object-based region growing integrating edge detection. Remote Sens. 2013, 5, 4470–4487. [Google Scholar] [CrossRef]
- Dang, Y.; Zhang, C.; Zhou, X.; Xu, J.; Xue, S. Instantaneous Shorelines as an Intermediate for Island Shoreline Mapping based on Aerial/Satellite Stereo Images. Mar. Geod. 2018, 41, 219–229. [Google Scholar] [CrossRef]
- Ren, X.; Jiang, L.; Guan, D.; Tang, X.A. A geographic information based sea-land segmentation method for HR optical remote sensing image. In Proceedings of the Progress in Electromagnetic Research Symposium (PIERS), Shanghai, China, 8–11 August 2016; pp. 3553–3556. [Google Scholar]
- Cheng, D.; Meng, G.; Xiang, S.; Pan, C. Efficient sea-land segmentation using seeds learning and edge directed graph cut. Neurocomputing 2016, 207, 36–47. [Google Scholar] [CrossRef]
- Zhuang, Y.; Guo, D.; Chen, H.; Bi, F.; Ma, L.; Soomro, N.Q. A novel sea-land segmentation based on integral image reconstruction in MWIR images. Sci. China Inf. Sci. 2017, 60, 069302. [Google Scholar] [CrossRef]
- You, X.; Li, W. A sea-land segmentation scheme based on statistical model of sea. In Proceedings of the 4th International Congress on Image and Signal Processing (CISP), Shanghai, China, 15–17 October 2011; Volume 3, pp. 1155–1159. [Google Scholar]
- Łubczonek, J.; Włodarczyk, M. Charting of the shoreline of inland waters using digital remote sensing images. Sci. J. Marit. Univ. Szczec. 2010, 22, 53–58. [Google Scholar]
- Yoo, S.L.; Jung, C.Y. Optimal arrangement of patrol ships based on k-means clustering for quick response of marine accidents. J. Korean Soc. Mar. Environ. Saf. 2017, 23, 775–782. [Google Scholar] [CrossRef]
- Moroni, D.; Pieri, G.; Tampucci, M.; Salvetti, O. A proactive system for maritime environment monitoring. Mar. Pollut. Bull. 2016, 102, 316–322. [Google Scholar] [CrossRef]
- Pieri, G.; Cocco, M.; Salvetti, O. A marine information system for environmental monitoring: ARGO-MIS. J. Mar. Sci. Eng. 2018, 6, 15. [Google Scholar] [CrossRef]
- Jackson, J.T.; Gunsch, G.H.; Claypoole, R.L.; Lamont, G.B. Blind steganography detection using a computational immune system: A work in progress. IJDE 2003, 4, 19. [Google Scholar]
- Bala, R.; Eschbach, R. Spatial color-to-grayscale transform preserving chrominance edge information. In Proceedings of the Twelfth Color Imaging Conference: Color Science and Engineering Systems, Technologies, Applications, Scottsdale, AZ, USA, 9 November 2004; Volume 1, pp. 82–86. [Google Scholar]
- Henrich, D. Space-efficient region filling in raster graphics. Vis. Comput. 1994, 10, 205–215. [Google Scholar] [CrossRef] [Green Version]
- Nosal, E.M. Flood-fill algorithms used for passive acoustic detection and tracking. In Proceedings of the New Trends for Environmental Monitoring Using Passive Systems, Hyeres, French Riviera, France, 14–17 October 2008; pp. 1–5. [Google Scholar]
- Clifford, R.; Jalsenius, M.; Montanaro, A.; Sach, B. The complexity of flood filling games. Theory Comput. Syst. 2012, 50, 72–92. [Google Scholar] [CrossRef]
- Ock, Y.S. Pending issues and policy about abalone culture. Policy Res. Fish. 2010, 5, 13–36. [Google Scholar]
- KMST (Korea Maritime Safety Tribunal). Accident Position Information Based on Electronic Chart; Korea Maritime Safety Tribunal: Sejong-City, Korea, 2016. Available online: http://data.kmst.go.kr/WebVMS_KMST/WebVMS.jsp (accessed on 14 October 2017).
Figure 1.
Flow chart of the image processing stage.

Figure 2.
Example of flood-filling starting from the seed shown in red.

Figure 3.
Flow chart of the flood-filling algorithm.

Figure 4.
Flow chart of the optimization algorithm.

Figure 5.
Concept of comparing the cumulative pixel values.

Figure 6.
Study area with current rescue ship locations (Magenta).

Figure 7.
Marine accident sites (1997–2016) (Orange).

Figure 8.
Image processing: (a) Map with boundaries with RGB image; (b) grayscale converted boundaries; (c) land and sea areas marked in black and white, respectively.
Figure 8.
Image processing: (a) Map with boundaries with RGB image; (b) grayscale converted boundaries; (c) land and sea areas marked in black and white, respectively.

Figure 9.
Pre-location of rescue ships (Magenta).

Figure 10.
Study area showing optimized rescue ship locations (magenta) and accident site locations allocated to them (Red, Green and Blue).
Figure 10.
Study area showing optimized rescue ship locations (magenta) and accident site locations allocated to them (Red, Green and Blue).

© 2019 by the authors. Licensee MDPI, Basel, Switzerland. This article is an open access article distributed under the terms and conditions of the Creative Commons Attribution (CC BY) license (http://creativecommons.org/licenses/by/4.0/).
Share and Cite
MDPI and ACS Style
Jung, C.-Y.; Yoo, S.-L. Optimal Rescue Ship Locations Using Image Processing and Clustering. Symmetry 2019, 11, 32. https://doi.org/10.3390/sym11010032
AMA Style
Jung C-Y, Yoo S-L. Optimal Rescue Ship Locations Using Image Processing and Clustering. Symmetry. 2019; 11(1):32. https://doi.org/10.3390/sym11010032
Chicago/Turabian StyleJung, Cho-Young, and Sang-Lok Yoo. 2019. "Optimal Rescue Ship Locations Using Image Processing and Clustering" Symmetry 11, no. 1: 32. https://doi.org/10.3390/sym11010032
Note that from the first issue of 2016, this journal uses article numbers instead of page numbers. See further details here.