An Efficient Knowledge-Graph-Based Web Service Recommendation Algorithm

School of Information Science and Technology, Dalian Maritime University, Dalian 116033, China
*
Authors to whom correspondence should be addressed.
Symmetry 2019, 11(3), 392; https://doi.org/10.3390/sym11030392
Submission received: 14 February 2019
/
Revised: 13 March 2019
/
Accepted: 14 March 2019
/
Published: 18 March 2019
(This article belongs to the Special Issue Symmetry in Computing Theory and Application)
Abstract
:Using semantic information can help to accurately find suitable services from a variety of available (different semantics) services, and the semantic information of Web services can be described in detail in a Web service knowledge graph. In this paper, a Web service recommendation algorithm based on knowledge graph representation learning (kg-WSR) is proposed. The algorithm embeds the entities and relationships of the knowledge graph into the low-dimensional vector space. By calculating the distance between service entities in low-dimensional space, the relationship information of services which is not considered in recommendation approaches using a collaborative filtering algorithm is incorporated into the recommendation algorithm to enhance the accurateness of the result. The experimental results show that this algorithm can not only effectively improve the accuracy rate, recall rate, and coverage rate of recommendation but also solve the cold start problem to some extent.
1. Introduction
The recommender system plays an important role in a personalized services research field. By mining the relationship between items or users, users can discover the items they may be interested in from a large number of different items.
With the rapid development of technologies such as cloud computing, mobile computing, service computing, the Internet, and big data, the emergence of a large number of Web services has caused users to face information overload problems. Finding relevant services among a large number of choices has become an important issue in the field of service computing and has been attempted to be solved by service recommendation [1,2].
Currently, most mainstream service recommendation algorithms are generally based on collaborative filtering (CF). Sreenath and Singh [3], Karta [4], and others adopted user-based CF to make recommendations. Herlocker et al. [5] proposed a K-nearest-neighbor model based on CF to improve recommendation accuracy, which is currently the most popular collaborative recommendation system model.
Quality of service (QoS) is a key factor in evaluating a service. Because we cannot obtain QoS data intuitively, many Web service recommendation systems use collaborative filtering algorithms to mine QoS attribute information, find users who are similar to the current requester, and predict the QoS values of unused services for the current requester. Shao et al. [6] proposed a user-based CF algorithm to predict service QoS values. Zheng et al. [7] combined user-based CF and item-based CF to improve recommendation accuracy.
The above Web service recommendation methods have the cold start and data sparse problems and do not consider relationships between services in the recommendation process. The service relationship is an important factor in the process of users utilizing a service; therefore, considering the service relationship in the recommendation process can give users more accurate recommendation results.
A Web service recommendation algorithm based on knowledge graph representation learning (kg-WSR) is proposed in this paper to solve the abovementioned problems. It fully considers the semantic relationship between Web services and has a good solution to the cold start problem. It uses knowledge graph representation learning to get the low-dimensional vector representation of service and user nodes, calculates the distance between services used by the user to obtain user classification, and sorts the candidate services according to the user’s QoS preference to obtain a better recommendation set.
2. Related Works
Research on service recommendation has been published in the proceedings of numerous conferences and journals. Most of these methods are based on collaborative filtering, which provides recommendations through user similarity or service similarity. So, we discuss in this section several typical Web service recommendation algorithms based on collaborative filtering. Recently, many algorithms predict the quality of Web services by adding geographic location, text evaluation, and other factors to improve the recommendation effect. Thus, we also introduce here some related algorithms. In order to add semantic information to the recommendation process, in this study, we used knowledge graph representation learning to obtain the low-dimensional vectors which contain the semantic information of the corresponding entity; several typical representation learning algorithms are discussed below.
2.1. Research on Knowledge Representation Learning
Mikolov et al. [8] proposed the word2vec word representation learning model and toolkit in 2013. Through this model, they found that the word vector space has translation invariance. After that, representation learning has gained widespread attention.
The main methods of knowledge representation learning include the distance model [9], single-layer neural network [10], tensor neural network model [10,11], matrix decomposition model [12], and translation model [13,14,15,16,17]. Due to the huge performance improvement of the translation model, through which not only the training parameters are greatly reduced but also the accuracy is improved, the translation model has become the representative model of knowledge representation learning.
The TransE algorithm proposed by Bordes et al. [14] is the most representative algorithm of the translation model. It treats relationships in the knowledge base as a certain kind of translation vector between entities. For each triple (h, r, t), TransE uses the relation vector R as the translation between the head entity vector H and the tail entity vector T. We can also regard R as a translation from H to T. TransE implements the digitization of the entity, so knowledge representation learning can quickly calculate the semantic relevance of the entities.
The TransE algorithm has good results for one-to-one relationships between entities, but it is less effective for the one-to-many, many-to-one, and many-to-many relationships [18]. The important reason is that TransE represents both entities and relationships in the same plane, and the interaction between entities and relationships cannot be clarified, which in turn makes it impossible to distinguish complex relationships.
In order to deal with the complex relationship between entities, Wang et al. [19] proposed the TransH algorithm, which establishes a relationship-oriented hyperplane model. For a relation r, a relation-specific translation vector lr is placed on the relationship-specific hyperplane lnr (normal vector) instead of being represented in the same space as the entity. TransH can solve the problems faced by TransE when complex relationships occur.
2.2. Research on Web Service Recommendation
Zheng et al. [7,19] proposed a recommendation system based on a user feedback collaborative filtering algorithm (WSRec algorithm), which uses a collaborative filtering algorithm to predict QoS values and a linear combination of user-based and item-based collaborative filtering to improve the accuracy of QoS prediction. However, there are limitations in the recommendation system caused by the use of collaborative filtering algorithms; that is, sparse data seriously affects the accuracy of QoS prediction.
Sreenath and Singh [3], Karta [4], and others used user-based CF to recommend services, but these only consider user similarity and the recommendation is not comprehensive.
Ma et al. [20] predicted QoS values by tensor decomposition, marked services by a user preference learning method, and implemented service recommendation using service scores.
Herlocker et al. [5] proposed a K-nearest-neighbor (KNN) model based on collaborative filtering, namely, the UPCC algorithm, which is presently the most popular collaborative recommendation algorithm. However, it has serious data sparseness and cold start problems. For new users, new services cannot be given a reasonable recommendation.
Salakhutdinov et al. [21] proposed a product-based KNN model called the IPCC algorithm. This type of KNN model assumes that a user’s present and past interests are similar; that is, if a service is similar to a service that a user liked in the past, then this service is now very likely to be liked by him. The breadth of recommendations for such algorithms is very low, for it is not possible to recommend other types of services that users may like but only to recommend a certain type of service.
Jhaveri et al. [22] proposed a composite model for two-way Web service recommendation using QoS and quality of experience (QoE). The model analyzes the positive or negative aspects of the evaluation text and combines the user’s emotional score with the satisfaction score to improve the accuracy of the recommendation.
Papadakis et al. [23] proposed a recommendation algorithm based on the Vivaldi algorithm (SCoR), which maps users and items to nodes on the coordinate axes and calculates the distance of the nodes. The algorithm can solve the cold start problem to a certain extent.
Liu et al. [24] proposed a QoS prediction algorithm that considers the location and geographic factors affecting QoS in the recommendation algorithm to improve prediction accuracy.
Nilashi et al. [25] proposed a collaborative filtering recommendation algorithm based on ontology and dimensionality reduction. However, the establishment of ontology is complex, and there are very few existing Web service ontologies.
3. Knowledge-Graph-Based Web Service Recommendation Algorithm
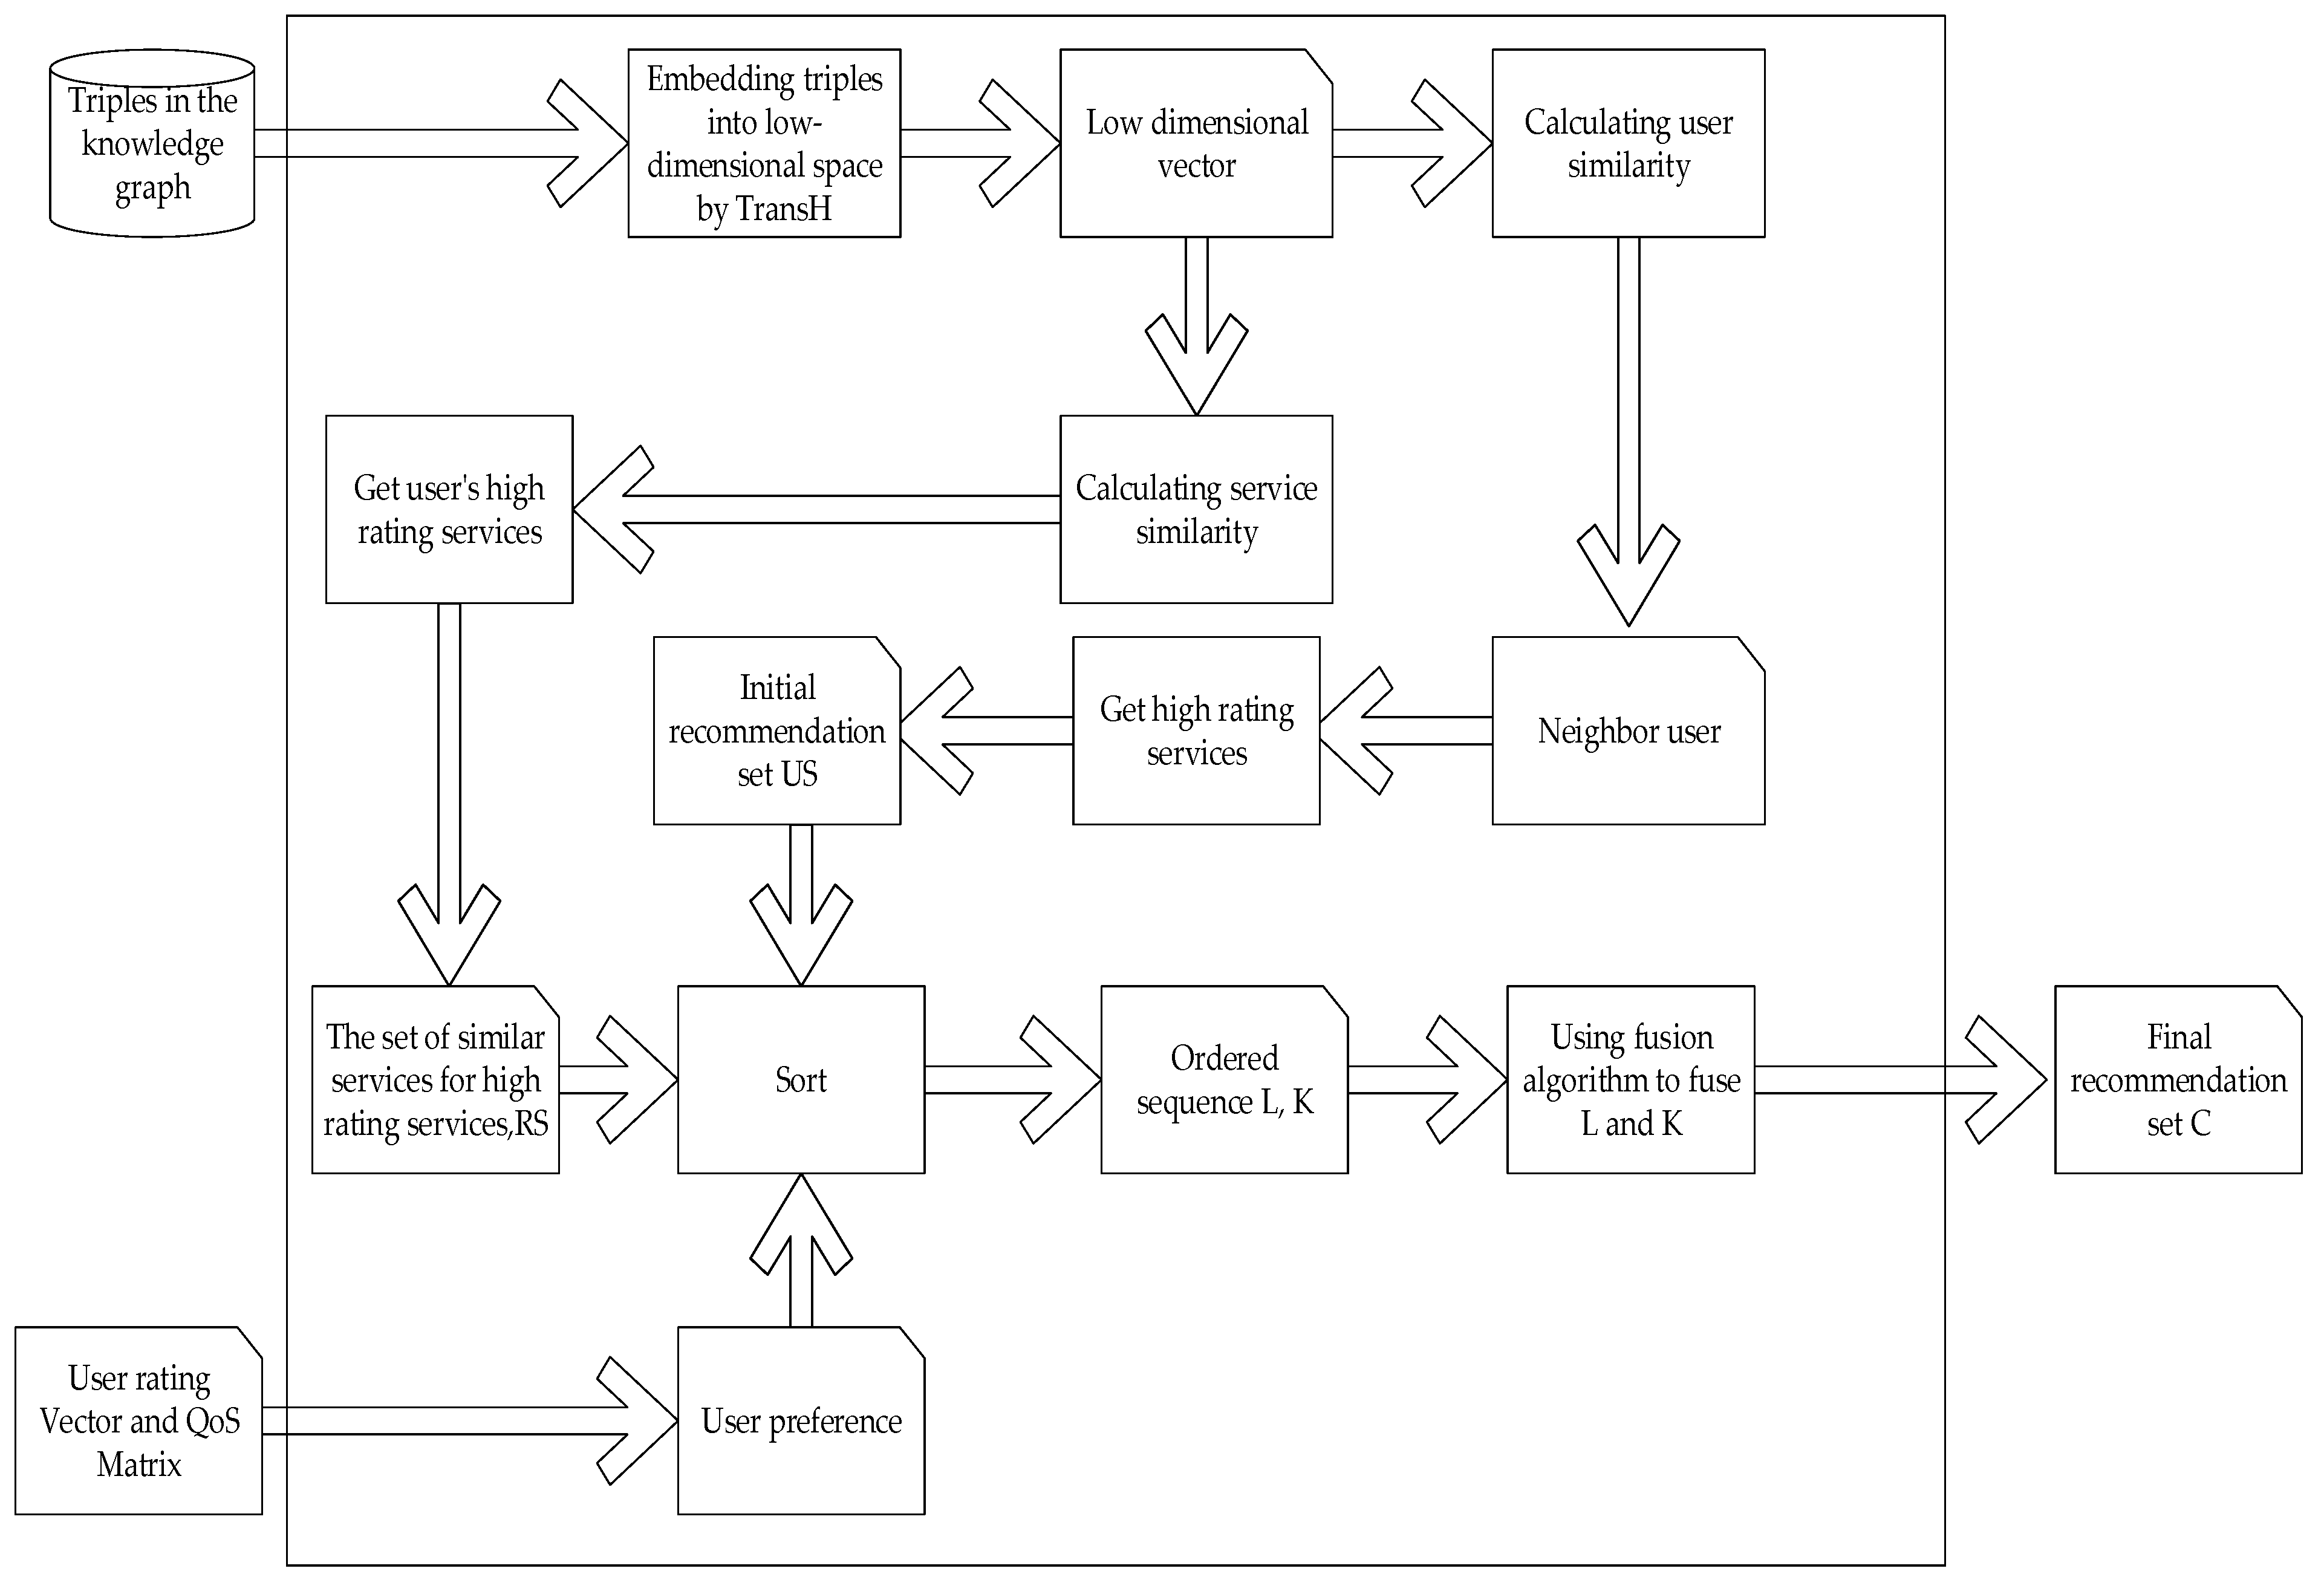
In order to solve the cold start problem of traditional service recommendation and the problem of semantic associations between services not being taken into consideration, we developed the kg-WSR algorithm. In this algorithm, firstly, the entity relationships of a Web service knowledge graph are analyzed. There are two types of entity nodes in the Web service knowledge graph: Web services and users. The relationship between different services is judged by the input and output of the service; users and services are linked by rating. Secondly, the entities in the knowledge graph are embedded into a low-dimensional space by using the TransH algorithm. Then, the similarities between users are calculated to identify the neighbors and the nearest K users for a user, and the distances between services are calculated to find semantically similar services for each service. The smaller the distance, the greater the degree of association. For the user receiving the recommendation, the highly rated services of his neighbors are defined as set US, the semantically similar services of services that he marked highly form the recommended set RS, and his QoS preference is calculated according to the user rating vector and service QoS matrix. According to preference, the US and RS are sorted into ordered sequences L and K, respectively. A preliminary recommendation set is generated by integrating L and K in the proportion of p:q, and the final ranking is performed to create the final recommendation set C. The values of p and q are adjusted according to whether the user receiving the recommendation is a positive user or a negative user.
The main steps of the proposed method are shown in Figure 1.
3.1. Web Service Knowledge Graph Representation Learning
3.1.1. Analyzing Service Relations
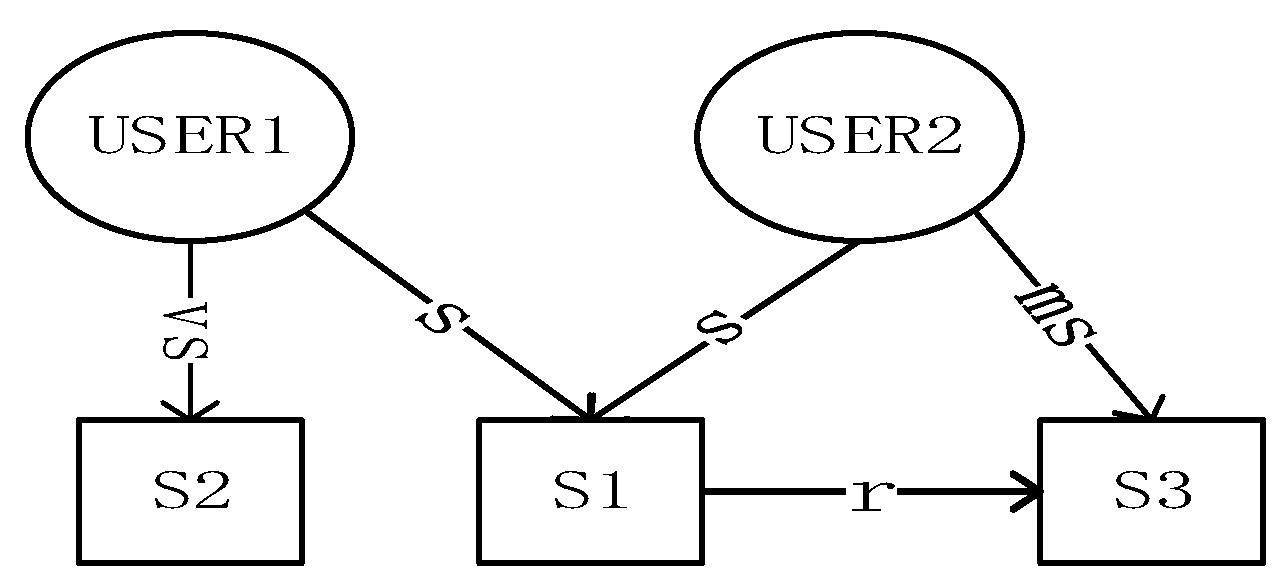
The service entities in the Web service knowledge graph are related through service relationships, so determining the service relationship is a crucial step in the Web service knowledge graph. From the perspective of a Web Services Description Language (WSDL) document, a Web service can be abstracted into a conceptual model consisting of three layers of components: service, operation, and parameter. The definition of service relationships is also divided into three levels, namely, parameter, operation, and service levels. This paper considers service-level relationships. Service-level relationships focus on describing interactions and constraints between services. On the Web, multiple services are functionally equivalent or similar, and there must be competition between them. On the other hand, the service process determines the existence of collaboration between services, which is the basis for control flow in composite services and business processes [26]. Therefore, according to the competition and collaboration relationship, there are five categories of service relationships, as shown in Table 1.
As for the relationship between users and services, they are linked by rating. There are five rating levels corresponding to this relationship: extremely dissatisfied, dissatisfied, medium satisfaction, satisfied, and very satisfied.
The relationship between services and the relationship between users and services are illustrated in the Web service knowledge graph shown in Figure 2.
3.1.2. Embedding Entities in Low-Dimensional Space
Based on the knowledge graph, the TransE algorithm is a representative algorithm in representation learning. It embeds the entities and relationships in the knowledge graph into the low-dimensional vector space.
For a triple (h, r, t) in knowledge graph G, let lh, lr, and lt represent vectors corresponding to h, r, and t, respectively. TranE expects lh, lr, lt to satisfy Equation (1):
The score function is , where is the 2 norm of , the Euclidean distance.
Training the loss function is shown in Equation (2):
where E is a set of entities in the knowledge graph, (h, r, t) is the correct triple from the training set, K’ is a set of error triples, and is the separation distance between the score of the correct triple and the score of the wrong triple, which is generally it is set to 1. The error triple is not randomly generated. In order to select a representative error triple, TransE randomly replaces one of the header and tail entities of each triple in K with other entities to get K’.
represents the hinge loss function, described in Equation (3):
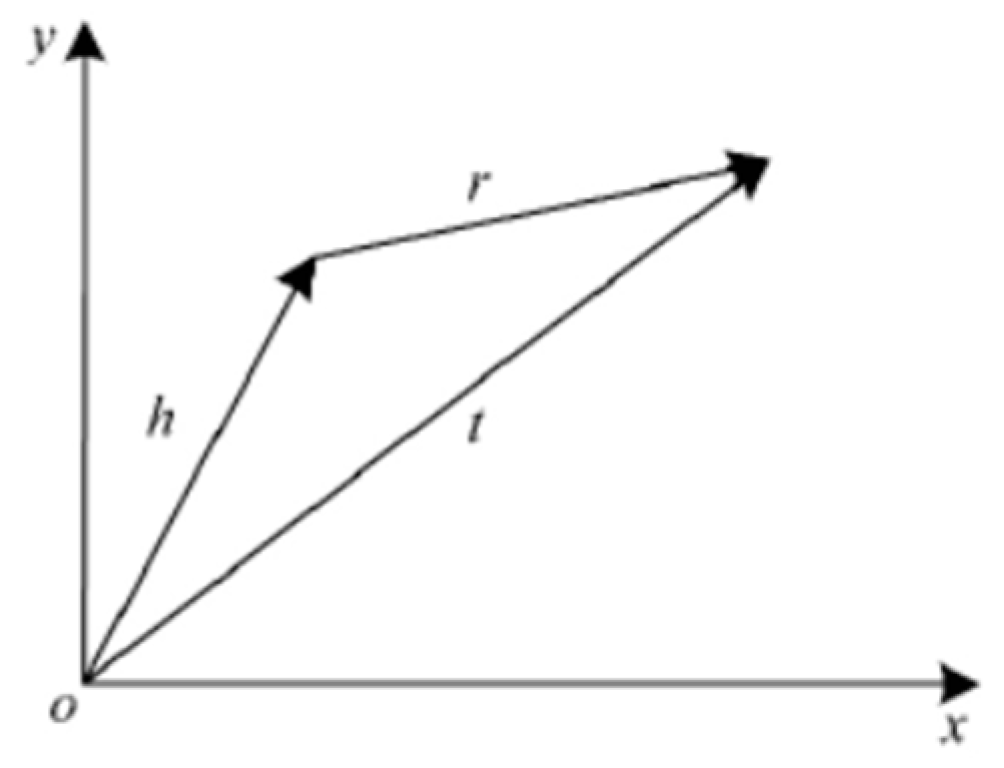
TransE adopts the principle of maximum distance and trains by enlarging distances between the right and wrong samples. The loss function is optimized by a stochastic gradient descent algorithm. The resulting vector space has the following characteristics: (1) the head node vector plus the corresponding triplet relationship vector is approximately equal to the triplet tail node vector; (2) the closer the semantic of services in the knowledge graph, the smaller the entity distance [27]. The vector representation of the TransE algorithm is shown in Figure 3.
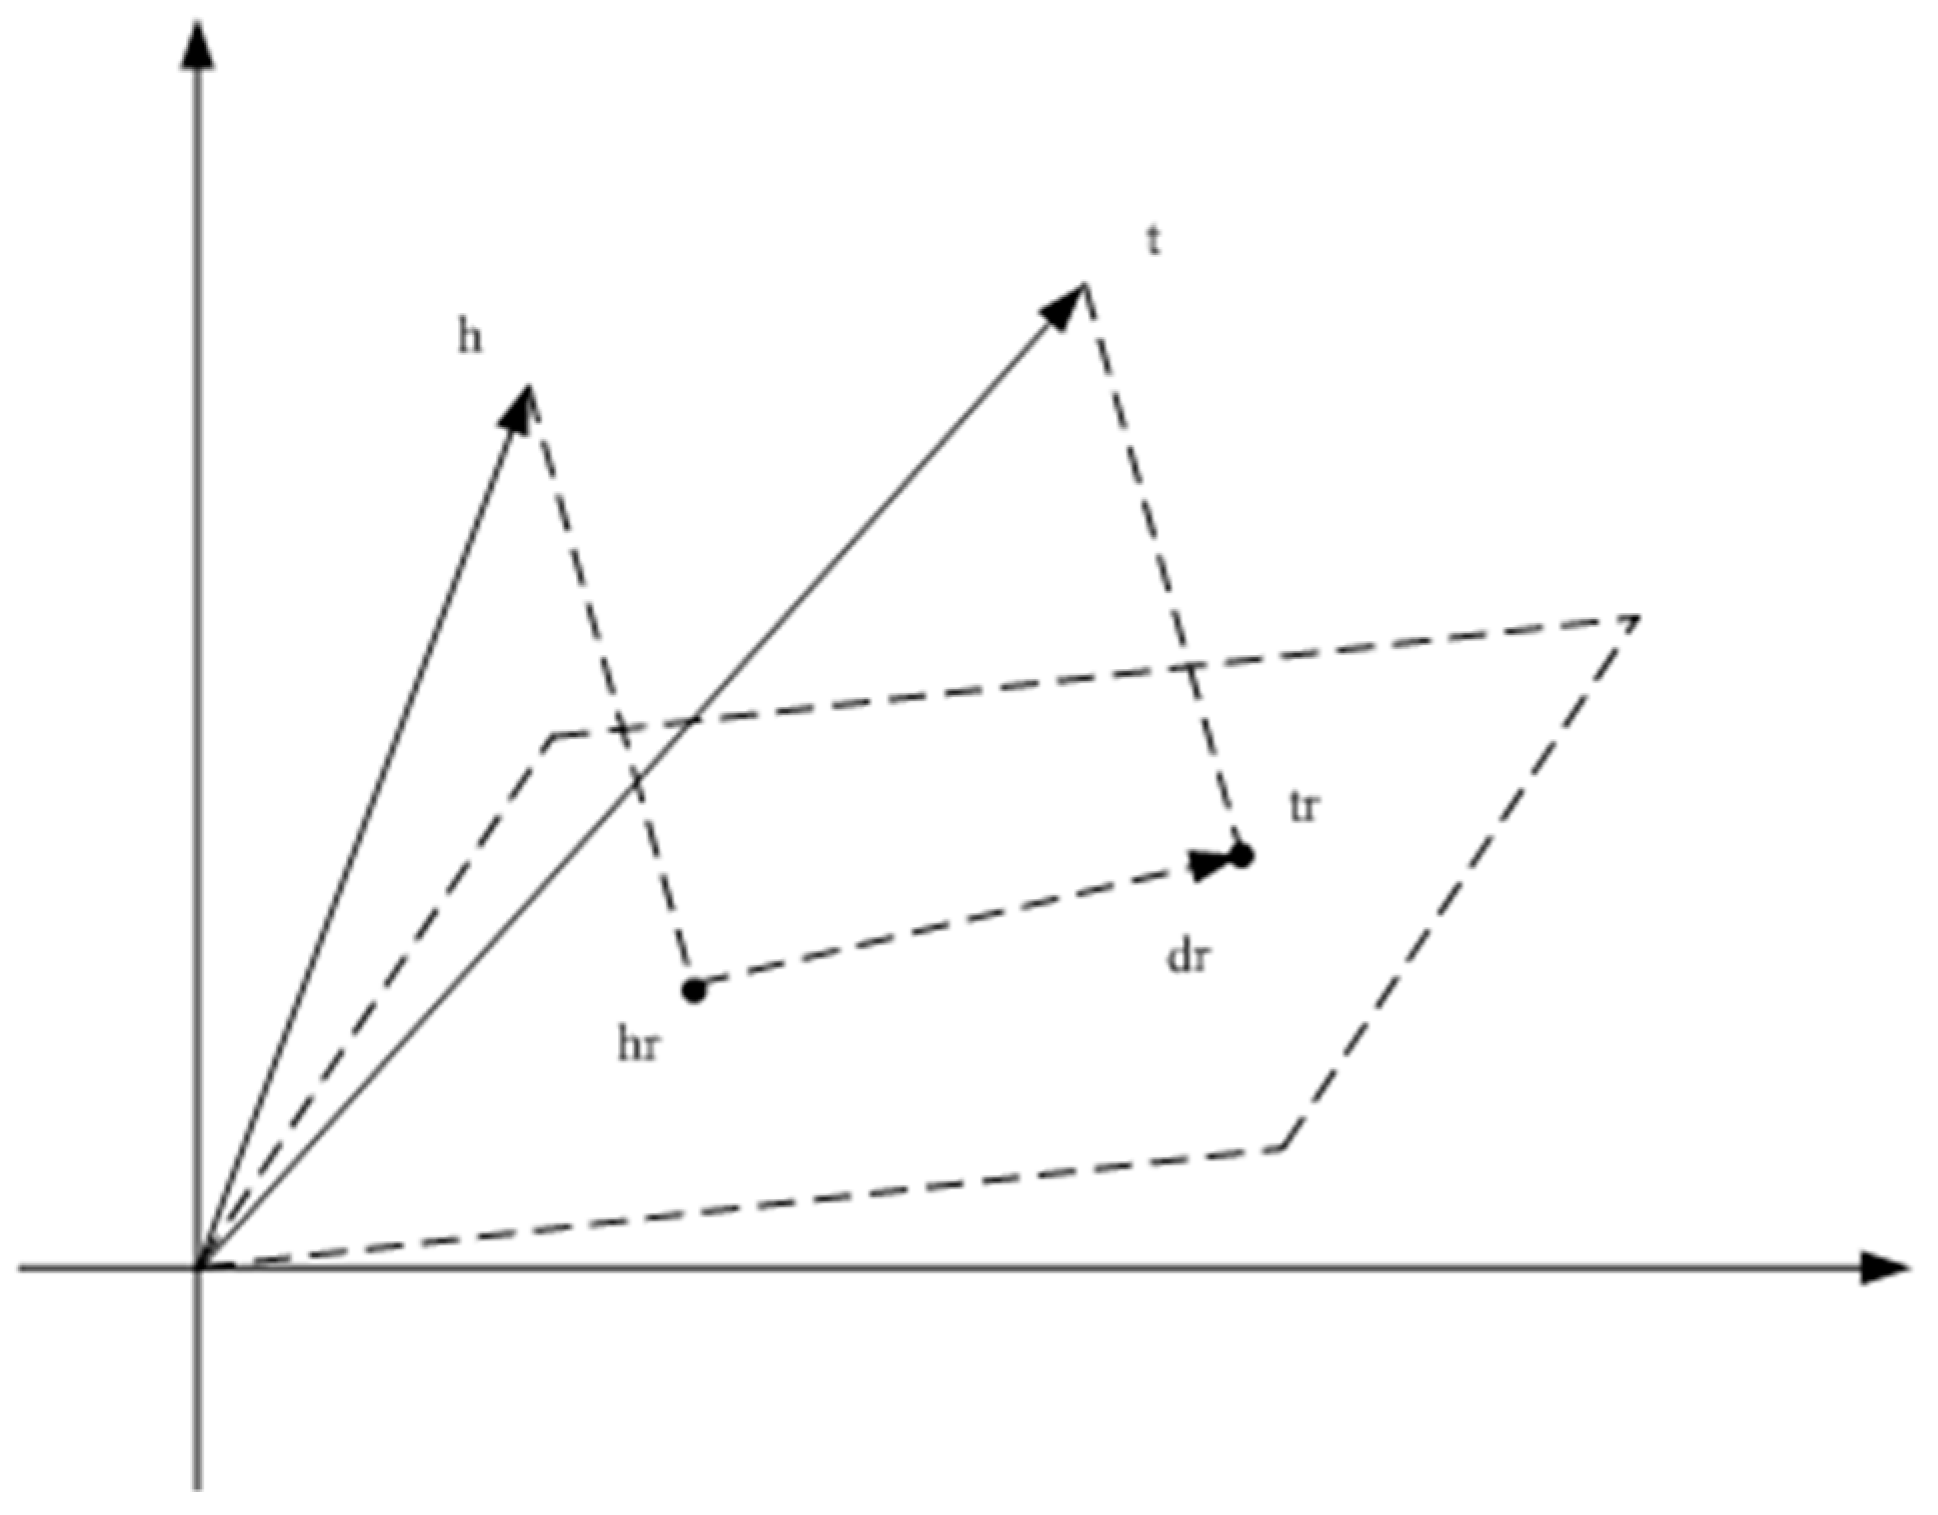
TransH establishes a relationship-oriented hyperplane model in order to optimize TransE’s weak ability to handle complex relationships. For a relation r, the vector lr corresponding to r is placed on the relationship-specific hyperplane lnr (normal vector) instead of being represented in the same space as the entity representation. For a triple (h, r, t), h and t are first mapped to lhr, ltr on the hyperplane lnr. Equations (5) and (6) are used to link lhr, ltr, and lr on the hyperplane. The score function is described in Equation (4):
which can provide
The above formula can be used in the scoring function after the trial of the hyperplane model:
Consider the constraints of the vector:
The final loss function is
The second and third terms of the loss function are representations of the constraints. The training principle is similar to TransE.
Different entities can be distinguished after using the hyperplane model to make the knowledge representation more accurate. The vector representation of the TransH algorithm is shown in Figure 4.
Since TransH calculates the loss function by Euclidean distance, the Euclidean distance is used to measure the similarity of the entities. The entity similarity is defined as Equation (12):
where A and B are two entity vectors in the knowledge graph. It can be seen from Equation (12) that the closer sim(A, B) is to 1, the higher the correlation between the entity vectors A and B is; that is, the closer the two entities are in the knowledge graph, the smaller sim(A, B) is and the more alienated the two entities are in the knowledge graph.
The similarities of users are calculated by using Equation (12) and sorted. The 10 users closest to um form the neighbor set U of user um.
3.1.3. Obtaining the Initial Recommendation Set
For the triple in the knowledge graph, the head vector plus the relationship vector is approximately equal to the tail vector. For each um’s neighbor user u(), Equations (13) and (14) are used to find his highly rated services, and the highly rated services of neighbor users of um form a set denoted as US:
The value of γ represents the maximum distance between a service and the user’s highly rated service. The smaller γ is, the more the service satisfies the conditions of the user’s highly rated service. γ is determined by experiment, and s represents u’s vector corresponding to the highly rated service. rsatisfaction represents the vector corresponding to satisfaction, and rverysatisfaction represents the vector corresponding to very satisfied.
For the user um, his high evaluation services are revealed by Equations (13) and (14), the similarities between each highly rated service and other services are calculated, and the top five services closest to each highly rated service are added to the set RS as initial recommendation services.
US and RS are the initial recommendation service sets.
3.2. User QoS Preference Calculation and User Behavior Classification
3.2.1. QoS Preference Calculation
QoS is an important factor to be considered for recommendations. It includes multidimensional quality of service factors such as response time, reliability, availability, throughput, and so on. Different users have different acceptance levels for different QoS attributes. For example, some users are more concerned with reliability than response time, while others are more concerned with response time than reliability. Therefore, calculating the user’s preference for different QoS attributes through user behavior can rank the recommendation services more reasonably.
Suppose that has awarded ratings to N Web services and there are K QoS properties for each Web service.
Let denote the rating vector of , where denotes the rating awarded by for .
Let denote the QoS matrix of , where denotes the value of the k-th QoS property of service n which is observed from .
Let denote the preference vector of , where pk denotes ’s preference for k-th QoS attributes [21].
The relationship between , , and is expressed in Equation (15):
The purpose is to calculate . Because the number of QoS attributes is small, the noise in the QoS and rating data might provide a wrong solution when using linear algebra. So, the loss function is defined as shown in Equation (16):
where is the regularization term to avoid overfitting. can be solved by a gradient descent algorithm as follows:
- (1)
- Randomly initialize the values of the parameters in .
- (2)
- Use Equation (17) to compute the partial derivative of F for pk and Equation (18) to update the parameters:where is the iteration step size for calculating .
- (3)
- If , back to 2; if , terminate the computation and is determined.
3.2.2. User Behavior Classification
The usage habits of users are different. Some users like to use services that have been used or related to them. We define these users as negative users. Some users are open to and willing to try new services. We define these users as positive users. In the knowledge graph, the distance between entities represents the semantic similarity of the entities. So, we can judge the degree of association between the two services by calculating the distance of the Web service entities in the graph. Therefore, the category of a user can be effectively determined by the average distance between all the services used by him.
Let denote the set of highly rated services that has used. According to the above definition and the distance of the entity vector in the knowledge graph, the user behavior is judged by Equation (19):
where represents the average distance of the Web services used by the user in the knowledge graph, which is used to determine whether it is a positive or negative user. The algorithm sets the ratio of positive to negative users as 1:1. for each user is calculated and sorted ascendingly. Users with a in the top 50% are negative users, and the others are positive users.
3.3. Recommendation Set Fusion
By Equations (12)–(14), um’s neighbor users’ highly rated services set US and the highly rated services’ association services set RS of um are obtained. For um, his predictive scores of services in US and RS are obtained by multiplying the calculated user preferences pm with the predicted QoS attribute values of services. The average value of QoS evaluation of his neighbor users represents the QoS prediction value of um for services. The product of user preference and predictive QoS is added to the predictive score of the service. Web services in US and RS are sorted by predictive scores to get L and K. The services in US are far away from the services used by the user to receive a recommendation, so the positive user prefers to be recommended more services in US than in RS. The services in RS are closer to the services used by the user to receive a recommendation, so the negative user prefers to be recommended more services in RS than in US. The final recommendation set C should integrate L and K in the proportion p:q, and p and q are determined by experiment. Assuming that the length of L is l and the length of K is k, the length of C denoted as n can be calculated by Equation (20):
The fusion algorithm is shown as follow:
| Algorithm 1: Recommendation set fusion algorithm |
| Input: Neighbor user service ordered set L; associated service for high-scoring services of recommended users ordered set K; user category NU (negative user), PU (positive user) |
| Output: Final recommendation set C |
| 1. If(user is PU) |
| 2. For do: |
| 3. For do: |
| 4. |
| 5. End do |
| 6. End do |
| 7. C = L |
| 8. Else |
| 9. For do: |
| 10. For do: |
| 11. |
| 12. End do |
| 13. End do |
| 14. C = K |
3.4. Pseudocode of kg-WSR
The pseudocode for kg-WSR is shown as follows:
| Algorithm 2: kg-WSR |
| Input: Triples in knowledge map; user um; um’s rating vector; um’s service QoS matrix; user set UF; service set SF |
| Output: Service recommendation set C of user um |
| 1. Computing user preference Pm by gradient descent |
| 2. Using TransH to obtain the low-dimensional vector expression of entities and relationships |
| 3. For each user u in UF do: |
| 4. Computing the similarity between u and um |
| 5. Sort similarities |
| 6. End for |
| 7. Ten users with the highest similarity as the neighbor set U of um |
| 8. For each user u in U do: |
| 9. For each service s in SF do: |
| 10. Computing ||u+rsatisfaction-s|| and ||u+rverysatisfaction-s|| |
| 11. If ||u+rsatisfaction-s|| < or ||u+rverysatisfaction-s|| < then: |
| 12. s added to set US |
| 13. End if |
| 14. End for |
| 15. For each service s in SF do: |
| 16. Computing ||um+rsatisfaction-s|| and ||um+rverysatisfaction-s|| |
| 17. If ||um+rsatisfaction-s|| < or ||um+rverysatisfaction-s|| < then: |
| 18. s is highly rated service for user um |
| 19. End if |
| 20. End for |
| 21. For each um’s highly rated service do: |
| 22. For each service s in SF do: |
| 23. Computing service similarity |
| 24. End for |
| 25. Sort similarities |
| 26. The three services with the highest similarity are added to the set RS |
| 27. End for |
| 28. Sorting US and RS into ordered sequences L and K, respectively, using user preference pm |
| 29. Computing the average distance between highly rated services of um and determining user classification |
| 30. Use the fusion algorithm to form the final recommendation set C |
4. Experiment and Evaluation
We conducted experiments to test the proposed algorithm and evaluated its recommendation effect in the environment we provided. The experimental results show that the proposed algorithm improved the accuracy rate, recall rate, and coverage rate of recommendation results.
4.1. Experimental Data
In order to obtain real Web services, 873 travel-related and map-related Web services were captured on multiple open platforms through Web crawlers. Travel-related services included hotel services, ticketing services, attraction services, etc. Relationships between services were determined by input–output keyword matching and the relationships defined in Table 1. At the same time, the rating information of 345 users and the evaluation of the two QoS attributes of response time and reliability were obtained. These data were stored in the Web service knowledge graph.
4.2. Evaluation Standard
For the recommendation results, the precision rate (P), recall rate (R), and coverage rate (C) indicators were used to evaluate this algorithm. The precision rate represents the recommended accuracy; that is, how many recommended services are correct. The recall rate reflects the proportion of items recommended by the recommended system occupying items that users really like [1]. Services used by fewer than 10 users were defined as new services. Coverage rate refers to the rate of new services in recommendation results. This was used to judge the degree of solving the cold start problem. The indicators were defined as:
where represents the list of services actually used by the user, is the recommended list of services, represents new services in the recommendation list, and represents new services in the knowledge graph.
4.3. Experimental Comparison and Verification
The low-dimensional vector representation of services and users in the knowledge graph were obtained by the TransH algorithm. Assuming the user had five highly rated services, through many experiments, we obtained = 0.15. After calculating the average distance of services used by each user, we found that when the parameter in Equation (19) , the user was a negative user; when , the user was a positive user.
4.3.1. Embedded Dimension Determination
Knowledge graph representation learning is to embed entities into low-dimensional vector space, so it will have different effects for different embedding dimensions. The experimental results of 100–500 dimensions are shown in Table 2.
It can be seen from Table 2 that the recommended effect was best with 200 dimensions.
4.3.2. Fusion Ratio Determination
The proportional fusion experiment was performed with the learning embedding dimension of 200 and the number of recommended set C was 30. Table 3 shows the P and R for each ratio when the user classification was not performed. Table 4 shows the P and R for each ratio when the user classification was performed.
4.3.3. Performance Comparison
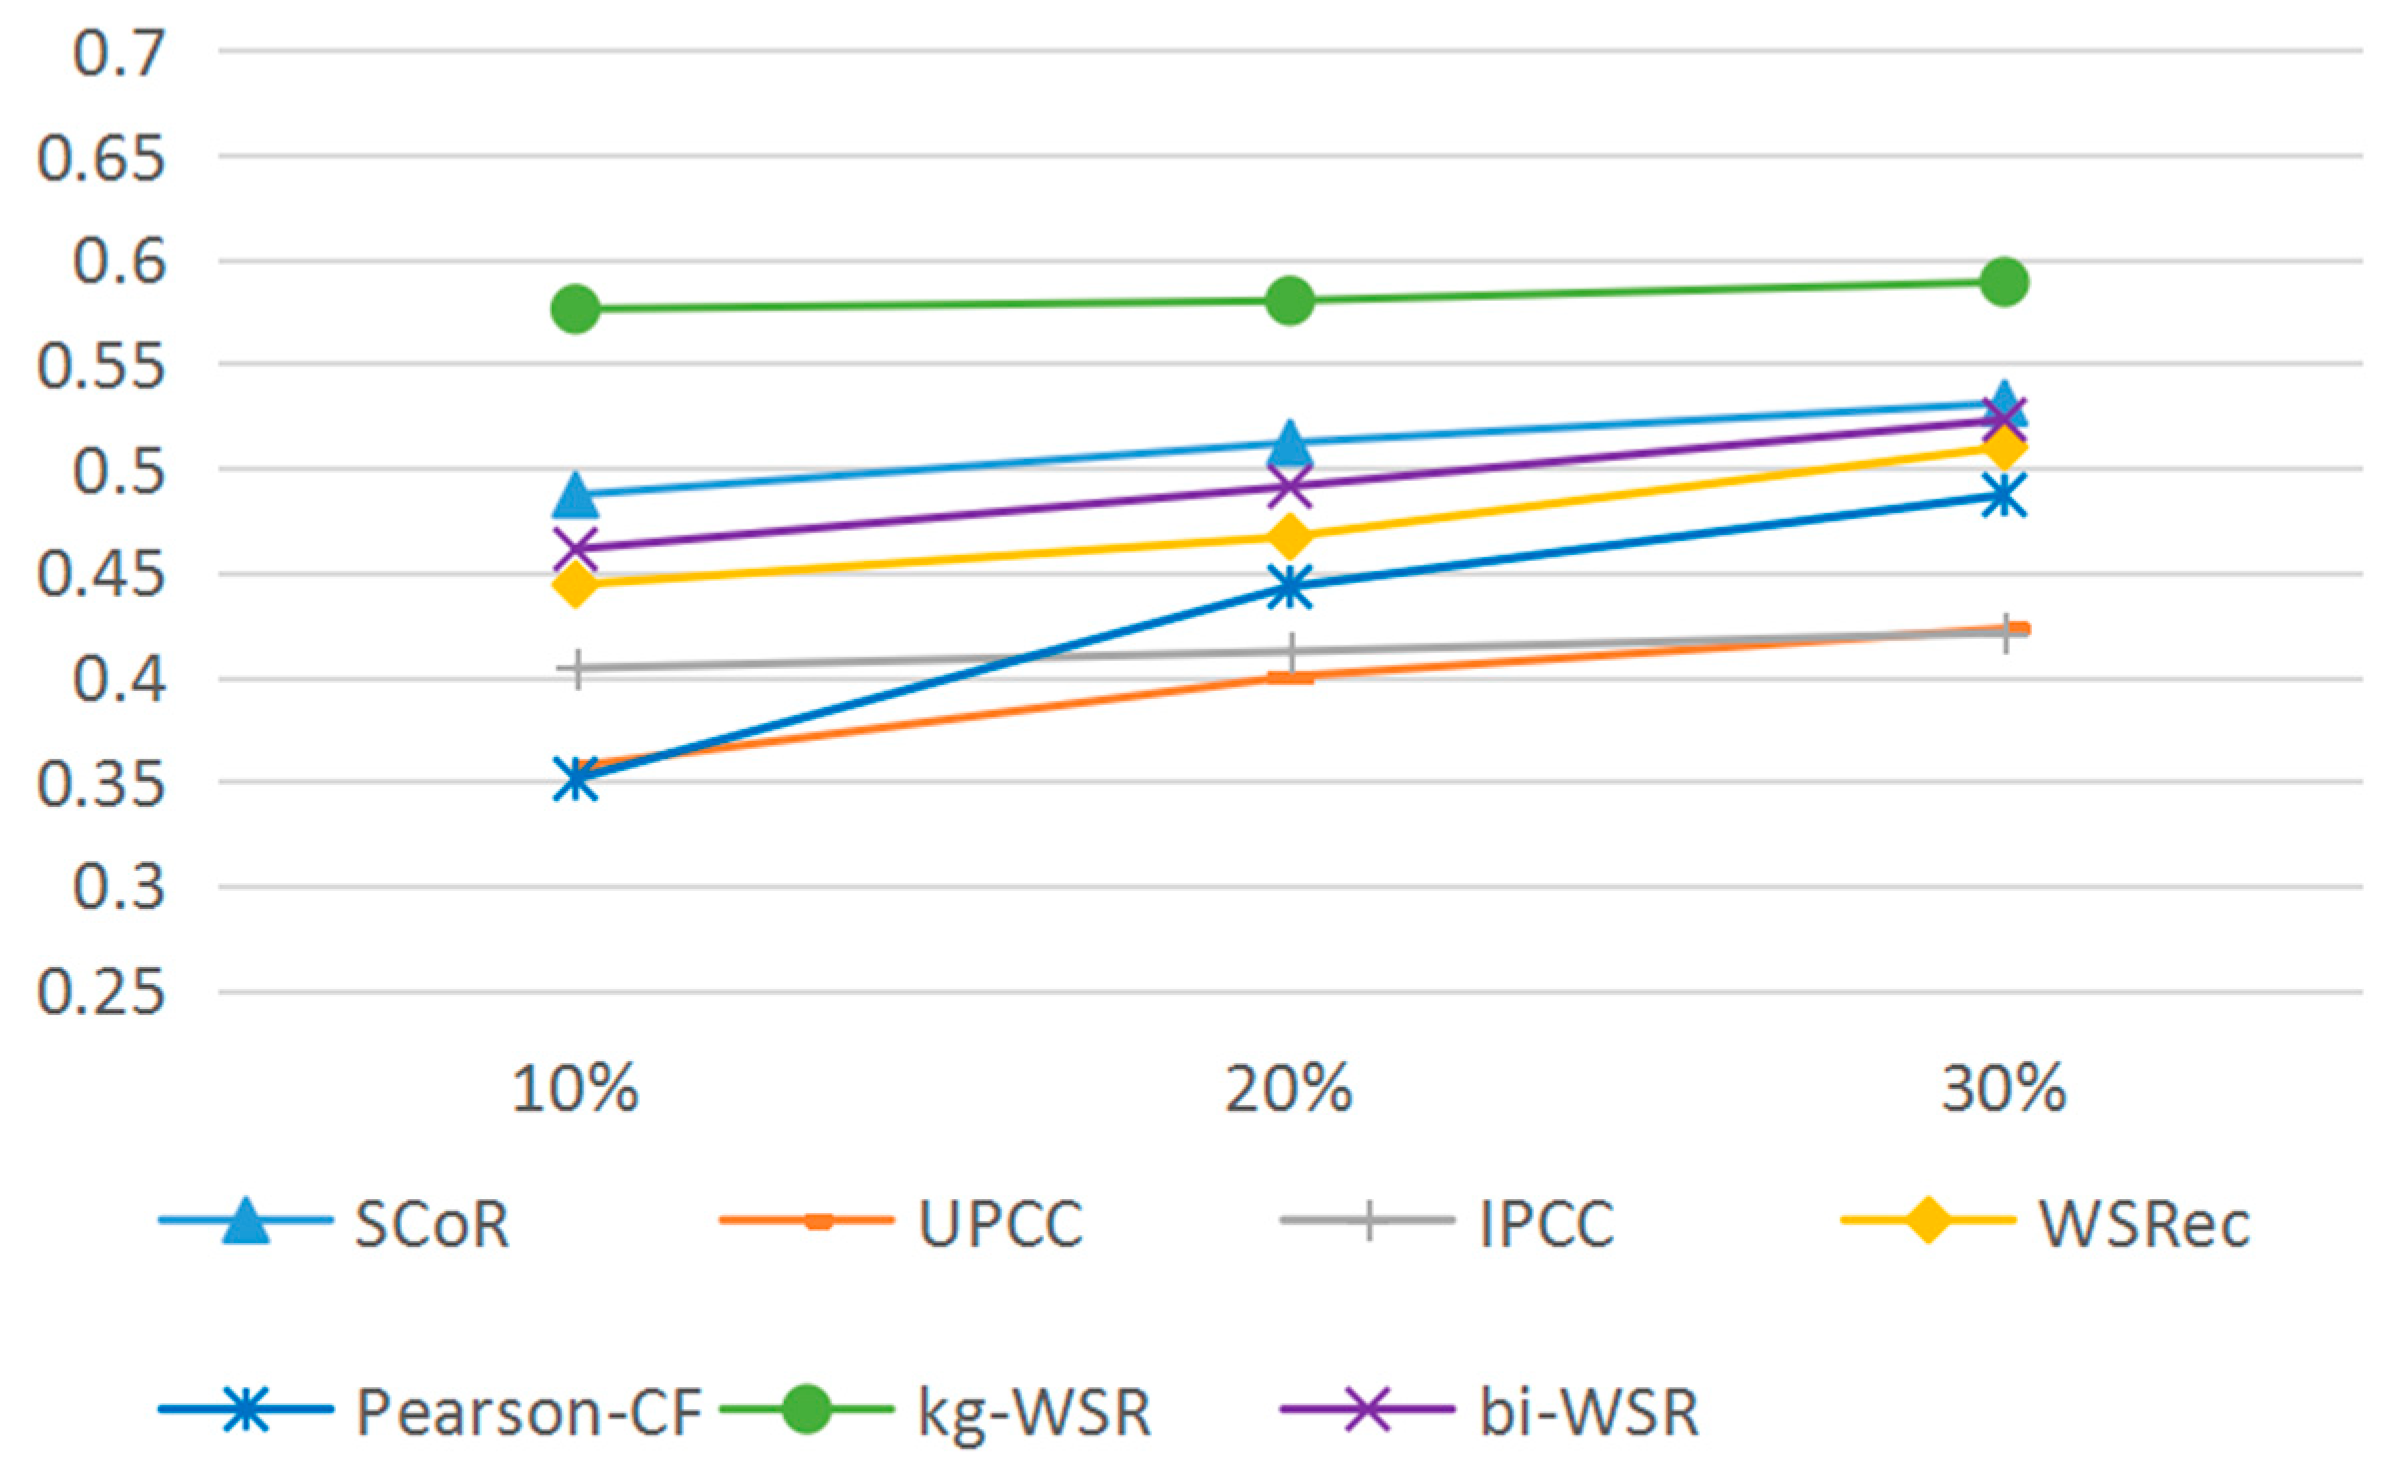
Experiments were performed with an optimal dimension of 200 and an optimal ratio of 6:4, 4:6. The following algorithms were selected to be compared with the kg-WSR:
SCoR: This algorithm puts the entity into the coordinate system to calculate the Euclidean distance for recommendation. This algorithm has a good effect on the cold start problem.
UPCC: Research on the neighbor model, KNN model.
IPCC: Research on product-based KNN model.
WSRec: Improved collaborative filtering prediction algorithm and integrated information on similar users and services.
Pearson-CF: Collaborative filtering service recommendation algorithm based on Pearson coefficient.
Bi-WSR: Integrated recommendation model with integrated QoS and QoE.
The recommended results for the comparison algorithms were mainly affected by the QoS matrix data density (D). Therefore, the experiment set three different densities of 10%, 20%, and 30%. Figure 5 shows the accuracy rate comparison with kg-WSR.
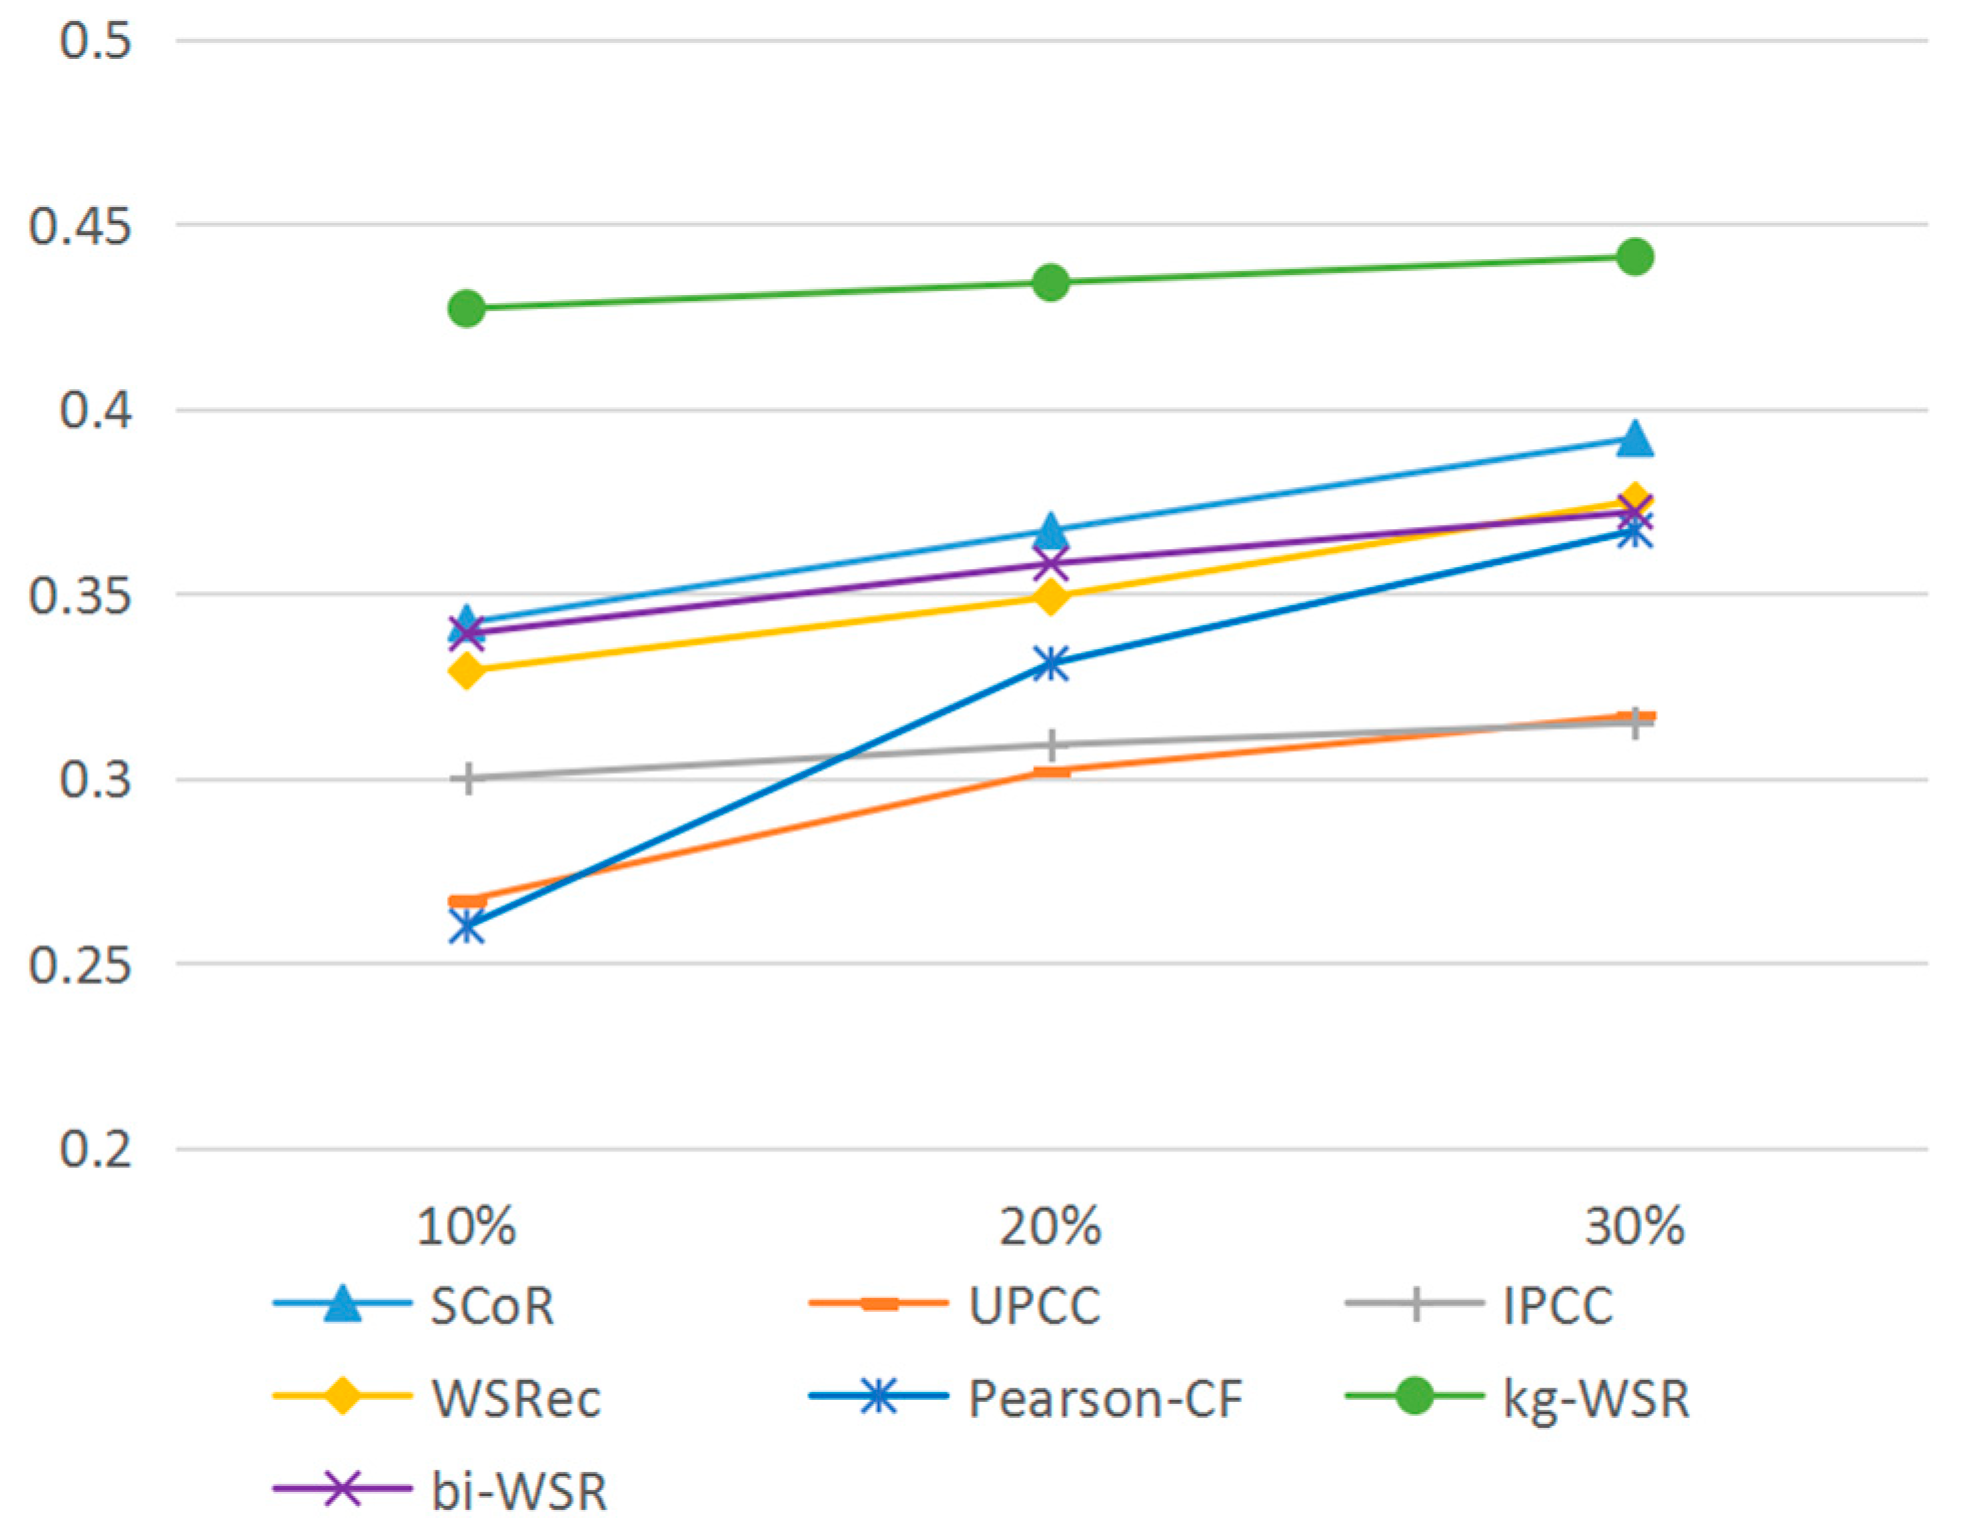
Figure 6 shows the comparison of recall rates.
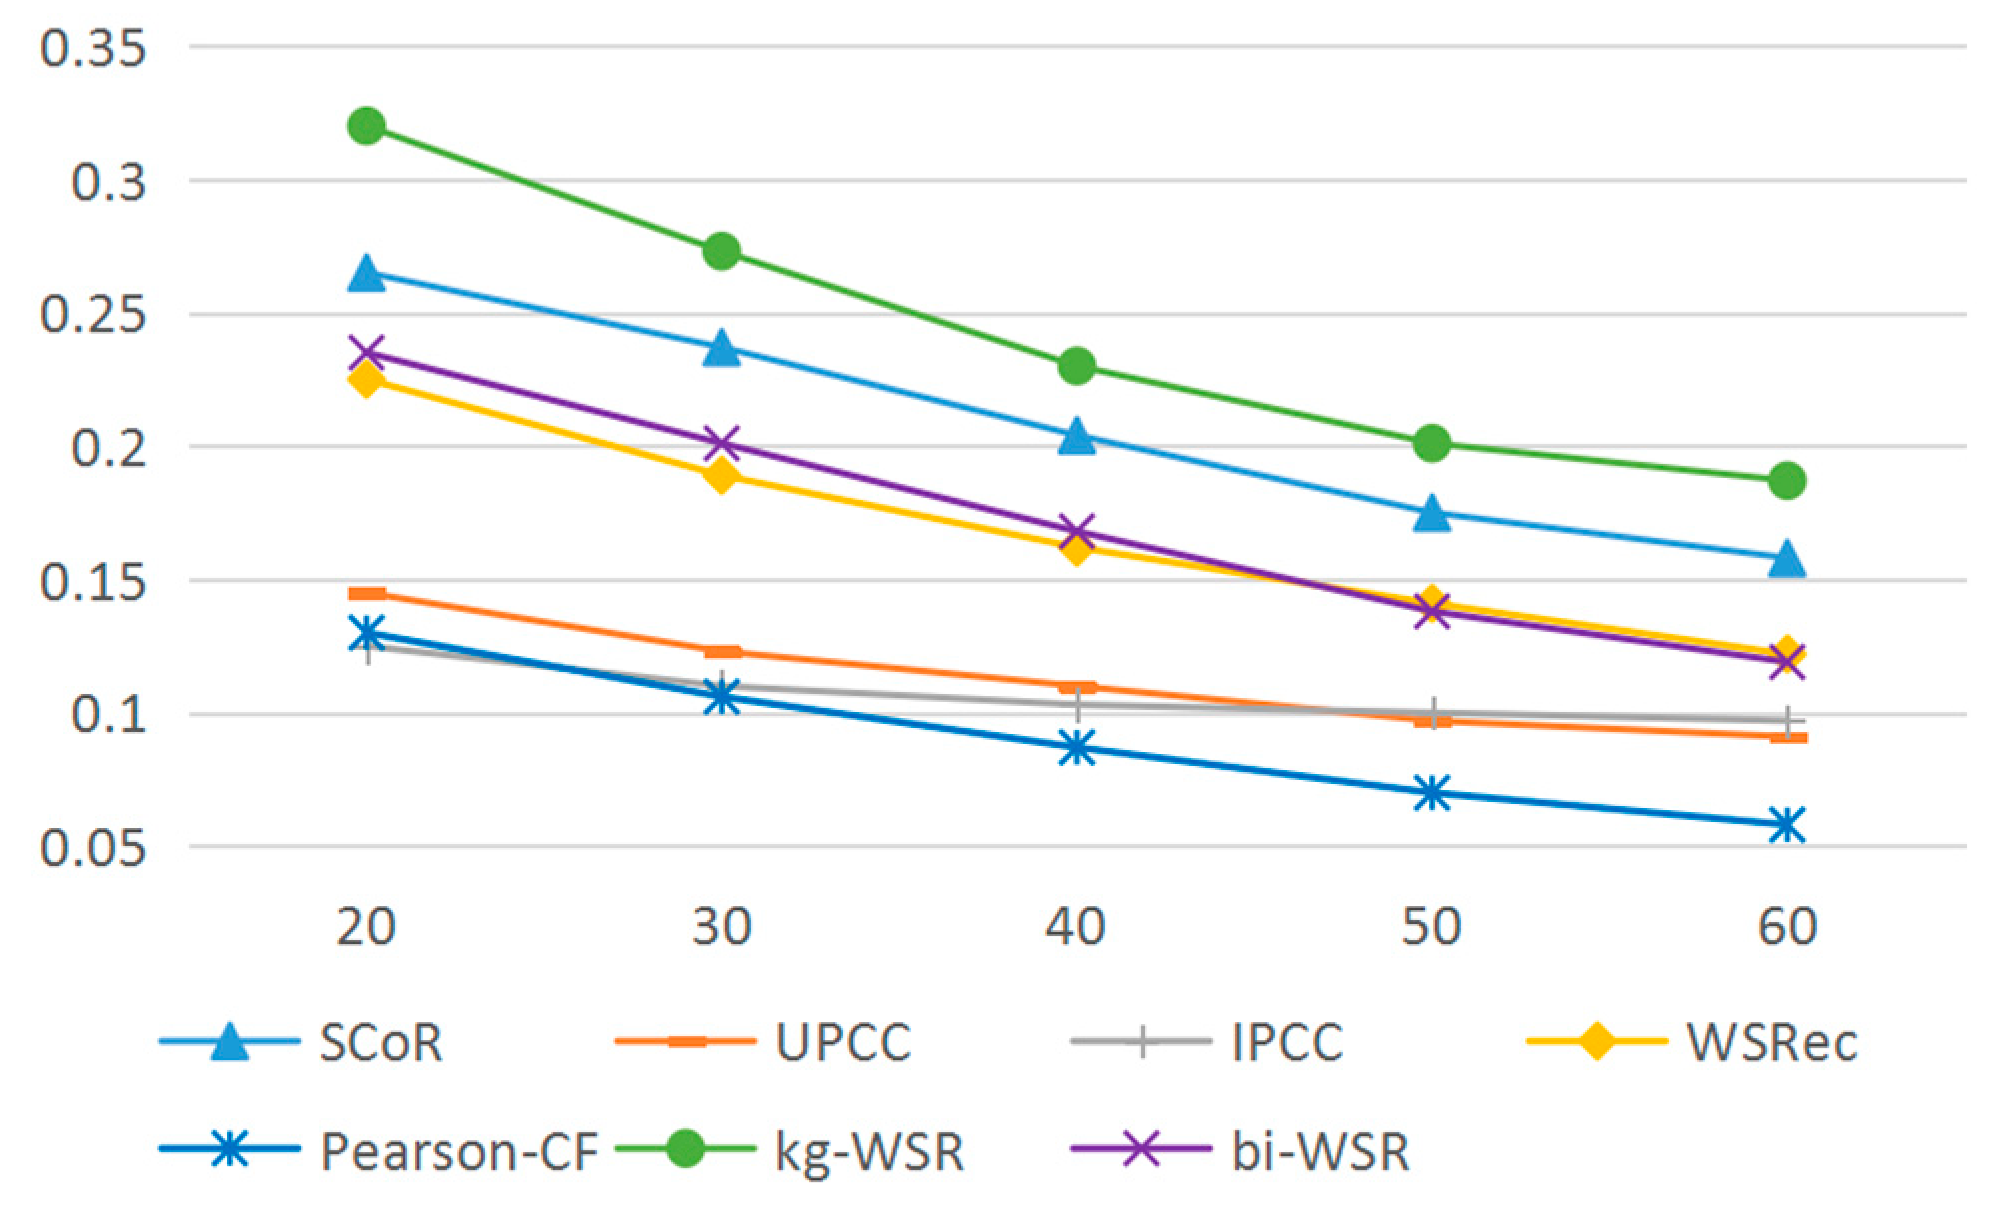
In order to evaluate the cold start problem, different numbers of new services were injected into the experimental data and the algorithm coverage rates were compared. Figure 7 shows the comparison of algorithm new service coverage rates.
It can be seen from Figure 5, Figure 6 and Figure 7 that the kg-WSR algorithm improved the accuracy, recall, and coverage rates of recommendation results by using the service association information and user information in the knowledge graph. Also, the influence of data density on the algorithm was small. The coverage rate of the new services was obviously higher than that of the other algorithms. Thus, this algorithm better solves the cold start problem.
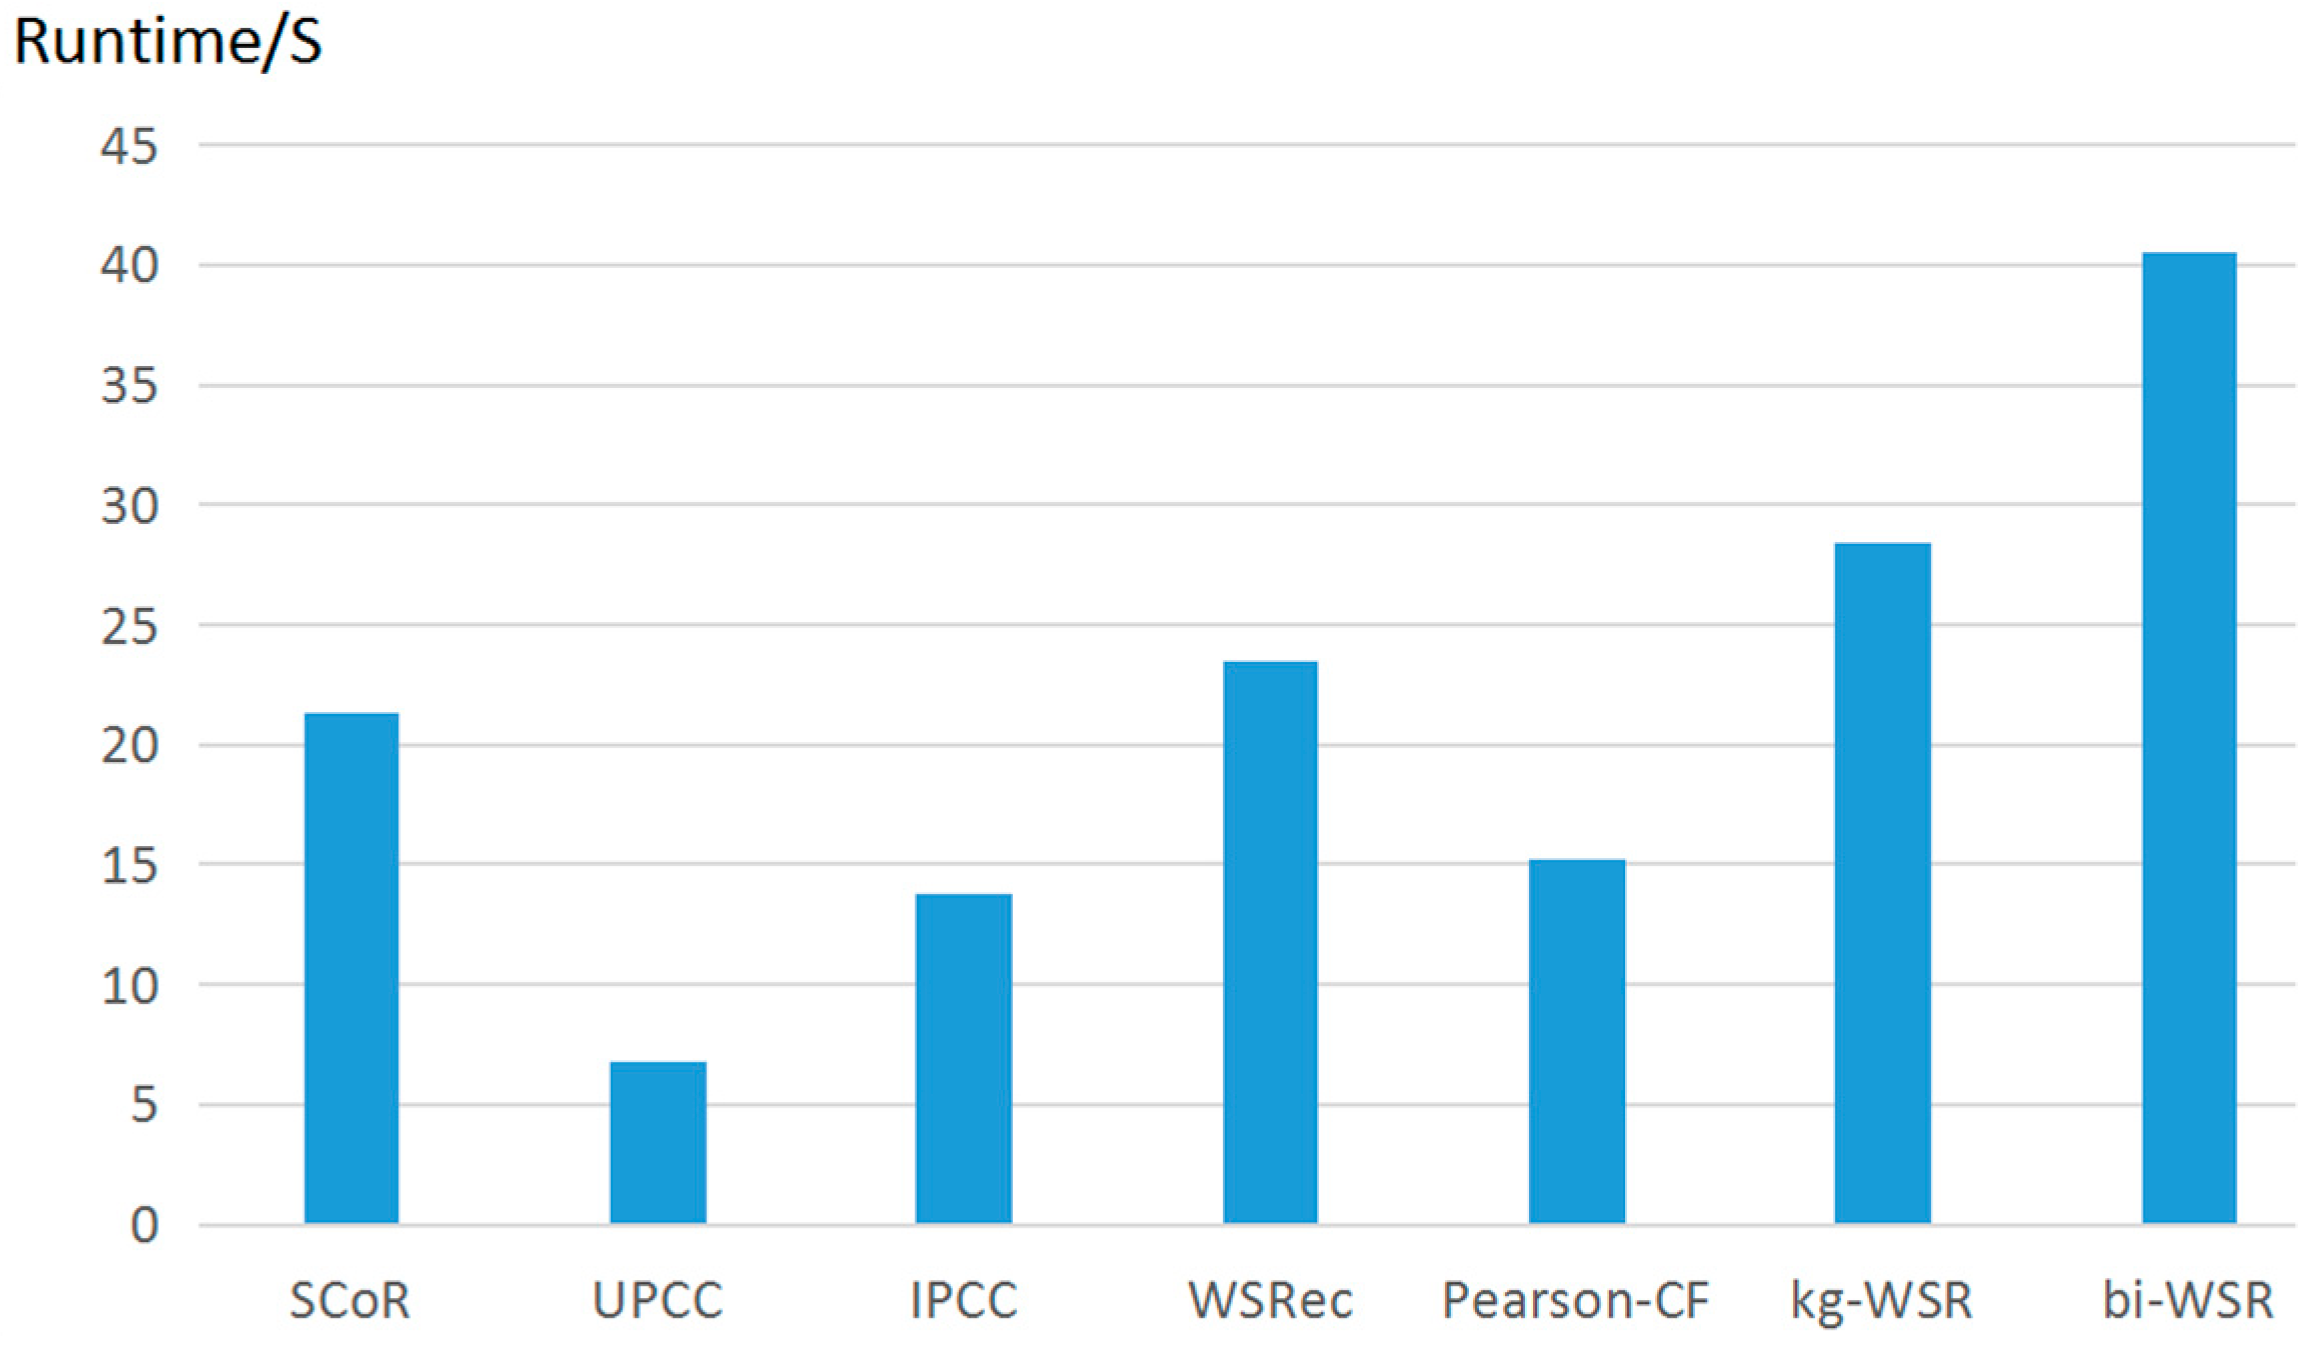
4.3.4. Algorithm Efficiency
Figure 8 shows the running time of each algorithm, which was the average of that of 10 repeated experiments.
It can be seen from Figure 8 that the kg-WSR algorithm proposed in this paper was more computationally intensive because factors such as user preference and user classification were involved. The running time was slightly higher than that of WSRec and SCoR while lower than that of bi-WSR. The running time was higher than UPCC, IPCC, and Pearson-CF because they only use similarity for recommendations.
5. Conclusions
This paper proposed an efficient Web service recommendation algorithm based on knowledge graph representation learning. This algorithm not only takes into account the semantic information between services but also calculates users’ QoS preferences and user classification. Therefore, the algorithm has a comprehensive recommendation effect. The algorithm embeds the entity into the low-dimensional space through knowledge graph representation learning (TransH), calculates similarities between entities to find neighbor users and associated services, and classifies users by the distance between services used.
Experiments conducted show that the kg-WSR improved the accuracy of the recommendation result and had a certain effect on solving the cold start problem. Although the time cost of the algorithm was higher than that of the other algorithms to which it was compared, it greatly improved the accuracy and recall rates and achieved a better recommendation effect.
Author Contributions
Author Contributions Writing—original draft, Z.C., X.Q., S.J., and X.Z.
Funding
This work was supported by the National Natural Science Foundation of China (Grant No. 51679025, 51479021), the Fundamental Liaoning Provincial Natural Science Foundation of China (Grant No. 20170520196) and the Fundamental Research Funds for the Central Universities (Grant No.3132016308).
Conflicts of Interest
The authors declare no conflict of interest.
References
- Zhang, X.; He, K.; Wang, J.; Liu, J. A Survey of Web Services Personalized Recommendations. Comput. Eng. Sci. 2013, 35, 132–140. [Google Scholar]
- Yue, K.; Wang, X.; Zhou, A. Web Services Core Support Technology: A Review of Research. J. Softw. 2004, 15, 428–442. [Google Scholar]
- Sreenath, R.M.; Singh, M.P. Agent-based service selection. Web Semant. Sci. Serv. Agents World Wide Web 2004, 1, 261–279. [Google Scholar] [CrossRef]
- Karta, K. An Investigation on Personalized Collaborative Filtering for Web Service Selection. Honours Programme Thesis, University of Western Australia, Brisbane, Australia, 2005. [Google Scholar]
- Herlocker, J.L.; Konstan, J.A.; Borchers, A.; Riedl, J. An algorithmic framework for performing collaborative filtering. In Proceedings of the International ACM Sigir Conference on Research & Development in Information Retrieval, Berkeley, CA, USA, 15–19 August 1999. [Google Scholar]
- Shao, L.; Zhang, J.; Wei, Y.; Zhao, J.; Xie, B.; Mei, H. Personalized QoS Prediction for Web Services via Collaborative Filtering. In Proceedings of the IEEE International Conference on Web Services, Salt Lake City, UT, USA, 9–13 July 2007. [Google Scholar]
- Zheng, Z.; Ma, H.; Lyu, M.R.; King, I. Wsrec: A collaborative filtering based web service recommender system. In Proceedings of the 7th IEEE International Conference on Web Services, Los Angeles, CA, USA, 6–10 July 2009; pp. 437–444. [Google Scholar]
- Mikolov, T.; Sutskever, I.; Chen, K.; Corrado, G.S.; Dean, J. Distributed Representations of Words and Phrases and their Compositionality. Adv. Neural Inf. Process. Syst. 2013, 26, 3111–3119. [Google Scholar]
- Bordes, A.; Weston, J.; Collobert, R.; Bengio, Y. Learning Structured Embedding of Knowledge Bases. In Proceedings of the 25th AAAI Conference on Artificial Intelligence, San Francisco, CA, USA, 7–11 August 2011. [Google Scholar]
- Socher, R.; Chen, D.; Manning, C.D.; Ng, A. Reasoning with Neural Tensor Networks for Knowledge Base Completion. In Proceedings of the International Conference on Neural Information Processing Systems, Lake Tahoe, NV, USA, 8–13 December 2013; Curran Associates Inc.: Red Hook, NY, USA, 2013. [Google Scholar]
- Yang, B.; Yih, W.; He, X.; Gao, J.; Deng, L. Embedding entities and relations for learning and inference in knowledge bases. arXiv, 2014; arXiv:1412.6575. [Google Scholar]
- Nickel, M.; Tresp, V.; Kriegel, H.P. A three-way model for collective learning on multi-relational data. In Proceedings of the International Conference on International Conference on Machine Learning, Bellevue, WA, USA, 2–28 June 2011. [Google Scholar]
- Mikolov, T.; Chen, K.; Corrado, G.; Dean, J. Efficient Estimation of Word Representations in Vector Space. arXiv, 2013; arXiv:1301.3781. [Google Scholar]
- Bordes, A.; Usunier, N.; Garcia-Duran, A.; Weston, J.; Yakhnenko, O. Translating embeddings for modeling multi-relational data. In Proceedings of the NIPS, Cambridge, UK, 4–10 December 2013. [Google Scholar]
- Ji, G.; He, S.; Xu, L.; Liu, K.; Zhao, J. Knowledge Graph Embedding via Dynamic Mapping Matrix. In Proceedings of the Meeting of the Association for Computational Linguistics & the International Joint Conference on Natural Language Processing, Beijing, China, 27–31 July 2015. [Google Scholar]
- Xiao, H.; Huang, M.; Hao, Y.; Zhu, X. TransG: A Generative Mixture Model for Knowledge Graph Embedding. arXiv, 2016; arXiv:1509.05488. [Google Scholar]
- He, S.; Liu, K.; Ji, G.; Zhao, J. Learning to represent knowledge graphs with gaussian embedding. In Proceedings of the 24th ACM International on Conference on Information and Knowledge Management, Melbourne, Australia, 18–23 October 2015; pp. 623–632. [Google Scholar]
- Fang, Y.; Zhao, X.; Tan, Z.; Yang, S.; Xiao, W. An Improved Translation-Based Knowledge Mapping Representation Method. J. Comput. Res. Dev. 2018, 55, 139–150. [Google Scholar]
- Wang, Z.; Zhang, J.; Feng, J.; Chen, Z. Knowledge Graph Embedding by Translating on Hyperplanes. In Proceedings of the Twenty-Eighth Aaai Conference on Artificial Intelligence, Québec City, QC, Canada, 27–31 July 2014. [Google Scholar]
- You, M.A.; Xin, X.; Wang, S.; Li, J.; Sun, Q.; Yang, F. QoS Evaluation for Web Service Recommendation. China Commun. 2015, 12, 151–160. [Google Scholar] [CrossRef]
- Salakhutdinov, R.; Mnih, A. Probabilistic Matrix Factorization. In Proceedings of the International Conference on Neural Information Processing Systems, Kitakyushu, Japan, 13–16 November 2007. [Google Scholar]
- Jhaveri, S.; Soundalgekar, P.M.; George, K.; Kamath, S.S. A QoS and QoE based Integrated Model for Bidirectional Web Service Recommendation. In Proceedings of the Pacific Neighborhood Consortium Annual Conference and Joint Meetings, Tainan, Taiwan, 7–9 November 2018. [Google Scholar]
- Papadakis, H.; Panagiotakis, C.; Fragopoulou, P. SCoR: A Synthetic Coordinate based Recommender system. Expert Syst. Appl. 2017, 79, 8–19. [Google Scholar] [CrossRef]
- Liu, J.; Tang, M.; Zheng, Z.; Liu, X.F.; Lyu, S. Location-aware and personalized collaborative filtering for web service recommendation. IEEE Trans. Serv. Comput. 2016, 9, 686–699. [Google Scholar] [CrossRef]
- Nilashi, M.; Ibrahim, O.; Bagherifard, K. A recommender system based on collaborative filtering using ontology and dimensionality reduction techniques. Expert Syst. Appl. 2018, 92, 507–520. [Google Scholar] [CrossRef]
- Chen, S.; Feng, Z.; Wang, H. Service Relationship and Its Application in Service-Oriented Computing. Chin. J. Comput. 2010, 33, 2068–2083. [Google Scholar] [CrossRef]
- Liu, Z.; Sun, M.; Lin, Y.; Xie, R. Progress in Knowledge Representation Learning. J. Comput. Res. Dev. 2016, 53, 247–261. [Google Scholar]
Figure 1.
The main steps of the Web service recommendation algorithm based on knowledge graph representation learning (kg-WSR).
Figure 1.
The main steps of the Web service recommendation algorithm based on knowledge graph representation learning (kg-WSR).

Figure 2.
Simplified diagram of the knowledge graph.

Figure 3.
Vector representation of the TransE algorithm.

Figure 4.
Vector representation of the TransH algorithm.

Figure 5.
Comparison of algorithm accuracy rates.

Figure 6.
Comparison of algorithm recall rates.

Figure 7.
Comparison of algorithm new service coverage rates.

Figure 8.
Algorithm running time comparison.


Table 1.
Service relationship.
| Types | Categories | Description |
|---|---|---|
| Competitive relations | Exact plugin subsume | |
| Collaborative relations | Rely-total | |
| Rely-part |
Table 2.
P, R values corresponding to different embedding dimensions.
| Dimension | P | R |
|---|---|---|
| 100 | 0.580 | 0.435 |
| 200 | 0.587 | 0.441 |
| 300 | 0.582 | 0.437 |
| 400 | 0.578 | 0.434 |
| 500 | 0.576 | 0.432 |
Table 3.
P, R values for each proportion when there was no user classification.
| Fusion Ratio (p:q) | P | R |
|---|---|---|
| 0:10 | 0.465 | 0.347 |
| 1:9 | 0.497 | 0.376 |
| 2:8 | 0.520 | 0.388 |
| 3:7 | 0.544 | 0.410 |
| 4:6 | 0.567 | 0.420 |
| 5:5 | 0.542 | 0.409 |
| 6:4 | 0.527 | 0.396 |
| 7:3 | 0.487 | 0.368 |
| 8:2 | 0.461 | 0.349 |
| 9:1 | 0.430 | 0.316 |
| 10:0 | 0.415 | 0.310 |
Table 4.
P, R values for each proportion when there was user classification.
| NU Fusion Ratio | PU Fusion Ratio | P | R |
|---|---|---|---|
| 0:10 | 10:0 | 0.482 | 0.360 |
| 1:9 | 9:1 | 0.508 | 0.383 |
| 2:8 | 8:2 | 0.530 | 0.395 |
| 3:7 | 7:3 | 0.570 | 0.429 |
| 4:6 | 6:4 | 0.587 | 0.441 |
| 5:5 | 5:5 | 0.546 | 0.406 |
© 2019 by the authors. Licensee MDPI, Basel, Switzerland. This article is an open access article distributed under the terms and conditions of the Creative Commons Attribution (CC BY) license (http://creativecommons.org/licenses/by/4.0/).
Share and Cite
MDPI and ACS Style
Cao, Z.; Qiao, X.; Jiang, S.; Zhang, X. An Efficient Knowledge-Graph-Based Web Service Recommendation Algorithm. Symmetry 2019, 11, 392. https://doi.org/10.3390/sym11030392
AMA Style
Cao Z, Qiao X, Jiang S, Zhang X. An Efficient Knowledge-Graph-Based Web Service Recommendation Algorithm. Symmetry. 2019; 11(3):392. https://doi.org/10.3390/sym11030392
Chicago/Turabian StyleCao, Zhiying, Xinghao Qiao, Shuo Jiang, and Xiuguo Zhang. 2019. "An Efficient Knowledge-Graph-Based Web Service Recommendation Algorithm" Symmetry 11, no. 3: 392. https://doi.org/10.3390/sym11030392
Note that from the first issue of 2016, this journal uses article numbers instead of page numbers. See further details here.