Critical Components Identification for Service-Oriented Systems


School of Information Science and Technology, Dalian Maritime University, Dalian 116026, China
*
Authors to whom correspondence should be addressed.
Symmetry 2019, 11(3), 427; https://doi.org/10.3390/sym11030427
Submission received: 14 February 2019
/
Revised: 16 March 2019
/
Accepted: 18 March 2019
/
Published: 22 March 2019
(This article belongs to the Special Issue Symmetry in Computing Theory and Application)
Abstract
:Identifying critical components are of great significance to the overall reliability of service-oriented systems (SOSs). As the size of the SOS increases, identifying critical components in the process of predicting the SOS reliability can reduce the number of components that need to be predicted and shorten the prediction time. Moreover, predicting the reliability of critical components can also ensure the stability of the SOS. Therefore, we transform the relationships among service components of the SOS into a service dependency graph. Then, an improved weighted LeaderRank algorithm (IW-LeaderRank) is proposed to measure the importance of components and obtain the sequence of critical components. Through experimental analysis, the method can accurately and efficiently identify critical components in SOSs.
1. Introduction
Service-oriented systems (SOSs) are defined as loosely coupled software applications based on service-oriented architecture (SOA) [1]. As service components in SOSs are usually provided by different organizations, their reliability is also affected by the fluctuation of the Internet. At the same time, a lot of resources need to be spent in the process of evaluating SOSs. Therefore, the reliability prediction of the SOS is a major challenge [2]. In order to meet more needs, the scale of the SOS is gradually expanding, and its complexity is also increasing. In recent years, massive methods have been proposed to improve the accuracy of prediction, but ignored the problem of longer evaluation time. Identifying critical components before predicting the reliability of the SOS can reduce computational complexity and evaluation time. Therefore, identifying the critical components is necessary for maintaining the stability of the SOS. Although the problem of identifying the critical components of SOSs has been widely concerned, most of the existing methods [3] have not combined the two aspects of the characteristics of the service and the relationships between the services. In order to pursue better sorting results, this paper proposes an efficient method to identify the critical components of SOSs. The improved weighted LeaderRank algorithm (IW-LeaderRank) is used to identify the critical components of SOSs, which takes service propagation capability, service reliability, influence ability and service heat into account. It is helpful to identify the most critical components accurately. Through experiments, the advantages of the IW-LeaderRank are verified by comparing them with the existing excellent algorithms.
The rest of this paper is organized as follows. Section 2 presents the related work of critical components identification. Section 3 provides the process of constructing service dependency graph of SOSs. Section 4 introduces a new method of identifying critical components in SOSs, and explains the calculation steps of this method. Section 5 describes the experimental process, and discusses our results by comparing the results with those of established algorithms. Finally, Section 6 draws the conclusions of this paper.
2. Related Work
In order to identify the critical components in SOSs, the existing methods are generally studied from two aspects: The importance measurement of system components and the analysis of software system architecture.
There are many methods to measure the importance of components. Zheng et al. [4] produced a ranking of services by taking advantage of the users past experiences and preferences between the pairs of services. In order to reduce errors, Zhen et al. [5] applied the correlation between Quality of Service (QoS) attributes to predict the QoS value of services to measure the services importance. In reference [6], in order to improve the fault-tolerant ability of multi-tenant service-based systems (SBSs), Wang et al. proposed a component importance measurement method based on quality analysis of service components, multiple tenants’ preferences for multi-dimensional system quality, and the service sharing across the tenants in the SBS. Although these methods can measure the importance of components, they are unable to detect and exclude malicious QoS values.
Zheng et al. [7] thought the significance value of a component was determined by some factors that invoke this component, such as the significance values of these components, how often the current component is invoked by other components and the component characteristics. Then, two component importance ranking methods were proposed. However, these methods do not consider the characteristics of components, such as throughput, response time and so on, when calculating link weights. The above measurement methods of component importance have their own limitations separately.
On the other hand, most of the traditional software key class recognition methods are based on the network model. The purpose is to find out some special nodes which have more influence than other nodes on the structure and function of the network [8].
Ding et al. [9] built software network models, identified important classes in software systems by the h-index method. Wang et al. [10] believed that the importance of components should be assessed not only in terms of their complexity, but also in terms of their influence. Both of them were affected and contacted mutually. So the software class importance metrics Class-HITS algorithm was proposed and a good sorting result was obtained.
In addition, the critical components can be found efficiently and accurately by analyzing the dependencies among software classes. Mala and others [11] believed that the importance of software classes can be ranked accurately through external metrics and internal metrics. The external metrics were the dependency metrics which showed the dependency of each component with other components and the internal metrics were comprised of the complexity level of each component itself. Şora et al. [12] used fuzzy rules containing inputs class attributes to produce the best results, such as size, weighted incoming dependencies, weighted outgoing dependencies and PageRank value.
There are many critical components identification methods proposed in software systems. However, they are all measured unilaterally. Some literatures use centrality indexes to measure the importance of the components location in networks and graphs. The others consider that the measurement indexes only depend on the dependencies between the components. Most of the methods do not combine the two parts together for more reasonable research.
3. Service Dependency Graph of SOS (SDGS)
3.1. Service Dependency Relationships of SOS
The service dependency relationships are based on the input/output parameters between the services. In the SOS, the dependency relationships between the services can be differentiated according to the interaction between the services’ attributes [13]. Therefore, service dependency relationships are divided into three categories:
Definition 1.
(Complete dependency relationship). For two service i () and service j (), if the attribute values of is determined and the attribute values of is determined accordingly, this is . Service is said to be completely dependent on service .
Definition 2.
(Partial dependency relationship). For service and , if . Then, service is partially dependent on service .
Definition 3.
(Interdependence relationship). For service and , if and . Then, service and service are interdependent.
Although these three relationships all have service dependence, they have different service dependence intensity. In order to express it clearly, we can use the following definition to describe the intensity of service dependency relationships.
Definition 4.
(Service dependence intensity). It represents the intensity of the service dependency relationships between service and service , its value is determined by the ratio of interactive attributes (formula (1)).
is the number of attributes provided by to , and is the total number of attributes.
3.2. Traditional Service Dependency Graph
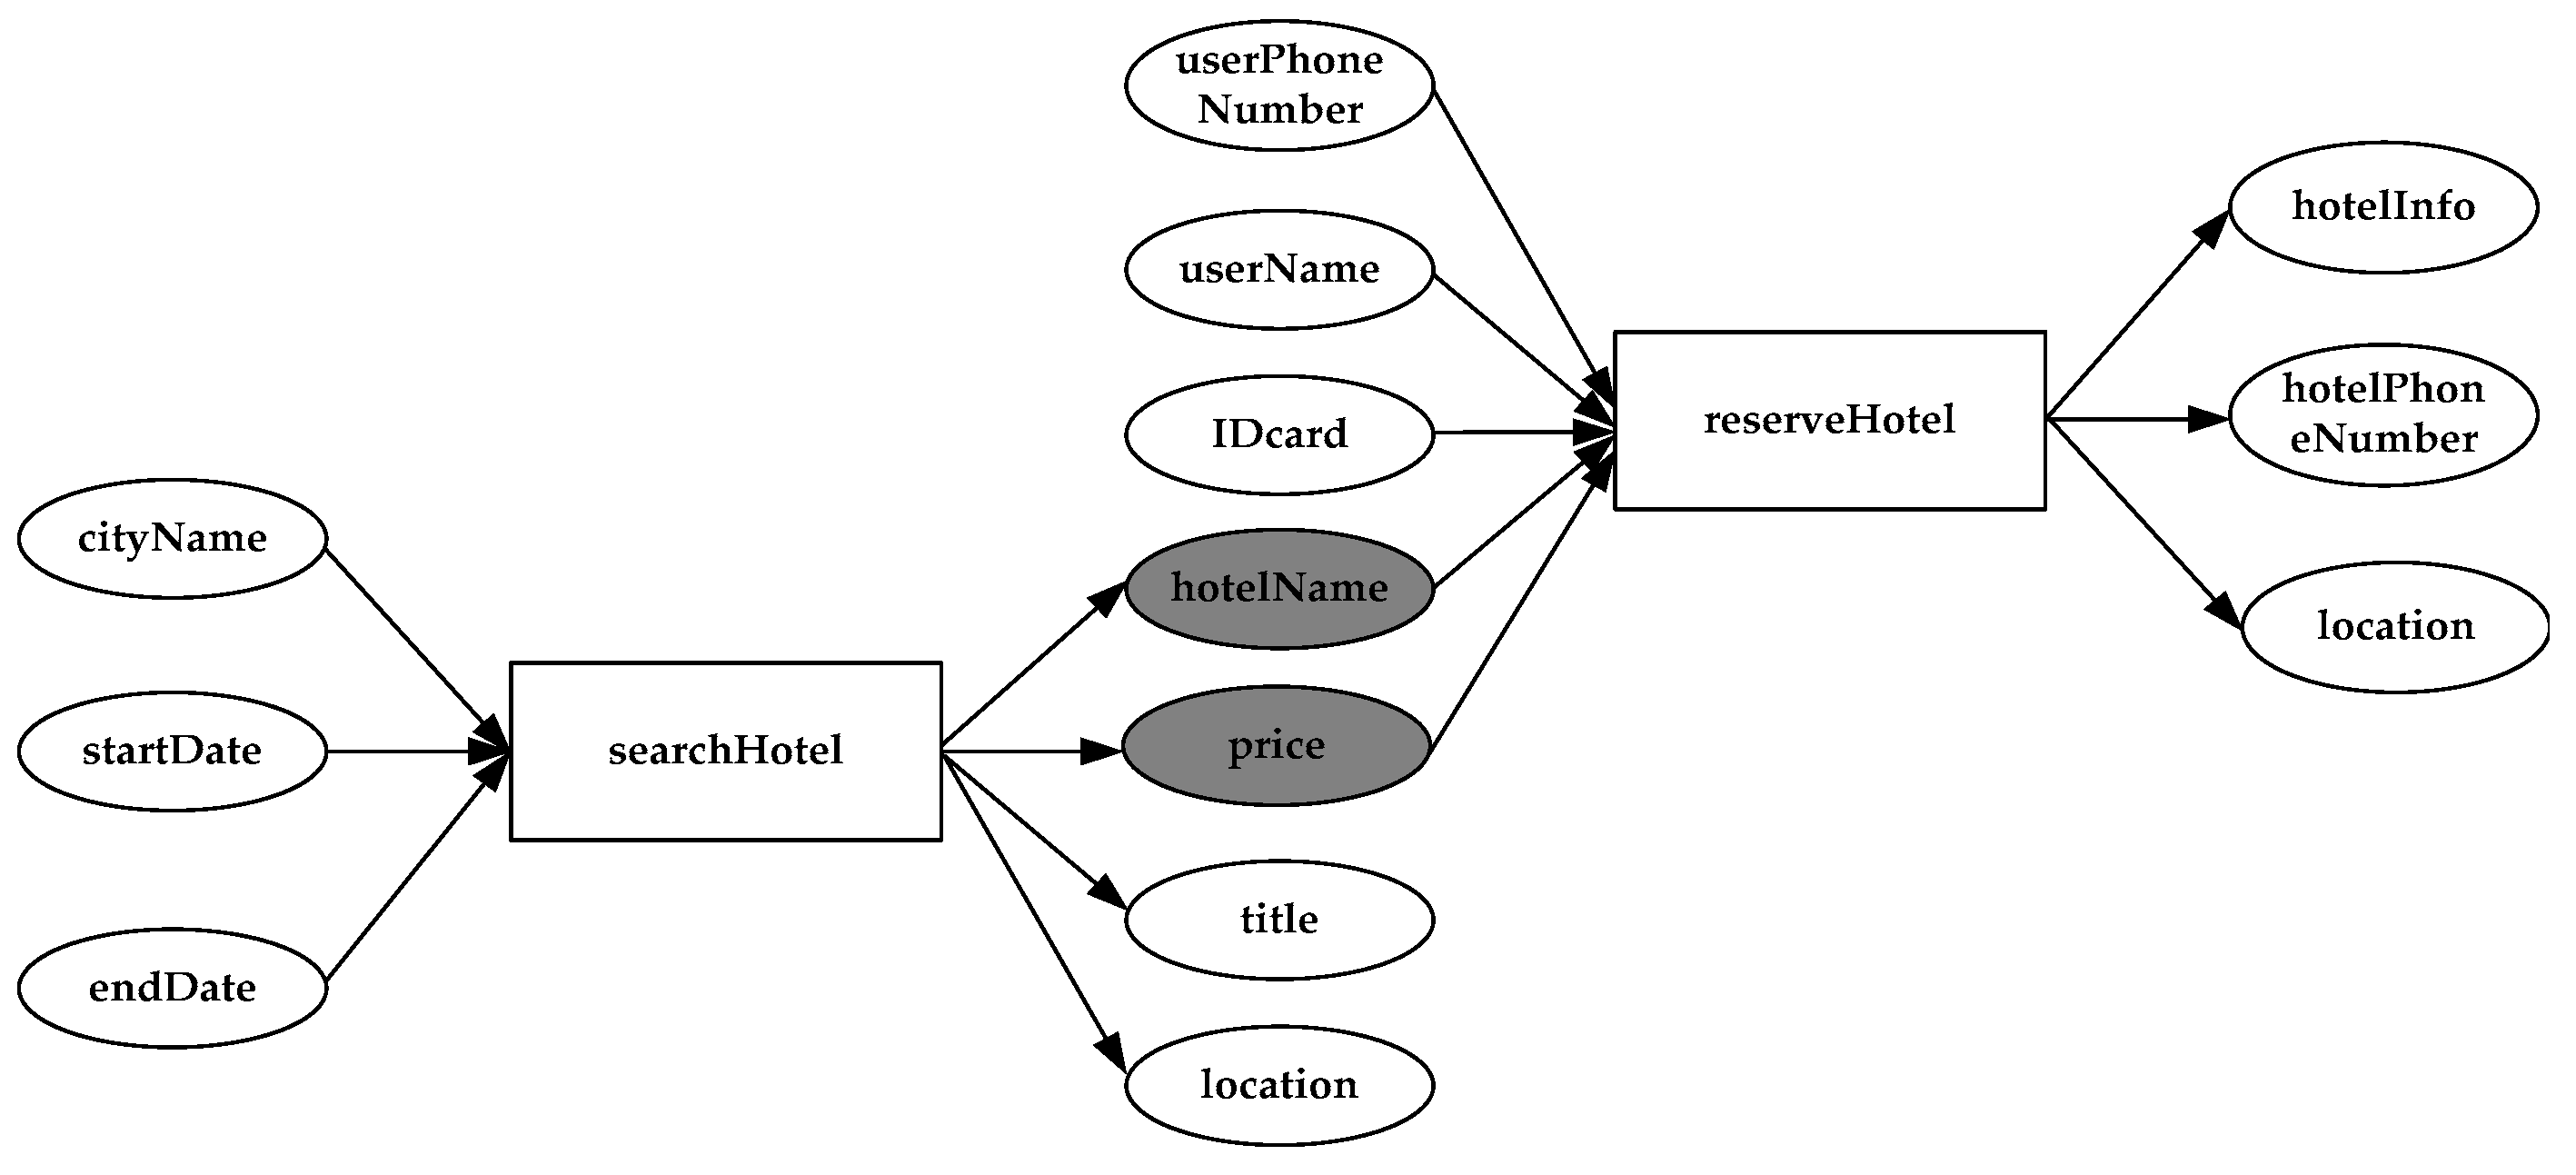
The traditional service dependency graph is composed of attribute nodes (input/output) and operation nodes (service), which is used to describe all possible input/output dependency relationships between the services [14].
Figure 1 shows the dependence between service ‘searchHotel’ and service ‘reserveHotel’. The rectangle in the figure represents the service, and the circle represents the input and output objects of the service. ‘cityName’, ‘startDate’ and ‘endDate’ are the input of service ‘searchHotel’; ‘hotelName’, ‘price’, ‘title’, ‘location’ are the output of service ‘searchHotel’; ‘userPhoneNumber’, ‘userName’, ‘IDcard’, ‘hotelName’, and ‘price’ are the input of service ‘reserveHotel’; ‘hotelInfo’, ‘hotelPhoneNumber’, ‘location’ are the output of service ‘reserveHotel’. So, ‘price’ and ‘hotelName’ are both the output of service ‘searchHotel’ and the input of service ‘reserveHotel’. This is a service dependency relationship between service ‘searchHotel’ and service ‘reserveHotel’ with input/output relationship.
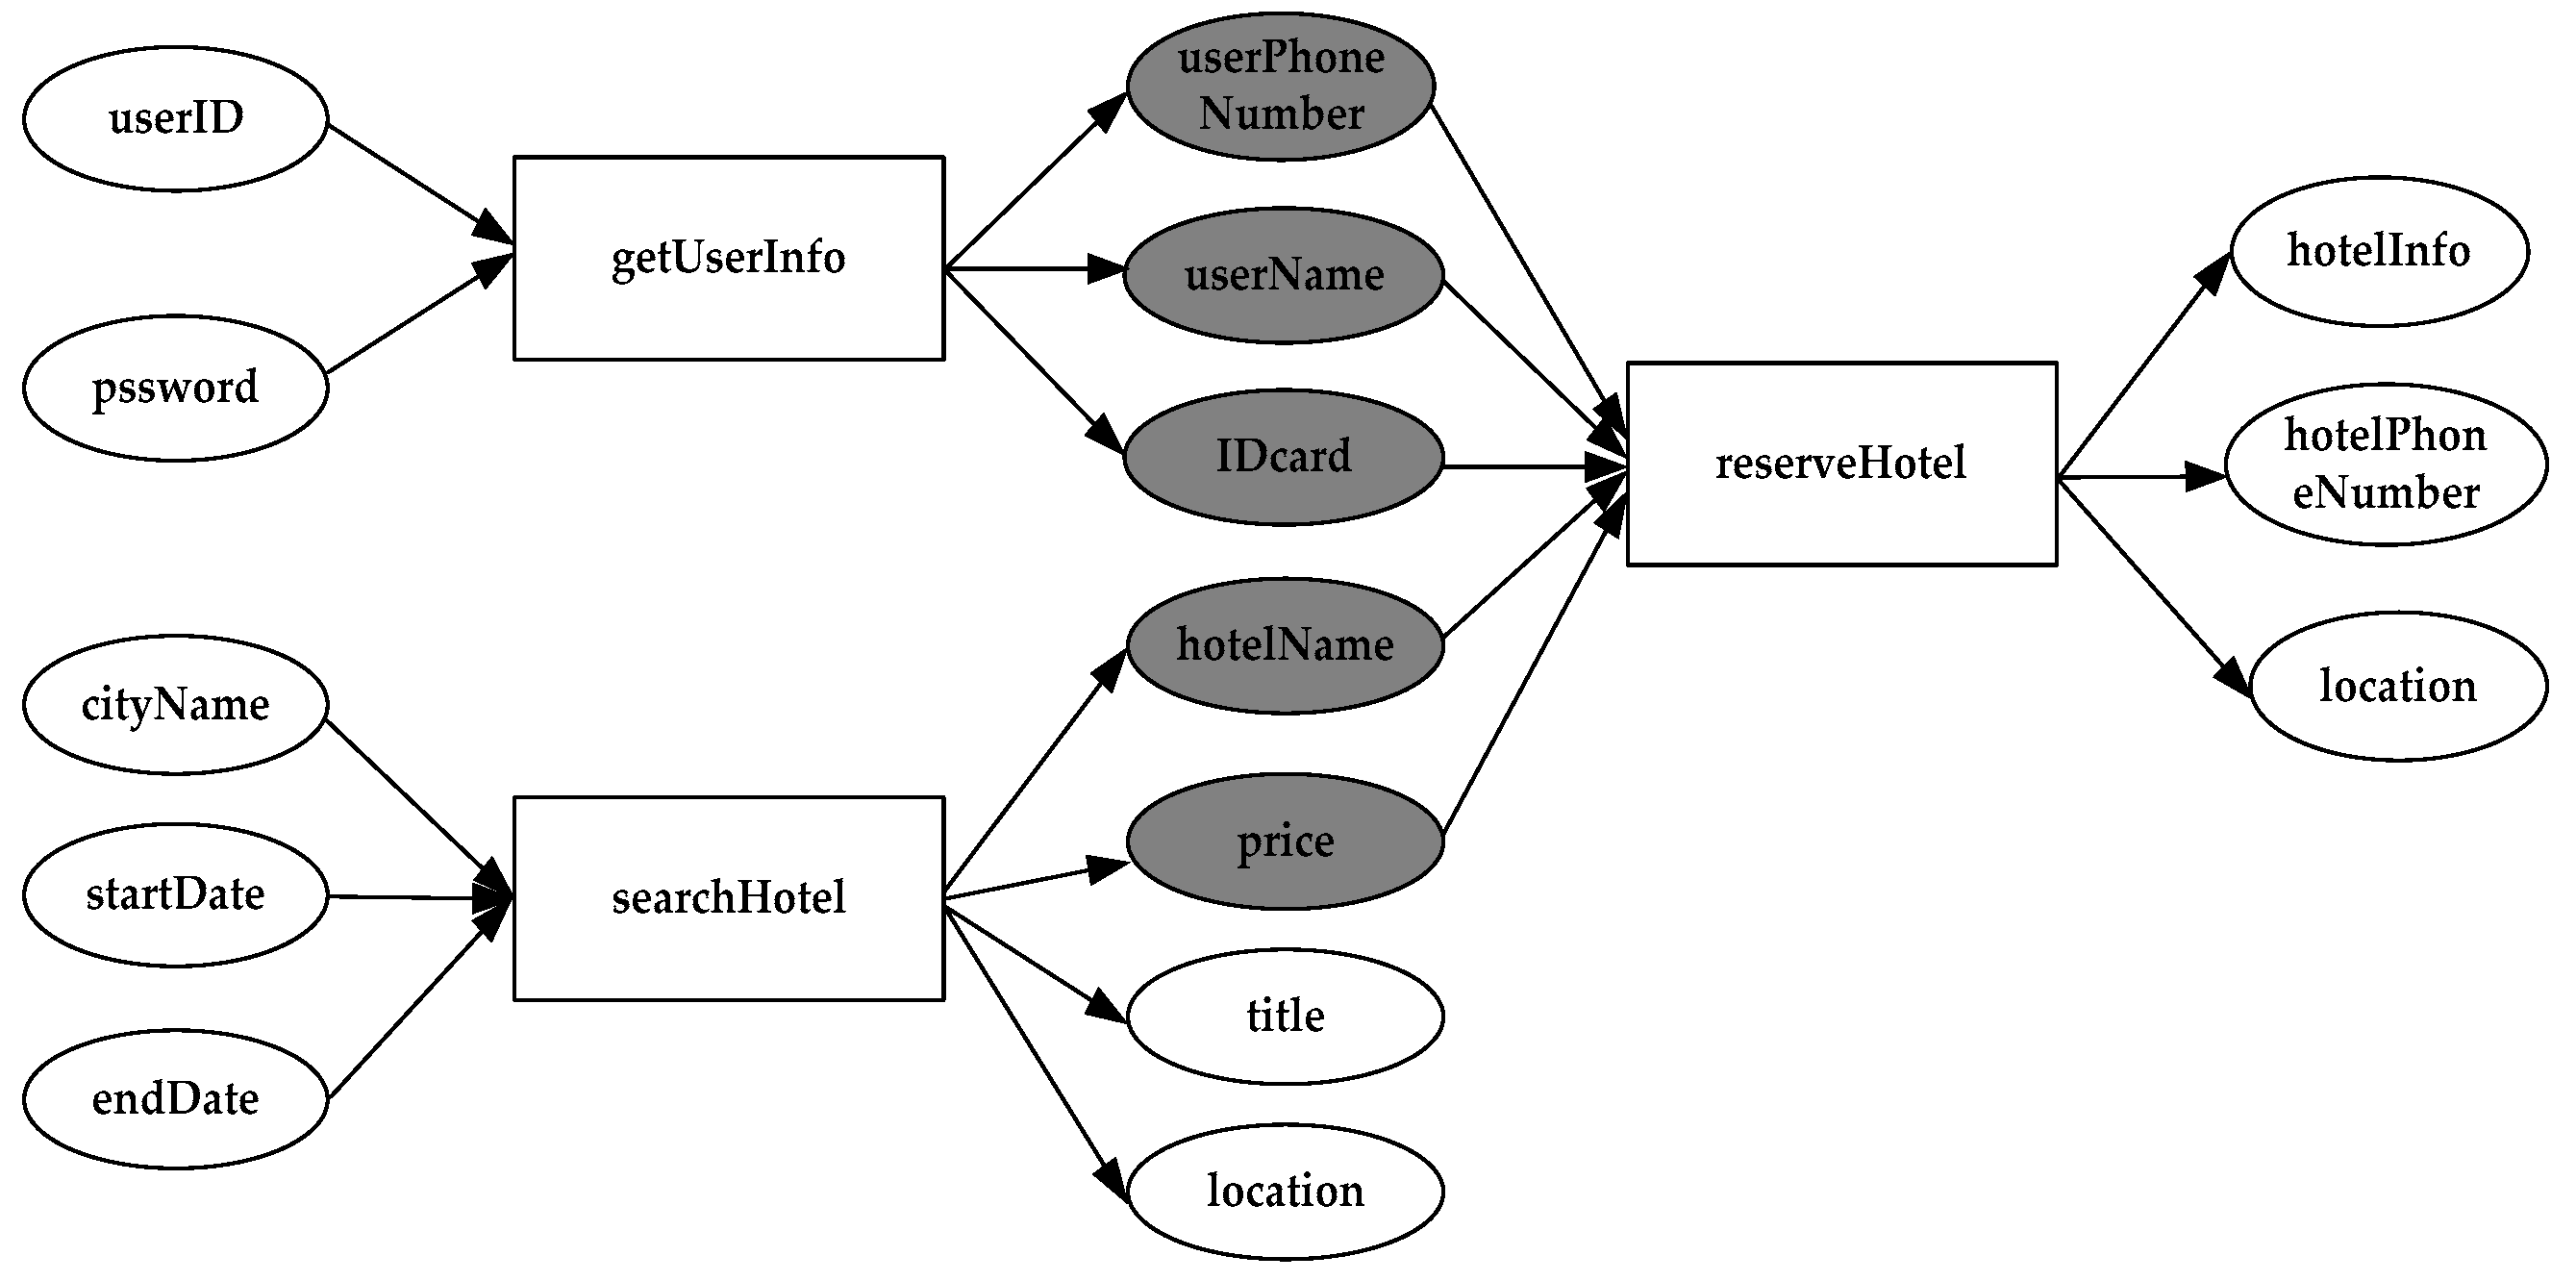
The service dependency graph can not only describe the interaction between the services, but can also play an important role in improving the accuracy of service composition [15,16], ensuring service reliability [17] and so on. Therefore, the traditional service dependency graph can represent the three kinds of service dependency relationships, but it can not express the service dependency intensity. For example, in Figure 2, the hotel reservation requires customer and hotel information. Therefore, service is partially dependent on service . But according to formula (1), the intensity of ‘reserveHotel’ dependence on ‘searchHotel’ is 2/5, and dependence on ‘getUserInfo’ is 3/5 (, ). The dependence between ‘getUserInfo’ and ‘reserveHotel’ is stronger than that between ‘searchHotel’ and ‘reserveHotel’. So in order to describe the interaction between the services in the SOS more accurately, the traditional service dependency graph needs to be improved to include service dependency intensity.
3.3. Improved Traditional Service Dependency Graph
The traditional service dependency graph can not express the service dependency intensity, so it is transformed into a weighted SDGS. According to the SDGS, the critical components of the SOS can be identified effectively. Therefore, the process of establishing this model is a crucial link. The SDGS has become the basis of identifying critical service components and predicting service reliability. In SDGS, components are regarded as nodes, dependency relationships are regarded as edges, and the weight on edges represents the service dependence intensity, which makes the structural characteristics of real systems comprehensively. The SDGS can be described by the following definition.
Definition 5.
(SDGS). SDGS = (V, E, W), where refers to the set of service components of SOS, refers to the set of dependency relationships among service components, which can be divided into three categories: Complete dependency relationship, partial dependency relationship and interdependence relationship. is the corresponding weight set of edge set , indicating the intensity of service dependency relationships.
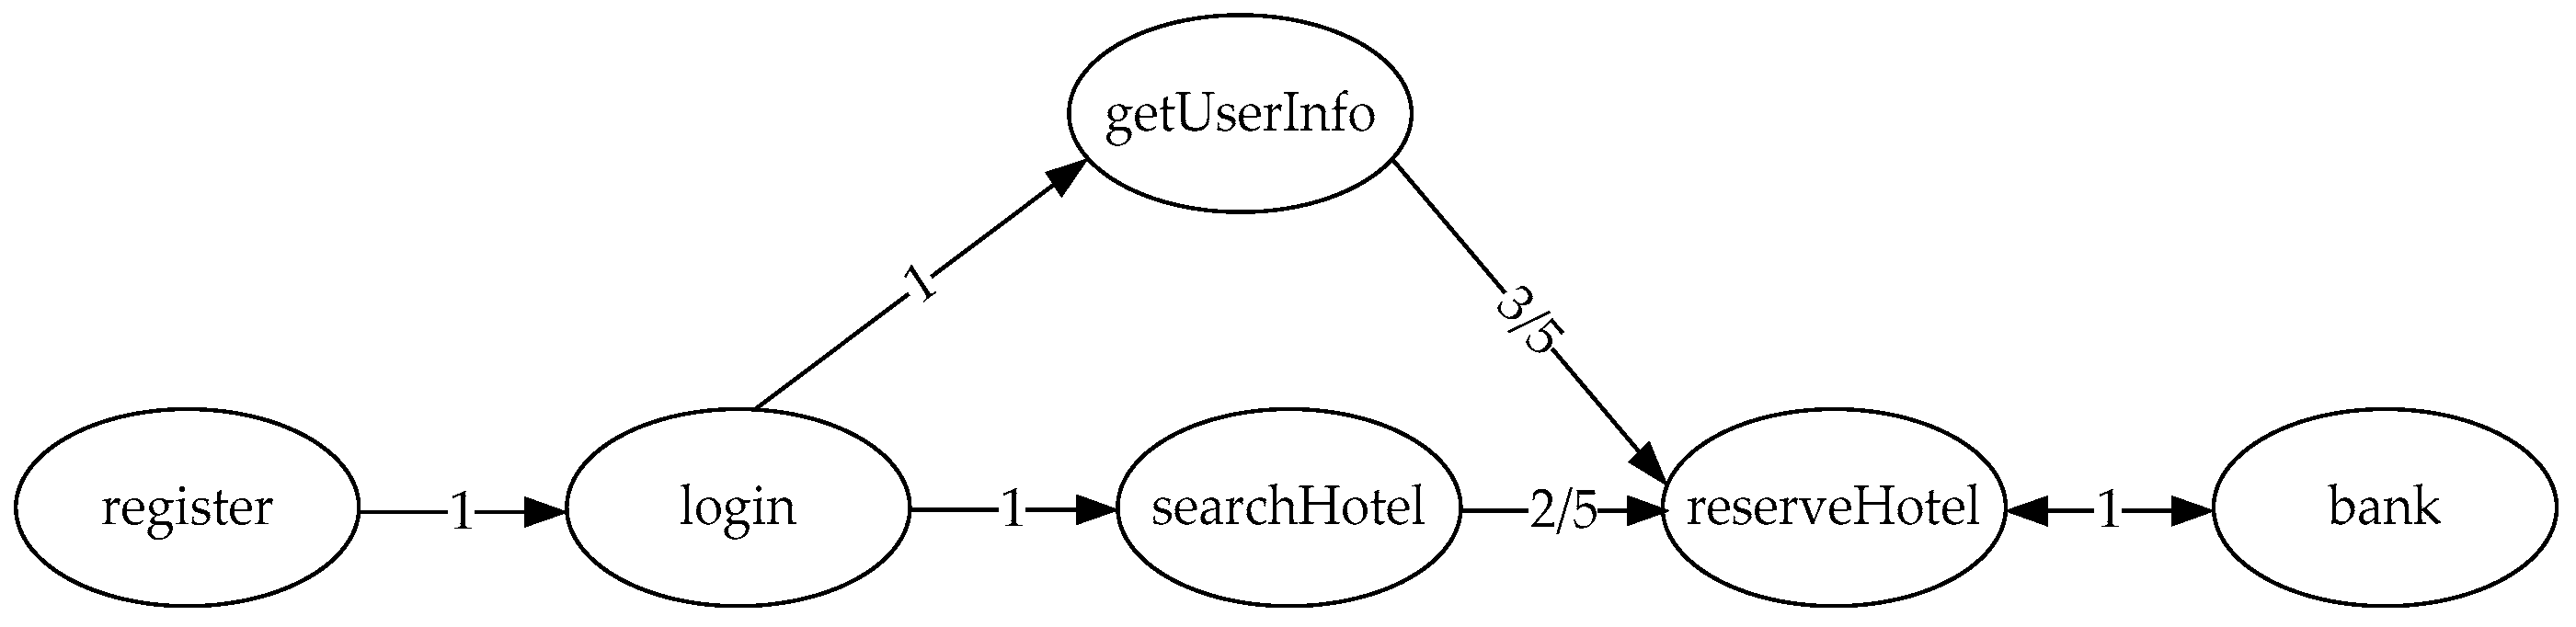
For example, in Figure 3, users enter the system to register and login, and the system executes service ‘register’ and service ‘login’. Users search hotels according to their needs and implement service ‘searchHotel’. Users find suitable hotels to make reservation, and the system implements service ‘getUserInfo’ and service ‘reserveHotel’. During the booking process, the system calls the service ‘bank’ to make payment, and the payment result is returned to service ‘reserveHotel’. As service ‘register’ and service ‘login’, service ‘login’ and service ‘getUserInfo’, service ‘login’ and service ‘searchHotel’ are completely dependency relationships, and service ‘reserveHotel’ and service ‘bank’ is interdependence relationship, the weight of all edges is 1. Meanwhile, service ‘getUserInfo’ and service ‘reserveHotel’, service ‘searchHotel’ and service ‘reserveHotel’ are partially dependency relationships, the weight of edge (getUserInfo, reserveHotel) is 3/5 according to formula (1), and the weight of edge (searchHotel, hotelRearch) is 2/5. Therefore, according to this graph, we can not only see the dependency relationships among service components, but also understand the dependency intensity of each relationship.
4. Critical Services Identification Method
The purpose of the identification method is to identify critical service components in the SOS according to the SDGS. The critical components of the SOS generally refer to components that are important to maintain the structure and functionality of the entire system. The reliability of critical service components represents the reliability of the SOS, and reducing the reliability of critical service components has a great impact on the whole system. Based on the SDGS, this paper uses the IW-LeaderRank to identify the critical components of the SOS. This section first introduces the LeaderRank algorithm, and then gives the indicators and calculation flow for IW-LeaderRank.
4.1. Introduction to LeaderRank Algorithm
The idea of the LeaderRank algorithm [18] is to add a common node (ground node) to the known directed network , and add a reverse connection to the unidirectional connection to obtain a directional with nodes: Network . Since the public node has a two-way connection with other nodes in the network, G constitutes a strong connected graph, which can avoid isolated nodes in the complex network and ensure the convergence of the algorithm. The LeaderRank algorithm steps are as follows:
(1) The initial value of the ground node is , and the initial values of other remaining nodes are .
(2) represents the number of iterations, and is the LeaderRank value of the node which iterates times. is the number of nodes in the network after removing the ground node. When node and node have edges, the value is 1, otherwise the value is 0. indicates the out-degree of node .
(3) Repeat step two. When the number of iterations is constant, the value will converge to a fixed value. Remove the ground node, and distribute the ground node value to other nodes evenly. Finally, the value of node i is as follows.
The results of the LeaderRank algorithm can be converged to a stable value, especially for large complex directional networks.After the LeaderRank algorithm sorts all the nodes in the network, the results show that the LeaderRank algorithm rank is better than the PageRank algorithm. And the robustness of the LeaderRank algorithm makes more tolerant noise data [19].
In order to improve the accuracy, many papers have proposed the improved LearderRank algorithm. Qiao Li et al. [20] believe that nodes with greater in-degree get more values from the ground node. Therefore, the weight of the edge between nodes and the ground node is related to the in-degree of the node itself. In fact, the weighted LeaderRank algorithm can’t solve all the problems. Therefore, many solutions have been proposed in recent years, such as combining node propagation ability [21,22], considering the strength of association between the nodes [23].
In summary, the LeaderRank algorithm and the weighted LeaderRank algorithm play an important role in node ordering. Although many documents are properly improved, these methods are still not comprehensive enough. For example, when combining the propagation ability, the characteristics of the node are not analyzed. And when considering the influence of multiple factors, the calculation time becomes longer, and the balance point of accuracy and efficiency is not reached.
4.2. IW-LeaderRank
Since the SDGS has been transformed into a weighted graph, the original LeaderRank algorithm has been improved to a weighted algorithm. Considering that service components in SOSs have different service heat (), service components with high heat need more attention. When observing the reliability of the SOS, we find that the reliability value of each service component has a different influence on the fluctuation of the system reliability value, then, we add the service reliability influence ability () in the process of iteration. In addition, many studies have shown that service components have different propagation [21,22], when calculating the LeaderRank value, we introduce the Betweenness centrality () to control the service propagation capability. Symbol explanations are shown in Table 1.
In the SDGS, the service points to the service , that is , which represents the service depending on service . Therefore, in order to calculate the dependency of components, the SDGS adjacency matrix should be transposed before identifying critical components. The service node can be regarded as a web page and the dependency between the services is regarded as a web page link. The formula of the IW-LeaderRank is as follows.
Formula (4) is the nodes iteration process, when node and node have edges, the value is 1, and otherwise the value is 0. Where and are the weight of the edges between the nodes, and the ground node is interdependent with other nodes, so the weight of the edge is 1. The iteration process of the ground node is simplified to formula (5). Formula (6) is the calculation of the final value of LeaderRank except the ground node.
4.2.1. Weighted LeaderRank Algorithm
When calculating a service LeaderRank value, since each edge connected with it has a weight, the LeaderRank value of the service cannot be equally distributed to its out-degree node. Actually, it should be distributed according to the weight. The larger the weight is, the larger the value of the service. The improved weighted iteration process can be seen from formula (7).
In the above iteration formula, service is the in-degree node of service , service is the out-degree node of service . When calculating the service LeaderRank value, the value of service gets the value from service by weight ratio each time.
4.2.2. Service Heat
In the SOS, each service component has its own functions. But there will be a big difference in their service heat. Usually, the service component with high heat is more important. For example, as bicycle-sharing is more popular nowadays, many tourism SOSs provide shared bicycle service. We assume that the usage frequency is higher in spring and summer, and the service hot is larger. Therefore, shared bicycle service is more important at this period. In order to improve the accuracy of sorting, we add the service heat factor to optimize the algorithm. Its calculation formula is as follows.
is the number of times service is used, that is, the number of times the service interface is called. is the number of components in the system. Statistical time intervals can be selected based on component usage and system component structure changes, ranging from approximately one week to several months.
4.2.3. Service Reliability Influence Ability
The impact of different service reliability fluctuations on the overall system is different, the more influential the service, the more important it is. When the reliability of a service decreases, the reliability of the whole system decreases, which indicates that the reliability fluctuation of a service will lead to a greater risk. Therefore, the reliability of the service should be predicted first. If the reliability is lower than the threshold, it should be replaced reasonably.
The historical reliability of components is divided into as time segments, the reliability variation of components in each segment is calculated, which is represented by . , stands for increased reliability and for decreased reliability. is the reliability of this service in phase . Referring to the previous literature [24,25,26], we found that the reliability of services can be calculated according to response time, throughput, and the failure data of Web services in the past. In this paper, formula (9) is used to calculate the reliability of service. Based on this formula, the corresponding time reliability variation of the SOS is calculated, which is expressed by , . By calculating the change of time segments, the historical reliability change of service components and the SOS form two curves: , . The influence of the reliability fluctuation of each component on the reliability change of the whole system is obtained by using the standard Euclidean distance formula. The smaller the value, the closer the two curves are to each other, the greater the impact of service components. The calculation formulas of and are as follows.
is the failure rate, . is the number of service errors in fragment , is the total number of times the service is invoked. is the length of fragment .
is the standard deviation. The degree of influence of the service reliability can be adjusted by , the appropriate ratio is selected according to the actual situation of the SOS.
4.2.4. Service Propagation Capability
In addition, the importance of the service component depends on the component’s position in the SDGS. The closer the service is to the center of the SDGS, the further the error propagates, the more important it is. According to the literature [21], it is found that the metric of the LeaderRank algorithm does not consider the node propagation ability. In order to solve the above problems of the algorithm, a factor-balancing algorithm is added. The performance of the reflects the position of a node in the graph. It means the number of times a particular node is the shortest path member between the other two nodes. The calculation formula is as follows.
where is the shortest path number of node and node , is the shortest path number of node and node passing node . The greater the Betweenness centrality value of service is, the greater its influence and the closer its relationships with other services.
The process of IW-LeaderRank is as follows.
| Algorithm 1: IW-LeaderRank |
| Input: SDGS Adjacent Transfer Matrix, Number of Service Calls, Service Thermal Coefficient |
| Output: Components LeaderRank Value Sequence |
| 1. Calculate the service heat of each component in the SOS according to formula (8) |
| 2. Calculate the service reliability influence ability of each component in the SOS according to formula (10) |
| 3. |
| 4. while () do |
| 5. |
| 6. |
| 7. |
| 8. END |
| 9. Calculate the service propagation capability of each component in the SOS according to formula (11) |
| 10. |
| 11. return |
The IW-LeaderRank can get the ranking of service components in the SOS, the more advanced the service, the more important it is. In order to get the candidate critical components, filter the service component ranking list and select the top-k component as the candidate critical components.
5. Evaluation
This paper takes the tourism SOS as the experimental object. The tourism SOS is designed and implemented in our laboratory. It mainly includes map navigation, hotel reservation, scenic spot introduction, ticket purchase and other functions. Its system service components are mainly obtained from service websites, like programmable web (https://www.pro-grammableweb.com). The SDGS consists of 58 nodes and 136 edges.
5.1. Comparison of Centrality Index
In statistics, the Kendall Rank correlation coefficient is a statistical value used to measure the correlation between the two random variables, often expressed in the Greek letter . The Kendall correlation coefficient can be used to measure the similarity of critical component sequences of different SOSs. So, the correlation between the IW-LeaderRank and other Centrality Indexes can be compared. The value range of is between −1 and 1. When is 1, it means that the two sequences of critical component have consistent rank correlation; when is −1, it means that the two sequences have completely opposite rank correlation; when is 0, it means that the two sequences are independent of each other. The Kendall Rank correlation coefficient is generally calculated in three ways. Because the measurement results of service components may be the same, this experiment adopts the formula , that can exist the same value. The result of which is shown in Table 2.
The second column of Table 2 is the result of the comparison between the IW-LeaderRank and Degree centrality, Closeness centrality, Betweenness centrality and PageRank centrality. Since the three indexes except PageRank centrality are undirected graphs, the direction of edges can be neglected in calculation. Through the significance test, it is found that the IW-LeaderRank is strongly positively correlated with the four measurement methods at a significant level of 0.05, which shows that the algorithm is feasible. The results of ranking similarity show that the IW-LeaderRank is close to Betweenness centrality and PageRank centrality.
5.2. Comparison of Effectiveness
The IW-LeaderRank in this paper is compared with the following excellent algorithms: FTCloude1 [7], G-NWD [9], FLC-4 input [12], weighted LeaderRank (W-LeaderRank) [20].
5.2.1. Recall Rate
In order to compare the differences in the importance of identification between this method and other methods, the recall rate is used as the evaluation criteria. Its calculation formula is as follows.
In formula (12), is the critical component set identified by the evaluation method and is the critical component set known in the SOS. The recall rate is the ratio of the number of identified correct critical components to the number of all known critical components in the SOS.
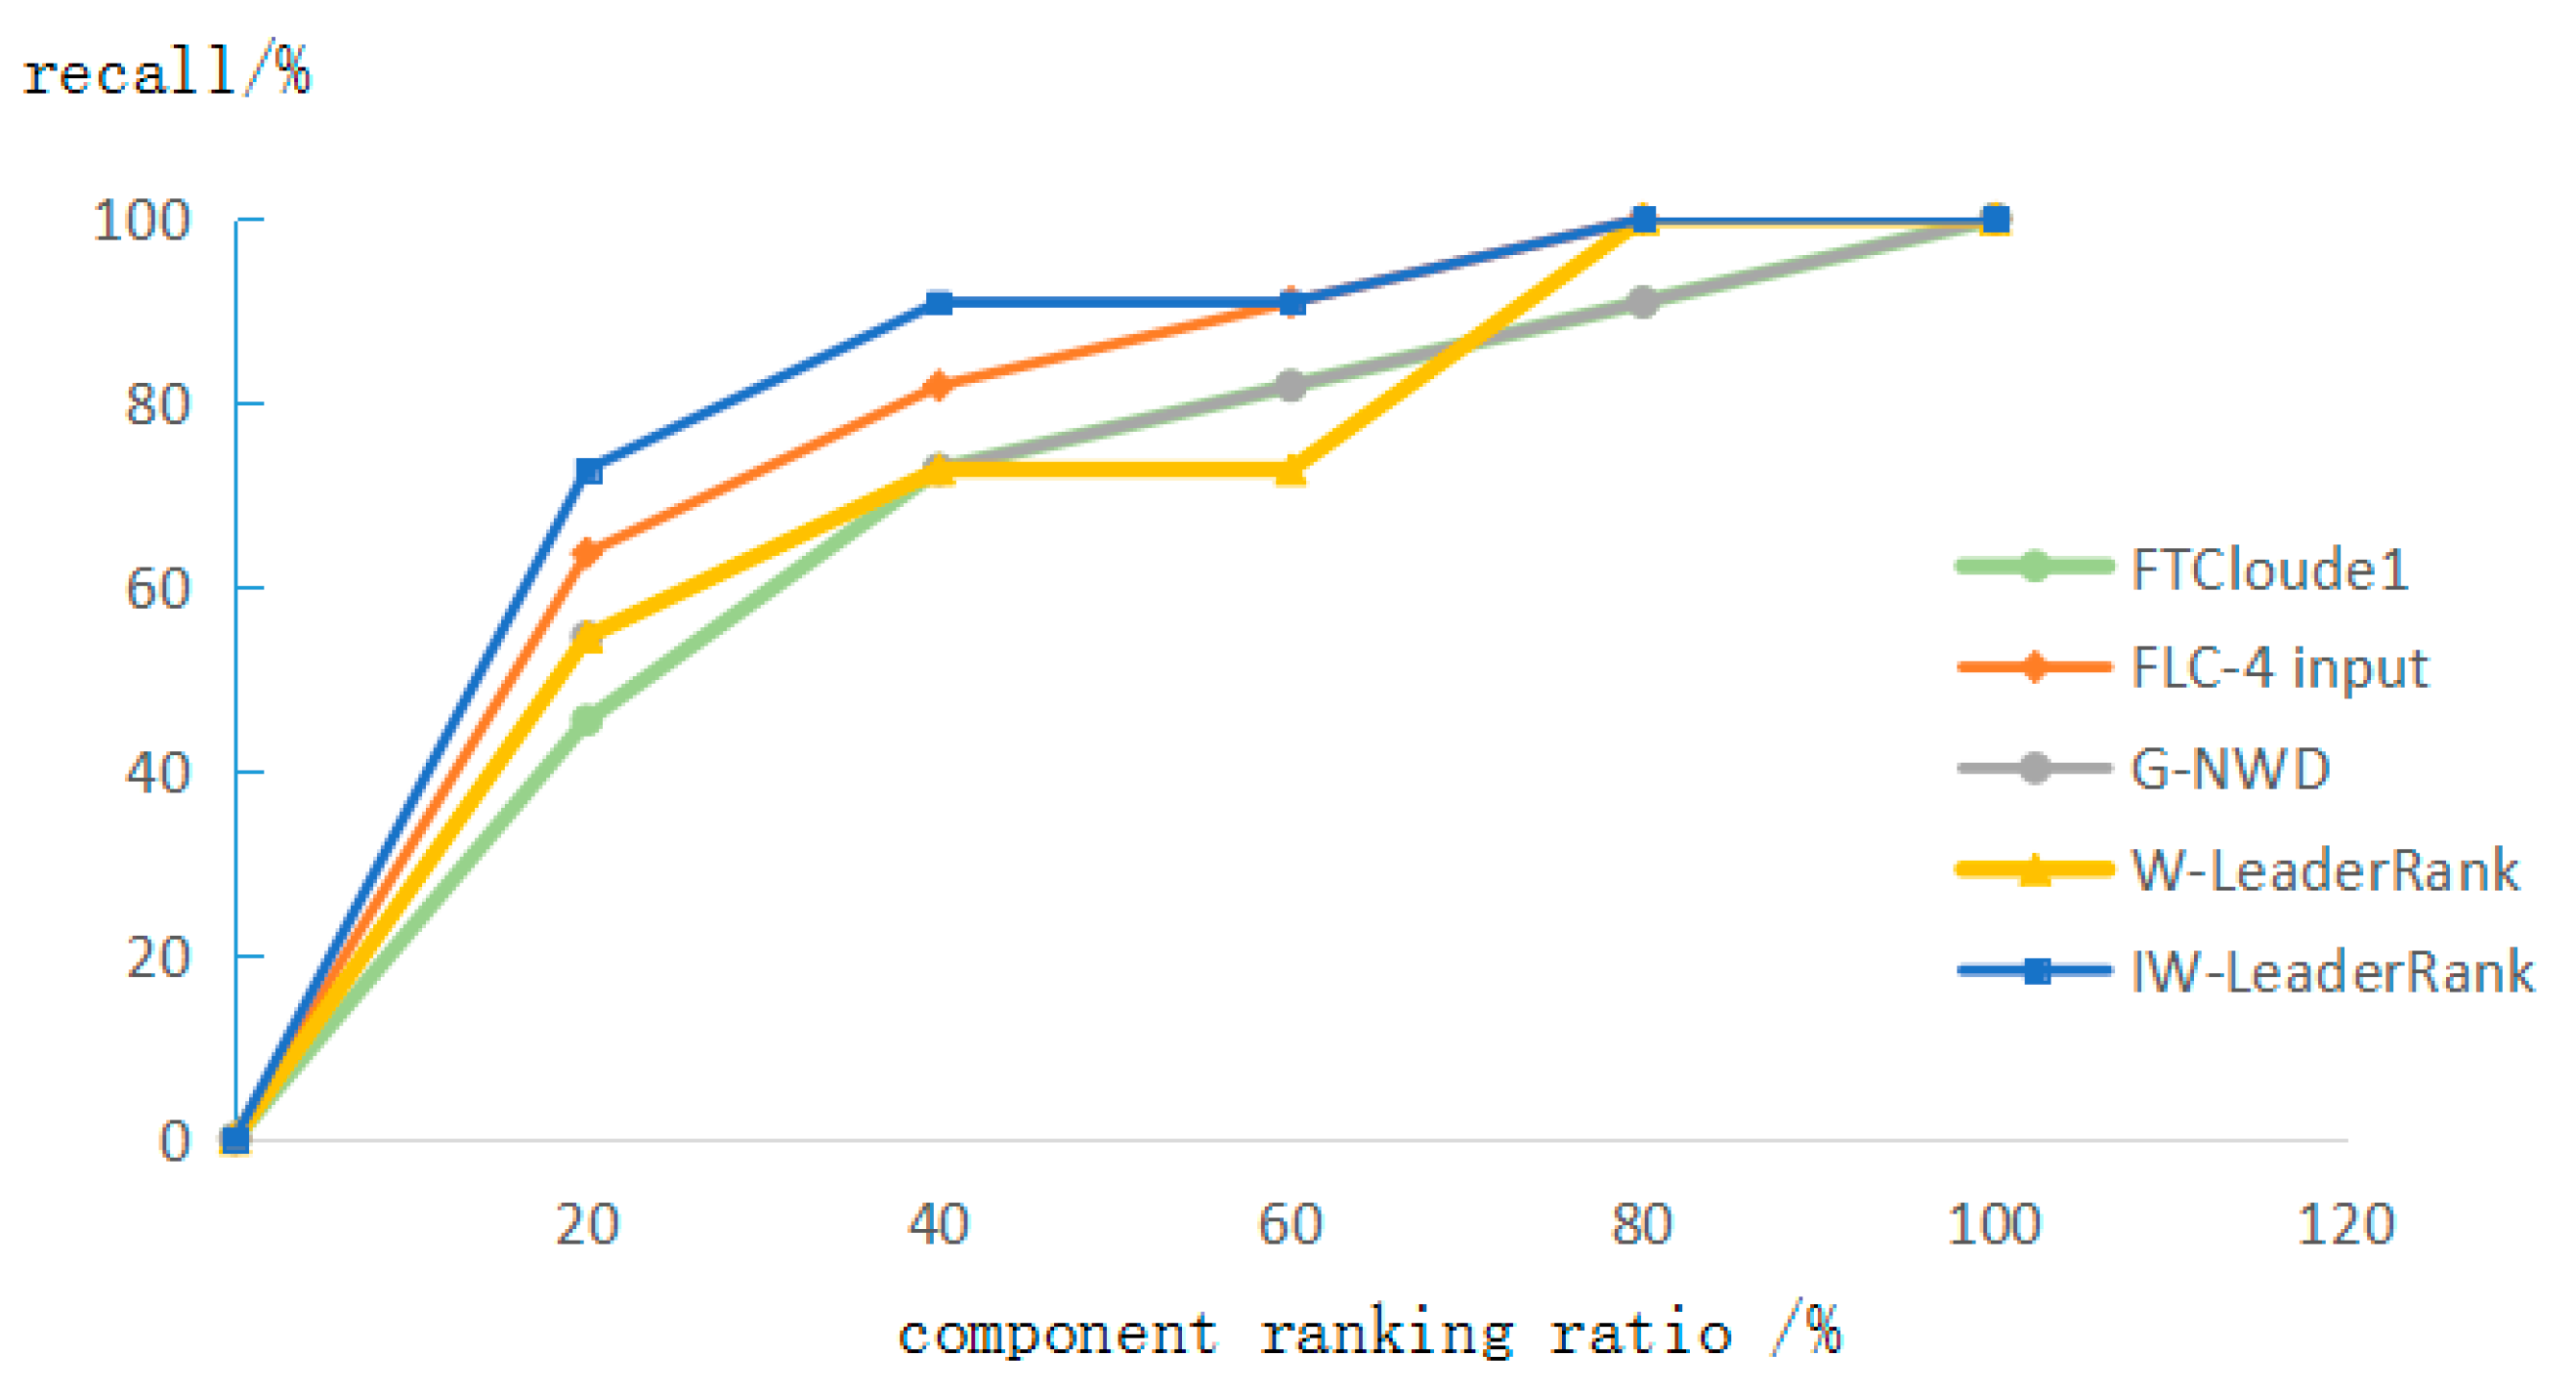
Figure 4 shows the changes in recall rates of various methods for identifying critical service components in the tourism SOS. FTCloude1 and W-LeaderRank are ineffective in identifying critical components. The reason is that these methods only focus on dependency relationships among components and do not further analyze the differences of relationships, so they can not better distinguish the importance of components in ranking. The recall rate of the FLC-4 input method is higher than the G-NWD. Overall, these two methods have better recognition effect. The results of the IW-LeaderRank method in the first half are slightly a better than those of other algorithms. However, there is no significant difference in recall rates between 60% and 100% component sequences.
5.2.2. Precision Rate
Precision rate is the ratio of the number of identified correct critical components to the number of required critical components. As can be seen from formula (13), the two evaluation criteria are only different in denominator.
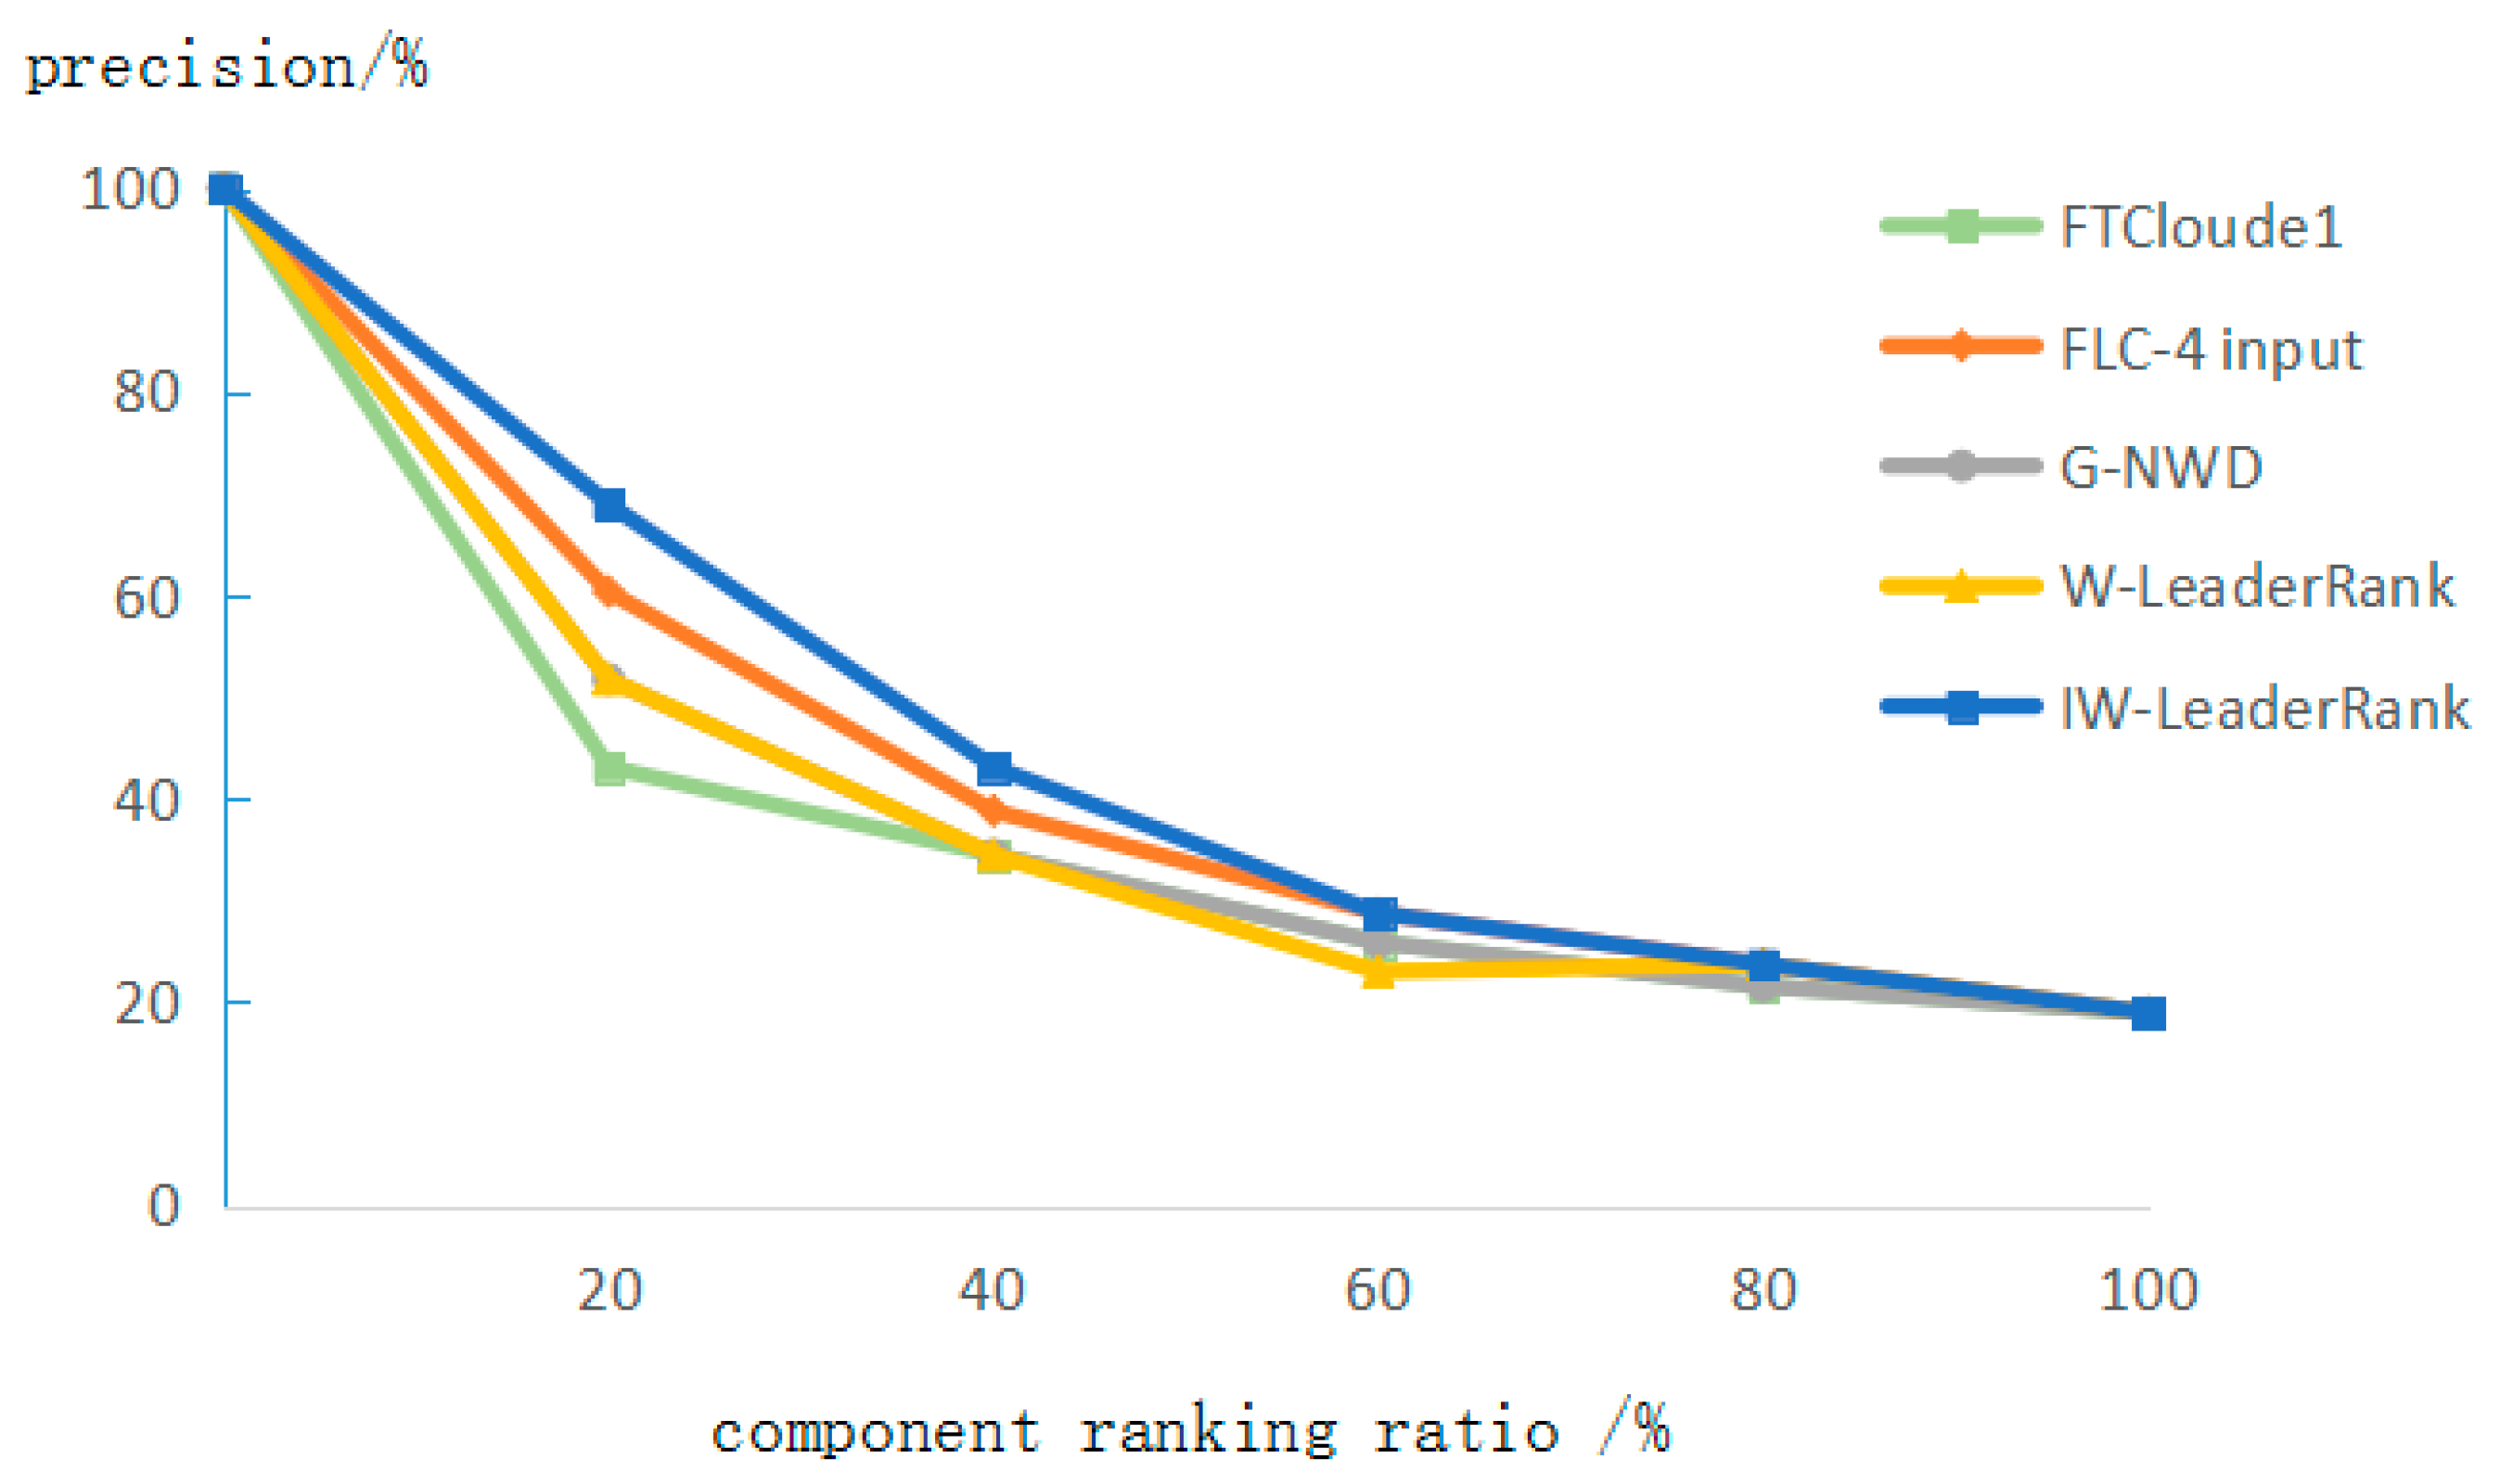
The comparison of precision rate about five methods for identifying the critical components of the tourism SOS is shown in Figure 5. We can clearly see that the FTCloude1 and W-LeaderRank have low precision, which is closely related to the inadequacy of the two algorithms. However, the precision of the first 20% sequence of the W-LeaderRank algorithm is significantly higher than that of FTCloude1 method, which is close to that of the G-NWD algorithm. But overall, the precision of the G-NWD algorithm in identifying critical components is higher than that of the first method. The FLC-4 input and IW-LeaderRank have the best precision and are superior to other algorithms.
5.2.3. Results Analysis
According to Figure 4 and Figure 5, we can see that our new method has certain advantages. With the increase of component ranking ratio, the recall rate increases and the precision rate decreases. Therefore, we need to select the appropriate Top-k component as the critical components of the system. Through experiments of literature [27], it is found that for all systems, the most important classes always rank in the top 10, almost independent of tools. Similarly, the most important service components are at the top. Therefore, we need to identify more critical service components in order to ensure the reliability of the system.
In the following table, comparing the recall rate and precision rate of each method by top 20%—top 60%, we found that the top 40% component is a better choice; it is suitable to be the critical component of the tourism SOS. According to Table 3, we can see that the recall rate of each method has a great improvement between top 20% and top 40%. In addition to the W-LeaderRank method, other methods have a certain increase at each stage. Although the recall rate between top 40% and top 60% is increasing, the increase is not significant and tends to be stable. At the same time, we find from Table 4 that the precision of top 20%–top 40% is gradually decreasing, because the number of components is greatly increasing with the increase of top proportion. So the precision is gradually decreasing. The precision of top 40%–top 60% is also declining gradually, but the decline is not significant. Table 3 and Table 4 show that top 40% is the ideal proportion. The recall rate and precision rate results of top 40% are good, so, we can use the IW-LeaderRank method to measure the results of top 40% as the critical component of the tourism SOS.
6. Conclusions
In this paper, the service propagation capability, the service reliability influence ability and the service heat are integrated into the LeaderRank algorithm, an IW-LeaderRank algorithm is proposed to identify the critical components of SOSs. This paper contributes to the following:
Because of the different dependency intensities among services, an SDGS is constructed to represent the interaction between the components by adding weights to dependency relationships. Using this graph can better measure components importance.
The IW-LeaderRank algorithm is proposed to identify the critical components of SOSs. Through this method, the critical components sequence can be obtained effectively, the prediction time can be reduced and the system reliability can be guaranteed.
The experimental data in this paper is limited. In the future, different scales of the SOS will be used to validate the effectiveness of this method; we will verify the value of the IW-LeaderRank in more practical environments.
Author Contributions
Writing—original draft: X.Z., S.J., X.Q., Z.C., and L.Z.
Funding
This work is supported by the National Natural Science Foundation of China (Grant No. 51679025, 51479021), the Fundamental Liaoning Provincial Natural Science Foundation of China (Grant No.20170520196) and the Fundamental Research Funds for the Central Universities (Grant No.3132019205).
Conflicts of Interest
The authors declare no conflict of interest.
References
- Wang, H.; Yang, Z.; Yu, Q. Online Reliability Prediction via Long Short Term Memory for Service-Oriented Systems. In Proceedings of the 2017 IEEE International Conference on Web Services (ICWS), Honolulu, HI, USA, 25–30 June 2017. [Google Scholar]
- Xu, Y.; Yin, J.; Wu, Z.; He, D.; Tan, Y. Reliability prediction for service oriented system via matrix factorization in a collaborative way. In Proceedings of the IEEE 7th International Conference on Service-Oriented Computing and Applications, Matsue, Japan, 17–19 November 2014. [Google Scholar]
- Wang, J.; Ai, J.; Yang, Y.; Su, W. Identifying key classes of object-oriented software based on software complex network. In Proceedings of the 2nd International Conference on System Reliability and Safety (ICSRS), Milan, Italy, 20–22 December 2017; pp. 444–449. [Google Scholar]
- Zheng, Z.; Wu, X.; Zhang, Y.; Lyu, M.R.; Wang, J. QoS ranking prediction for cloud services. IEEE Trans. Parallel Distrib. Syst. 2013, 24, 1213–1222. [Google Scholar] [CrossRef]
- Ye, Z.; Bouguettaya, A.; Zhou, X. QoS-aware cloud service composition using time series. In Proceedings of the International Conference on Service-Oriented Computing, Berlin, Germany, 2–5 December 2013; Springer: Berlin/Heidelberg, Germsny, 2013; pp. 9–22. [Google Scholar]
- Wang, Y.; He, Q.; Ye, D.; Yang, Y. Formulating criticality-based cost-effective monitoring strategies for multi-tenant service-based systems. In Proceedings of the 2017 IEEE International Conference on Web Services (ICWS), Honolulu, HI, USA, 25–30 June 2017; pp. 325–332. [Google Scholar]
- Zheng, Z.; Zhou, T.C.; Lyu, M.R.; King, I. Component ranking for fault-tolerant cloud applications. IEEE Trans. Serv. Comput. 2012, 5, 540–550. [Google Scholar] [CrossRef]
- Albert, R.; Jeong, H.; Barabási, A.L. Error and attack tolerance of complex networks. Nature 2000, 406, 378. [Google Scholar] [CrossRef] [PubMed]
- Ding, X.; Li, B.; Cheng, C. A Method of Measuring the Importance of Software Network Nodes Based on H Index Variant. Eng. Sci. Technol. 2017, 49, 136–144. [Google Scholar]
- Wang, Y.; Yu, H.; Zhu, Z. Generation of Integration Test Sequences Based on the Importance of Software Nodes. Comput. Res. Dev. 2016, 53, 517–530. [Google Scholar]
- Mala, D.J.; Praba, M.R. Critical components identification and verification for effective software test prioritization. In Proceedings of the 2011 Third International Conference on Advanced Computing, Chennai, India, 14–16 December 2011; pp. 181–186. [Google Scholar]
- Şora, I.; Todinca, D. Using fuzzy rules for identifying key classes in software systems. In Proceedings of the 2016 IEEE 11th International Symposium on Applied Computational Intelligence and Informatics (SACI), Timisoara, Romania, 12–14 May 2016; pp. 317–322. [Google Scholar]
- Gu, Z.; Li, J.; Xu, B. Automatic service composition based on enhanced service dependency graph. In Proceedings of the 2008 IEEE International Conference on Web Services, Beijing, China, 23–26 September 2008; pp. 246–253. [Google Scholar]
- Liu, J.; Hao, S.; Zhang, X.; Wang, C.; Sun, J.; Yu, H.; Li, Z. Research on Web service dynamic composition based on execution dependency relationship. In Proceedings of the 2016 IEEE World Congress on Services (SERVICES), San Francisco, CA, USA, 2–7 July 2016; pp. 113–117. [Google Scholar]
- Guo, Y.; Chen, S.; Feng, Z. Composition oriented web service semantic relations research. In Proceedings of the 2011 International Joint Conference on Service Sciences, Taipei, Taiwan, 25–27 May 2011; pp. 69–73. [Google Scholar]
- Peña, A.B.; Dávila-Nicanor, L.; González-Morán, C.O.; Alor-Hernández, G. Predictive model to determine quality of service on Cloud Computing: Service Dependence Graph. In Proceedings of the 2016 IEEE 13th International Conference on Networking, Sensing, and Control (ICNSC), Mexico City, Mexico, 28–30 April 2016; pp. 1–5. [Google Scholar]
- Zheng, Y.; Ye, C.; Huang, L. Research on Data Service Dependency Graph Model and Automatic Composition Method. J. Chin. Mini-Micro Comput. Syst. 2018, 39, 450–456. [Google Scholar]
- Lü, L.; Zhang, Y.C.; Yeung, C.H.; Zhou, T. Leaders in social networks, the delicious case. PLoS ONE 2011, 6, e21202. [Google Scholar] [CrossRef] [PubMed]
- Li, X. Class Impact Sorting Method in Complex Software Systems. Master’s Thesis, Dalian Maritime University, Dalian, China, 2016. [Google Scholar]
- Li, Q.; Zhou, T.; Lü, L.; Chen, D. Identifying influential spreaders by weighted LeaderRank. Phys. A Stat. Mech. Its Appl. 2014, 404, 47–55. [Google Scholar] [CrossRef] [Green Version]
- Xu, S.; Wang, P.; Zhang, C.X.; Lü, J. Spectral learning algorithm reveals propagation capability of complex networks. IEEE Trans. Cybern. 2018, 99, 1–9. [Google Scholar] [CrossRef] [PubMed]
- Zhang, Z.H.; Jiang, G.P.; Song, Y.R.; Xia, L.L.; Chen, Q. An improved weighted LeaderRank algorithm for identifying influential spreaders in complex networks. In Proceedings of the 2017 IEEE International Conference on Computational Science and Engineering (CSE) and IEEE International Conference on Embedded and Ubiquitous Computing (EUC), Guangzhou, China, 22–23 July 2017; Volume 1, pp. 748–751. [Google Scholar]
- Wang, X. Research on the Structure and Impact of University Knowledge Network Based on Microblog Interconnection. Master’s Thesis, Central China Normal University, Wuhan, China, 2018. [Google Scholar]
- Wang, H.; Wang, L.; Yu, Q.; Zheng, Z. A Novel Online Reliability Prediction Approach for Service-Oriented Systems. In Proceedings of the 2014 IEEE International Conference on Web Services, Anchorage, AK, USA, 27 June–2 July 2014; pp. 582–589. [Google Scholar]
- Ding, Z.; Xu, T.; Ye, T.; Zhou, Y. Online prediction and improvement of reliability for service oriented systems. IEEE Trans. Reliabil. 2016, 65, 1133–1148. [Google Scholar] [CrossRef]
- Arora, S.; Kumar, L.; Rath, S.K. Prediction of reliability for service-oriented systems. In Proceedings of the 2016 International Conference on Computing, Communication and Automation (ICCCA), Greater Noida, India, 29–30 April 2016; pp. 817–823. [Google Scholar]
- Şora, I. A PageRank based recommender system for identifying key classes in software systems. In Proceedings of the 2015 IEEE 10th Jubilee International Symposium on Applied Computational Intelligence and Informatics, Timisoara, Romania, 21–23 May 2015; pp. 495–500. [Google Scholar]
Figure 1.
Service dependency graph.

Figure 2.
Service dependency graph of hotel reservation module.

Figure 3.
Hotel reservation system of service dependency graph of SOS (SDGS).

Figure 4.
Recall rate comparison.

Figure 5.
Precision rate comparison.


Table 1.
Symbol explanation.
| Symbol | Interpretation of Meaning |
|---|---|
| Service heat, that is, the frequency of service components being invoked in SOSs. | |
| Service reliability influence ability, that is, the ability of service component reliability to influence the reliability of SOSs. | |
| Betweenness centrality value of service. |
Table 2.
value comparisons.
| Correlation | 0.05 | ||
|---|---|---|---|
| Method | |||
| Degree | 0.553 | yes | |
| Closeness | 0.322 | yes | |
| Betweenness | 0.676 | yes | |
| PageRank | 0.864 | yes | |
Table 3.
Comparing statistical results of recall rate.
| Method | Recall Rate (%) | ||||
|---|---|---|---|---|---|
| Top 20% | Top 30% | Top 40% | Top 50% | Top 60% | |
| FTCloude1 | 45.5 | 54.5 | 72.7 | 81.8 | 81.8 |
| FLC-4 input | 63.6 | 72.7 | 81.8 | 81.8 | 91.0 |
| G-NWD | 54.5 | 63.6 | 72.7 | 81.8 | 81.8 |
| W-LeaderRank | 54.5 | 54.5 | 72.7 | 72.7 | 72.7 |
| IW-LeaderRank | 72.7 | 81.8 | 91.0 | 91.0 | 91.0 |
Table 4.
Comparing statistical results of precision.
| Method | Precision Rate (%) | ||||
|---|---|---|---|---|---|
| Top 20% | Top 30% | Top 40% | Top 50% | Top 60% | |
| FTCloude1 | 43.1 | 34.5 | 34.5 | 31.0 | 25.9 |
| FLC-4 input | 60.3 | 46.0 | 38.8 | 31.0 | 28.7 |
| G-NWD | 51.7 | 40.7 | 34.5 | 31.0 | 25.9 |
| W-LeaderRank | 51.7 | 34.9 | 34.5 | 27.6 | 23.0 |
| IW-LeaderRank | 69.0 | 51.7 | 43.1 | 34.5 | 28.7 |
© 2019 by the authors. Licensee MDPI, Basel, Switzerland. This article is an open access article distributed under the terms and conditions of the Creative Commons Attribution (CC BY) license (http://creativecommons.org/licenses/by/4.0/).
Share and Cite
MDPI and ACS Style
Zhang, X.; Jiang, S.; Qiao, X.; Cao, Z.; Zhang, L. Critical Components Identification for Service-Oriented Systems. Symmetry 2019, 11, 427. https://doi.org/10.3390/sym11030427
AMA Style
Zhang X, Jiang S, Qiao X, Cao Z, Zhang L. Critical Components Identification for Service-Oriented Systems. Symmetry. 2019; 11(3):427. https://doi.org/10.3390/sym11030427
Chicago/Turabian StyleZhang, Xiuguo, Shuo Jiang, Xinghao Qiao, Zhiying Cao, and Liangjun Zhang. 2019. "Critical Components Identification for Service-Oriented Systems" Symmetry 11, no. 3: 427. https://doi.org/10.3390/sym11030427
Note that from the first issue of 2016, this journal uses article numbers instead of page numbers. See further details here.