Mechanical Behavior of Tunnel Lining with Cracks at Different Positions

1
Key Laboratory of Urban Underground Engineering of Ministry of Education, Beijing Jiaotong University, Beijing 100044, China
2
Beijing Municipal Engineering Research Institute, Beijing 100037, China.
*
Author to whom correspondence should be addressed.
Symmetry 2020, 12(2), 194; https://doi.org/10.3390/sym12020194
Submission received: 23 December 2019
/
Revised: 14 January 2020
/
Accepted: 20 January 2020
/
Published: 27 January 2020
(This article belongs to the Special Issue Symmetry in Engineering Sciences II)
Abstract
:Cracks in the lining significantly reduce the safety of a tunnel during operation. It is urgent to figure out the influence of cracks on tunnel carrying capacity. In this paper, three-dimensional model tests were conducted to investigate deformation, internal force, and deterioration laws of the lining with prefabricated cracks at different positions. The main conclusions were obtained as follows: (1) The carrying capacity of the lining structure with prefabricated cracks was reduced, and the deformation of the lining structure increased. The penetration of the vault crown crack accelerated the damage of the lining structure, and structural failure occurred when the crack went through at the left arch spring. (2) The internal force of the lining was greatly affected by the positions of prefabricated cracks. The internal forces of the lining structure decreased with the existence of prefabricated cracks. Whether or not there were prefabricated cracks, tension cracks appeared in the inside fiber of the vault and inverted arch. (3) The deformation of the lining structure with the existence of prefabricated cracks increased. When the prefabricated crack was located at the vault, the deformation was the largest, followed by the arch spring, side wall, and arch shoulder. (4) The analysis shows that prefabricated cracks at the vault are the most damaging under stress and deformation of the lining structure, so longitudinal cracks at the vault should be strengthened.
1. Introduction
In recent years, the safety of tunnel construction, especially the stability of the tunnel face [1,2,3,4] and the deformation of the ground and neighboring structures [5,6], has been a research hotspot in the field of tunnel engineering. With the large-scale expansion of the Chinese Railway Network, the problems of tunnel structure damage continue to arise. The hidden danger of tunnel operation caused by defects of the metro structure is a problem that cannot be ignored. It is necessary to evaluate and classify the safety status of the metro structure. It is widely accepted that the carrying capacity of the lining structure is reduced due to existing cracks, and the service life of tunnels is greatly shortened [7]. Therefore, research on lining cracks is of great significance. Much research has been carried out to study the damage of tunnels; the cause is summarized and analyzed by on-site investigation of the number, length, inclination, and width of lining cracks and the depth of typical cracks [8,9]. Studies on the failure of concrete structures have been carried out based on numerical analysis [10,11]. Based on model tests and numerical calculations, the influence of tunnel excavation on existing cracks in the surrounding rock was studied, and the crack propagation law and structural damage mode of surrounding rock were obtained [12]. The mechanism of cracking and the process of failure of the secondary lining of a highway tunnel were studied by a field investigation and model test [13]. A detailed investigation was carried out on the cracking and leakage of a tunnel in Japan after an earthquake, and suggestions were given from the perspective of the design layer on the construction of tunnels in an earthquake zone [14]. The mechanical properties of the lining structure with cracks were studied by means of field investigation, numerical analysis, and model tests. Based on this, a calculation method for analyzing the mechanical properties of multifractured lining structures was proposed [15]. Li et al. [16] considered the width and length of cracks, the spalling of lining concrete, the deterioration of materials, and the leakage of water, and determined classification criteria for structural damage of tunnels constructed by the mining method. Feng [17] took the crack width of a tunnel as an evaluation index and classified the condition of lining cracks into four grades (A, B, C, and D) according to the condition of railway and highway tunnels in Japan and China. Zhang [18] first put forward the concept of the degree of health of the tunnel structure, and established a quantitative method to evaluate the safety status of the tunnel structure based on data of an engineering inspection. He [19] designed a 1:25 model test of the Bijiashan tunnel and studied the influence of backfilling and grouting, inner surface reinforcement of the lining, combined reinforcement, and the stress field on the carrying capacity of tunnel structures with cracks. Liu et al. [20] developed a 1:10 full-circumferential closed tunnel model loading device, studied the influence of crack depth and position on the carrying capacity of the tunnel structure, and established a relationship between crack depth and carrying capacity. It can be seen that research on tunnel damage has achieved some success, but from the existing research results, the model tests on lining cracks are mostly based on the plane strain model. Based on the background, in order to investigate the influence of longitudinal cracks on the carrying capacity of the lining structure, the mechanical and deformation behavior of lining with cracks at different positions are carried out, relying on a self-developed 3D test bench with a geometric ratio of 1:10. Then the internal force, deformation, and progressive failure law of the lining are analyzed to reveal the impact of lining cracks on the carrying capacity of the lining to provide a reference for the treatment of lining cracks in similar subway projects.
2. Laboratory Model Test
2.1. Engineering Overview
Based on Line 14 of the Beijing Metro, this paper selected Shi-Lihe Station to Nan-Balizhuang Station as the research section. The overall length of the tunnel (stake number: K25+723.000–K26+704.950) is 981.95 m and the buried depth of the tunnel is 7.5–17 m. The mining method was adopted for construction, with a tunneling footage of 1.2 m. The thickness of both the primary support and the secondary lining is 30 cm. The design parameters of a typical cross-section are shown in Figure 1.
According to the drilling data and indoor geotechnical test results, the soil layers within the exploration range of the project site were divided into four large layers: artificial fill (Qml), Quaternary neosediment, Quaternary Late Pleistocene alluvial–diluvial (Q4al+pl), and Tertiary Chang Xin Dian Formation clastic rocks. There are clastic rocks in the Late Pleistocene alluvial deposit (Q3al+pl) and the Lower Tertiary Chang Xin Dian Formation (E2c). The formation in this area is mainly composed of silty clay and fine sand, and their lateral pressure coefficients are 0.45 and 0.40, respectively.
According to the statistical results of the lining cracks of 15 subway lines in Beijing, many cracks are less than 10 m in length. Therefore, we basically regarded the length of all cracks as less than 10 m. On this basis, taking into account the geometric dimensions of the model, test repeatability, test operability, and reliability, we determined that the geometric similarity ratio of the test model would be 1:10, and the hydraulic loading device was used to simulate the effect of stratum on the lining structure. The research object of this paper is the 12 m lining structure (equivalent to 10 construction footings).
2.2. Test Platform
The test platform uses a three-dimensional full-cycle loading device. The test platform is mainly composed of five parts: bench, reaction frame, wheel-rail device, loading system, and measurement system. The dimensions of the bench are 120 cm × 120 cm (width × height). The overall layout of the loading system is shown in Figure 2. In order to simulate the stress of the tunnel, jacks on the top are used as vertical loading groups to simulate vertical earth pressure, and the other jacks are used as horizontal loading groups to simulate lateral earth pressure. The whole test is completed under symmetrical loading mode.
The model test included a pre-preparation, experimental loading, and data acquisition and analysis phase. In order to keep the loading process stable, the experimental loading should be kept slow, and the jacks of the symmetric points should be simultaneously raised to ensure that the lateral pressure coefficient is around 0.4 (the lateral pressure coefficient is determined by the actual engineering). After the graded load, the oil pressure was kept constant and the load of each stage was stable for more than 5 min. The crack development and the whole gypsum model change were observed throughout the stationary stage of loading. The trend of crack propagation and the change of geometry were observed over time. The model experiment ended with main through-cracks appearing and the lining structure deforming sharply. The measurement system includes a pressure sensor, displacement sensor, strain gauge, and data acquisition system. The overall layout of the test platform can be seen in Figure 3. Concrete strain gauges were arranged on the inner and outer surfaces of the middle part of the model. As shown in Figure 4, 16 strain gauges were arranged on the lining, O1–O8 on the outside of the lining and I1–I8 on the inside.
2.3. Similar Relations and Materials
In this part, the similarity ratio of geometry (CL) is determined as 10. According to the similarity theorem, the similarity ratio of Poisson’s ratio (Cγ) and strain (Cε) is 1, and the similarity ratio of strength (CR), stress (Cσ), and elastic modulus (CE) is 10. This realistic prototype scale model has been simplified to define the reduced-scale model. The mechanical property of gypsum is similar to that of concrete. Both are brittle materials with a Poisson’s ratio of about 0.2, and their compressive strength is much larger than their tensile strength. In this similar model test of similarities, the mix proportion of the lining material is water: gypsum: cementing material = 0.65:1:0.01.
The primary lining prototype was cast in situ with C25 shotcrete, and the secondary lining prototype is a reinforced concrete structure with C40 concrete. In this test, the primary and secondary lining were poured with C30 concrete simultaneously. The mechanical parameters of the lining are based on actual engineering. The elastic modulus and compressive strength of the lining are 30 GP and 30 MPa, respectively. The parameters of the materials are shown in Table 1. The cross-section of the lining shows a two-lane and five-center-circle section; the thickness is 0.6 m (including primary and secondary lining), the span length is 6.58 m, the height is 6.75 m, and the axial length is 12 m. The dimensions of the model are 120 cm × 65.8 cm × 67.5 cm (length × width × height) and the thickness of the lining is 6 cm. The dimensions of the model are shown in Figure 5.
2.4. Experimental Scheme
The failure behavior of the lining with longitudinal prefabricated cracks at different positions was investigated by five model tests. Test 1 was a baseline case with no prefabricated crack. Tests 2–5 had a lining structure with a prefabricated longitudinal crack at the tunnel vault, the arch shoulder, the sidewall, and the arch spring, respectively. The schemes of the model tests are listed in Table 2, and the model tests of prefabricated cracks at different positions are schematically described in Figure 6. According to the inspection results of Line 14 of the Beijing Metro, the length, width, and depth of the prefabricated cracks were 60 cm, 0.2 mm, and 1 cm, respectively.
3. Test Results Analysis
3.1. Results Analysis of Lining with No Prefabricated Crack
3.1.1. Mechanical behavior of the lining
The internal force of the lining at the vault, arch spring, and inverted arch were analyzed. Figure 7 shows the curves of internal force with the external load at the vault. In the early loading stage, the axial force of monitoring points 1, 2, and 8 linearly increased with load. As the loading continued, the increased magnitude of axial force at monitoring point 8 was greater than that at monitoring point 2. When the load reached 70 kPa, tension crack 1 appeared in the intrados of the vault. When the load increased to 135 kPa, tension crack 2 appeared in the extrados of the left arch waist. In the next loading period, there were several cracks in the arch waist and the left arch spring, but they had little impact on the internal force of the lining at the vault. The bending moment of the arch lining increased with increased external load, in which monitoring point 1 was a positive bending moment and monitoring points 2 and 8 were negative, which implies that the outer part of the vault was under compression and the inner side was under tension.
Internal force curves of the lining on the sidewall are shown in Figure 8. The axial force and bending moment of monitoring points 3 and 7 were similar. When the load was in the range of 0 to 70 kPa, axial force and bending moment increased slowly. After crack 1 appeared, the increased ratio of axial force and bending moment of monitoring point 7 was greater than that of monitoring point 3, until a tension crack appeared on the outside of the lining near monitoring point 7. As the external load continued to increase, tension cracks 4 and 5 appeared near monitoring point 3.
Figure 9 shows the internal force curves of the lining at the sidewall. It can be seen that the axial force at measuring point 5 of the inverted arch was significantly less than that at the arch spring, and the internal side of the lining of the inverted arch was subjected to a positive bending moment, which increased gradually with the increased load. When the load was less than 70 kPa, the change law of axial force at all positions was similar. When tensile crack 1 appeared at the vault, the structural integrity was destroyed, resulting in reduced axial force at the inverted arch, while the increased axial force at the arch spring presented an obvious stress concentration phenomenon. When the load reached 174 kPa, tension crack 6 appeared in the left arch spring. As the load increased, the cracks in the left arch spring penetrated, and the lining structure lost its carrying capacity.
An internal force diagram of lining failure is shown in Figure 10. The positive bending moments appeared at the inverted arch and crown, indicating that the inner side of the lining was under tension. It shows that the axial force of the substructure of the lining was larger than that of the superstructure, and stress concentration occurred at both arch springs. Due to the uneven distribution of structural materials and other factors in the process of model making, the internal force on the left side of the lining was a little bit larger than that on the right side. Finally, the crack at the left arch spring penetrated, and the lining structure lost its carrying capacity. In terms of the bending moment, the internal lining of the vault and inverted arch was subjected to tension, and a tension crack first appear at the vault crown, while the bending moment of the left side wall and the arch spring was greater than that of the right side. The distribution of cracks of the lining is depicted in Figure 11.
3.1.2. Deformation behavior of lining
To investigate the deformation law of the lining during the test, vertical and horizontal convergence of the lining are analyzed in this part. Figure 12 shows the relation curve between deformation and load. When the external load was between 0 and 70 kPa, vertical convergence increased slowly, and horizontal displacement increased linearly with the increased load. When crack 1 appeared, the vertical convergence ratio increased, and when the load reached 174 kPa (through-crack 1), vertical deformation increased sharply. The appearance of through-crack 1 indicates that the vault of the lining was damaged, decreasing the load transferring from the arch to the sidewall. At this time, horizontal displacement tended to be gentle, however, vertical deformation increased sharply until structural failure occurred. It can be concluded that vertical displacement was greatly affected by the crack at the vault, while the appearance of cracks in other parts of the lining had little influence on vertical deformation.
3.2. Analysis of Prefabricated Cracks at Different Positions
3.2.1. Mechanical Behavior Analysis
The distribution of lining internal force in the ultimate state under different tests are depicted in Figure 13. The internal force of the lining was greatly affected by the positions of the prefabricated cracks. The internal forces of the lining structure decreased by different degrees with the existence of prefabricated cracks. Vertical displacement was greatly affected by crack 1 at the vault, while the appearance of cracks in other parts had little effect on vertical deformation. When prefabricated cracks were located at the arch shoulder, sidewall, and arch spring, the lining axial force and bending moment were asymmetrically distributed. In tests 3 and 5, with increased positive bending moment at the inverted arch, tension cracks appeared on the inside of the inverted arch.
3.2.2. Deformation Behavior Analysis
The distribution of lining internal force in the ultimate state is shown in Figure 14. It can be seen that the overall variation in vertical and horizontal convergence curves of the tests is similar. When the external load was between 0 and 70 kPa, the speed of horizontal deformation was significantly higher than that of vertical convergence. The vertical and horizontal convergence ratio increased after crack 1 appeared. When crack 1 became a through-crack, vertical convergence increased sharply until the crack at the left arch spring was through, then the model lost its carrying capacity. However, the horizontal convergence curve became gradually stable at this stage.
As for test 2, when the external load reached 60 kPa, the prefabricated crack at the vault began to expand, and the external load was greatly reduced compared with test 1 (no prefabricated crack) when the crack at the vault penetrated. The ultimate load of the structure was 215 kPa, which is lower than that of test 1 (228 kPa).
As for tests 2 and 4, the prefabricated cracks were located at the vault and sidewall, respectively. The cracks appeared in the same sequence during the loading of the two tests, but the prefabricated cracks did not expand. Cracks in the vault and side wall appeared first at the inner fiber of the tunnel vault, second at the outer fiber of the lining at the left arch waist, third at the outer fiber of the lining at the right arch waist, and then at the inner fiber of the lining at the left arch spring. As for tests 3 and 5, prefabricated cracks were located at the arch shoulder and arch spring, respectively. The cracks appeared in the same sequence during the loading of the two tests. The cracks first appeared at the vault, then, as the load reached the tensile limit of the inner fiber of the lining, tensile crack 2 appeared at the inverted arch, then cracks 3 and 4 appeared on the outside of the left and right arch waist, respectively. Finally, the crack at the left arch spring went through, and the structure lost its carrying capacity.
Figure 15 shows a comparison diagram of vertical and horizontal convergence curves of lining under different tests. The deformation of the lining structure increased when there was a prefabricated crack. The final vertical and horizontal convergence of the four models in descending order was as follows: the prefabricated crack was located at the vault, then at the arch spring, side wall, and arch shoulder. It can be seen that the influence on deformation due to prefabricated cracks at the vault and arch spring was greater than at the sidewall and arch shoulder.
4. Analysis of Carrying Capacity of Lining
It can be seen from the above analysis that the penetration of cracks at the vault accelerated the damage of the lining structure. It is considered that the carrying capacity is the load beyond which the lining fails. Table 3 shows the load when the crack at the vault went through and the ultimate load of all tests. The carrying capacity of the lining structure was reduced when there were prefabricated cracks. In test 2 (prefabricated crack at the vault), the load was 144 kPa when crack 1 became a through-crack. When the prefabricated cracks were located at the arch shoulder, sidewall, and arch spring, the load increased gradually.
When the prefabricated crack was located at the vault, the ultimate load of the structure decreased by 6% compared with test 1, and when the prefabricated cracks were located at the arch shoulder and sidewall, the ultimate load decreased slightly. During the test process, the structure failed when the arch spring cracked through, while the prefabricated crack at the arch spring accelerated the penetration of the crack, and the ultimate load decreased by 4% (219 kPa) compared with test 1. It can be concluded that the presence of a prefabricated crack at the vault accelerated the crack’s propagation, and as the prefabricated cracks were far from the vault, the load at the vault crack increased. The ultimate load of the lining structure was reduced by the presence of prefabricated cracks, and the reduction was greater when the cracks were located at the vault and the arch than at the side wall and arched shoulder.
5. Conclusions
Based on the horseshoe cross-section tunnel structure of the Beijing subway, mechanical and deformation characteristics of the lining structure with prefabricated cracks at different positions were studied by 3D-model tests. The main conclusions are as follows:
- (1)
- The carrying capacity of the lining with prefabricated cracks was reduced, and the deformation of the lining structure increased. Cracks located at the vault fully extended along longitudinal direction accelerated the speed of lining damage. When the crack located at the left arch spring extended along longitudinal direction, the tunnel lining failed.
- (2)
- The internal force of the lining was greatly affected by the positions of prefabricated cracks. The internal forces of the lining structure decreased with the existence of prefabricated cracks. Whether or not a prefabricated crack existed, the outer fiber of the vault and inverted arch were under compression and the inner fiber was under tension, so a tension crack appeared at the inside fiber of the vault and inverted arch, while compressive stress concentration appeared at both sides of the arch springs.
- (3)
- The deformation of the lining structure with the existence of prefabricated cracks increased. When the prefabricated crack was located at the vault, the deformation was the largest, followed by the arch spring, side wall, and arch shoulder. Vertical deformation was greatly affected by the crack at the vault; however, the appearance of cracks in other parts had little influence on vertical deformation. The through-crack at the tunnel vault indicated failure of the vault of the lining. At this time, the load transferring from the arch to the sidewall decreased in order to reduce horizontal deformation, while vertical deformation increased greatly until the structure was damaged.
- (4)
- The ultimate carrying capacity of the lining was reduced due to the existence of prefabricated cracks, and the carrying capacity of the lining structure was greatly reduced when the prefabricated crack was located at the vault. It can be concluded that the crack at the vault was the most damaging under the stress and deformation of the lining structure, so treatment of longitudinal cracks at the vault should be strengthened and receive more attention during projects.
Author Contributions
J.S. designed research and contributed to the funding; Y.J. and X.L. carried out the model tests, completed most of the data analysis; X.N. helped in the model test and contributed to the funding; C.L. helped in data analysis and wrote the manuscript. All authors have read and agreed to the published version of the manuscript.
Funding
This research was funded by the Fundamental Research Funds for the Central Universities (2019JBM093) and the Science and Technology Research and Development Program of China Railway Corporation (N2018G029)
Acknowledgments
The authors are deeply thankful to the reviews for their valuable suggestions to improve the quality of the paper.
Conflicts of Interest
The authors declare no conflict of interest regarding the publication of this paper.
References
- Zhang, C.P.; Han, K.H.; Zhang, D.L. Face stability analysis of shallow circular tunnels in cohesive-frictional soils. Tunn. Undergr. Space Technol. 2015, 50, 345–357. [Google Scholar] [CrossRef]
- Zhang, C.P.; Li, W.; Zhu, W.J.; Tan, Z.B. Face stability analysis of a shallow horseshoe-shaped shield tunnel in clay with a linearly increasing shear strength with depth. Tunn. Undergr. Space Technol. 2020, 97, 103291. [Google Scholar] [CrossRef]
- Han, K.H.; Zhang, C.P.; Zhang, D.L. Upper-bound solutions for the face stability of a shield tunnel in multilayered cohesive–frictional soils. Comput. Geotech. 2016, 79, 1–9. [Google Scholar] [CrossRef]
- Li, W.; Zhang, C.P. Face Stability Analysis for a Shield Tunnel in Anisotropic Sands. Int. J. Geomech. 2020. [Google Scholar] [CrossRef]
- Zhang, C.P.; Zhang, X.; Fang, Q. Behaviors of existing twin subway tunnels due to new subway station excavation below in close vicinity. Tunn. Undergr. Space Technol. 2018, 81, 121–128. [Google Scholar] [CrossRef]
- Zhang, X.; Zhang, C.P.; Wang, J.C. Effect of closely spaced twin tunnel construction beneath an existing subway station: A case study. J. Test. Eval. 2018, 46, 1559–1573. [Google Scholar] [CrossRef]
- Briffaut, M.; Benboudjema, F.; D’Aloia, L. Effect of fibres on early age cracking of concrete tunnel lining. Part I: Laboratory ring test. Tunn. Undergr. Space Technol. 2016, 59, 215–220. [Google Scholar] [CrossRef]
- Ansell, A. Investigation of shrinkage cracking in shotcrete on tunnel drains. Tunn. Undergr. Space Technol. 2010, 25, 607–613. [Google Scholar] [CrossRef]
- Kamel, T.; Limam, A.; Silvani, C. Residual strength of underground structures in service. Can. Geotech. J. 2016, 53, 988–999. [Google Scholar] [CrossRef]
- Carvalho, J.P.; Lehmann, H.; Bartelt, H.; Magalhães, F.; Amezcua-Correa, R.; Santos, J.L.; Knight, J.C. Structural diagnosis of a concrete dam with cracking and high nonrecoverable displacements. J. Perform. Construct. Facil. 2016, 30, 04016021. [Google Scholar]
- Kong, C.; Gao, X.Q.; Cao, L.; Liu, K. Analysis of the failure of primary support of a deep-buried railway tunnel in silty clay. Eng. Fail. Anal. 2016, 66, 259–273. [Google Scholar] [CrossRef]
- Zhou, L.; Zhu, Z.; Dong, Y.; Ying, P.; Wang, M. Study of the fracture behavior of mode I and mixed mode I/II cracks in tunnel under impact loads. Tunn. Undergr. Space Technol. 2019, 84, 11–21. [Google Scholar] [CrossRef]
- Song, W.; Lai, H.; Liu, Y.; Yang, W.; Zhu, Z. Field and laboratory study of cracking and safety of secondary lining for an existing highway tunnel in loess ground. Tunn. Undergr. Space Technol. 2019, 88, 35–46. [Google Scholar] [CrossRef]
- Zhang, X.P.; Jiang, Y.J.; Sugimoto, S. Seismic damage assessment of mountain tunnel: A case study on the Tawarayama tunnel due to the 2016 Kumamoto Earthquake. Tunn. Undergr. Space Technol. 2018, 71, 138–148. [Google Scholar] [CrossRef] [Green Version]
- Xu, G.; He, C.; Lu, D.; Wang, S. The influence of longitudinal crack on mechanical behavior of shield tunnel lining in soft-hard composite strata. Thin-Walled Struct. 2019, 144, 106282. [Google Scholar] [CrossRef]
- Li, Y.J.; Wang, M.S.; Xu, H.J.; Zhang, Y. Study on the Damage Classification Criterion and Reinforcement Strategies of Mine Construction Subway. Urban Rapid Rail Transit. 2014, 27, 86–89. (In Chinese) [Google Scholar]
- Feng, X.Y. Study on Tunnel Damage Classification and Lining Crack Control Technology. Master’s Thesis, Beijing Jiaotong University, Beijing, China, 2012. (In Chinese). [Google Scholar]
- Zhang, S.L. Study on Health Diagnosis and Evaluation of Tunnel Lining Structure. Ph.D. Thesis, Beijing Jiaotong University, Beijing, China, 2012. (In Chinese). [Google Scholar]
- He, C.; Tang, Z.C.; Wang, B.; She, J. Research on effect of inner surface reinforcing on structure bearing capacity by model test in defective tunnel. Rock Soil Mech. 2009, 30, 406–412. (In Chinese) [Google Scholar]
- Li, X.Z.; Li, W.Y.; Song, Y.L.; Gu, Y.C. Experiment on the influence of cracking characteristics under unsymmetrical load on stresses or forces in tunnel lining. China Civ. Eng. J. 2015, 48, 119–128. (In Chinese) [Google Scholar]
Figure 1.
Design parameters of a typical cross-section (unit: mm).
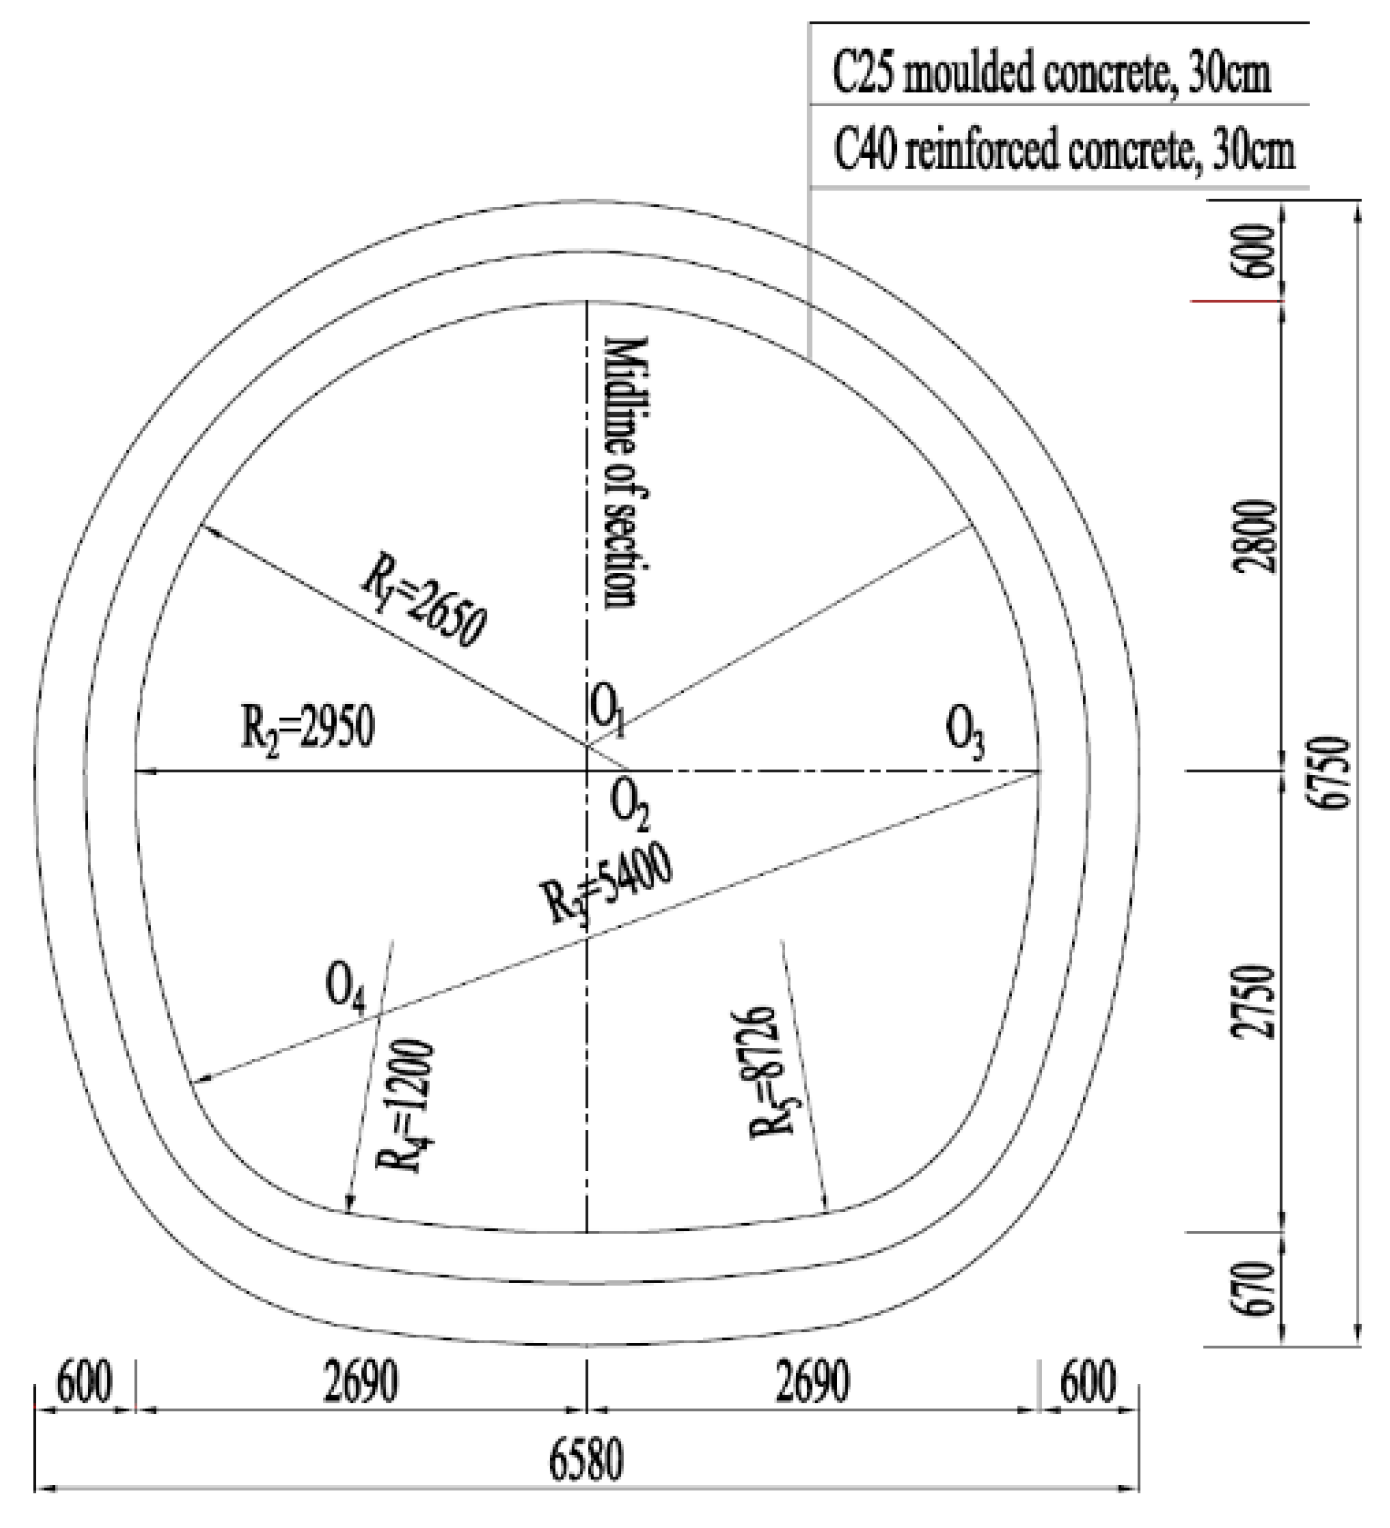
Figure 2.
Overall layout of loading system.

Figure 3.
Test platform.

Figure 4.
Layout of strain gauges for lining model.

Figure 5.
Dimensions of lining model.

Figure 6.
Diagram of prefabricated cracks at different positions: (a) test 2; (b) test 3; (c) test 4; (d) test 5.
Figure 6.
Diagram of prefabricated cracks at different positions: (a) test 2; (b) test 3; (c) test 4; (d) test 5.

Figure 7.
Internal forces curves of lining at vault: (a) axial force; (b) bending moment.

Figure 8.
Internal force curves of lining at sidewall: (a) axial force; (b) bending moment.
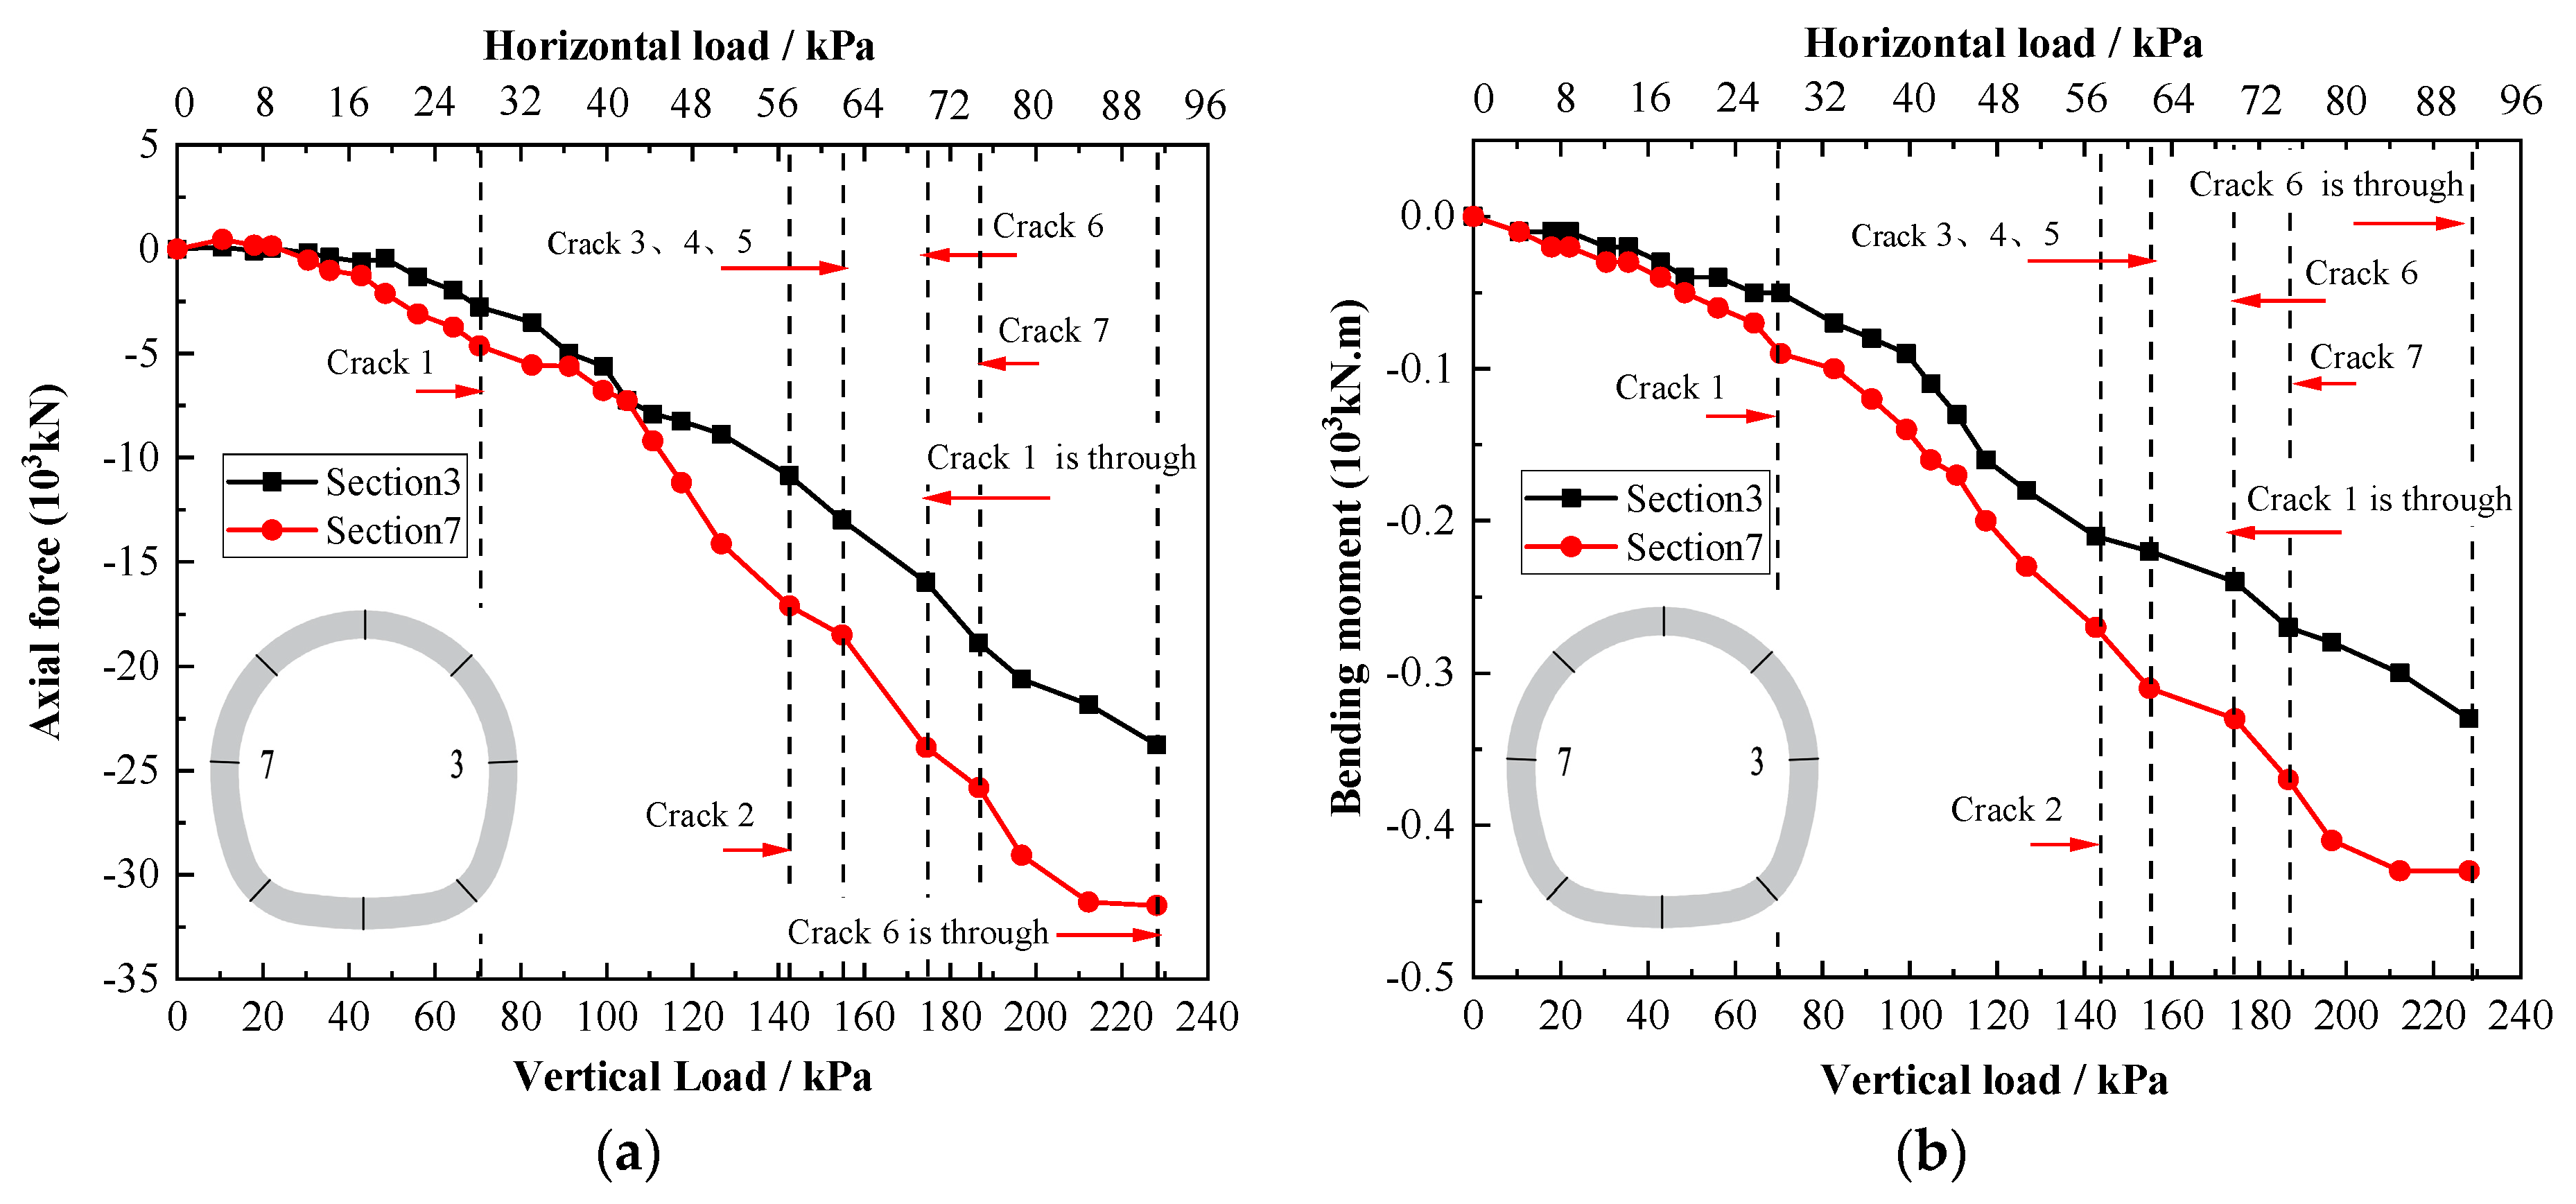
Figure 9.
Internal force curves of lining at arch spring and inverted arch: (a) axial force; (b) bending moment.
Figure 9.
Internal force curves of lining at arch spring and inverted arch: (a) axial force; (b) bending moment.

Figure 10.
Distribution of lining internal force in the ultimate state: (a) axial force; (b) bending moment. (The green line represents axial force, and the red line represents bending moment.)
Figure 10.
Distribution of lining internal force in the ultimate state: (a) axial force; (b) bending moment. (The green line represents axial force, and the red line represents bending moment.)

Figure 11.
Distribution of cracks in the lining.
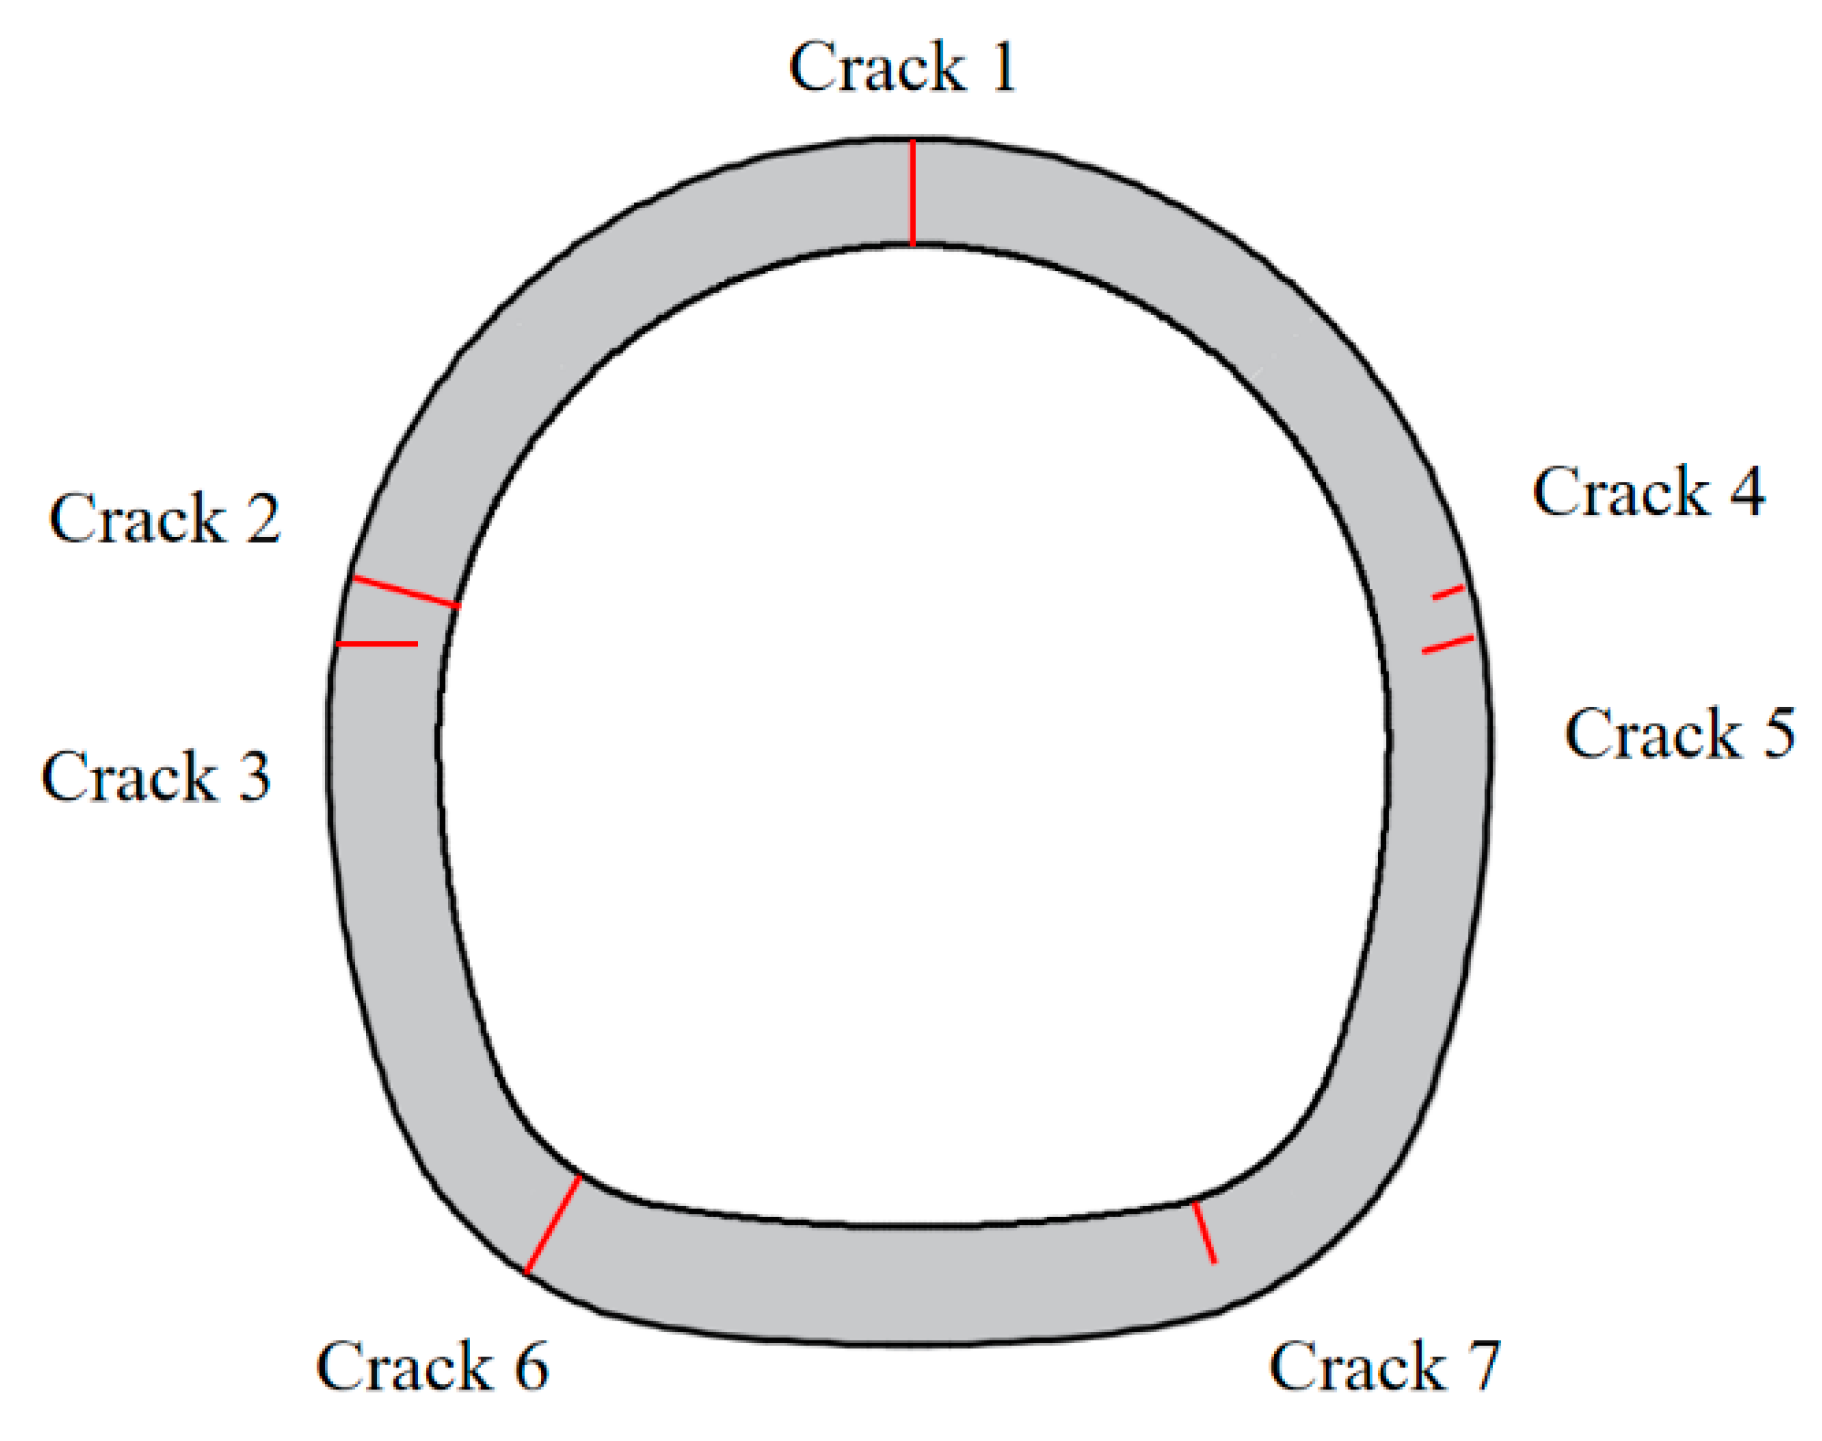
Figure 12.
Relation curve between load, deformation, and cracks.
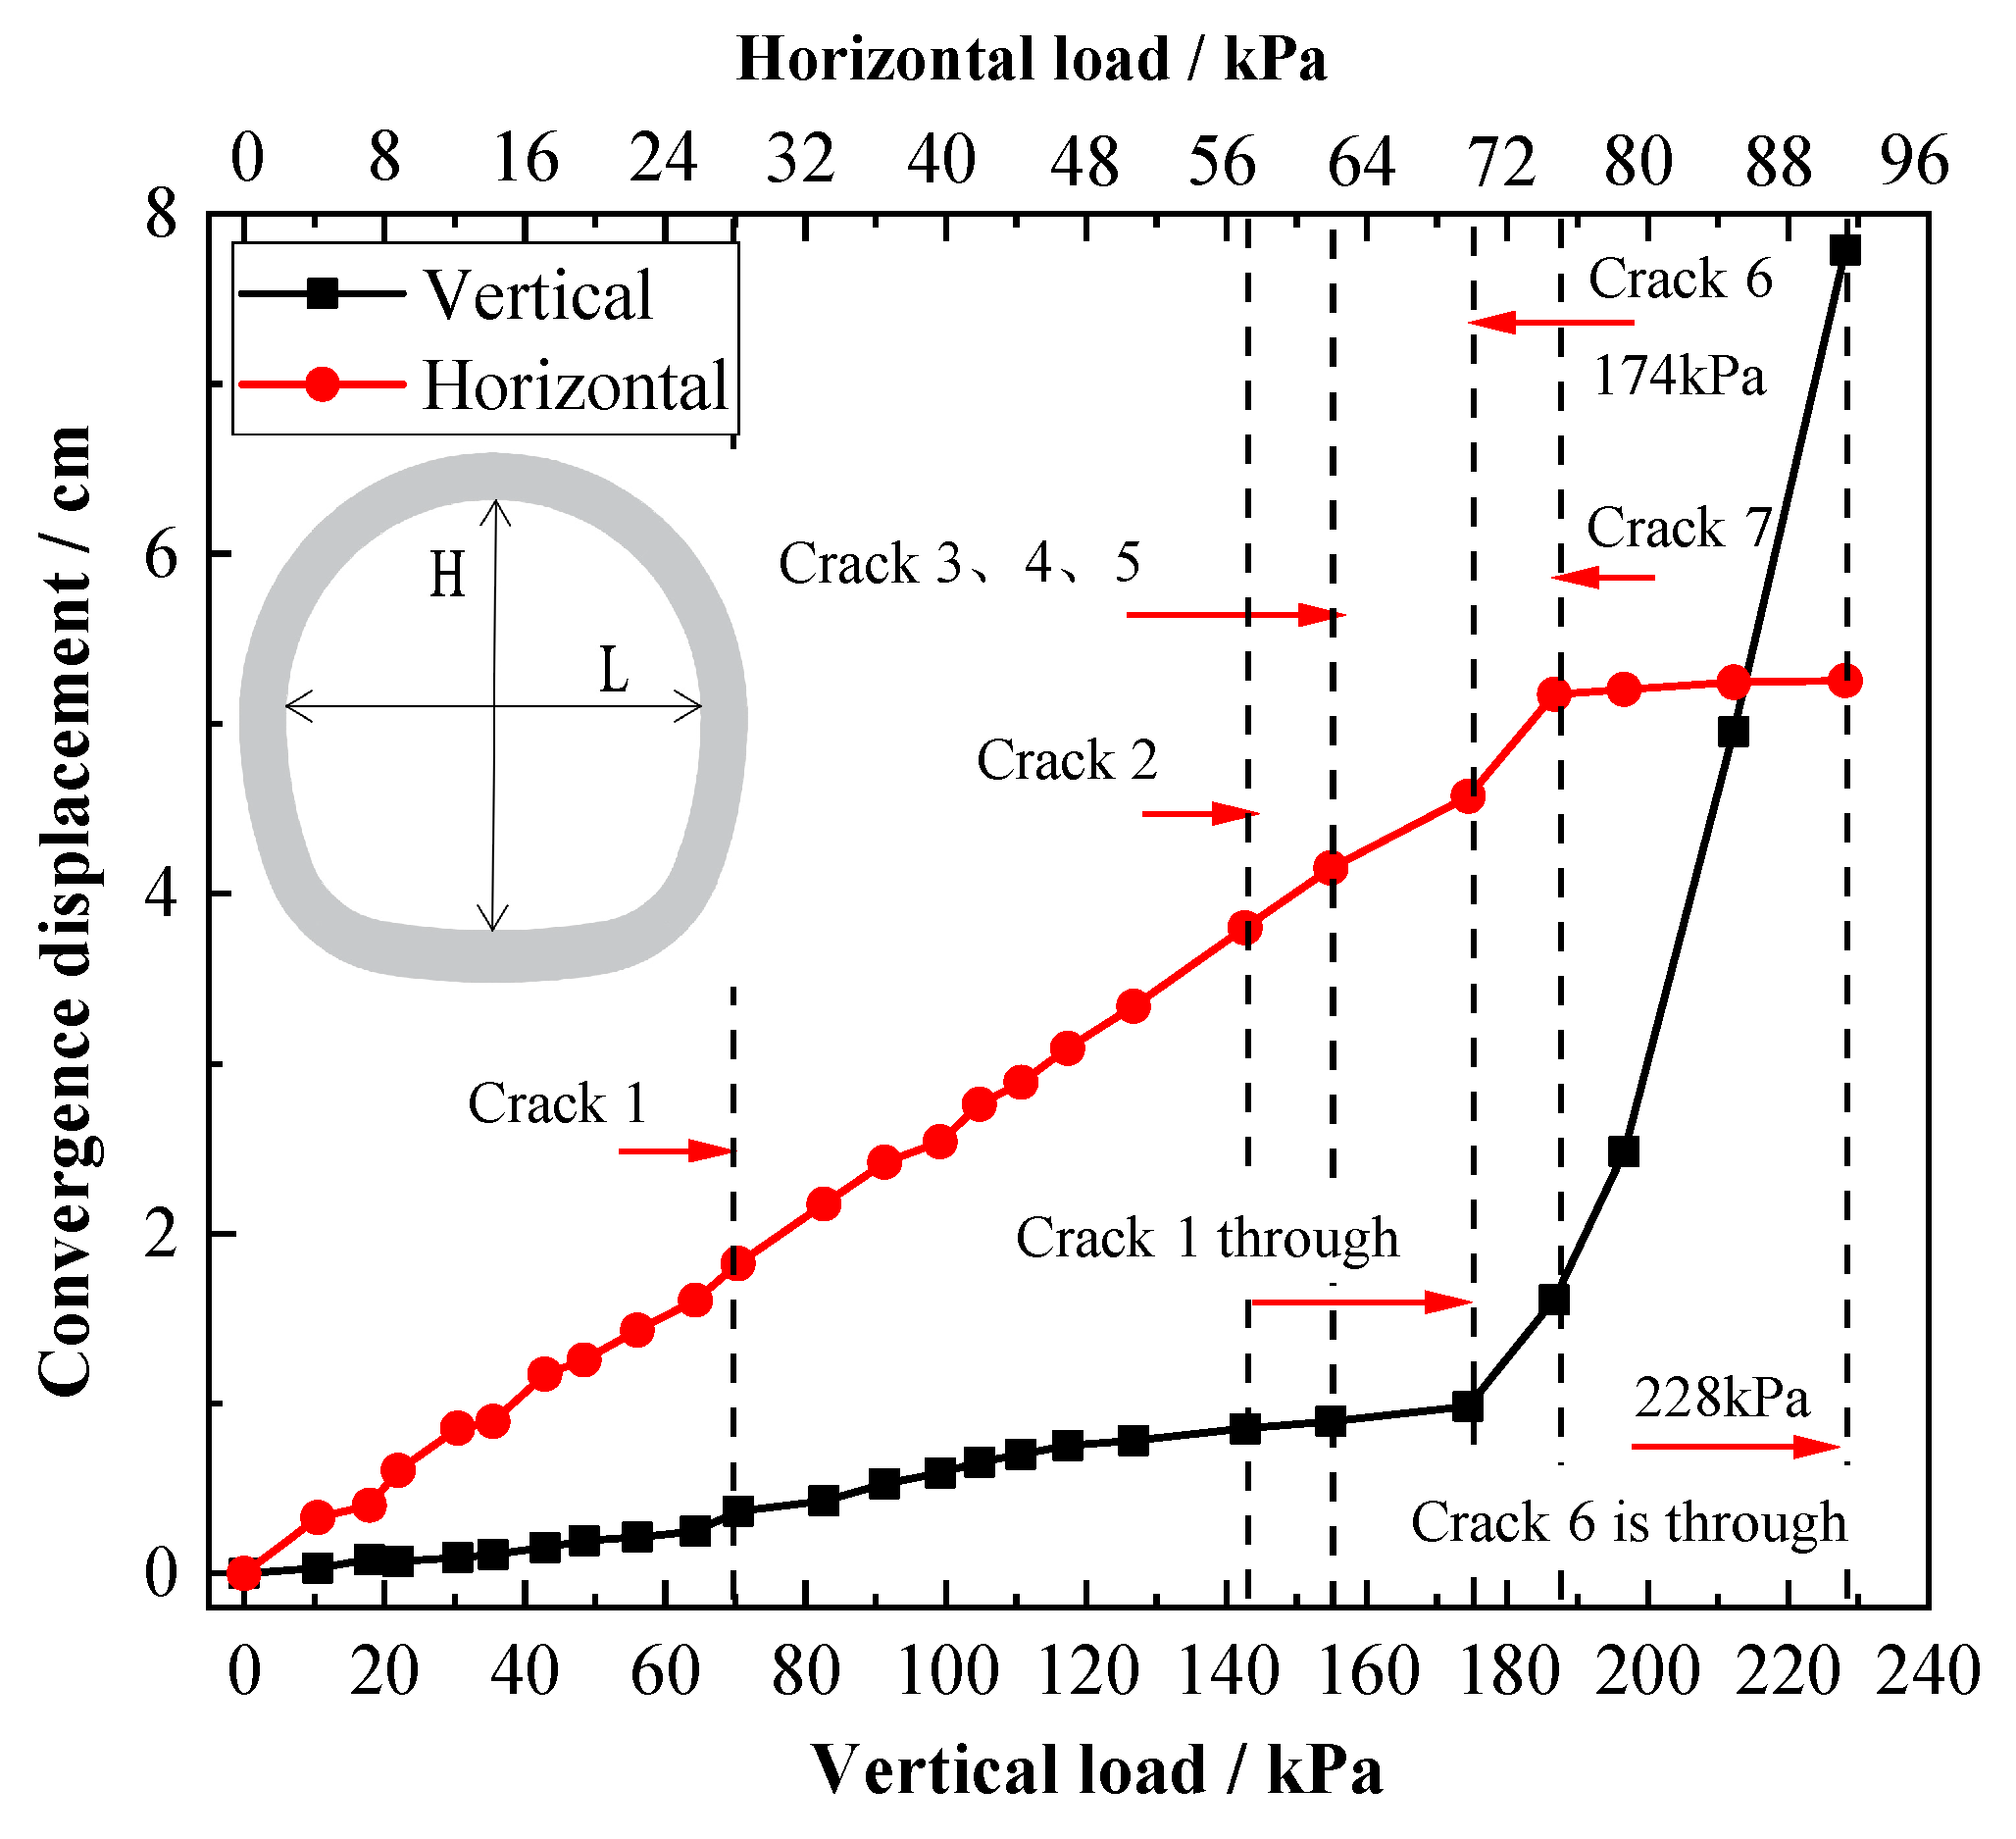
Figure 13.
Distribution of lining internal force in the ultimate state: (a) test 2; (b) test 3; (c) test 4; (d) test 5. (The green line represents axial force, and the red line represents bending moment.)
Figure 13.
Distribution of lining internal force in the ultimate state: (a) test 2; (b) test 3; (c) test 4; (d) test 5. (The green line represents axial force, and the red line represents bending moment.)


Figure 14.
Relation curves between load, deformations, and cracks: (a) test 2; (b) test 3; (c) test 4; (d) test 5.
Figure 14.
Relation curves between load, deformations, and cracks: (a) test 2; (b) test 3; (c) test 4; (d) test 5.

Figure 15.
Relation curves between load and deformation of all tests: (a) vertical; (b) horizontal.


Table 1.
Physical and mechanical parameters of lining.
| Elastic Modulus (GPa) | Compressive Strength (GPa) | Poisson’s Ratio | |
|---|---|---|---|
| Prototype lining | 30 | 30 | 0.2 |
| Model lining | 2.9 | 3.1 | 0.2 |
Table 2.
Schemes of model tests.
| Scheme | Position of Crack |
|---|---|
| Test 1 | None (baseline case) |
| Test 2 | Vault |
| Test 3 | Shoulder |
| Test 4 | Sidewall |
| Test 5 | Arch spring |
Table 3.
Load when crack is through at the vault and failure load.
| Scheme | Load When Crack at Vault is Through (kPa) | Failure Load (kPa) | Carrying Capacity Reduction Ratio |
|---|---|---|---|
| Test 1 | 174 | 228 | – |
| Test 2 | 144 | 215 | 5.7% |
| Test 3 | 156 | 218 | 4.4% |
| Test 4 | 171 | 223 | 2.2% |
| Test 5 | 179 | 219 | 3.9% |
© 2020 by the authors. Licensee MDPI, Basel, Switzerland. This article is an open access article distributed under the terms and conditions of the Creative Commons Attribution (CC BY) license (http://creativecommons.org/licenses/by/4.0/).
Share and Cite
MDPI and ACS Style
Su, J.; Jie, Y.; Niu, X.; Liu, C.; Liu, X. Mechanical Behavior of Tunnel Lining with Cracks at Different Positions. Symmetry 2020, 12, 194. https://doi.org/10.3390/sym12020194
AMA Style
Su J, Jie Y, Niu X, Liu C, Liu X. Mechanical Behavior of Tunnel Lining with Cracks at Different Positions. Symmetry. 2020; 12(2):194. https://doi.org/10.3390/sym12020194
Chicago/Turabian StyleSu, Jie, Yinming Jie, Xiaokai Niu, Chang Liu, and Xuan Liu. 2020. "Mechanical Behavior of Tunnel Lining with Cracks at Different Positions" Symmetry 12, no. 2: 194. https://doi.org/10.3390/sym12020194
Note that from the first issue of 2016, this journal uses article numbers instead of page numbers. See further details here.