Article

An Integrated Framework for Dynamic Vehicle Routing Problems with Pick-up and Delivery Time Windows and Shared Fleet Capacity Planning

1
Research and Development HepsiJET, Istanbul 34785, Turkey
2
Sabanci Business School, Sabanci University, Istanbul 34956, Turkey
*
Author to whom correspondence should be addressed.
Symmetry 2024, 16(4), 505; https://doi.org/10.3390/sym16040505
Submission received: 4 March 2024 / Revised: 4 April 2024 / Accepted: 7 April 2024 / Published: 22 April 2024

Abstract

:
This paper proposes a novel route optimization framework to solve the problem of instant pick-up and delivery for e-grocery orders. The proposed framework extends the traditional time-windowed package delivery problem. We demonstrate the effectiveness of our approach for this integrated problem using actual delivery data from HepsiJet, a leading e-commerce logistics provider in Turkey. We first employ several machine learning algorithms and simulations to investigate the capacity of the courier. Subsequently, a dynamic route planning workflow is executed with a highly specialized and novel routing algorithm. Our proposed heuristic approach considers combined fleet operations for delivering regular packages originating from a central depot and dynamic e-grocery orders picked up at local supermarkets and delivered to the customers. The heuristic algorithm constitutes k-opt and node transfer operation variations customized for this integrated problem. We report the performance of our approach in problem instances from the literature and instances from HepsiJet’s daily operations, which we also publicly share as new route optimization problem instances. Our results suggest that, despite the more complex nature of the integrated problem, our proposed algorithm and solution framework produce more efficient and cost-effective solutions that offer additional business opportunities for companies such as HepsiJet. The computational analyses reveal that implementing our proposed approach yields significant efficiency gains and cost reductions for the company, with a distance reduction of over 30%, underscoring our approach’s effectiveness in achieving substantial cost savings and enhanced efficiency through integrating two distinct delivery operations.

1. Introduction

Portable computers, mobile phones, wireless, and mobile networks allow us to access the Internet from almost anywhere and maintain our connection dynamically even when we are on the move, ushering in a new economic era. People can now easily shop on traditional e-commerce websites, online marketplaces, and mobile market apps that provide fast delivery without leaving their homes all day. Furthermore, people in many OECD countries have reduced their physical presences and interactions due to the COVID-19 crisis. Self-imposed social distancing, combined with strict containment measures implemented in many OECD countries, has effectively halted much traditional brick-and-mortar retailing, at least temporarily, causing a major increase in online shopping and the use of e-commerce [1,2].
In the United States, between February and April 2020, retail and food service sales fell 7.7% compared with the same period in 2019. However, sales for grocery and non-store retailers increased 16 % and 14.8 % , respectively. In the EU-27.2 countries, mail-order or online retail sales increased by 30 % in April 2020 compared with April 2019, while store retail sales decreased by 17.9 % . As a result, shifts from physical retail to e-commerce will likely be significant around the globe. For example, in the United States, the share of e-commerce in total retail increased slowly from 9.6 % in Q1 2018 to 11.8 % in Q1 2020 but rather quickly to 16.1 % in Q2 2020 [3,4]. Especially on specific shopping days such as Black Friday, Mother’s Day, or Christmas holidays, this demand has reached its maximum level, and the need for faster and more cost-effective package deliveries has arisen significantly [5].
In Turkey, e-commerce sales reached USD 13.1 billion in the first half of 2020, 64 % higher compared with its previous year. This major increase, which was at least partially due to the rise of the COVID-19 pandemic and the subsequent lockdowns, has significantly affected the already challenged package delivery industry [6]. Consequently, transportation and logistics for e-commerce have been facing a grand challenge that can be turned into an opportunity, if managed well with intelligent supply chain management techniques [7].
The operation of collecting orders from customers and delivering them on time involves many parameters and logistical decisions. Traditionally, e-commerce customers are served from inventories stored in or delivered to central locations (e.g., warehouses, distribution centers, and cross-docks) within the parameters requested by the customer (e.g., delivery time windows or same-day delivery) or the limitations of the logistics operations. The increased demand for e-commerce and e-grocery, for the reasons explained above, resulted in a similarly increased demand for a relatively new mode of delivery: instant delivery. By instant delivery, we refer to customer requests that are typically served from local stores or supermarkets in a shorter-than-same-day time frame, such as being picked up within minutes of placing the order and delivered within the next hour or so. During the COVID-19 pandemic, social distancing rules, lockdowns, and the risk of disease transmission caused changes in consumer behavior, leading to the popularity of instant delivery, with high revenue generation opportunities for the e-commerce businesses. Under the pandemic conditions, instant delivery companies broke sales records as shops were closed as people stayed home. The number of instant delivery application users in Turkey reached almost 1.5 million deliveries in the second half of 2019 and continues to increase rapidly [8].
Standard VRP problems are suitable for modeling traditional cargo operations. In these operations, fleet carriers take custody of all shipments from a single depot at the start of the delivery process and deliver them to different points during the day. There are no strict time windows during distribution. The other type of last-mile operation is on-demand instant delivery operations. These operations are based on picking up deliveries from different points during the day, depending on customer demands, and distributing them to other points within a short time window. In these operations, demands can also arrive dynamically during the day. These types of operations are categorized in the VRP literature as Dynamic Pick-up and Delivery with Time Window Vehicle Routing Problems (DPDTWVRPs).
In certain practical settings, an e-commerce business may handle both types of operations simultaneously (i.e., traditional cargo delivery and instant delivery) with two parallel fleets. For example, with the relatively recent acquisition of Whole Foods Market, Amazon can use its logistics experience and resources to facilitate the instant delivery of groceries along with its traditional e-commerce. At the time of writing this article, Amazon only offers the instant delivery of groceries to Amazon Prime members in select ZIP codes. In such cases, capacity sharing between the two fleets of e-commerce and instant delivery can provide an opportunity to expand the business overall, albeit with proper planning and scheduling.
This paper addresses the problem of capacity sharing between two types of fleets in the same business. By combining these operations, the number of required couriers and overall costs can be reduced. This in turn will increase the earnings of the non-salaried, crowd-sourced drivers that charge based on the distribution and collection process. In order to combine these two operations, a framework is needed to solve VRPs and DPDTWVRPs in terms of routing. In addition, the capacities of the fleets must be planned correctly for integration to work efficiently. To the best of our knowledge, there is no single solution in the literature to cover all aspects of such a problem. The proposed framework in this paper solves two different routing problems simultaneously and also employs the capacity planning aspect proposed in a previous work with the support of machine learning methods [9].
More specifically, we offer a route optimization solution framework that aims to address this new trend in e-commerce logistics (i.e., instant delivery) in integration with conventional package delivery logistics. We propose an integrated route optimization framework that operates a combined fleet, sharing vehicle capacities between the instant delivery orders served from local grocery stores and the traditional time-windowed orders served from a central depot. To achieve desirable levels of cost efficiency and customer satisfaction, we use an array of mathematical models, including machine learning (ML) and simulation, to address not only the route optimization side but also the courier capacity planning aspect of the entire logistics operation. Specifically, we first use ML to predict the number of packages and allocate courier capacity to delivery areas. Then, we employ a route optimization approach to efficiently serve the complete set of delivery requests for the two markets combined. The main goal is to make efficient and optimized use of the extra idle times of the vehicles to serve a new market, as opposed to running two sets of disjointed operations for two separate fleets.
To show the effectiveness of our proposed framework and the business value of the integrated routing approach, we conduct two sets of computational experiments: testing our proposed algorithm on instances from the literature and testing it on real-world problem instances from HepsiJet in Turkey. HepsiJet is a rapidly growing, technology-driven e-commerce logistics company launched in May 2017 with a business plan that involves crowd-sourced couriers. It showed a growth trend by increasing the number of cross-docks along with the spread of e-commerce throughout Turkey. The size of its operations (measured by the number of delivered packages) rose by 91% from 2018 to 2019 and by 171% from 2019 to 2020. Fast delivery and timely arrival are essential in e-grocery shopping, as customers expect their groceries to arrive promptly and at a scheduled time. This helps them plan their days accordingly and guarantees that fresh and perishable items are delivered on time. In our case study, we demonstrate how the proposed approach can improve the current operations and how it can also validate the business case of logistically integrating the instant delivery market and generating business and consumer value.
The contributions of this study are threefold:
  • We present an overall framework along with its operational details for potential deployment of a capacity planning and routing optimization solution that seeks efficiency by integrating last-mile delivery operations. This framework can be used by logistics planners and optimization experts to achieve operational efficiencies above and beyond what they have already achieved.
  • As part of the presented framework, we propose an optimization solution that attempts to solve two traditionally disjointed but equally complex variants of the vehicle routing problem to achieve further operational efficiency using a shared fleet. To the best of our knowledge, this is the first attempt at solving this kind of a unified problem and validating its effectiveness in an industrial setting.
  • We provide and publicly share an authentic real-world data set for future researchers to develop and apply new algorithms, aimed at solving the complex unified routing optimization problem we have tackled in our study. This data set comes with features reflecting the detailed real-life dimensions of rich vehicle routing problems typically encountered in real-world settings. We report the solutions we have found for benchmarking purposes as well.
In what follows, we present a review of the relevant literature, followed by the mathematical definition of the problem at hand, our proposed framework and optimization methodology, as well as our computational results and suggestions for future directions for research. In the context of our study, the symmetry concept is essential as it relates to the equitable allocation of resources between the two distinct types of delivery operations. Symmetry ensures that both instant and traditional delivery services are optimally integrated, allowing for balanced use of fleet capacities and operational efforts.

2. Literature Review

2.1. Vehicle Routing Problems (VRPs)

Vehicle routing problems are one of the most widely studied problems in the optimization literature. In many areas, such as production and supply chains, the first focal point of companies is to increase the efficiency of their delivery operations and fleet optimization in general. The classical vehicle routing problem (VRP) involves assigning routes to a fleet of vehicles at the lowest possible overall cost in order to serve a set of customers with known demands. Each customer typically needs to be visited only once by an assigned vehicle (with or without capacity limitations), which starts (and typically ends) its daily route at a central warehouse location [10,11].
Many variables and configurations can be encountered in the literature that attempt to adapt the vehicle routing problem to real-life situations, such as delivery time windows, paired pick-up and delivery, distance constraints, vehicle number and capacity constraints, and open and closed routes. A VRP with many or most of these real-life business requirements is referred to as a rich vehicle routing problem. The authors of [12] provided a general classification and brief descriptions of many such real-world vehicle routing problem extensions. One of the VRP extensions that we study in this paper, the PDPTW, involves pick-up and delivery with time windows where a customer requires his or her order to be picked up at a location other than the requested delivery location. In this case, the pick-up and delivery requests are known in advance, and the number of vehicles is an input parameter.
Many modeling approaches and algorithms, including mathematical, linear, branch-cutting, exact or heuristic, and deterministic or stochastic, have been proposed in the literature to solve various types of vehicle routing problems. To cite a few, the authors of [13] proposed a self-adaptive framework for classical vehicle routing problems integrated into the local search heuristic algorithm. The authors of [14] proposed an adaptive large neighborhood search (ALNS) algorithm to solve a pick-up and delivery vehicle routing problem with stochastic demand.
There are numerous reasons for considering variable input data in a dynamic VRP (DVRP) setting. Various dynamic features that cause dynamism in the classical VRP can be defined as uncertain inputs (e.g., new requests or order cancellations, adjustments to order size or deadline, and increased travel time due to traffic congestion) or stochastic inputs (e.g., customer requests based on random variables). A comprehensive review of the dynamic elements in the literature review of the DVRP can be found in [15,16]. The authors of [17] re-examined more complex formulations due to the delay. The authors of [17,18] believe that DVRP implementations are more difficult in city logistics, where traffic jams and other events are more likely to disrupt routing plans. This situation may be critical when customers require same-day delivery, requiring a faster response time to their demands and traffic conditions. The authors of [19] generated modules to obtain real-time traffic data and predict travel times to assist decision makers at a hypothetical shipping company, and they integrated DVRPs into a DSS framework.
In the classic urban model, the courier serves shippers and customers on the same planning day with delivery, pick-up, or both. In other words, it optimizes the costs and benefits for various stakeholders globally, whereas city logistics aims to balance customer satisfaction with travel costs. The authors of [20] captured the transition from traditional retail logistics to complicated omnichannel logistics challenges, emphasizing retailers’ need to adjust their logistics strategies to meet the demands of high-level consumer experiences across multiple channels by examining 373 articles. The authors of [21] presented an innovative edge-based approach for the vehicle routing problem with time windows (VRPTW), integrating a graph attention network into a deep reinforcement learning model. The authors of [22] introduced a clustering-based routing heuristic (CRH) to optimize last-mile logistics for fresh food e-commerce by efficiently clustering demand nodes to improve delivery vehicle routing, diminishing the computational complexity and time to yield optimal solutions. The authors of [23] explored the vehicle routing problem with time windows (VRPTW) using a tabu search optimization technique and obtained the best-known solution for every instance of 38 benchmark instances. The authors of [24] developed a mixed-integer optimization model to solve the time-constrained capacitated vehicle routing problem (TCVRP) which is tailored to e-commerce parcel delivery vehicles, especially emphasizing electric vehicles (EVs) without the necessity for mid-route recharging.
This more holistic goal should consider the customer’s living conditions as they are affected by pollution and traffic congestion [25]. Pollution is not explicitly addressed in the DVRP documents reviewed. However, readers interested in green logistics can find information on the green VRPs (GVRPs) and pollution routing problems (PRPs) in [11]. Finally, some articles considered the priority of orders. In this case, orders that have been waiting in the system longer than others have higher priority the day after planning [26,27,28].
Unlike other cases, there are two types of couriers in this problem. The start and end points of the route for the first type of courier are the cross-docks. This type of courier transports HepsiJet shipments, which they pick up at a cross-dock and deliver to customers. Furthermore, they carry grocery orders by stopping at supermarket locations if their vehicle capacities and routes permit. The second type of courier picks up orders at the pocket warehouses that carry stock and delivers them to the final destinations. Pocket warehouse couriers have a single pocket warehouse as their starting and ending point, and they only carry pocket warehouse orders.
After the couriers start their routes, adding new HepsiJet orders to the routes is not possible. However, it is possible to create new mobile warehouse orders during the day. Pocket warehouse shipments that are newly created are dynamically assigned to couriers. The first stage of the project aims to transport fast delivery market shipments as pocket warehouse orders. The infrastructure has been designed so that any company that operates a pocket warehouse or store business model and stores stock can be considered a customer. Our problem differs because it involves two types of warehouses (cross-docks and pocket warehouses) and two levels of dynamic order types with time windows.

2.2. Capacity Planning with Machine Learning

In the transportation domain, machine learning methods based on regression models have been proposed for the prediction of the emission rates of vehicles for the capacitated vehicle routing problem [29,30], the correlation between the number of heavy goods vehicles and deliveries [31], driver deviation on routes [32], etc. There are various studies focused on last-mile food delivery systems. Using the number of locations, visiting area, distance, and dispersion, the travel time was predicted using different state-of-the-art regressors for last-mile delivery [33]. Also, regression models [34] are used to estimate the delivery demands of online orders.
For delivery capacity planning and service quality, only a few studies have been conducted to cope with congestion in transportation systems. To reduce the slack capacity in vehicles, a deep reinforcement learning algorithm, namely the deep Q network-based approach, has been proposed to assign shipments to the relevant couriers for efficient delivery [35]. In this capacity planning study, which the authors considered a multi-point pick-up and delivery problem with time intervals and transfers, they developed a crowd-sourced system in which the availability of the drivers to be able to deliver for a certain period is shared, and service requests are forwarded [36]. The authors of [34] used regression models to predict the delivery demands of orders placed over the Internet.
For capacity planning, several optimization-based solutions have been proposed in cases where the crowd-sourced delivery density of hundreds of billions of dollars of annual food orders is in question. In one of these studies, the authors of [37] suggested a solution for planning capacity based on the delivery area’s distances, payments per delivery for couriers, and delivery time to enhance multiple food deliveries in the short term. Machine learning research focusing on food delivery aims to predict the delivery time and minimize costs [38]. An early study [39] in the field of logistics used multiple forecasting methods (a moving average method, autoregressive (AR) model, and the autoregressive integrated moving average (ARIMA)) to forecast the delivery volumes for different products based on historical shipment data and input constraints. Therefore, in our previous works [9,40], state-of-the-art regression models were employed to predict the daily delivery capacity of a fleet starting their routes from a cross-dock depot and for a specific time slot. In another study, the authors of [41] developed a capacity planning platform to be used in many different service areas and offered to employees, selecting suitable service providers whose earnings are determined through fixed additional fees. A regression algorithm has been applied to the real-world capacity prediction problems of electricity load [42,43], pile bearing [44], and batteries [33].
Based on this thorough review of the literature, we can conclude that there are algorithms that solve standard VRPs and DPDTWVRPs separately. However, no framework has been presented yet to solve these two problems in a combined way which also includes capacity planning details. The scope of the problem addressed in this paper is comprehensive. This paper offers a framework for a solution that covers all the aspects of this problem.

3. Problem Definition

HepsiJet provides a crowd-sourced delivery service with over 2000 couriers working at more than 150 cross-docks. The delivery packages that reach the cross-docks in the last-mile process of the delivery operations are appropriated by the couriers and delivered to the recipient addresses. This last-mile operation can be described as a traditional static multi-vehicle single-depot vehicle routing problem. Within the scope of this paper, we will refer to these deliveries as standard deliveries. They include products which are already stocked in the satellite or regional warehouses of business partners and are suitable for fast delivery in a short period of time after an order is placed, along with standard cargo services.
The last-mile life cycle of standard deliveries begins when daily shipments arrive at the relevant cross-dock in ring vehicles. Packages arriving at the cross-docks are appropriated in the morning by crowd-sourced couriers, who then proceed with the deliveries and complete the life cycle when all packages are delivered. On the other hand, instant deliveries with hard time windows have a different process flow. This flow starts when the order reaches the relevant company cross-dock. Then, the order is assigned to a courier in the cross-dock either manually or automatically. The assigned courier must pick up the package at the pick-up point and deliver it to the recipient within the required time window.
In this paper, we address the combined problem of satisfying both workflows with a single set of couriers operating at the cross-dock level. In this setting, couriers who deliver standard packages may also be tasked with delivering instant delivery orders, and vice versa. The goal is to make the optimum use of any idle capacity the two separate fleets of couriers would have if they were to run their delivery operations independently. Within this context, and with the help of machine learning (ML)-based methods, we also aim to predict the number of time-windowed instant deliveries that the couriers can additionally distribute using their idle capacities at their respective cross-docks. Using ML, we predict in advance the number of shipments for each cross-dock in the coming days. Given these predictions, the number of instant deliveries that a cross-dock can commit to with its idle capacity is then revealed.
In the next subsection, we present a mathematical model for the combined route optimization problem. In the Methodology section, we outline a heuristic algorithm to solve this routing problem and also detail our ML-based solution for the capacity planning problem.

Mathematical Model

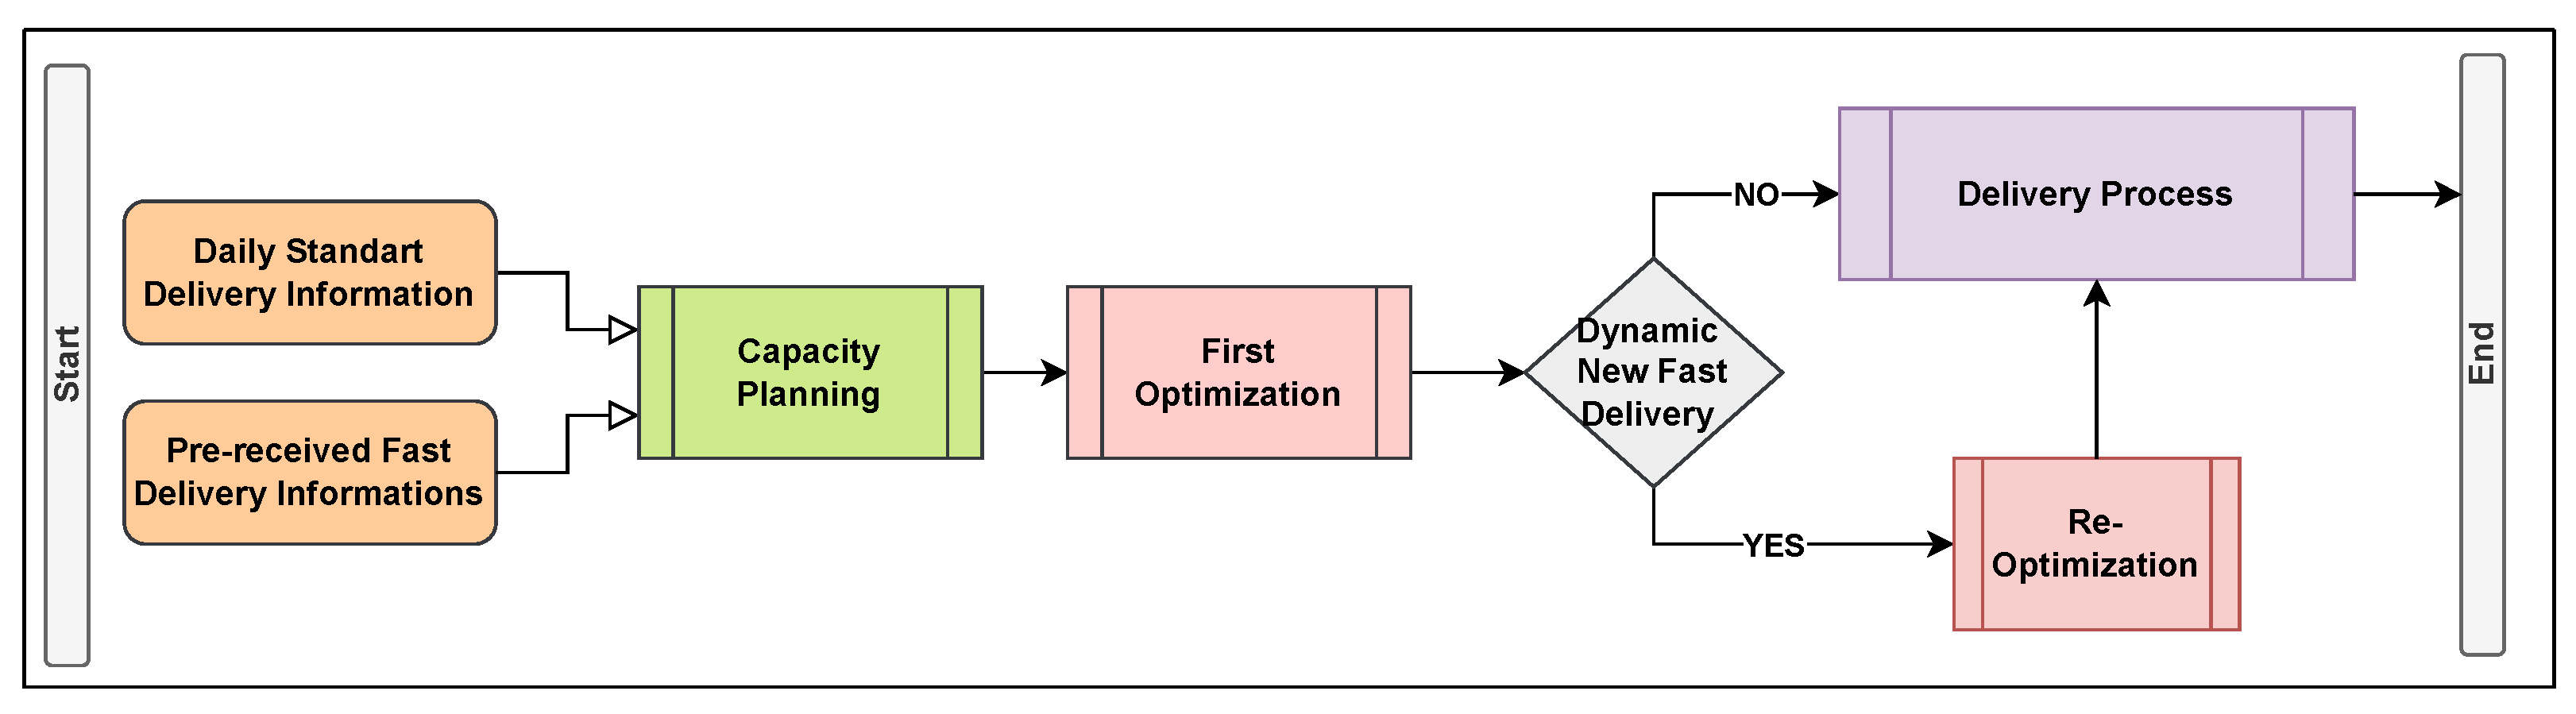
We developed a mixed-integer linear programming model for the combined route optimization problem, considering time windows and a unified fleet of couriers that can dynamically deliver both order types. We account for the possibility that additional optimizations can take place during the day for building or updating daily routes from this point on. Deliveries that are not previously completed at the time of optimization are included, along with any instant delivery orders received in the meantime. As a result, couriers start at the cross-dock depot but do not return there except at the end of the day after all deliveries are completed. Packages loaded onto a vehicle at the cross-dock in the morning stay on the same vehicle until delivered. Each optimization (from the second round on) considers the last known completed delivery location of a courier as the starting location for their new route.
We provide below the mathematical model representing this problem along with the notation, as well as the model parameters and decision variables.
  • Parameters
  • V: set of all couriers;
  • N s : delivery nodes for standard orders, where N s = { 1 , , n 1 } ;
  • N p : pick-up nodes for instant orders, where N p = { n 1 + 1 , , n 1 + n 2 } ;
  • N q : delivery nodes for instant orders, where N q = { n 1 + n 2 + 1 , , n 1 + 2 n 2 } ;
  • N 0 = { 0 } : cross-dock (starting) node k V (first optimization);
  • N d k : departure node of courier k V (subsequent optimizations);
  • N: set of all nodes, where N = N s N p N q N 0 N d k ;
  • d: first optimization indicator, which is one for the first optimization and zero otherwise;
  • T: remaining time until the end of the delivery period;
  • w i : revenue or profit per delivery obtained by delivering to node i;
  • c i j , t i j : driving cost and driving time from node i to j, respectively;
  • s i : required service (pick-up or drop-off) time at node i;
  • a i , b i : time window’s lower and upper limits for node i, respectively;
  • g i : one if the deadline for delivery i is today and zero otherwise;
  • l i : late delivery cost for delivery i;
  • Y i k : one if d = 0 and node i’s delivery package was loaded onto vehicle k in the first optimization and zero otherwise;
  • α , β , γ : objective function weights for revenue or profit generated from deliveries, total cost of delivery, and late delivery penalties, respectively.
  • Decision Variables
  • x i j k : one if vehicle k travels from node i to j and zero otherwise;
  • D i : one if delivery at node i has not been made and zero otherwise;
  • A i : arrival time of the vehicle for delivery at node i.
  • Mathematical Model
max α i N s N q j N k V w i x j i k β i , j N k V c i j x i j k γ i N s N e g i l i D i
i N j N t i j + s j     x i j k T k V
i N k N d k x 0 i k = d k V
i N s N p N q N 0 x j i k = 1 d k V , j N d k
i N x i 0 k = 1 k V
i N k V x i j k 1 j N s N p N q
j N k N d k k V x i j k 1 i N s N p N q
i N k V x i j k = i N k V x j i k j N
A i + s i + t i j A j + M 1 x i j k i , j N , k V
A i A i + n 2 i N p
a i A i b i i N
j N { 0 } x j i k Y i k ( 1 d ) i N s , k V
D i = 1 k V j N x i j k i N s N q
s i = 0 i N d k N 0
A i = 0 i N d k N 0
The objective function in Equation (1) optimizes the weighted combination of the total revenue or profit generated from the deliveries, the total cost of transportation, and the penalties for late deliveries. According to the constraints in Equation (2), the total time spent by each courier driving to and delivering at all locations visited cannot exceed the remaining time until the end of the day. The constraints in Equation (3) ensure that all couriers start from the cross-dock in the first optimization. In subsequent optimization(s), the last known position of each vehicle is taken as the starting location. The constraints in Equation (4) satisfy the couriers’ departure from their last-known locations for reoptimization(s). Return to the warehouse for every courier is ensured by the constraints in Equation (5). One-time visiting and departing delivery points is provided by the constraints in Equations (6) and (7), respectively. The constraints in Equation (8) ensure that the number of exits should equal the number of arrivals at a location. The constraints in Equation (9) maintain the iterative calculation of the arrival times for each point with respect to both the service times and travel times. The constraints in Equation (10) ensure that products are picked up before they are delivered for instant delivery orders. Instant delivery orders must be delivered within a certain time window, which is ensured by Equation (11). Standard deliveries loaded in the first optimization are delivered by the same vehicle according to the constraints in Equation (12). For cost calculation purposes, a variable to keep track of the deliveries made is defined by the constraints in Equation (13). Finally, the constraints in Equations (14) and (15) set the starting times for the departure nodes as well as the zero service times at these nodes.

4. Methodology

4.1. Vehicle Routing Problem

The k-opt algorithm is the first local improvement method used during optimization. This algorithm aims to reduce the total route time by changing the order of a courier’s planned deliveries. Here, k represents the number of connections between nodes in a single route that will be removed and connected differently. For example, if k = 3 , then a better solution (in terms of a shorter route time) is sought in all combinations of removing 3 connections from the route and reconnecting the affected nodes by adding 3 different connections. If there is no better solution as a result of this operation, the node sequence is said to be 3-optimal. The k-opt algorithm improves each courier’s route individually, but it operates in a limited solution space because it does not allow node transfers between couriers. This means a node oddly included in a route will never leave the route, leading to a suboptimal solution. To address this issue, we implemented node transfer mechanisms in which couriers transfer or exchange their delivery nodes to or with one another. These are classified into different types based on the number of nodes transferred and the methods used to select the couriers to and from which the transfer will be made. During this node transfer stage, the optimization criterion is to minimize the sum of all couriers’ route times. Algorithm 1 below outlines this entire process.
Algorithm 1 Route Optimization Steps
 1:
Add first nodes to all vehicles                ▹ Initialize routes
 2:
Add standard nodes to suitable vehicles
 3:
Add marketplace nodes to suitable vehicles
 4:
while further addition possible do     ▹ Iterate until no more additions
 5:
     Replace standard nodes with marketplace nodes if needed
 6:
     Add standard nodes to suitable vehicles
 7:
     while route improvement possible do
 8:
          Apply k-opt to each vehicle
 9:
          Apply node transfers between vehicles
10:
     end while
11:
end while
We implemented 8 different node transfer types as follows:
  • nt1FromMax chooses one node from the vehicle with the maximum total time and transfers it to another vehicle.
  • nt1ToMin transfers a node from any vehicle to the vehicle with the minimum total time.
  • nt2FromMax is similar to nt1FromMax, but two nodes are chosen and transferred.
  • In nt2Mutual, two vehicles are chosen, and then a node transfer is made between them.
  • In nt2Seq, a node transfer is made between 3 vehicles, where one node is transferred from the first vehicle to the second and another node is transferred from the second vehicle to the third.
    The last three transfer types include marketplace posts:
  • ntMr1 chooses a marketplace node and transfers it to another vehicle.
  • ntMrAll chooses all nodes of a randomly chosen marketplace for another vehicle.
  • ntMrAllMutual chooses two vehicles, and all nodes of a chosen marketplace for these vehicles are transferred between the vehicles.
The variety of node transfer mechanisms in routing optimization, such as single, dual, and sequential three-node transfers, along with marketplace-based approaches, offer enhanced flexibility in route management. This variety allows for specific maneuvers that might not be possible with a single type of transfer, accommodating different operational scenarios and enabling more adaptive and efficient route adjustments. Consequently, this flexibility plays a crucial role in minimizing the total route times of couriers, leading to more effective and dynamic optimization in routing scenarios. These node transfer mechanisms are executed sequentially in the order shown in Algorithm 2. When a successful (i.e., time-reducing) node transfer is made, the execution restarts from the beginning. The transfer steps continue until no new transfer can produce an improved solution.
Algorithm 2 Node Transfers for Route Optimization
 1:
while potential for improvement exists do
 2:
      try nt1FromMax           ▹ Transfer from max route
 3:
      try nt1ToMin             ▹ Transfer to min route
 4:
      try nt2FromMax            ▹ 2-node transfer from max
 5:
      try nt2Mutual              ▹ Mutual 2-node transfer
 6:
      try nt2Seq             ▹ Sequential 2-node transfer
 7:
      try ntMr1       ▹ Marketplace node transfer for 1 node
 8:
      try ntMrAll     ▹ Marketplace node transfer for all nodes
 9:
      try ntMrAllMutual    ▹ Mutual marketplace node transfer
10:
end while

4.2. Capacity Planning

In this work, an approach for delivery capacity prediction is developed in which the delivery information of the cross-docks is utilized to predict the daily capacity of a fleet that starts its routes from a cross-dock depot in a specific time slot. The first step in the approach is data preparation, which includes removing outliers, constructing feature vectors, and aggregating data on a daily basis. In the second stage, numerous attributes for each cross-dock during each time interval are determined, containing deliveries completed in a single day, three days, and one week. After the extraction phrase, a training dataset is composed, enclosing all the deliveries from all the cross-docks for each interval during a training period. The initial regression model is then trained to utilize this comprehensive dataset.

4.2.1. Data Preparation

For the data preparation step, the deliveries are aggregated daily, and the samples including null values are dropped. In this step, the raw features listed in Table 1 are also selected by analyzing the data in terms of the rate of null values, the number of unique values, and the reliability of the prediction performance using simple experiments. The raw features that are processed at this stage include the cross-dock, time slot, delivery ID, courier ID, date, district, and delivery address.

4.2.2. Feature Extraction

In the feature extraction process in our previous works [9,40] for the capacity planning stage, we incorporated time-based features (such as the day of the week, month, year, and special days like B l a c k   F r i d a y and C h r i s t m a s ). Also, we aggregated historical deliveries from the same cross-dock with the same time slot over the last day, the last 3 days, and the last week. These aggregated data were then included in the feature set, resulting in the generation of a total of 32 features. The aggregated features consisted of several components: the number of deliveries and couriers who worked actively on that day, the count of unique districts and addresses to which the deliveries were made, and the average as well as the maximum number of deliveries completed by a single courier.

4.2.3. Feature and Model Selection

The most discriminative features and the best model were selected by considering the reliability of the regression for capacity prediction. This process was also used to generate a shared regression model for all the cross-docks. For the regression model on the cross-docks, after analyzing the p values of the features, those that were less than 0.05 were selected as the most suitable features for the regression model (Table 2).
The deliveries were distributed across the cross-dock’s bound regions that were allocated to a limited time slot between the preferred earliest pick-up time and the latest delivery time. The couriers of the cross-dock also had limited time and capacity.
For prediction of the total daily delivery capacity regarding cross-docks and time slots, the proposed approach, which is the extended version of our previous work [9], is composed of the steps demonstrated in Figure 1: (1) data preparation for analysis of the raw delivery data and removal of outliers, (2) selection of the raw features to be used in modeling, (3) extraction of time-based and aggregated features for regression, based on the historical data of the cross-dock in all the slots, (4) feature selection, (5) model selection using a number of state-of-the-art algorithms with the best parameters, (6) generation of the capacity prediction model, and (8) updating of the selected model to learn recent data and adapt to unexpected changes on a daily basis. Furthermore, several regression models were investigated to predict the delivery capacity. These regression algorithms were gradient boosting tree regression (GBT), Gaussian process regression (GPR) [45], the XGBoost regressor, linear regression (LR), random forest regressor (RFR), multilayer perceptron (MLP) regression, and the support vector regressor (SVR), which were compared in the model selection process [40]. The algorithms were used with their best hyper-parameter sets estimated using the selected set. The GBT model outperformed other regression models for predicting the cross-dock delivery capacity.

4.3. System Integration

We developed a fully integrated system that brings together all the elements of this solution framework in Figure 2. Our design involves a thorough analysis of each component to ensure they work together seamlessly. With this system design, machine learning-based capacity estimation, estimation of the number of packages on the relevant days, and fast deliveries with dynamic pick-up and delivery time windows that can be distributed in addition to standard packages will be accepted. This system, which starts with predicting the number of packages for the following days, will end with the distribution of all packages during the day in the order prescribed by the optimization model. The number of packages for the following days will be predicted one week in advance. Forecasts will be updated as we approach the corresponding day. With these updates, the accuracy of the estimation of the relevant day will increase as the future day approaches, and accordingly, the calculation of the additional capacity will become more efficient. Following capacity planning and the acceptance of additional shipments to the extent permitted by the capacity, all steps will be listed with route optimization before the courier departs, using the information of all known shipments at the beginning of the relevant day (both regular TSP packages and time-windowed pick-up and delivery packages).
In order to answer the question of how many dynamic pick-up and delivery shipments are equivalent to the free capacity of the couriers from the standard shipments, the total delivery times of the randomly selected past 1000 pick-up and delivery orders were prepared as a sample set. Regarding all these orders, the distribution times were calculated with a random standard delivery location as a departure point. The pick-up service time, delivery service time, and travel time were summed to obtain an artificial total delivery time for each order. The average instant delivery time was calculated for each cross-dock set. A safety time of 15% was added to the calculated cross-dock-based average time.

Simulation

To represent the service time variability, the best-fitting probability distribution application was used to model each package service time. During the selection of the most suitable distribution, a sample was created with the one-day all delivery service times of 300 couriers. A Python package called FITTER was implemented and used to find the first five best-fitting distributions for all courier deliveries with respect to the sum squared errors from the following list:
  • Cauchy;
  • Chi2;
  • Exponential;
  • Exponpow;
  • Gamma;
  • Lognorm;
  • Normal;
  • Powerlaw;
  • Rayleigh;
  • Uniform.
The distributions created with the best-fitting parameters were ranked according to the sum square errors for the 300 courier day samples. As a result of the best-fitting tests, the Cauchy distribution was identified as the best-fitting distribution for 84% of the courier day samples. The Gamma distribution and normal distribution followed with 8% and 6%, respectively. In the context of these results, the Cauchy distribution was selected as the most suitable one for modeling all cross-docks.

5. Computational Results

To the best of our knowledge, our model is the first to combine the problem of pick-up and delivery with time windows with a standard VRP in an application setting. As a result, there was no test data set available to benchmark this particular use case. To address this, we designed a three-stage computational study to demonstrate the effectiveness of our proposed solution. In the first stage, we demonstrate that our solution can result in cost reductions in a company’s operations in comparison with its existing routing solutions in place. In the second stage, we test the performance of our solution, which is uniquely designed for our integrated problem, using Solomon’s VRPTW instances. This is clearly not ideal, as our solution is not highly optimized or tuned for those instances but rather designed to address the more generalized integrated problem. Yet, it should give us insight into its performance in general. Finally, we generate a complete 1 day data set simulated from the company’s operational data and use our solution to solve it. Since we do not have an optimal solution as a ground truth to compare it against, we publish this data set and the corresponding routing solution we obtained for future researchers to benchmark against. The details for each experiment are given in the relevant sections below.

5.1. Experiment 1

In the early stages of HepsiJet, the last-mile operations were not following a structured routing optimization system. Couriers delivered the packages with respect to their neighborhood know-how. If the process is considered from the route optimization point of view, the problem reduces to single-vehicle route optimization. Before the vehicle departs, it receives all deliveries’ custody from the cross-dock representative and then stops at every delivery point. In the first phases of operations at HepsiJet, distributions are carried out at the discretion of the couriers without benefiting from route optimization. Before using route optimization, we could access the kilometers traveled by the transporter, as a database of information was kept in which we could follow the movements of the transporter. When the daily shipment distribution order of the couriers taken from the database is analyzed, it can be seen that the couriers sort and distribute the shipments based on their own district, neighborhood, and environment know-how. However, by optimizing the distribution order of the transporters using route optimization, it is possible to reduce the time spent on distribution, as well as travel and gasoline costs. The setting was modeled as a TSP problem since the orders to be distributed by each courier during the day were, certain and these points were visited at least once a day. This experiment focused on the cost reduction that the company would have achieved if these early distributions had benefited from the route optimization algorithm proposed in this article.
In order to analyze the cost reduction opportunity, the information of the shipments delivered by 10 couriers from each of 12 cross-docks intuitively for 10 days and without using route optimization was obtained. In light of this information, the mileage traveled by the transporters was calculated using the distribution order. Then, the regular shipments of each courier were optimized with a k o p t -based heuristic algorithm and customized forehead algorithm within the framework of this paper. These optimization outputs’ distance and time costs were compared with the actual non-optimized distribution costs. In the context of this comparison, a cost reduction of almost 9 % was observed in terms of the total distance traveled by the company’s couriers. A cost reduction of the same rate was also observed in terms of travel time. It can be estimated that the distance traveled by the relevant couriers will decrease by an average of 20 km per day if the route optimization output were to be used. The results of this experiment are shown in Table 3.

5.2. Experiment 2

The algorithm proposed in this paper has rather complex properties when compared with the classical simple vehicle routing problem. As a result, some questions can occur regarding the measurability of the routing algorithm’s performance. In order to test the performance and effectiveness of the route optimization model developed for this paper, a performance analysis was conducted on the most cited routing sample problem set. The Solomon benchmark sets, one of the most used data sets, was used since there is not yet a benchmark test covering all the features for the unique problem that was aimed to be solved in this framework. The problem set used was first produced in [46] to test the time-windowed vehicle routing problems and then adapted to many different problem types. The solutions for problems of type R are shown in Table 4, while the solutions for problems of type RC are shown in Table 5.

5.3. Experiment 3

In this study, a detailed experiment was carried out for the pilot implementation and performance measurement of the proposed framework. Simulation data for two cross-docks for 1 day were prepared for two problems of different sizes. Within the framework of this study, an initial optimization was obtained with multi-vehicle route optimization for all the instant deliveries and standard deliveries known to the cross-dock at the beginning of the working day. Then, the distribution simulation was performed until a new instant order was received, taking into account the service times and travel times. The optimization was updated with the new order information every time new order information came in. New dynamic orders coming within the framework of the simulation were dynamically assigned to the couriers, and the distribution simulation continued. While there are 19 couriers in one cross-dock, the other one amounted to only 3. Consequently, a total of 788 and 73 standard packages were distributed by these cross-docks, respectively. Each cross-dock served two different markets. In addition, 179 and 18 market shipments were simulated during the day, respectively. All optimizations for a cross-dock with 19 couriers had a run time of 19 min. For the three-courier problem simulation, the total optimization run time was 84 s. For both sets of experiments, it can be seen that the couriers distributed all the shipments within the framework of their capacities, and in addition, the couriers in these fleets were crowd-sourced, meaning that they were paid based on the number of packages they collected and delivered. It can also be observed that the total distances traveled by the transporters were relatively uniform. The results for the problem with 19 couriers are shown in Table 6, while the results for the problem with three are shown in Table 7.
For the problem of capacity planning, the proposed GBT regression model performance is illustrated in Figure 3 for delivery capacity predictions in April. The overall R 2 value of the capacity prediction model was 0.816 . The average R M S E values for each cross-dock are given in Table 8, and the best prediction was obtained from cross-dock 2.
To measure the distance reduction that led to cost reduction provided by the framework, we conducted additional experiments on the dataset used in Experiment 3. Our approach was based on the assumption that there were enough hypothetical discrete carriers that could deliver fast deliveries with time windows. In this scenario, cross-dock couriers would handle regular deliveries, while hypothetical couriers would handle fast time-framed deliveries. Table 9 shows a 33.5% distance reduction for the full dataset, indicating that the proposed approach satisfied a significant amount of cost reduction. Additional fixed and overhead costs for the hypothetical couriers need to be considered for real-life cost reduction calculations.

6. Conclusions and Future Works

We proposed a novel framework for planning and increasing the efficiency of a unique delivery operation system that handles both standard and instant deliveries in a dynamic fashion with specified time windows. Our framework consists of an initial capacity planning phase, followed by a routing optimization phase. In the capacity planning phase, we presented a method combining a regression algorithm and a simulation methodology for planning of the daily delivery capacity. We demonstrated the performance of the gradient boosting tree (GBT) regression model, which gave better performance than several state-of-the-art alternatives for most of the cross-docks in the previous work. In the routing phase, the offered heuristic algorithm consists of special k o p t and node transfer operation variations. The performance of the algorithm developed for this particular problem was assessed over the Solomon benchmark instances. Our computational results demonstrate the efficiency and cost reduction provided to the company by implementing our proposed approach. The computational results indicate more than 30% distance reduction, suggesting that the proposed approach satisfies a substantial cost reduction and efficiency for combining two distinct delivery operations. In future work, the driver-based prediction capability of the delivery number and time will be developed and integrated with the route optimization module.

Author Contributions

Conceptualization, E.T.K., S.C., B.B. (Barış Bayram), G.A., B.B. (Burcin Bozkaya) and R.A.-T.; methodology, E.T.K., S.C., B.B. (Barış Bayram), B.B. (Burcin Bozkaya) and R.A.-T.; software, E.T.K., S.C. and B.B. (Barış Bayram); validation, E.T.K., S.C. and B.B. (Barış Bayram); formal analysis, E.T.K., S.C. and B.B. (Barış Bayram); investigation, E.T.K., S.C., B.B. (Barış Bayram) and B.B. (Burcin Bozkaya); resources, E.T.K., S.C., B.B. (Barış Bayram) and G.A.; data analysis, E.T.K., S.C. and B.B. (Barış Bayram); writing—original draft preparation, E.T.K., S.C., B.B. (Barış Bayram), G.A., B.B. (Burcin Bozkaya) and R.A.-T.; writing—review and editing, E.T.K., S.C., B.B. (Barış Bayram), G.A., B.B. (Burcin Bozkaya) and R.A.-T.; visualization, E.T.K., S.C. and B.B. (Barış Bayram); supervision, G.A., B.B. (Burcin Bozkaya) and R.A.-T.; project administration, G.A. and E.T.K.; funding acquisition, G.A. All authors have read and agreed to the published version of the manuscript.

Funding

The research by HepsiJet (D Fast Dağıtım Hizmetleri ve Lojistik A.Ş) was carried out at the HepsiJet Research and Development Center with financial support from The Scientific and Technological Research Council of Türkiye (TÜBİTAK) (Grant No: 3191204 and 119C147).

Data Availability Statement

The data used to identify and analyze the problem in this paper are available publicly for further research purposes. It is important to note that the data are readily accessible and can be utilized by other researchers who are interested in further exploring the issues addressed in this paper. By making the data publicly available, we hope to encourage other researchers to build upon our findings and contribute to the overall understanding of the problem. Furthermore, additional research and analysis can lead to the development of new and innovative solutions that can further benefit society as a whole. GitHub Link: https://github.com/tolkup/HXDynamicVehicleRoutingProblems.

Conflicts of Interest

The authors declare no conflicts of interest.

References

  1. OECD. OECD Economic Outlook, Volume 2020 Issue 2; OECD: Paris, France, 2020. [Google Scholar] [CrossRef]
  2. Viu-Roig, M.; Alvarez-Palau, E.J. The Impact of E-Commerce-Related Last-Mile Logistics on Cities: A Systematic Literature Review. Sustainability 2020, 12, 6492. [Google Scholar] [CrossRef]
  3. OECD. E-commerce in the time of COVID-19. OECD Policy Responses to Coronavirus (COVID-19); OECD: Paris, France, 2020. [Google Scholar]
  4. Sharma, A.J.; Jhamb, D. Changing Consumer Behaviours towards Online Shopping—An Impact of COVID-19. Acad. Mark. Stud. J. 2020, 24, 1–10. [Google Scholar]
  5. Pantano, E.; Pizzi, G.; Scarpi, D.; Dennis, C. Competing during a pandemic? Retailers’ ups and downs during the COVID-19 outbreak. J. Bus. Res. 2020, 116, 209–213. [Google Scholar] [CrossRef] [PubMed]
  6. Isik, S.; İbiş, H.; Gulseven, O. The Impact of the COVID-19 Pandemic on Amazon’s Business. Econ. Netw. eJournal 2021, 1–10. [Google Scholar]
  7. Toktaş-Palut, P. Analyzing the effects of Industry 4.0 technologies and coordination on the sustainability of supply chains. Sustain. Prod. Consum. 2022, 30, 341–358. [Google Scholar] [CrossRef]
  8. Barış, A.; Yılmaz, T. Consumers’ Perceptions of Online Grocery Applications: “Getir” A Case study in Turkey. Maltepe Univ. IletişIm Fak. Derg. 2021, 8, 206–228. [Google Scholar]
  9. Bayram, B.; Ülkü, B.; Aydın, G.; Akhavan-Tabatabaei, R.; Bozkaya, B. A Machine Learning Approach to Daily Capacity Planning in E-Commerce Logistics. In Proceedings of the Machine Learning, Optimization, and Data Science; Nicosia, G., Ojha, V., La Malfa, E., La Malfa, G., Jansen, G., Pardalos, P.M., Giuffrida, G., Umeton, R., Eds.; Springer: Cham, Switzerland, 2022; pp. 45–50. [Google Scholar]
  10. Lahyani, R.; Khemakhem, M.; Semet, F. Rich vehicle routing problems: From a taxonomy to a definition. Eur. J. Oper. Res. 2015, 241, 1–14. [Google Scholar] [CrossRef]
  11. Lin, C.; Choy, K.L.; Ho, G.T.S.; Chung, S.H.; Lam, H.Y. Survey of Green Vehicle Routing Problem: Past and future trends. Expert Syst. Appl. 2014, 41, 1118–1138. [Google Scholar] [CrossRef]
  12. Braekers, K.; Ramaekers, K.; Nieuwenhuyse, I.V. The vehicle routing problem: State of the art classification and review. Comput. Ind. Eng. 2016, 99, 300–313. [Google Scholar] [CrossRef]
  13. Alabas-Uslu, C.; Dengiz, B. A self-adaptive local search algorithm for the classical vehicle routing problem. Expert Syst. Appl. 2011, 38, 8990–8998. [Google Scholar] [CrossRef]
  14. Zhu, L.; Sheu, J.B. Failure-specific cooperative recourse strategy for simultaneous pickup and delivery problem with stochastic demands. Eur. J. Oper. Res. 2018, 271, 896–912. [Google Scholar] [CrossRef]
  15. Psaraftis, H.N.; Wen, M.; Kontovas, C.A. Dynamic vehicle routing problems: Three decades and counting. Networks 2016, 67, 3–31. [Google Scholar] [CrossRef]
  16. Abbatecola, L.; Fanti, M.P.; Ukovich, W. A review of new approaches for Dynamic Vehicle Routing Problem. IEEE Access 2016, 8, 361–366. [Google Scholar] [CrossRef]
  17. Pillac, V.; Gendreau, M.; Gueret, C.; Medaglia, A.L. A review of dynamic vehicle routing problems. Eur. J. Oper. Res. 2013, 225, 1–11. [Google Scholar] [CrossRef]
  18. Kim, G.; Ong, Y.S.; Cheong, T.; Tan, P.S. Solving the Dynamic Vehicle Routing Problem Under Traffic Congestion. IEEE Trans. Intell. Transp. Syst. 2016, 17, 2367–2380. [Google Scholar] [CrossRef]
  19. Barcelo, J.; Grzybowska, H.; Barceló, J. Decision support system for real-time urban freight Management. In Proceedings of the 7th International Conference on City Logistics Procedia—Social and Behavioral Sciences, Mallorca, Spain, 7–9 June 2012; Volume 39, pp. 712–725. [Google Scholar]
  20. Risberg, A. A systematic literature review on e-commerce logistics: Towards an e-commerce and omni-channel decision framework. Int. Rev. Retail. Distrib. Consum. Res. 2023, 33, 67–91. [Google Scholar] [CrossRef]
  21. Zhang, Y.; Wang, J.; Zhang, Z. Edge-based Formulation with Graph Attention Network for Practical Vehicle Routing Problem with Time Windows. In Proceedings of the 2022 International Joint Conference on Neural Networks (IJCNN), Padua, Italy, 18–23 July 2022; pp. 1–8. [Google Scholar] [CrossRef]
  22. Prajapati, D.; Harish, A.R.; Daultani, Y.; Singh, H.; Pratap, S. A Clustering Based Routing Heuristic for Last-Mile Logistics in Fresh Food E-Commerce. Glob. Bus. Rev. 2023, 24, 7–20. [Google Scholar] [CrossRef]
  23. Demir, H.B.; Özmen, E.P.; Esnaf, S. Time-Windowed Vehicle Routing Problem: Tabu Search Algorithm Approach. ADCAIJ Adv. Distrib. Comput. Artif. Intell. J. 2022, 11, 179. [Google Scholar] [CrossRef]
  24. Cokyasar, T.; Subramanyam, A.; Larson, J.; Stinson, M.; Sahin, O. Time-Constrained Capacitated Vehicle Routing Problem in Urban E-Commerce Delivery. Transp. Res. Rec. 2023, 2677, 190–203. [Google Scholar] [CrossRef]
  25. Kim, G.; Ong, Y.S.; Heng, C.K.; Tan, P.S.; Zhang, N.A. City Vehicle Routing Problem (City VRP): A Review. IEEE Trans. Intell. Transp. Syst. 2015, 16, 1654–1666. [Google Scholar] [CrossRef]
  26. Ferrucci, F.; Bock, S.; Gendreau, M. A pro-active real-time control approach for dynamic vehicle routing problems dealing with the delivery of urgent goods. Eur. J. Oper. Res. 2013, 225, 130–141. [Google Scholar] [CrossRef]
  27. De Armas, J.; Melián-Batista, B. Constrained dynamic vehicle routing problems with time windows. Soft Comput. 2015, 19, 2481–2498. [Google Scholar] [CrossRef]
  28. Albareda-Sambola, M.; Fernández, E.; Laporte, G. The dynamic multiperiod vehicle routing problem with probabilistic information. Comput. Oper. Res. 2014, 48, 31–39. [Google Scholar] [CrossRef]
  29. Xiao, Y.; Zhao, Q.; Kaku, I.; Xu, Y. Development of a fuel consumption optimization model for the capacitated vehicle routing problem. Comput. Oper. Res. 2012, 39, 1419–1431. [Google Scholar] [CrossRef]
  30. Kouridis, C.; Gkatzoflias, D.; Kioutsioukis, I.; Ntziachristos, L.; Pastorello, C.; Dilara, P. Uncertainty estimates and guidance for road transport emission calculations. Publ. Off. Eur. Union EUR 2010, 24296. [Google Scholar]
  31. Daniela, P.; Paolo, F.; Gianfranco, F.; Graham, P.; Miriam, R. Reduced urban traffic and emissions within urban consolidation centre schemes: The case of Bristol. Transp. Res. Procedia 2014, 3, 508–517. [Google Scholar] [CrossRef]
  32. Li, Y.; Phillips, W. Learning from Route Plan Deviation in Last-Mile Delivery. 2018. Available online: https://dspace.mit.edu/handle/1721.1/118135 (accessed on 11 May 2021).
  33. Liu, K.; Hu, X.; Wei, Z.; Li, Y.; Jiang, Y. Modified Gaussian process regression models for cyclic capacity prediction of lithium-ion batteries. IEEE Trans. Transp. Electrif. 2019, 5, 1225–1236. [Google Scholar] [CrossRef]
  34. Fabusuyi, T.; Twumasi-Boakye, R.; Broaddus, A.; Fishelson, J.; Hampshire, R.C. Estimating small area demand for online package delivery. J. Transp. Geogr. 2020, 88, 102864. [Google Scholar] [CrossRef] [PubMed]
  35. Ahamed, T.; Zou, B.; Farazi, N.P.; Tulabandhula, T. Deep Reinforcement Learning for Crowdsourced Urban Delivery: System States Characterization, Heuristics-guided Action Choice, and Rule-Interposing Integration. arXiv 2020, arXiv:2011.14430. [Google Scholar]
  36. Sampaio, A.; Savelsbergh, M.; Veelenturf, L.P.; Woensel, T.V. Delivery systems with crowd-sourced drivers: A pickup and delivery problem with transfers. Networks 2020, 76, 232–255. [Google Scholar] [CrossRef]
  37. Yildiz, B.; Savelsbergh, M. Service and capacity planning in crowd-sourced delivery. Transp. Res. Part C Emerg. Technol. 2019, 100, 177–199. [Google Scholar] [CrossRef]
  38. Moghe, R.P.; Rathee, S.; Nayak, B.; Adusumilli, K.M. Machine Learning based Batching Prediction System for Food Delivery. In Proceedings of the 3rd ACM India Joint International Conference on Data Science &Management of Data (8th ACM IKDD CODS & 26th COMAD), Bangalore, India, 2–4 January 2021; pp. 316–322. [Google Scholar]
  39. Yonekawa, A.; Hirayama, J.; Ojiro, D.; Ara, K.; Shimazu, Y. Logistics Prediction System and Prediction Method. US Patent 11,004,018, 11 May 2021. [Google Scholar]
  40. Küp, B.Ü.; Bayram, B.; Türkmen, A.D.; Küp, E.T.; Tabatabaei, R.A.; Bozkaya, B. Capacity planning in e-commerce logistics using a hybrid machine learning model. In Proceedings of the 2023 Innovations in Intelligent Systems and Applications Conference (ASYU), Sivas, Turkey, 11–13 October 2023; pp. 1–6. [Google Scholar]
  41. Gurvich, I.; Lariviere, M.; Moreno, A. Operations in the On-Demand Economy: Staffing Services with Self-Scheduling Capacity; Springer: Cham, Switzerland, 2019; pp. 249–278. [Google Scholar]
  42. Mahajan, A.S.; Shrivastav, A. Short Term Load Forecasting based on Regression models. In Proceedings of the 2023 International Conference for Advancement in Technology (ICONAT), Sunny Beach, Bulgaria, 24–26 January 2023; pp. 1–8. [Google Scholar]
  43. Tran, N.T.; Tran, T.T.G.; Nguyen, T.A.; Lam, M.B. A new grid search algorithm based on XGBoost model for load forecasting. Bull. Electr. Eng. Inform. 2023, 12, 1857–1866. [Google Scholar] [CrossRef]
  44. Momeni, E.; Dowlatshahi, M.B.; Omidinasab, F.; Maizir, H.; Armaghani, D.J. Gaussian process regression technique to estimate the pile bearing capacity. Arab. J. Sci. Eng. 2020, 45, 8255–8267. [Google Scholar] [CrossRef]
  45. Le, L.T.; Nguyen, H.; Zhou, J.; Dou, J.; Moayedi, H. Estimating the heating load of buildings for smart city planning using a novel artificial intelligence technique PSO-XGBoost. Appl. Sci. 2019, 9, 2714. [Google Scholar] [CrossRef]
  46. Solomon, M.M. Algorithms for the Vehicle Routing and Scheduling Problems with Time Window Constraints. Oper. Res. 1987, 35, 254–265. [Google Scholar] [CrossRef]
Figure 1. The proposed approach for system integration.
Symmetry 16 00505 g001
Figure 2. The proposed approach for predicting the total daily delivery capacity.
Symmetry 16 00505 g002
Figure 3. Actual and predicted daily total capacity values.
Symmetry 16 00505 g003
Table 1. Raw features and their descriptions.
Input FeatureDescription
xdock_idIdentifier for the cross-dock facility
slotSpecific time interval within a day
dow, dom, doyDay of week, month, and year for the current day, respectively
moyMonth of the year for the current day
dow_yest, dom_yest, doy_yestDay of the week, month, and year for the previous day, respectively
moy_yestMonth of the year for the previous day
delivery_idIdentifier for the delivery
courier_idIdentifier for the courier
address_idIdentifier for the delivery address
district_idIdentifier for the district of the delivery address
delivery_attemptCount of attempts made for the delivery until successful
ontimeIndicator of whether the delivery was made on time or not
Table 2. Selected features and their descriptions.
Input FeatureDescription
xdock_idIdentifier for the each cross-dock
slotSpecific time interval within a day
dowDay of week for the target prediction day
total_del_num_yestCount of deliveries made yesterday
mean_district_num_yestMean number of districts delivered yesterday
mean_attempt_num_yestMean delivery attempts made by all couriers yesterday
mean_capacity_yestMean deliveries of all couriers yesterday
max_capacity_yestMaximum deliveries made by a courier yesterday
mean_total_del_num_3dMean total deliveries made in the last 3 days
mean_courier_num_3dMean courier count in the last 3 days
mean_attempt_num_3dMean number of delivery attempts in the last 3 days
mean_address_num_3dMean number of unique addresses in the last 3 days
mean_capacity_3dMean number of deliveries by all couriers in last 3 days
mean_total_del_num_1weekMean total deliveries made in the last week
mean_attempt_num_1weekMean number of delivery attempts in the last week
mean_capacity_1weekMean deliveries of all couriers in the last week
Table 3. Experiment 1 problem set results.
Cross DockNumber of CouriersDistance (Original) (km)Distance (Optimized) (km)Cost Reduction
XD011019,68018,030 8.38 %
XD021015,67014,270 8.93 %
XD031022,21020,110 9.46 %
XD04712,07011,100 8.04 %
XD051030,79027,940 9.26 %
XD06780907190 11.12 %
XD0710163,20014,740 9.68 %
XD0810244,30022,240 8.96 %
XD0910139,30012,550 9.91 %
XD1010274,30024,810 9.55 %
XD1110362,30033,070 8.72 %
XD129452,80042,570 5.98 %
Overall113272,080248,680 8.60 %
Table 4. R1 benchmark set result statistics.
R1 Problem Set
Problem NameOptimalMethodRun Time(s)Percent
R101.25 617.1 6520.3065.7
R101.5010441177.31.70012.8
R102.25 547.1 674.30.32123.2
R102.50 971.5 1119.52.65423.2
R103.25 454.6 557.80.33322.7
R103.50772.9981.53.27127
R104.25 416.9 515.40.48723.7
R104.50 625.4 743.77.50918.9
R105.25 530.5 5610.5835.7
R105.50 899.3 1028.32.83014.3
R106.25 465.4 548.20.82817.8
R106.50793957.66.22120.8
R107.25424.3499.60.40517.7
R107.50711.1886.97.95224.7
R108.25397.3493.80.66324.3
R108.50617.76773.4049.6
R109.25441.3516.80.33917.1
R109.50786.8884.63.10512.4
R110.25444.1474.80.6816.9
R110.50697847.52.05721.6
R111.25428.8514.10.38719.9
R111.50707.2815.37.56115.3
R112.25393435.30.44710.8
R112.50630.2732.83.34616.3
Table 5. RC1 benchmark set result statistics.
RC1 Problem Set
Problem NameOptimalMethodRun Time (s)Percent
RC101.25 461.1484.10.1365%
RC101.509441027.23.8118.8%
RC102.25351.8356.10.4721.2%
RC102.50822.5962.41.5077%
RC103.25332.8346.21.6994%
RC103.50710.97905.72411.1%
RC104.25306.6340.30.97411%
RC104.50545.8642.14.27917.6%
RC105.25411.34700.28914.3%
RC105.50855.3981.67.25814.8%
RC106.25345.5355.20.4412.8%
RC106.50723.2849.92.50817.5%
RC107.25298.3315.40.4895.7%
RC107.50642.7676.24.6385.2%
RC108.25294.5300.70.3362.1%
RC108.50598.1647.84.1008.3%
Table 6. Experiment 3 full problem results.
Vehicle IDStandardNumber of MarketsNumber of M1 DeliveryNumber of M2 DeliveryTotal Distance
0 47000166,694
150000170,583
250000146,823
349000162,635
450000169,870
5401100175,217
6152925169,575
747000153,759
8291210167,572
950000162,972
10361130150,875
11025322208,333
1253000180,110
13391100155,523
1449000179,146
1552000169,696
1645104153,758
1753000170,857
18341120143,507
Table 7. Experiment 3: 3 couriers scaled results.
Vehicle IDStandardMarketsMarket 1Market 2Total Distance
02810127,593
112214329,975
23300024,160
Table 8. The capacity prediction performances of the cross-docks.
Cross-DocksAvg. RMSEAvg. Actual CapacityAvg. Predicted Capacity
1199.511964.912005.55
2167.681918.551912.04
3282.642358.132280.15
4328.133050.363002.38
5115.821192.411219.32
6188.631773.131765.40
7178.581378.521388.63
8154.671696.051702.25
9170.971438.631466.97
10153.541529.021530.507
Table 9. Additional scenario results.
Problem ScaleCapacity Sharing (km)Additional Courier (km)Percentage Reduction
Full Problem319,750.5481,139.833.5%
3 Courier Scaled75,728.1109,919.731.1%
Disclaimer/Publisher’s Note: The statements, opinions and data contained in all publications are solely those of the individual author(s) and contributor(s) and not of MDPI and/or the editor(s). MDPI and/or the editor(s) disclaim responsibility for any injury to people or property resulting from any ideas, methods, instructions or products referred to in the content.

