
Utilizing Multiple Regression Analysis and Entropy Method for Automated Aesthetic Evaluation of Interface Layouts


School of Mechanical Engineering, Southeast University, Nanjing 211189, China
*
Author to whom correspondence should be addressed.
Symmetry 2024, 16(5), 523; https://doi.org/10.3390/sym16050523
Submission received: 1 April 2024
/
Revised: 16 April 2024
/
Accepted: 23 April 2024
/
Published: 26 April 2024
(This article belongs to the Section Computer)
Abstract
:Aesthetic evaluation of increasingly complex and personalized human–computer interaction interfaces serves as a critical bridge between humans and machines, fundamentally enhancing various interaction factors. This study addresses the challenges in aesthetic evaluation by adjusting existing methodologies to incorporate seven aesthetic metrics: density, symmetry, balance, proportionality, uniformity, simplicity, and sequence. These metrics were effectively integrated into a composite evaluation metric through both multiple regression analysis and entropy methods, with the efficacy of both fitting methods validated. Leveraging automatic segmentation and recognition technology for interface screenshots, this research enables rapid, automated acquisition of evaluations for the seven metrics and the composite index, leading to the development of a prototype system for interface layout aesthetic assessment. Aimed at reducing the time, manpower, and resources required for interface evaluation, this study enhances the universality, compatibility, and flexibility of layout assessments. It promotes integration at any stage of the design process, significantly benefiting lightweight rapid evaluation and iterative design cycles, thereby advancing the field of interface aesthetic evaluation.
1. Introduction
In the digital era, human–computer interaction (HCI) interfaces serve as the bridge for communication between humans and machines. The design of HCI interfaces has become increasingly complex and personalized, leading to a growing demand for aesthetic evaluation. Aesthetics is one of the most crucial elements in interface design [1], with proven impacts on various interaction aspects including perceived usability [2], interaction efficiency [3], user satisfaction [4], and usage intentions [5]. As interface designs become highly homogeneous, exceptional aesthetic appeal gains importance [6], positively influencing sustainable perceived value, breaking the homogeneity, and providing a competitive edge [7]. Given the significance of interface aesthetics in HCI, conducting thorough evaluations is essential [2]. Aesthetic evaluation of interface layouts, particularly from a cognitive aesthetic perspective, has become a key approach to enhancing design quality. This evaluation, through the analysis of aesthetic metrics such as density, symmetry, and balance, reveals the intrinsic value and effectiveness of designs. Such assessments not only aid designers in enhancing the visual impact of interface layouts but also offer users a more enjoyable and efficient interaction experience.
However, despite its significance, the evaluation phase is often overlooked in HCI interface design and application. Currently, there is a scarcity of validated scales for measuring HCI aesthetics [4]. Especially in the design process, traditional methods typically adopt a linear approach, where evaluation is positioned at the end of the process, after the transition from concept design to frontend implementation, or even after the interface has been launched. This linear process poses significant challenges, particularly when the evaluation outcomes are unsatisfactory, necessitating a reassessment and potential redesign, leading to efficiency losses, including in time, energy, and resources. The lack of flexibility in this linear design approach is not due to designers undervaluing interface evaluation but stems from two main challenges in the evaluation process. Firstly, the process of interface evaluation is costly and complex. Aesthetic assessments often require experimental studies to gather user feedback, necessitating participant recruitment. Evaluating website aesthetics through user ratings is resource-intensive [8], with the design, implementation, and data analysis demanding high levels of expertise and involving significant time and financial costs, increasing the complexity and delay of evaluations. In contrast, with the advancement of artificial intelligence and machine learning technologies, automated tools and algorithms for aesthetic evaluation are emerging. However, these methods require collecting extensive data to train evaluation models, including direct user feedback on interface aesthetics and user behavior and interface usage data. Studies indicate that datasets need to contain over 16,000 webpage screenshots for deep learning models to be effective [9]. The collection, processing, and analysis of data require substantial resources, including advanced computing capabilities and data storage space, posing a challenge for resource-limited research teams or companies.
Secondly, existing evaluation methods often involve multiple metrics, making it difficult to intuitively assess the merits of interface layout solutions. In the process of rapid design iteration, designers need to compare the subtle differences between various design proposals and require a comprehensive index for overall decision making. Although previous computational methods have been proposed based on multiple aesthetic dimensions to aid designers in quantifying interface aesthetics, computational models have become exceedingly complex, leading to redundancy and overlap among some metrics [10]. Currently, the acquisition of a comprehensive index often relies on the Analytic Hierarchy Process (AHP), where the weights of various metrics are determined through questionnaires or interviews [11]. Therefore, devising a more scientifically effective method to integrate multiple aesthetic metrics into a comprehensive evaluation indicator remains a significant challenge in the application of interface layout evaluation methods.
In response to these challenges, this research simplifies and adjusts the 14 metrics proposed by Ngo [12] to identify seven aesthetic metrics: density, symmetry, balance, proportionality, uniformity, simplicity, and sequence. These metrics are integrated into a comprehensive evaluation indicator using multiple regression and entropy methods, with the validity of both fitting methods verified. Leveraging automatic segmentation and recognition technology for graphical user interface (GUI) screenshots, this research enables the rapid and automated acquisition of the seven metrics’ evaluation values and the comprehensive indicator’s evaluation value. Consequently, an interface layout aesthetic evaluation prototype system was designed. We aim to reduce the time, manpower, and resources required for interface evaluation, enhance the universality, compatibility, and flexibility of layout assessment, and promote its integration at any design stage, contributing to lightweight rapid evaluation and iterative design cycles.
The remainder of the paper is structured as follows: Section 2 elaborates on related research in interface layout aesthetic evaluation, further illustrating the challenges faced by the study. Section 3 explains the setup, calculation, and recognition outcomes of the seven aesthetic metrics. Section 4 and Section 5 describe how the seven aesthetic metrics are integrated into a comprehensive evaluation indicator using multiple regression and entropy methods, respectively. Section 6 validates the effectiveness of the comprehensive evaluation indicator obtained through both methods via verification experiments. Section 7 discusses the interface layout aesthetic evaluation software based on the methodology proposed in this study. Section 8 and Section 9 discuss and summarize the findings of this research.
2. Related Works
Contemporary research and users often underestimate the immediate and profound importance of aesthetics in HCI interfaces [13]. As a non-instrumental quality, the aesthetics of HCI interfaces play a crucial role, as they can be perceived at a glance, instantly determining whether a user is attracted to the system. Interface aesthetics can produce a hedonic halo effect, thereby influencing the usability ratings of the interface [13]. Taking website interfaces as an example, in the absence of specific information, users face the decision of whether to continue interacting or to seek alternative options. At this juncture, the immediate evaluation of interface aesthetics plays a key role in the user’s decision to stay or leave, and it strongly influences the usability and credibility of the interface [14]. For instance, in the presented fashion shopping scenario, elements such as the recommendation area and product highlights have a significant positive impact on customer attention due to adherence to aesthetic rules in interface design [15]. Soui et al. investigated the impact of eight aesthetic flaws across 56 versions of five Android applications, confirming that despite significant code improvements, some severe aesthetic flaws persist, potentially necessitating additional maintenance efforts [16].
Given the significance of aesthetics in the field of HCI, it is necessary to employ effective and reliable tools for its assessment. This study summarizes common interface layout aesthetic evaluation metrics found in recent research. Ngo’s model is a classical approach that includes 14 aesthetic evaluation metrics and indicates that the interactions among selected features are linear and all these features are equally important [12]. Maity and Bhattacharya primarily considered text, images, and whitespace as the main elements, thus forming an interface aesthetic computation model [17]. Wang et al. proposed an interpretable GUI design aesthetic index, integrating visual aesthetics (visual similarity and spatial proximity) and GUI structure (semantic similarity and whitespace) to simulate the distribution of visual grouping [18]. Chen et al. aimed to study the impact of shape, contrast, and visual force on the visual weight of interface elements, providing empirical evidence for optimizing the balance calculation model [19]. Liu et al. evaluated the relationship between eight key elements (image–text ratio, color difference, color distribution, color harmony, thematic style, whitespace ratio, frame style, and number of colors) and emotions [20]. Deng explored the relationship between curvature and proportion and emotional preferences regarding five sets of emotional indicators for interfaces (safety–danger, formal–lively, masculine–feminine, cold–warm, and soft–hard) [21]. Chen and Zhang selected four indicators from existing aesthetic metrics—balance, equilibrium, cohesion, and density—to evaluate laptop keyboard layouts [22]. Hynek and Hruška aimed to analyze the applicability of selected object-based metrics in dashboard quality assessment and their ability to differentiate well-designed samples, focusing on users’ subjective perceptions and constructing a model to rate and classify object-based metrics based on the ability to objectively distinguish well-designed dashboards [23]. In webpage evaluation, VisAWI is a common model that includes four metrics: simplicity, diversity, colorfulness, and craftsmanship [2,4,7].
With the rapid increase in demand for aesthetic evaluation, a large number of tools for assessing interface aesthetics have emerged. Zen and Vanderdonckt constructed QUESTIM, which includes a simplified aesthetic model and implements the assessment of GUI metrics through a web service tool [24]. Oulasvirta and colleagues developed the Aalto Interface Metrics (AIM), which aggregates multiple models and metrics, providing an online service where users can input the URL of a GUI design for online evaluation [25]. Bessghaier et al. proposed an automated method for restructuring the design of user interface structures based on a data model, using the ADDET tool to assess the quality of the original and restructured versions of 511 user interfaces in terms of the number of aesthetic flaws and aesthetic properties. The results indicate significant positive differences between the restructured user interfaces and the originals under the improvement of seven quality indicators, with an average value of 0.59 [26]. Samele and Burny developed OctoDollop, which can assess graphical user interfaces instantaneously and seamlessly based on a limited number of samples, without departing from their usage context [27].
Although various tools are available to measure interface aesthetics, only a few have been proven effective and capable of accurately assessing actual aesthetics. Lima and Gresse von Wangenheim, through a comprehensive summary of user interface visual aesthetics over the past decade, contend that few methods have been comprehensively evaluated in terms of reliability and validity. Given the importance of visual aesthetics as a part of software quality, further research is warranted [28]. While other measurement methods have been utilized in aesthetic assessments, their lack of standardization, vague psychometrics, and empirical research preclude them from serving as reliable tools [1]. Existing models for predicting aesthetics are limited in performance and capability [8]. Current research on HCI interface layouts predominantly focuses on ergonomics analysis, with insufficient study on the aesthetics and aesthetic degree computation of interface layouts. The application of aesthetics in interface design is still in its infancy, lacking clear aesthetic standards to guide interface design [3]. Moreover, most studies concentrate on the functional aspects of features, with considerably less attention given to aesthetic design features [5], and there is a lack of research investigating the reliability and validity of proportion types as a unidimensional structure in visual aesthetics [29]. Additionally, the evaluation indicators are overly abstract, the objective rationality of the evaluation process needs improvement, and the feedback guidance of the evaluation results on HCI design requires enhancement [30].
There are also studies that apply machine learning methods to identify features related to aesthetics, thereby creating models to predict aesthetics. For instance, Soui and Haddad combined the Densnet201 architecture with the K-Nearest Neighbor (KNN) classifier to evaluate mobile user interfaces, assessing this approach using a publicly available large dataset, with the model achieving an average accuracy of 93% [31]. These methods can capture rich or complex aesthetic perceptions, providing excellent results. However, this approach often faces issues with interpretability, generalizability, and flexibility. For example, the aesthetic perceptions provided by machine learning can enhance the accuracy of evaluations but do not intuitively suggest to web designers how to lay out web objects [32]. Moreover, such models typically focus on specific targets, such as evaluating interfaces of particular categories, and require complete retraining if modifications are needed [33].
In terms of specific applications, although previous research has provided evidence of the impact of website aesthetic design features on user responses, the underlying mechanisms of this impact remain relatively unexplored [5]. For a complete webpage, the design and layout often overlook the consideration of each element’s layout position, focusing instead on specific visual areas [32]. Furthermore, existing mobile marketing recommendation methods lack further research into user data and the layout features of mobile marketing recommendation interfaces, thus failing to utilize user aesthetic preference information to improve the quality of mobile market recommendations. Research on utilizing the layout information of mobile marketing interfaces and user aesthetic preferences from an aesthetic perspective for layout remains insufficient [34].
3. Acquisition of Interface Elements and Determination of Metrics
In this study, OpenCV was primarily utilized to automatically acquire the positional information of interface elements, followed by the determination of seven aesthetic evaluation indicators and their quantification methods based on Ngo’s research. Subsequently, the effects of automatic acquisition and quantitative calculation were demonstrated through examples of two interfaces.
3.1. Extraction of Interface Element Position Information
In traditional methods of interface aesthetic evaluation, manual dragging is generally required to mark the edges of elements. This method is inefficient when there are many interface elements or when multiple interfaces need to be evaluated comparatively. In our previous research [35], preliminary attempts at edge detection for graphical user interfaces were implemented. In this study, OpenCV was further employed to automatically obtain the contour dimensions and positional information of design elements in interface screenshots.
3.1.1. Preprocessing
Since this study does not consider the color design of the interface, the screenshots are first converted to grayscale upon file reading, specifically using the cv2.COLOR_BGR2GRAY command. Subsequently, the screenshots undergo binarization, aimed at further simplifying the grayscale image to make the edges more distinct and the internal contours clearer. During thresholding, an adaptive threshold method is used, where the threshold is obtained by calculating the weighted average of the surrounding area of each pixel and applying this threshold to the current pixel. After binarization, the screenshot image retains only two gray levels: 0 and 255, representing black and white.
3.1.2. Image Segmentation and Position Acquisition
The segmentation and detection method used in this study is essentially consistent with the method used by Bakaev et al. [36], with the difference that we do not use the DOM for auxiliary recognition. By employing the edge detection feature in OpenCV, elements within the interface screenshot can be recognized as rectangles. For the interface, the width and length are set as “width” and “height”, respectively; for the elements, each element’s attributes are represented as a tuple , indicating the horizontal position, vertical position, length, and width of element i within the interface. The definition of position information is as shown in Figure 1.
3.2. Aesthetic Evaluation Metrics
This section elucidates the specific meanings and quantification methods of the metrics frequently encountered in related research. Ngo’s study proposed 14 quantifiable metrics, the effectiveness of which has been widely recognized. However, a review of the literature reveals that most studies adopt only 4–6 of these metrics rather than using all 14.
In our research, modifications were made to Ngo’s metrics as follows: Firstly, the metric system was reduced. Due to the need for multiple linear regression in this study, collinearity issues among some metrics, such as between balance and equilibrium, were identified in preliminary research. Consequently, this led to a simplification of the original fourteen metrics down to the seven utilized in this study. Secondly, the metrics and their formulas were further streamlined, primarily focusing on symmetry, proportionality, and simplicity. Lastly, in using these seven metrics and formulas, the need to segment and extract interface elements necessitated the definition of positional tuples . Based on this positional measurement approach, modifications were made to Ngo’s formulas to facilitate programming implementation in OpenCV.
In the metrics described below, the total number of elements in the interface is set as N. Additionally, as this study primarily focuses on the aesthetics of layout and does not involve the impact of color, the following metrics are applied to the interface after undergoing the preprocessing described in Section 3.1.1.
3.2.1. Density
In this study, density is determined by the optimal proportion of whitespace within an interface. Whitespace in interface design, utilized to divide the design space, constitutes the breathing space of an interface. In graphic design, designers often leverage whitespace to create a refined, high-end image for products or brands. Whitespace significantly affects the visual impact of an interface, and it is generally believed that interfaces achieve maximum aesthetic and usability when whitespace occupies about 50% of the user-visible area. From the perspective of different interface types, usability increases with more whitespace up to 50%, beyond which usability decreases with additional whitespace. For e-commerce website interfaces, where users typically expect product diversity, reduced product information might lower their shopping intent, while overcrowded interface elements can significantly decrease perceived usability. Studies show dissatisfaction among users of all ages with either too high (above 90%) or too low (below 50%) proportions of whitespace. When users are asked to complete open-ended questions regarding their usability and aesthetic needs, the most common responses relate to “simplicity”, such as clear layouts, high readability, and distinct titles. Given recent design trends, minimalist design styles like “Minimalism” are particularly popular among users. Therefore, it can be inferred that interfaces with 50% element occupancy provide the most comfortable user experience.
Different studies slightly vary in their definition of whitespace. Some scholars consider line spacing, paragraph spacing, distances between elements and boundaries, gaps between text and images, and color blocks used to differentiate elements as whitespace. Others view any part of the interface not conveying information as whitespace. Quantification of density is twofold: one based on pixels, calculating the proportion of non-informative pixels in the total pixel count of the interface screenshot, and another based on element area, abstracting elements into rectangles and computing the proportion of the local blank area outside rectangles in the total page area. While other metrics could also adopt these two quantification methods, this research abstracts each element in the same manner without considering specific content or color, thus opting for the second method based on the area of the bounding rectangles of elements.
The specific formula is as follows:
3.2.2. Symmetry
The literature on the impact of interface symmetry on user perception and cognition is abundant in studies of graphical user interface layouts, underscoring symmetry as a critical factor. Symmetry aids in refining the interface structure, enhancing visual guidance for information, and improving users’ comprehension of interface content.
Various methods for quantifying interface symmetry exist, with considerable research focusing on vertical symmetry, making it a significant method for symmetry quantification. Initially, quantification of interface symmetry was based on three orientations: horizontal, vertical, and diagonal symmetry, with equal weight given to each. However, recent studies, especially those on graphical user interfaces like web and mobile layouts, predominantly focus on vertical symmetry. Research indicates a strong correlation between vertical symmetry and users’ aesthetic preferences. Therefore, this study considers only the vertical symmetry of interface layouts.
Vertical symmetry is defined as follows: A perpendicular line through the intersection of the interface’s diagonals divides the interface into left and right sections. The left side elements are mirror-copied across this perpendicular line, and the proportion of the area where the copied elements overlap with the elements on the right side to the total area on the right side represents vertical symmetry. Specifically, the quantification algorithm for symmetry proceeds as follows: First, divide the interface into left and right parts using a vertical symmetry axis, then identify pixel pairs (u, v) on both sides that meet the following three criteria:
where and represent the grayscale values of pixel points u and v, respectively. Given that the image has undergone binarization, both values should be 0, indicating that the pixel points are part of the element’s interior rather than the background. The proportion of pixel pairs that meet the above three criteria relative to the total area of all elements quantifies the interface’s vertical symmetry. The expression of vertical symmetry in interface layouts under this quantification method is as follows:
where denotes the number of pixels pairs that meet the above three criteria.
3.2.3. Balance
Similar to interface symmetry, interface balance encompasses different types, primarily focusing on central balance and the separate calculations of left–right and top–bottom balance. In physics, balance is defined as equal weight on both ends. Visually, balance implies that elements within an interface are orderly arranged, creating a dynamic sense of stability. The two main factors affecting users’ perception of interface balance are visual weight and positioning.
In this study, interface balance is defined as the distribution of visual weight among elements within the interface. The interface is divided into four quadrants: top-left, top-right, bottom-left, and bottom-right, each with equal weight. The quantification approach compares the difference in visual weight between the sides of the vertical and horizontal symmetry axes. The specific formulas are as follows:
where L, R, T, and B represent the left, right, top, and bottom sides of the vertical and horizontal symmetry axes, respectively. denotes the area of each quadrant’s elements, and represents the distance between the element’s center point and the interface’s center point.
3.2.4. Proportionality
High-quality proportions have been widely applied, with the Golden Ratio considered the most preferred proportion in human perception. Thus, it is extensively used in both grand architectural and delicate jewelry designs. This study’s applicability to graphical user interfaces is universal, and interface proportionality cannot be quantified entirely in the manner proposed by Ngo. Therefore, this research further quantifies interface layout proportionality, simplifying Ngo’s formula [12]. The specific formulas are as follows:
where N is the total number of elements within the interface. The process is to calculate the ratio of to for each element, determine which of the two values, or , is greater, and use the larger one as the denominator and the smaller one as the numerator. The preferred proportions are selected based on the five ratios mentioned by Ngo in his paper: 1:1, 1:1.414, 1:1.618, 1:1.732, 1:2 [12].
3.2.5. Uniformity
Uniformity refers to the consistency among elements belonging to the same functional module within an interface. Similar to its function in the fields of architectural and industrial product design, uniformity plays a significant role in enhancing the aesthetics of an interface. It helps users better understand the product’s functionalities and naturally guides them in performing corresponding operations. Uniformity in an interface can be achieved by utilizing similar element sizes to ensure that the gaps between elements are not too large and that the gaps between elements and the interface boundaries are not exceeded.
Uniformity is defined as the degree to which all elements in an interface appear to be part of a whole. This includes two aspects: the similarity in element sizes and the spacing between elements compared to the spacing from the edges. The specific formulas are as follows:
where refers to the degree of similarity in sizes among interface elements, calculated as follows:
where denotes the area of the bounding rectangle of all elements within the interface, width and height are the dimensions of the interface screenshot, and are the dimensions of each element, refers to the number of different sizes among the interface elements, and N represents the total number of elements within the interface.
3.2.6. Simplicity
Simplicity refers to the degree to which elements within an interface are easily accepted by users, typically measured by the number of elements and their alignment levels. This study’s definition of simplicity, following Ngo, pertains to the distribution and alignment degree of elements within an interface [12].
where represents the number of vertically aligned elements, represents the number of horizontally aligned elements, and N is the total number of elements within the interface. The coordinates of the top-left corner of the elements are denoted as , and the number of points with identical or values, i.e., the number of vertical alignment points and horizontal alignment points , are calculated. A higher value indicates stronger simplicity, while a lower value indicates weaker simplicity.
3.2.7. Sequence
Sequence measures the degree to which the layout of elements within an interface facilitates eye movement. Typically, especially during free browsing, the gaze moves from the top-left corner across to the bottom-right corner, with elements of strong contrast dominating more user attention. From a layout perspective, elements occupying larger areas are more likely to be noticed. The quantification formula for sequence is as follows:
where is the area of element i in quadrant j, and represents the dominance weight of the top-left, top-right, bottom-left, and bottom-right quadrants, corresponding to 4, 3, 2, and 1, respectively.
3.3. Metrics Acquisition and Calculation
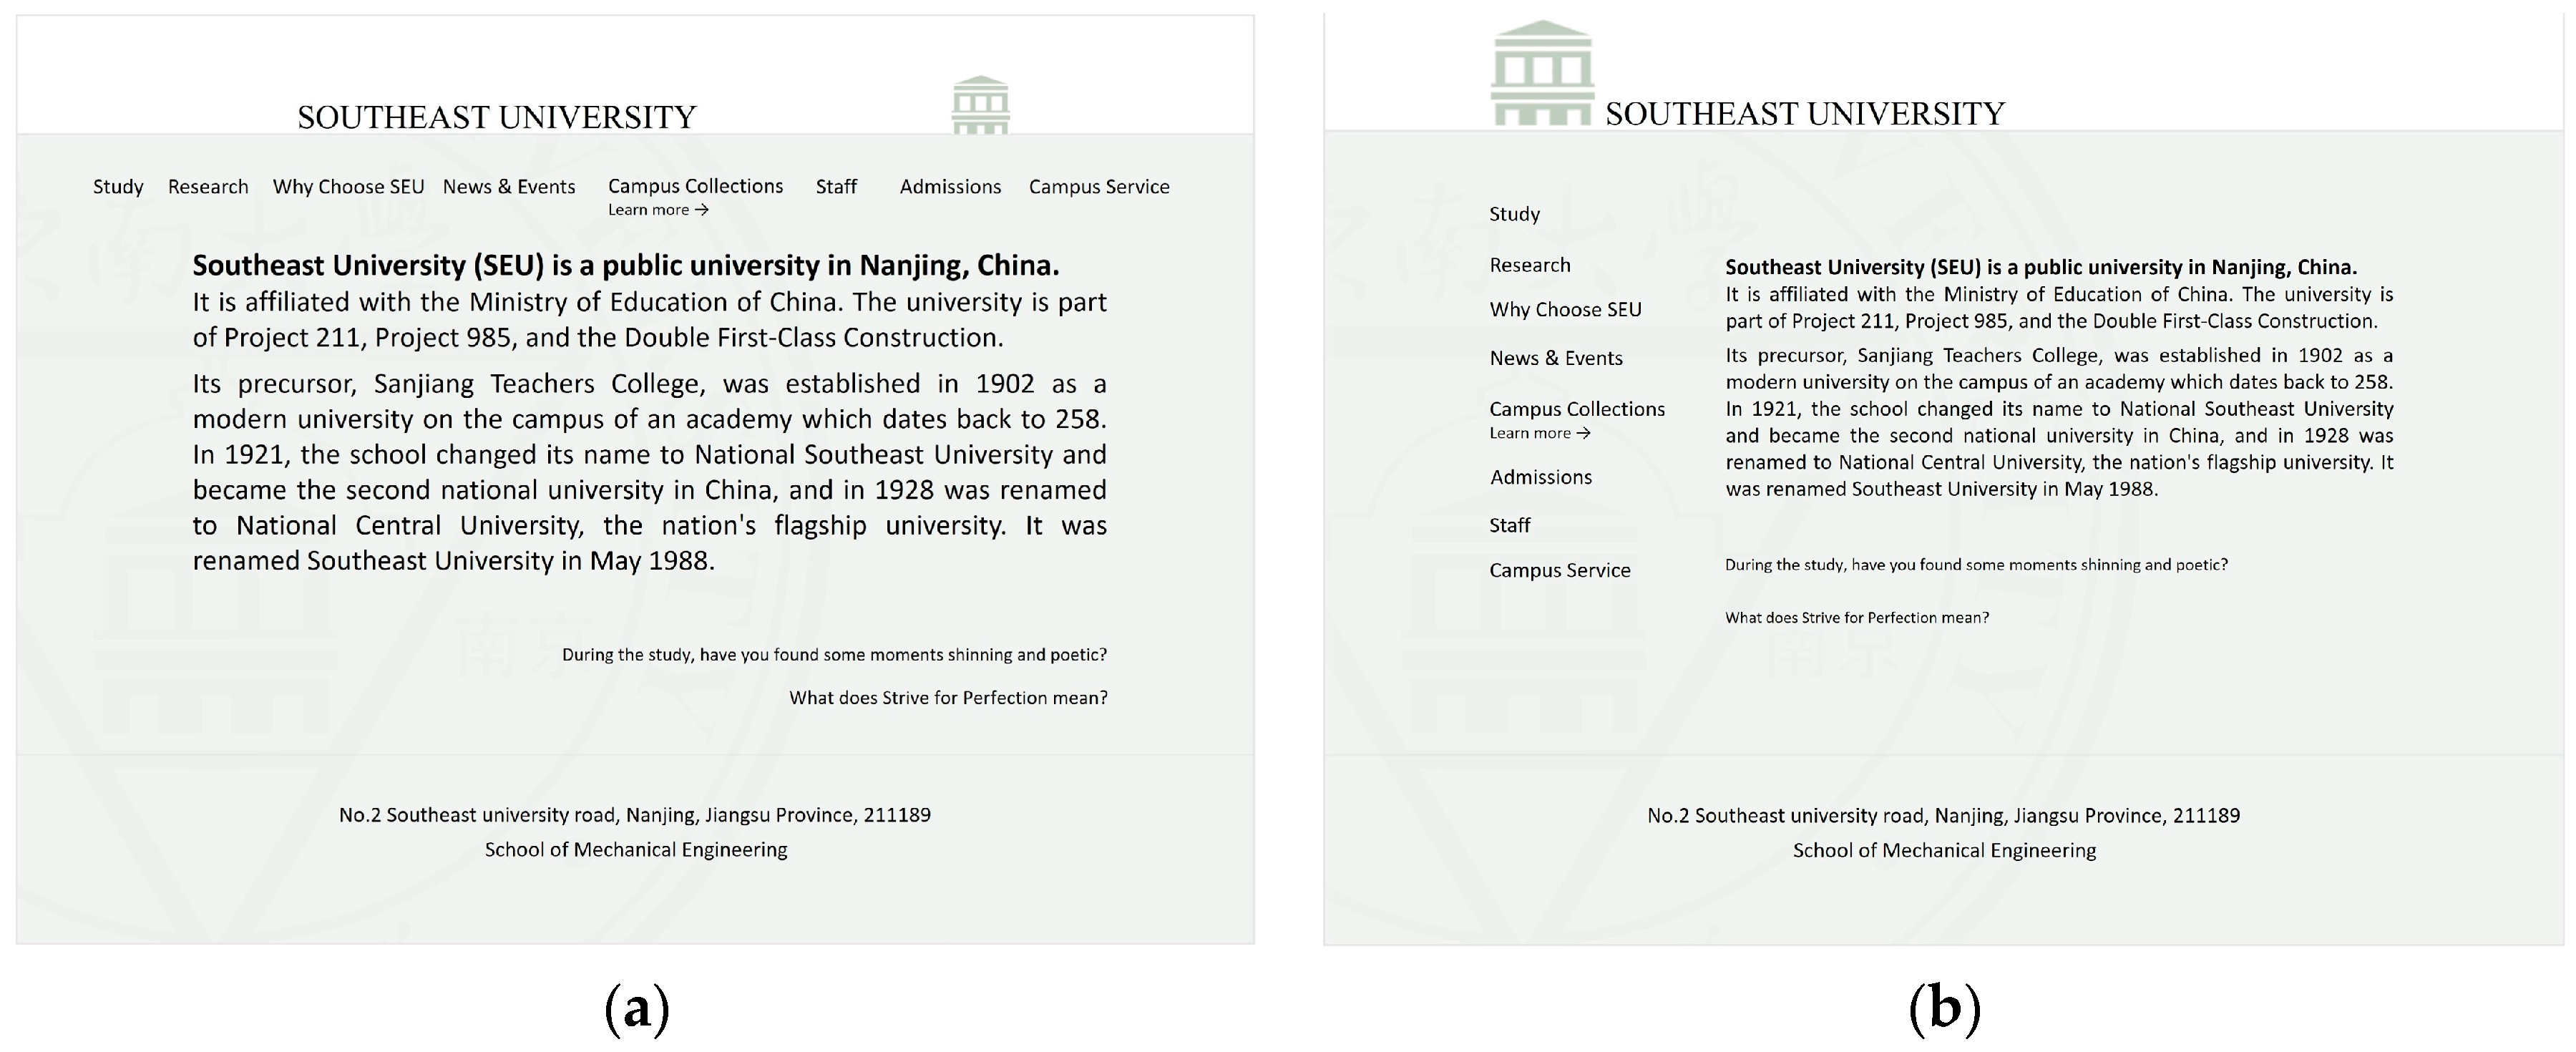
Based on the content of Section 3.1 and Section 3.2, this section demonstrates the multi-metric evaluation results for interface layouts through computational examples involving the layouts of two interfaces. In Figure 2, (a) and (b) represent two different interface layout methods, whereas in Figure 3, (a) and (b) correspond to the recognition of segmentation detection formed by them. Based on the detection and recognition outcomes and the aesthetic calculation formulas outlined in this study, the evaluation results for the two layout schemes can be directly obtained, as shown in Table 1.
From the calculated results of the mentioned metrics, it is evident that the two schemes exhibit varying strengths across the seven metrics, making it challenging to intuitively determine the superiority of one design over the other. Thus, alongside providing detailed specific metric calculation results, a scientific and reliable comprehensive index is necessary to intuitively and comprehensively evaluate the advantages and disadvantages of the two layout approaches.
4. Evaluation Method Based on Multiple Regression Model
The first method for obtaining a composite index involves using seven indicator values to model users’ overall evaluations of interface layouts. Specifically, user ratings for their overall perception of different interface layouts are collected through an online questionnaire. Additionally, the seven indicators for each interface layout are also obtained using the method described in Section 3. Ultimately, these are modeled using a multiple regression approach, the process of which is illustrated in Figure 4.
In this study, it is hypothesized that users’ evaluations of interfaces are directly related to the seven selected metrics through a multiple regression relationship. A multiple regression model is established based on user ratings for different interface layouts collected via online survey questionnaires. The ratings employ a Likert scale method, and the collected data are analyzed and processed. The average user rating for each layout is calculated, along with the computational values of the seven metrics for each interface. These data are then fitted to derive the formula for the multiple regression model. The explanatory variables are the seven metrics: density , symmetry , balance , proportionality , uniformity , simplicity , and sequence , with the user rating for a particular interface as the dependent variable Y. The multiple linear regression model is as follows:
where , …, are the regression coefficients, and is the random error term.
4.1. Questionnaire Survey
Prior to conducting the interface layout evaluation, the objective of this evaluation was communicated to participants, along with a brief description of interface layout aesthetics. Additionally, basic information about the participants was recorded, including age, gender, educational background, experience in interface design, and daily usage duration of GUIs.
The interface screenshots for online evaluation were not subject to a time limit for display. Typically, time restrictions are imposed during aesthetic ratings of webpages and other GUIs to prevent content within the interface from influencing users. However, the questionnaire samples consist of abstract images of interface layouts, devoid of specific colors and content; hence, no display time limit for layout interfaces was set. The rating employs a 5-point Likert scale for the online survey experiment, where “Very appealing” scores 5 points, “Quite appealing” 4 points, “Neutral” 3 points, “Slightly unappealing” 2 points, and “Very unappealing” 1 point. The questionnaire contains a total of 55 images, derived from real GUIs and abstracted into layout diagrams through binarization, with elements represented by gray rectangular blocks. Some of the experimental materials are shown in Figure 5.
4.2. Data Collection
A total of 320 questionnaires were distributed, with 314 considered valid. Among the respondents, 166 were female, accounting for 52.87% of the total, and 148 were male, making up 47.13%. The age distribution included 116 individuals between 18 and 25 years old, 113 individuals aged 26–30, 16 individuals over 30, and 8 individuals under 18. A total of 170 participants had experience related to interface design, and all participants had normal corrected vision.
The rating given by each user to interface layout K is denoted as , with the total ratings for each interface by all users represented as , where is the total number of participants. The arithmetic mean of ratings for each sample is calculated as:
and the standard deviation for each sample is:
The questionnaire survey on interface layout aesthetics and the summary of the data are presented in Table A1 of Appendix A. Samples 18, 32, 36, 37, and 54 exhibited coefficient of variation values exceeding 44%, which is significantly higher compared to other samples. Therefore, data related to these five samples were excluded during the data fitting process. To eliminate the influence of dimensions, the evaluation values were normalized, with the results shown in Table A2 of Appendix A.
4.3. Data Analysis
The data were subjected to multiple regression analysis to assess whether the model exhibits multicollinearity. The specific related data obtained are presented in Table 2.
Table 2 shows that the model indicates passed the F-test (F = 4.029, p = 0.002 < 0.05), suggesting that at least one of the variables has a significant impact on the dependent variable Y. Furthermore, the determination coefficient R2 is 0.402, meaning that the independent variables can explain 40.2% of the variance in the dependent variable.
Subsequently, we calculated the impact of each independent variable on the dependent variable Y and assessed the statistical significance of each regression coefficient using the t-statistic. As presented in Table 2, the t-statistics and corresponding p-values for each variable were determined. These calculations of t-statistics and p-values indicate that the coefficients are statistically significant, thereby confirming that the influences of different independent variables are meaningful.
Following this, the correlations between variables were calculated and analyzed, with the results displayed in Figure 6. The results indicate significant positive correlations between and , and and , with correlation coefficients around 0.5 and p-values less than 0.001. Conversely, the correlations between other pairs of variables are relatively weak.
Finally, the issue of multicollinearity among variables was examined using the VIF. As shown in Table 2, the highest VIF is 1.966, which is well below the commonly used thresholds of 5 or 10, indicating that our model does not suffer from severe multicollinearity issues. Although pairs of variables with high correlations were identified in the correlation analysis, these relationships did not statistically elevate the risk of multicollinearity. Additionally, the Durbin–Watson (D-W) value is 1.646, suggesting that there is no autocorrelation in the model and the sample data are uncorrelated, thus enhancing the model’s reliability. Therefore, these variables are suitable for multiple linear regression analysis. Based on the coefficients derived from Table 2, the multiple linear regression model formula is:
5. Evaluation Method Based on Entropy Theory
The second method for acquiring a comprehensive index utilizes the entropy weight method to determine the weights of each metric, thereby constructing a comprehensive evaluation model for interface layout metrics. Entropy theory, now integrated into research across various disciplines, enhances objectivity. The core idea of the entropy weight method is that the greater the amount of information in a system, the smaller the uncertainty, resulting in a higher weight; conversely, the smaller the information amount, the greater the uncertainty, and the smaller the relative weight. Assuming a relationship between the seven metrics and the comprehensive evaluation results of interfaces based on entropy, this method attempts to determine the weights of selected metrics using the entropy weight method to fit the comprehensive evaluation results. The process of the entropy method is shown in Figure 7.
As all metrics in this study are positive, with higher numerical values indicating better outcomes, the calculation formula is as follows:
where represents the computed value of the layout metric for the sample. For the interface to be evaluated, is directly obtained using the methods described in Section 3. m denotes the number of samples, and n indicates the number of metrics.
Using Python’s NumPy library, the metrics undergo max-min normalization. To mitigate the influence of extreme values, any metric calculation value of 0 is converted to 0.01 to ensure result validity. Since all selected metrics are positive, the specific normalization calculation is as follows:
The proportion of the sample value of the layout metric to that metric is , calculated as:
The entropy value for the metric is:
where . The weight for each layout metric is then:
Through the calculations above, the weight matrix for the interface layout metrics can be determined. Based on the entropy weight method evaluation mapping, the formula for comprehensive evaluation of interface layout is:
where represents the comprehensive evaluation for the sample; is the normalized matrix of interface layout metrics; is the matrix of layout metric weights.
6. Validation Experiment
This section presents validation experiments for both the comprehensive evaluation index based on linear regression and the one based on the entropy weight method. The experiments aim to obtain actual designers’ comprehensive evaluation rankings of various interface layouts. Then, by applying linear regression and the entropy weight method for interface evaluation, the effectiveness of both comprehensive evaluation approaches is verified.
6.1. Experimental Procedure
The experimental materials consist of grayscale-processed homepage screenshots from six news websites. The selected webpages are from popular news and information sources with representative layouts, including The New York Times, BBC, HUFFPOST, China Daily, People’s Daily, and Huxiu.
The experiment utilized a ranking method. Ranking is a commonly used comparative method in psychophysics, where all stimuli to be compared are presented to the participants at once, who are then asked to compare them based on a certain characteristic and make a judgment. The specific steps of the experiment are as follows:
- All images are presented to the participants at once, with the instruction: “Please participate in the layout aesthetics ranking experiment. Here are 6 different interface layout images, please rank them according to the quality of the interface layout.”;
- The default order in which the images appear is random, and the order of all participants’ rankings is recorded;
The participants included 20 individuals with substantial design experience, aged between 20 and 30, comprising 10 females and 10 males. Each participant received a compensation of RMB 30 upon completing the experiment. The experiment was approved by the Academic Review Board of the School of Design at Southeast University, and all participants were informed about and consented to the purpose of the experiment and the data collection process.
6.2. Experimental Results
The results of the layout aesthetics ranking are presented in Table 3. The “Total Rank Sum” represents the sum of the ranking position values for a particular layout as given by the 20 participants. The “Rank Average” is the mean of these total ranking sums. The smaller these two values, the higher the aesthetic evaluation of the interface, and the higher its rank in the order.
6.3. Results of Multiple Regression and Entropy Weight Method Calculations
Based on the aesthetic calculation formulas and the automatic acquisition of design elements’ contour sizes and positional information provided in Section 3, the seven evaluation metrics for each interface can be directly obtained. Table 4 shows the automated calculation results for each metric.
Using the multiple regression method described in Section 4, the comprehensive evaluation values and ranking results for each interface are obtained, as shown in Table 5.
Following the entropy weight method outlined in Section 5, the metric matrix is obtained:
After normalizing the metric matrix, the result is achieved:
The weight matrix for the layout metrics is:
Thus, the formula for calculating the comprehensive evaluation is as follows:
Hence, the final comprehensive evaluation values and rankings determined through the entropy weight method are presented in Table 6.
The ranking results obtained through the validation experiment, multiple regression, and the entropy weight method are compared in Table 7.
7. Prototype Design of Interface Layout Evaluation Software
This section outlines the development of prototype software for the automated evaluation of interface layout aesthetics. The primary function of this software is to segment and recognize the input interface screenshots, capture the boundary information of elements within the interface, abstract all interface elements into rectangles, and calculate both multi-metrics and a comprehensive index. The final recognition outcomes and index calculation results are presented in a visual format. When more than one interface screenshot is input, the output not only includes the calculation results for the metrics, but also the calculation results and rankings for multiple interfaces across various metrics.
The software prototype, as shown in Figure 8, consists of four display sections. The “Layout Recognition Results” section displays the segmentation and recognition effects of interface elements. The “Metric Calculation Results” section presents the calculation outcomes for the seven metrics. When users hover their cursor over the “Description” corresponding to each metric, a tooltip will appear providing a detailed explanation of that metric to help users understand its significance, thereby enhancing their trust in the data and the data’s guiding role in design evaluation. Similarly, when users hover over the “Formula”, the calculation formula for that metric is displayed. The “Comprehensive Values” section shows the comprehensive evaluation indices obtained through multiple regression and the entropy weight method, as well as the ranking of layout methods based on these metrics. The “Radar Chart Visualization” is based on multi-metric visualization and, together with the “Comprehensive Values”, forms an intuitive display of layout aesthetics evaluation, especially useful for the clear comparison of multiple layout schemes. Additionally, in the bottom right corner of the software interface, users can perform actions such as uploading one or more interface layout schemes, calculating layout aesthetics evaluation results, saving current results, and returning to the software’s homepage.
8. Discussion
Building on previous research findings, this study identified metrics highly correlated with the aesthetic appeal of interface layouts, adjusted and elaborately described their quantification methods, and used these as a basis for quantifying the aesthetics of interface layouts. The metrics include density, symmetry, balance, proportionality, uniformity, simplicity, and sequence. In practical evaluation applications, it is often challenging to intuitively display the merits and demerits of different design schemes using these seven metrics directly. In the research by Li et al., the weights of the metrics were derived from scores obtained through user questionnaires and interviews [11], a method which inherently bears a level of ambiguity [37]. In contrast, this study fits the seven metrics into a single comprehensive index using both multiple regression and the entropy weight method, approaches that offer more objectivity and statistical significance.
Moreover, unlike the study by Wan et al., which posited a positive correlation between an interface’s popularity and its aesthetics, using popularity rankings and visitation frequency as indicators of high aesthetic quality [32], this research focuses directly on the aesthetic features of the interface. Thus, it avoids the influence of various factors, such as interface functionality and user needs, on visitation frequency. Validation of the comprehensive index reveals that the ranking results obtained from both multiple regression and the entropy weight method largely align with the outcomes of the ranking method employed by participants. Although slight discrepancies exist between the rankings of the first and second places, and the third and fourth places, the differences in the specific values of the two comprehensive metrics are minimal, making the ranking reversals within an acceptable range.
From the final ranking results, it is evident that Layout 1 (The New York Times homepage), Layout 2 (BBC News homepage), and Layout 6 (Huxiu homepage) rank among the top three, both in terms of index scores and user ratings. These layouts are discernibly more structured, content-rich, and feature relatively larger fonts and images compared to others, aligning with user demands for interface aesthetics.
In the prototype design of the interface layout evaluation software, we integrated the interface segmentation recognition method from previous research with the multi- metric and comprehensive index calculation methods proposed in this study, resulting in an automated computation and evaluation of interface layouts. This software holds significance in two main aspects.
The first is its universality. Many current studies use manual selection for segmentation, bypassing or overlooking the acquisition of interface elements’ position and size information. Segmentation remains a bottleneck, hindering the full automation of computational aesthetic assessments [38]. Some more automated approaches involve using web crawlers to directly read a webpage’s HTML source code [32] or browser extensions to support webpage segmentation methods’ inspection and analysis [39]. However, when evaluating interfaces during the design process or when interfaces are presented in different formats (e.g., low-fidelity drawings or interfaces involving some confidential systems), segmentation and recognition become barriers to rapid evaluation [40]. Therefore, this study evaluated interfaces using screenshots [14], employing wireframe models to represent the position and size of elements within the interface [41]. Thus, regardless of the interface’s current form or the frontend language in which it is written, the final user-facing visual interface can be captured. Recognizing and processing interface screenshots allows for a more universal evaluation.
Secondly, the software has a significant impact on improving the design cycle. Interface design should not be a linear process from design to evaluation. If evaluation only occurs after completing the requirements-low, fidelity-high, fidelity-frontend design stages, any required modifications based on evaluation results would consume considerable time and manpower. This is primarily because traditional interface layout assessments rely on anthropometric data to verify the accessibility and feasibility of human–computer interaction interfaces, focusing on the quantitative analysis and processing of human–machine operation experimental data [3]. Through the outcomes of this study, a lightweight, rapid, and automated evaluation of interface layout aesthetics can be achieved, offering an effective alternative to evaluation methods that require recruiting a large number of participants for empirical experiments. This alternative fosters a shift from a linear design process to a cyclical design–evaluation progression, especially when comparing multiple design schemes. It allows for intuitive comparisons of different layout designs or understanding the effectiveness of layout improvements. Embedding evaluation throughout the design cycle, rather than as an afterthought, can significantly reduce subsequent testing costs, enhancing design efficiency and reliability [37]. Designers can innovate and respond to user needs more effectively, meeting the complexity and dynamism of interface design and evaluation, and promoting a shift towards more iterative, agile, and user-centered methodologies.
Our research still exhibits certain limitations, primarily manifested in the generalizability of the validation experiments. In Section 6, the experimental materials used were all sourced from a single category of interfaces, specifically the interfaces of electronic newspapers. This decision was made because, unlike the more universally applicable abstract interfaces used in Section 4, the real interfaces in the validation experiments contain actual content, which could influence user evaluations. For example, the content volume in electronic news interfaces is typically much higher than that in the home interfaces of ordinary apps. Therefore, to control variables, interfaces from the same category were utilized. In future research, it is necessary to validate the effectiveness of the methods proposed in this study across more categories of real interfaces.
9. Conclusions
In this study, we proposed and implemented a method for evaluating the aesthetics of interface layouts by comprehensively considering seven key aesthetic metrics: density, symmetry, balance, proportionality, uniformity, simplicity, and sequence, aimed at enhancing the efficiency and accuracy of interface design evaluations. The main contributions of this research include the following aspects:
Firstly, we adjusted and optimized existing aesthetic evaluation methods. We simplified the fourteen criteria from Ngo’s study to seven metrics, and modified the calculation methods for symmetry, proportionality, and simplicity among them. Subsequently, using two distinct statistical techniques—multiple regression analysis and entropy weighting method—we integrated the seven independent aesthetic metrics into a single comprehensive evaluation index. The success of this step not only validates the effectiveness of the chosen methods, but also provides a reliable quantitative tool for subsequent interface layout aesthetic assessments.
Secondly, by incorporating the interface screenshot automatic segmentation and recognition technology from previous research, this study can rapidly and automatically obtain the seven metrics’ evaluation values and their comprehensive evaluation value for interface layouts. The application of this technology significantly speeds up the evaluation process and its automation level, reducing the demand for manpower and resources, and enhancing the universality, compatibility, and flexibility of the assessment.
Further, based on the aforementioned methods and technology, we developed a prototype system for evaluating the aesthetic quality of interface layouts. This system not only facilitates rapid assessment of the aesthetic quality of interface layouts, but also promotes rapid iteration and optimization during the design phase, offering significant value in supporting lightweight and swift evaluations and cyclical iterative design.
In summary, this study not only theoretically expands the research on interface aesthetics evaluation but also provides an effective tool and method in practice to support and promote efficient, accurate interface design assessments. Future work will focus on further optimizing the accuracy of the evaluation model, expanding its applicability across different types of interface designs, and exploring its potential for integration and application within actual design processes.
Author Contributions
Conceptualization, X.W.; methodology, X.W. and Y.S.; software, M.T. and Y.S.; validation, M.T. and C.X.; formal analysis, X.W., M.T. and Y.S.; investigation, X.W.; resources, X.W. and Y.S.; data curation, Y.S.; writing—original draft preparation, X.W.; visualization, X.W.; supervision, C.X.; project administration, C.X.; funding acquisition, C.X. All authors have read and agreed to the published version of the manuscript.
Funding
This research was funded by National Natural Science Foundation of China, grant number 72271053 and 71871056.
Data Availability Statement
Data are contained within the article.
Acknowledgments
We would like to thank the anonymous reviewers of this paper for their constructive suggestions and comments.
Conflicts of Interest
The authors declare there to be no conflicts of interest.
Appendix A

Table A1.
The questionnaire survey on interface layout aesthetics and the summary of the data.
| Layout | Mean | Standard Deviation | Coefficient of Variation |
|---|---|---|---|
| 1 | 3.72 | 0.86 | 23.15% |
| 2 | 2.99 | 1.10 | 36.81% |
| 3 | 3.37 | 1.00 | 29.58% |
| 4 | 2.86 | 1.13 | 39.50% |
| 5 | 3.46 | 1.05 | 30.51% |
| 6 | 3.37 | 0.98 | 29.03% |
| 7 | 3.02 | 1.22 | 40.32% |
| 8 | 3.11 | 1.11 | 35.65% |
| 9 | 3.30 | 1.13 | 34.33% |
| 10 | 3.22 | 1.11 | 34.48% |
| 11 | 3.01 | 1.02 | 33.98% |
| 12 | 3.82 | 0.98 | 25.53% |
| 13 | 3.43 | 1.02 | 29.64% |
| 14 | 3.45 | 1.00 | 29.12% |
| 15 | 2.69 | 1.11 | 41.25% |
| 16 | 3.07 | 1.07 | 34.86% |
| 17 | 3.19 | 1.06 | 33.26% |
| 18 | 2.68 | 1.19 | 44.57% |
| 19 | 3.49 | 1.05 | 30.03% |
| 20 | 2.94 | 1.07 | 36.29% |
| 21 | 3.53 | 1.08 | 30.66% |
| 22 | 3.11 | 1.06 | 34.14% |
| 23 | 3.14 | 1.07 | 34.05% |
| 24 | 3.05 | 1.10 | 36.17% |
| 25 | 2.97 | 1.22 | 37.71% |
| 26 | 3.15 | 1.10 | 34.89% |
| 27 | 3.81 | 0.99 | 25.90% |
| 28 | 3.26 | 0.97 | 29.85% |
| 29 | 3.37 | 1.03 | 30.60% |
| 30 | 3.76 | 0.92 | 24.42% |
| 31 | 3.65 | 1.00 | 27.33% |
| 32 | 2.84 | 1.30 | 45.80% |
| 33 | 2.91 | 1.20 | 41.35% |
| 34 | 3.00 | 1.05 | 34.96% |
| 35 | 2.92 | 1.13 | 38.65% |
| 36 | 2.56 | 1.25 | 49.00% |
| 37 | 2.65 | 1.18 | 44.31% |
| 38 | 2.84 | 1.19 | 41.66% |
| 39 | 3.66 | 1.00 | 27.31% |
| 40 | 3.12 | 1.13 | 36.19% |
| 41 | 2.79 | 1.14 | 40.65% |
| 42 | 3.20 | 0.99 | 30.81% |
| 43 | 3.28 | 1.03 | 31.36% |
| 44 | 3.28 | 0.97 | 29.51% |
| 45 | 3.67 | 0.95 | 25.85% |
| 46 | 2.80 | 1.22 | 43.78% |
| 47 | 3.11 | 1.07 | 34.52% |
| 48 | 3.17 | 0.98 | 30.80% |
| 49 | 3.62 | 0.99 | 27.43% |
| 50 | 3.35 | 1.02 | 30.34% |
| 51 | 2.92 | 1.02 | 34.92% |
| 52 | 2.80 | 1.12 | 39.87% |
| 53 | 2.74 | 1.12 | 40.92% |
| 54 | 2.51 | 1.24 | 49.47% |
| 55 | 3.33 | 1.11 | 33.39% |
Table A2.
Normalized interface layout evaluation values.
| Layout | Value | Layout | Value |
|---|---|---|---|
| 1 | 0.91 | 27 | 0.99 |
| 2 | 0.29 | 28 | 0.52 |
| 3 | 0.62 | 29 | 0.62 |
| 4 | 0.18 | 30 | 0.95 |
| 5 | 0.69 | 31 | 0.85 |
| 6 | 0.62 | 33 | 0.22 |
| 7 | 0.32 | 34 | 0.30 |
| 8 | 0.39 | 35 | 0.23 |
| 9 | 0.56 | 38 | 0.16 |
| 10 | 0.49 | 39 | 0.86 |
| 11 | 0.31 | 40 | 0.40 |
| 12 | 1.00 | 41 | 0.12 |
| 13 | 0.67 | 42 | 0.47 |
| 14 | 0.68 | 43 | 0.54 |
| 15 | 0.03 | 44 | 0.54 |
| 16 | 0.36 | 45 | 0.87 |
| 17 | 0.46 | 46 | 0.13 |
| 19 | 0.72 | 47 | 0.39 |
| 20 | 0.25 | 48 | 0.44 |
| 21 | 0.75 | 49 | 0.83 |
| 22 | 0.39 | 50 | 0.60 |
| 23 | 0.42 | 51 | 0.23 |
| 24 | 0.34 | 52 | 0.13 |
| 25 | 0.27 | 53 | 0.08 |
| 26 | 0.43 | 55 | 0.58 |
References
- Saremi, M.; Sadeghi, V.; Khodakarim, S.; Maleki-Ghahfarokhi, A. Farsi Version of Visual Aesthetics of Website Inventory (FV-VisAWI): Translation and Psychometric Evaluation. Int. J. Hum. Comput. Interact. 2023, 39, 834–841. [Google Scholar] [CrossRef]
- Moshagen, M.; Thielsch, M.T. Facets of Visual Aesthetics. Int. J. Hum. Comput. Stud. 2010, 68, 689–709. [Google Scholar] [CrossRef]
- Deng, L.; Wang, G. Quantitative Evaluation of Visual Aesthetics of Human-Machine Interaction Interface Layout. Comput. Intell. Neurosci. 2020, 2020, e9815937. [Google Scholar] [CrossRef] [PubMed]
- Perrig, S.A.C.; von Felten, N.; Honda, M.; Opwis, K.; Brühlmann, F. Development and Validation of a Positive-Item Version of the Visual Aesthetics of Websites Inventory: The VisAWI-Pos. Int. J. Hum. Comput. Interact. 2023, 1–25. [Google Scholar] [CrossRef]
- Pengnate, S.; Sarathy, R.; Lee, J. The Engagement of Website Initial Aesthetic Impressions: An Experimental Investigation. Int. J. Hum. Comput. Interact. 2019, 35, 1517–1531. [Google Scholar] [CrossRef]
- Jiang, Q.; Deng, L.; Zhang, J. How Dose Aesthetic Design Affect Continuance Intention in In-Vehicle Infotainment Systems? An Exploratory Study. Int. J. Hum. Comput. Interact. 2024, 1–16. [Google Scholar] [CrossRef]
- Wang, J.; Hsu, Y. Does Sustainable Perceived Value Play a Key Role in the Purchase Intention Driven by Product Aesthetics? Taking Smartwatch as an Example. Sustainability 2019, 11, 6806. [Google Scholar] [CrossRef]
- Eisbach, S.; Daugs, F.; Thielsch, M.T.; Böhmer, M.; Hertel, G. Predicting Rating Distributions of Website Aesthetics with Deep Learning for AI-Based Research. ACM Trans. Comput.-Hum. Interact. 2023, 30, 28. [Google Scholar] [CrossRef]
- Bakaev, M.; Heil, S.; Khvorostov, V.; Gaedke, M. How Many Data Does Machine Learning in Human–Computer Interaction Need?: Re-Estimating the Dataset Size for Convolutional Neural Network-Based Models of Visual Perception. IT Prof. 2023, 25, 23–29. [Google Scholar] [CrossRef]
- Wang, C.; Ren, X. An Entropy-Based Approach for Computing the Aesthetics of Interfaces. In Proceedings of the 2018 ACM Companion International Conference on Interactive Surfaces and Spaces, Tokyo, Japan, 25–28 November 2018; Association for Computing Machinery: New York, NY, USA, 2018; pp. 57–61. [Google Scholar]
- Li, S.; Zhang, Z.; Wu, W.; Fang, Y.; Xia, Z. Cognitive Evaluation of Digital Twin Interface Layout of Industrial Machine Tools Based on Aesthetics Model. In Proceedings of the 2022 28th International Conference on Mechatronics and Machine Vision in Practice (M2VIP), Nanjing, China, 16–18 November 2022; pp. 1–5. [Google Scholar]
- Ngo, D.C.L.; Teo, L.S.; Byrne, J.G. Modelling Interface Aesthetics. Inf. Sci. 2003, 152, 25–46. [Google Scholar] [CrossRef]
- Minge, M.; Thüring, M. Hedonic and Pragmatic Halo Effects at Early Stages of User Experience. Int. J. Hum. Comput. Stud. 2018, 109, 13–25. [Google Scholar] [CrossRef]
- Miniukovich, A.; Figl, K. The Effect of Prototypicality on Webpage Aesthetics, Usability, and Trustworthiness. Int. J. Hum. Comput. Stud. 2023, 179, 103103. [Google Scholar] [CrossRef]
- Sulikowski, P.; Kucznerowicz, M.; Bąk, I.; Romanowski, A.; Zdziebko, T. Online Store Aesthetics Impact Efficacy of Product Recommendations and Highlighting. Sensors 2022, 22, 9186. [Google Scholar] [CrossRef] [PubMed]
- Soui, M.; Chouchane, M.; Bessghaier, N.; Mkaouer, M.W.; Kessentini, M. On the Impact of Aesthetic Defects on the Maintainability of Mobile Graphical User Interfaces: An Empirical Study. Inf. Syst. Front. 2022, 24, 659–676. [Google Scholar] [CrossRef]
- Maity, R.; Bhattacharya, S. Is My Interface Beautiful?—A Computational Model-Based Approach. IEEE Trans. Comput. Soc. Syst. 2019, 6, 149–161. [Google Scholar] [CrossRef]
- Wang, C.; Miniukovich, A.; Ren, X. An Interpretable Metric of Visual Aesthetics for GUI Design. Behav. Inf. Technol. 2024, 1–15. [Google Scholar] [CrossRef]
- Chen, X.; Lu, Y.; Hao, G. Balanced Aesthetics: How Shape, Contrast, and Visual Force Affect Interface Layout. Int. J. Hum. Comput. Interact. 2023, 1–14. [Google Scholar] [CrossRef]
- Liu, J.; Ang, M.C.; Chaw, J.K.; Kor, A.-L.; Ng, K.W. Emotion Assessment and Application in Human–Computer Interaction Interface Based on Backpropagation Neural Network and Artificial Bee Colony Algorithm. Expert Syst. Appl. 2023, 232, 120857. [Google Scholar] [CrossRef]
- Deng, L. The Influence of Curvature and Proportion on Emotional Preference for Human-Machine Interface Design. Multimed. Tools Appl. 2022, 81, 43581–43611. [Google Scholar] [CrossRef]
- Chen, X.; Zhang, J. Analysis of Keyboard Layout Elements Based on Aesthetic and Subjective Evaluation. In Advances in Industrial Design, Proceedings of the AHFE 2021 Virtual Conferences on Design for Inclusion, Affective and Pleasurable Design, Interdisciplinary Practice in Industrial Design, Kansei Engineering, and Human Factors for Apparel and Textile Engineering, USA, 25–29 July 2021; Springer: Cham, Switzerland, 2021; pp. 991–998. [Google Scholar]
- Hynek, J.; Hruška, T. Application of Object-Based Metrics for Recognition of Well-Designed Dashboards. Int. J. Hum. Comput. Interact. 2019, 35, 1203–1215. [Google Scholar] [CrossRef]
- Zen, M.; Vanderdonckt, J. Towards an Evaluation of Graphical User Interfaces Aesthetics Based on Metrics. In Proceedings of the 2014 IEEE Eighth International Conference on Research Challenges in Information Science (RCIS), Marrakech, Morocco, 28–30 May 2014; pp. 1–12. [Google Scholar]
- Oulasvirta, A.; De Pascale, S.; Koch, J.; Langerak, T.; Jokinen, J.; Todi, K.; Laine, M.; Kristhombuge, M.; Zhu, Y.; Miniukovich, A.; et al. Aalto Interface Metrics (AIM): A Service and Codebase for Computational GUI Evaluation. In Proceedings of the 31st Annual ACM Symposium on User Interface Software and Technology Adjunct Proceedings, Berlin, Germany, 14–17 October 2018; Association for Computing Machinery: New York, NY, USA, 2018; pp. 16–19. [Google Scholar]
- Bessghaier, N.; Soui, M.; Ghaibi, N. Towards the Automatic Restructuring of Structural Aesthetic Design of Android User Interfaces. Comput. Stand. Interfaces 2022, 81, 103598. [Google Scholar] [CrossRef]
- Samele, A.; Burny, N. Bootstrapped Evaluation with OctoDollop: A Mobile Application for Evaluating Mobile GUI Aesthetics in Context. In Proceedings of the Companion Proceedings of the 2023 ACM SIGCHI Symposium on Engineering Interactive Computing Systems, Swansea, UK, 27–30 June 2023; Association for Computing Machinery: New York, NY, USA, 2023; pp. 73–75. [Google Scholar]
- De Souza Lima, A.L.; Gresse von Wangenheim, C. Assessing the Visual Esthetics of User Interfaces: A Ten-Year Systematic Mapping. Int. J. Hum. Comput. Interact. 2022, 38, 144–164. [Google Scholar] [CrossRef]
- De Souza Lima, A.L.; Gresse von Wangenheim, C.; Borgatto, A.F. Comparing Scales for the Assessment of Visual Aesthetics of Mobile GUIs Through Human Judgments. Int. J. Mob. Hum. Comput. Interact. 2022, 14, 1–28. [Google Scholar] [CrossRef]
- Song, X.; Liu, M.; Gong, L.; Gu, Y.; Shidujaman, M. A Review of Human-Computer Interface Evaluation Research Based on Evaluation Process Elements. In Human-Computer Interaction, Proceedings of the 25th HCI International Conference, Part I, Copenhagen, Denmark, 23–28 July 2023; Kurosu, M., Hashizume, A., Eds.; Springer Nature Switzerland: Cham, Switzerland, 2023; pp. 262–289. [Google Scholar]
- Soui, M.; Haddad, Z. Deep Learning-Based Model Using DensNet201 for Mobile User Interface Evaluation. Int. J. Hum. Comput. Interact. 2023, 39, 1981–1994. [Google Scholar] [CrossRef]
- Wan, H.; Ji, W.; Wu, G.; Jia, X.; Zhan, X.; Yuan, M.; Wang, R. A Novel Webpage Layout Aesthetic Evaluation Model for Quantifying Webpage Layout Design. Inf. Sci. 2021, 576, 589–608. [Google Scholar] [CrossRef]
- Zen, M.; Burny, N.; Vanderdonckt, J. A Quality Model-Based Approach for Measuring User Interface Aesthetics with Grace. Proc. ACM Hum.–Comput. Interact. 2023, 7, 172:1–172:47. [Google Scholar] [CrossRef]
- Xiao, L.; Mao, H.; Wang, S. Research on Mobile Marketing Recommendation Method Incorporating Layout Aesthetic Preference for Sustainable M-Commerce. Sustainability 2020, 12, 2496. [Google Scholar] [CrossRef]
- Song, Y.; Xue, C.; Wang, X.; Zhang, P. Edge Detection Method for the Graphic User Interface of Complex Information System. In Human Systems Engineering and Design II, Proceedings of the 2nd International Conference on Human Systems Engineering and Design: Future Trends and Applications, Munich, Germany, 16–18 September 2019; Ahram, T., Karwowski, W., Pickl, S., Taiar, R., Eds.; Springer International Publishing: Cham, Switzerland, 2020; pp. 429–434. [Google Scholar]
- Bakaev, M.; Heil, S.; Khvorostov, V.; Gaedke, M. Auto-Extraction and Integration of Metrics for Web User Interfaces. J. Web Eng. 2018, 17, 561–590. [Google Scholar] [CrossRef]
- Liu, Q.; Chen, J.; Yang, K.; Liu, D.; He, L.; Qin, Q.; Wang, Y. An Integrating Spherical Fuzzy AHP and Axiomatic Design Approach and Its Application in Human–Machine Interface Design Evaluation. Eng. Appl. Artif. Intell. 2023, 125, 106746. [Google Scholar] [CrossRef]
- Bourguet, M.-L. Metrics-Based Evaluation of Graphical User Interface Aesthetics: The Segmentation Problem. In Proceedings of the 2018 ACM Companion International Conference on Interactive Surfaces and Spaces, Tokyo, Japan, 25–28 November 2018; Association for Computing Machinery: New York, NY, USA, 2018; pp. 31–38. [Google Scholar]
- Jung, G.; Cha, J. A WebExtension Framework for Experimentation and Evaluation of Webpage Segmentation Methods. SoftwareX 2023, 23, 101501. [Google Scholar] [CrossRef]
- Brie, P.; Burny, N.; Vanderdonckt, J. VisionAPI: An API for Offline and Online Segmentation and Identification of Hand-Sketched Graphical User Interfaces. In Proceedings of the Companion Proceedings of the 2023 ACM SIGCHI Symposium on Engineering Interactive Computing Systems, Swansea, UK, 27–30 June 2023; Association for Computing Machinery: New York, NY, USA, 2023; pp. 59–67. [Google Scholar]
- Maity, R.; Bhattacharya, S. A Quantitative Approach to Measure Webpage Aesthetics. Int. J. Technol. Hum. Interact. 2020, 16, 53–68. [Google Scholar] [CrossRef]
Figure 1.
Illustration of the positional information for the interface and element.

Figure 2.
Two different interface layout methods. (a) A layout method that places the menu at the top and uses a larger font; (b) A layout method that places the menu on the left side.
Figure 2.
Two different interface layout methods. (a) A layout method that places the menu at the top and uses a larger font; (b) A layout method that places the menu on the left side.

Figure 3.
Corresponding to the segmentation recognition results of the layout methods in Figure 2. (a) Elements recognition results for layout 1; (b) Elements recognition results for layout 2.
Figure 3.
Corresponding to the segmentation recognition results of the layout methods in Figure 2. (a) Elements recognition results for layout 1; (b) Elements recognition results for layout 2.

Figure 4.
The process of multiple regression.

Figure 5.
Four layout examples from among the 55 experimental materials. (a) A minimalist title bar layout; (b) A relatively tight layout; (c) A relatively loose layout; (d) A layout with emphasis on the title bar.
Figure 5.
Four layout examples from among the 55 experimental materials. (a) A minimalist title bar layout; (b) A relatively tight layout; (c) A relatively loose layout; (d) A layout with emphasis on the title bar.

Figure 6.
Heatmap of correlation matrix.

Figure 7.
The process of the entropy method.

Figure 8.
The interface layout evaluation software prototype.

Table 1.
Calculation results of each metric for layout 1 and layout 2.
| Metric | Layout (1) | Layout (2) |
|---|---|---|
| Density | 0.7072 | 0.4425 |
| Symmetry | 0.8709 | 0.7123 |
| Balance | 0.6623 | 0.6296 |
| Proportionality | 0.7205 | 0.7176 |
| Uniformity | 0.2349 | 0.2493 |
| Simplicity | 0.2887 | 0.2182 |
| Sequence | 0.7443 | 0.4990 |
Table 2.
Results of multiple regression analysis.
| Metric | B | SE | t | p | VIF | R2 | F |
|---|---|---|---|---|---|---|---|
| Intercept | −0.430 | 0.614 | −0.699 | 0.026 | - | ||
| X1 | −0.109 | 0.191 | −0.571 | 0.037 | 1.232 | 0.402 | F (7, 42) = 4.029, p = 0.002 |
| X2 | 0.549 | 0.310 | 1.772 | 0.007 | 1.966 | ||
| X3 | 0.107 | 0.310 | 0.343 | 0.023 | 1.614 | ||
| X4 | 0.340 | 0.591 | 0.575 | 0.031 | 1.954 | ||
| X5 | 0.089 | 0.287 | 0.310 | 0.042 | 1.695 | ||
| X6 | 0.483 | 0.152 | 3.179 | 0.001 | 1.269 | ||
| X7 | −0.020 | 0.165 | −0.123 | 0.049 | 1.016 |
Table 3.
The results of the layout aesthetics ranking.
| Subject | Layout 1 | Layout 2 | Layout 3 | Layout 4 | Layout 5 | Layout 6 |
|---|---|---|---|---|---|---|
| 1 | 2 | 3 | 4 | 6 | 5 | 1 |
| 2 | 1 | 4 | 3 | 6 | 5 | 2 |
| 3 | 1 | 5 | 3 | 2 | 6 | 4 |
| 4 | 2 | 1 | 3 | 4 | 5 | 6 |
| 5 | 2 | 4 | 1 | 6 | 5 | 3 |
| 6 | 4 | 1 | 5 | 3 | 2 | 6 |
| 7 | 4 | 1 | 6 | 5 | 2 | 3 |
| 8 | 5 | 6 | 4 | 3 | 2 | 1 |
| 9 | 6 | 5 | 4 | 1 | 3 | 2 |
| 10 | 6 | 1 | 5 | 4 | 2 | 3 |
| 11 | 2 | 4 | 3 | 6 | 5 | 1 |
| 12 | 4 | 3 | 6 | 2 | 5 | 1 |
| 13 | 3 | 1 | 6 | 2 | 5 | 4 |
| 14 | 2 | 3 | 1 | 4 | 6 | 5 |
| 15 | 6 | 1 | 5 | 4 | 2 | 3 |
| 16 | 1 | 3 | 6 | 5 | 2 | 4 |
| 17 | 2 | 1 | 6 | 4 | 3 | 5 |
| 18 | 6 | 2 | 5 | 4 | 1 | 3 |
| 19 | 4 | 2 | 5 | 1 | 3 | 6 |
| 20 | 2 | 4 | 6 | 1 | 3 | 5 |
| Total Rank Sum | 65 | 55 | 87 | 73 | 72 | 68 |
| Rank Average | 3.250 | 2.750 | 4.350 | 3.650 | 3.600 | 3.400 |
| Rank | 2 | 1 | 6 | 5 | 4 | 3 |
Table 4.
The automated calculation results for each metric.
| Layout | X1 | X2 | X3 | X4 | X5 | X6 | X7 |
|---|---|---|---|---|---|---|---|
| 1 | 0.9039 | 0.8109 | 0.8878 | 0.8572 | 0.2721 | 0.6656 | 1.0000 |
| 2 | 0.8316 | 0.9102 | 0.9138 | 0.7709 | 0.2666 | 0.7337 | 1.0000 |
| 3 | 0.5309 | 0.4258 | 0.4386 | 0.8139 | 0.2849 | 0.6379 | 0.7500 |
| 4 | 0.5673 | 0.5276 | 0.8246 | 0.7873 | 0.4154 | 0.5236 | 1.0000 |
| 5 | 0.5680 | 0.7400 | 0.7652 | 0.7753 | 0.4333 | 0.6122 | 1.0000 |
| 6 | 0.6611 | 0.6362 | 0.7380 | 0.8088 | 0.3934 | 0.6363 | 1.0000 |
Table 5.
Multiple regression comprehensive evaluation values and ranking results.
| Layout | Comprehensive Values | Rank |
|---|---|---|
| 1 | 0.6899973 | 1 |
| 2 | 0.6453237 | 2 |
| 3 | 0.4571699 | 5 |
| 4 | 0.4497229 | 6 |
| 5 | 0.4609067 | 4 |
| 6 | 0.5399016 | 3 |
Table 6.
Entropy method comprehensive evaluation values and rankings.
| Layout | Comprehensive Values | Rank |
|---|---|---|
| 1 | 0.767298 | 1 |
| 2 | 0.755409 | 2 |
| 3 | 0.551151 | 6 |
| 4 | 0.649024 | 5 |
| 5 | 0.671581 | 4 |
| 6 | 0.681377 | 3 |
Table 7.
The ranking results obtained through the validation experiment, multiple regression, and the entropy method.
Table 7.
The ranking results obtained through the validation experiment, multiple regression, and the entropy method.
| Layout | Ranking Method | Multiple Regression | Entropy Method |
|---|---|---|---|
| 1 | 2 | 1 | 1 |
| 2 | 1 | 2 | 2 |
| 3 | 6 | 5 | 6 |
| 4 | 5 | 6 | 5 |
| 5 | 4 | 4 | 4 |
| 6 | 3 | 3 | 3 |
Disclaimer/Publisher’s Note: The statements, opinions and data contained in all publications are solely those of the individual author(s) and contributor(s) and not of MDPI and/or the editor(s). MDPI and/or the editor(s) disclaim responsibility for any injury to people or property resulting from any ideas, methods, instructions or products referred to in the content. |
© 2024 by the authors. Licensee MDPI, Basel, Switzerland. This article is an open access article distributed under the terms and conditions of the Creative Commons Attribution (CC BY) license (https://creativecommons.org/licenses/by/4.0/).
Share and Cite
MDPI and ACS Style
Wang, X.; Tong, M.; Song, Y.; Xue, C. Utilizing Multiple Regression Analysis and Entropy Method for Automated Aesthetic Evaluation of Interface Layouts. Symmetry 2024, 16, 523. https://doi.org/10.3390/sym16050523
AMA Style
Wang X, Tong M, Song Y, Xue C. Utilizing Multiple Regression Analysis and Entropy Method for Automated Aesthetic Evaluation of Interface Layouts. Symmetry. 2024; 16(5):523. https://doi.org/10.3390/sym16050523
Chicago/Turabian StyleWang, Xinyue, Mu Tong, Yukun Song, and Chengqi Xue. 2024. "Utilizing Multiple Regression Analysis and Entropy Method for Automated Aesthetic Evaluation of Interface Layouts" Symmetry 16, no. 5: 523. https://doi.org/10.3390/sym16050523
Note that from the first issue of 2016, this journal uses article numbers instead of page numbers. See further details here.