1. Introduction
The concept of symmetry belongs to the concepts of the highest order in terms of generality. These terms are called categories, and they cannot be determined simply, but rather by relating them to a series of other terms: part, whole, structure, element, and law. That is why symmetry as a category is defined differently in various sources. There are usually two types of approaches: symmetry represents harmonious, aesthetic proportionality, and harmony of parts such that it reflects beauty and perfection; and the second approach is more precise and presents symmetry as a well-defined concept of balance that can be shown and proven in accordance with the rules of the formal system such as geometry, mathematics, physics, and chemistry. Different types of symmetries occur in various scientific fields. For example, symmetry in geometry is a characteristic of geometric figures and other abstract mathematical elements when there is a correspondence with respect to a center, axis, or plane. In nanotube physics, the distribution of channeled ions is symmetric whether the nanotubes are radially deformed or not or whether the nanotubes are carbon or not. Symmetric distributions of protons channeled through nanotubes are shown in [
1,
2].
Symmetry has been underutilized in the understanding of the mechanics of neural networks. Symmetry can provide a theoretical framework based on the intrinsic symmetries built into the network architecture that are present for any dataset [
3]. Symmetry in deep learning can explore various types of fundamental properties of nonlinearity and the connection to symmetries of weight space [
4]. In the study [
5], a new method was proposed that automatically detects symmetries of a dataset using a deep learning method.
Aerosols are solid particles or small liquid droplets formed from smoke, dust, fly ash, and condensed gaseous substances that can be found in atmospheric air. Some of these particles are so large that if they are bright, they can be seen as fog or cloud, or if they are dark, they can be seen as smoke or soot. Forecasting the global aerosol optical thickness (AOT) can help a variety of scientific considerations beyond those of global air pollution, such as the influence of the Saharan air layer on Atlantic tropical cyclones [
6].
AOT serves as a key metric for understanding the impact of aerosols on human health and the Earth’s climate. Its range from 0 to 1 covers the different aerosol scenarios encountered in our atmosphere. An AOT value of less than 0.1 corresponds to a crystal-clear sky with maximum visibility. A value of 1 indicates very hazy conditions due to the significant presence of aerosols [
7].
Based on the attention mechanism, in the study [
8], the U-Net model adopts a symmetric encoder–decoder structure, and this symmetric network structure is concise and stable, greatly improving the remote sensing image segmentation effect. The U-Net is a very efficient image segmentation method that has excellent performance in many image segmentation tasks, especially medical image segmentation tasks. The U-Net was developed based on a fully convolutional network architecture and was first applied to biomedical image segmentation in 2015 [
9].
Some studies have shown that attention mechanisms can improve classification effects [
10,
11]. In this study, a model on the basis of the U-Net and attention mechanism is proposed like in [
8]. This improvement allows the model to better focus on areas with high aerosol optical thickness (AOT). The attention module serves to learn the useful patterns of the input image and which important features it should focus on to perform its task [
8].
In order to optimize the parameters of the deep learning model, authors often use metaheuristics as a method that performs a fine search for optimal values in a multidimensional space. Metaheuristic methods are usually nature-inspired and can be classified as evolutionary-, swarm-, physics-, human-, biology-, system-, math-, or music-based [
12].
The structure of this paper is as follows: The methodology and literature review are described in
Section 2. Subsequently, the model design is given in
Section 3. The results are presented and discussed in
Section 4. Finally,
Section 5 summarizes the work of this study and future work.
3. Symmetric U-Net Model
The model is written in Python (3.10.13 version) (Jupyter Notebook environment) using tensorFlow/keras as well as other data science libraries. Like in study [
8], the proposed architecture was obtained by modifying the original U-Net model maintaining a symmetric structure. We also tried the ConvLSTM2D, Normalization, and Dropout layers proposed in the study [
16], as well as the Conv3D and AvgPooling3D layers.
The original U-Net model [
9], as well as the model in a similar study [
8], is intended for the purpose of segmenting the input images. The model developed in this study is primarily adapted from the original one by using image sequences that provide the model with historical changes within the used image sequence. This time window, which does not exist in the original setup, provides the model with the ability to predict the future segmented image. Therefore, by introducing the third time dimension in our case, ConvLSTM2D was used instead of the Conv2D layer; MaxPooling3D was used instead of MaxPooling, and UpSampling3D was used instead of UpSampling.
During the manual search of effective and useful layers, we found that Conv3D, Attention, Dropout, and AvgPooling3D layers do not have a positive impact on the model results. Also in the mentioned process, we found that the ConvLSTM2D, Normalization, and MaxPooling3D layers have a positive impact on the model. The model development process was divided into two phases: the first was manual, and the second phase was automated metaheuristic screening. The reason for this is that as the required variables increase in metaheuristic search, hardware resources and time increase significantly, a problem better known as the ‘curse of dimensionality’ [
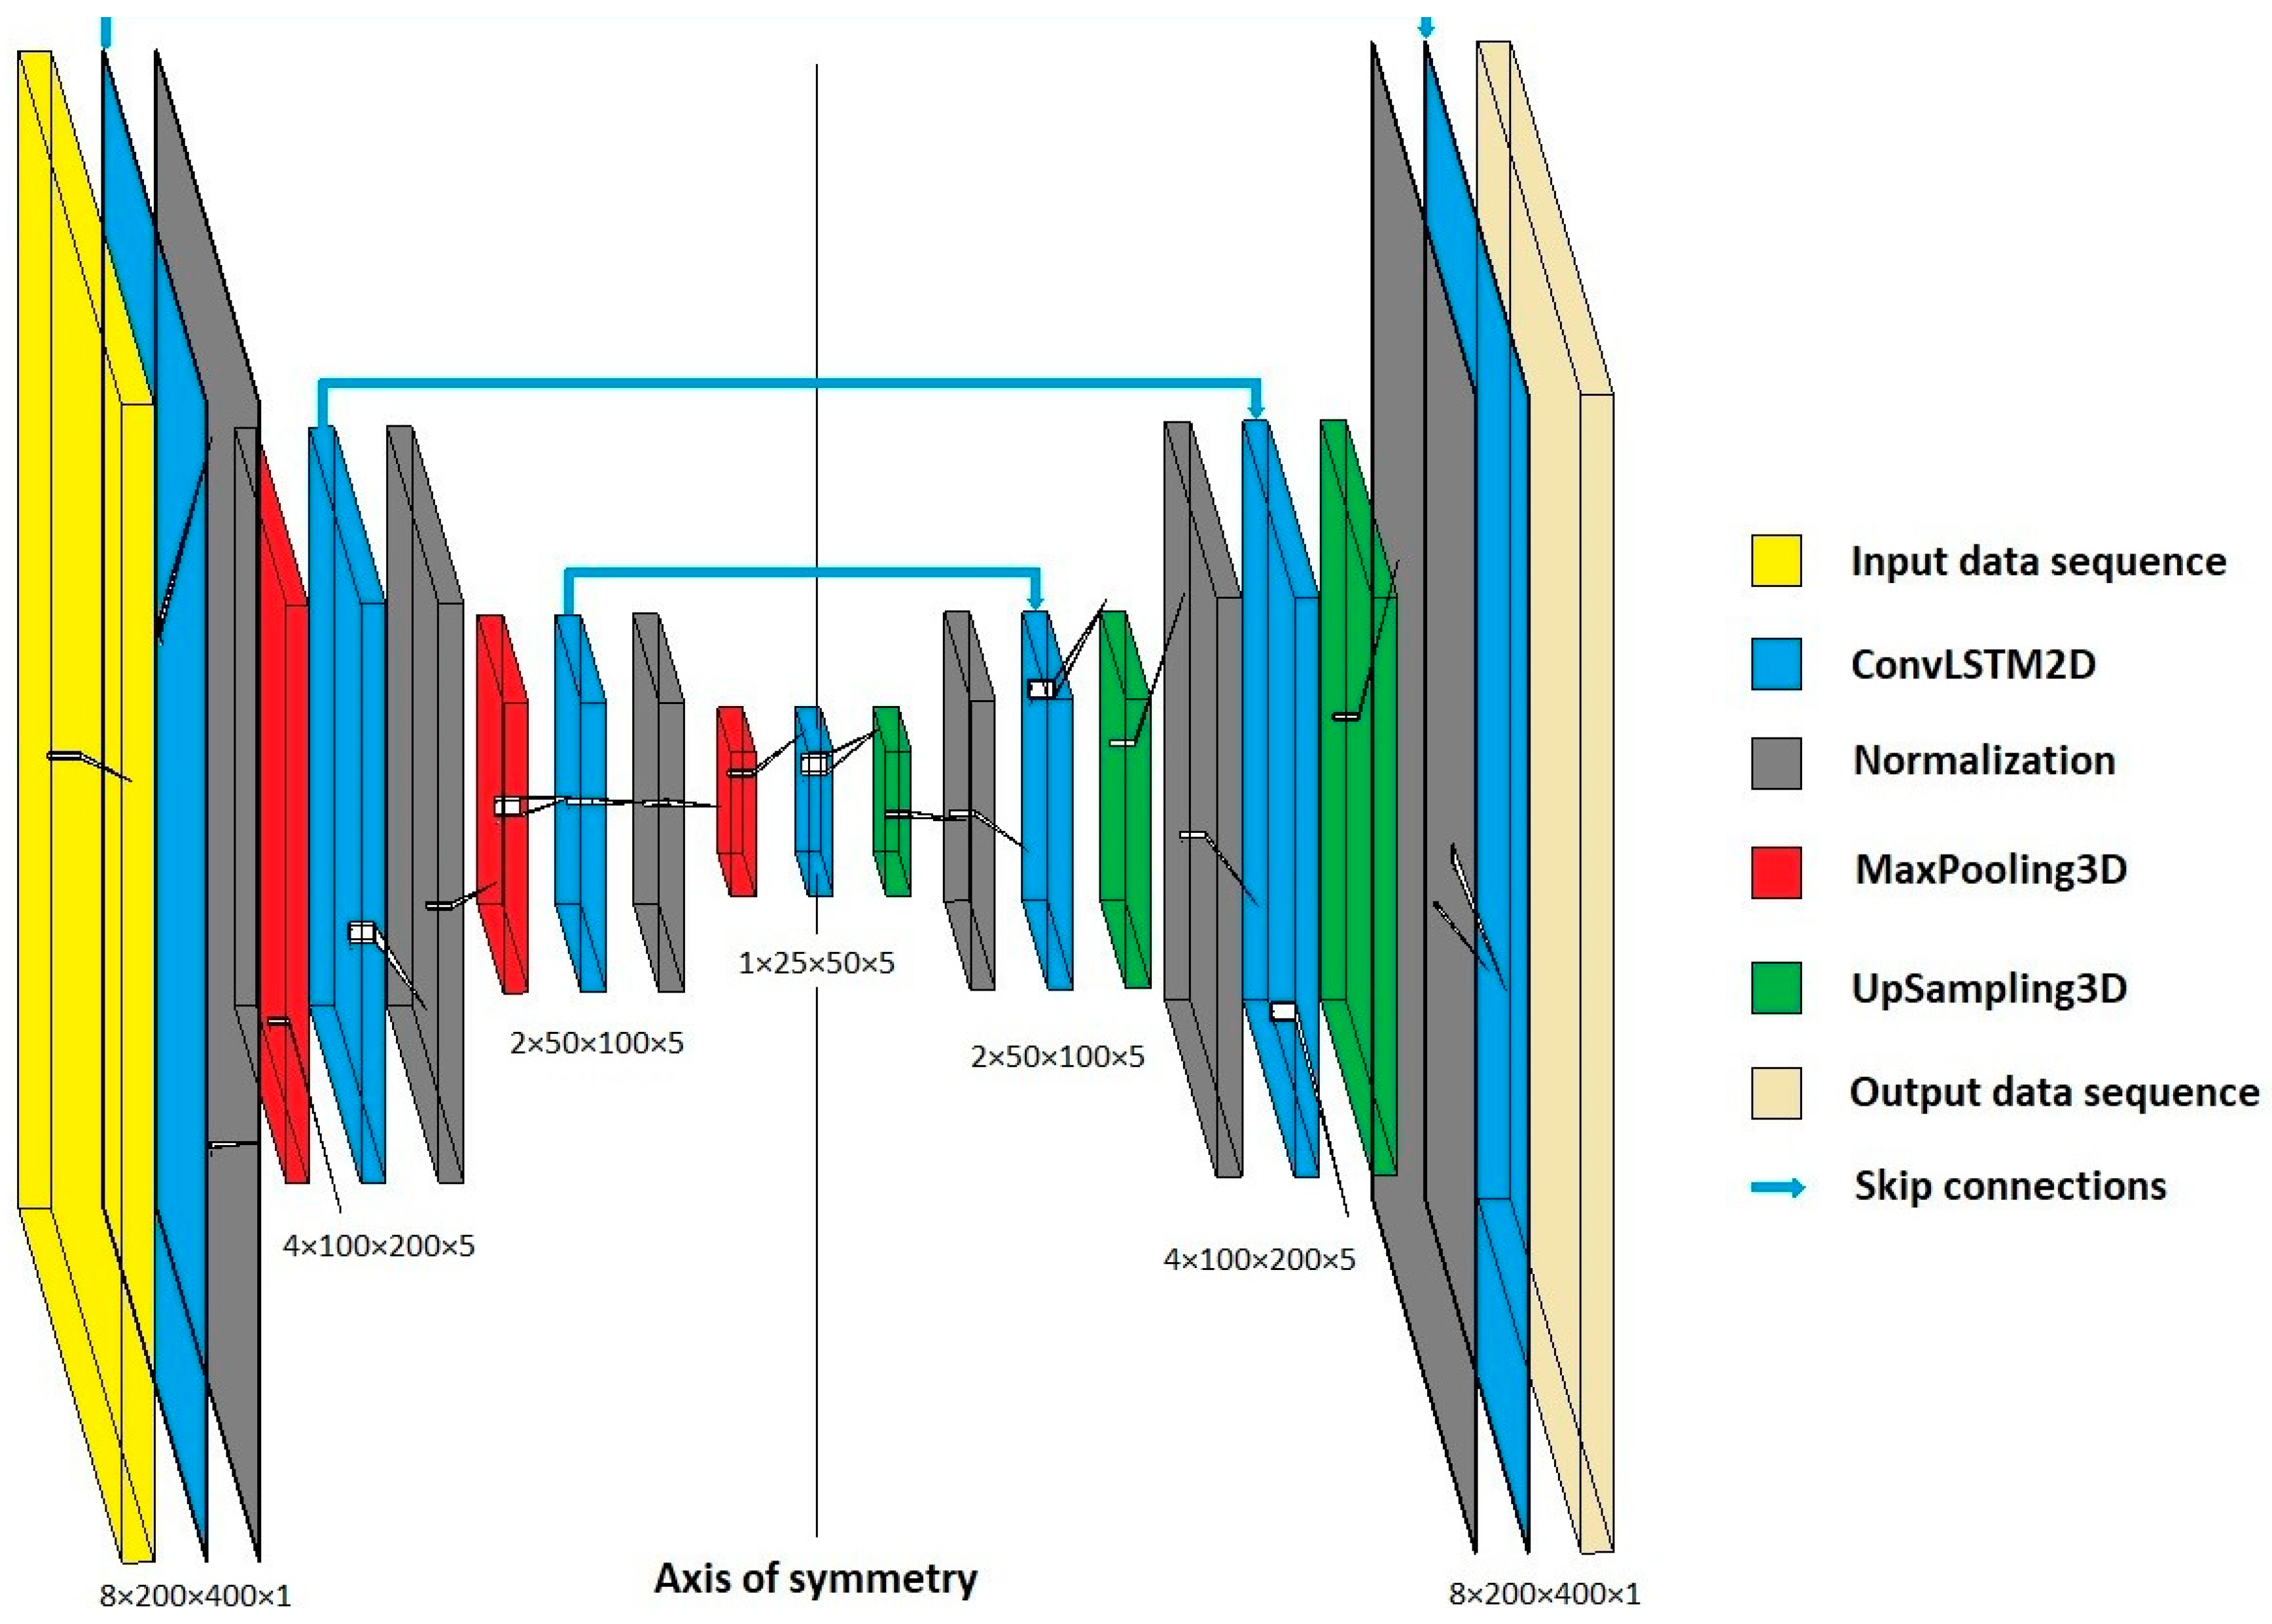
20]. The best combination of layers in a symmetric U-Net model that we found is shown in
Figure 1. The encoding path is on the left half (side), while the decoding path is on the right half (side). Every block in the encoding path of the U-Net contains a ConvLSTM2D, Normalization, and MaxPooling3D layer. The max pooling reduces the dimensionality of each feature map. Each block in the decoding path contains symmetrically to the encoding path the up-sampling and dimension recovery, the fusion operation, as well as Normalization and ConvLSTM2D layers. Each blue box corresponds to a multi-channel feature map.
4. Results and Discussion
Based on the proposed structure of the model, hyperparameters were tuned, which significantly affected the results of the model. The stochastic nature of deep learning models introduces a certain level of uncertainty. Due to the study of very small individual influences of the required parameters on the results of the model, the learning process was adapted to the deterministic principle.
The stochastic nature of the deep learning model occurred due to the random setting of the initial values of weights and biases, as well as due to the parallelization process of training where the results of individual epochs were not obtained simultaneously [
21]. A deterministic learning process can be enabled in the tesorflow/keras environment, but it leads to an increase in training time. We solved the problem of different weights and biases by setting the seed work.
The bias values in all ConvLSTM2D layers were performed by setting the bias_initializer parameter to 0. The weights values were set by defining the set_random_seed parameter, as well as by defining the GlorotUniform and orthogonal initializers to specific seed values. The mentioned two initializers were used for the kernel_initializer and recurrent_initializer parameters of the ConvLSTM2D layers.
We also achieved prevention of overfitting by using the EarlyStopping and ReduceLROnPlateau as regulation methods during learning. Monitors for these methods were tied to metrics achieved on the validation dataset, so the test dataset was used exclusively for testing purposes.
The selected loss function ‘BinaryCrossentropy’ was calculated based on the differences between the prediction and the original images for the entire data sequence; i.e., for a set of eight images, while the metric ‘BinaryAccuracy’ was modified to calculate the difference for only the last output image, which represents the prediction of the image of high aerosol concentrations. In this way, the regulation of the learning rate parameter during the learning process was related to the quality of the last image, i.e., prediction, and the regulation of EarlyStopping was related to the possibility of finding patterns in the time domain of the entire segment, i.e., sequence.
During the metaheuristic process, the required parameters are those that showed potential during the manual search. The mentioned parameters and their range with optimal values are given in
Table 1.
The FOX metaheuristic was initialized to search the above six parameters of different types and ranges with a population size of 10 and 15 epochs. The parameters Recurrent dropout, Number of filters in hidden layers, Activation, and Recurrent activation refer to the ConvLSTM2D layers. The Threshold value represents the limit when classifying pixel values in model output data. The required criterion was finding the maximum value of the AUC-PR metric on the test dataset. The range of values obtained for this metric was from 0.033 to 0.572, where the maximum value of the metric was obtained with the values shown in
Table 1 as the optimal solution.
During the search, the FOX algorithm sometimes repeated the entire combination of parameter values, which makes it suitable for working with deep learning models that are stochastic in nature. The distribution of values for the searched parameters in the metaheuristic process of the mentioned algorithm is given in
Figure 2.
The candidate values belong to the set of values of the defined range for each required parameter by the FOX metaheuristic algorithm given in the column Range/Values,
Table 1. In the cases of a continuous domain search by searching for decimal values, for better visibility of the graphics, rounding was performed to 0.1, 0.05, and 0.01 for Threshold, Recurrent Dropout, and Learning Rate, respectively. The Solution represents the optimal value for each parameter individually according to the FOX metaheuristic algorithm, and these values are given in the Optimal solution column,
Table 1.
As can be seen from
Figure 2, the FOX algorithm most often searches areas close to optimal values, which is expected for metaheuristic algorithms. The percentage of searches in areas close to Optimal were 95.03%, 91.93%, 77.64%, 56.52%, 27.33%, and 0.62% for Activation, Recurrent activation, Threshold, Recurrent dropout, Number of filters in hidden layers, and Learning rate, respectively. However, with some parameters, a large retention is observed in areas that are not of interest, such as with the search Learning rate and Number of filters in hidden layers.
In order to better understand mutual relations, Pearson correlation testing was performed between all required parameters and the obtained AUC-PR metric,
Table 2.
From
Table 2, it can be concluded that the Learning rate parameter has the strongest linear Pearson correlation with the AUC-PR metric with a value of 0.506. The next-strongest correlation with the mentioned metric is Number of filters in hidden layers with 0.475. On the other hand, the Activation function of the ConvLSTM2D layers of the deep learning model has the lowest correlation with the selected metric with 0.05. Heatmap colors given in the
Table 2 are arranged from green to red and visually represent lowest to greatest values respectively.
On the basis of the previous two tests, it can be concluded that the time spent in the area close to the optimal value for some required parameter in FOX algorithms is inversely proportional to the intensity of the linear Pearson correlation, viewed relative to all parameters.
Taking into account the fact that the achieved prediction results of the machine learning model are highly dependent on the database and its preparation, we used an objective way of presenting the results through the ddc and dtc criteria, as well as the relative coefficients ddr and dtr [
17]. Comparing the best-achieved result of the AUC-PR metric of 0.572 with the ddc and dtc criteria of 0.368 and 0.496, respectively, it can be concluded that the symmetric U-Net model is capable of generating adequate data and finding patterns in the time domain. The calculated relative coefficients ddr and dtr have values of 1.554 and 1.153, respectively. The previously developed ResNet3D-101 model with transfer learning [
17] gave an AUC-PR metric for global aerosol prediction of 0.553, achieving values of ddr and dtr relative coefficients of 1.502 and 1.115, respectively. Based on the comparison of the values of the relative coefficients, it can be can concluded that the symmetric U-Net model from this study is capable of generating better data than the developed ResNet3D-101 model from previous study, i.e., better-achieved relative coefficient ddr andmore capable of finding patterns in the time domain based on a better relative coefficient dtr.
5. Conclusions and Future Research
The paper used a metric based on precision and recall rates that describe the success of reproducing positive labels, i.e., high concentrations of aerosols; thus, the AUC-PR metric is adequate for this application. By establishing a deterministic mode when training the model, we ensured the absolute reproducibility of the results during the metaheuristic process, which provided us with an insight into the finest influences of the required parameters on the results.
The model training process was adapted to finding patterns in the time domain via a loss function for the entire sequence of images and through EarlyStopping controller. The quality of the last image in the sequence for aerosol prediction was regulated through the metric modified for only the last image and through the process of reducing the learning rate during training. The Fox metaheuristic has proven to be very effective for this purpose. It has shown adaptability to the stochastic nature of deep learning algorithms, but it would be good if there was a Boolean parameter for deterministic to increase efficiency for such use. Based on the distribution of the required parameters as well as Pearson linear correlation, it can be concluded that the FOX algorithm spends the most time in areas close to the optimal value with the weakest correlation of the parameter with the required metric and vice versa.
The proposed symmetric U-Net model for forecasting high concentrations of aerosols achieved an AUC-PR metric of 0.572. Based on the calculated ddc and dtc criteria, the developed model is capable of generating adequate data and finding patterns in the time domain. Based on the comparison of the achieved relative coefficients ddr and dtr, the proposed symmetric model generates better quality data and is more capable of finding patterns in the time domain than the previously developed ResNet3D-101 model with transfer learning technique [
17].
Considering that the concept of the symmetric U-Net model is well proven in this study for predicting high concentrations of aerosols with segmented satellite images, in further research, we plan to also apply it to datasets of a local character with a potential connection to other physical quantities measured from the ground.

 ,
, 

