Article

Adaptive Image Matching Using Discrimination of Deformable Objects

1
Department of Electronic Engineering, Inha University, 22212 Incheon, Korea
2
Department of Computer Science and Information Engineering, Inha University, 22212 Incheon, Korea
*
Authors to whom correspondence should be addressed.
Symmetry 2016, 8(7), 68; https://doi.org/10.3390/sym8070068
Submission received: 20 April 2016 / Revised: 11 July 2016 / Accepted: 13 July 2016 / Published: 21 July 2016
(This article belongs to the Special Issue Symmetry in Systems Design and Analysis)

Abstract

:
We propose an efficient image-matching method for deformable-object image matching using discrimination of deformable objects and geometric similarity clustering between feature-matching pairs. A deformable transformation maintains a particular form in the whole image, despite local and irregular deformations. Therefore, the matching information is statistically analyzed to calculate the possibility of deformable transformations, and the images can be identified using the proposed method. In addition, a method for matching deformable object images is proposed, which clusters matching pairs with similar types of geometric deformations. Discrimination of deformable images showed about 90% accuracy, and the proposed deformable image-matching method showed an average 89% success rate and 91% accuracy with various transformations. Therefore, the proposed method robustly matches images, even with various kinds of deformation that can occur in them.

Graphical Abstract

1. Introduction

Computer vision lets a machine or computer see and understand objects, just like human vision. The purpose of computer vision is to recognize object in an image and/or to understand the relationships between objects. While recent research has focused on recognition based on big data and deep learning (DL) [1], traditional computer vision methods are still widely used in some specific areas. While DL is not yet used in many applications due to the requirement for high computing power and big data, traditional research based on hand-craft techniques, like feature detection and feature matching, are actively used in various applications, such as machine vision, image stitching, object tracking, and augmented reality. Image matching is matching similar images or objects, even under geometric transformations, such as translation; optical, scale, and rotation transformations; affine transformations, which are complex transformations; and viewpoint change. The new current challenge is image matching of deformable objects [2]. In the real world, deformable objects encompass the majority of all objects. In particular, research related to fashion items, such as clothes, is conducted because of the rapid growth in Internet shopping [3]. However, since deformable-object matching has a different target than the existing image-matching methods, feature-detection and -matching methods are not identical. As such, much research has been conducted into achieving both objectives at the same time, but without substantial results. Since deformable models cannot be defined by a specific transformation model, there are numerous difficulties in such research. Early deformable matching methods were researched for augmented reality, remote exploration, and image registration for medical images, and it was not until recently that research on deformable-object matching appeared.
A good matching algorithm is characterized by robustness, independence, and a fast matching speed [4]. Robustness is recognizing that two images are identical if they have exactly the same objects in them. However, the algorithm must recognize identical objects even under transformation. Independence is recognizing the differences between two images containing objects that are different. Lastly, fast matching is the property of rapidly determining a match. Without fast matching, an algorithm cannot process many images, and hence, cannot be a good algorithm. The biggest disadvantage to previous deformable object-matching algorithms is slow matching. Therefore, in this paper, as a solution to the problems of the aforementioned methods (and by considering these characteristics), we propose an efficient algorithm that operates the same way for both rigid and deformable objects.
The rest of this paper is composed as follows. Section 2 introduces the existing image-matching methods. Section 3 introduces the proposed algorithm, followed by Section 4, where the experimental results from image sets with various deformable objects are examined and analyzed. Finally, Section 5 evaluates the proposed algorithm, and concludes the paper.

2. Related Works

In this section, we introduce the known feature-matching methods for computer vision. Image-matching methods can be largely classified into matching rigid objects and matching deformable objects. Rigid object-matching methods mostly consist of those that examine geometric relationships based on feature correspondence, and that show good performance under transformations like viewpoint change and affine transformation. However, matching performance degrades when deformable objects are the target. For deformable object-matching, various methods are used depending on the specific image set. In other words, there is no generalized procedure. Moreover, there is the common problem of generally slow execution time. We introduce three categories of common feature-point matching methods, which are classified in terms of methodology [5].

2.1. Neighborhood-Based Matching

Early researchers used neighbor-pixel information around the points to find feature correspondence. Neighborhood-based methods include threshold-based, nearest neighbor (NN), and nearest neighbor distance ratio (NNDR) [6]. In the threshold-based method, if the distance between the descriptors is below a predefined threshold value, the features are considered to be matched. The problem in this method is that a single point in the source image may have several matched points in the target image. In the NN approach, two points are matched if their descriptor is in the nearest neighborhood and the distance is below a specific threshold. Therefore, the problem with the threshold-based method is solved. However, this method may result in many false positives between images, known as outliers. This is overcome by random sample consensus (RANSAC), which was proposed by Fischler and Bolles [7]. RANSAC is a good outlier-removal method, and is widely used for object detection and feature matching.

2.2. Statistical-Based Matching

Logarithmic distance ratio (LDR), proposed by Tsai et al. [8], is a technique for fast image indexing, which calculates the similarities in feature properties, including scale, orientation and position, and recognizes similar images based on lower similarity distance. This technique is effectively used to rapidly search similar image candidates in large image datasets. Lepsøy et al. proposed the distance ratio statistic (DISTRAT) method [9], which adopts LDR for image matching. They found that the LDR of inlier matching pairs has a specific ratio when LDR is calculated using feature coordinates only. Therefore, the final matching decision is based on a statistical analysis whereby the LDR histogram is narrower with more inliers. This method has the advantage of performance equivalent to RANSAC while having a faster matching speed, and was eventually selected as the standard in Moving Picture Expert Group (MPEG)—Compact Descriptors for Visual Search (CDVS) [10].

2.3. Deformable Object-Based Matching

The aforementioned matching algorithms are optimized for rigid objects. However, most real-world objects are deformable. Previously proposed feature-based deformable object-matching methods include transformation model-based [11], mesh-based [12], feature clustering [13], and graph-matching [14] methods. Transformation model-based methods require high complexity, because they operate under a pixel-based model. Therefore, feature-based methods that are not pixel-based were proposed. Agglomerative correspondence clustering (ACC), proposed by Cho and Lee [15], is a method that calculates the correspondence between each matching pair, and clusters matching pairs with a similar feature correspondence. ACC defines feature correspondence as the difference between the points calculated using the homograph model of matching pairs and the point that was actually matched. Then, matching pairs with a small difference are considered to have a locally similar homography, and are hierarchically clustered. Unlike previous methods, ACC will cluster matching pairs with a similar homograph by calculating the geometric similarity between each matching pair, rather than classifying matching pairs into inliers and outliers. While ACC has the disadvantages of appreciably high complexity and a high false positive rate, it shows the best performance when only the true rate is considered. As such, Improved ACC was introduced as an enhanced version of ACC [16].

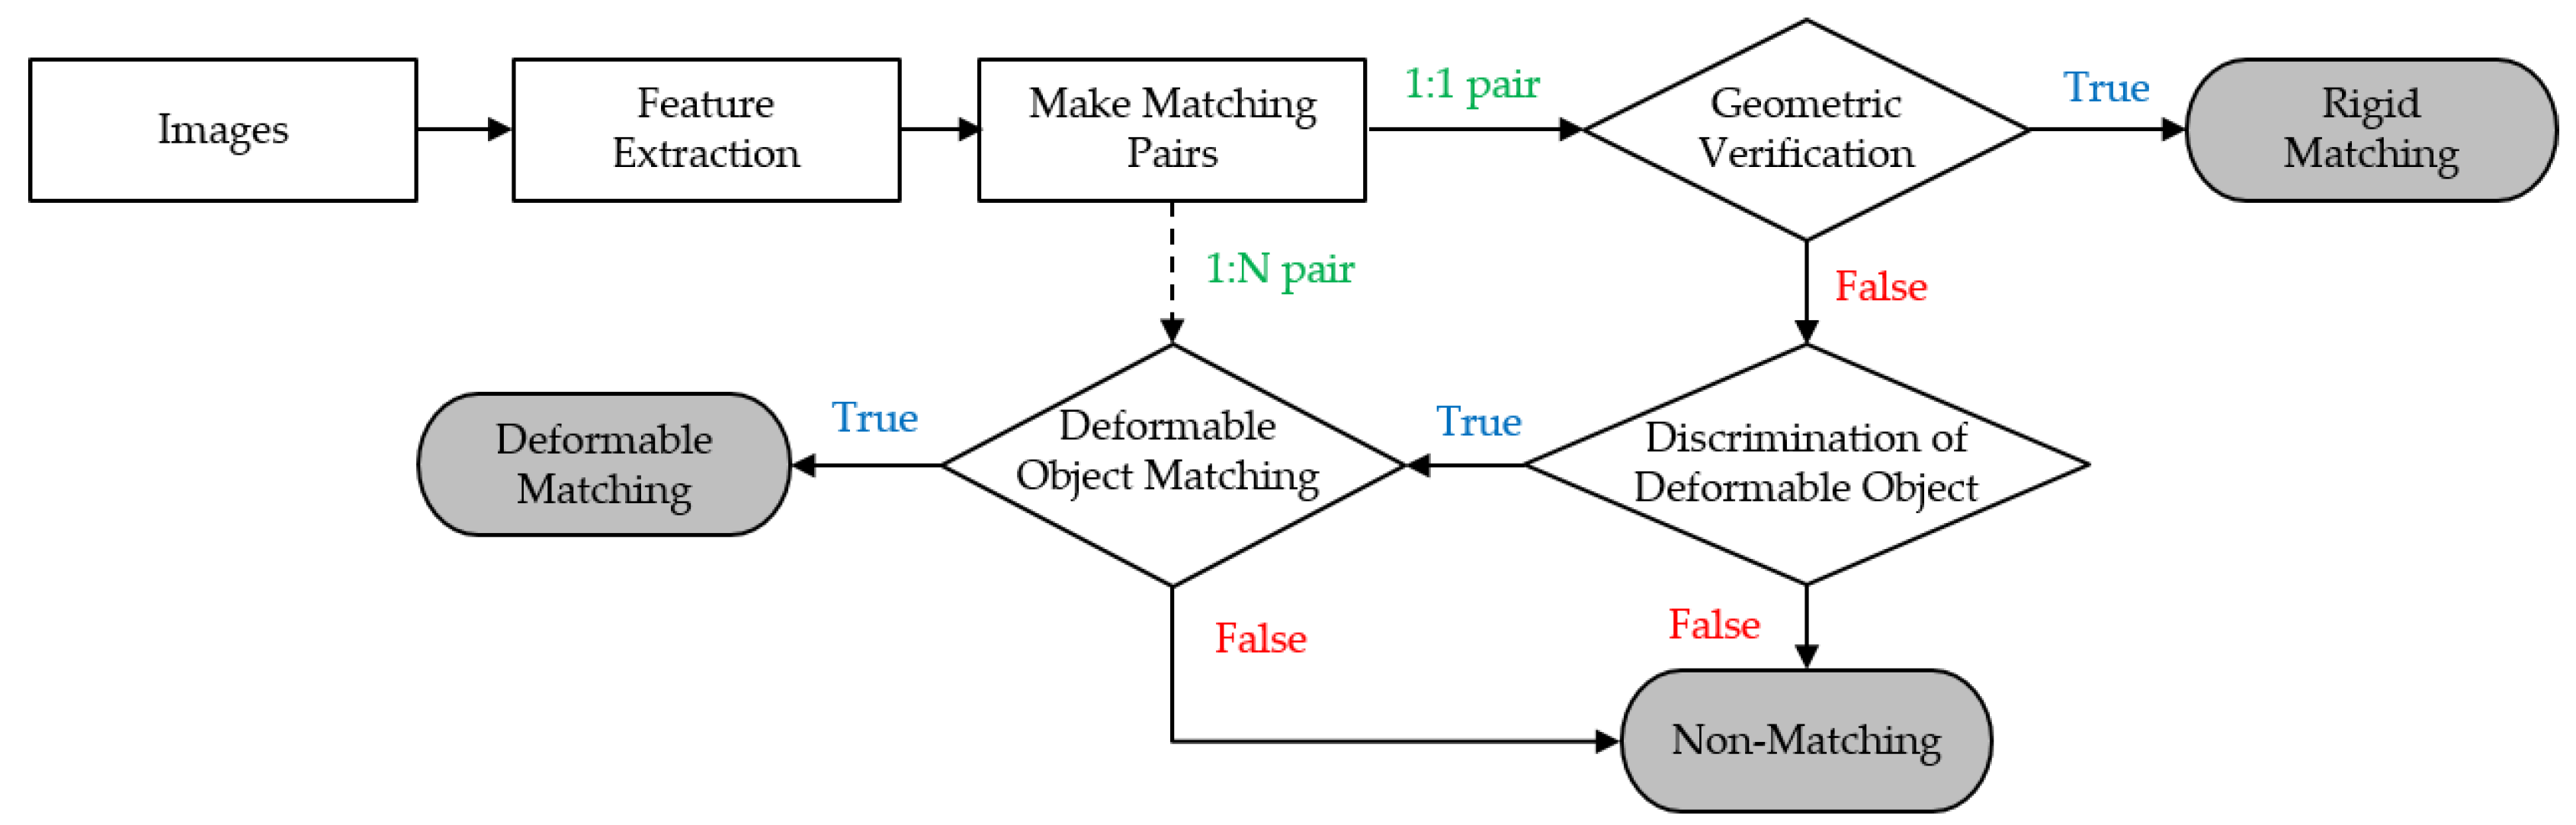
3. Proposed Algorithm

RANSAC shows robust performance against geometric transformation of rigid objects. However, it does not offer good performance when matching deformable objects. Meanwhile, deformable object-matching methods generally have high complexity, which presents difficulty in applications that require fast matching. The easiest solution to this issue is to first perform rigid object-matching and match the remaining non-matched points using deformable object-matching methods. However, this is an inefficient solution. Therefore, it is more effective to selectively adopt the matching method, as long as it can discriminate deformable objects. As a solution, we propose discrimination of deformable transformations based on statistical analysis of matching pairs, and the subsequent use of the corresponding matching method. For example, if there are no inliers at all from among numerous matching pairs, then these are likely to be non-matching pairs. Moreover, even if there are some inliers, they are unlikely to be a match if the inlier ratio is low. Since the inlier ratio is low for deformable objects, it is impossible to obtain good results. This paper proposes discrimination of possible deformable objects through statistical analysis of such matching information and supervised learning.
Figure 1 shows a diagrammatic representation of the proposed image-matching process. First of all, features are detected from the image, and candidate matching pairs are found. Final matching is examined through geometric verification. The algorithm is an adaptive matching method wherein the possibility of the candidate matching pair being a deformable object is examined through discrimination of the deformable object (using the proposed algorithm) within the candidate matching pairs that do not satisfy geometric verification, Deformable object-matching is only performed on matching pairs that are determined to be deformable objects. If the algorithm cannot discriminate the deformable objects well, it is an inefficient algorithm. Therefore, how well the algorithm discriminates deformable objects significantly affects the overall performance.

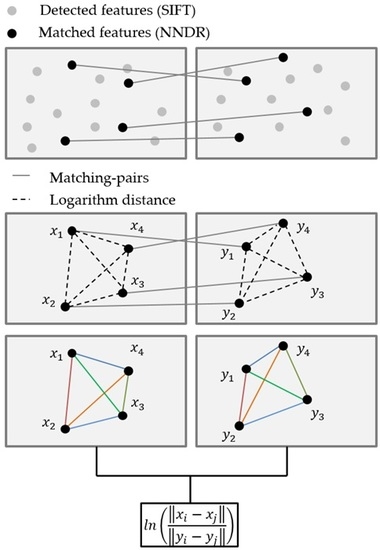
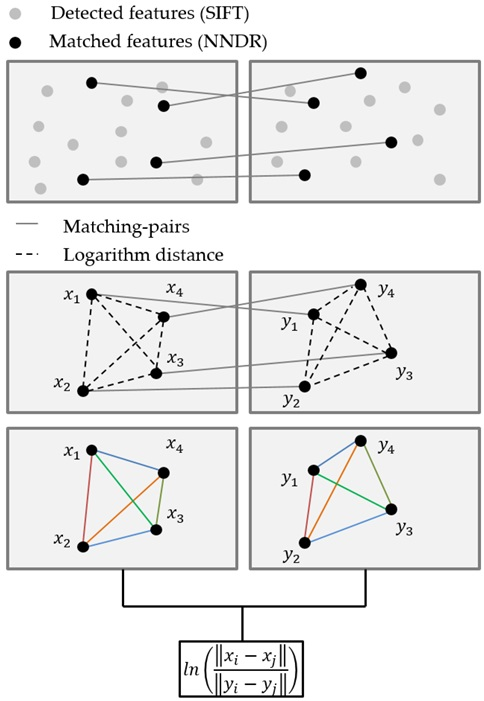
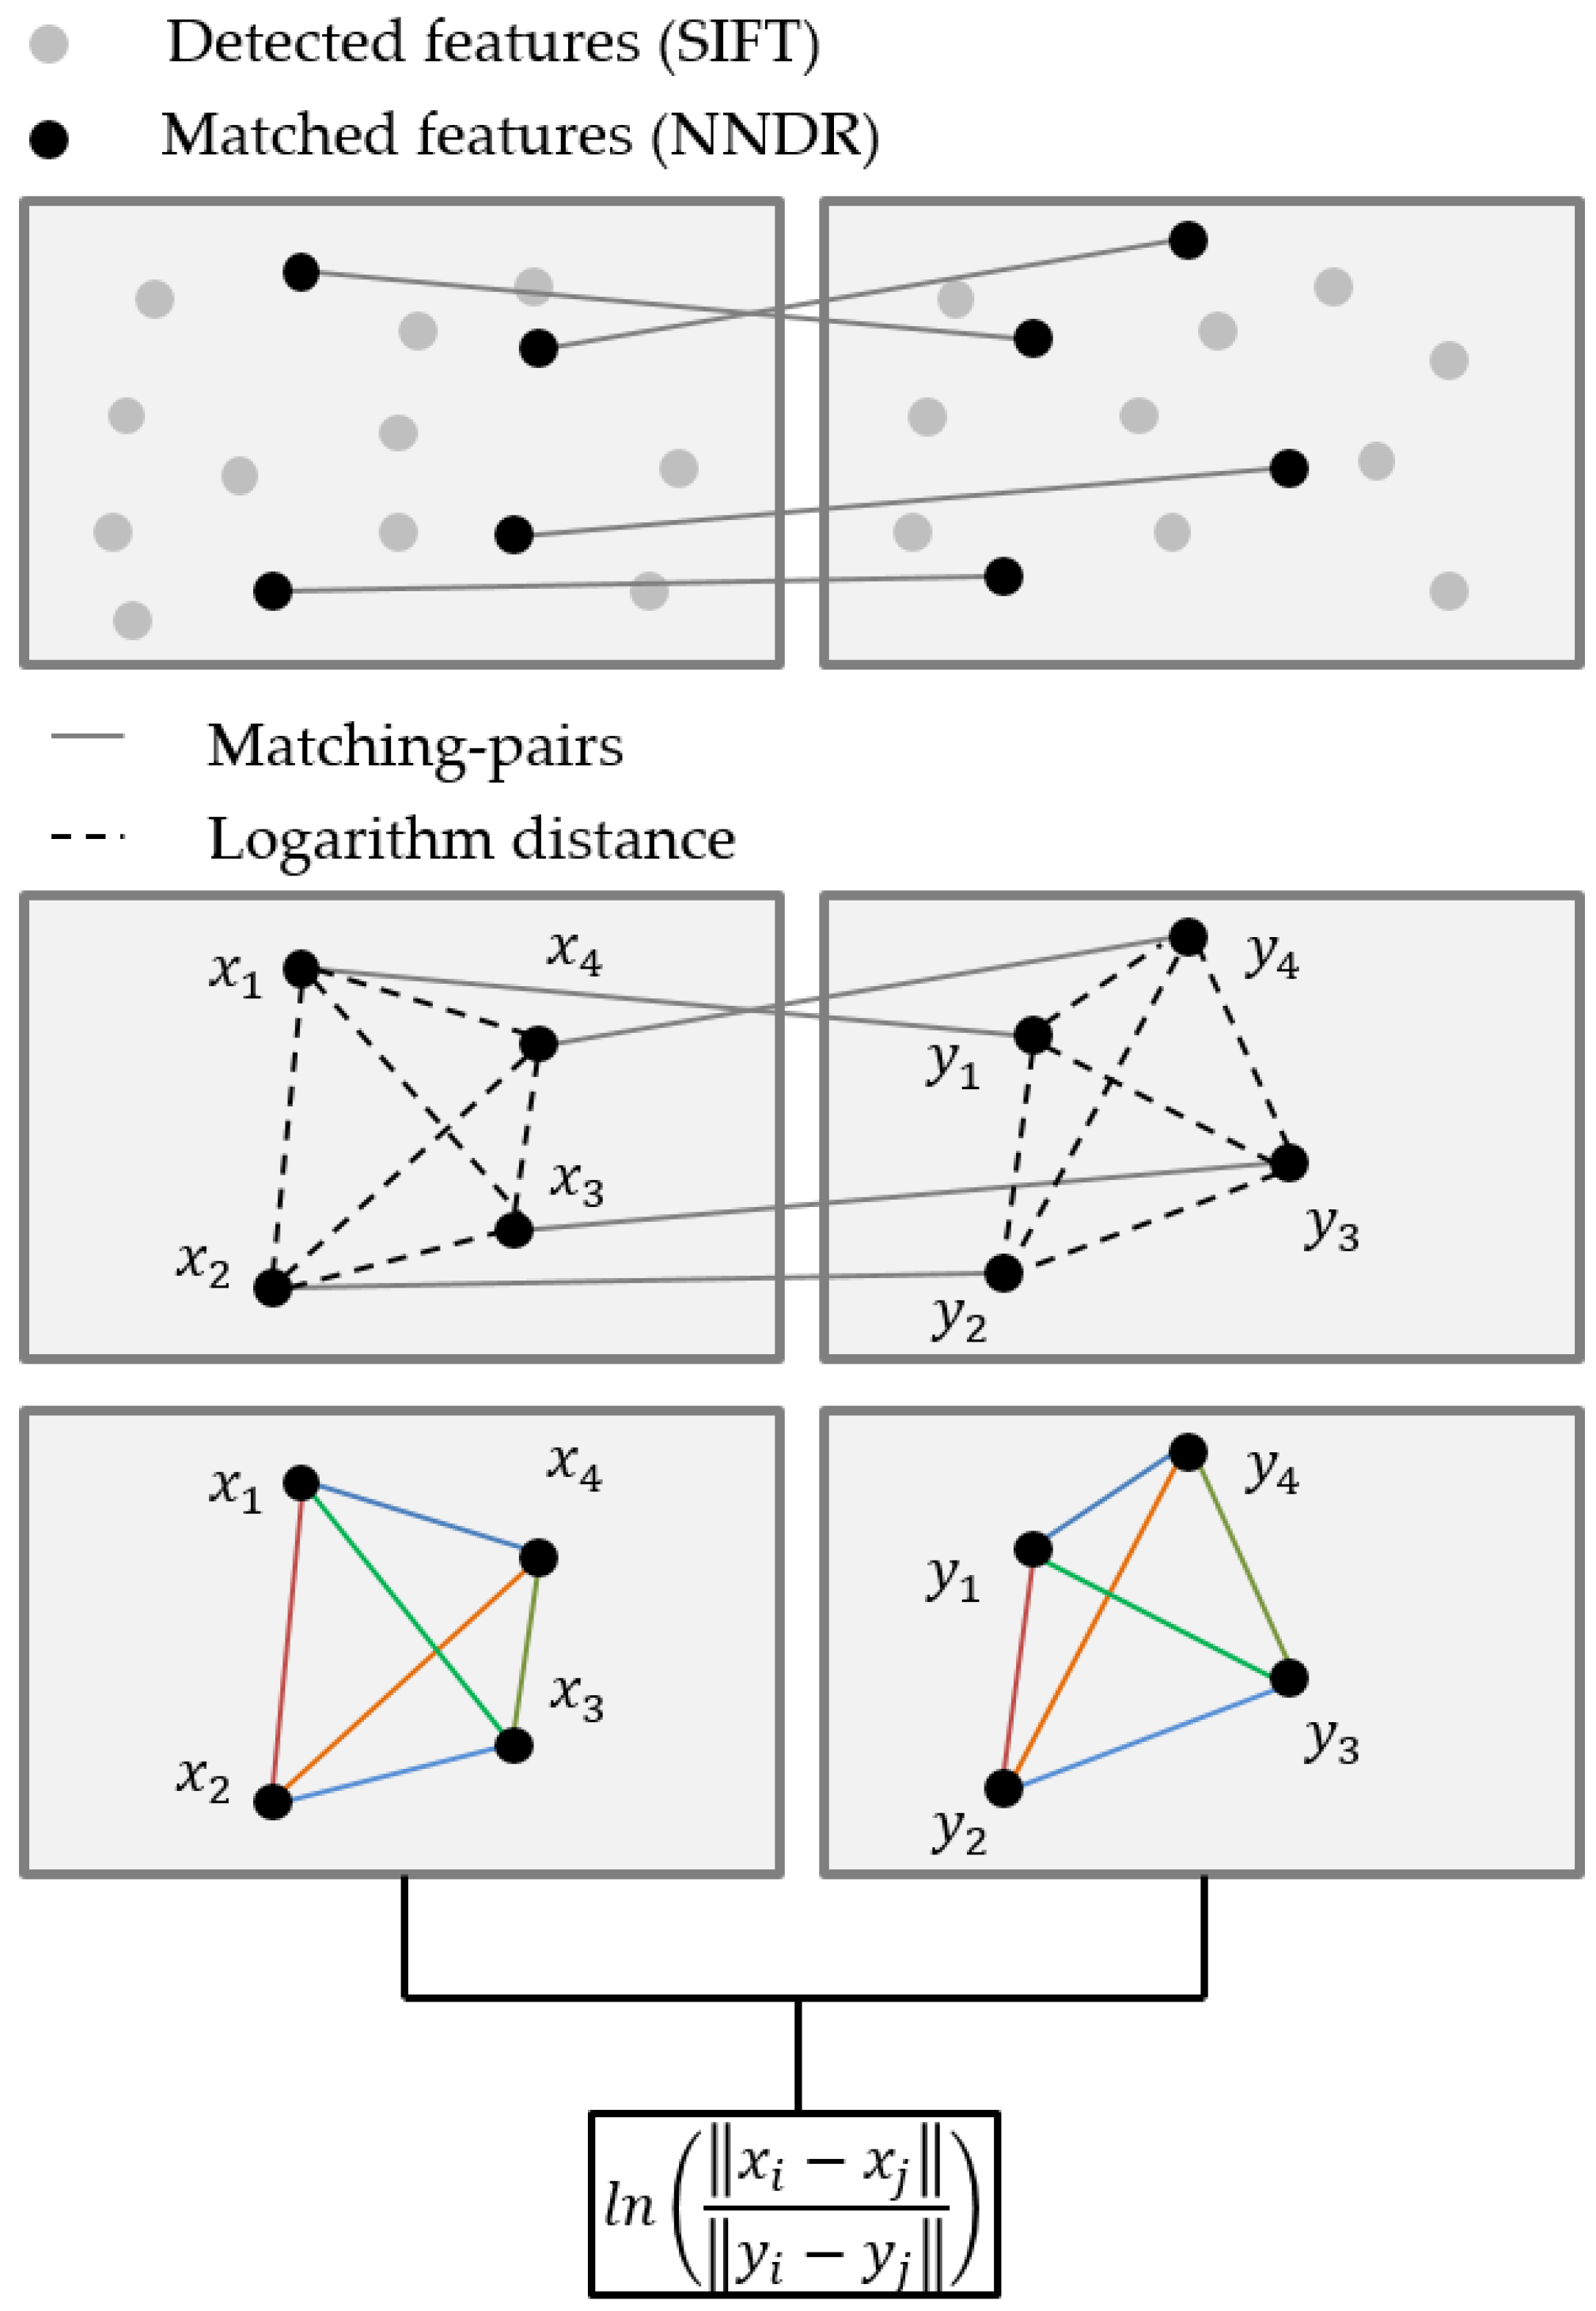
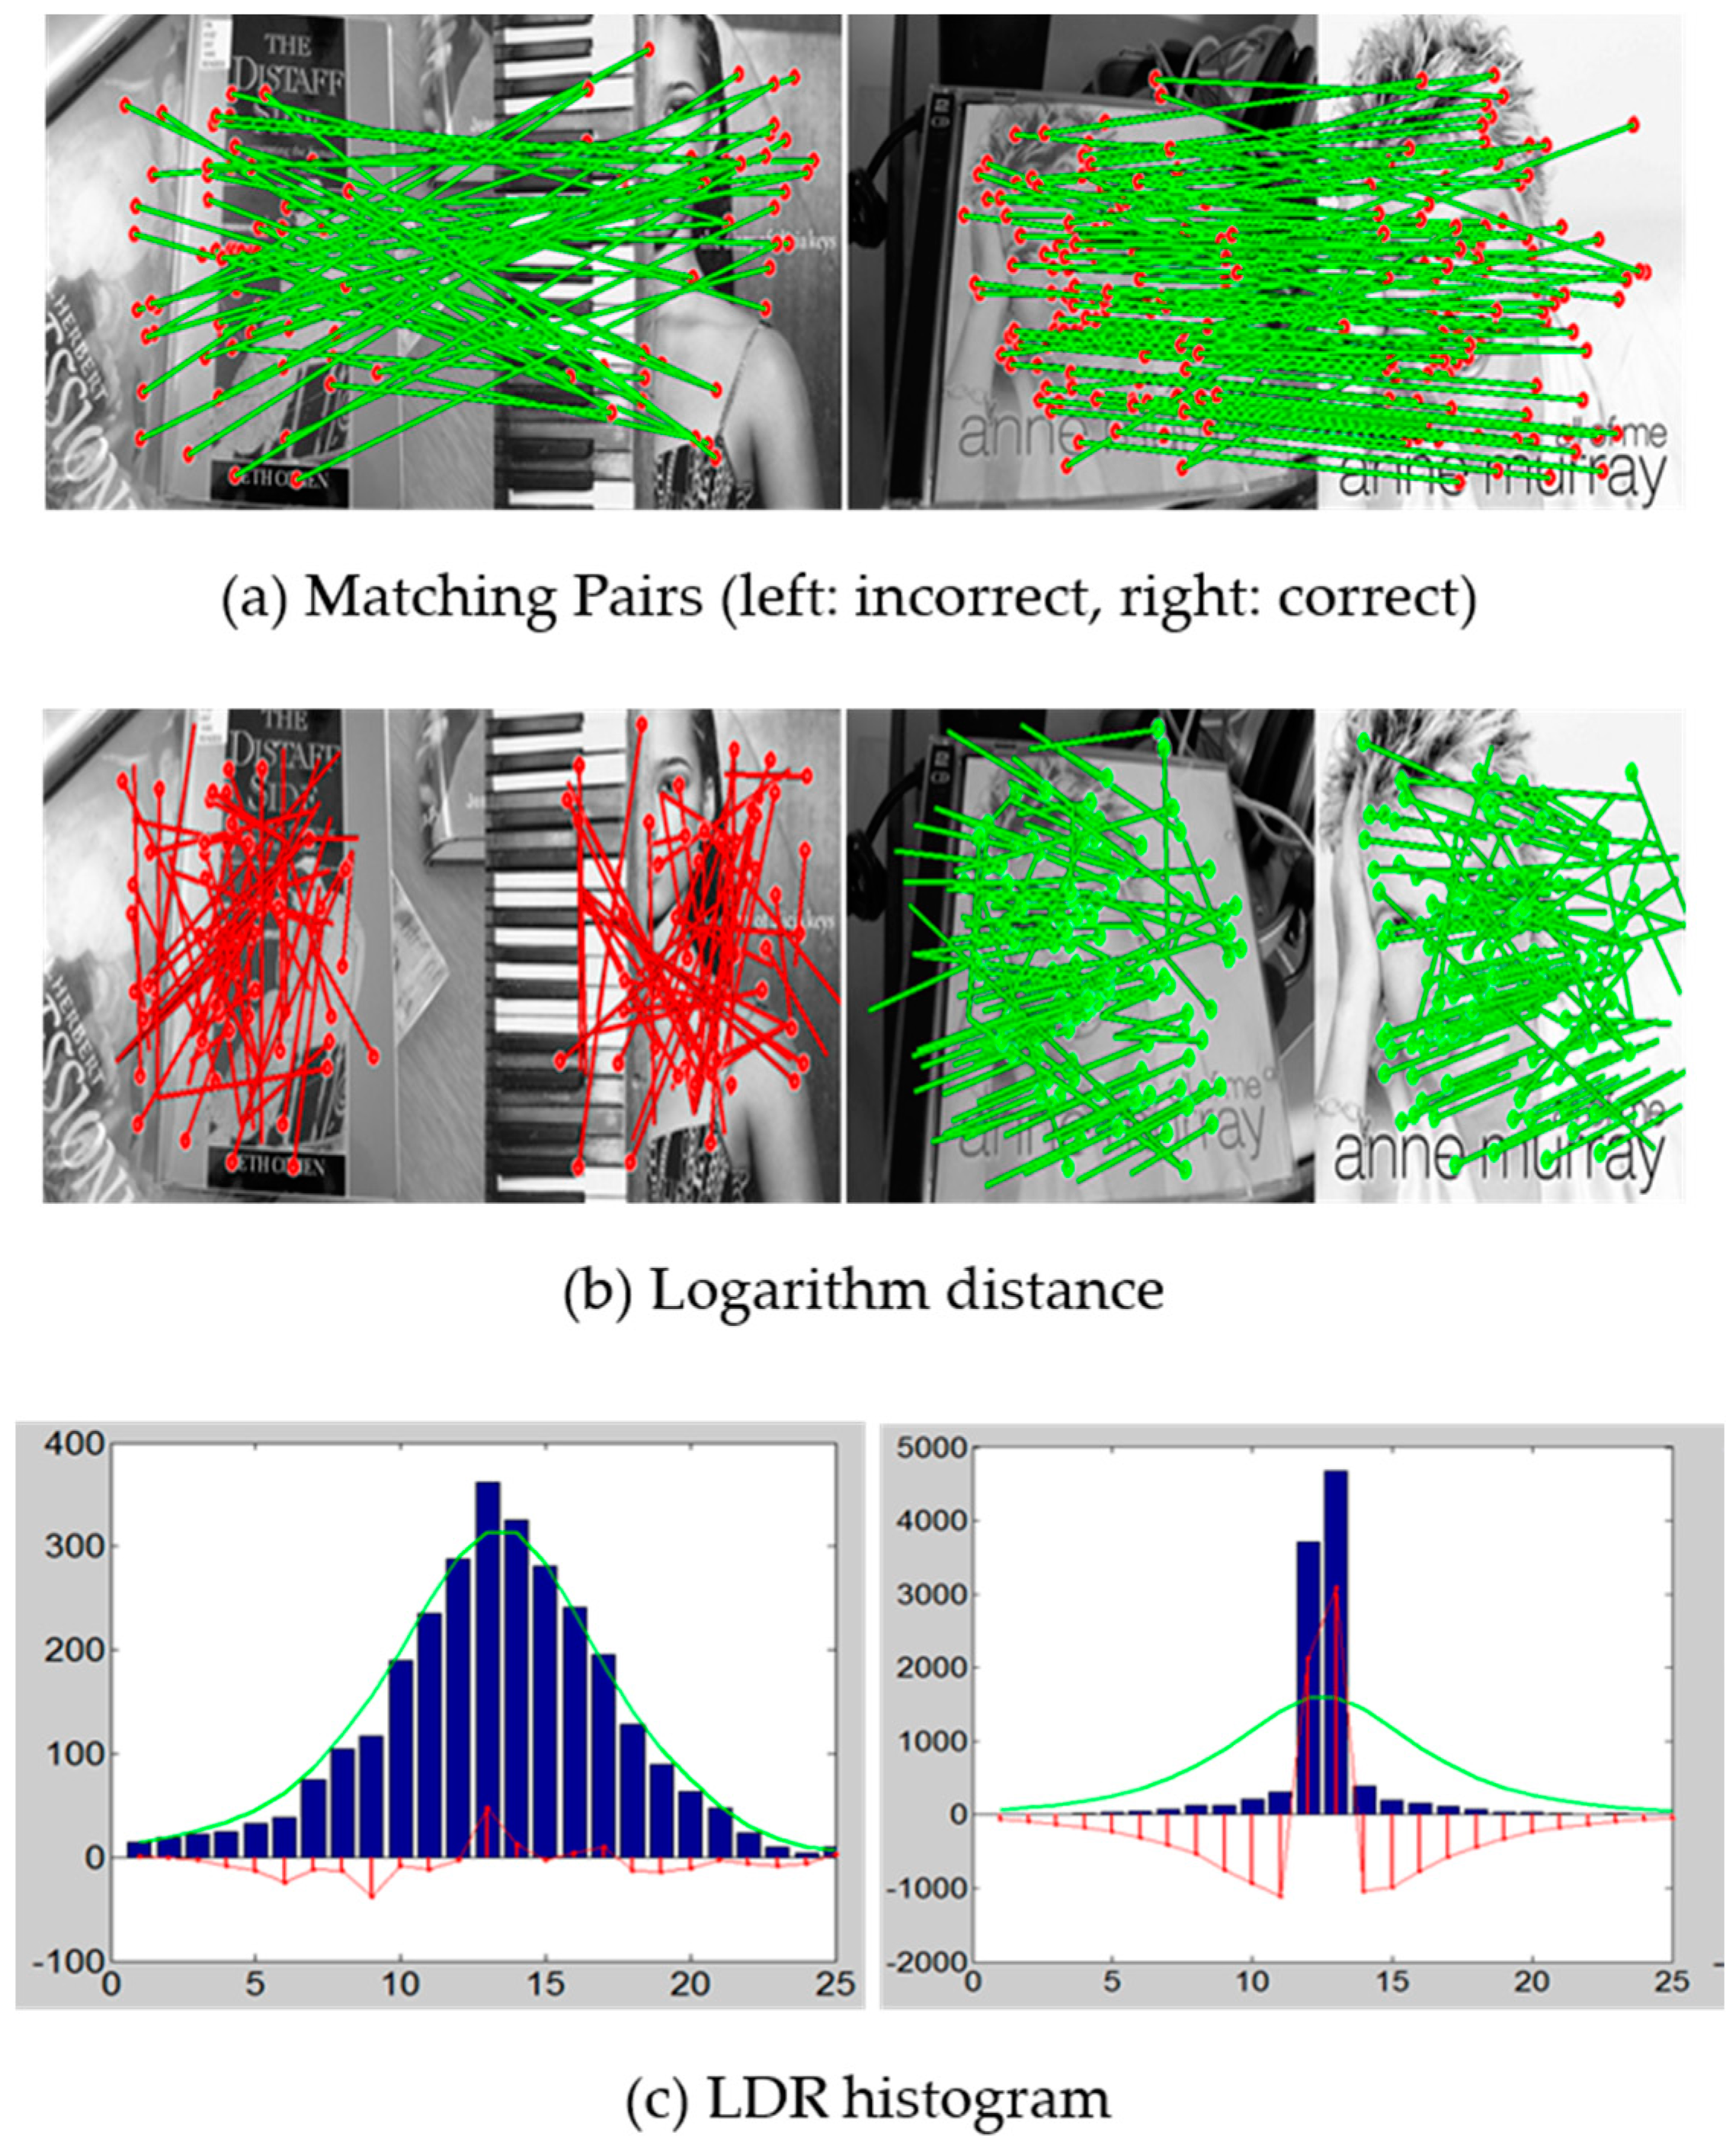
3.1. Feature Detection, and Making a Matched Pair

The proposed method requires feature coordinates and properties for deformable-object matching. Therefore, a scale-invariant feature transform (SIFT) detector is used, which is a point-based detector that includes the feature’s coordinates, scale, and dominant orientation [17]. Speeded up robust features (SURF), maximally stable extremal regions (MSER), and affine detectors, which have similar properties, can also be used. SIFT is a set of orientation histograms created on a 4 × 4-pixel neighborhood with eight bins each. The descriptor then becomes a vector of all the values of these histograms. Since there are 4 × 4 = 16 histograms, each with eight bins, the vector has 128 elements. The features extracted from each image are F ( i ) = { c i , s i ,   o i , d e s c i }   ( i = 0 ~ N ) where c i is a coordinate, s i is the scale, o i is the dominant orientation, and d e s c i denotes 128-dimensional descriptors. To form matching pairs, the features detected from each image are compared. The metric used for the comparison is Euclidean distance, which is given by Equation (1):
d ( f R ( i ) , f Q ( j ) ) = k = 1 128 ( f R ( i ) k f Q ( j ) k ) 2
which obtains the Euclidean distance between the i-th feature vector of the reference image, f R ( i ) , and the j-th feature vector of the query image, f Q ( j ) . The simplest feature matching sets a threshold (maximum distance) and returns all matches from other images within this threshold. However, the problem with using a fixed threshold is that it is difficult to set; the useful range of thresholds can vary greatly as we move to different parts of the feature space [18]. Accordingly, we used NNDR for feature matching [17] as follows:
N N D R =   d 1 d 2 = D A D B D A D C
where, d1 and d2 are the nearest and second nearest neighbor distances, DA is the target descriptor, DB and DC are its closest two neighbors, and the symbol denotes the Euclidean distance. Lowe demonstrated that the probability of a false match (e.g., a feature with a similar pattern) significantly increases when NNDR > 0.8 [17]. Thus, matching pairs with an NNDR higher than 0.8 are not employed. Numerous studies showed that forming 1:1 matching pairs using NNDR leads to the best performance. However, matching for deformable objects the single matching-pair can be outliers, which would disrupt performance. Therefore, considering deformable-object matching, up to k candidates are selected in decreasing order of ratio, rather than selecting a single candidate with NNDR. A feature point forms 1:k matching pairs using k-NNDR. For rigid-object matching, matching pairs with a k = 1 are used, and in the deformable object-matching method, k = 2 or 3 is used.
The N × M matching pairs formed as such undergo an overlap check process, as follows:
o v l p [ i , j ] = {   1   if   M i ( p i ) = M j ( p j ) ,   0   otherwise .   ( 0 i , j N M )
Matching pairs (Mk) consist of each of the feature points from the reference and query images. In Equation (3), Mk(pk) denotes the positions of the two feature points. Here, p k = [ p k R , p k Q ] , where p k R is the position of the feature point extracted from the reference image, and p k Q is the position of the feature point extracted from the query image. If p i R is equal to p j R , or if p i Q is equal to p j Q when comparing the i-th matching pair (Mi) with the j-th matching pair (Mj), it is recognized as a repetition, and 1 is assigned to o v l p [ i , j ] . In this manner, 1 or 0 is assigned to all o v l p [ i , j ] , eventually generating an NM × NM overlap matrix, which has o v l p [ i , j ] as elements. The generated overlap matrix is used for clustering during deformable-object matching.

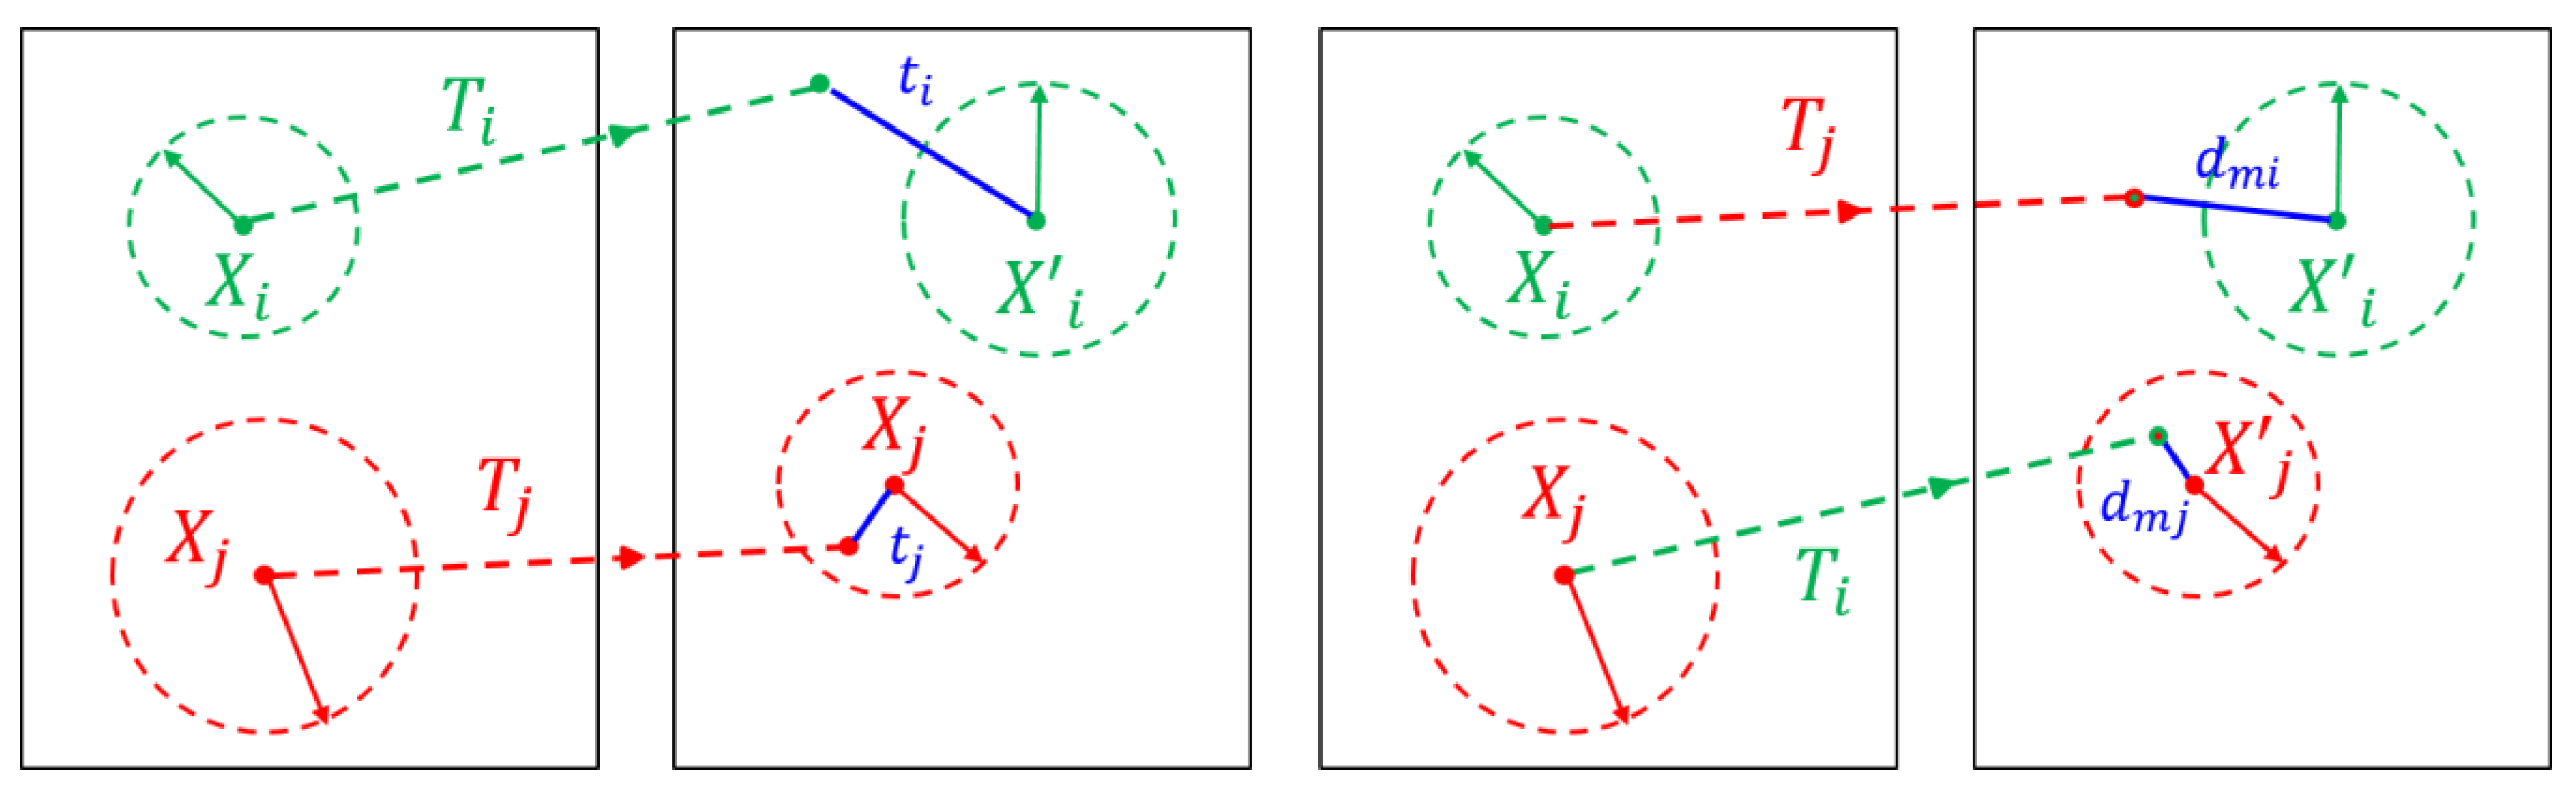
3.2. Geometric Verification for Rigid Object-Matching

After forming matching pairs, image matching is determined through geometric verification of 1:1 matching pairs. Letting the matching pairs be (x1,y1),…,(xn,yn), the LDR set Z is obtained with the following equation:
z i j = l n ( x i x j y i y j ) ,   Z = { z i j | i j }
where xi,j is a coordinate of the reference image, and yi,j and xi,j are the matched-feature coordinates.
Moreover, Z denotes the LDR sets of all matching pairs. A schematic of this process is in Figure 2.
Let all features within one image follow the same bivariate normal distribution, with variance σ x 2 in the query image and σ y 2 in the reference image. Let a 2 be the proportion of the variances:
σ x 2 σ y 2 = a 2
Then the LDR has the following probability distribution function (PDF):
f Z ( z ; a ) = 2 ( a e z e 2 z + a 2 ) 2
In addition, we examine the upper and lower bounds of the LDR for objects of this type. This behavior is studied by first forming LDR histogram h(k) for the matching pairs by counting the occurrences over each bin:
h ( k ) = # ( Z ζ k )
The bins ζ 1 , , ζ K are adjacent intervals. The inlier behavior can be expressed by the following double inequality:
a x i y i y i y j b x i x j
where a and b define the boundaries of the LDR for inliers. The LDR is restricted to an interval. The inliers would contribute to bins contained in ( ln b , ln a ) which for most cases is a limited portion of the histogram. We used the interval ( a , b ) , which is (−2.6, 2.6).
The comparison of LDR histograms between incorrectly matched images and correctly matched images is presented in Figure 3. Since a geometric transform occurs mostly in rigid object images, each matching-pair will have a similar logarithm distance and will become narrow. Exploiting this, the match between two images can be determined.
Pearson’s chi-square test is utilized to compare the correlation of h(k) and f(k). Let the LDR histogram have k bins. The histogram will be compared to the discretized model function f(k). We used these quantities to formulate the test. Equation (9) is a formula to calculate the goodness-of-fit parameter for c. A high value for c if the shape of the LDR histogram differs much from that of f(k), implied that many of the matches are inliers:
c = k = 1 K ( h k n f k ) 2 n f k   χ 1 a , K 1 2
where n is the total number of matching pairs, and χ 1 a , K 1 2 is the threshold of χ 2 having K-1 degrees of freedom. The threshold determination method is based on an experiment by Lepsøy [9]. To obtain the false positive rate below, 1 − a = 0.01 (1%), set the threshold to 70. If c is higher than the threshold, d(k) is computed using Equation (10) to find the inliers:
d ( k ) = h ( k ) β f ( k ) ,      β = k = 1 K h ( k ) f ( k ) k = 1 K ( f ( k ) ) 2
where β is a weight to normalize h(k) and f(k). Figure 4a shows the comparisons of h(k) to f(k) and to d(k), respectively, between matching images and non-matching images. We can see that the LDR of matching pairs is narrow with numerous inliers, and that a match can rapidly be identified by calculating this difference.
After geometric verification based on LDR, matrix D is formed by quantizing d(k) in order to predict the number of inliers, and eigenvalue u and dominant eigenvector r are calculated using Dr = ur, used in Equation (11).
i n l i e r n = 1 + μ m a x k = 1 , , K   d ( k )
Subsequently, eigenvector r is sorted in descending order, and the upper-range matching pairs corresponding to the calculated number of inliers are finally determined to be the inliers. Figure 4b shows a diagrammatic representation of this process.
Lastly, the weights of the matching pairs and the inliers are calculated, and matches are determined by calculating the ratios of the weights. Weights are based on the conditional probability of the inliers when the ratio between the NN distance and second distance during feature matching is given. Equation (12) shows the corresponding conditional probability function.
p ( c | r ) = p ( r | c ) p ( r | c ) + p ( r | c ¯ )
where c and c ¯ denote the probability of inliers and outliers, respectively, and r is the distance ratio.

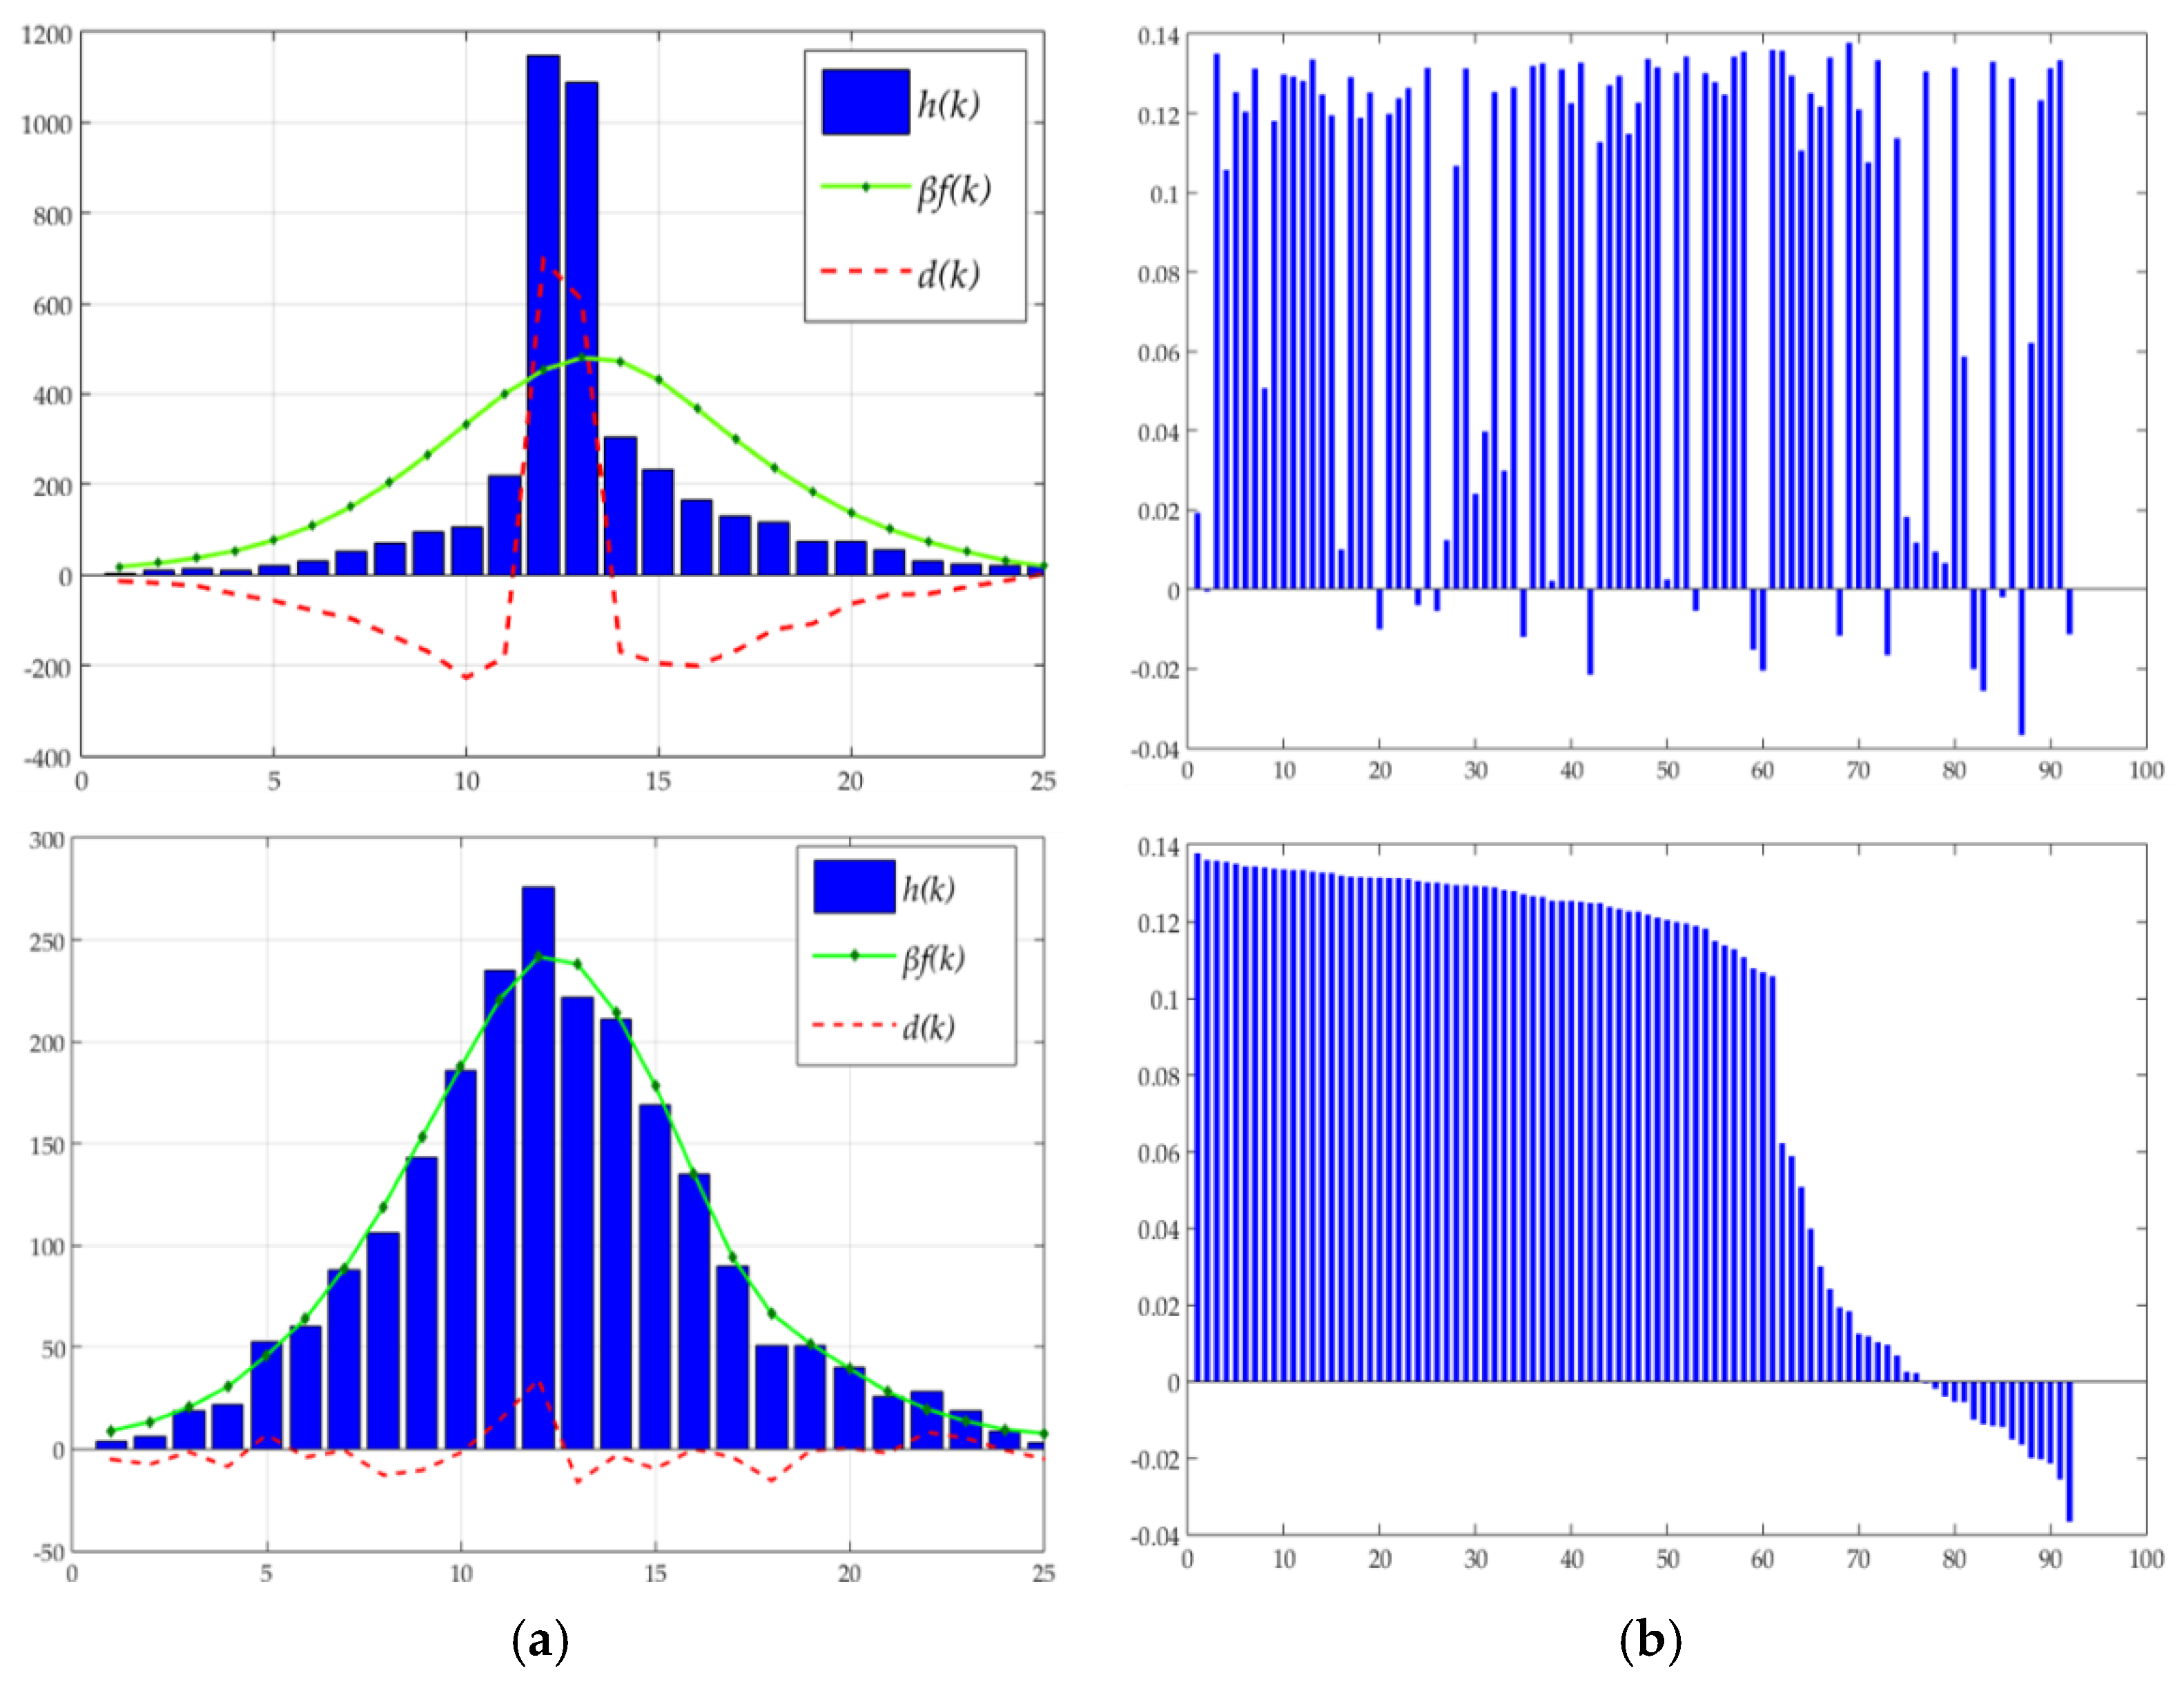
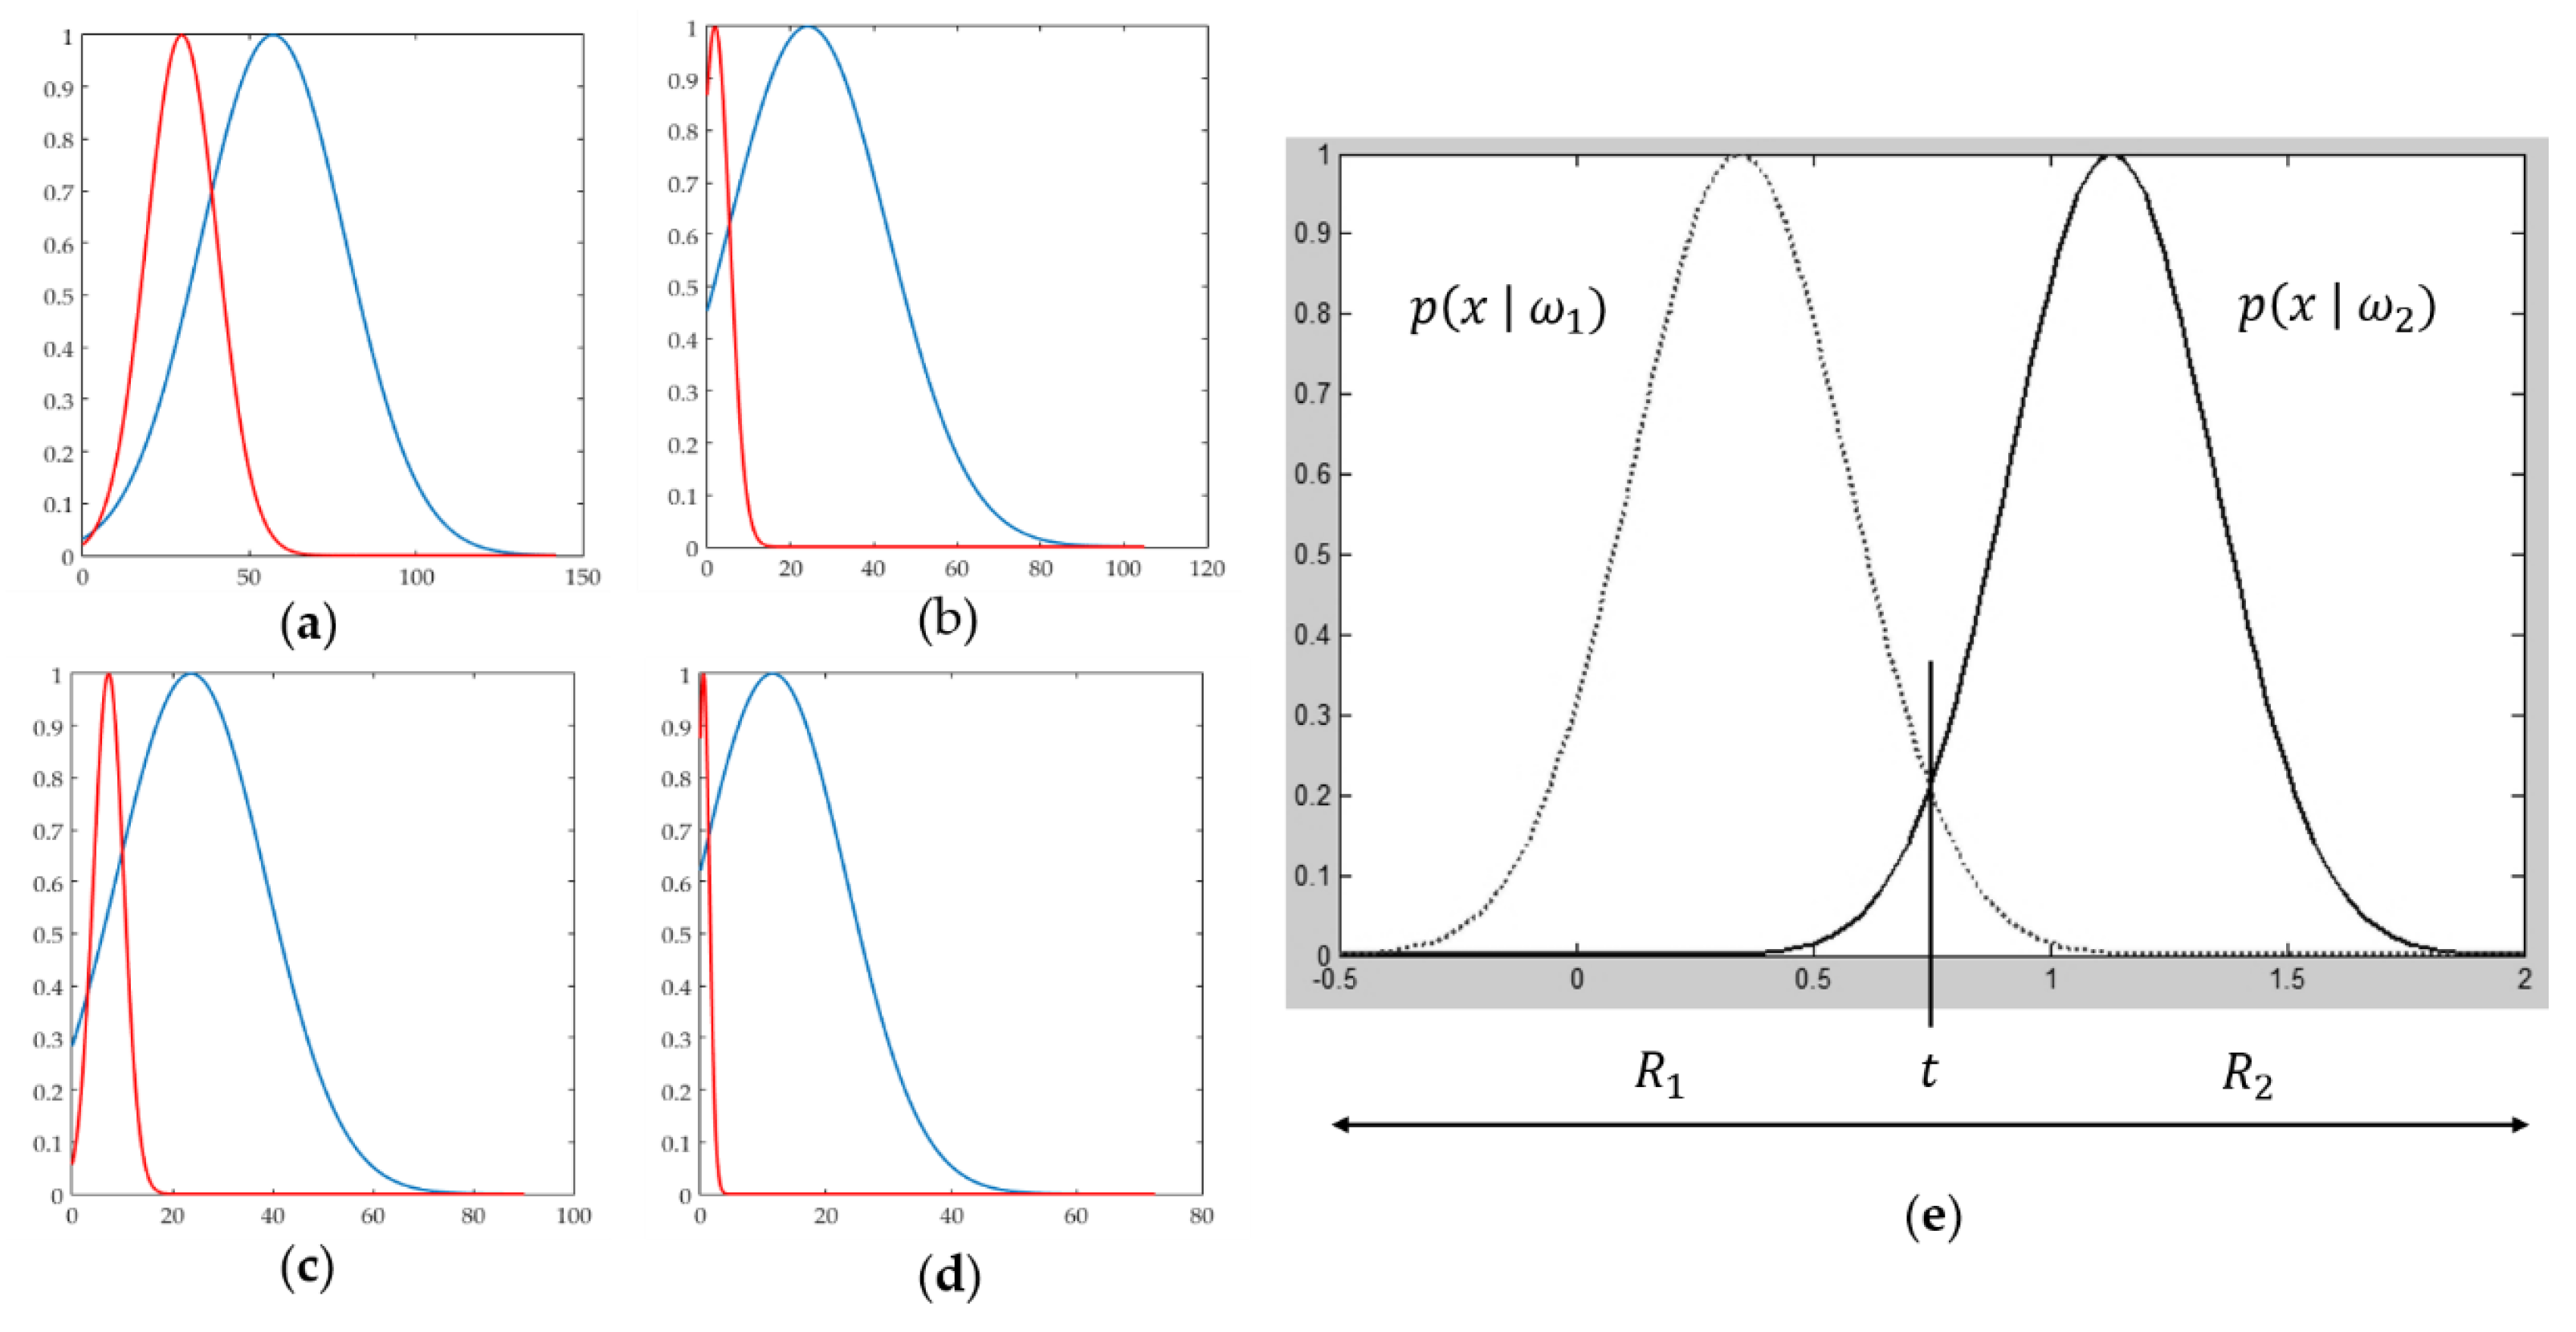
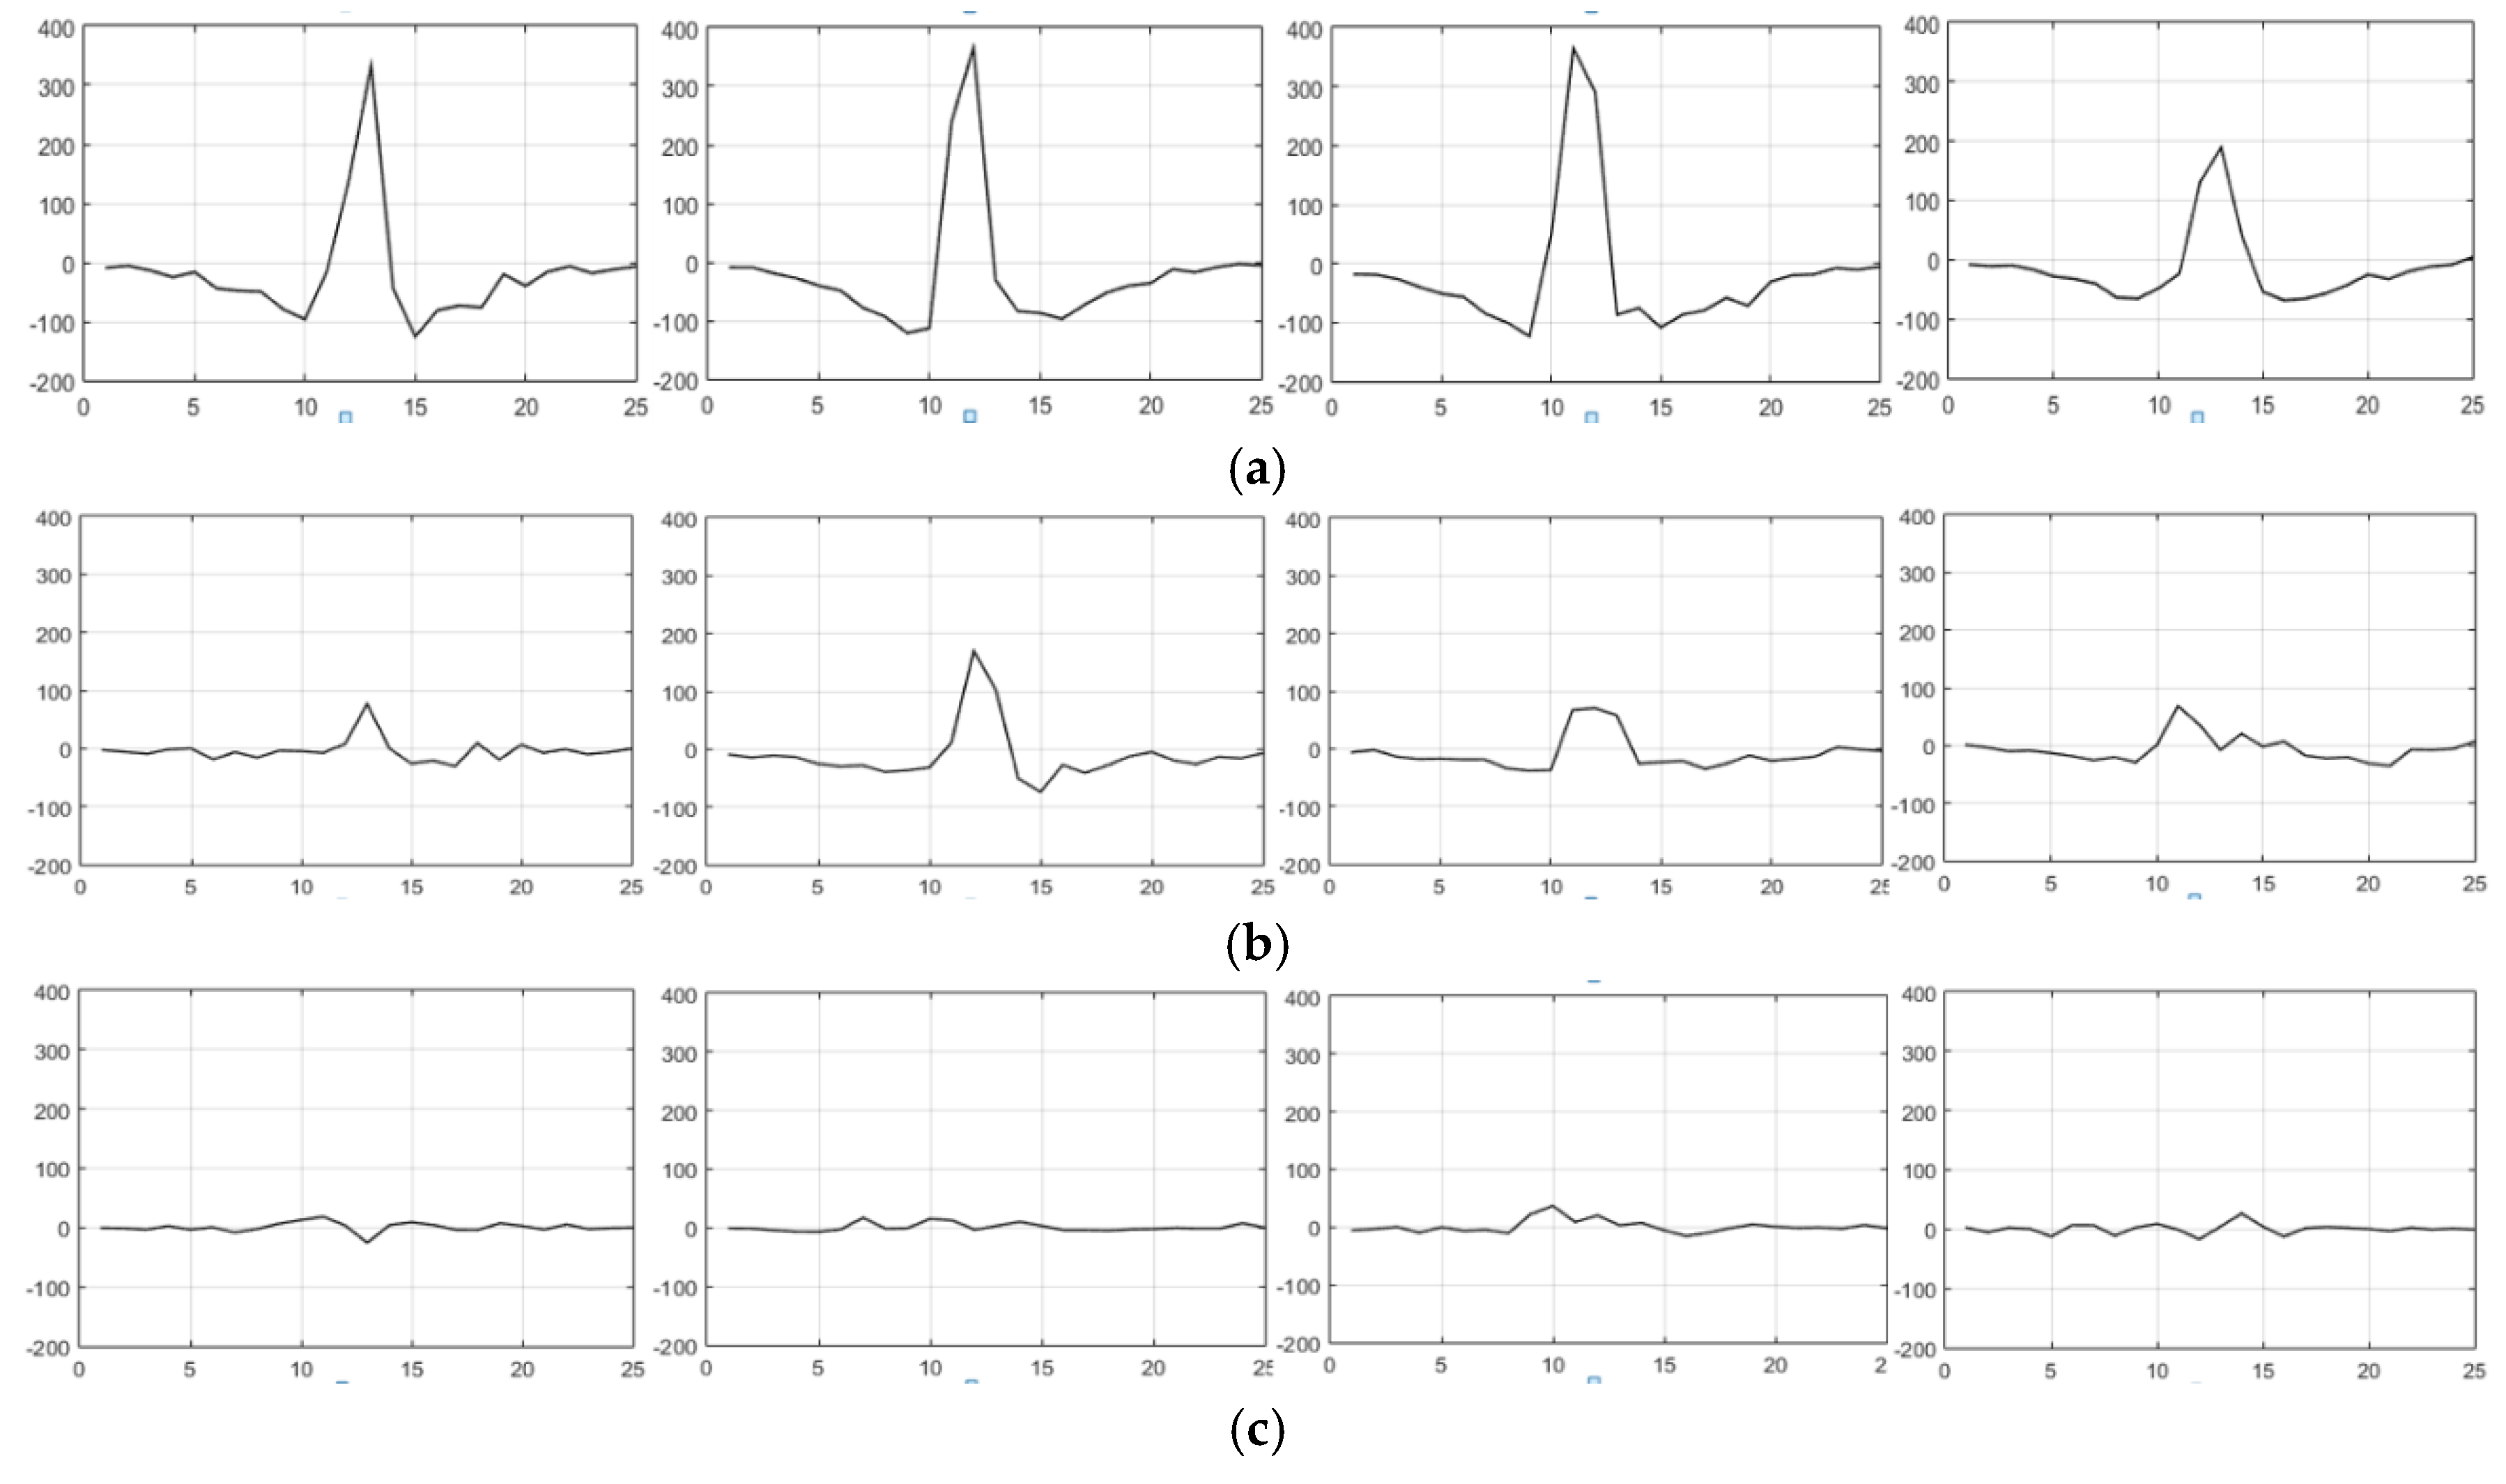
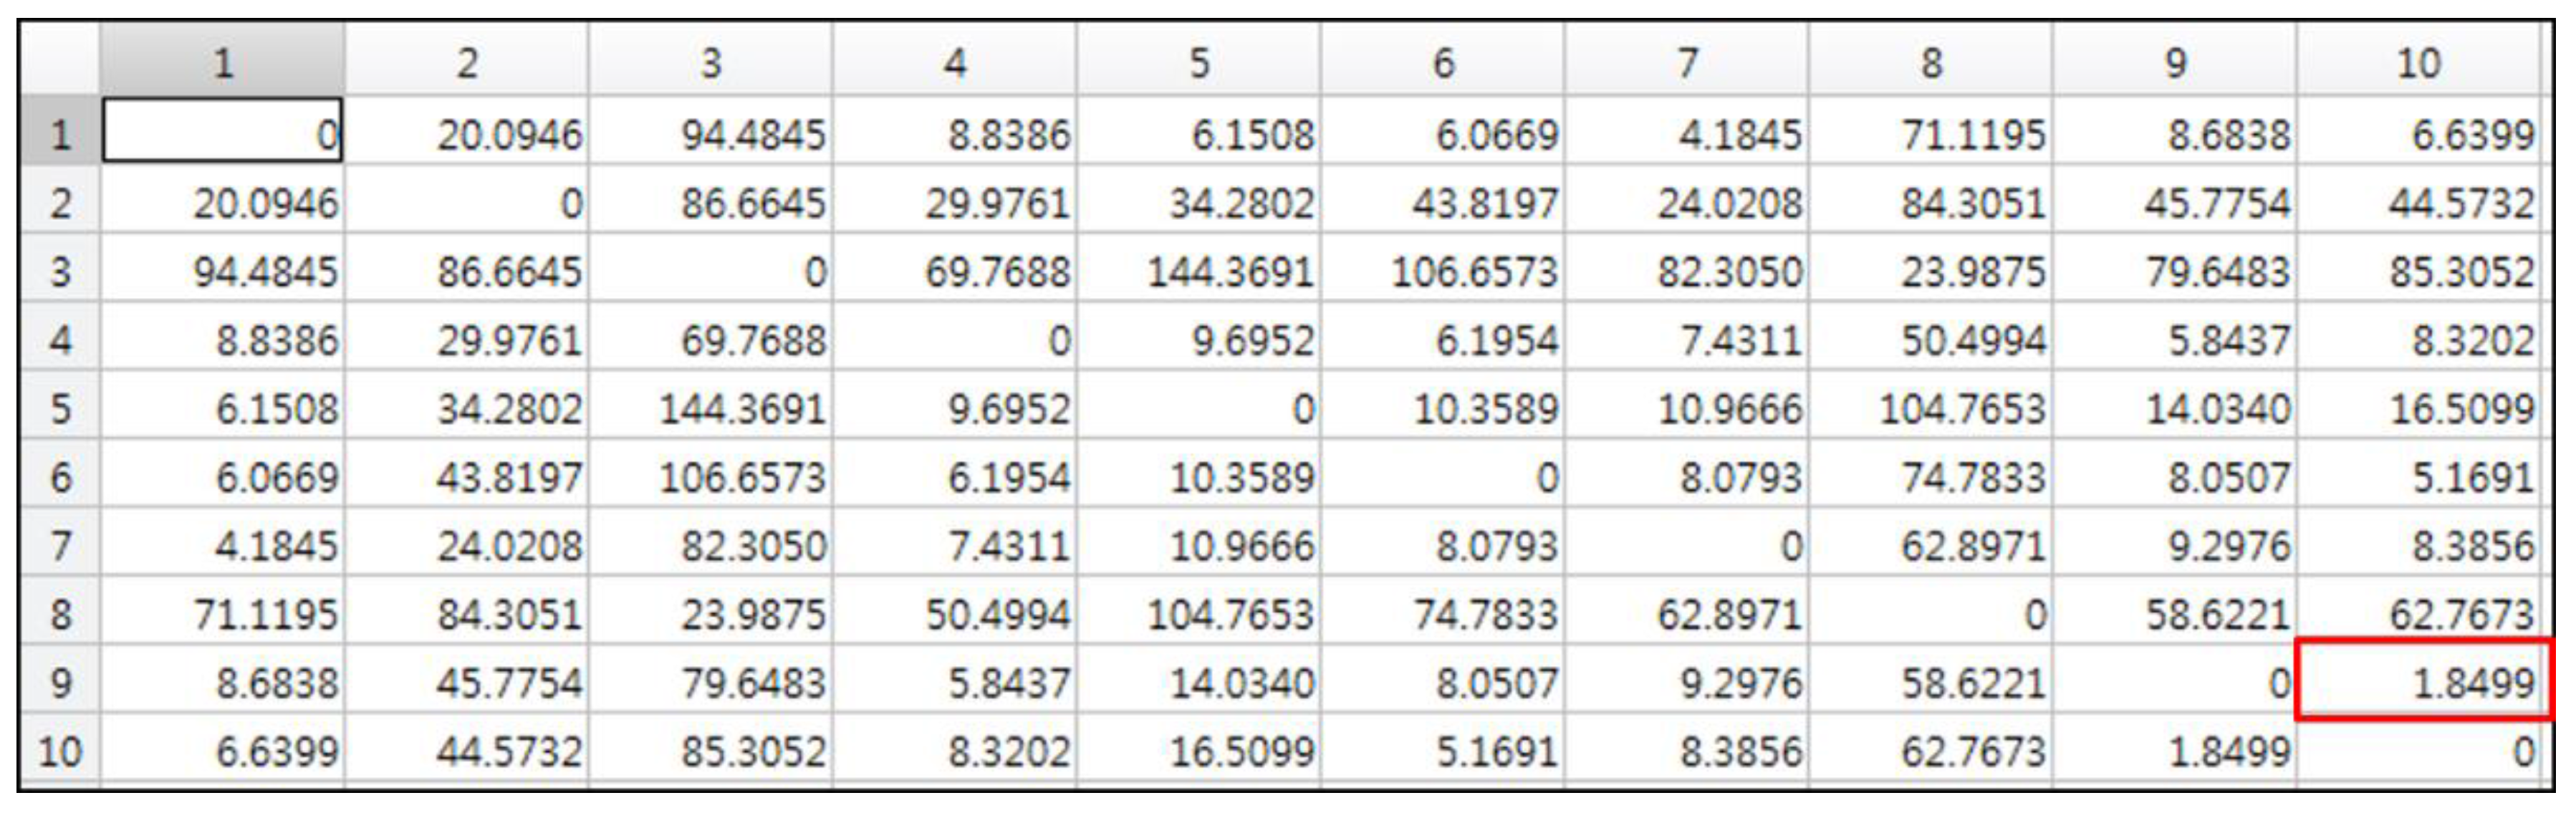
3.3. Discrimination of Deformable Object Images

After generating matching pairs from the two images, x and y, and performing geometric verification, the total number of matching pairs, the number of inliers, the matching-pair weight, and the inliers’ weights are calculated using the results. These can be defined as matching information M(x,y) = { m a t c h n ,   i n l i e r n ,   w e i g h t } . We analyzed which statistical distribution M(x,y) has, using the example images. Non-matching and deformable-object images were used as training images, and the mean, μ , and standard deviation, σ, of each property were calculated to form normal distribution N ( μ , σ 2 ) . However, since the non-matching and deformable-object images show similarity in M(x,y) from numerous aspects, discrimination of the two classes is vague. Therefore, the following is proposed to find the model that minimizes the error. Analyzing numerous training images, we observed that deformable-object matching does not lead to good results if the number of inliers is less than a certain number. In other words, there must be more than a certain number of inliers. Figure 5b was obtained from experiment using more than four inliers corresponding to minimum error. Subsequently, the ratio between the number of inliers with the greatest difference in mean between the two classes, and the matching-pair weight with the least difference in variance is calculated, and t with the minimum error is obtained using a Bayesian classifier.
Let the training set be X = (x1,c1), (x2,c2),…,(xn,cn), xi for the i-th properties, and let ci be the class index of xi, which represents non-matching (w1) and deformable-matching (w2). X is defined as the ratio between the inlier number from matching information and matching-pair weight, as shown in Equation (13):
x = i n l i e r n d i s t n
Figure 5 shows the graph obtained by separating matching information into that of incorrectly matched images and deformable matching images. Figure 5a–d shows each property of the matching information; however, it is difficult to distinguish the deformable matching pairs from non-matching pairs. Figure 5e shows the normal distribution of x for the matching pairs with more than four inliers after rigid-object matching. We can see that the distinction is clearer than in the previous graphs. Therefore, t with the minimum error was found and is used for the classifier.
However, discrimination of deformable objects does not exhibit good performance if it is based on statistical analysis only. This is because a deformable transformation cannot be defined as a certain model. Therefore, the pattern for d(k), which was used for geometric verification, was identified through machine learning-based training, and the result was used. Figure 6 shows a graphical illustration of d(k) from matching rigid-object, deformable-object, and non-matching-pair images.
Figure 6c appears to be completely different from the case above. It exhibits irregular patterns over the entire range, most of which are small in size. This implies that the LDR and the PDF are almost identical. Exploiting this characteristic, d(k) of a deformable matching-pair and d(k) of a non-matching pair were extracted from the training set, and the characteristics of each pattern were classified using support vector machine (SVM) [19], which is one of the supervised learning algorithms.
The probability of a deformable transformation is determined from the results of the previous statistical analysis and machine learning, and the deformable objects are finally discriminated through voting. The voting method combines the results obtained from various conditions, rather than from using the results of the one with the best classification performance, which is appropriate for unpredictable deformable transformations.

3.4. Deformable-Object Matching

Deformable-object images are discriminated, and finally, deformable object-matching is performed. Rigid object-matching methods mostly calculate a homograph in order to examine the geometric consistency of the features in the whole image. However, while deformable objects can have locally similar geometry, it is difficult to calculate a single homograph from the whole image. Therefore, we used a method to cluster matching pairs with similar geometric models, and we propose a method with enhanced performance through the use of clustering validation.
Letting two matching pairs be Mi, and Mj, transformations Ti and Tj and translations ti, and tj can be calculated from the characteristics of each matching pair, using the enhanced weak geometric consistency (WGC) [20], as shown in Equation (14).
[ x q y q ] = s [ cos θ sin θ sin θ cos θ ] [ x p y p ] ,   t = | q ( x q , y q ) q ( x q , y q ) |
where s denotes scale, θ is the dominant orientation, and tx and ty represent coordinate translations. Using Equation (9), the matching pairs can be expressed as M i = ( ( x i , y i ) , ( x i , y i ) , T i ) and M j = ( ( x j , y j ) , ( x j , y j ) , T j ) , and the geometric similarity of the two matching pairs is calculated using Equation (15):
d g e o = ( M i , M j ) = 1 2 ( X j T i X j + X i T j X i ) = 1 2 ( d m i + d m j )
where, X k = [ x k , y k ] t ,   X k = [ x k , y k ] t ,   k = i , j . If transformation models T i and T j are similar, dgeo(Mi,Mj) will be close to 0. A graphical representation of this is shown in Figure 7.
Using this relationship, it can be assumed that the matching pairs with a small dgeo(Mi,Mj) have a similar geometric relation. Therefore, similarity is computed by calculating the geometric transformation between each matching pair, rather than by defining a transformation model of the whole image.
Figure 8 shows an example of an affine matrix where the geometric similarity between the matching pairs is calculated. The matrix is formed by calculating the geometric similarity between each matching pair, assuming there are 10 matching pairs. In the example, the matching pairs with high geometric similarity are the 9th and 10th matching pairs. Deformable objects are found through hierarchical clustering of matching pairs with high similarity in the calculated affine matrix.
Hierarchical clustering will group the clusters through linkages by calculating the similarity within each cluster. In order to minimize the chain effect during linkage, a k-NN method was used. While this is similar to a single-linkage method, it was extended to have k linkages, and has the advantage of robustness against the chain effect. Figure 9 shows the results of hierarchical clustering based on geometric similarity between matching pairs. Figure 9a shows the matching result when there is a geometric transformation in an image containing a rigid object. We can see from the figure that the entire object is grouped into a single large cluster due to similar geometric relations. In Figure 9b, we can see that the objects are matched separately, with each object clustered distinctly under a deformable transformation.
Hierarchical clustering eventually forms a single cluster. Therefore, clustering must be stopped at some point. During the linkage of clusters, clustering is stopped when the geometric similarity of the matching pair exceeds a set threshold. However, if such a thresholding method is the only one used, the number of clusters becomes excessive, with most of the clusters likely being false clusters. Therefore, clustering validation is used to remove false clusters. If the number of matching pairs that form the clusters is too low, it is less likely that the resulting clusters become objects. Hence, two methods are used for clustering validation. First, a cluster is determined to be a valid cluster only if the number of matching pairs that form the cluster is greater than τm. Secondly, a cluster is determined to be a valid cluster if the area of the matching pairs that form the cluster is larger than a certain portion of the entire area (τa). The area of the matching pairs that form the cluster is calculated using a convex hull. Figure 10 shows the results of removing the invalid clusters through clustering validation for each case of inlier matching and outlier matching. From inlier matching, it was observed that the clusters with a small area are removed, and for outlier matching, the accuracy was enhanced by preventing the false positives that occur due to small clusters.

4. Experiment Results

In order to evaluate the performance of the proposed matching method, the Stanford Mobile Visual Search (SMVS) dataset from Stanford University was used [21]. SMVS includes images of CDs, DVDs, books, paintings, and video clips, and is currently the standard image set for performance evaluation of image matching under MPEG-7 CDVS. The annotations of matching pairs and non-matching pairs were compiled in SMVS, through which true positives and false positives can be evaluated. Additionally, in order to evaluate deformable object-matching, performance was evaluated with varying intensities of deformation using thin plate spline (TPS) [22]. Deformation intensity was varied in three levels (light, medium, and heavy), and 4200 query images from SMVS were extended to 12,800 images. Lastly, 600 clothing images, which are natural deformable objects without artificial deformation, were collected and used. Figure 11 shows examples of SMVS images, deformed SMVS images with each level of intensity, and clothing images.
True positive rate (TPR) and false positive rate (FPR) were used to evaluate matching performance. TPR is an equation that examines robustness from among the characteristics of matching algorithms, with greater value implying better performance. In contrast, FPR examines independence from among the characteristics of matching algorithms, with a smaller value implying better performance. Moreover, for objective comparison, accuracy was used, which is defined in relation to TPR and FPR.
TPR =   T P T P + F N = T P P
FPR =   F P F P + T N = F P N
Accuracy =   T P + T N P + N
For a speed performance test, we used an Intel Xeon E3-1275 (8 core) CPU and with a clock speed of 3.5 GHz and 32 GB RAM running the Windows 7 (64-bit).

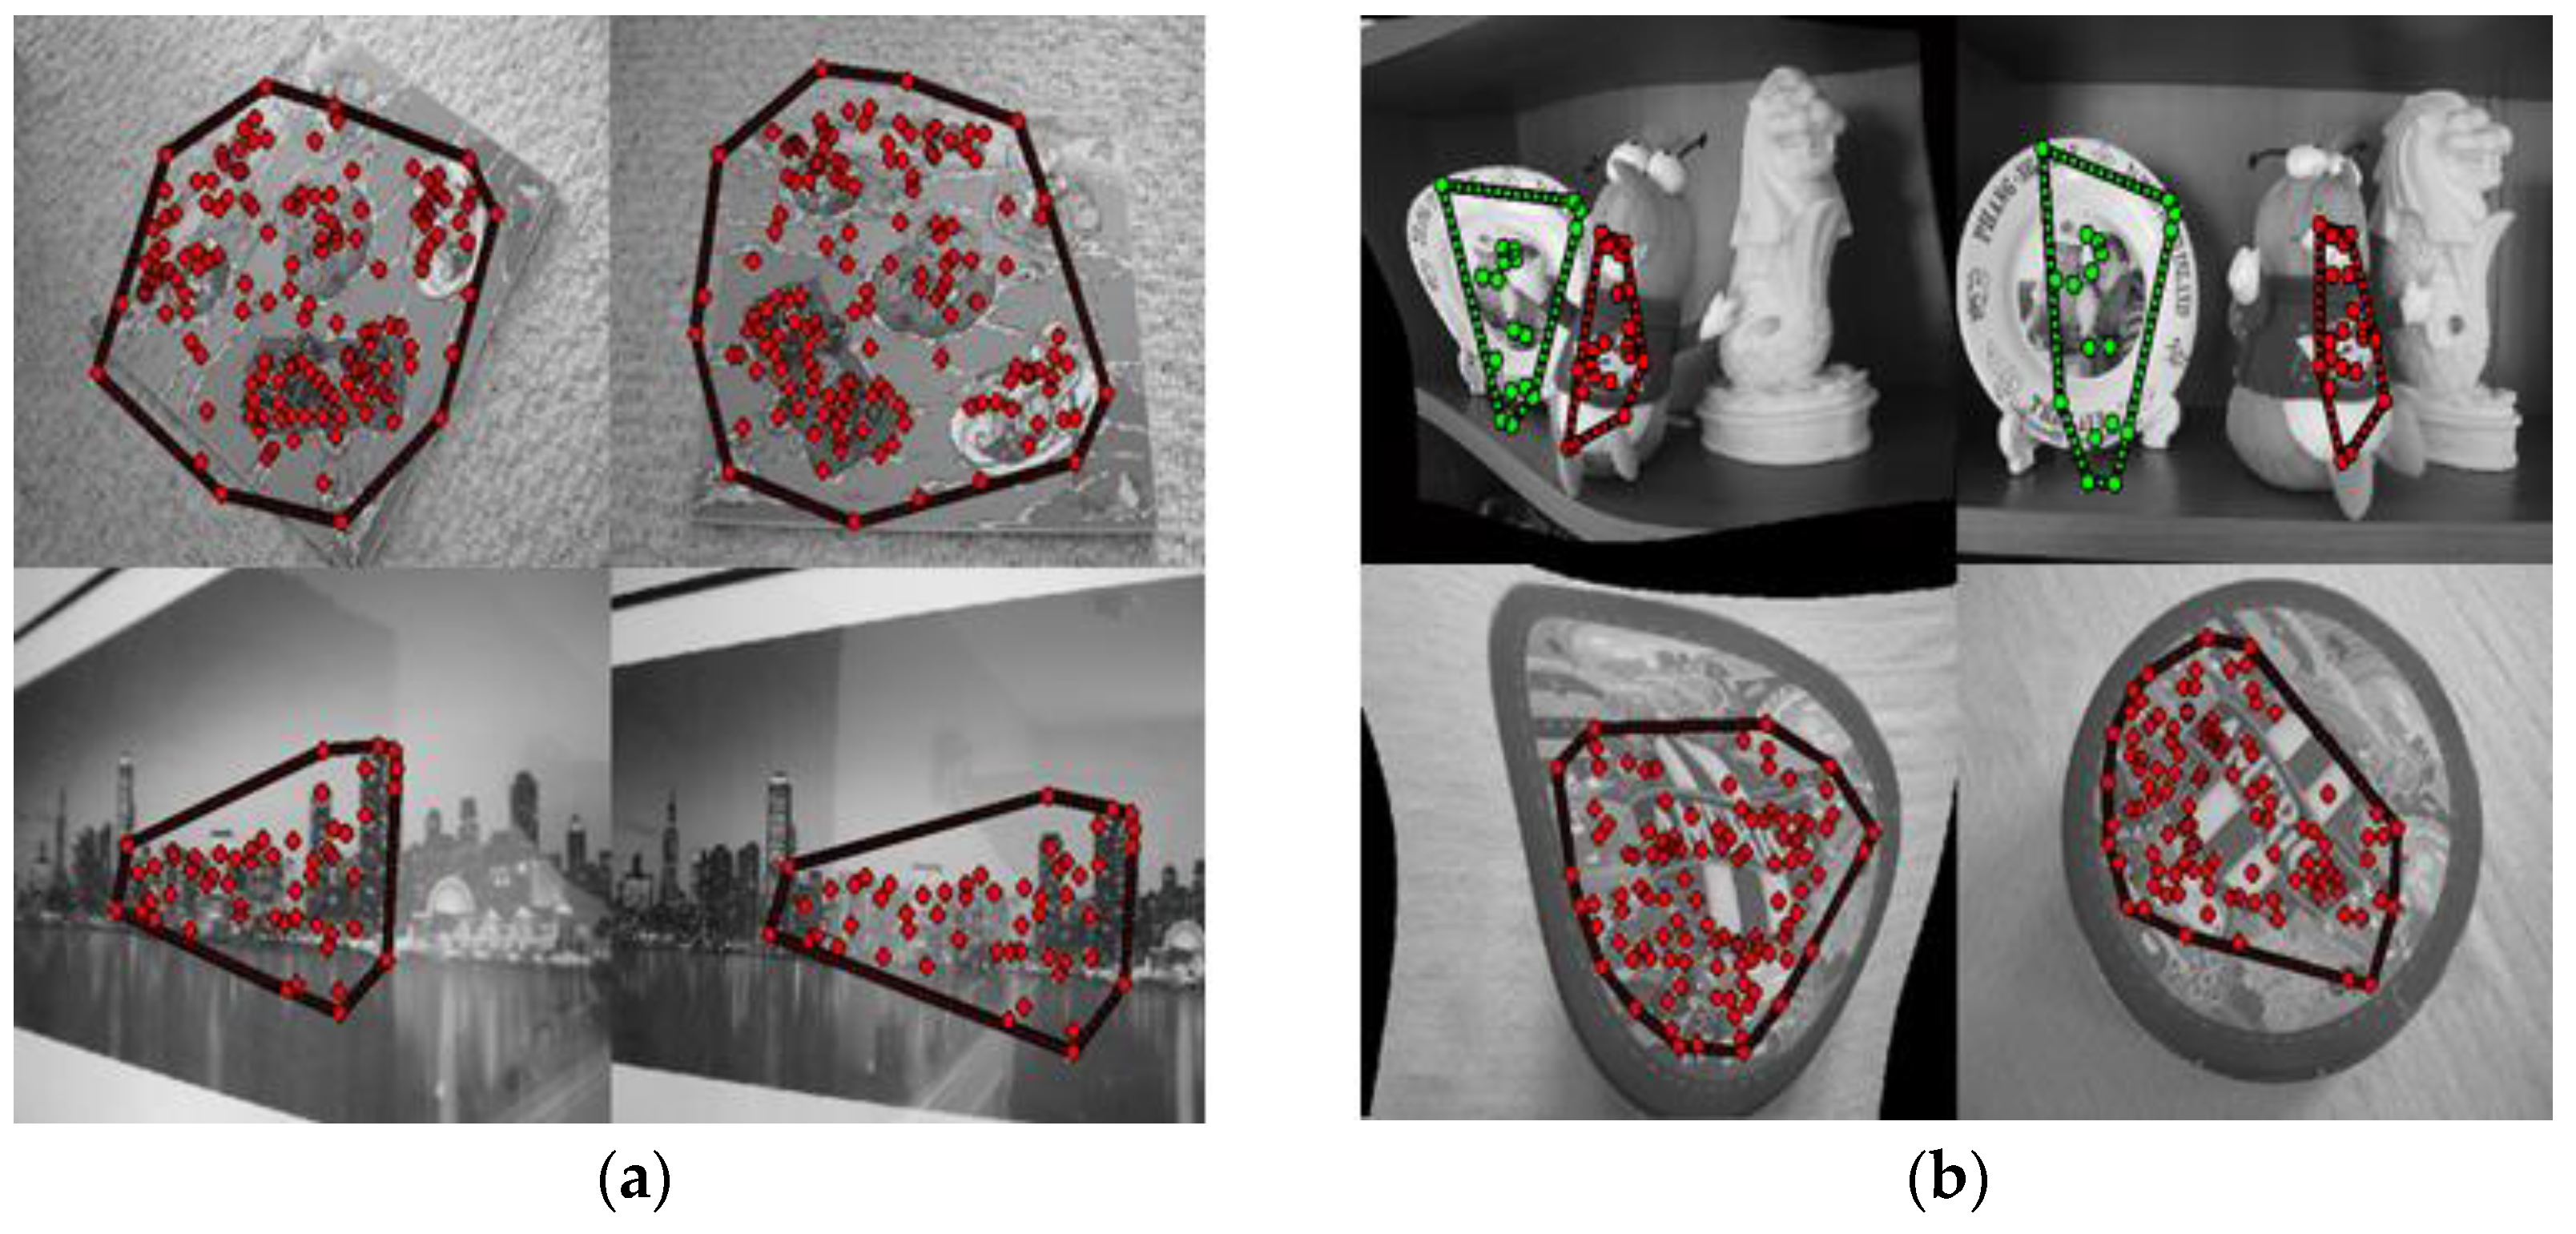
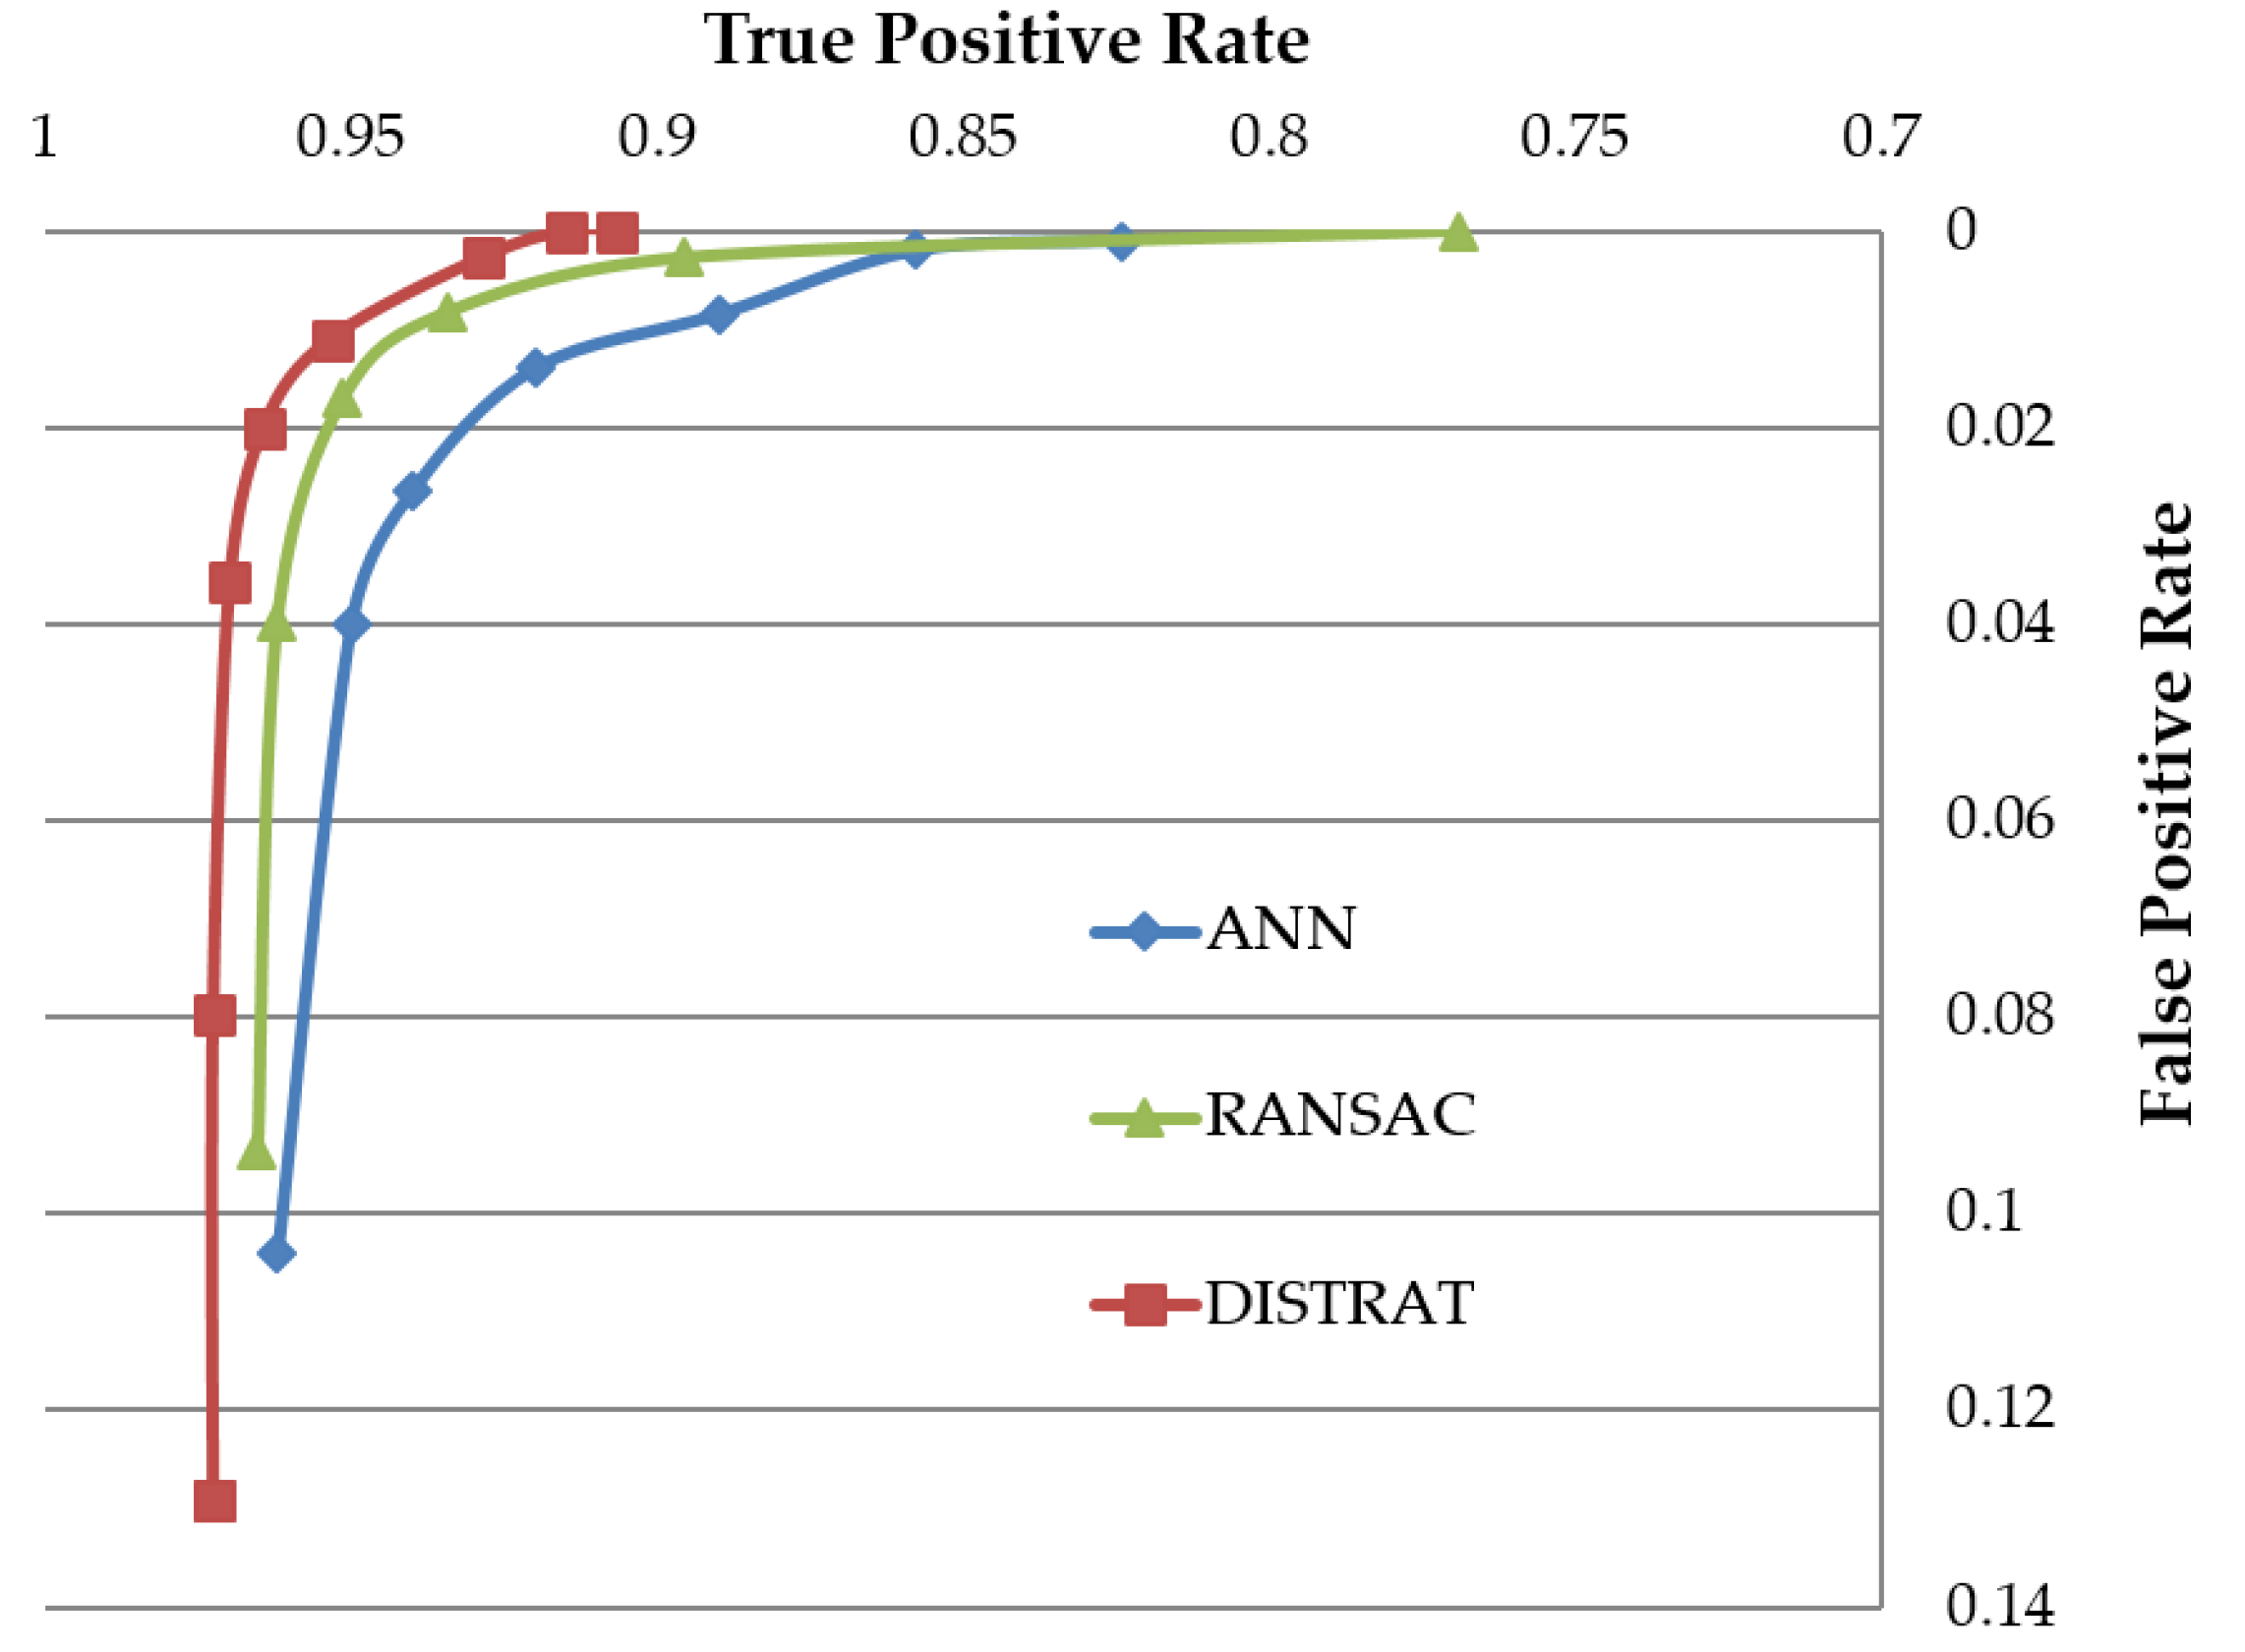
4.1. Geometric Verification Test for Rigid Object Matching

First, an NNDR higher than 0.8 was excluded in feature matching, and a Euclidean distance less than 0.6 was not used for fast calculation. This method was verified by Mikolajczyk and has been applied in most feature-matching cases [18]. Inliers were determined through LDR, while the matching score for a matching decision was calculated as follows:
m a t c h i n g   s c o r e =   ω ( ω + T m )
where, ω is the sum of inlier distances, and Tm is the threshold value. Matching was determined for a matching score >0.5. Accordingly, the experiment was conducted by altering the Tm value. The optimum value for Tm was determined through the receiver operating characteristic (ROC) curve, and set at Tm = 3, allowing a comparison of the performances of standard matching methods. A rigid-object image from the SMVS dataset was employed as an experimental image.
Figure 12 illustrates the ROC curves of Approximate Nearest Neighbor (ANN) [23], RANSAC [7], and DISTRAT [9], which were employed in this study as rigid-object image-matching methods. A superior performance is indicated by a position closer to the top-left of the graph. DISTRAT and RANSAC exhibit similar performance in rigid-object matching. However, DISTRAT, which is based on a statistical algorithm, has the advantage of a very fast matching speed compared to RANSAC, which is based on an iteration algorithm.

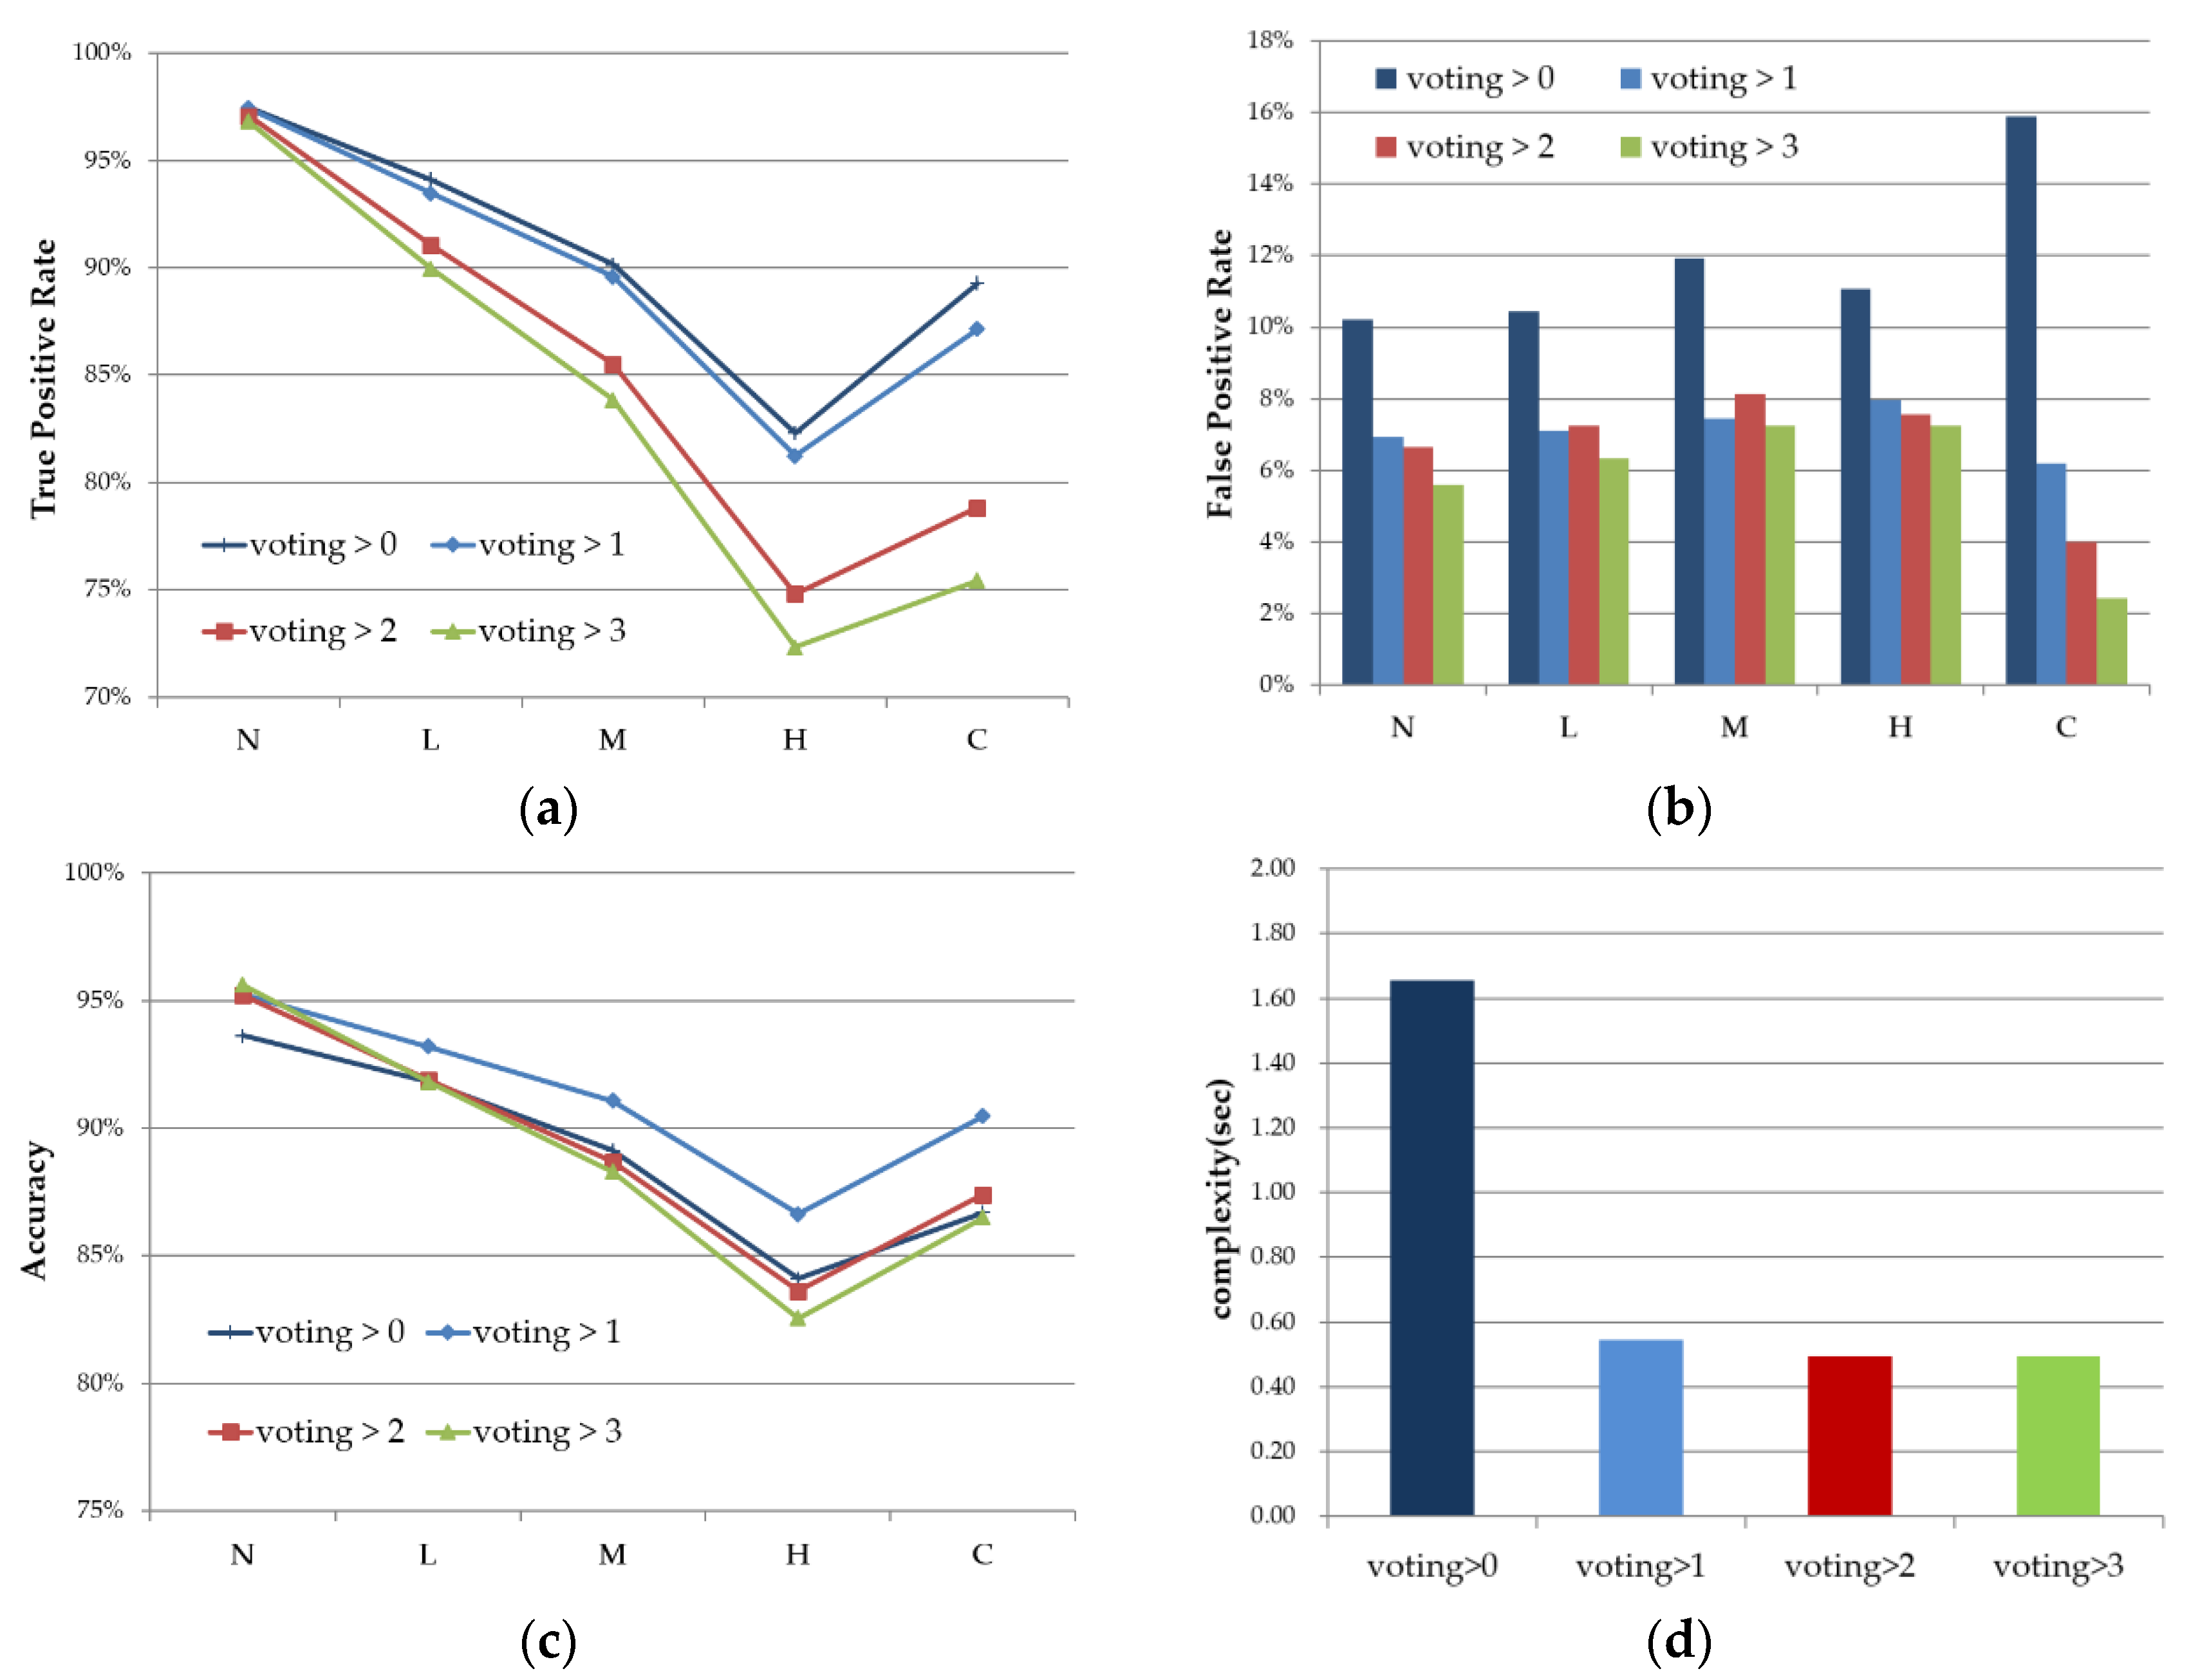
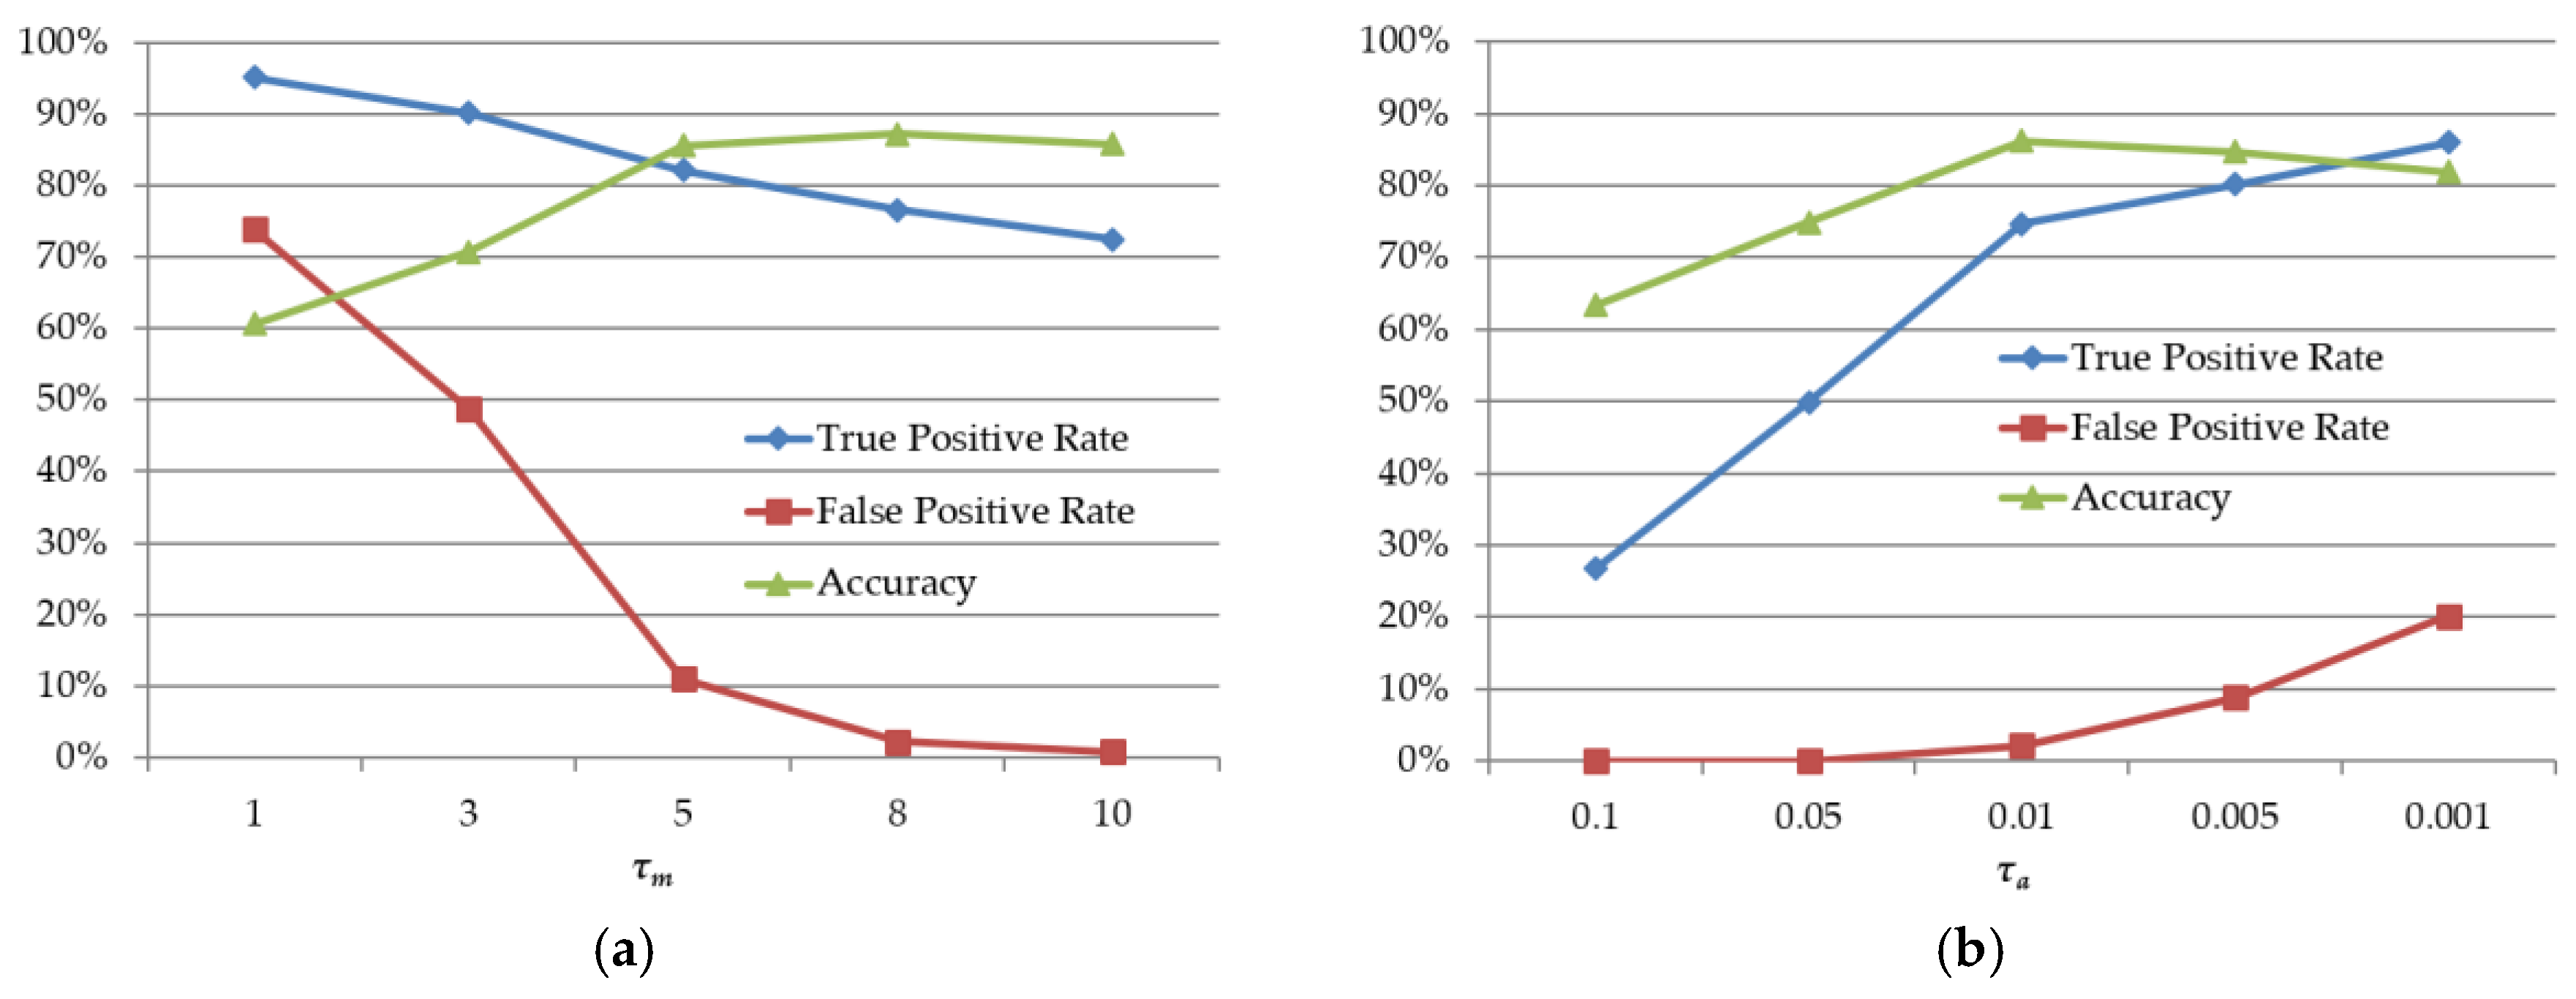
4.2. Discriminating Deformable Objects Using Voting Methods

The voting method was used for discrimination of deformable object images. Two additional methods were used as conditions in each voting, as well as SVM and the statistical model described in Section 3.3. The additional methods are the matching score used in rigid-object matching, and the sum of inliers distance. Matching score employs Equation (16). A low matching score indicates a small number of inliers or insufficient weight for an image-matching determination. However, it is necessary to slightly lower the matching parameter for deformable object images. Thus, a value that is lower than 0.5, which is used in rigid-object matching, was selected, and the probability of deformable object-matching was determined. The value was set at 0.2 and employed for the experiment. Second, the ratio of the total matching-pair weight and inlier weights was calculated. This value represents the proportion of inlier weights in the total matching pairs, regardless of the number of inliers. A value of 0.28 was selected through experiment as the method for determining matching-pairs having the probability of a deformable object.
Results of the proposed discrimination process for deformable objects are shown in Figure 13. The University of Kentucky (UKY) dataset was used as the training image set [23]. The UKY dataset consists of 10,200 images of 2550 objects.
Four conditions were used for voting, and the voting value was varied throughout the experiments, where voting > 0 implies conducting deformable-object matching for all cases that have not been rigid-matched. In contrast, voting > 3 indicates no deformable-object matching in most cases.
While TPR is highest voting > 0, the execution time is inefficient, the FPR is high, and accuracy is low, since all of the numerous deformable object-matching processes were run. If the voting value increases, the TPR and accuracy decrease, overall, since the possibility of deformable objects decreases. Therefore, the best performance for average accuracy was when voting > 1.

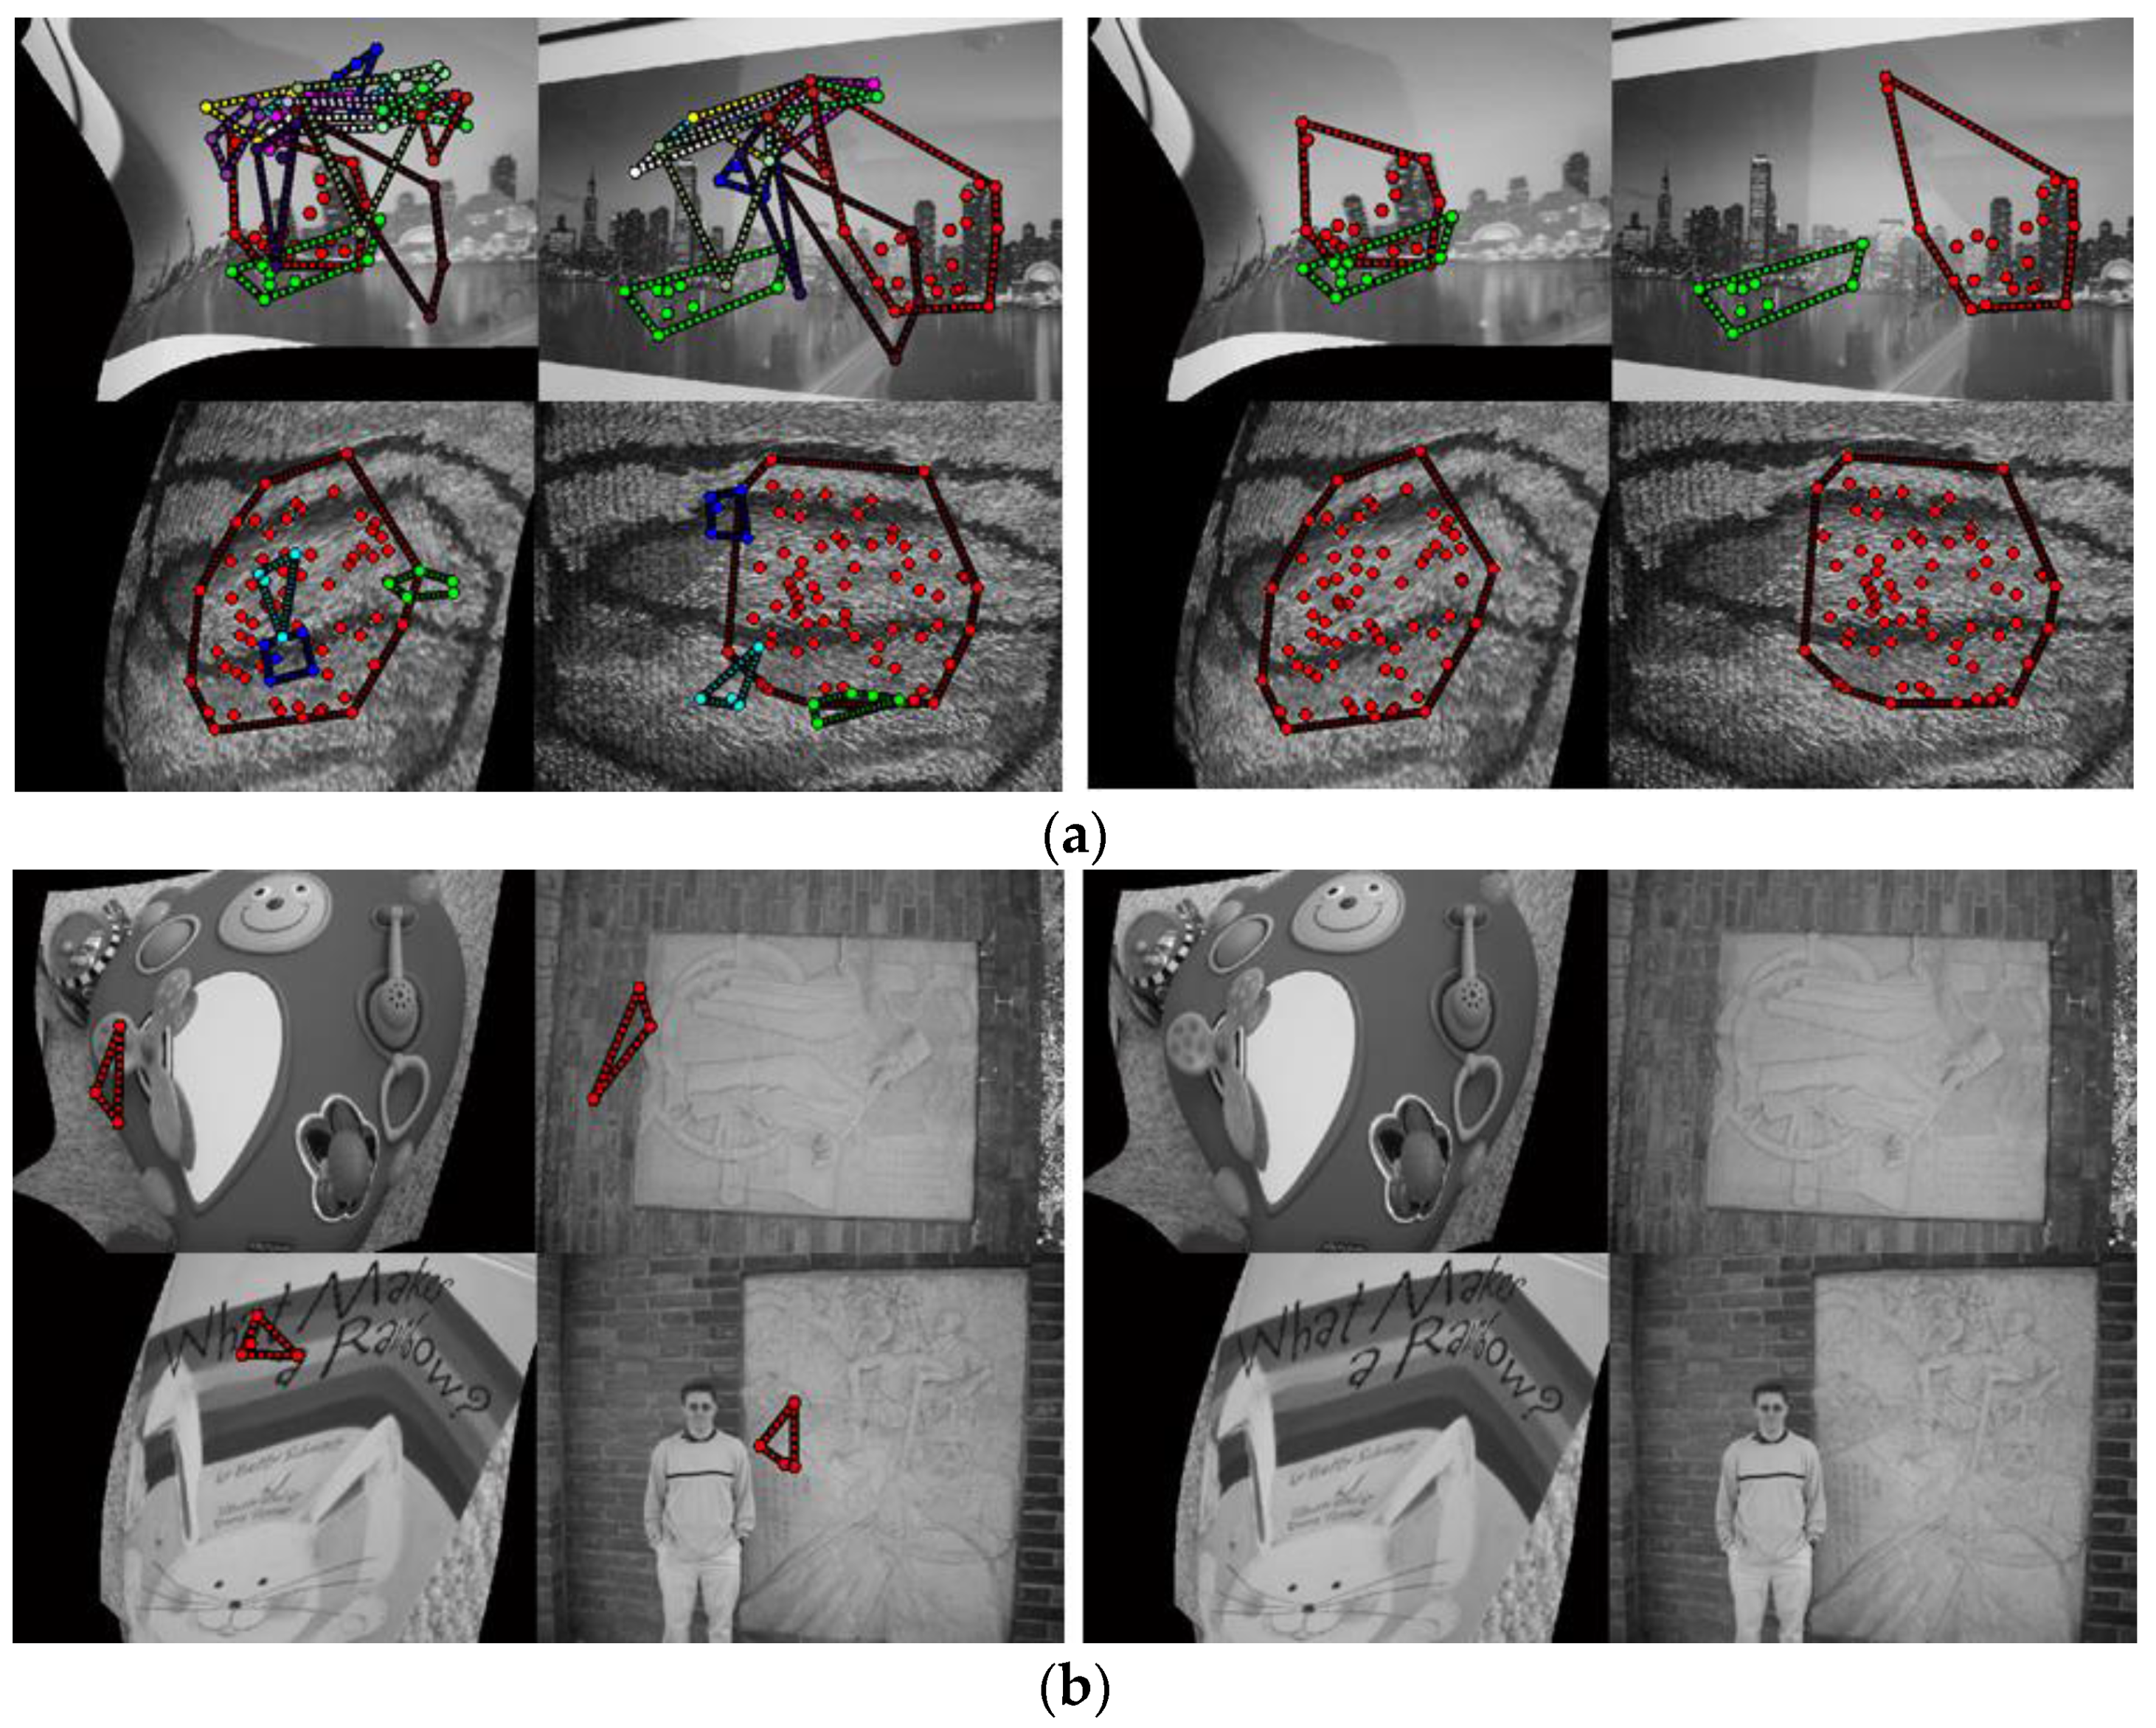
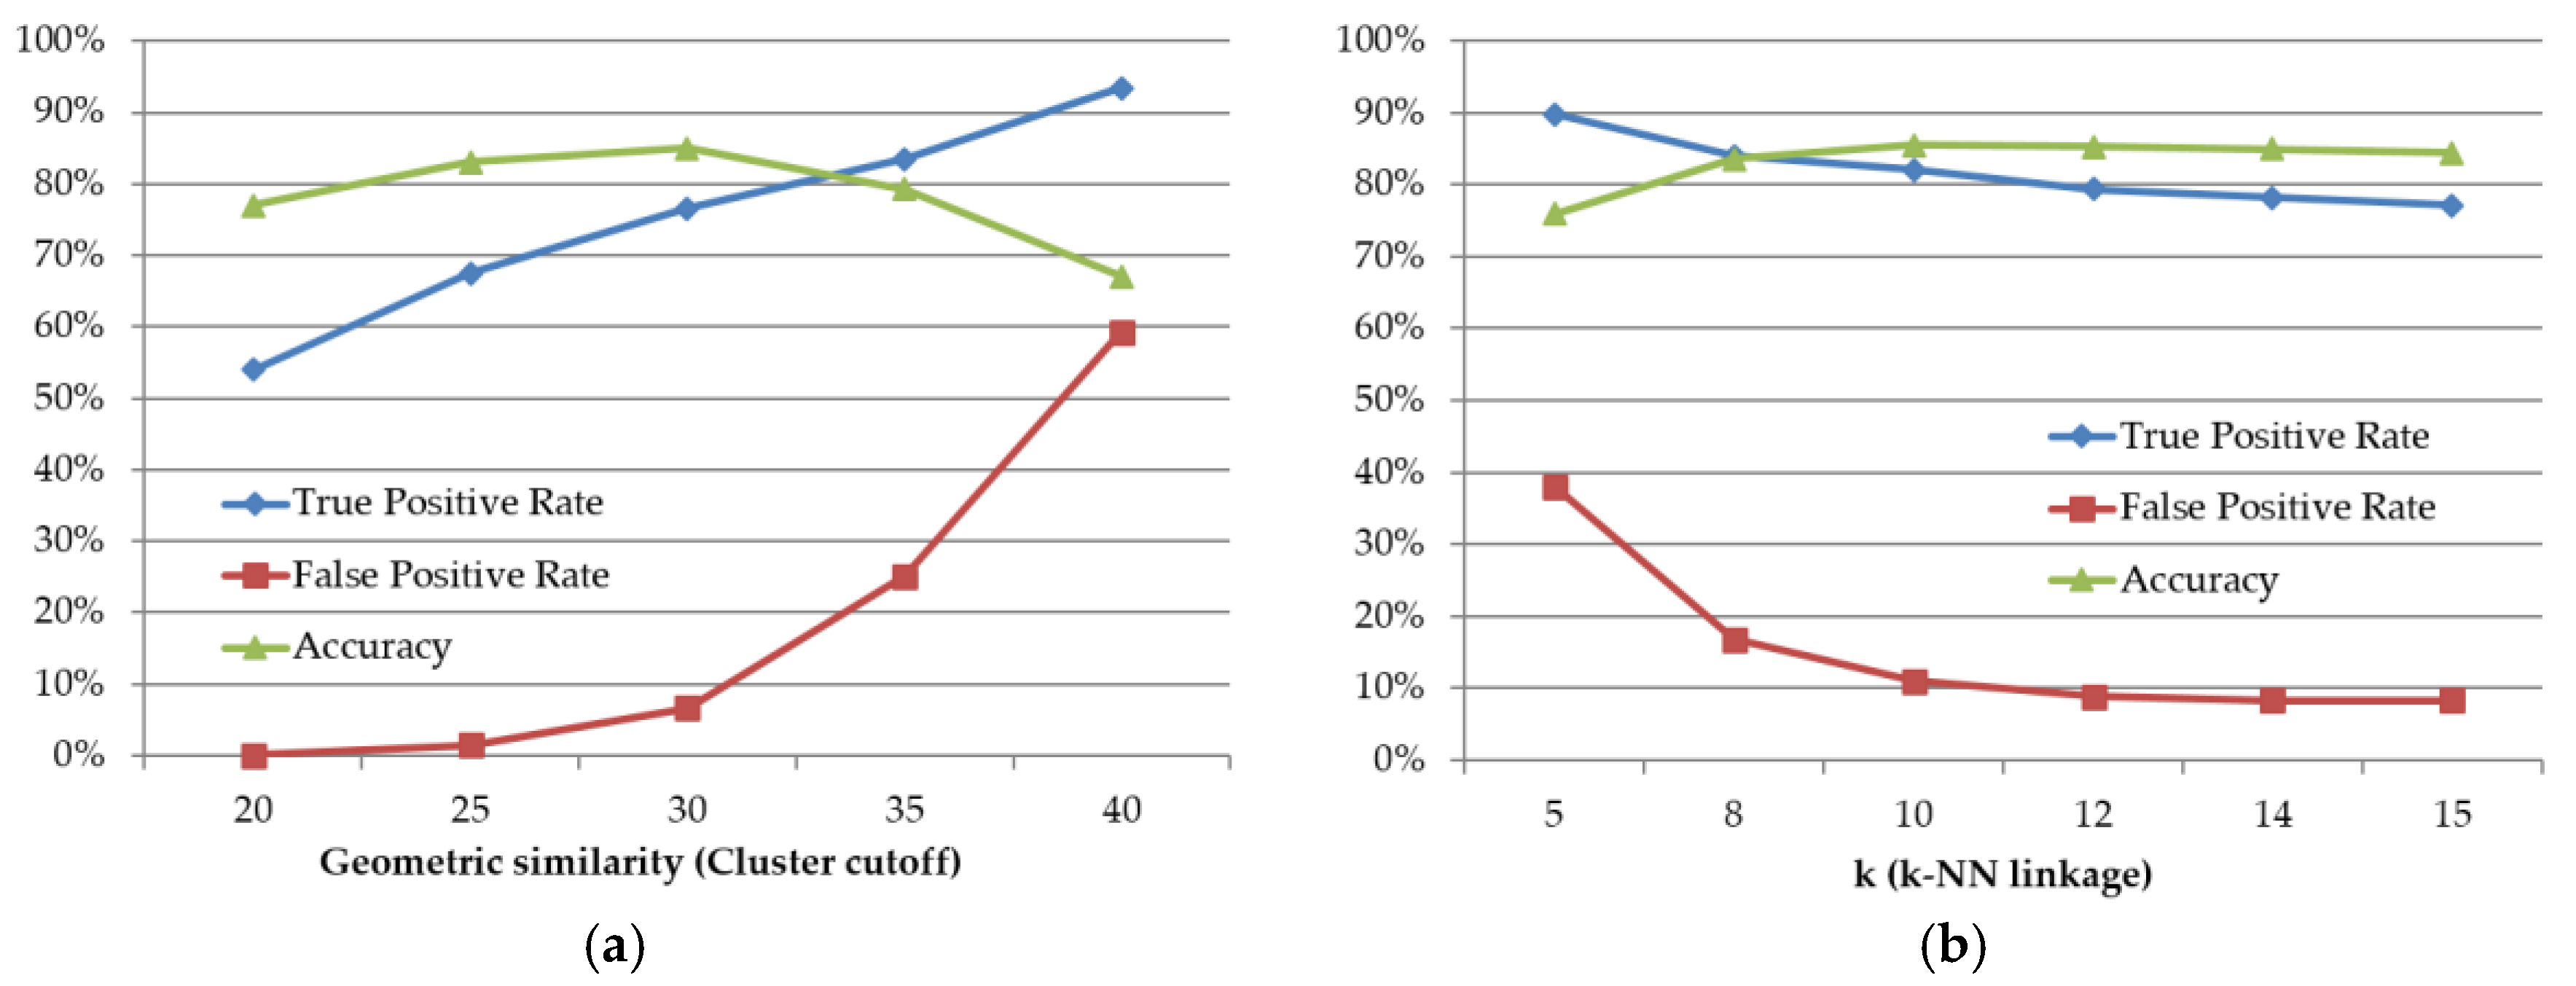
4.3. Deformable Object-Matching Performance Test

Hierarchical clustering was used for deformable-object matching. Hierarchical clustering will create a single cluster without cutoff. Figure 14a presents experimental results obtained by changing the cutoff. As the cutoff value increases, TPR and FPR increase. Accuracy was calculated to find the optimum cutoff value. It was confirmed through experiment that the best accuracy was found at a cutoff of 30. Moreover, linkage for the clustering employed a strong k-NN in a chain effect, and an experiment was conducted to determine the optimum k. The results are presented in Figure 14b. For a higher k, the number of false positives is reduced, but complexity increases. Because there is no significant effect on accuracy when k is higher than 10, a k value equal to 10 was employed.
An experiment was conducted using the two proposed methods for clustering validation. When clusters were formed using hierarchical clustering, the number of matching pairs contained in each cluster and the area of each cluster consisting of matching pairs in the image are determined as shown in Figure 15. Each cluster can be viewed as an object in an image. When the number of matching pairs constituting an object is small, or the area is narrow, the resulting object has a low value. Hence, cluster validation was performed using this result. Figure 15a illustrates the experiment regarding false clusters when the number of matching pairs contained in a cluster has a small threshold value (τm). The optimum value was determined through experiment to be τm = 5. Figure 15b shows the calculated ratio of each cluster area and the entire image area. A false cluster was deemed to occur when the ratio (τa) is low. From the experiment, the best value was confirmed to be τa = 0.01, and hence, this value was employed.

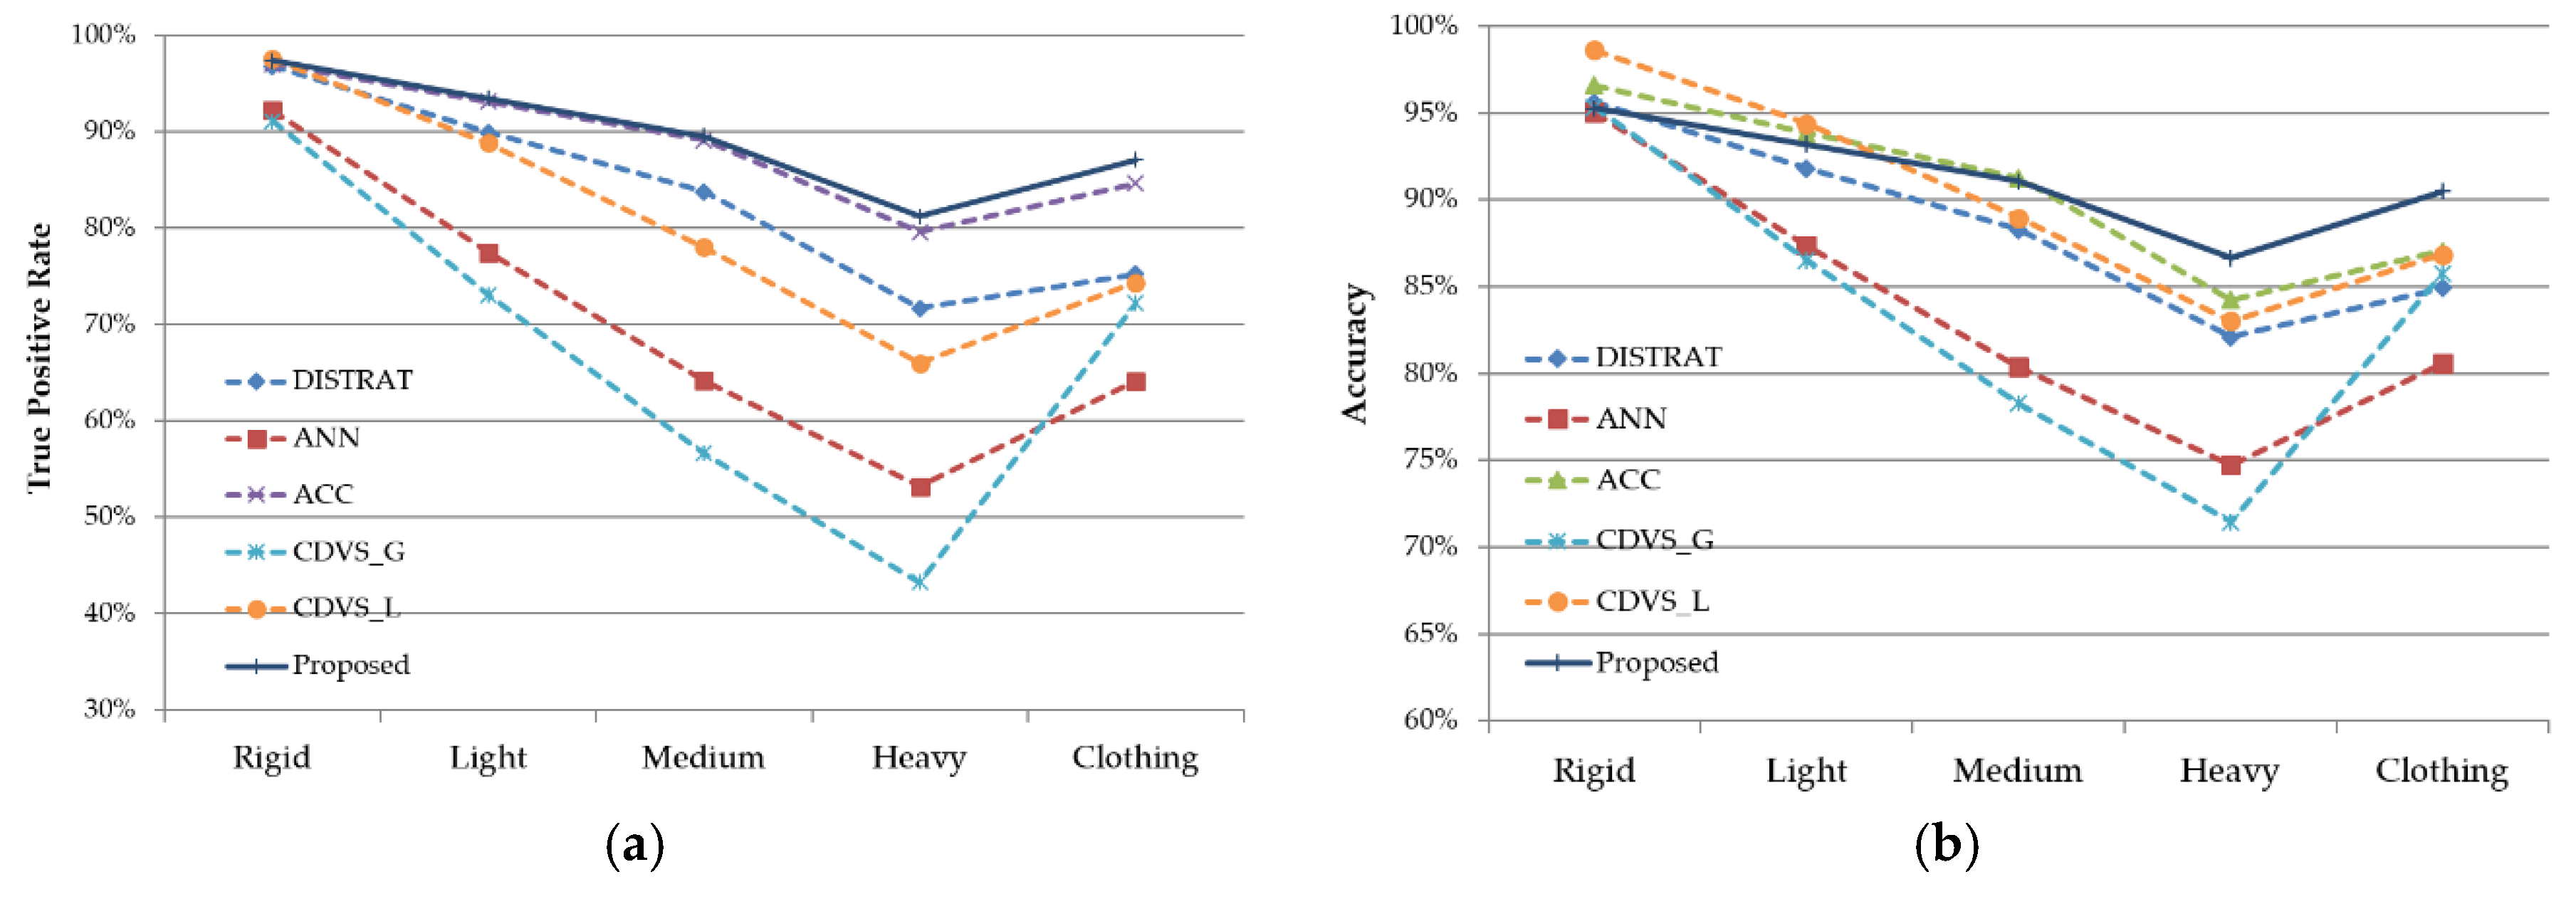
4.4. Performance Evaluation for the Proposed Matching Method

Lastly, performance evaluation using all test images was compared to that of various matching methods. TPR, FPR, accuracy and execution time were compared, as shown in Table 1. The parameters for performance evaluation were determined though the experiments described in the previous Section 4.1, Section 4.2 and Section 4.3. The main parameters are as follows. A value of Tm = 3 for the matching score was employed for rigid-object matching. Moreover, rigid matching was deemed to occur when the calculated matching score was higher than 0.5; voting > 1, which determines the best performance, was employed for voting on discrimination of deformable object images. Finally, cutoff = 30 was employed for cluster matching in deformable-object matching, while values of τm = 5 and τa = 0.01 were employed for cluster validation. For the performance comparison, the same parameters were employed for DISTRAT [9] and ACC [15].
Compared to various matching methods, the average accuracy was highest with the proposed method, with no significant difference in execution time. DISTRAT [9] and ANN [24] are representative rigid object-matching methods, and show good results with normal images, where there is only geometric transformation rather than deformable transformation. However, a dramatic decrease in performance was seen with an increase in the intensity of deformable transformation. Moreover, while the most recent method, CDVS [10], shows extremely fast execution time, since its objective is in retrieval rather than matching (and hence, compressed descriptors are used), this method also shows a decrease in performancebecause it is intended for rigid objects. While the clustering method [15] has a TPR equivalent to the proposed method, its FPR and time complexity are high, which will present difficulties in actual applications.
Figure 16 shows a comparison of various matching methods with different image types. TPR was observed to be the best in the proposed method. While it can be seen that both TPR and accuracy with the previous methods indicate a significant decrease in performance with an increasing intensity of deformation, the proposed method shows the least amount of decrease, implying that it can be used for robust matching of any transformation.

5. Conclusions

This paper introduced a method of matching images with geometric transformation and deformable transformations using the same features. Previous methods were specialized for certain transformations, and do not show good performance with other transformations. As a solution to this issue, we proposed an adaptive image-matching method that adopts discrimination of deformable transformations. The possibility of the occurrence of a deformable transformation is discriminated using the results from statistical analysis of the matching information and supervised learning. The proposed method showed discrimination performance of more than 90% accuracy, on average. Moreover, we proposed a method of calculating the geometric similarity of each matching pair, matching the pairs by clustering those with high similarity. Previous clustering-based methods have an issue with high time complexity. However, since the use of the aforementioned method of discriminating deformable transformations leads to most non-matching images being removed, and matching concerns only images with a deformable transformation, the discrimination method brings an increase in efficiency to the overall matching method. While the proposed image-matching method exhibits a TPR of 89%, since it can generate both rigid- and deformable-matching results, it was observed that FPR does not increase, since most false positives are removed through discrimination of deformable transformations.
Future research tasks include improving the accuracy of the deformable transformation discrimination method, and developing a deformable image-matching method with a fast execution time. The accuracy of the deformable transformation discrimination method greatly influences performance. In addition to local features, which were used as a solution to the problem of accuracy, the use of global features, like color or texture, can also be considered. Since this paper intends to use single-feature detection, it is believed that the use of such additional information in actual applied systems in the future can lead to improved performance. Moreover, if it is possible to perform fast indexing that can also be used for deformable transformations, it is expected that the system can be extended to an image-retrieval system that is also robust to image transformations.

Acknowledgments

This research was supported by Basic Science Research Program through the National Research Foundation of Korea (NRF) funded by the Ministry of Education (2010-0020163).

Author Contributions

Insu Won and Dongseok Jeong provided the main idea of this paper, designed the overall architecture of the proposed algorithm. Jaehyup Jeong and Hunjun Yang conducted the test data collection and designed the experiments. Insu Won and Jangwoo Kwon wrote and revised the manuscript. All authors read and approved the final manuscript.

Conflicts of Interest

The authors declare no conflict of interest.

References

  1. Krizhevsky, A.; Sutskever, I.; Hinton, G.E. Imagenet classification with deep convolutional neural networks. In Proceedings of the Advances in Neural Information Processing Systems (NIPS), Lake Tahoe, NV, USA, 3–8 December 2012; pp. 1097–1105.
  2. Won, I.; Yang, H.; Jang, H.; Jeong, D. Adaptive Matching Method of Rigid and Deformable Object Image using Statistical Analysis of Matching-pairs. J. Inst. Electron. Inform. Eng. 2015, 52, 102–110. [Google Scholar] [CrossRef]
  3. Liu, S.; Song, Z.; Liu, G.; Xu, C.; Lu, H.; Yan, S. Street-to-shop: Cross-scenario clothing retrieval via parts alignment and auxiliary set. In Proceedings of the IEEE Conference on Computer Vision and Pattern Recognition (CVPR), Providence, RI, USA, 16–21 June 2012; pp. 3330–3337.
  4. Na, S.; Oh, W.; Jeong, D. A Frame-Based Video Signature Method for Very Quick Video Identification and Location. ETRI J. 2013, 35, 281–291. [Google Scholar] [CrossRef]
  5. Kahaki, S.; Nordin, M.J.; Ashtari, A.H.; Zahra, S.J. Deformation invariant image matching based on dissimilarity of spatial features. Neurocomputing 2016, 175, 1009–1018. [Google Scholar] [CrossRef]
  6. Awrangjeb, M.; Lu, G. Contour-Based Corner Detection and Robust Geometric Point Matching Techniques. Ph.D. Thesis, Monash University, Melbourne, Australia, 2008. [Google Scholar]
  7. Fischler, M.A.; Bolles, R.C. Random sample consensus: A paradigm for model fitting with applications to image analysis and automated cartography. Commun. ACM 1981, 24, 381–395. [Google Scholar] [CrossRef]
  8. Tsai, S.S.; Chen, D.; Takacs, G.; Chandrasekhar, V.; Vedantham, R.; Grzeszczuk, R.; Girod, B. Fast geometric re-ranking for image-based retrieval. In Proceedings of the International Conference on Image Processing (ICIP), Hong Kong, 26–29 September 2010; pp. 1029–1032.
  9. Lepsøy, S.; Francini, G.; Cordara, G.; Gusmão, D.; Buarque, P.P. Statistical modelling of outliers for fast visual search. In Proceedings of the International Conference Multimedia and Expo (ICME), Barcelona, Spain, 11–15 July 2011; pp. 1–6.
  10. Duan, L.; Chandrasekhar, V.; Chen, J.; Lin, J.; Wang, Z.; Huang, T.; Girod, B.; Gao, W. Overview of the MPEG-CDVS Standard. IEEE Trans. Image Process. 2016, 25, 179–194. [Google Scholar] [CrossRef] [PubMed]
  11. Zhu, J.; Hoi, S.C.; Lyu, M.R. Nonrigid shape recovery by Gaussian process regression. In Proceedings of the IEEE Conference on Computer Vision and Pattern Recognition (CVPR), Miami, FL, USA, 20–25 June 2009; pp. 1319–1326.
  12. Pilet, J.; Lepetit, V.; Fua, P. Real-time nonrigid surface detection. In Proceedings of the IEEE Conference on Computer Vision and Pattern Recognition (CVPR), San Diego, CA, USA, 20–26 June 2009; pp. 822–828.
  13. Kettani, O.; Ramdani, F.; Tadili, B. An Agglomerative Clustering Method for Large Data Sets. Int. J. Comp. Appl. 2014, 92, 1–7. [Google Scholar] [CrossRef]
  14. Zhou, F.; Torre, F. Deformable graph matching. In Proceedings of the IEEE Conference on Computer Vision and Pattern Recognition (CVPR), Portland, OR, USA, 23–28 June 2013; pp. 2922–2929.
  15. Cho, M.; Lee, J.; Lee, K.M. Feature correspondence and deformable object matching via agglomerative correspondence clustering. In Proceedings of the IEEE International Conference on Computer Vision (ICCV), Kyoto, Japan, 27 September–4 October 2009; pp. 1280–1287.
  16. Yang, H.; Won, I.; Jeong, D. On the Improvement of Deformable Object Matching. In Proceedings of the Korea-Japan Joint Workshop on Frontiers of Computer Vision (FCV), Okinawa, Japan, 4–6 February 2014; pp. 1–4.
  17. Lowe, D.G. Distinctive image features from scale-invariant keypoints. Int. J. Comp. Vis. 2004, 60, 91–110. [Google Scholar] [CrossRef]
  18. Krystian, M.; Cordelia, S. A Performance Evaluation of Local Descriptors. IEEE Trans. Pattern Anal. Mach. Intell. 2005, 27, 1615–1630. [Google Scholar]
  19. Chapelle, O.; Haffner, P.; Vapnik, V.N. Support vector machines for histogram-based image classification. IEEE Trans. Neural Netw. 1999, 10, 1055–1064. [Google Scholar] [CrossRef] [PubMed]
  20. Zhao, W.; Wu, X.; Ngo, C. On the annotation of web videos by efficient near-duplicate search. IEEE Trans. Multimed. 2010, 12, 448–461. [Google Scholar] [CrossRef]
  21. Chandrasekhar, V.R.; Chen, D.M.; Tsai, S.S.; Cheung, N.; Chen, H.; Takacs, G.; Reznik, Y.; Vedantham, R.; Grzeszczuk, R.; Bach, J. The Stanford mobile visual search data set. In Proceedings of the Second Annual ACM Conference on Multimedia Systems, Santa Clara, CA, USA, 23–25 February 2011; pp. 117–122.
  22. Bookstein, F.L. Principal warps: Thin-plate splines and the decomposition of deformations. IEEE Trans. Pattern Anal. Mach. Intell. 1989, 10, 567–585. [Google Scholar] [CrossRef]
  23. Nister, D.; Stewenius, H. Scalable recognition with a vocabulary tree. In Proceedings of the IEEE Computer Society Conference on Computer Vision and Pattern Recognition (CVPR), New York, NY, USA, 17–22 June 2006; pp. 2161–2168.
  24. Arya, S.; Mount, D.M.; Netanyahu, N.S.; Silverman, R.; Wu, A.Y. An optimal algorithm for approximate nearest neighbor searching fixed dimensions. J. ACM 1998, 45, 891–923. [Google Scholar] [CrossRef]
Figure 1. Proposed method for image matching using discrimination of deformable object images.
Symmetry 08 00068 g001
Figure 2. LDR histogram calculation process.
Symmetry 08 00068 g002
Figure 3. (a) Results of feature matching using NNDR (left: incorrectly matched images, right: correctly matched images); (b) the lines point to the positions of the matched features in the other image; and (c) the LDR histogram of the model function.
Symmetry 08 00068 g003
Figure 4. Analysis for geometric verification based on LDR (k = 25): (a) example of LDR histogram h(k), model function f(k), and difference d(k) (top: correctly matched images, bottom: incorrectly matched images); and (b) eigenvector r for finding inliers (top), and the results in descending order (bottom).
Symmetry 08 00068 g004
Figure 5. Normal distribution model of matching information from matching pairs of deformable and non-matching images: (a) number of matching pairs; (b) number of inliers; (c) sum of all matching pairs’ distances; (d) sum of inliers’ distances; and (e) matching information of x.
Symmetry 08 00068 g005
Figure 6. Comparison of d(k) between matching images: (a) d(k) of rigid matching pair; (b) d(k) of deformable-object matching pair; and (c) d(k) of non-matching pair.
Symmetry 08 00068 g006
Figure 7. Example of a geometric similarity measure.
Symmetry 08 00068 g007
Figure 8. Example of an affinity matrix (10 matching pairs).
Symmetry 08 00068 g008
Figure 9. Deformable image-matching results using hierarchical clustering of geometric similarity: (a) matching results for rigid objects with geometric transformation; and (b) matching results of a deformable object.
Symmetry 08 00068 g009
Figure 10. Comparison results from before (left) and after (right) clustering validation: (a) inlier-matching pairs; and (b) outlier-matching pairs.
Symmetry 08 00068 g010
Figure 11. Examples of images for the matching test: (a) SMVS datasets; (b) deformable transformation images (normal, light, medium, and heavy); and (c) clothing images.
Symmetry 08 00068 g011
Figure 12. ROC curve comparison of the representative rigid object-matching methods.
Symmetry 08 00068 g012
Figure 13. Performance per voting values (N: normal images; L: light deformable images; M: medium deformable images; H: heavy deformable images; and C: clothing images): (a) true positive rate for voting values; (b) false positive rate for voting values; (c) accuracy for voting values; and (d) execution time for voting values.
Symmetry 08 00068 g013
Figure 14. Experimental results according to parameters in clustering of geometric similarity for deformable-object matching: (a) experimental result based on the cutoff of geometric similarity; and (b) experimental result based on k of a k-NN linkage.
Symmetry 08 00068 g014
Figure 15. Results of the parameter experiment for cluster validation: (a) threshold of matching-pairs constituting a cluster; and (b) experimental results based on the ratio of clusters to the entire image area.
Symmetry 08 00068 g015
Figure 16. Performance results of the matching methods: (a) comparison of true positive rate; and (b) comparison of accuracy.
Symmetry 08 00068 g016
Table 1. Performance results of image-matching methods (averages).
MethodsTPRFPRAccuracyMatching Time (s)
DISTRAT [9]83.51%6.41%88.55%0.446
ANN [24]70.27%3.03%83.62%0.536
ACC [15]86.45%6.46%89.99%3.759
CDVS(Global) [10]67.27%0.35%83.46%0.003
CDVS(Local) [10]74.94%0.28%87.33%0.005
Proposed89.78%7.12%91.33%0.521

