
Nested One-to-One Symmetric Classification Method on a Fuzzy SVM for Moving Vehicles


Abstract
:1. Introduction
2. Construction of the Model of a Nested One-to-One Symmetric Classification Classifier on FSVM
2.1. The Basis of the Multi-Classifier Algorithm
2.2. The Model of the Nested One-to-One Symmetric Classification on a Fuzzy Support Vector Machine
- (1)
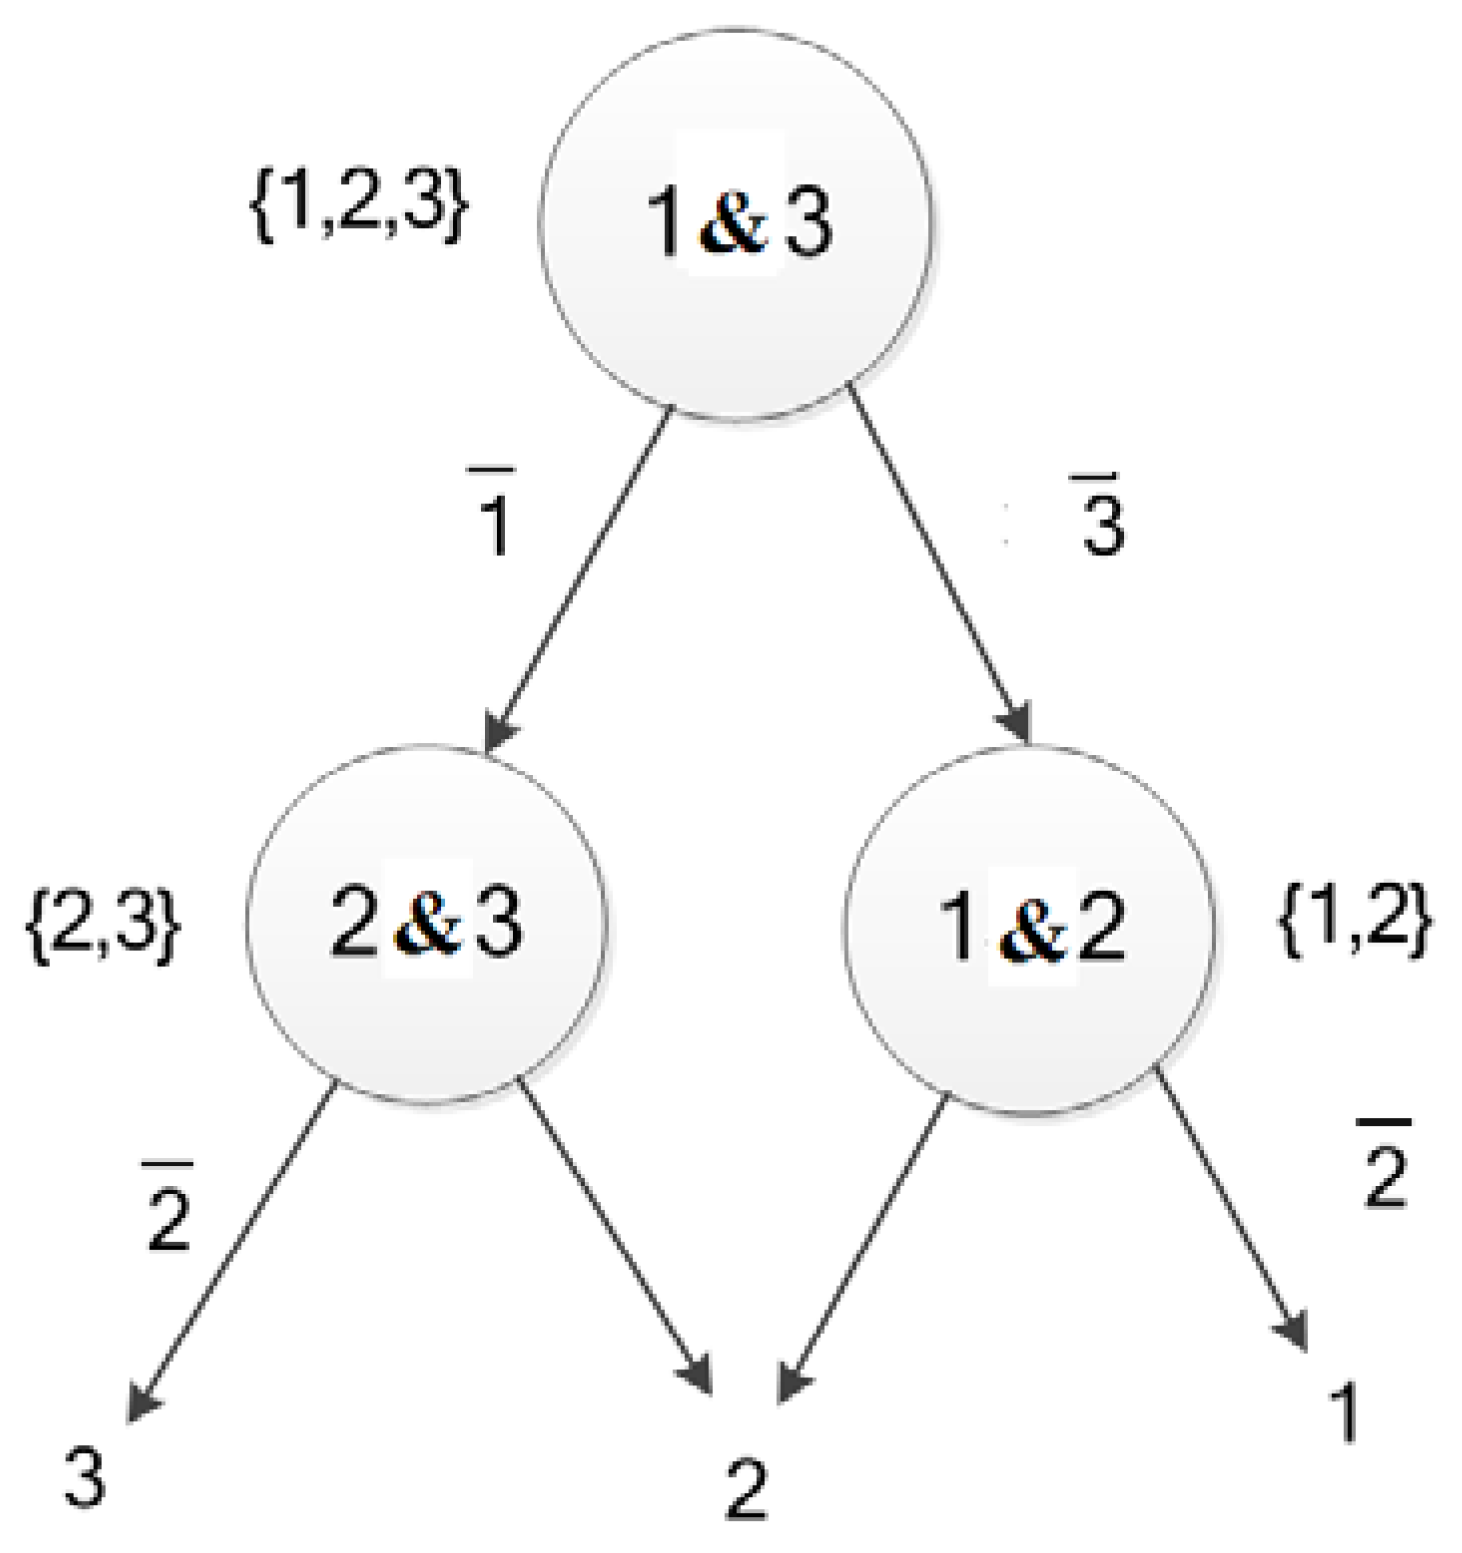
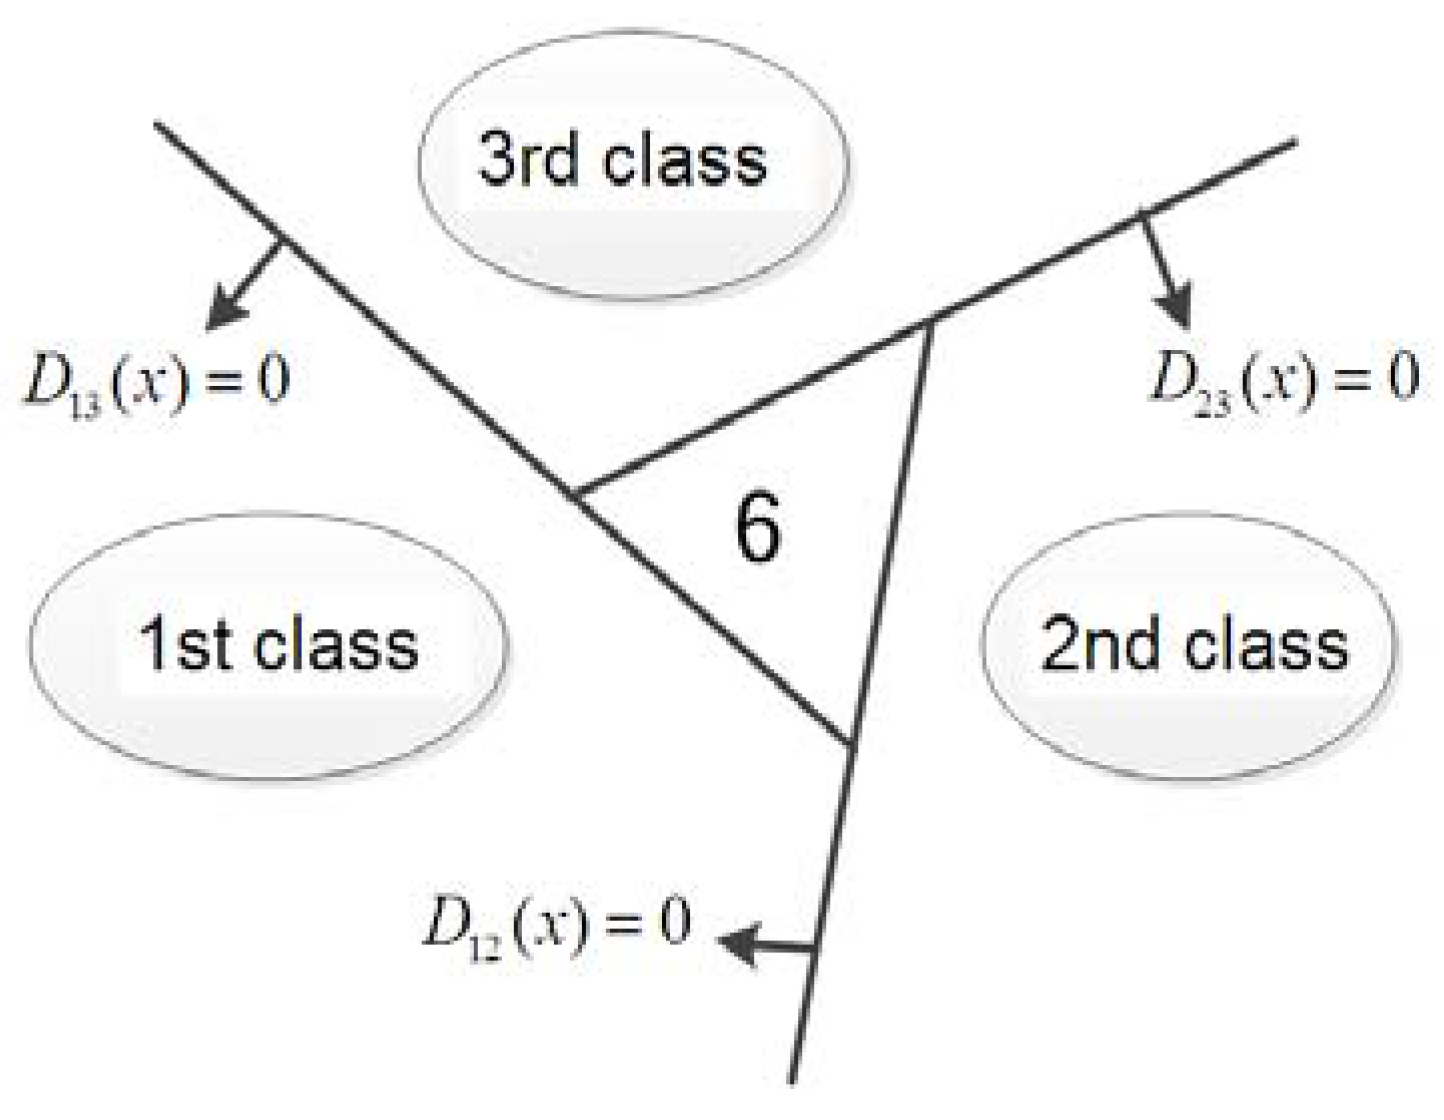
- For a C classification problem, the nested one to one classification constructs the most superior C(C-1)/2 hyper-planes. Where the hyper-plane between the m-th class and the n-th class is as Equation (10), with m and n ∈ {1,2,3}. A three-classification of the vehicle classification problem is addressed in this work, and three optimal hyper-planes are established.
- (2)
- For any given sample x, if the result k is the only value by calculating according to Equation (13), then sample x belongs to the k-th category. Otherwise, x will fall into the samples of the inseparable region according to Equation (13).
- (3)
- If the number of categories of samples that fall into the category of the non-separable area is greater than, or equal to, 3, then it is a multi-classification problem. Using these samples constructs three hyper-planes according to the symmetric strategy of the nested one-to-one classification.
- (4)
- Repeat steps (2) to (3) until the inseparable area contains only one or two classes, or no sample.
- (5)
- If the inseparable area contains only one type of sample, finally, the area is assigned to one class; if it contains two types of samples, the binary classification fuzzy support vector machine would be used to divide the region and assign the corresponding category.
2.3. Implementation and Validation of the Nested One-to-One Symmetric Classification Model on FSVM
3. Experiment of the Nested One-to-One Symmetric Classification for Moving Vehicles Based on FSVM
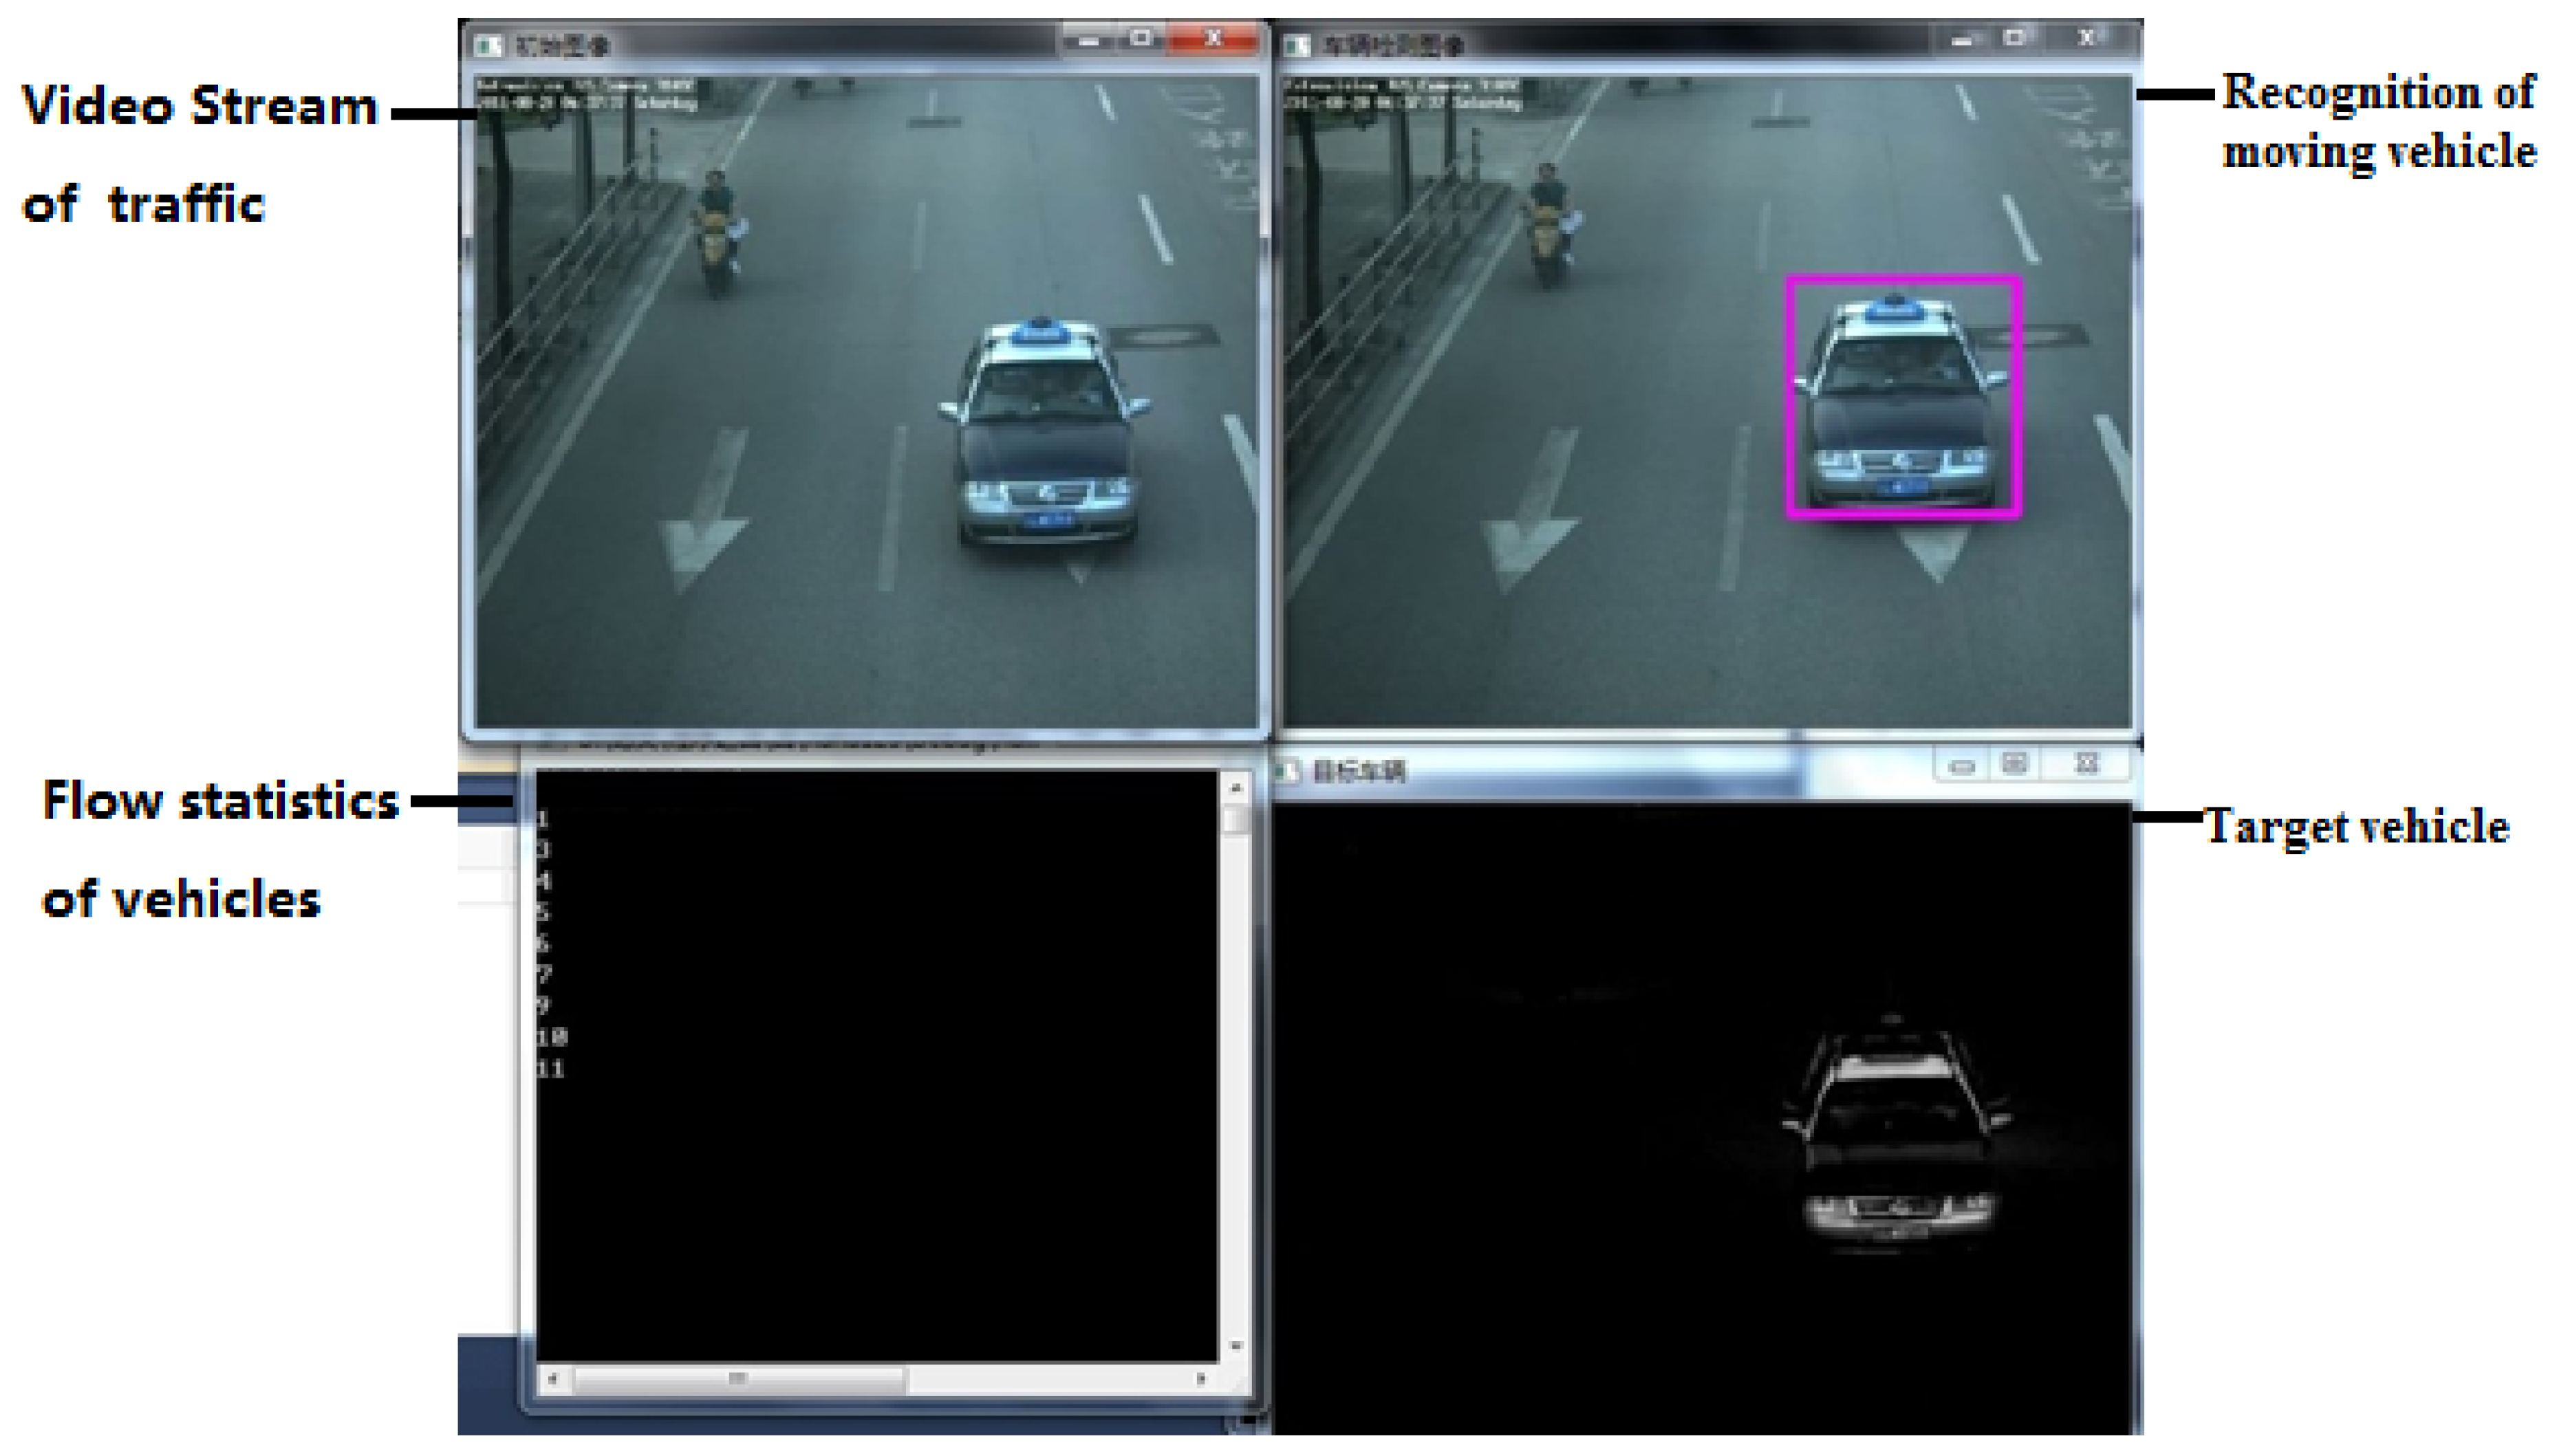
3.1. Procedure of Experiment
3.2. Analysis of Results
4. Conclusions
Acknowledgments
Author Contributions
Conflicts of Interest
References
- Cover, T.; Hart, P. Nearest neighbor pattern classification. IEEE Trans. Inf. Theory 1967, 13, 21–27. [Google Scholar] [CrossRef]
- Gupte, S.; Masoud, O.; Martin, R.F.K. Detection and Classification of Vehicles. IEEE Trans. Intell. Transp. Syst. 2002, 3, 37–47. [Google Scholar] [CrossRef]
- Gajda, J.; Sroka, R.; Stencel, M.; Wajda, A.; Zeglen, T. A vehicle recognition based on inductive loop detectors. In Proceedings of the IEEE Instrumentation and Measurement Technology Conference, Budapest, Hungary, 21–23 May 2001; pp. 460–464. [Google Scholar]
- Michalski, A. Dry calibration procedure of electromagnetic flowmeter for open channels. IEEE Trans. Instrum. Meas. 2000, 49, 434–438. [Google Scholar] [CrossRef]
- Merrier, R.; Harrington, A.; Cahill, V. A framework for integrating existing and novel Intelligent Transportation Systems. In Proceedings of the Intelligent Transportation Systems, Vienna, Austria, 13–16 September 2003; pp. 590–597. [Google Scholar]
- Zhang, F. The current situation and development thinking of the intelligent transportation system in China. In Proceedings of the International Conference on Mechanic Automation and Control Engineering, Wuhan, China, 26–28 June 2010; pp. 13–16. [Google Scholar]
- Georga, E.; Protopappas, V.; Guille, A.; Fico, G.; Ardigo, D.; Arredondo, M.T.; Exarchos, T.P.; Polyzos, D.; Fotiadis, D.I. Data Mining for blood Glucose Prediction and Knowledge Discovery in Diabetic Patients: The METABO Diabetes Modeling and Management System. In Proceedings of the Annual International Conference of the IEEE EMBS, Minneapolis, MN, USA, 3–6 September 2009; pp. 5633–5636. [Google Scholar]
- Kong, W.K.; Zhang, D.; Li, W. Palm print feature extraction using 2-D Gabor filters. Pattern Recognit. 2003, 36, 2339–2347. [Google Scholar] [CrossRef]
- Jing, X.-Y.; Zhang, D.; Tang, Y.-Y. An improved LDA approach. IEEE Trans. Syst. Man Cybern. B Cybern. 2004, 34, 1942–1951. [Google Scholar] [CrossRef] [PubMed]
- Bertozzi, M.; Broggi, A.; Fascioli, A. Vision-based intelligent vehicles: State of the art and perspective. Robot. Auton. Syst. 1998, 17, 56–63. [Google Scholar] [CrossRef]
- Tsai, L.-W.; Hsieh, J.-W.; Fan, K.-C. Vehicle Detection Using Normalized Color and Edge Map. IEEE Trans. Image Process. 2007, 16, 850–854. [Google Scholar] [CrossRef] [PubMed]
- Dubuisson, M.; Jain, A.; Taylor, W. A Vision-Based Vehicle Matching System. In Proceedings of the Intelligent Vehicles ‘94 Symposium, Paris, France, 24–26 October 1994; pp. 266–271. [Google Scholar]
- Sotelo, M.A.; Nuevo, J.; Bergasa, L.M.; Ocana, M.; Parra, I.; Fernandez, D. Road Vehicle Recognition in Monocular Images. In Proceedings of the IEEE International Symposium on Strial Electronics, ISIE, Dubrovnik, Croatia, 20–23 June 2005; pp. 1471–1476. [Google Scholar]
- Zhai, N.; Su, J.; Song, N.; Liu, Y.; Chen, Y. Research on Vehicle Type Recognition by Computer Vision Based on Invariant Moments. J. WUT Inf. Manag. Eng. 2007, 29, 7–10. [Google Scholar]
- Yang, Z. Vehicle Type Recognition in Traffic Video Surveillance. Master’s Thesis, Wuhan University of Technology, Wuhan, China, 2012. [Google Scholar]
- Schlosser, C.; Reitberger, J.; Hinz, S. Automatic Car detection in high resolution urban scenes based on an adaptive 3d model. In Proceedings of the IEEE Second GRSS/ISPRS Joint Workshop on Remote Sensing and Data Fusion over Urban Areas, Berlin, Germany, 22–23 May 2003; Volume 2, pp. 997–1000. [Google Scholar]
- Low, D.G. Distinctive Image features from scale-invariant key-point. Int. J. Comput. Vis. 2004, 2, 91–110. [Google Scholar] [CrossRef]
- Hagan, M.T.; Menhaj, M.B. Training Feed-forward networks with the marquardt algorithm. IEEE Trans. Neural Netw. 1994, 5, 295–301. [Google Scholar] [CrossRef] [PubMed]
- Wang, Y. The Study and Design of Real-Time Image Processing Platform Based on FPGA. Master’s Thesis, Northeastern University, Shenyang, China, 2011. [Google Scholar]
- Cheung, S.C.; Kamath, C. Robust techniques for background subtraction in urban traffic video. Proc. Vis. Commun. Image Process. 2004, 5308, 881–892. [Google Scholar]
- Kembhavi, A.; Harwood, D. Vehicle detection using partial least squares. IEEE Trans. Pattern Anal. Mach. Intell. 2011, 33, 1250–1265. [Google Scholar] [CrossRef] [PubMed]
- Vedavathi, K.; Rap, K.S.; Devi, K.N. Unsupervised learning algorithm for time series using bivariate AR(1) model. Expert Syst. Appl. 2014, 41, 3402–3408. [Google Scholar] [CrossRef]
- Wang, S.X.; Song, Z.-H.; Zhu, Z.-X.; Yang, B.-J.; Mao, E.-R.; Zhang, R. Study on crop image feature extraction of vehicle-based estimation system on large scale crop acreage. In Proceedings of the IEEE International Conference on Machine Learning and Cybernetics, Ningbo, China, 9–12 July 2007; pp. 377–382. [Google Scholar]
- Huang, S.S.; Fu, L.C.; Hsiao, P.Y. Region-Level Motion-Based Background Modeling and Substraction Using MRFs. IEEE Trans. Image Process. 2007, 16, 1446–1456. [Google Scholar] [CrossRef] [PubMed]
- Hu, M.K. Visual Pattern Recognition by Moment Invariants. IEEE Trans. Inf. Theory 1962, 8, 179–187. [Google Scholar]
- Kazemi, F.M.; Samadi, S.; Poorreza, H.R.; Akbarzadeh-T, M.R. Vehicle Recognition Using Curve let Transform and SVM. In Proceedings of the IEEE International Conference on Information Technology, Las Vegas, NV, USA, 2–4 April 2007; Volume 4, pp. 516–521. [Google Scholar]
- Lin, S.-L.; Liu, Z. Parameter selection in SVM with RBF kernel function. J. Zhejiang Univ. Technol. 2007, 4, 163–167. [Google Scholar]
- Jolly, D.; Lakshmanan, S.; Jain, K. Vehicle Segmentation and Classification Using Deformable Templates. IEEE Trans. Pattern Anal. Mach. Intell. 1996, 18, 293–308. [Google Scholar] [CrossRef]
- Liu, S.-W.; Huang, H.-P.; Lin, C.-H.; Chien, I.L. Fuzzy-Logic-Based Supervisor of Insulin Bolus Delivery for Patients with Type 1 Diabetes Mellitus. Ind. Eng. Chem. Res. 2013, 52, 1678–1690. [Google Scholar] [CrossRef]
- Wren, C.R.; Azarbayejani, A.; Darrell, T.; Pentland, A.P. Pfinder: Real-time tracking of the human body. IEEE Trans. PAMI 1997, 19, 780–785. [Google Scholar] [CrossRef]
- Kijsirikul, B.; Ussivakul, N. Multiclass support vector machines using adaptive directed acyclic graph. In Proceedings of the International Joint Conference on Neural Networks, Honolulu, HI, USA, 12–17 May 2002; pp. 980–985. [Google Scholar]
- Fei, B.; Liu, J.B. Binary tree of SVM: A new fast multiclass training and classification algorithm. IEEE Trans. Neural Netw. 2006, 17, 696–704. [Google Scholar] [CrossRef] [PubMed]
- Rifkin, R.; Klautau, A. In defense of one-vs-all classification. J. Mach. Learn. Res. 2004, 5, 101–141. [Google Scholar]
- Stauffer, C.; Grimson, W.E.L. Adaptive background mixture models for real-time tracking. In Proceedings of the IEEE Computer Society Conference on Computer Vision and Pattern Recognition, Fort Collins, CO, USA, 23–25 June 1999; IEEE Computer Society: Cambridge, MA, USA, 1999; pp. 1063–1069. [Google Scholar]


| No. | Name | Number | Video Capture Direction |
|---|---|---|---|
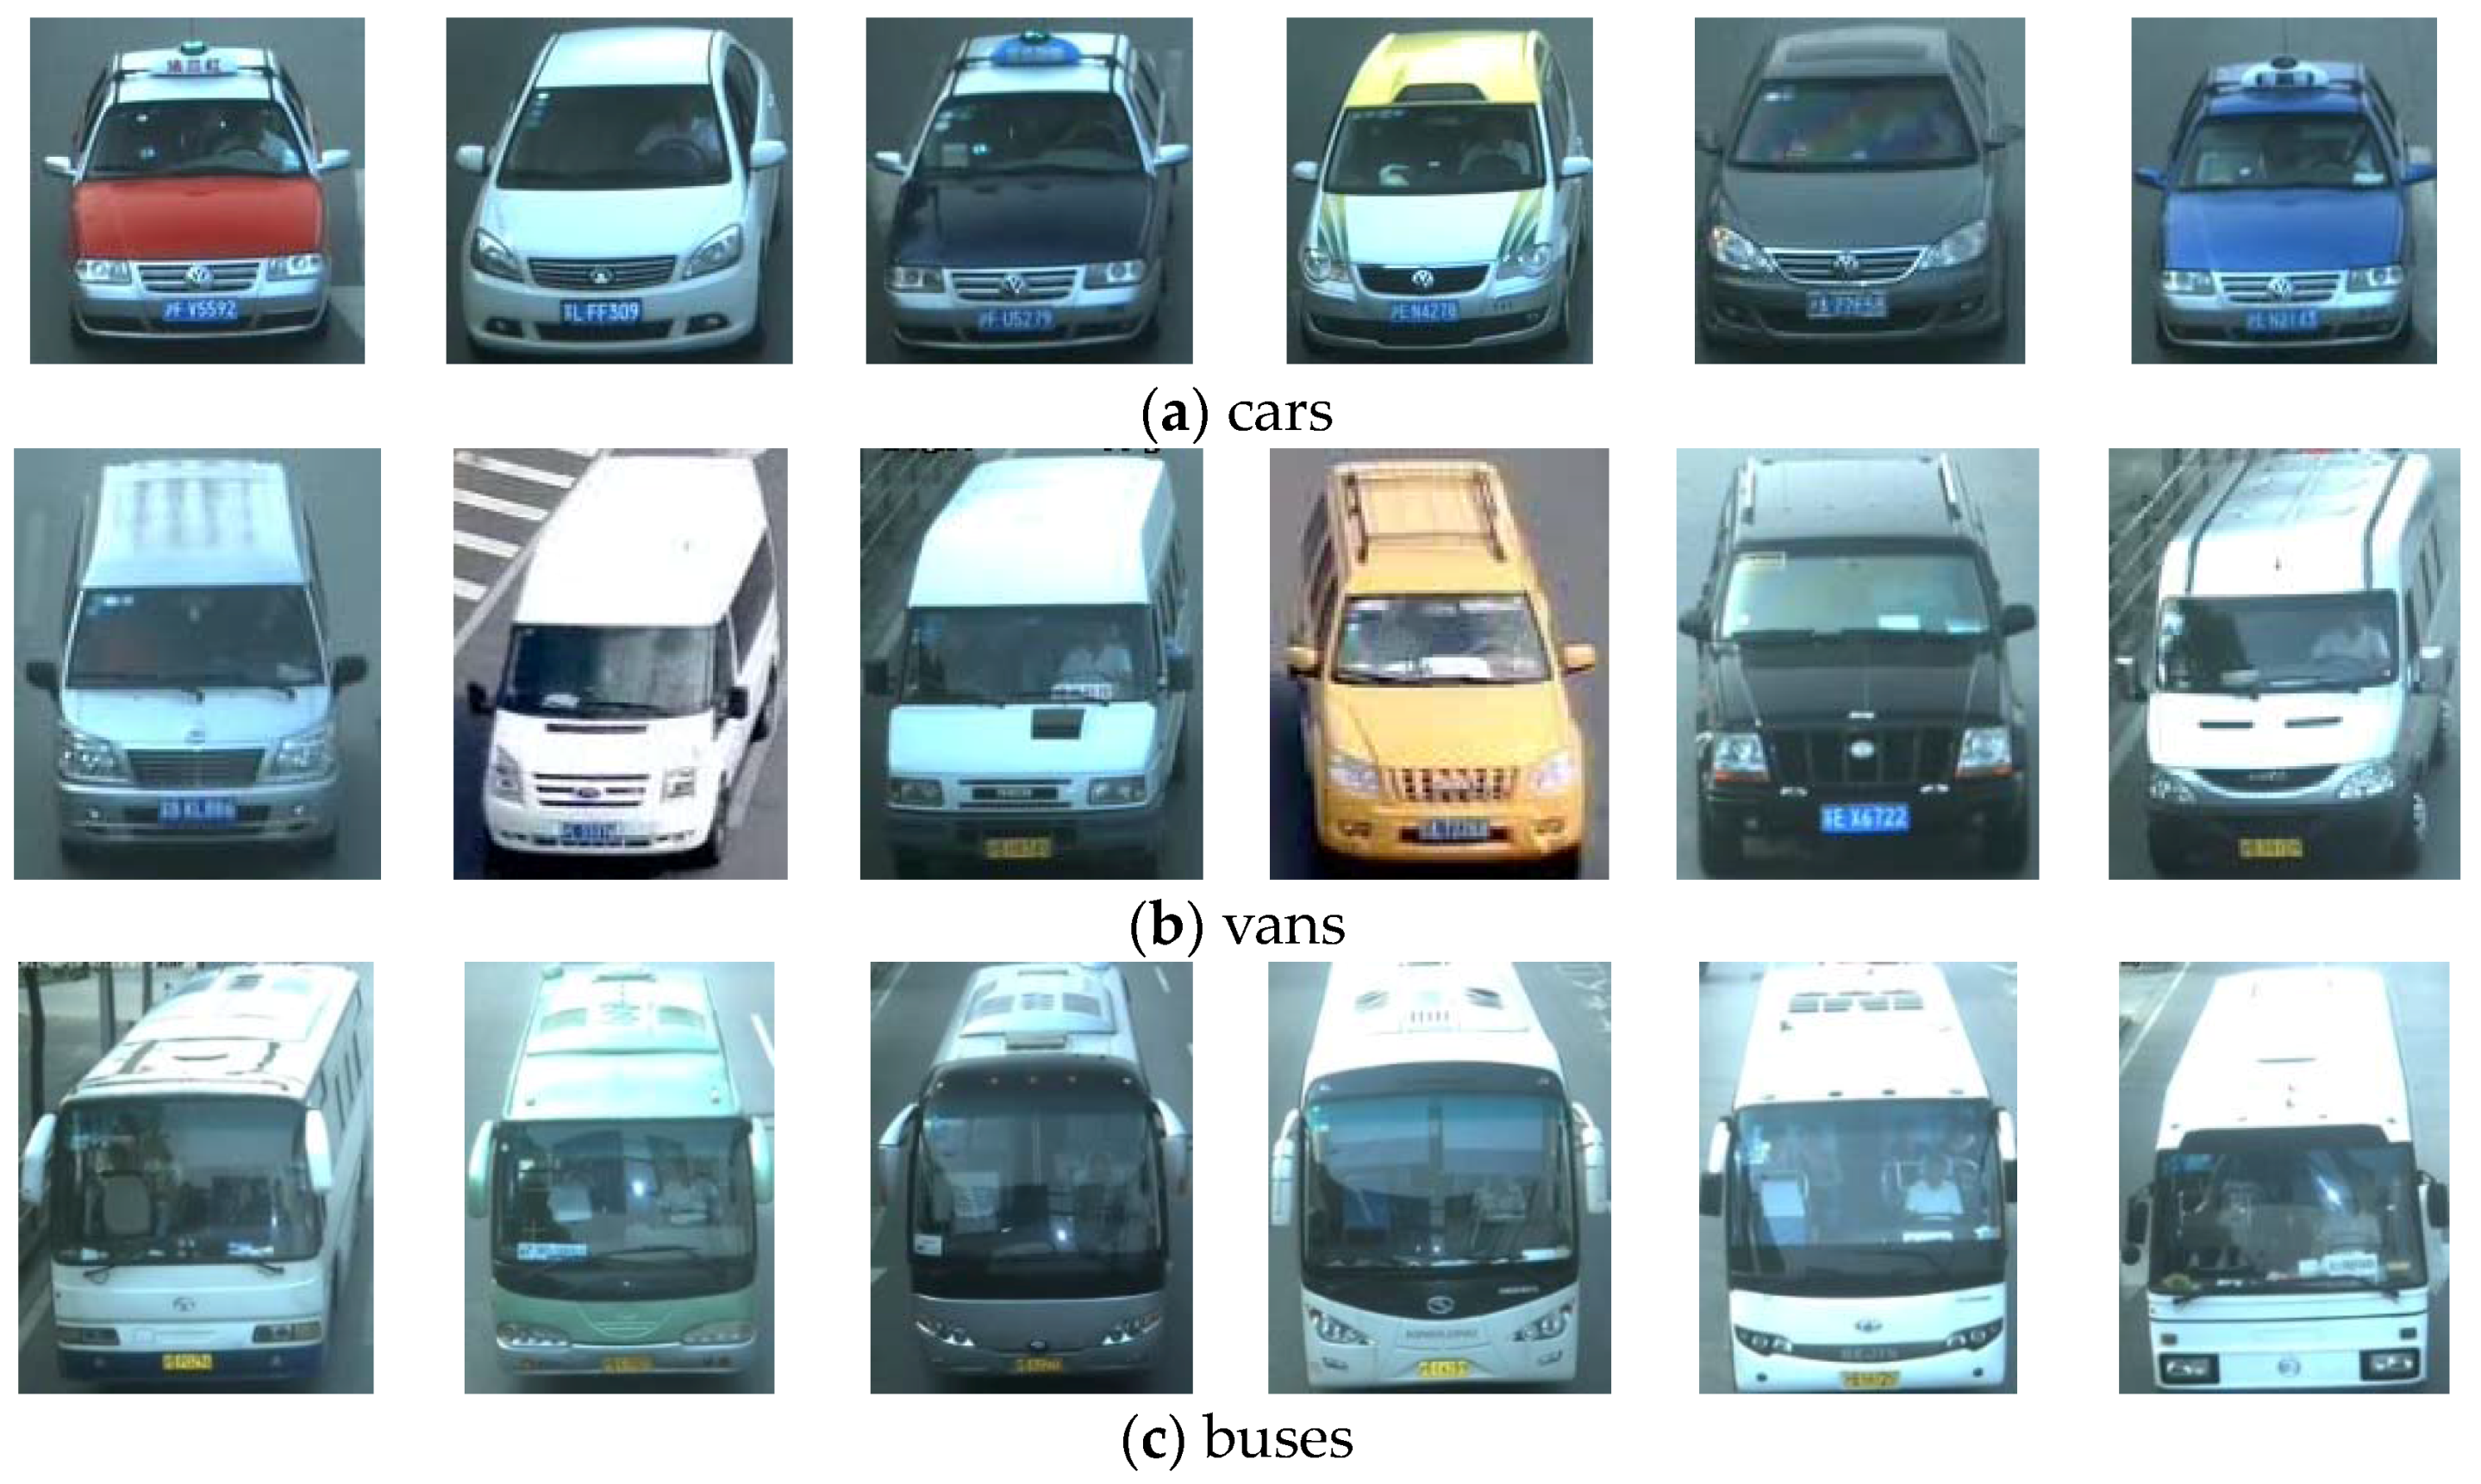
| 1 | Car | 60 | front |
| 2 | Van | 60 | front |
| 3 | Bus | 60 | front |
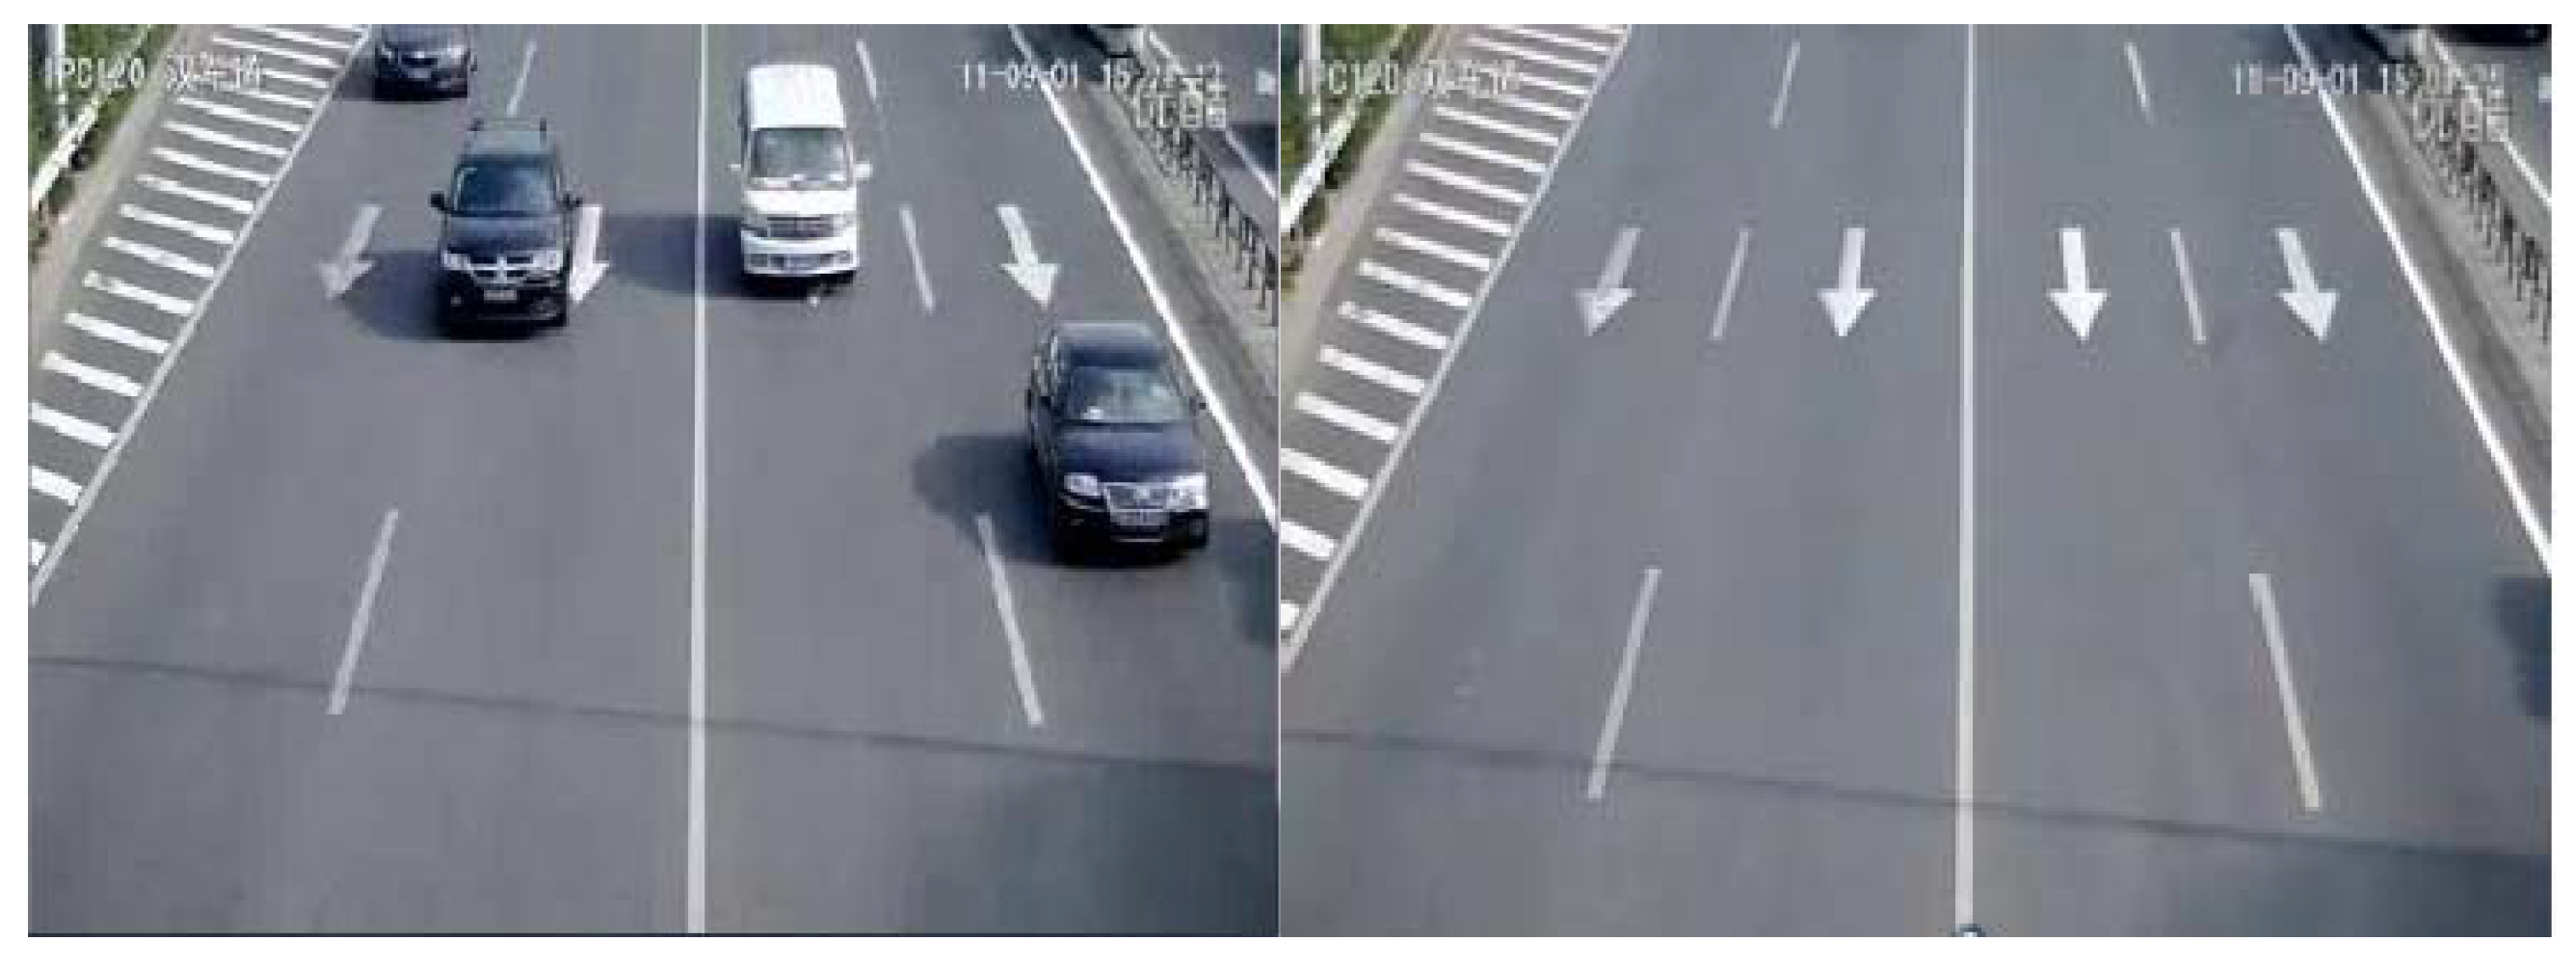
| Recognition Rate (%) | Scene 1 | Scene 2 |
|---|---|---|
| Vehicle detection algorithm based on the classical Gaussian mixture model | 98.4 | 94.3 |
| Gaussian mixture algorithm based on Bayesian Block | 98.6 | 98.1 |
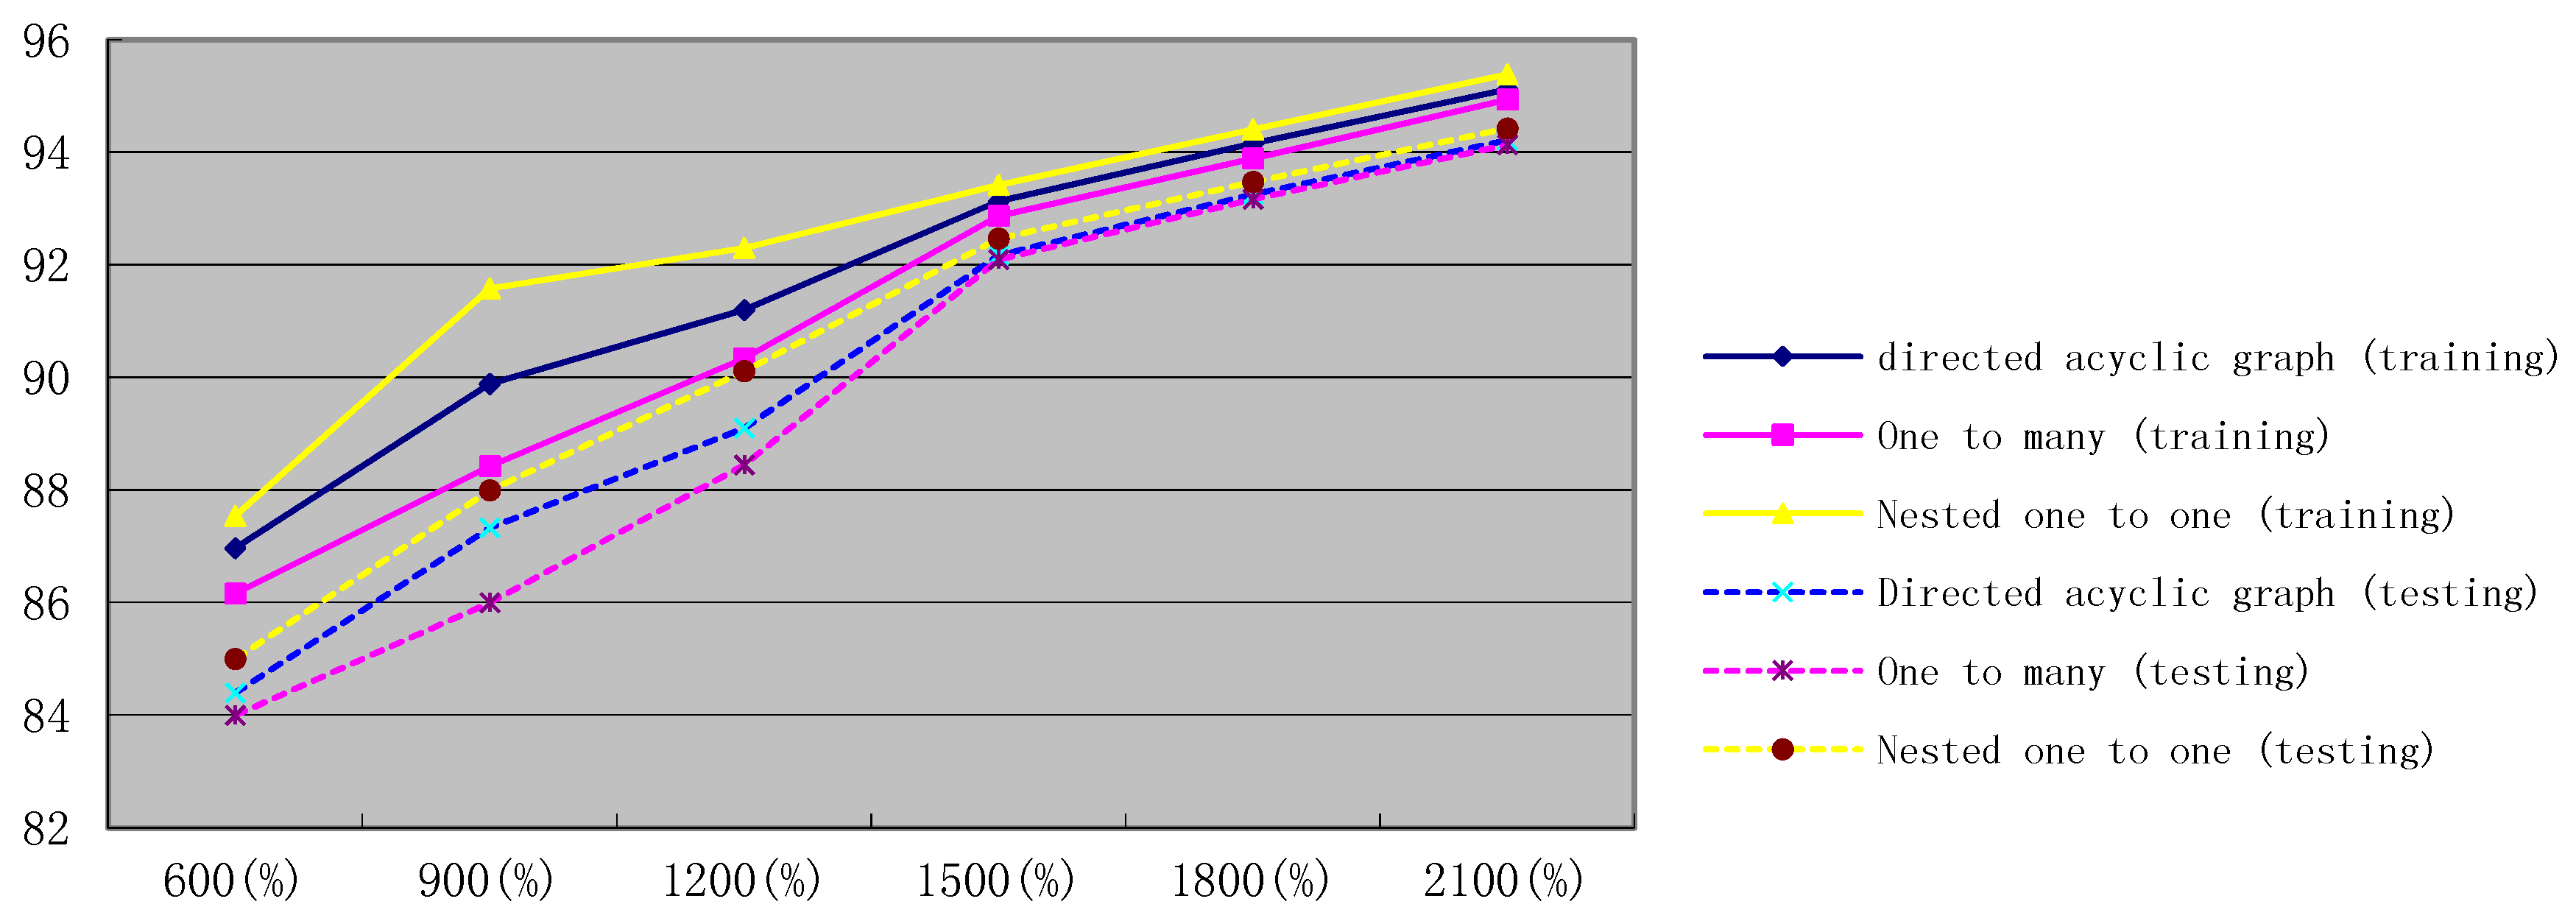
| Algorithms | 600 × 2/3 (%) | 900 × 2/3 (%) | 1200 × 2/3 (%) | 1500 × 2/3 (%) | 1800 × 2/3 (%) | 2100 × 2/3 (%) |
|---|---|---|---|---|---|---|
| One to many | 86.16 | 88.42 | 90.34 | 92.87 | 93.89 | 94.94 |
| directed acyclic graph | 86.97 | 89.89 | 91.2 | 93.13 | 94.16 | 95.12 |
| nested one to one | 87.54 | 91.58 | 92.3 | 93.42 | 94.41 | 95.39 |
| Algorithms | 600 × 1/3 (%) | 900 × 1/3 (%) | 1200 × 1/3 (%) | 1500 × 1/3 (%) | 1800 × 1/3 (%) | 2100 × 1/3 (%) |
|---|---|---|---|---|---|---|
| One to many | 84 | 86 | 88.45 | 92.1 | 93.17 | 94.14 |
| directed acyclic graph | 84.4 | 87.33 | 89.1 | 92.18 | 93.26 | 94.22 |
| nested one to one | 85 | 88 | 90.12 | 92.47 | 93.48 | 94.43 |
© 2017 by the authors. Licensee MDPI, Basel, Switzerland. This article is an open access article distributed under the terms and conditions of the Creative Commons Attribution (CC BY) license (http://creativecommons.org/licenses/by/4.0/).
Share and Cite
Qin, G.; Huang, X.; Chen, Y. Nested One-to-One Symmetric Classification Method on a Fuzzy SVM for Moving Vehicles. Symmetry 2017, 9, 48. https://doi.org/10.3390/sym9040048
Qin G, Huang X, Chen Y. Nested One-to-One Symmetric Classification Method on a Fuzzy SVM for Moving Vehicles. Symmetry. 2017; 9(4):48. https://doi.org/10.3390/sym9040048
Chicago/Turabian StyleQin, Guofeng, Xiaodi Huang, and Yiling Chen. 2017. "Nested One-to-One Symmetric Classification Method on a Fuzzy SVM for Moving Vehicles" Symmetry 9, no. 4: 48. https://doi.org/10.3390/sym9040048