
A Fault Feature Extraction Method for Motor Bearing and Transmission Analysis


Abstract
:1. Introduction
2. Basic Method
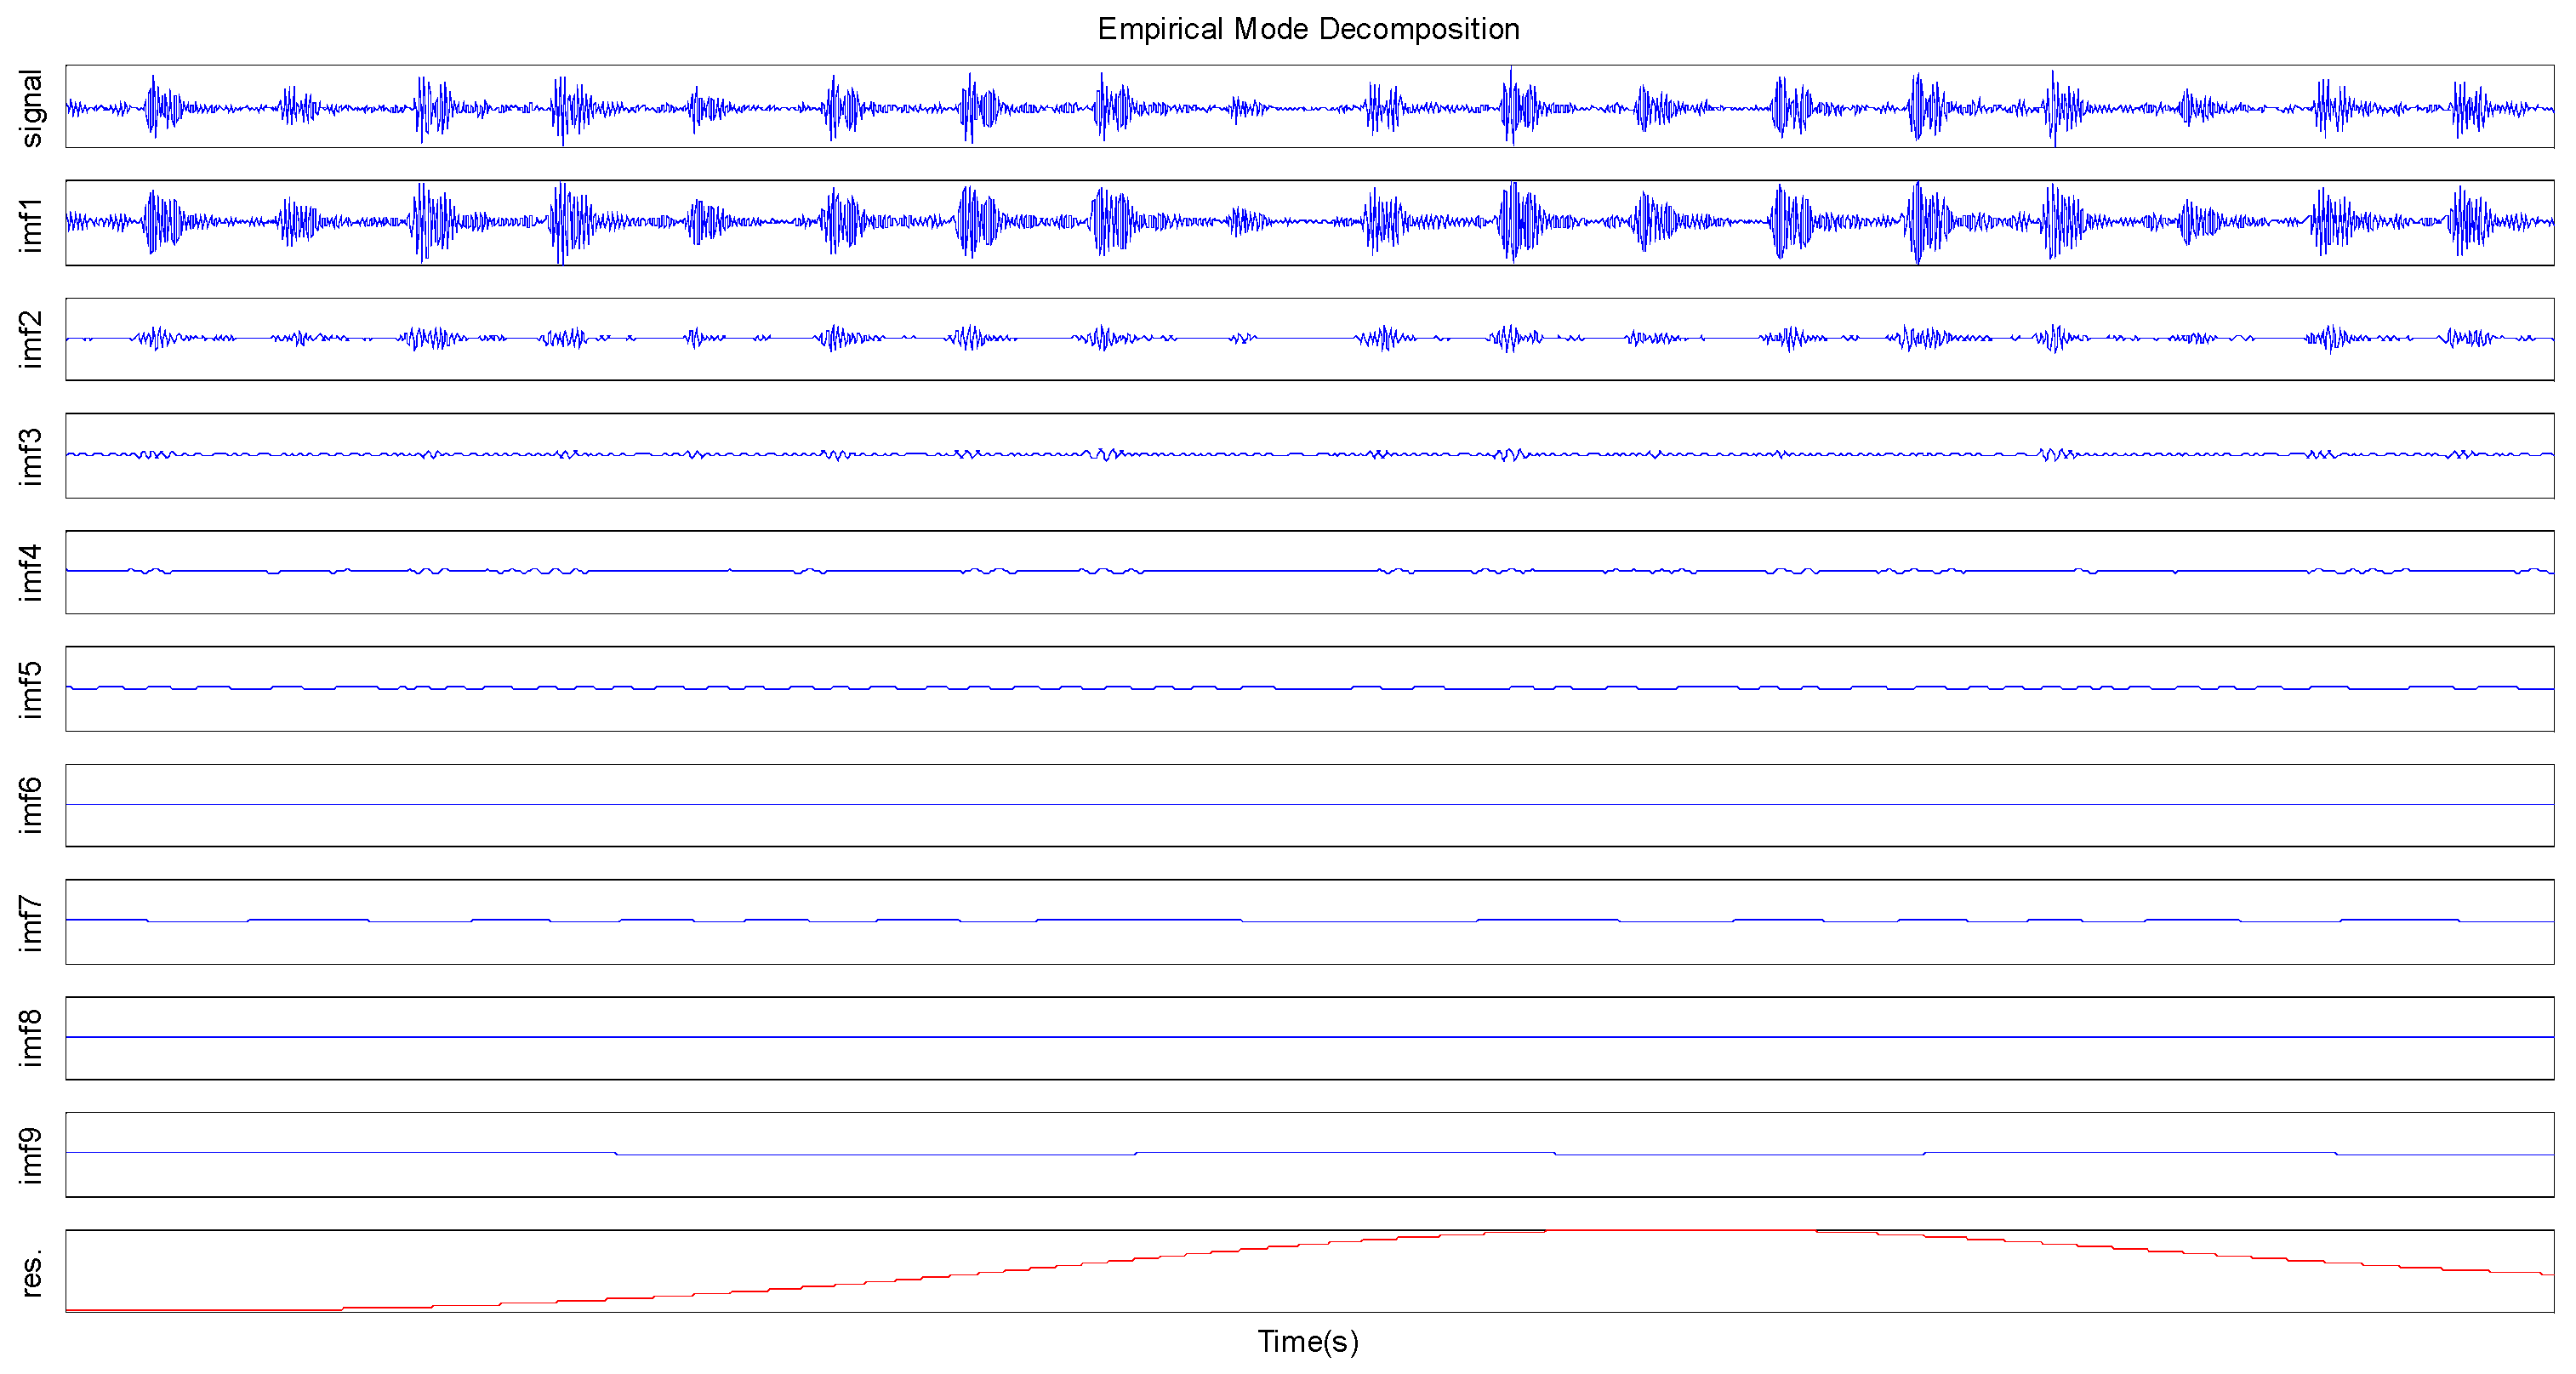
2.1. EMD
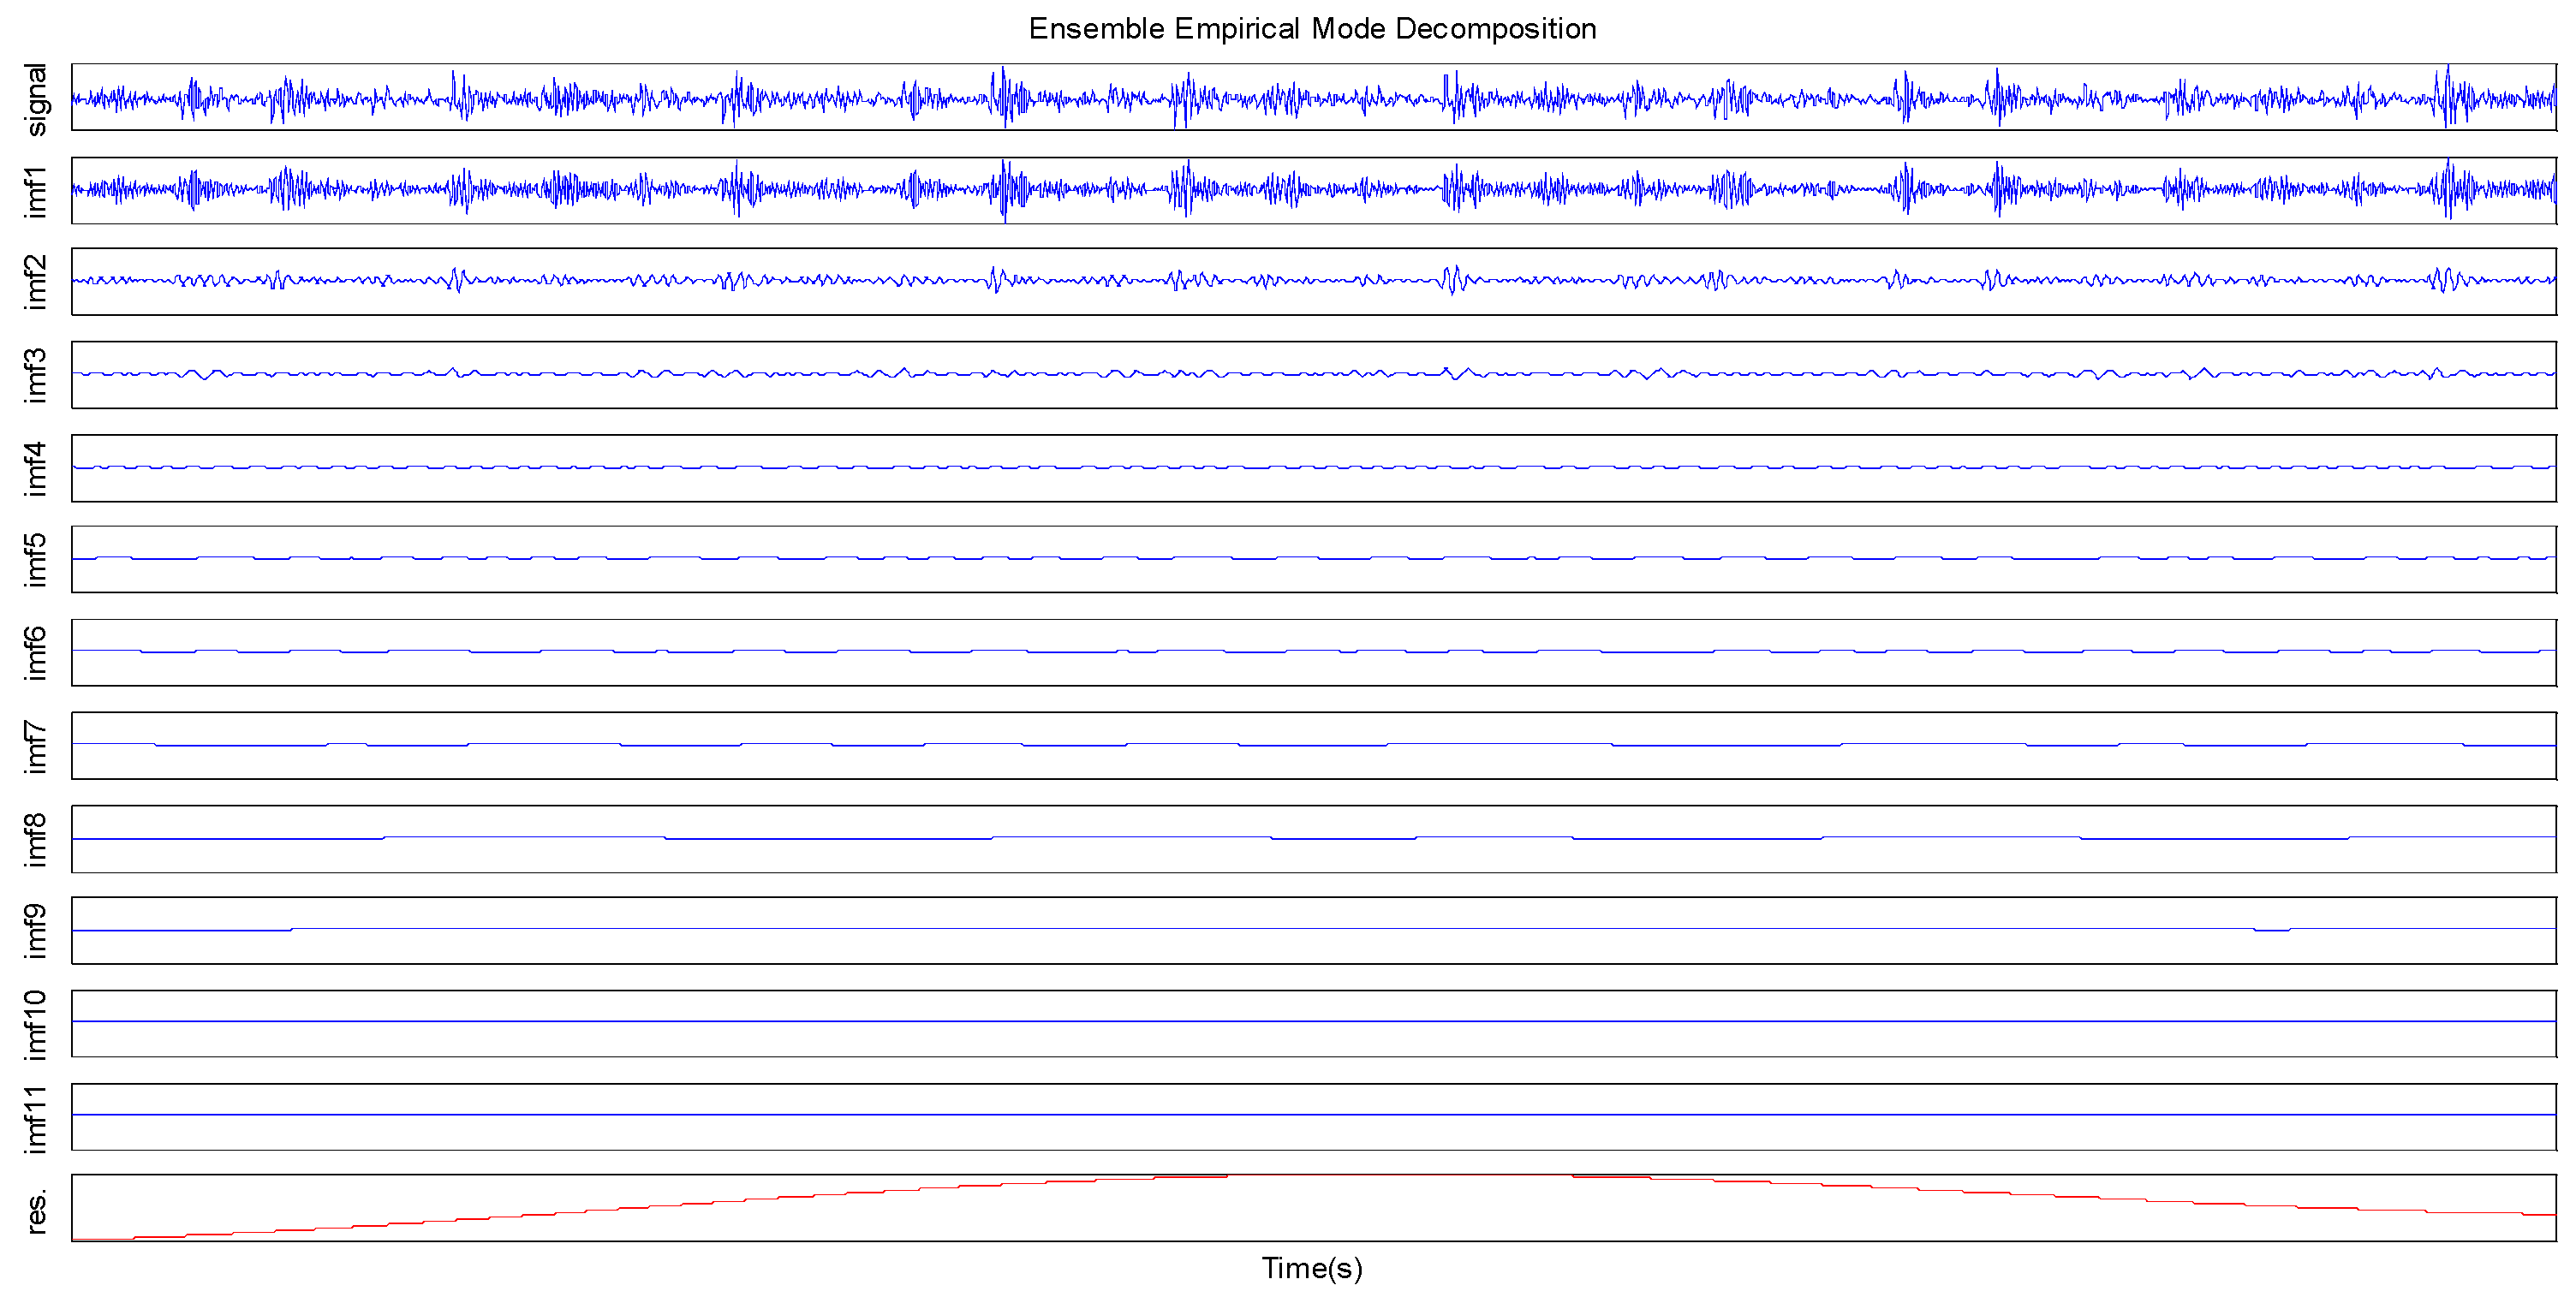
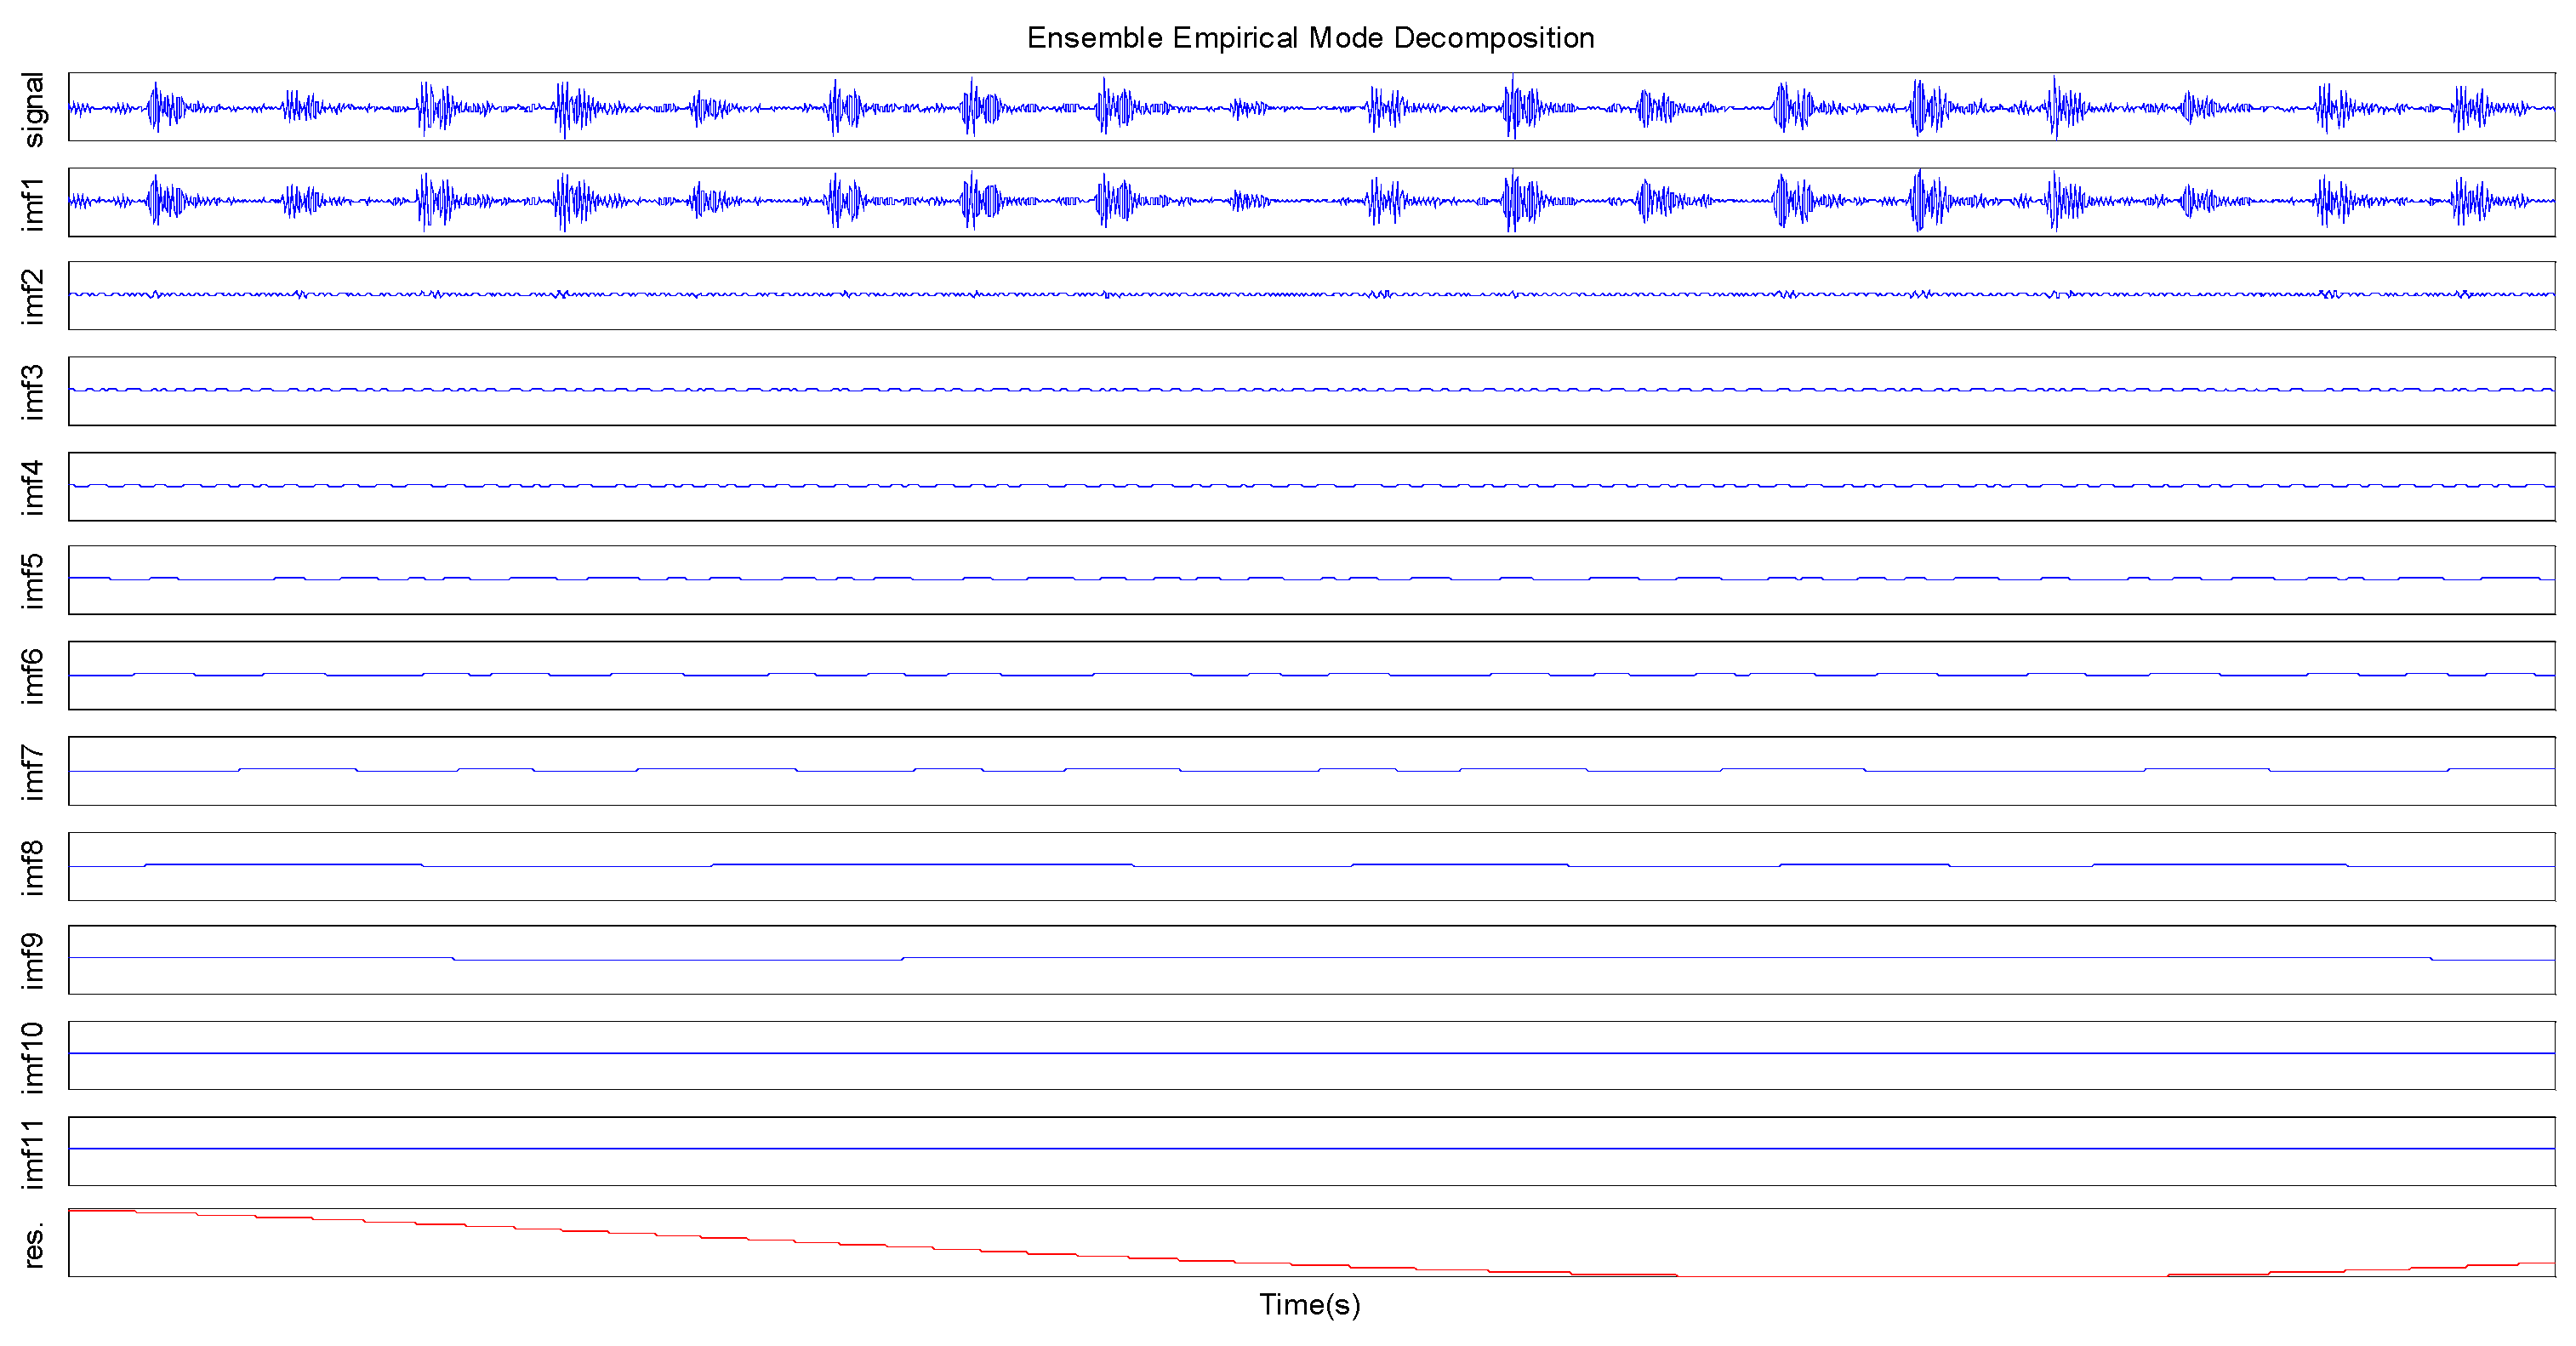
2.2. EEMD
- Step 1:
- Gaussian white noise sequences are added to the target data.
- Step 2:
- The new target data is decomposed into a series of IMFs according to the EMD algorithm.
- Step 3:
- Different Gaussian white noise sequences with the same amplitude are added to the data for each time; repeat Step 1 and Step 2.
- Step 4:
- The mean value of the various IMF is taken as the final result, that is:
2.3. Hilbert Transform
3. Experimental Environment and Theoretical Calculation
3.1. Experimental Environment
3.2. Theoretical Calculation of the Fault Characteristic Frequency of the Roller Bearing
4. Fault Feature Extraction and Analysis
4.1. Fault Vibration Signal Decomposition
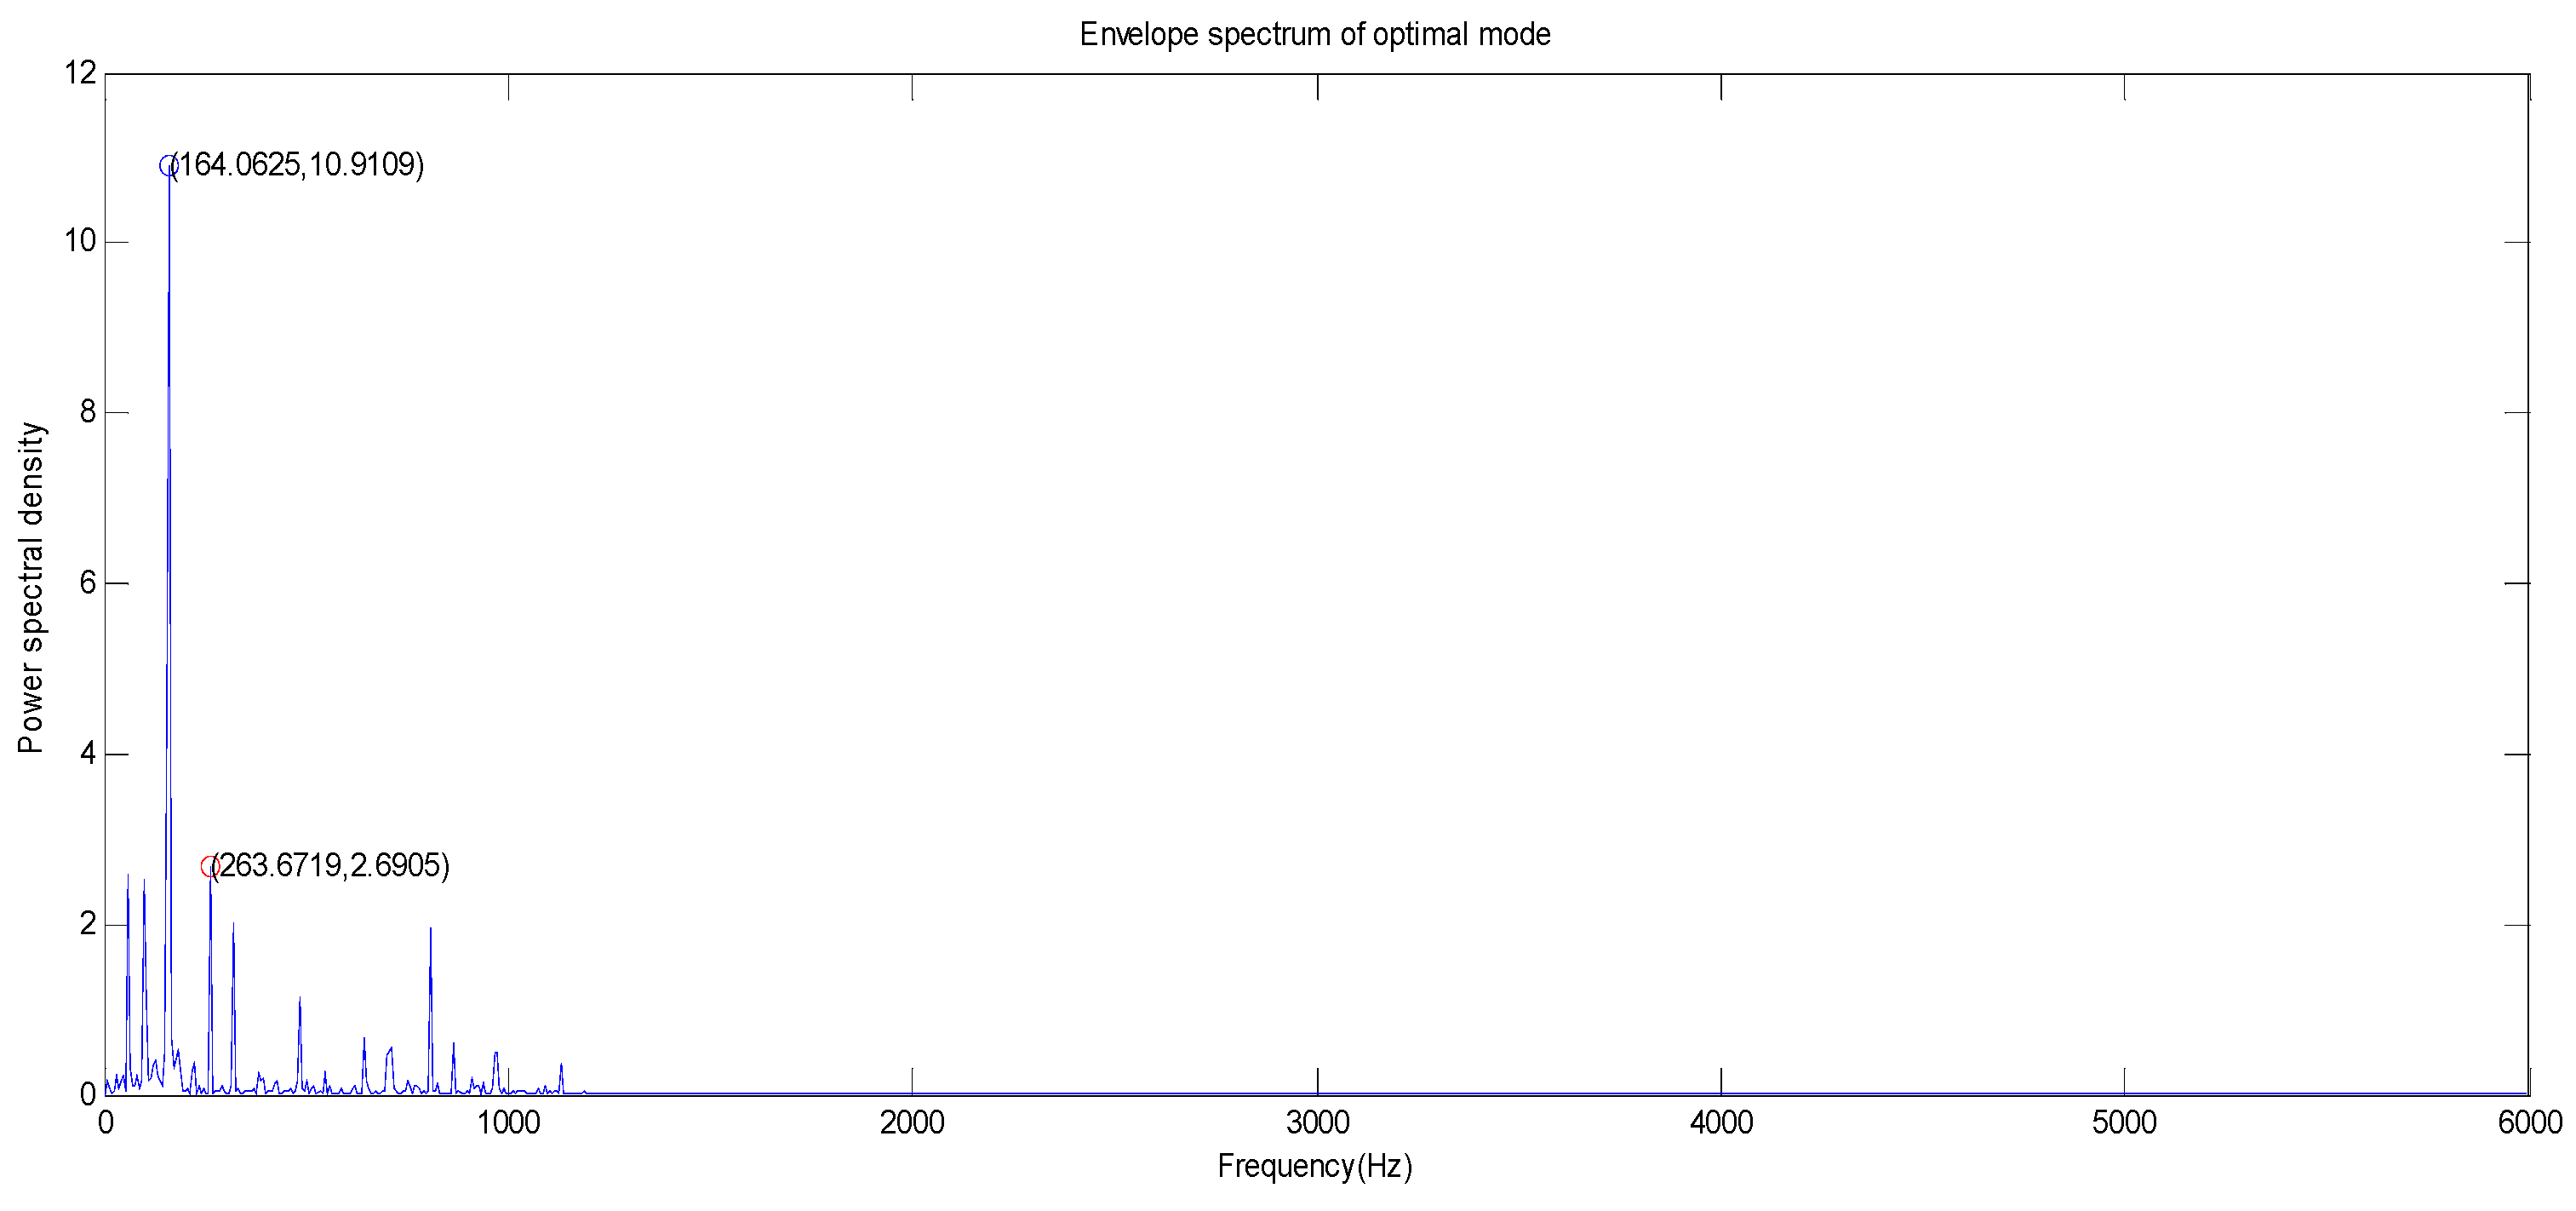
4.2. Selection of the Optimal Mode
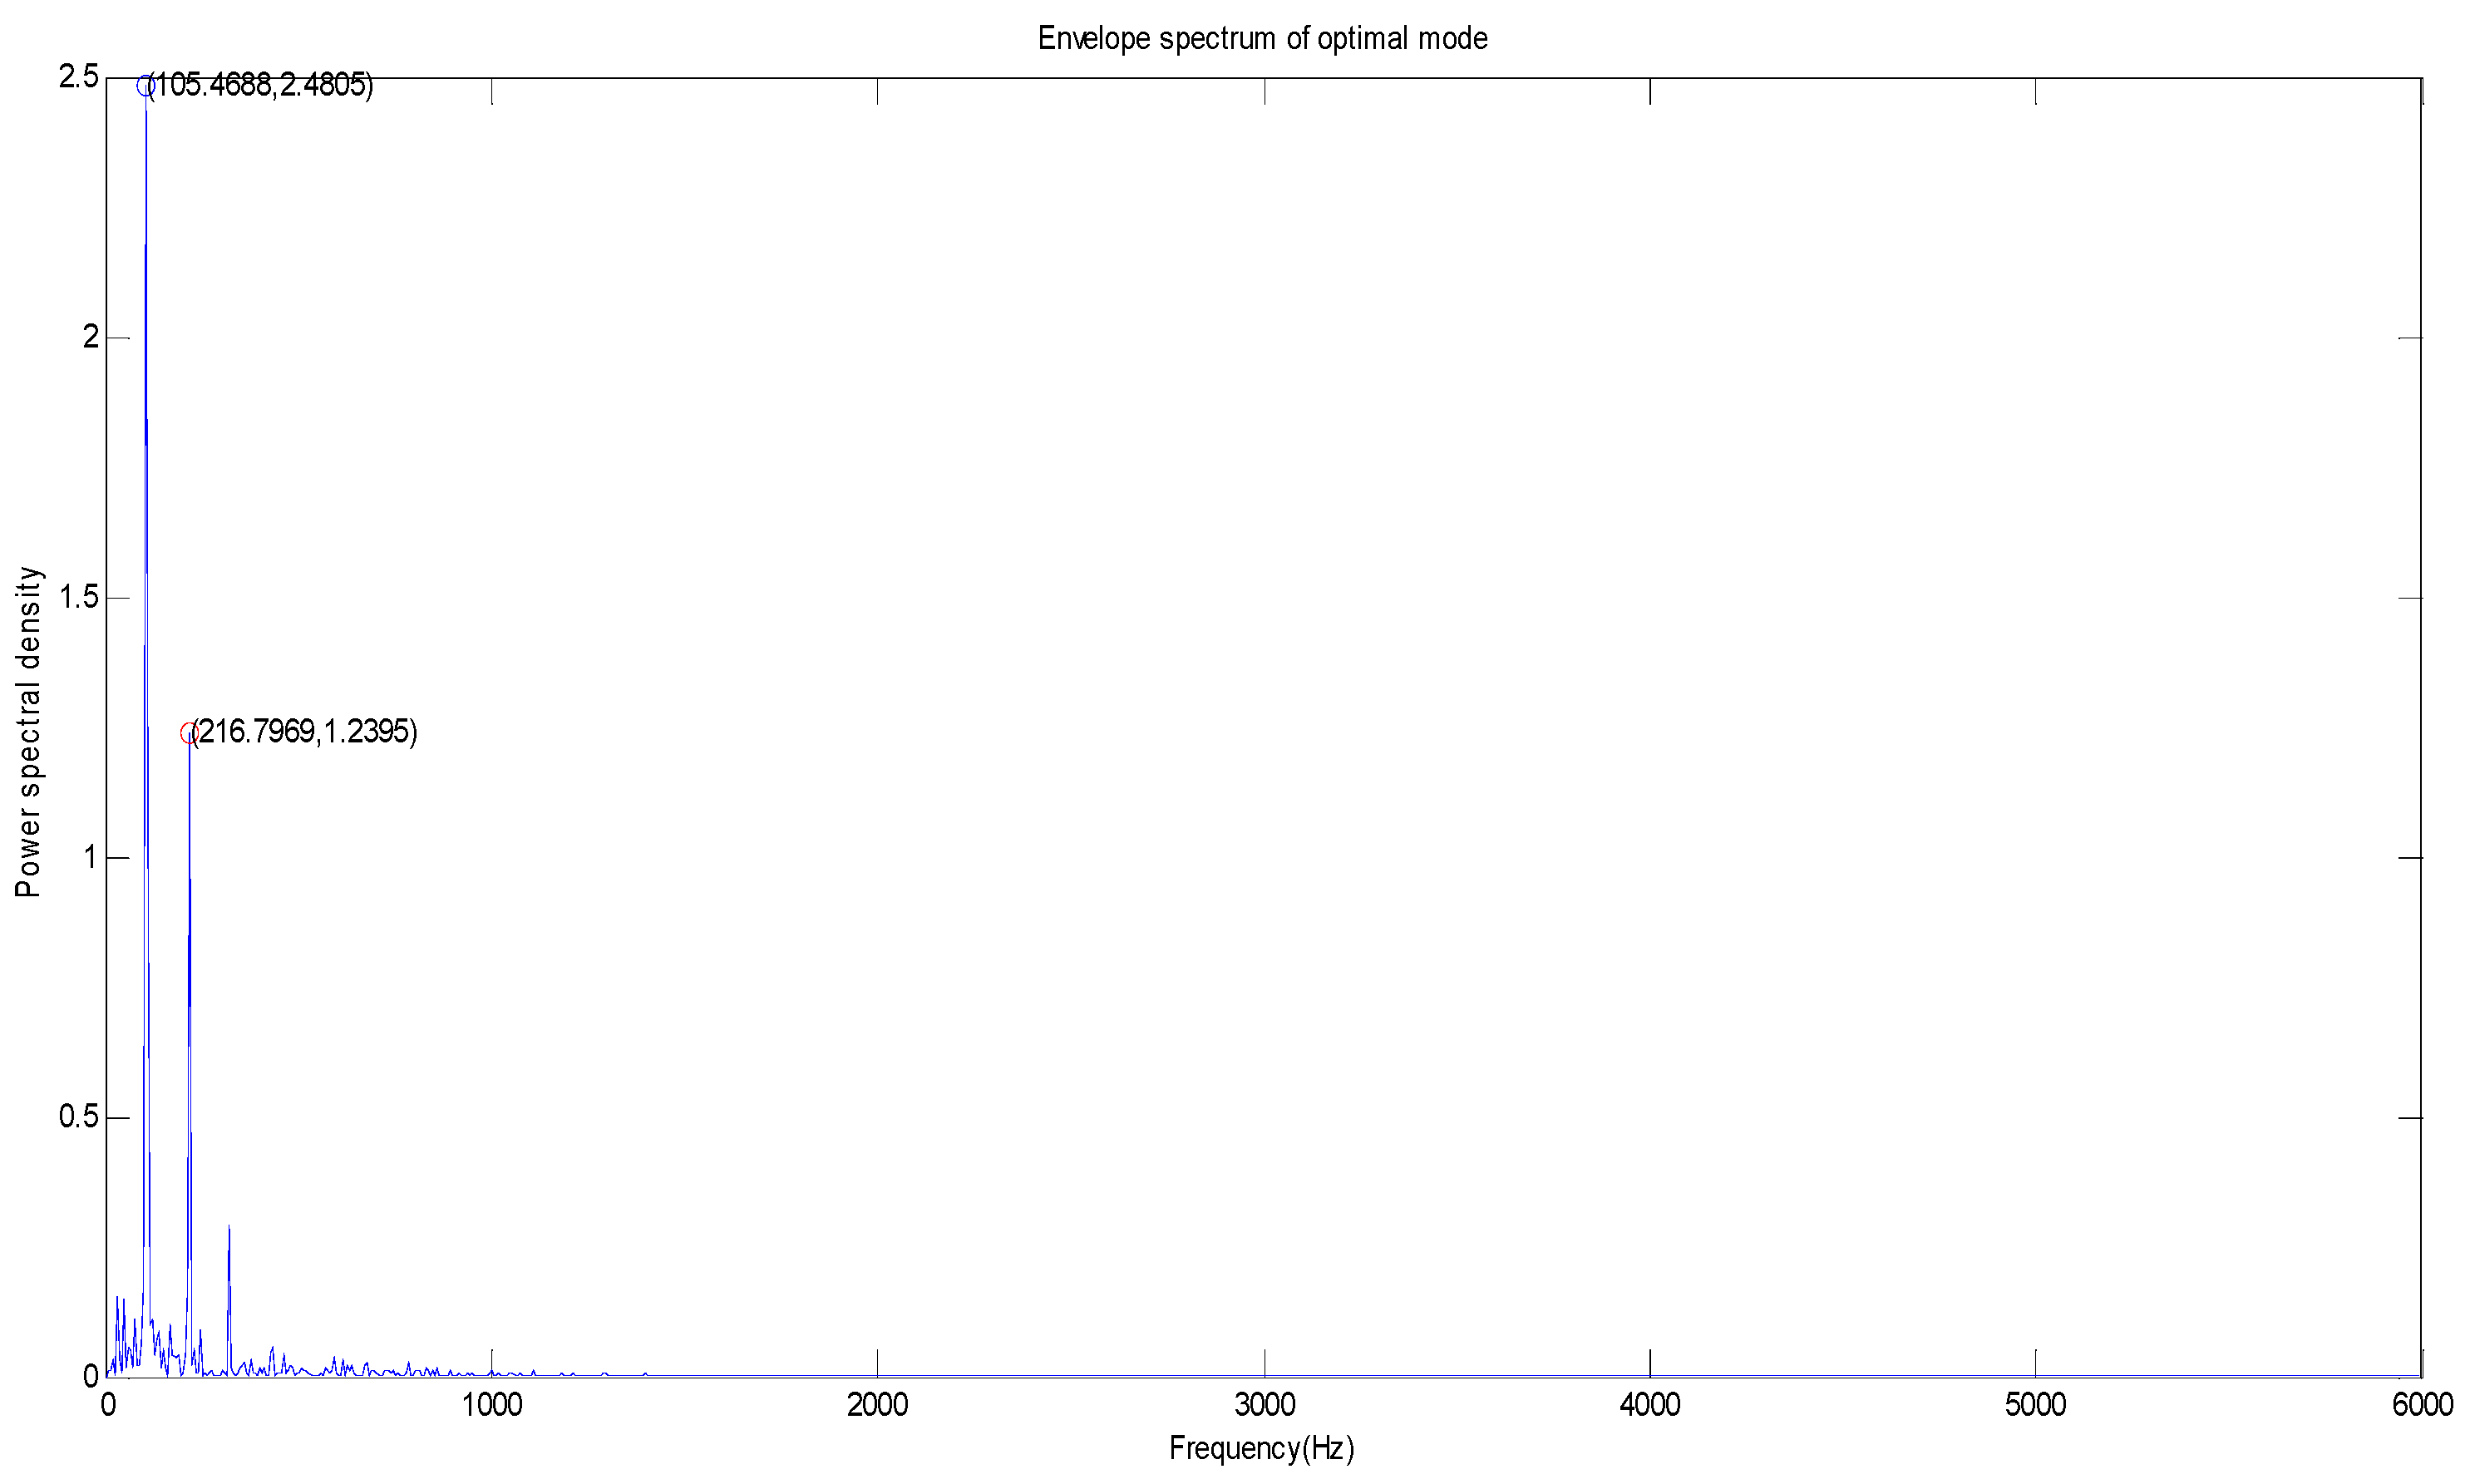
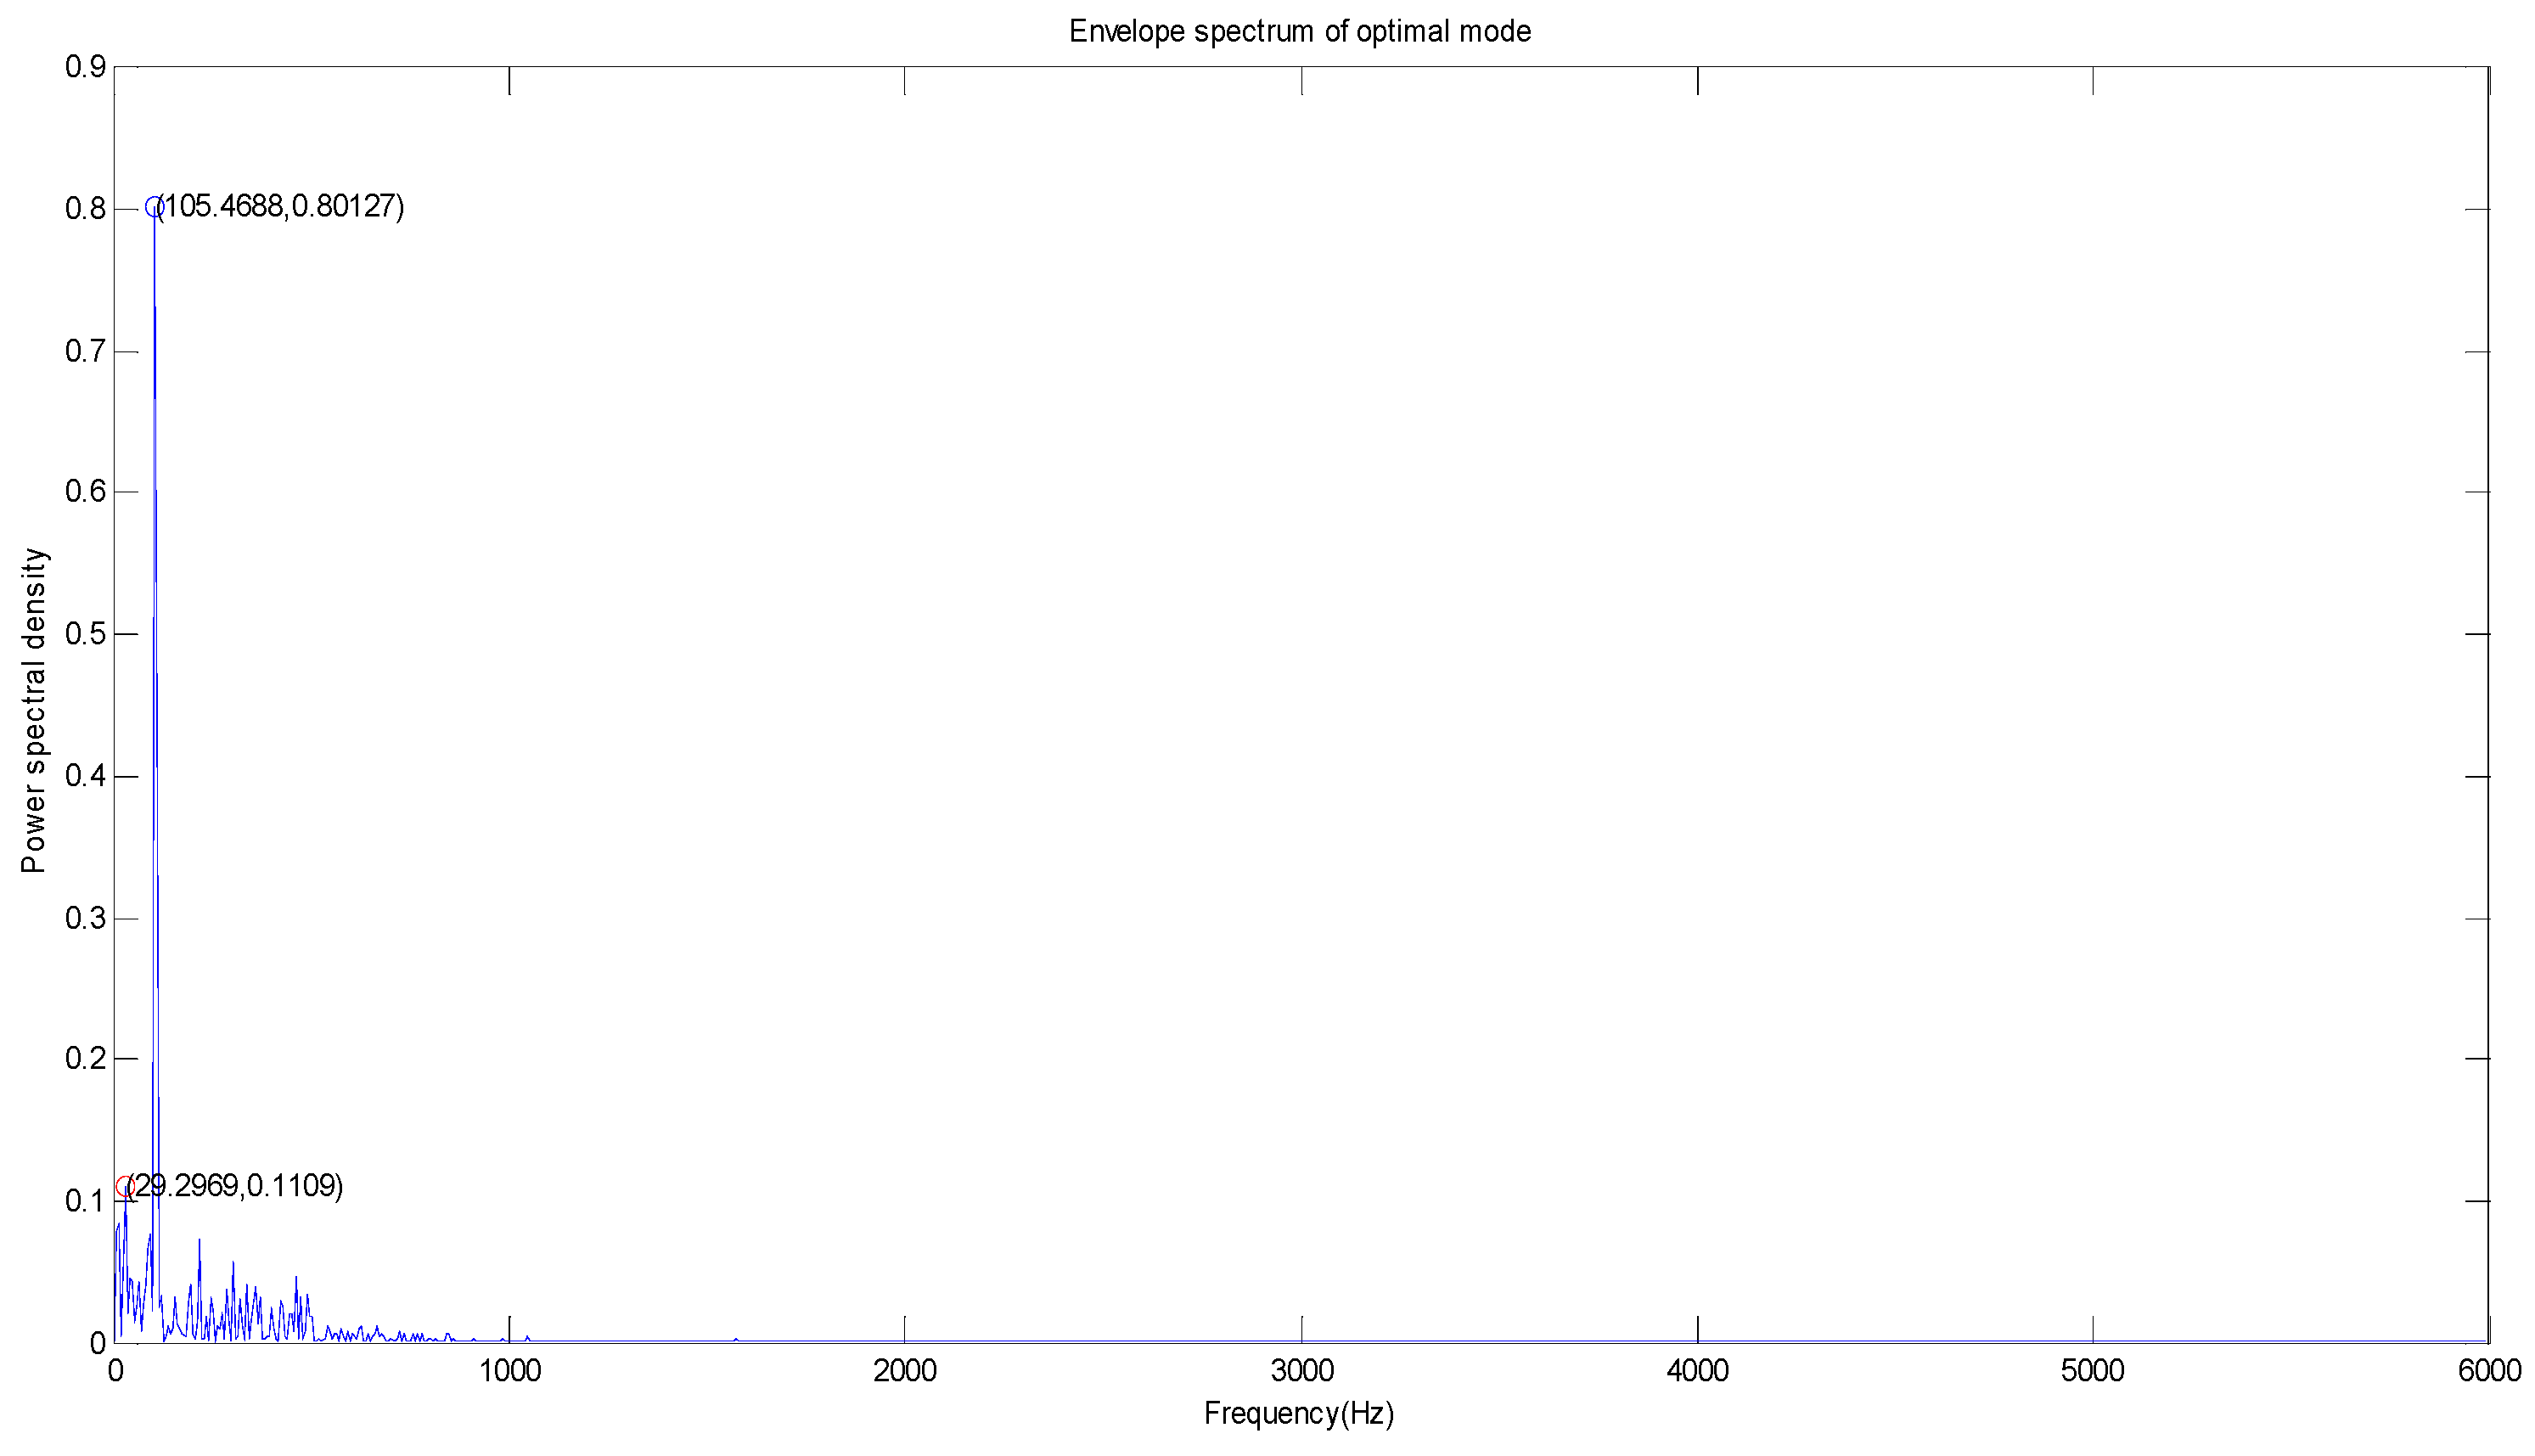
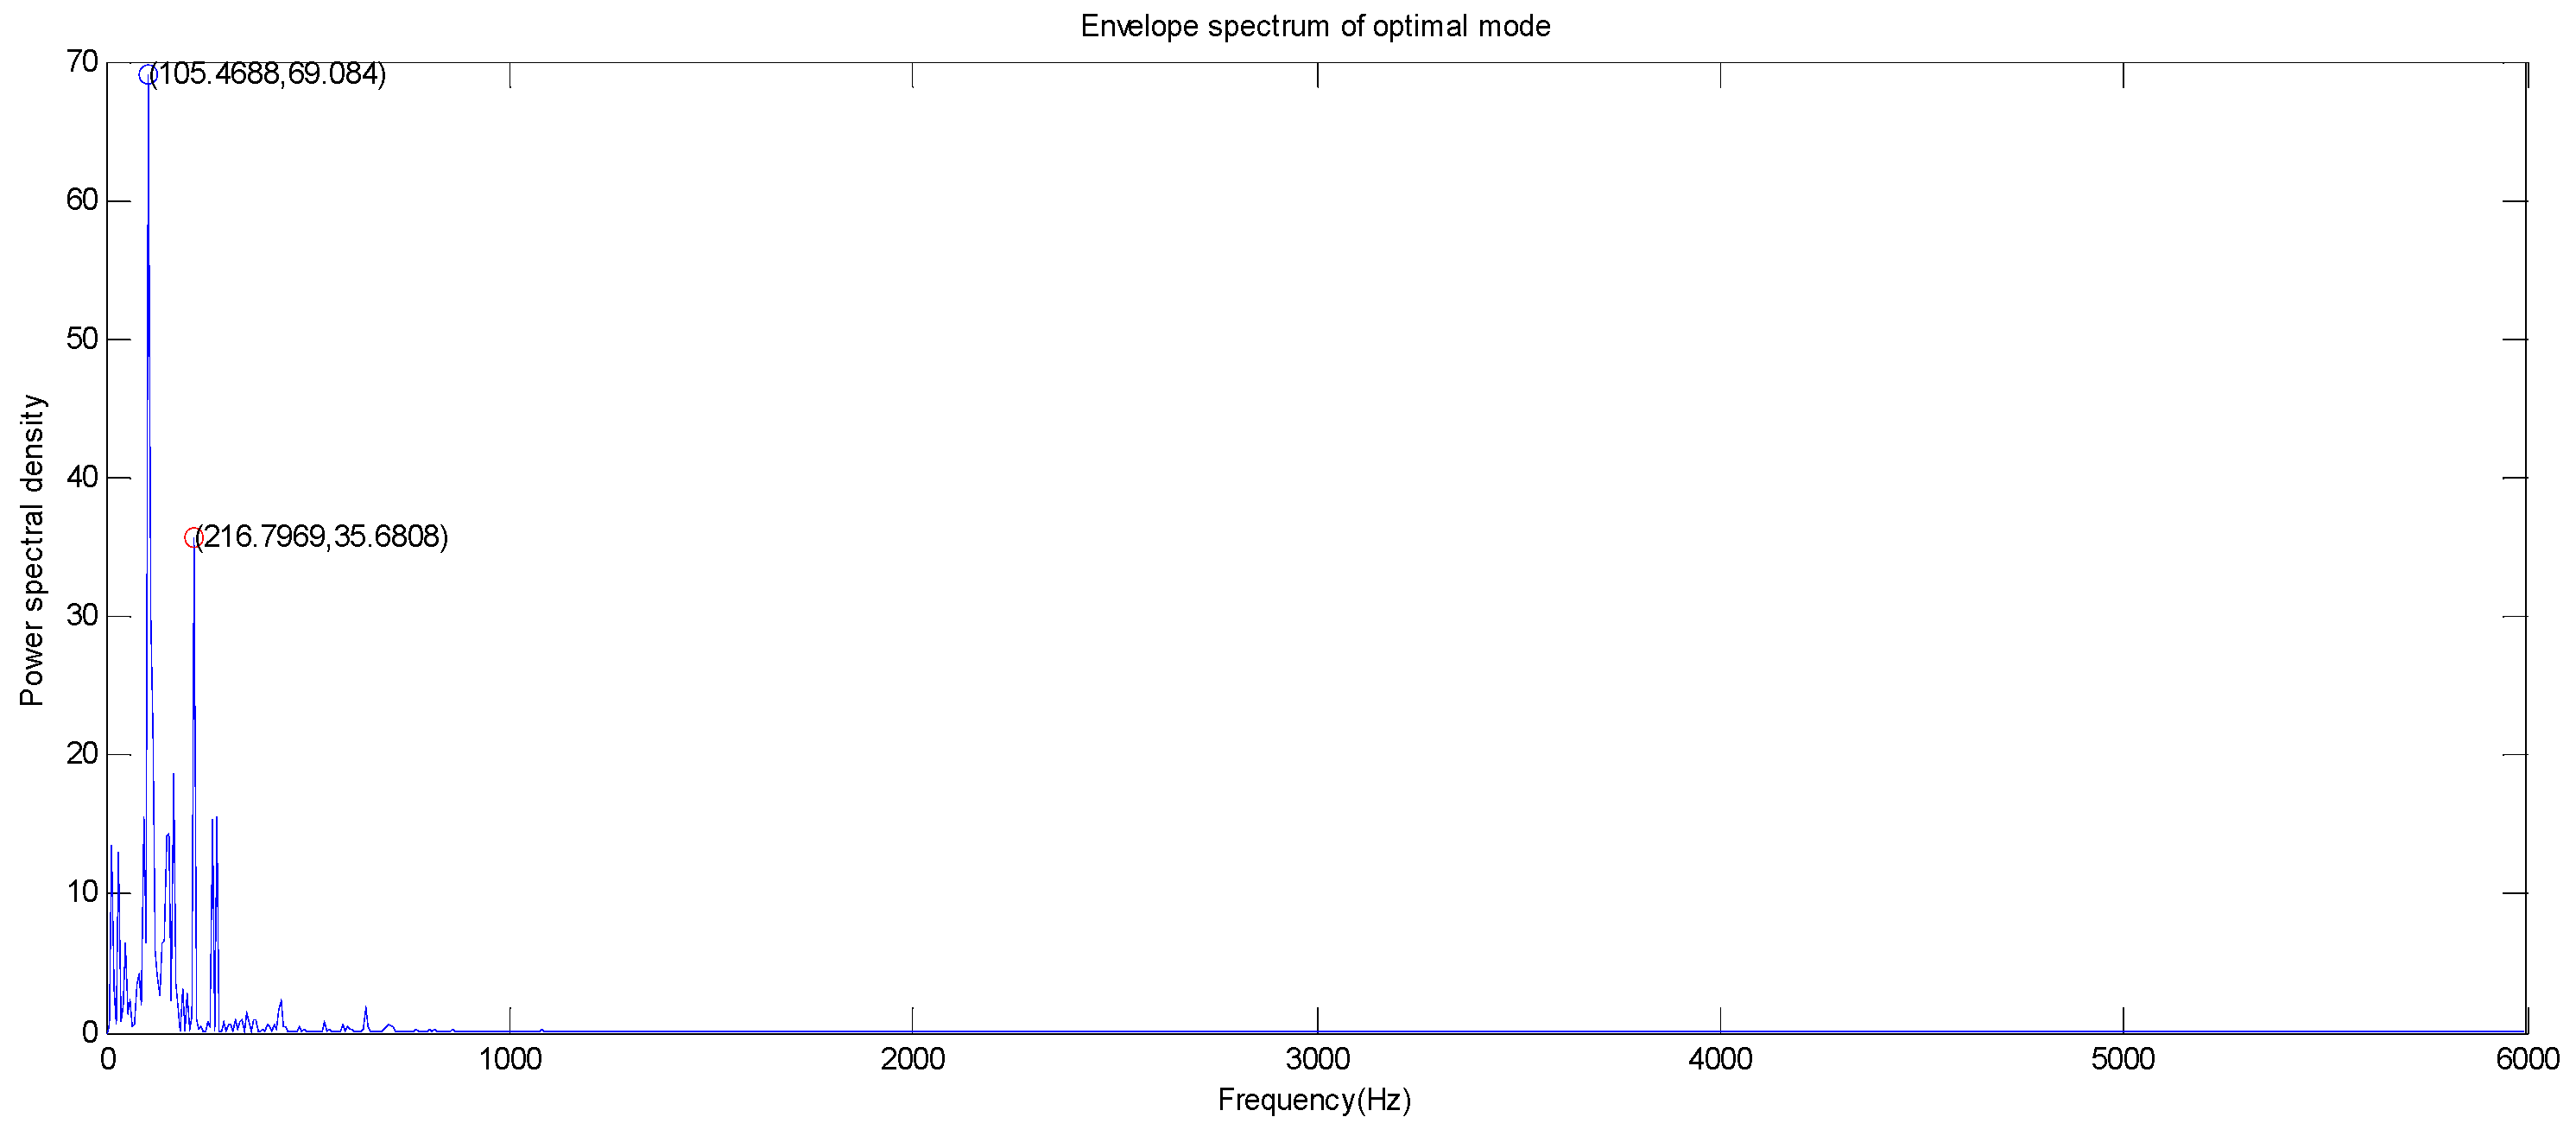
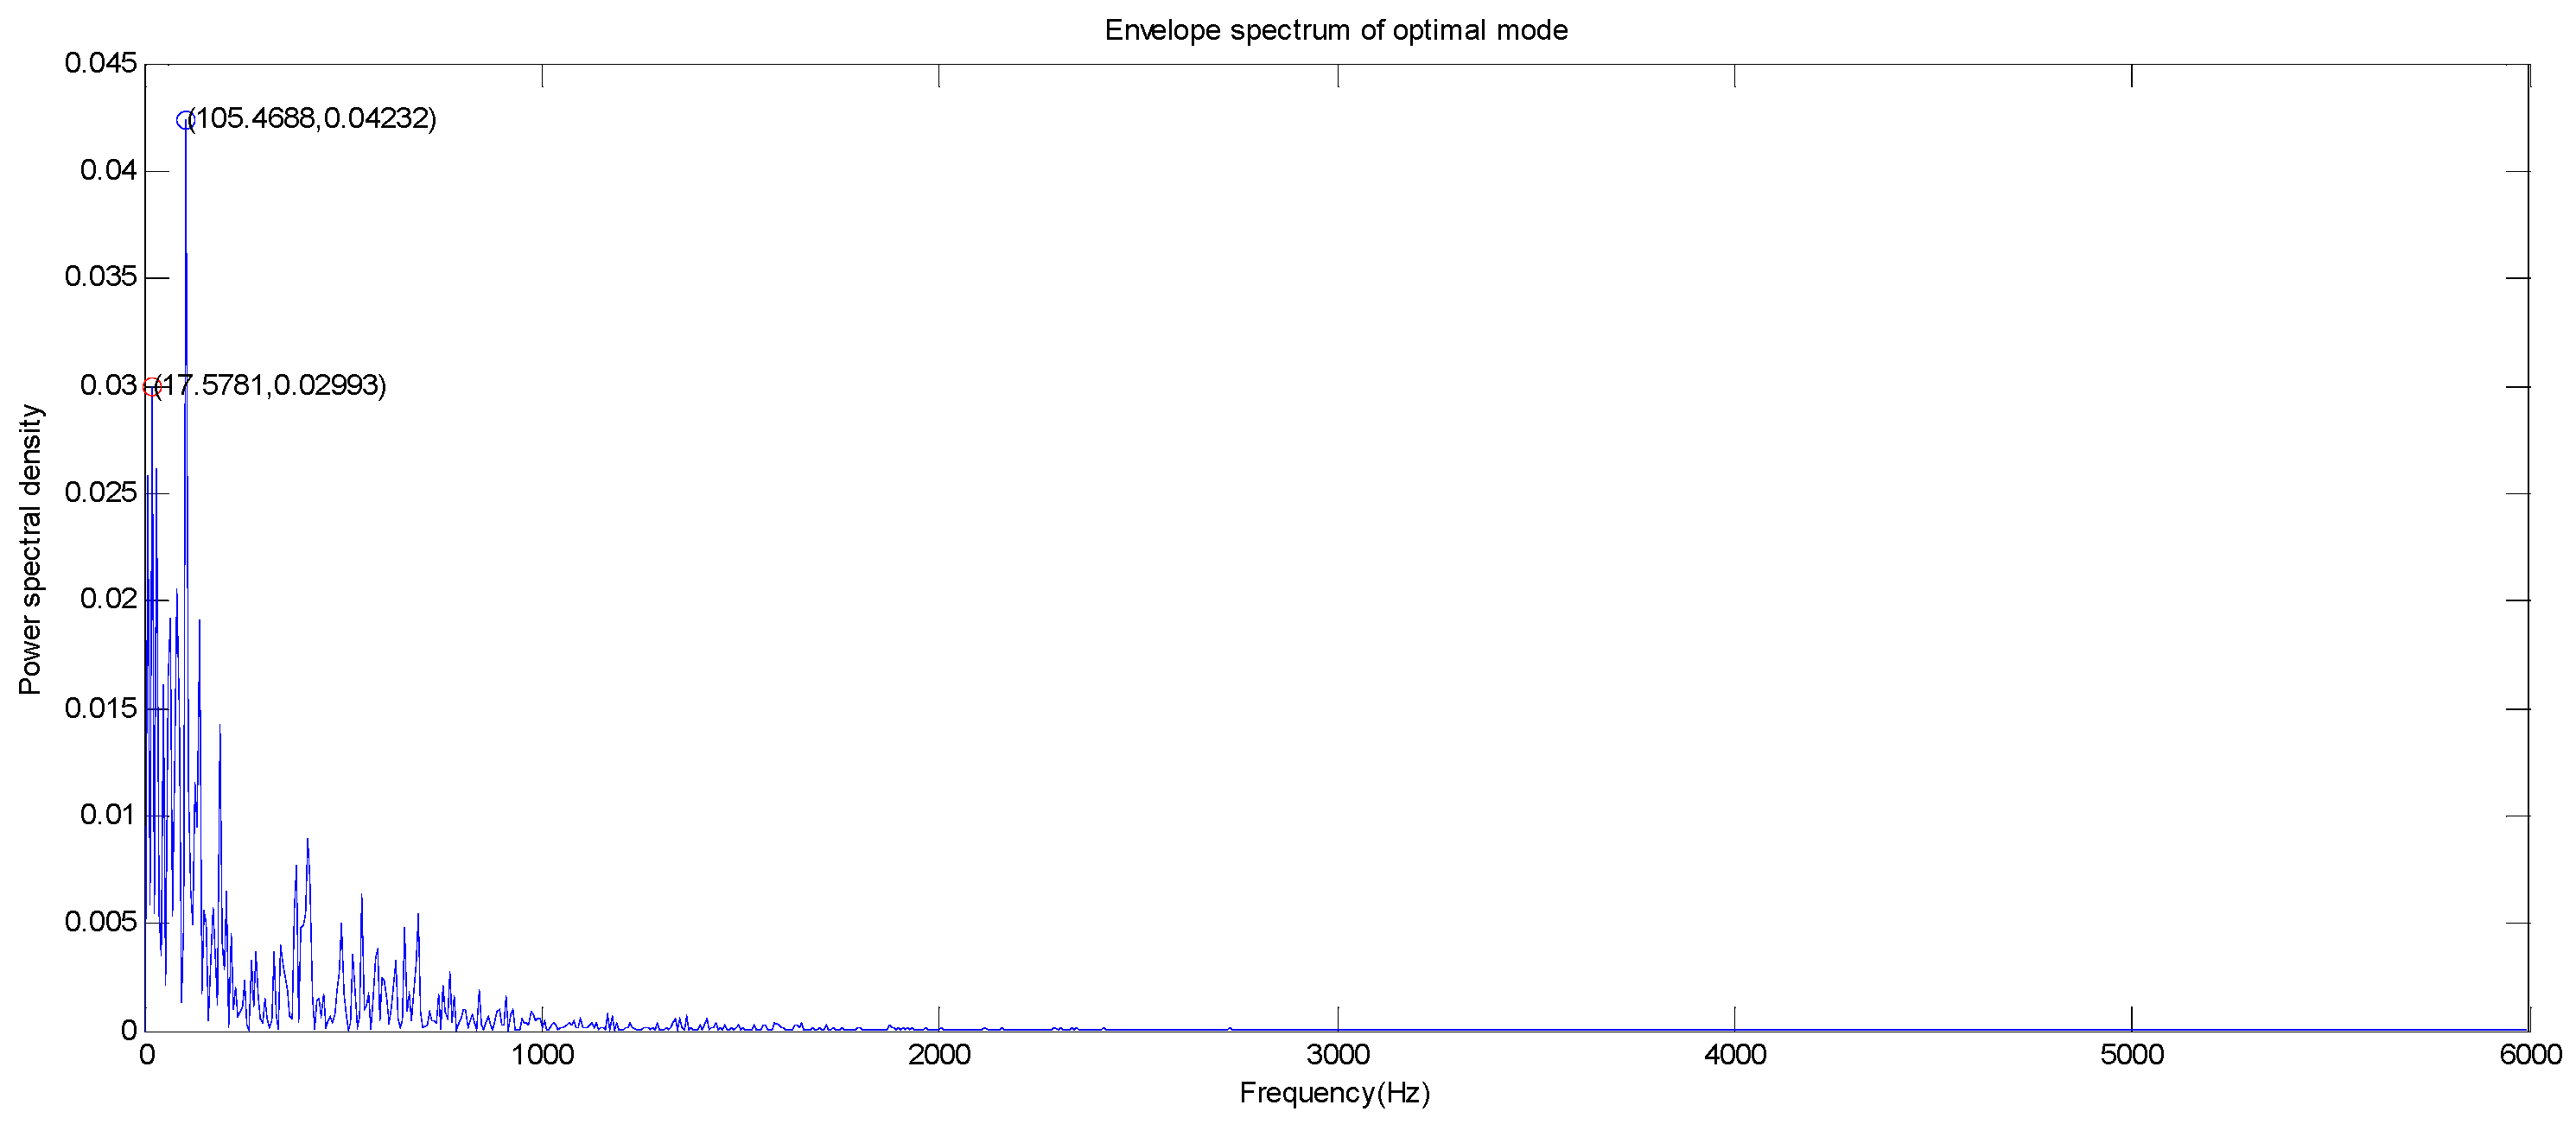
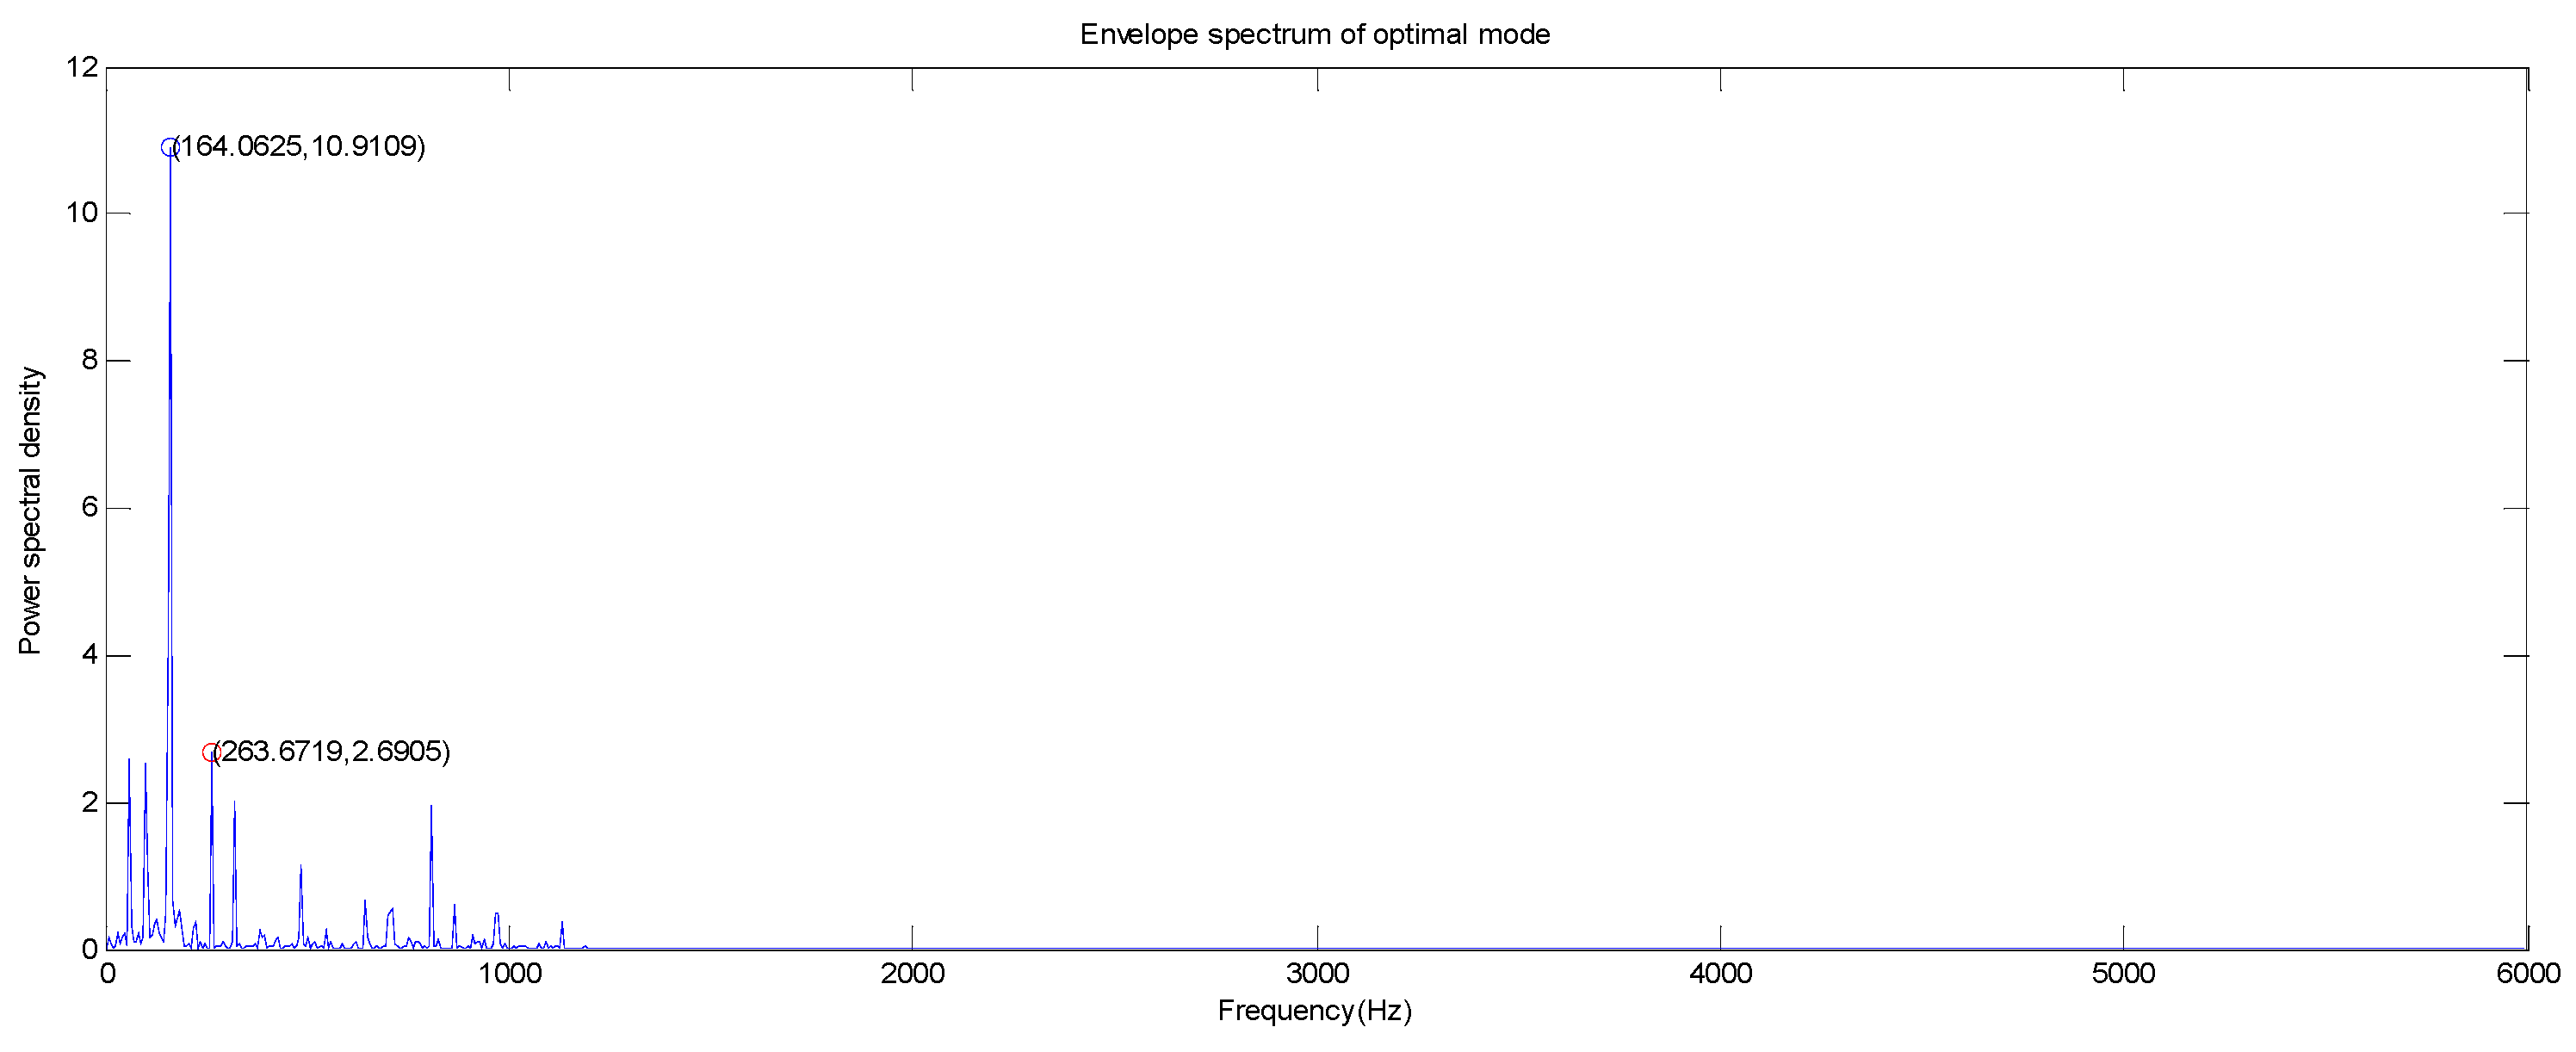
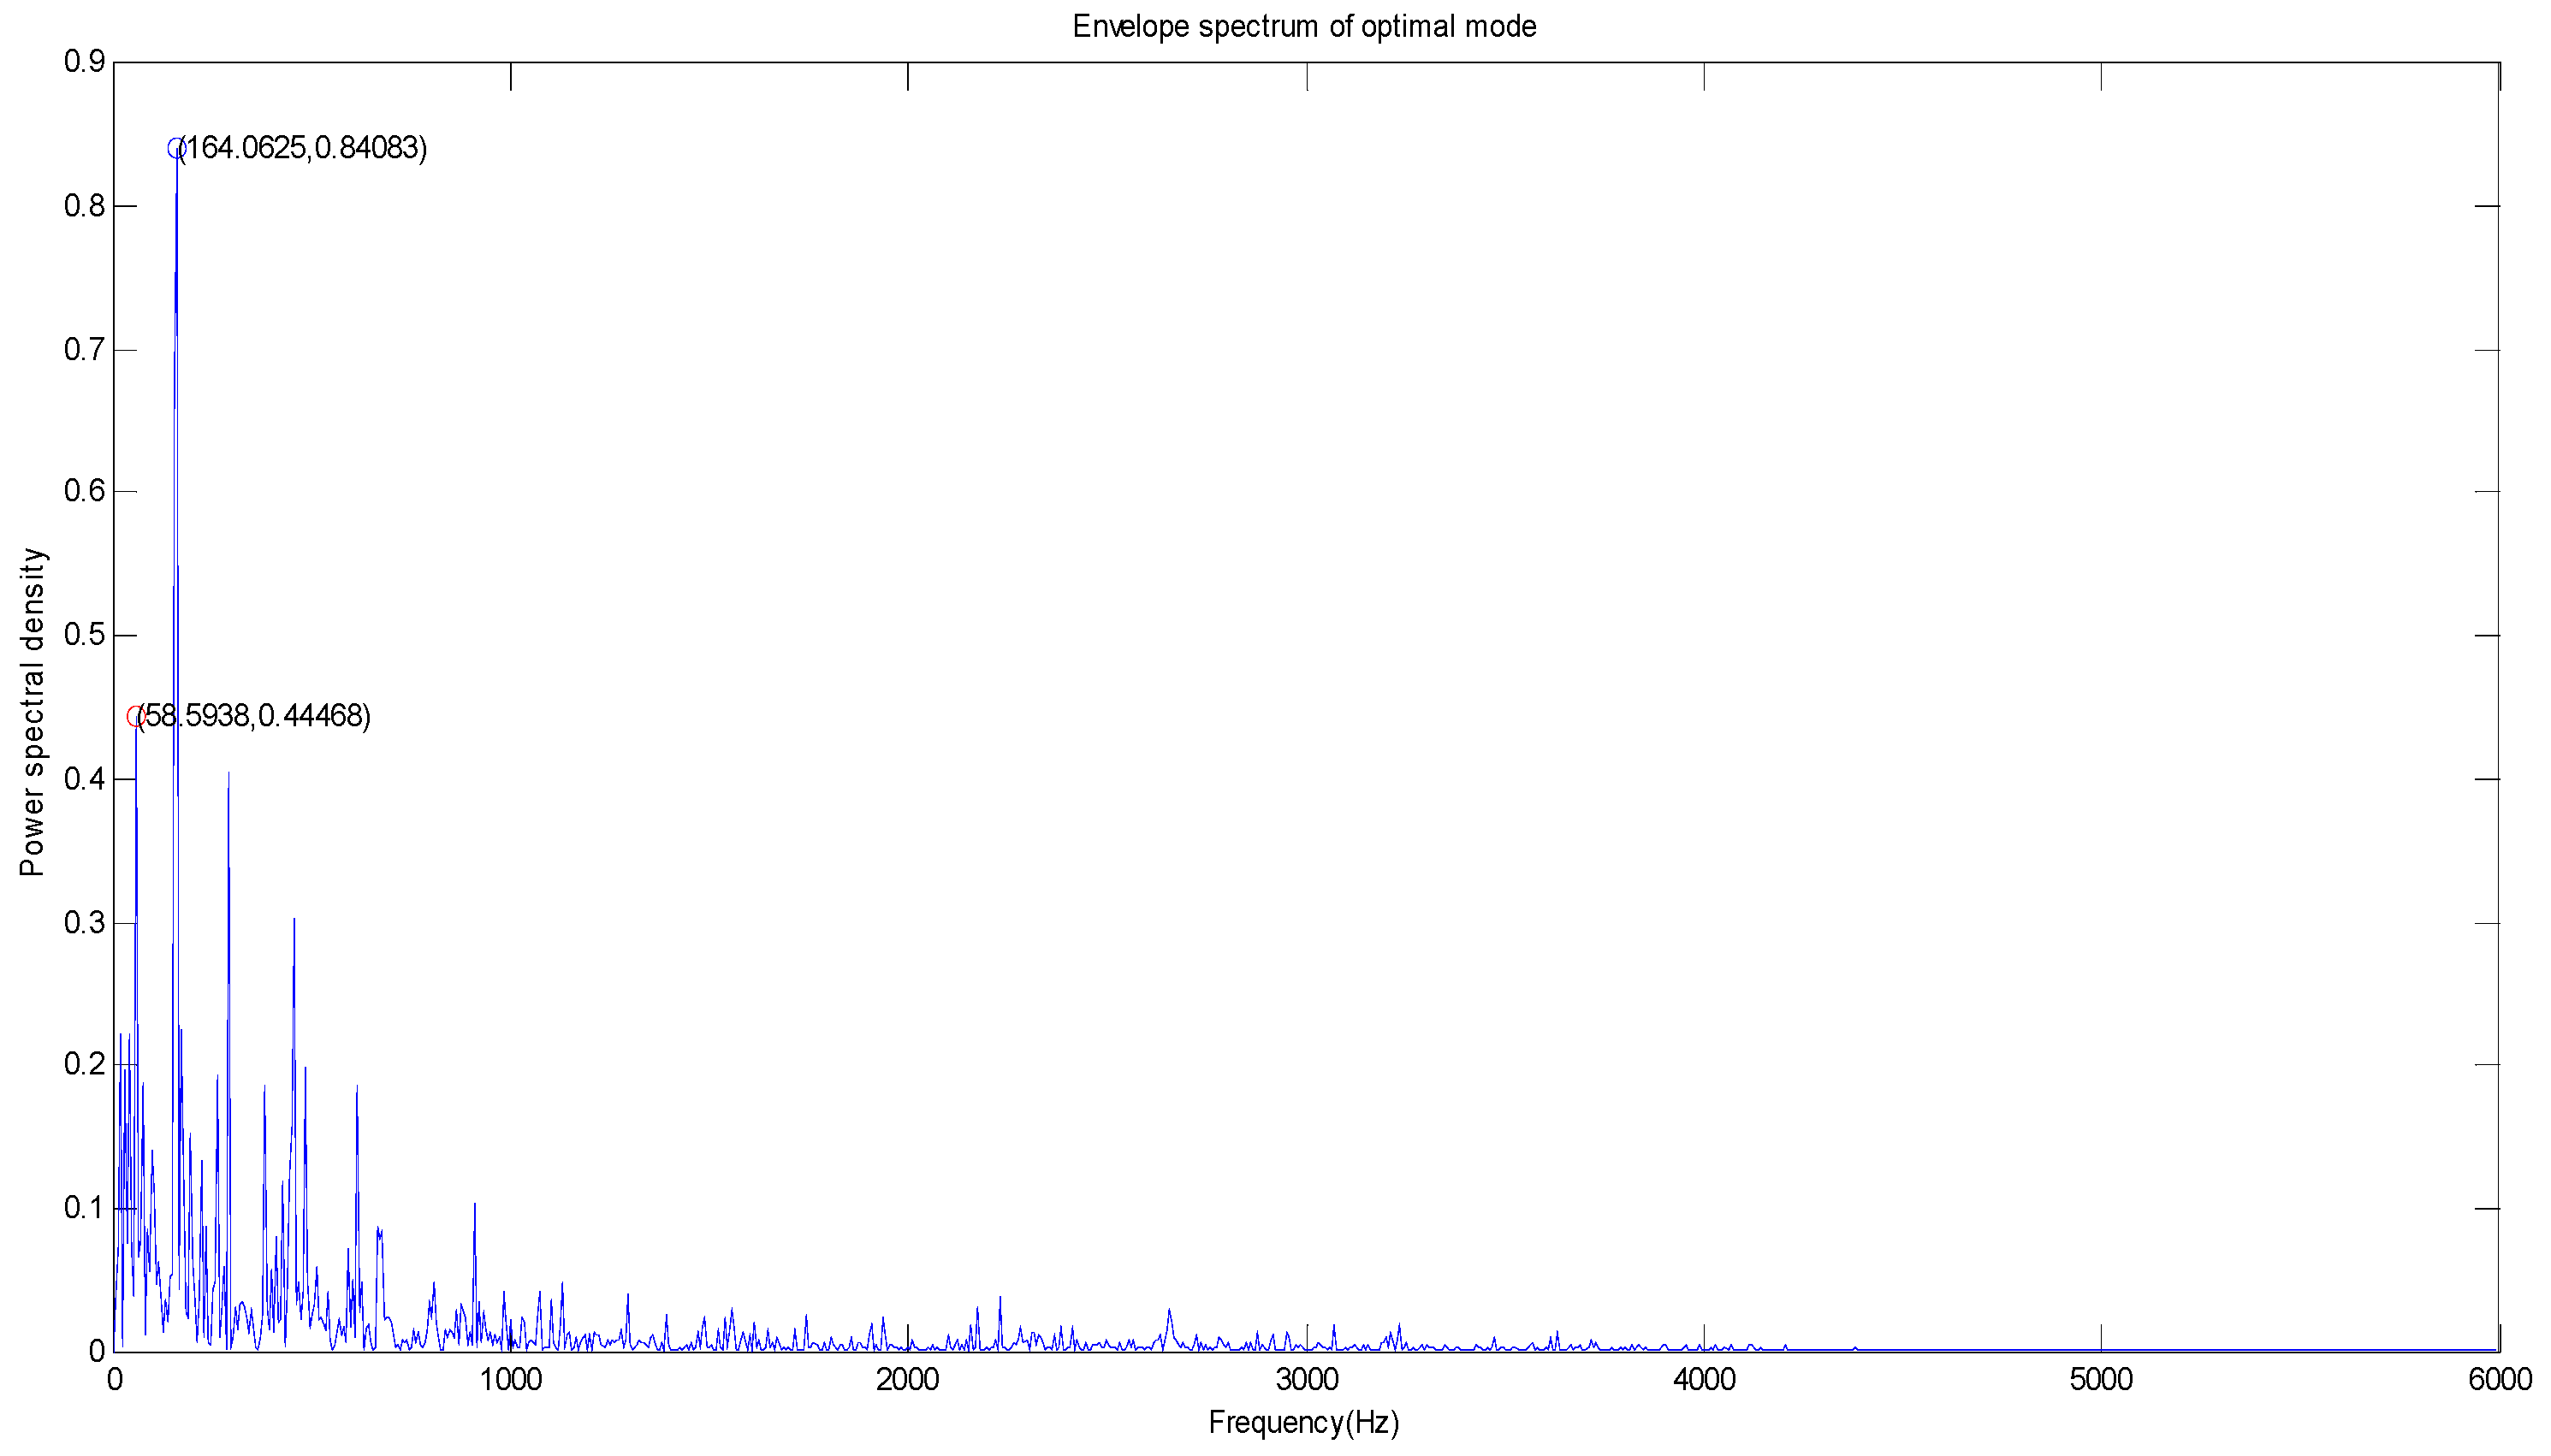
4.3. Fault Feature Analysis Based on the Hilbert Transform
5. Transmission Analysis of the Vibration Signal
5.1. Transmission Analysis of the Fault Vibration Signal for the Inner Ring
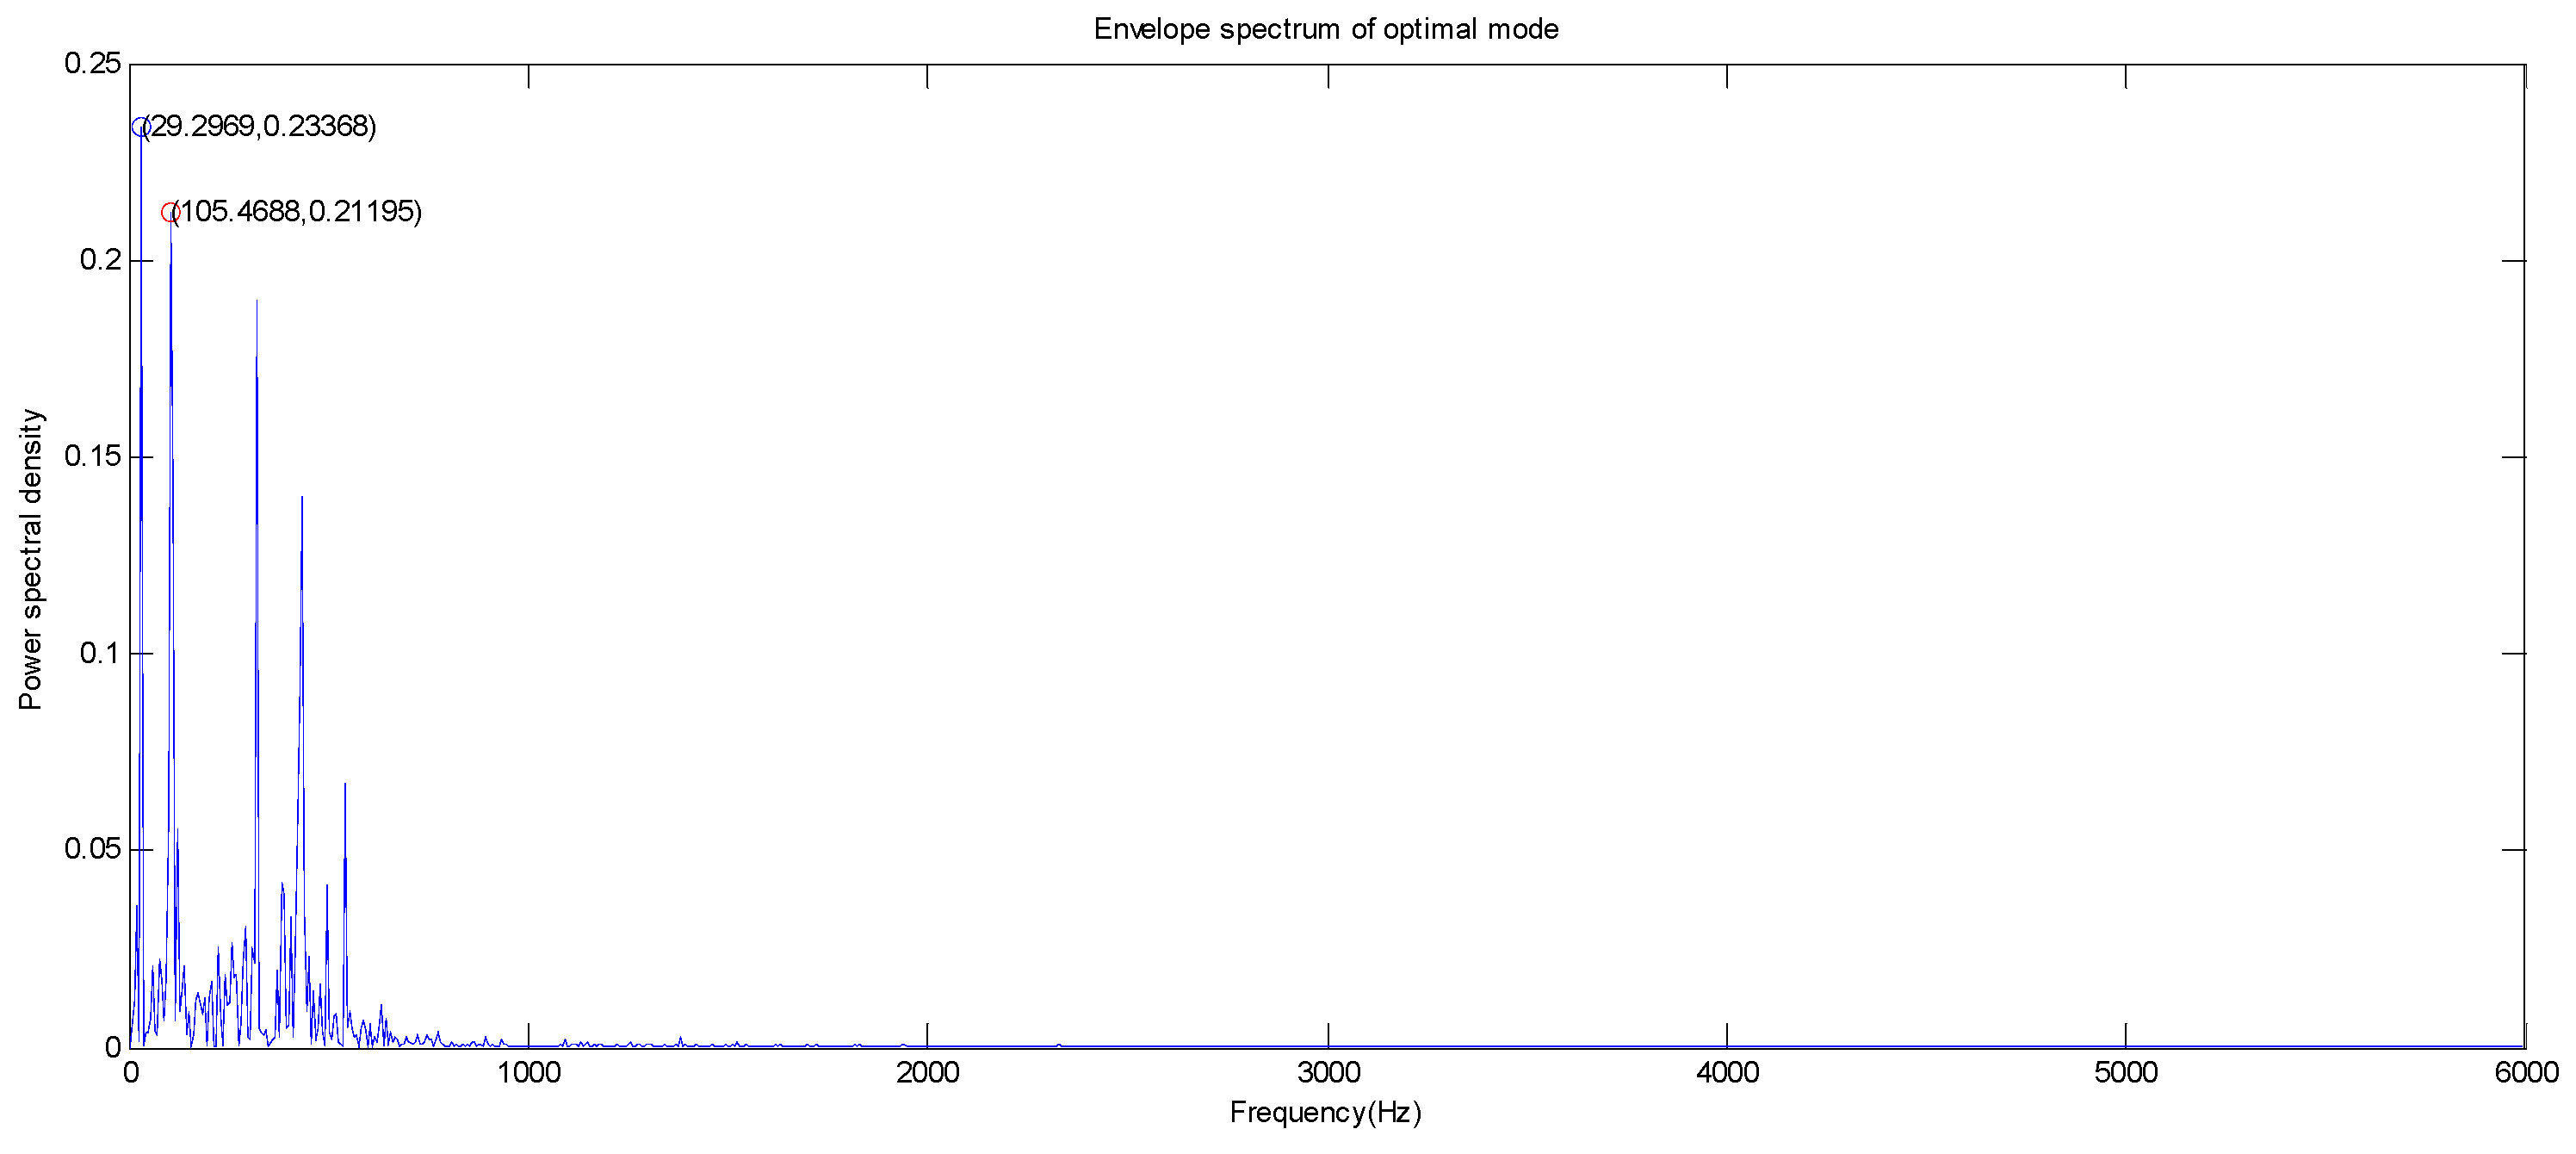
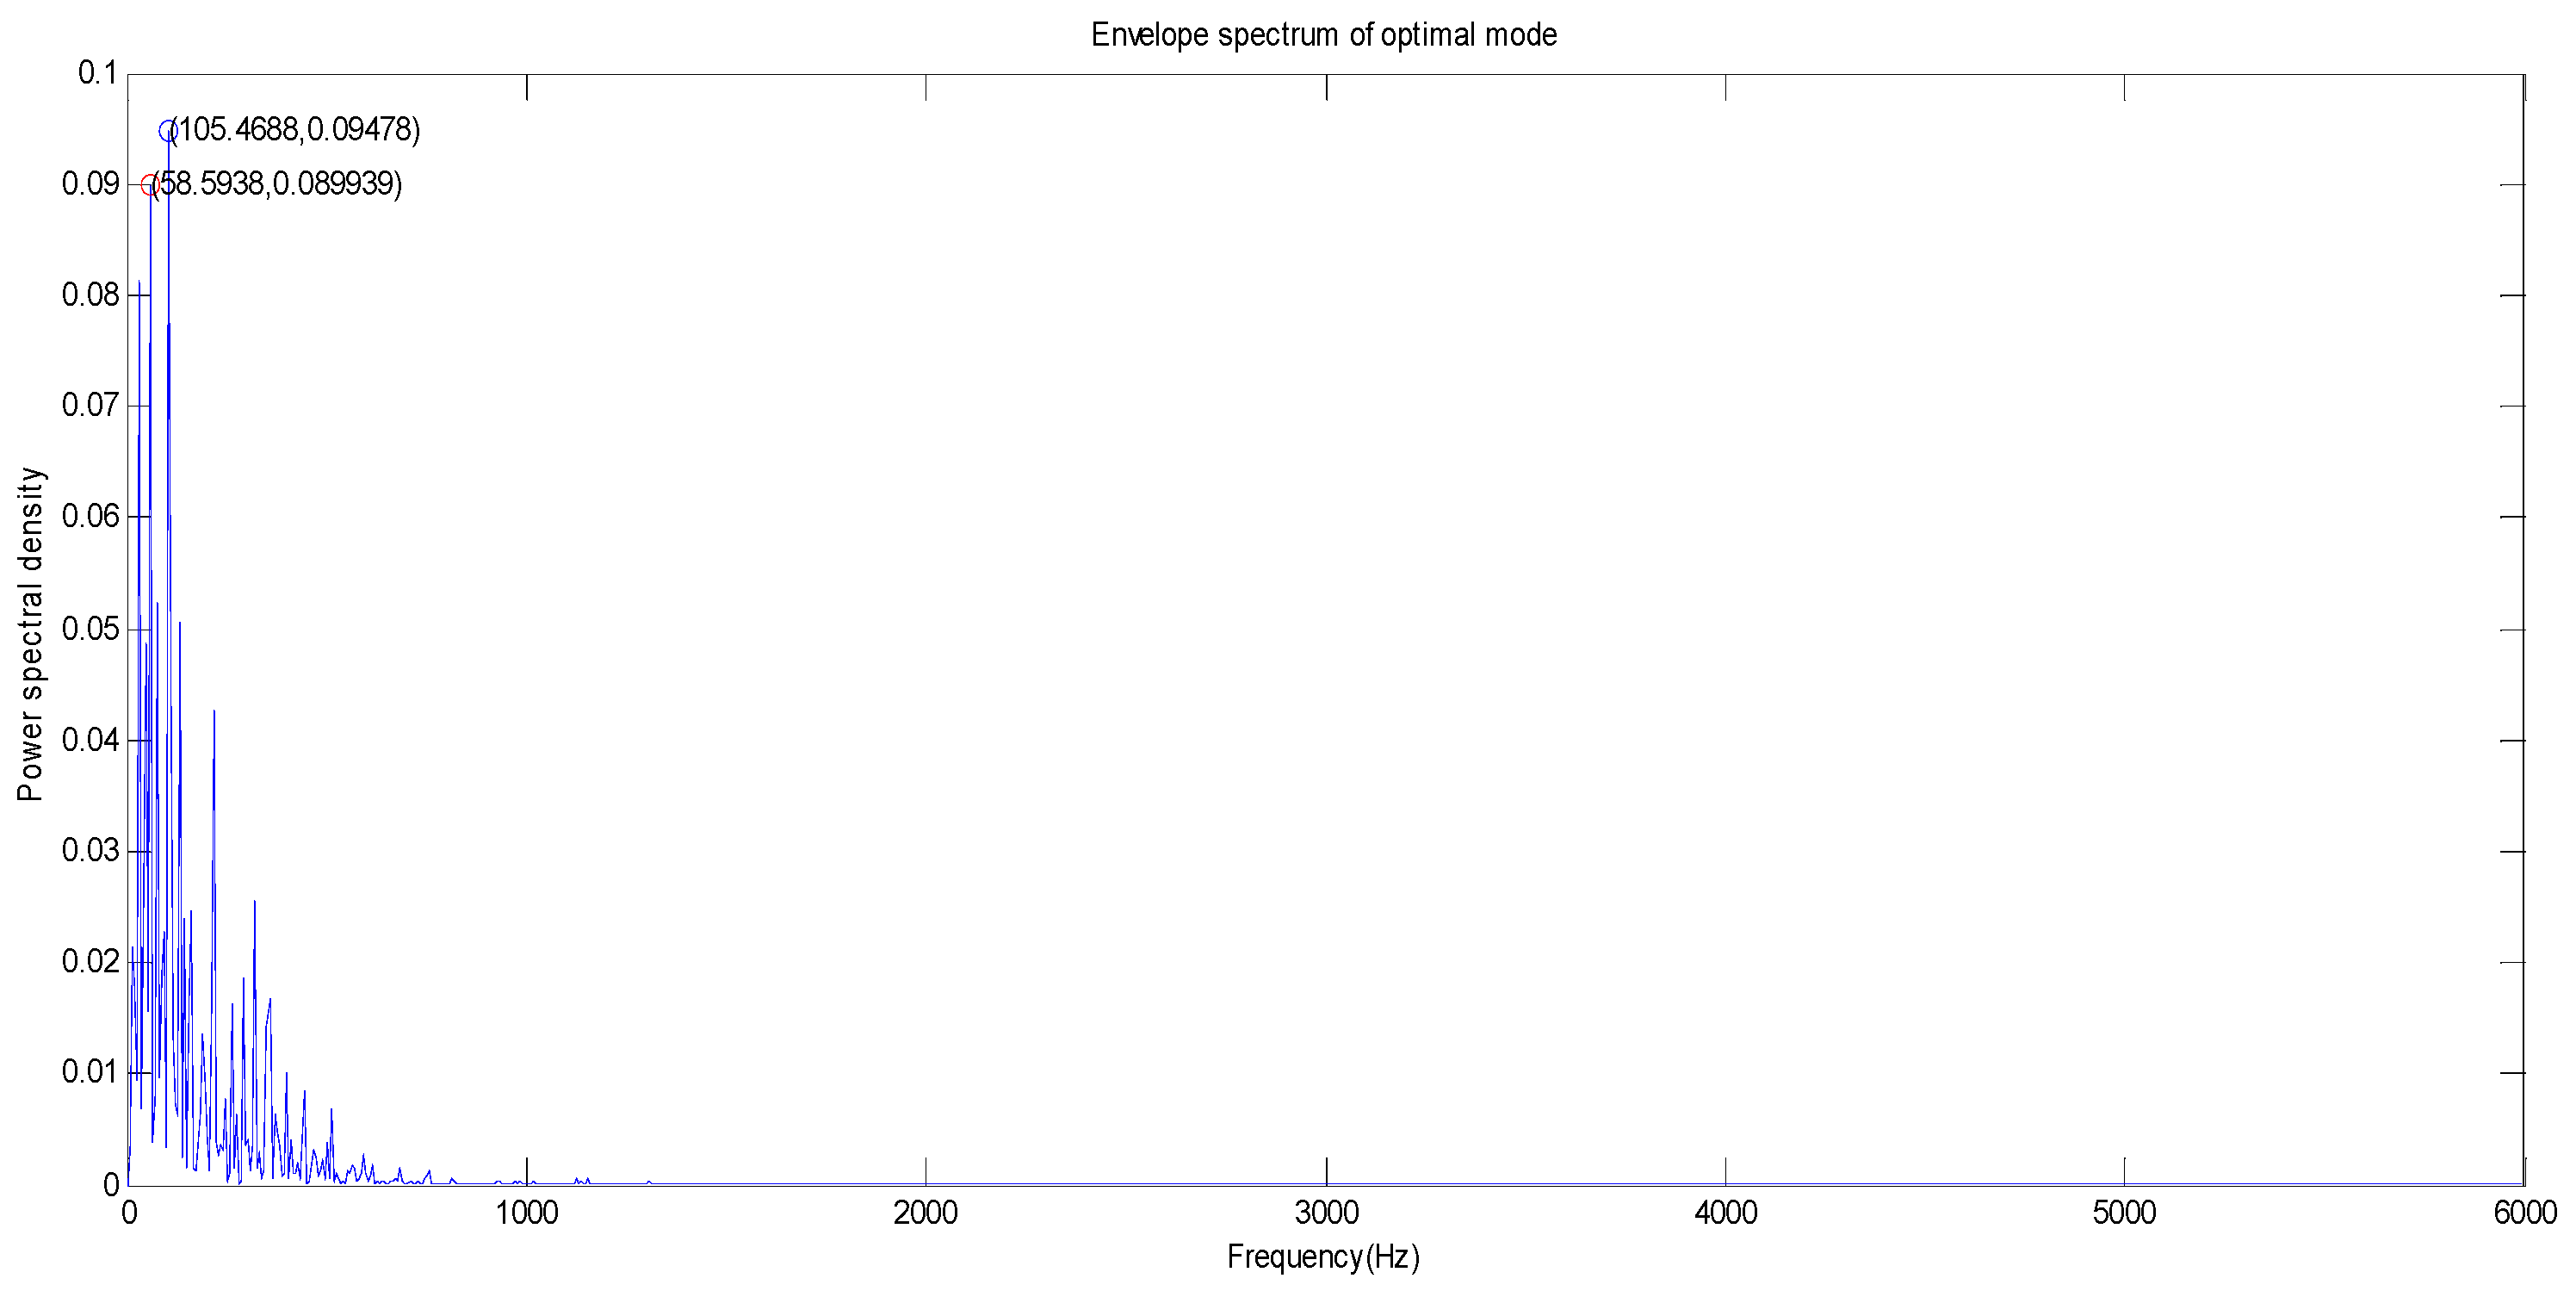
5.2. Transmission Analysis of the Fault Vibration Signal for the Outer Ring
6. Conclusions
Acknowledgments
Author Contributions
Conflicts of Interest
References
- Nandi, S.; Toliyat, H.A.; Li, X. Condition monitoring and fault diagnosis of electrical motors—A review. IEEE Trans. Energy Convers. 2005, 20, 719–729. [Google Scholar] [CrossRef]
- Wang, S.B.; Cai, G.G.; Zhu, Z.K.; Huang, W.G.; Zhang, X.W. Transient signal analysis based on Levenberg-Marquardt method for fault feature extraction of rotating machines. Mech. Syst. Signal Proc. 2015, 54–55, 16–40. [Google Scholar] [CrossRef]
- Bououden, S.; Chadli, M.; Karimi, H.R. An ant colony optimization-based fuzzy predictive control approach for nonlinear processes. Inf. Sci. 2015, 299, 143–158. [Google Scholar] [CrossRef]
- Pan, Z.Q.; Zhang, Y.; Kwong, S. Efficient motion and disparity estimation optimization for low complexity multiview video coding. IEEE Trans. Broadcast. 2015, 61, 166–176. [Google Scholar]
- Zhang, Y.H.; Sun, X.M.; Wang, B.W. Efficient algorithm for K-barrier coverage based on integer linear programming. China Commun. 2016, 13, 16–23. [Google Scholar] [CrossRef]
- Ming, A.B.; Qin, Z.Y.; Zhang, W.; Chu, F.L. Spectrum auto-correlation analysis and its application to fault diagnosis of rolling element bearings. Mech. Syst. Signal Proc. 2013, 41, 141–154. [Google Scholar] [CrossRef]
- Van Wyk, B.J.; van Wyk, M.A.; Qi, G. Difference Histograms: A new tool for time series analysis applied to bearing fault diagnosis. Pattern Recognit. Lett. 2009, 30, 595–599. [Google Scholar] [CrossRef]
- Mohsen, A.A.K.; Abu El-Yazeed, M.F. Selection of input stimulus for fault diagnosis of analog circuits using ARMA model. AEU Int. J. Electron. Commun. 2004, 58, 212–217. [Google Scholar] [CrossRef]
- Liu, Y.K.; Guo, L.W.; Wang, Q.X.; An, G.Q.; Guo, M.; Lian, H. Application to induction motor faults diagnosis of the amplitude recovery method combined with FFT. Mech. Syst. Signal Proc. 2010, 24, 2961–2971. [Google Scholar] [CrossRef]
- Rubini, R.; Meneghetti, U. Application of the envelope and wavelet transform analyses for the diagnosis of incipient faults in ball bearings. Mech. Syst. Signal Proc. 2001, 5, 287–302. [Google Scholar] [CrossRef]
- Yu, D.J.; Cheng, J.S.; Yang, Y. Application of EMD method and Hilbert spectrum to the fault diagnosis of roller bearings. Mech. Syst. Signal Proc. 2005, 19, 259–270. [Google Scholar] [CrossRef]
- Li, H.L.; Deng, X.Y.; Dai, H.L. Structural damage detection using the combination method of EMD and wavelet analysis. Mech. Syst. Signal Proc. 2007, 21, 298–306. [Google Scholar] [CrossRef]
- Guo, K.J.; Zhang, X.G.; Li, H.G.; Meng, G. Application of EMD method to friction signal processing. Mech. Syst. Signal Proc. 2008, 22, 248–259. [Google Scholar] [CrossRef]
- Cheng, J.S.; Yu, D.J.; Tang, J.S.; Yang, Y. Application of frequency family separation method based upon EMD and local Hilbert energy spectrum method to gear fault diagnosis. Mech. Mach. Theory 2008, 43, 712–723. [Google Scholar] [CrossRef]
- Wu, T.Y.; Chung, Y.L. Misalignment diagnosis of rotating machinery through vibration analysis via the hybrid EEMD and EMD approach. Smart Mater. Struct. 2009, 18, 095004. [Google Scholar] [CrossRef]
- Lei, Y.G.; Zuo, M.J. Fault diagnosis of rotating machinery using an improved HHT based on EEMD and sensitive IMFs. Meas. Sci. Technol. 2009, 20, 125701. [Google Scholar] [CrossRef]
- Jiang, H.K.; Li, C.L.; Li, H.X. An improved EEMD with multiwavelet packet for rotating machinery multi-fault diagnosis. Mech. Syst. Signal Proc. 2013, 36, 225–239. [Google Scholar] [CrossRef]
- Gong, P.; Chen, M.Y.; Zhang, L. EEMD-based selection of time-frequency patterns for motor imagery EEG. J. Comput. Inf. Syst. 2013, 9, 9211–9218. [Google Scholar]
- Lei, Y.; Li, N.; Lin, J.; Wang, S. Fault diagnosis of rotating machinery based on an adaptive ensemble empirical mode decomposition. Sensors 2013, 13, 16950–16964. [Google Scholar] [CrossRef] [PubMed]
- Ren, H.; Wang, Y.L.; Huang, M.Y.; Chang, Y.L.; Kao, H.M. Ensemble empirical mode decomposition parameters optimization for spectral distance measurement in hyperspectral remote sensing data. Remote Sens. 2014, 6, 2069–2083. [Google Scholar] [CrossRef]
- Shukla, S.; Mishra, S.; Singh, B. Power quality event classification under noisy conditions using EMD-based de-noising techniques. IEEE Trans. Ind. Inform. 2014, 10, 1044–1054. [Google Scholar] [CrossRef]
- Yang, C.Y.; Wu, T.Y. Diagnostics of gear deterioration using EEMD approach and PCA process. J. Int. Meas. Confed. 2015, 61, 75–87. [Google Scholar] [CrossRef]
- Vokelj, M.; Zupan, S.; Prebil, I. EEMD-based multiscale ICA method for slewing bearing fault detection and diagnosis. J. Sound Vib. 2016, 370, 394–423. [Google Scholar] [CrossRef]
- Özgür, Y.M.; Çerçevik, A.E. Axial vibration analysis of cracked nanorods with arbitrary boundary conditions. J. Vibroeng. 2015, 16, 2907–2921. [Google Scholar]
- Özgür, Y.M. Stability analysis of gradient elastic microbeams with arbitrary boundary conditions. J. Mech. Sci. Technol. 2015, 29, 3373–3380. [Google Scholar]
- Özgür, Y.M.; Süheyla, Y.K.; Çerçevik, A.E. A practical method for calculating eigenfrequencies of a cantilever microbeam with the attached tip mass. J. Vibroeng. 2016, 18, 3070–3077. [Google Scholar]
- Gu, B.; Sheng, V.S.; Tay, K.Y.; Romano, W.; Li, S. Incremental Support Vector Learning for Ordinal Regression. IEEE Trans. Neural Netw. Learn. Syst. 2015, 26, 1403–1416. [Google Scholar] [CrossRef] [PubMed]
- Gu, B.; Sheng, V.S. A Robust Regularization Path Algorithm for ν-Support Vector Classification. IEEE Trans. Neural Netw. Learn. Syst. 2016, 28, 1241–1248. [Google Scholar] [CrossRef] [PubMed]
- Xue, Y.; Jiang, J.M.; Zhao, B.P.; Ma, T.H. A self-adaptive artificial bee colony algorithm based on global best for global optimization. Soft Comput. 2017. [Google Scholar] [CrossRef]
- Gu, B.; Sun, X.M.; Sheng, V.S. Structural Minimax Probability Machine. IEEE Trans. Neural Netw. Learn. Syst. 2016, PP. [Google Scholar] [CrossRef] [PubMed]
- Gu, B.; Sheng, V.S.; Wang, Z.J.; Ho, D.; Osman, S.; Li, S. Incremental learning for ν-Support Vector Regression. Neural Netw. 2015, 67, 140–150. [Google Scholar] [CrossRef] [PubMed]
- Chandra, N.H.; Sekhar, A.S. Fault detection in rotor bearing systems using time frequency techniques. Mech. Syst. Signal Proc. 2016, 72–73, 105–133. [Google Scholar] [CrossRef]
- Yuan, C.H.; Sun, X.M.; LV, R. Fingerprint liveness detection based on multi-scale LPQ and PCA. China Commun. 2016, 13, 60–65. [Google Scholar]
- Xia, Z.H.; Wang, X.H.; Sun, X.M.; Wang, B.W. Steganalysis of least significant bit matching using multi-order differences. Secur. Commun. Netw. 2014, 7, 283–1291. [Google Scholar] [CrossRef]
- Tian, Q.; Chen, S.C. Cross-heterogeneous-database age estimation through correlation representation Learning. Neurocomputing 2017, 238, 286–295. [Google Scholar] [CrossRef]
- Xia, Z.H.; Wang, X.H.; Sun, X.M.; Liu, Q.S.; Xiong, N.X. Steganalysis of LSB matching using differences between nonadjacent pixels. Multimed. Tools Appl. 2016, 75, 1947–1962. [Google Scholar] [CrossRef]
- Bououden, S.; Chadli, M.; Filali, S.; El Hajjaji, A. Fuzzy model based multivariable predictive control of a variable speed wind turbine: LMI approach. Renew. Energy 2012, 37, 434–439. [Google Scholar] [CrossRef]
- Pan, Z.Q.; Lei, J.J.; Zhang, Y.; Sun, X.M.; Kwong, S. Fast motion estimation based on content property for low-complexity H.265/HEVC encoder. IEEE Trans. Broadcast. 2016, 62, 675–684. [Google Scholar] [CrossRef]
- Case Western Reserve University Bearing Data Center Website. Available online: http://csegroups.case.edu/bearingdatacenter/home (accessed on 9 January 2017).
- Cai, Y.P.; Li, A.H.; Wang, T.Y.; Liang, X.P. Engine vibration time-frequency analysis based on EMD-Wigner-Ville. J. Vib. Eng. 2010, 23, 430–437. [Google Scholar]
- Vahidi, B.; Ghaffarzadeh, N.; Hosseinian, S.H. A wavelet-based method to discriminate internal faults from inrush currents using correlation coefficient. Int. J. Electr. Power Energy Syst. 2010, 32, 788–793. [Google Scholar] [CrossRef]


| Types | Inside Diameter | Outside Diameter | Thickness | Rolling Diameter | Pitch Diameter |
|---|---|---|---|---|---|
| SKF6205-2RS | 0.9843 | 2.0472 | 0.5906 | 0.3126 | 1.537 |
| Inner Ring (Hz) | Outer Ring (Hz) | Rolling Element (Hz) |
|---|---|---|
| 162.19 | 107.29 | 141.08 |
| Index | Inner Ring (Hz) | Outer Ring (Hz) |
|---|---|---|
| Theoretical value | 162.19 | 107.29 |
| Calculated value | 164.06 | 105.47 |
| Error | 1.87 | 1.82 |
| Accuracy rate | 98.85% | 98.30% |
© 2017 by the authors. Licensee MDPI, Basel, Switzerland. This article is an open access article distributed under the terms and conditions of the Creative Commons Attribution (CC BY) license (http://creativecommons.org/licenses/by/4.0/).
Share and Cite
Deng, W.; Zhao, H.; Yang, X.; Dong, C. A Fault Feature Extraction Method for Motor Bearing and Transmission Analysis. Symmetry 2017, 9, 60. https://doi.org/10.3390/sym9050060
Deng W, Zhao H, Yang X, Dong C. A Fault Feature Extraction Method for Motor Bearing and Transmission Analysis. Symmetry. 2017; 9(5):60. https://doi.org/10.3390/sym9050060
Chicago/Turabian StyleDeng, Wu, Huimin Zhao, Xinhua Yang, and Chang Dong. 2017. "A Fault Feature Extraction Method for Motor Bearing and Transmission Analysis" Symmetry 9, no. 5: 60. https://doi.org/10.3390/sym9050060