
Opposition and Identicalness: Two Basic Components of Adults’ Perception and Mental Representation of Symmetry


1
Department of Humanities, University of Macerata, 62100 Macerata, Italy
2
Department of Psychological Sciences, University of Liverpool, Liverpool L69 7ZA, UK
3
Department of Human Sciences, University of Verona, 37129 Verona, Italy
*
Author to whom correspondence should be addressed.
Symmetry 2017, 9(8), 128; https://doi.org/10.3390/sym9080128
Submission received: 25 June 2017
/
Revised: 17 July 2017
/
Accepted: 21 July 2017
/
Published: 25 July 2017
(This article belongs to the Special Issue Symmetry-Related Activity in Mid-Level Vision)
Abstract
:Symmetry is a salient aspect of biological and man-made objects, and has a central role in perceptual organization. Two studies investigate the role of opposition and identicalness in shaping adults’ naïve idea of “symmetry”. In study 1, both verbal descriptions of symmetry (either provided by the participants or selected from among alternatives presented by the experimenter) and configurations drawn as exemplars of symmetry were studied. In study 2, a pair comparison task was used. Both studies focus on configurations formed by two symmetrical shapes (i.e., between-objects symmetry). Three main results emerged. The explicit description of symmetry provided by participants generally referred to features relating to the relationship perceived between the two shapes and not to geometrical point-by-point transformations. Despite the fact that people tended to avoid references to opposition in their verbal definition of symmetry in study 1, the drawings that they did to represent their prototypical idea of symmetry manifested opposition as a basic component. This latter result was confirmed when the participants were asked to select the definition (in study 1) or the configuration (in study 2) that best fitted with their idea of symmetry. In conclusion, identicalness is an important component in people’s naïve idea of symmetry, but it does not suffice: opposition complements it.
1. Introduction
The perception of symmetry has always been an intriguing subject for psychologists (for a review, see [1,2]). It has also been studied in relation to aesthetics (e.g., [3,4,5,6,7,8,9]) and, in recent times, to neuroscience [10,11].
Various studies have consistently demonstrated higher sensitivity (from the age of about four months) for bilateral symmetry around a vertical axis even at very short exposure times [12,13,14,15] and in various sense modalities [16,17]. Some studies have shown that the ability to detect mirror symmetry around a particular axis depends on the frequencies of various different orientations within a block of trials (e.g., [14,18]). This implies that the effect of orientation on the detection of symmetry is not completely determined by a fixed neural architecture in the visual system but can be modulated by scanning or attentional strategies. These findings do not negate the aforementioned preference for bilateral symmetry around a vertical axis, they indicate that it may be necessary to adjust the hypotheses regarding the causes of the phenomena. Since the structure of the ecological world and of artifacts is predominantly bilateral around a vertical axis, the preference for this type of symmetry might depend on exposure.
As noted by Wagemans ([19], p. 346), much of what is known about the effects of several factors on human detection of symmetry (thanks to decades of experimental work) has been inspired by phenomenological observation. Regularity, for example, defined as the salience or perceptual strength of a given pattern, is a classic phenomenological notion (or Gestalt notion) which has inspired a large number of studies on symmetry (e.g., [20,21,22,23,24,25,26,27,28,29,30,31,32,33]). The study described in this paper starts from a similar basis with the aim of analyzing whether and to what extent two phenomenological relationships, namely opposition and identicalness, are salient components of adults’ naïve idea of symmetry.
Identicalness, opposition, similarity and diversity are directly perceived relationships, which are basic to human perception and categorization [34,35,36,37,38,39,40,41,42]. Every time we make a comparison between two stimuli these relationships inevitably emerge. Therefore, a reasonable question for a psychologist to ask concerns the relationship which is perceived between two shapes recognized as being “symmetrical” (e.g., Figure 1). This has been referred to as “between-object” symmetry to distinguish it from “within-object” symmetry, i.e., when a single figure is involved and symmetry exists between its individual parts [43,44].
Independently of whether we are talking of a within-object symmetry or between-object symmetry, in geometrical terms symmetry is an isometry, that is, it is a transformation that maps elements to the same or another metric space such that the distance between the elements in the new metric space is equal to the distance between the elements in the original metric space (usually assumed to be bijective). There are four plane isometries: reflection, rotation, translation and glide reflection. Here we focus on reflection and we will reserve the word symmetry for reflectional symmetry. According to a standard definition (see Figure 1): “a spatial configuration is symmetrical with respect to a given plane E if it is carried into itself by reflection in E. Take any line l perpendicular to E and any point p on l: there exists one and only one point p’ on l which has the same distance from E but lies on the other side. The point p’ coincides with p only if p is on E. Reflection in E is that mapping of space upon itself, S: p → p’, that carries the arbitrary point p into its mirror image p’ with respect to E” ([45], pp. 4–5).
Is this what people have in mind when they think of “symmetry”? In Euclidean geometry and its applications, any reference to qualitative features which reveal experiential spatial constructs are eliminated and replaced by abstract entities, definitions and terms. Conversely, the objective of Experimental Phenomenology (e.g., [46,47,48,49]) is to identify, describe and define the properties and relationships that are salient from the point of view of human direct experiences. The constructs of “symmetry”, “identicalness” and “opposition” which are used in this paper, as well as those of “regularity” or “goodness” which have been used in relation to symmetry, are all connected with this theoretical perspective. In particular, we hypothesize that since bilateral symmetry is modelled on a mirror reflection and since identicalness and opposition are salient features (as reviewed in Section 2), opposition and identicalness should emerge as a salient integral part of people’s perception and mental representation of “symmetry”. The two studies presented in this paper test this hypothesis.
From Mirrors to Mirror Symmetry
Studies in the field of naïve optics [50] have revealed that when people are asked to determine the reflected world from the “real world” they do not rely on the optical-geometrical point-by-point rule (shown in Figure 1) even though they have explicit knowledge of this [50,51]. This is the same as the evidence found in studies on naïve or intuitive Physics concerning movement. It was discovered that when adults are asked to make predictions about simple physical phenomena—for example the case of free falling objects [52,53,54,55], the trajectory of objects which have been thrown [56,57] or the orientation of the surface of liquids in variously inclined containers [58,59]—many observers forget about what they have learnt in school. Instead they base their responses on prototypical models that they have in mind [60].
Among the proposals put forward to explain the systematic mistakes that adults make when asked to predict the behavior of reflections (e.g., [61,62,63,64]) one concerns the hypothesis that people think of reflections in terms of Identity and/or Opposition [65,66,67]. Most of the errors made [67,68,69] are compatible with a generalization of the rule which states that “the reflection does the same” (see Figure 2c) and/or “the reflection does the opposite” (see Figure 2b), which forms the basis of the macroscopic geometry of the relationship seen between a “real object” and its reflection ([67] (studies 4–5), [70]).
When people observe simple objects positioned in front of a vertical plane mirror or in motion at various angles of incidence towards or away from the mirror, descriptions such as “the reflection has an identical orientation/direction of motion” or “the reflection has an opposites orientation/direction of motion as compared to that of the real object” are judged to be accurate (see [67] studies 4–5). Similarly, when naïve observers see their own image in a plane mirror (or another person’s image), they report that they perceive the orientation of the reflection to be opposite with respect to the real body [70]. The fact that our left arm in the reflection is our right arm is a visual characteristic which we notice, especially when we are encouraged to focus on the lateralization of our body. However, we also immediately notice that we are facing in one direction (e.g., north) while the reflection is facing the opposite direction (i.e., south) and when we walk towards the mirror, the person in the reflection moves in the opposite direction (i.e., representing opposition on the sagittal axis). When the mirror is on the wall to the side of an observer, the reflection has an identical sagittal and gravitational orientation with respect to the real person but is opposite in terms of the coronal axis; if the person then moves laterally to his/her right (e.g., eastwards), the reflection moves in the opposite direction (i.e., to the left and westwards). If the observer then positions him/herself on top of a mirror lying on the floor, he/she again perceives the reflection as having an opposite orientation along the gravitational axes (as the reflection is upside-down). In all of these conditions, the orientation of the reflection is consistently described as “opposite” (rather than “identical”, “similar”, or “different”) in a percentage of cases ranging between 80% and 100% of the participants, depending on the position of the mirror (see [70], Figure 3). This concurs with the fact that participants in mirror tasks describe their reflection as “identical” to themselves when looking at their reflection in a mirror set vertically in front of them or to their side, or as “opposite” or “similar” to themselves when looking at their reflection in a mirror set horizontally under their feet [70]. These findings are in agreement with studies carried out with various types of visual stimuli which show that transforming the orientation of something into its opposite orientation guarantees an overall perception of clear contrast and clear invariance at the same time, and these seem to be the two conditions which are necessary for the relationship between two things or events to be specifically recognized as contrary/opposite, rather than generically different [34,35,71].
In this study, we posed the question of whether the fact that reflections are phenomenally associated with the recognition of identity and opposition (as mentioned above) can be generalized to the naïve idea of symmetry, which adults have in mind. If so, the configurations that people consider to be good examples of a “symmetrical configuration” should reveal not only identity but also opposition. In other words, they should look more like those shown on the right side in Figure 3 than those shown on the left.
The configurations displayed in Figure 3 are, from a geometrical point of view, equally valid examples of reflections around a vertical axis. However, the configurations on the left look identical and the only recognizable element of opposition concerns the localization of the two shapes with respect to the mirror axis. Conversely, the configurations on the right show opposition as they show shapes which are oppositely oriented. If visible opposition, in addition to visible identity, is an important component of people’s naïve idea of symmetry, then these configurations would not be equally good and we should expect those on the right to be better examples.
2. Study 1
The aim of this study was to ascertain how important the role of identicalness and opposition is in the explicit idea (i.e., verbal description) and implicit idea (i.e., mental representation or “prototypical mental image” in Yates et al.’s terms [60]) that naïve subjects have of symmetry. The former was assessed by asking participants to verbally describe the features characterizing two symmetrical shapes (the 1st question in the experiment) and at the end of the session, requesting them to choose which description out of three fit in best with their idea of symmetry (the 4th question). The implicit idea of symmetry was tested by assessing the drawings done by the participants as examples of their idea of symmetry (the 2nd and 3rd questions).
Since we were interested in understanding the relational aspects which characterize two symmetrical figures and to prevent the participants from simply drawing stereotypical images of symmetry such as a butterfly or a human face, we asked them to draw configurations consisting of two shapes which were symmetrical to each other.
We expected explicit and implicit descriptions to be related, but not necessarily to coincide. For example, participants might omit explicit references to opposition in their verbal description in response to question 1, but then draw configurations that manifest the opposite orientation of two figures (as those represented on the right in Figure 3) or, conversely, give verbal descriptions referring to the opposition component and then draw configurations that do not display opposition (such as the configurations on the left in Figure 3). Since we hypothesize that opposition is a structural implicit component of symmetry, we anticipated that the former expectation would be more likely to occur.
The drawings were analyzed according to a series of features of interest for the purposes of this study. These concerned, first of all, the shape of the figures forming the configuration (i.e., were they symmetrical or asymmetrical?) and the orientation of the two shapes with respect to the mirror axis. The reason why these features are important will become evident in Figure 4. The Figure represents various examples of symmetrical configurations around a vertical mirror axis, black circles in the first row, isosceles triangles in the second row and isosceles triangles with a piece missing in the third row. The difference between these concerns: (i) the structure of the shapes forming the configuration in terms of whether they are symmetrical or asymmetrical and the orientation of the shapes with respect to the mirror axis (0°, 20°, or 90°). The structure of the shapes (symmetry or lack of symmetry) is defined by two internal axes which are orthogonal to each other, represented by dashed lines in Figure 4. The orientation of the shapes with respect to the mirror axis is determined by three different angles: in the first column (0°), the shapes are positioned so that one of the internal axes is parallel and the other is orthogonal to the mirror axis; in the second column, the shapes have been rotated by 20° with respect to the original position and in the third column, they have been rotated by 90° with respect to the original position.
If the shapes forming the configuration are symmetrical with respect to both of their internal axes (Sym in Figure 4), it is impossible for the two shapes to be oppositely oriented, whatever their position with respect to the mirror axis is. Conversely, if the shapes are symmetrical with respect to one axis but asymmetrical with respect to the other axis (Asym 1 in Figure 4), it is only when the shapes are positioned so that their internal axis of symmetry is parallel to the mirror axis (i.e., Asym 1 at 0° in Figure 4) that the two shapes look identical to each other. In all other positions, the two shapes display an opposite orientation and this becomes particularly salient when the internal axis of symmetry is orthogonal to the mirror axis (i.e., Asym 1 at 90° in Figure 4). If the shapes are asymmetrical with respect to both of their internal axes (Asym 2 in Figure 4), it is impossible for them to be organized in such a way that they look identical and do not display an opposite orientation.
In order to determine whether opposition was visually evident or masked in the participants’ drawings, it was therefore critical to analyze the shapes in terms of whether they were Sym, Asym 1 or Asym 2 and, in the case of shapes with one internal axis of symmetry (i.e., Asym 1), to analyze how the participants positioned them with respect to the mirror axis, i.e., whether the internal axis of symmetry was parallel to the mirror axis, as in the 0° column in Figure 4, or orthogonal to the mirror axis, as in the 90° column in Figure 4.
We also took into consideration, in the case of shapes that clearly pointed in a particular direction, whether there was a preference for divergent or convergent patterns. Furthermore, we explored whether the mirror axis of the prototypical configurations that the participants had in mind was more frequently oriented vertically. If so, we further investigated how robust this aspect was in terms of whether it was invariant in both drawings.
2.1. Materials and Method
2.1.1. Participants
109 undergraduate students of Psychology and Education at the University of Verona, Italy (mean age 21.2; 74 females; 35 males). The study was approved by the Ethics Committee of the University of Verona as the local ethics committee responsible and was conducted in accordance with the Declaration of Helsinki (revised 2008). All participants gave their written informed consent in accordance with the local ethics committee requirements.
2.1.2. Materials
A 5 page booklet with each page containing a different request:
- (1)
- How would you define the relationship between two symmetrical shapes?
- (2)
- Draw a clear example of your idea of two symmetrical shapes.
- (3)
- Draw another clear example (radically different from the first two) of your idea of two symmetrical shapes.
- (4)
- Which of the following three definitions best describes your idea of symmetry?
- (a)
- Two identical shapes
- (b)
- Two opposite shapes
- (c)
- Two identical and opposite shapes
The order of the four questions was the same for all participants; the order of the three definitions in question four was randomized between participants.
2.1.3. Procedure
The experiment was conducted at the beginning of a class on a topic which was totally unrelated to the issue. Participants were seated 6 seats apart in order to prevent them from influencing each other. Each participant received a booklet. They were told to start from the first page and move to the next one only after having completed the previous page. There were no time limits. All of the participants took less than 10 min to complete the task.
2.1.4. Statistical Analysis
Responses were analyzed using Generalized Mixed effect Models (GLMM) [72]. All of the variables analyzed in Study 1 are categorical variables. Responses were coded binomially (i.e., in terms of use or non-use of each level of the categorical variable), and binomial family GLMMs (with logit link function) were then conducted on the frequency of use of each level of the categorical variable (i.e., proportion of use over non-use). Mixed effect models allowed us to deal with the variability between participants as a Random effect. In cases involving significant main effects or interactions, post-hoc tests using the Bonferroni correction were conducted and estimates were made of both the non-standardized size of the effect (i.e., EST, which indicates the log odd ratio) and the standardized size of the effect (i.e., Cohen’s index d; see [73,74,75]).
All analyses were carried out using the statistical software program R 3.3.1, with the “lme4”, “car”, “lsmeans”, and “effects” packages. We performed Mixed Model ANOVA Tables (Type 3 tests) via likelihood ratio tests implemented in the “afex” package.
2.1.5. Results
In this section, we will focus first on the verbal descriptions of symmetry given by the participants in answer to question 1 and chosen in question 4; then we will analyze the drawings showing examples of the idea of symmetry (questions 2 and 3). Lastly, we will assess any association between the verbal descriptions in questions 1 and 4 and the drawings.
(I) Verbal descriptions of symmetry
The definitions produced by the participants in response to question 1 were classified into different categories based on their content. The categories were defined by the experimenters after an initial inspection of the responses. The classification was then conducted by two independent judges based on these categories (with almost perfect agreement, Cohen’s κ index = 0.92). Four responses were excluded from the analyses since they were either missing or tautological. The categories are listed in Table 1, together with some examples of descriptions and the frequency of each category. Less than 3% of the descriptions given by the participants referred to a point-by-point transformation such that shown in Figure 1 (see category a in Table 1). All the other responses referred to features relating to the relationship perceived between the two shapes.
A GLMM (binomial family) tested whether some types of description were more frequently given and this turned out to be the case (χ2(7, 105) = 77.189, p < 0.0001, see top graph in Figure 5). As post-hoc tests revealed, responses referring exclusively to the sameness of the two symmetrical shapes (either in general, or specifying that they were the same in terms of shape and/or size—see examples of the descriptions under the category b in Table 1) were significantly more frequent than all of the other response categories except for those responses which made exclusive and explicit reference to a specular configuration (i.e., category c in Table 1; EST = 9.074, SE = 0.309, z-ratio = 2.934, p = 0.093).
The findings were as follows:
- (a)
- Exclusive references to Sameness were significantly more frequent than references to both Sameness and Opposition (categories b versus f in Table 1: EST = 1.292, SE = 0.334, z-ratio = 3.863, p = 0.003, d = 0.376);
- (b)
- The two most frequent types of description (i.e., categories b and c in Table 1), which together amount to 61% of the total number of responses, do not explicitly refer to opposition;
- (c)
- Only one response (i.e., less than 1%) mentioned the opposition component exclusively (category e in Table 1: “Two symmetrical shapes are two opposite shapes”);
- (d)
- Overall Opposition, in one way or another (i.e., categories e, f, and g in Table 1) was mentioned in only 20 out of the 105 descriptions collected (i.e., 19.04%).
These results suggest that the perception of opposition was not prominent in the verbal definitions.
A different picture emerged in the case of responses to question 4, for which participants were asked to choose which out of the three descriptions (“Two identical shapes”, “Two opposite shapes” and “Two identical and opposite shapes”) best fitted their idea of symmetry (χ2(2, 109) = 48.769, p < 0.0001; see bottom graph in Figure 5). “Identical and Opposite” was more frequently chosen as compared to exclusive references to Opposition (EST = 4.564, SE = 0.741, z-ratio = 6.159, p < 0.0001, d = 0.601) but “Identical and Opposite” was also more frequently chosen as compared to exclusive references to Identicalness (EST = 1.250, SE = 0.284, z-ratio = 4.398, p < 0.001, d = 0.429).
(II) Prototypical representations
The following analyses was conducted on 76 of the first drawings and 75 of the second drawings (some of them are shown in Figure 6). The other drawings were not considered either because they showed only one shape and not two as requested or because they were incorrect (i.e., they did not display symmetry). The latter was the case for 6 (i.e., 5.5%) of the drawings done as a first representation and 8 (i.e., 7%) of the drawings done as a second representation.
For all the variables considered in the following analyses, the assessment of the drawings was conducted by two independent judges, with inter-rater agreement ranging from very good (Cohen’s κ = 0.84) to excellent (Cohen’s κ = 0.94).
Mirror axis: vertical, horizontal or oblique? A GLMM was performed to analyze the orientation of the mirror axis in relation to the two drawings (first and second). A main effect of Orientation of the mirror axis emerged (χ2(2, 86) = 123.448, p < 0.0001). As shown in Figure 7 (top graph), participants more frequently drew configurations displaying a Vertical mirror axis than a Horizontal mirror axis (EST = −3.855, SE = 0.392; z-ratio = −9.843, p < 0.0001, d = −1.061), which in turn was more frequently used than an Oblique mirror axis (EST = 1.835, SE = 0.685, z-ratio = 2.678, p = 0.022, d = 0.288). As shown in the central graph in Figure 7 (which shows the interaction between Drawing and Orientation: χ2(2, 87) = 14.677, p = 0.0006), this distribution held for both the first and the second drawings. However, configurations displaying a horizontal mirror axis tended to be drawn more frequently in the second drawing as compared to the first (EST = −1.666, SE = 0.592; z-ratio = −2.816, p = 0.07, d = 0.274).
A combined analysis of the two drawings done by each participant was performed to determine whether the participants had used vertical axes in both drawings, horizontal axes in both drawings or had opted for a mixed solution. This allowed us to assess how robust the idea of a specific orientation of the mirror axis was in the participants’ minds. A combined GLMM was conducted on the mirror axes in Drawings 1 and 2 and the results are represented in the bottom graph in Figure 7 (χ2(4, 56) = 57.357, p < 0.0001). As confirmed by the post-hoc tests, the most frequent orientation was vertical in both the first and second drawings (EST = 3.152, SE = 0.58, z-ratio = 5.352, p < 0.0001, d = 0.715) despite the fact that participants had been explicitly told in the instructions that the second drawing should present a radically different example of symmetry to the first drawing.
Symmetrical or asymmetrical shapes? The shapes in the drawings were classified according to whether they were symmetrical around both their vertical and horizontal axes (see the configurations in the top row in Figure 4 and Figure 6), asymmetrical with respect to both the vertical and horizontal axes (see the configurations in the third row in Figure 4 and in the third and fourth rows in Figure 6) or symmetrical around one axis and asymmetrical with respect to the other (see the configurations in the second row in Figure 4 and Figure 6). As explained in the introduction of the study, when commenting on Figure 4, the symmetry/asymmetry of the shape is relevant since opposition emerges only with shapes which are asymmetrical with respect to at least one axis.
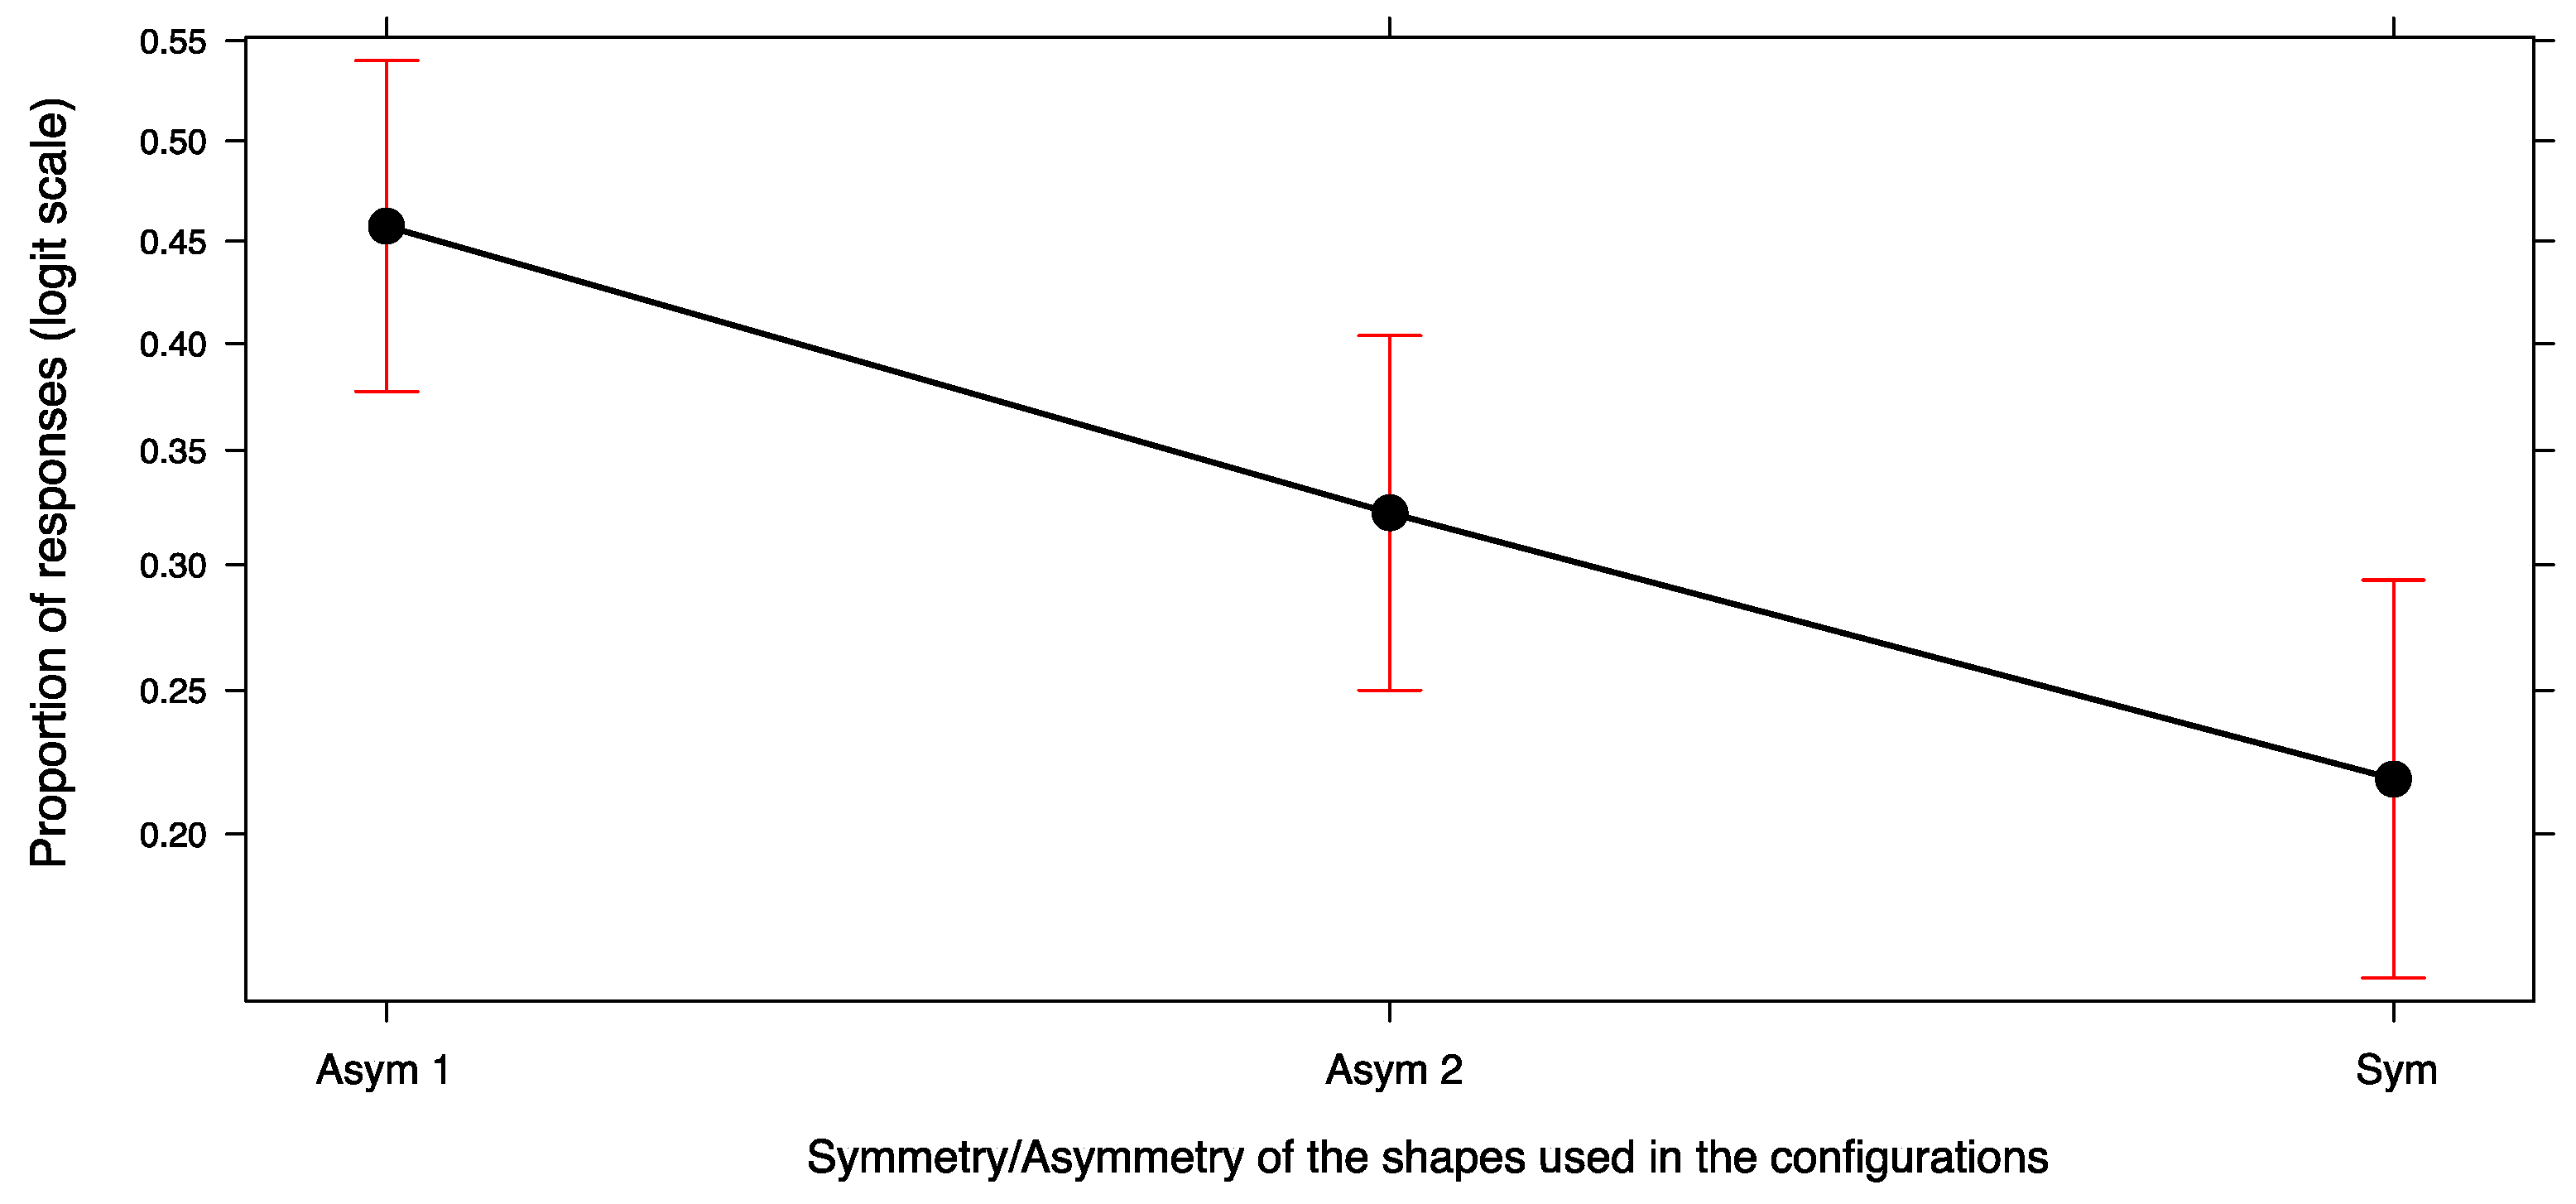
A GLMM was conducted to analyze the shapes in the two drawings according to the level of Symmetry/Asymmetry they displayed. The main effect of Symmetry/Asymmetry was confirmed (χ2(2, 86) = 17.758, p < 0.0001), with no interaction with Drawing (χ2(2, 86) = 2.412, p = 0.299). As shown in Figure 8, the drawings were based on asymmetrical shapes in the majority of cases: asymmetrical shapes (either Asym 1 or Asym 2) constituted around 75% of the total, including both the first and second exemplars. Perfectly symmetrical shapes, i.e., shapes that minimized the opposition component, accounted for less than 25% of the configurations.
Post hoc tests revealed that participants had a preference for shapes which were symmetrical around one axis and asymmetrical around the other axis (i.e., Asym 1 in Figure 4 and Figure 8). This was more frequent than either perfectly symmetrical figures (EST = 1.113, SE = 0.264, z-ratio = 4.208, p < 0.0001, d = 0.453) or figures which were asymmetrical with respect to both the horizontal and vertical axes (EST = 0.600, SE = 0.248, z-ratio = 2.414, p < 0.05, d = 0.260).
How were the shapes which were symmetrical around one axis (i.e., Asym 1) oriented with respect to the mirror axis? We analyzed the positioning of the shapes when they were symmetrical with respect to one axis and asymmetrical with respect to the other axis (i.e., Asym 1, see the configurations in the second row in Figure 4 and Figure 6). We studied whether the opposite orientation of the shapes was manifested (i.e., with the symmetrical axis orthogonal to the mirror axis) or absent (i.e., with the symmetrical axis parallel to the mirror).
We performed another GLMM on the Orientation of the shapes (both the first and second Drawing) with respect to the Mirror axis (Parallel or Orthogonal). A main effect of Orientation emerged (χ2(1, 57) = 38.572, p < 0.0001). As shown in Figure 9, participants more frequently positioned the shapes with their internal axis of symmetry orthogonal with respect to the mirror axis rather than parallel to it (EST = 3.434, SE = 0.516, z-ratio = 6.657, p < 0.0001, d = 0.882). This means that they chose a configuration that made the opposite orientation of the two shapes evident.
A further GLMM was conducted to ascertain whether, in cases in which the two shapes pointed in a direction which was orthogonal to the mirror, the participants more frequently drew two shapes pointing away from the mirror axis (i.e., a divergent configuration) or two shapes pointing towards the mirror axis (i.e., a convergent configuration). No significant effect of Convergent/Divergent Orientation emerged, either as a main effect (χ2(1, 43) = 1.490, p < 0.222), or interacting with Drawing, (χ2(1, 43) = 0.043, p = 0.835).
(III) Associations between verbal and iconic descriptions
We wondered whether there was an association between the descriptions given in answer to question 1 or selected from among alternatives in question 4 and the drawings. In particular, we wished to determine whether definitions which made reference exclusively to identicalness were associated with drawings showing shapes that maximized identicalness and minimized opposition (i.e., perfectly symmetrical shapes, i.e., Sym) and, conversely, definitions that mentioned an opposition component were associated with drawings showing asymmetrical shapes (i.e., Asym 1 and Asym 2).
We created a new three level variable labelled Iconic Pair to further classify the shapes in the drawings: (1) both shapes symmetrical (i.e., Sym); (2) both shapes asymmetrical (i.e., Asym 1 or Asym 2) and (3) mixed, i.e., one symmetrical (i.e., Sym) and the other asymmetrical (i.e., Asym 1 or Asym 2).
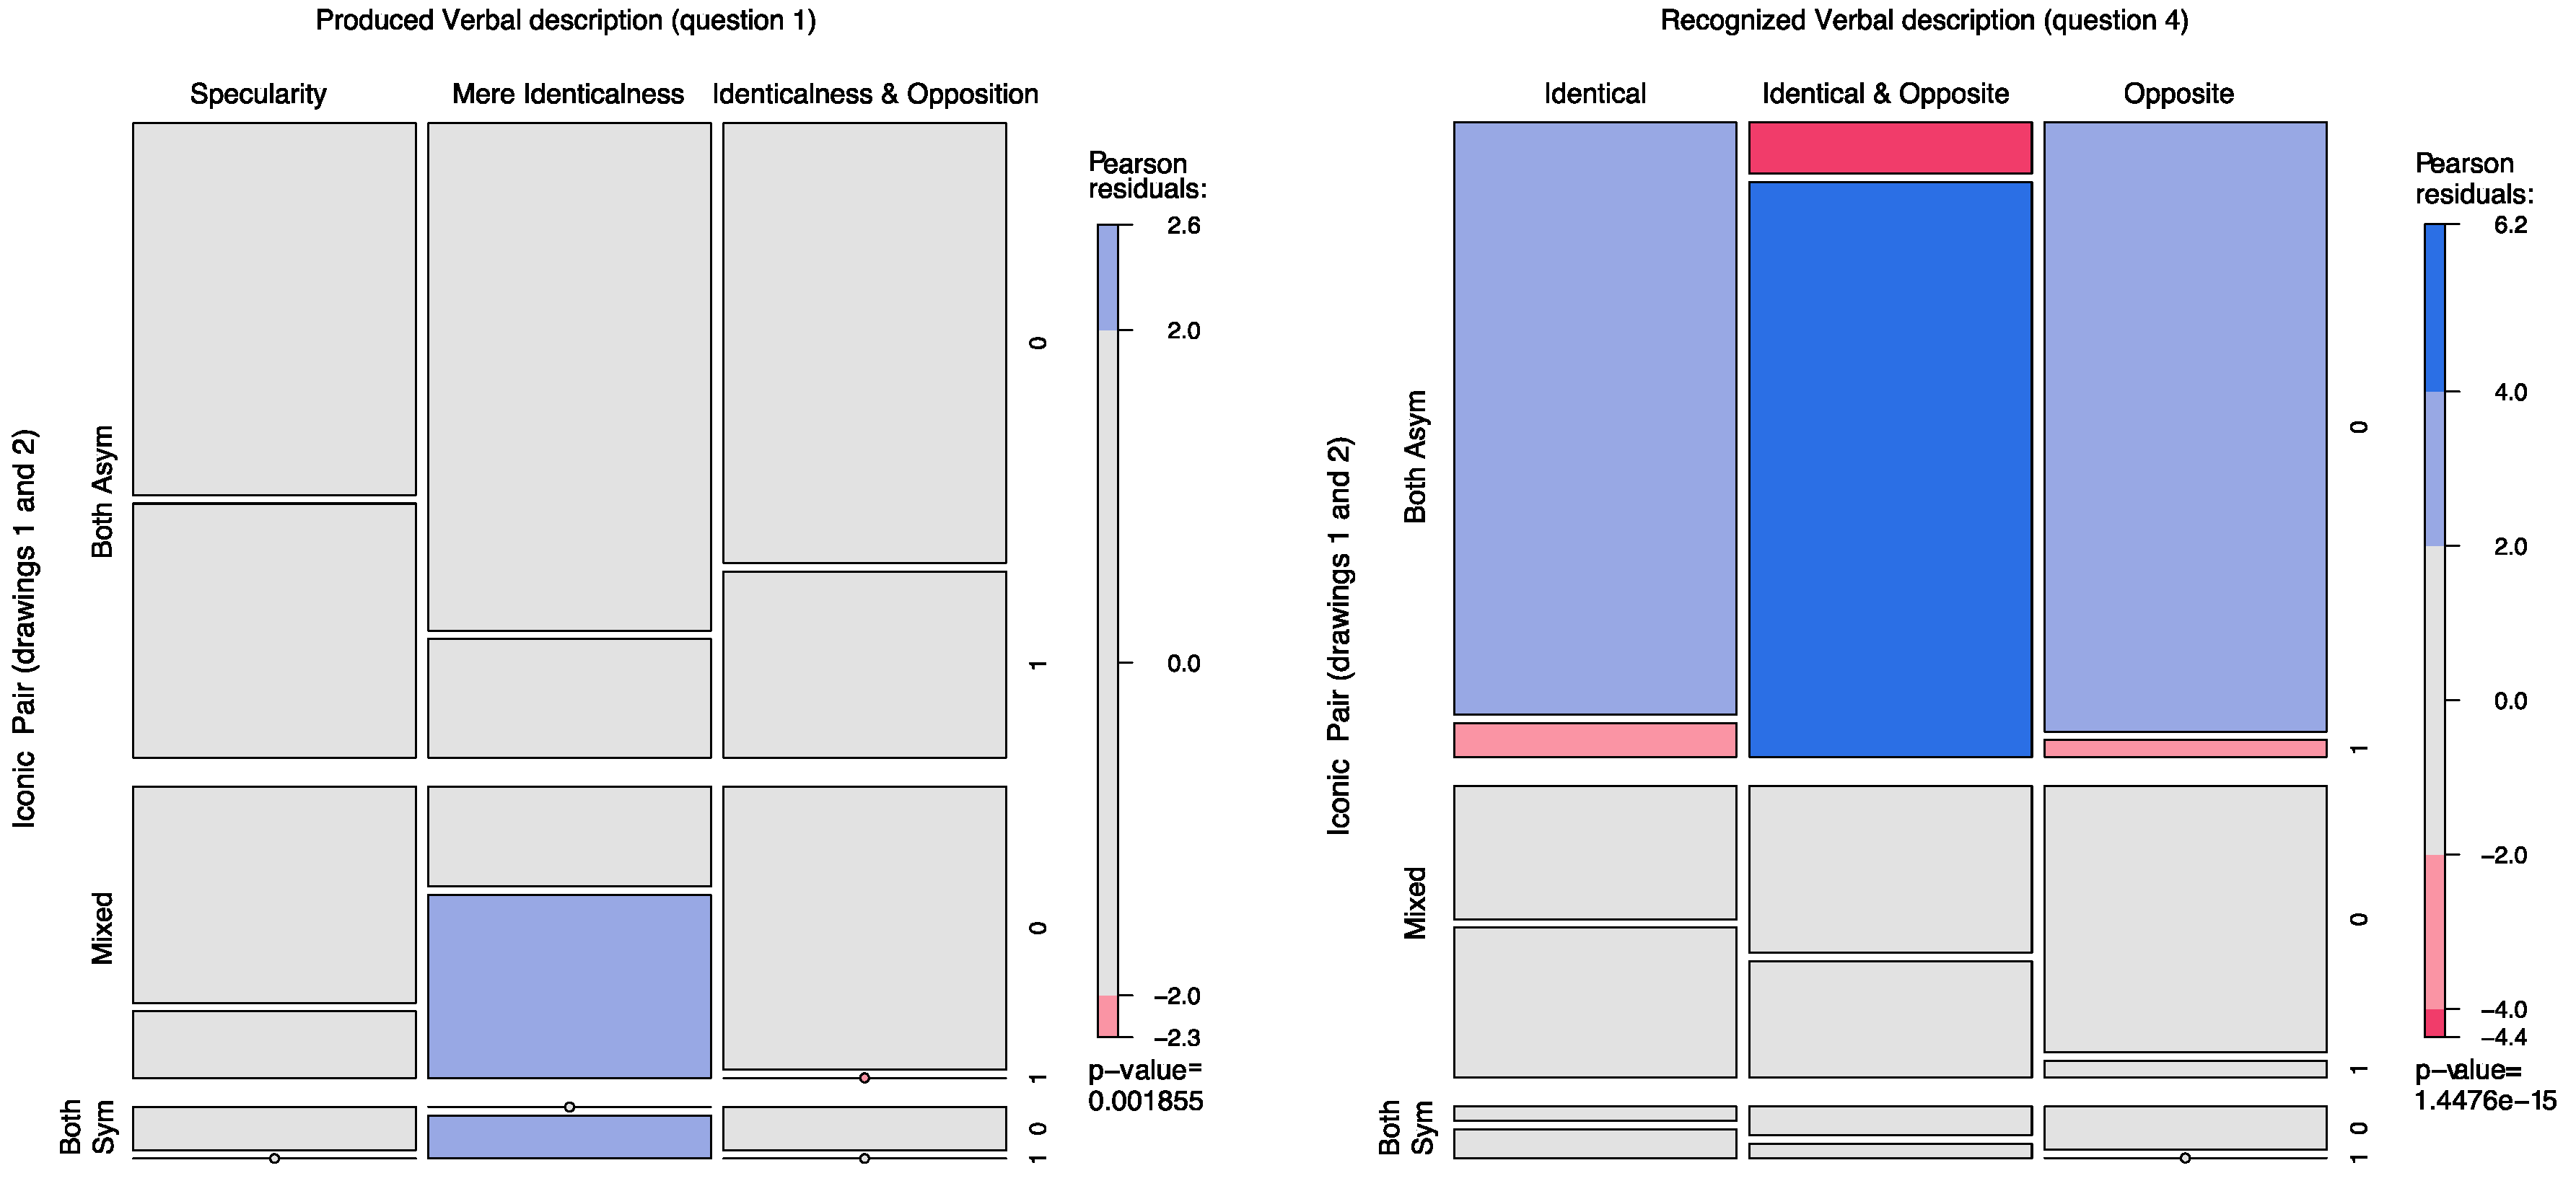
A first GLMM was carried out to determine whether there was any association between Iconic Pair levels and the responses to question 1 which had been re-coded according to three Categories: responses referring exclusively to identicalness (i.e., category b in Table 1); responses referring explicitly to Opposition (i.e., categories e + f + g in Table 1) and responses generically referring to a specular configuration, without mentioning opposition (categories c and d in Table 1). The interaction between the response categories in question 1 and the three Iconic Pair levels turned out to be significant (χ2(4, 57) = 9.353, p = 0.05). A second GLMM was then carried out to assess any association between the Iconic Pair levels and the responses to question 4 (Identical; Identical and Opposite; Opposite). In this case, too, the interaction between the responses to question 4 and the Iconic Pair levels turned out to be significant (χ2(4, 57) = 27.312, p < 0.0001).
We used mosaic plots to represent the association between the two variables [76,77,78]. A mosaic plot represents the observed frequencies of a contingency table by means of the size of the tiles; the interaction between variables by means of the asymmetrical non-alignment of the tiles and the significance of the difference between observed and expected frequencies according to a specific model (in our case a log-linear model of independence between variables) by means of the color of the tiles. The color of the tiles corresponds to Pearson residuals and the bars to the right of each mosaic show which color corresponds to residuals greater than the cut-off points |2| (corresponding to α = 0.05).
As shown in Figure 10, in the mosaic plot on the left, the responses to question 1 that mentioned only identicalness were more frequently associated with iconic representations that used symmetrical shapes (either in both the 1st and the 2nd drawings or in one of the two). Similarly, as shown in the mosaic plot on the right, those responses to question 4 that mentioned only identicalness were less frequently associated with iconic representations that used asymmetrical shapes in both the 1st and the 2nd drawings. Conversely an association emerged between using asymmetrical shapes in both the first and second drawings and selecting Identical and Opposite as the most fitting description in question 4.
3. Study 2
Study 2 was designed to further test (by means of a comparison task) the hypothesis that the phenomenal evidence of symmetry is more aligned with a perception of opposition in addition to identicalness, as compared to identicalness alone. Participants were asked to choose which of the two matched configurations better represented their idea of symmetry.
Various types of configurations and pair comparisons were presented in order to prevent participants from responding strategically (demand characteristics). In some cases, there were two configurations, both of which only showed evidence of identicalness; in other cases there were configurations that both showed evidence of identicalness and opposition and in another case the match was between a configuration which only showed identicalness and a configuration which showed both identicalness and opposition. The latter case was critical as it enabled us to test our hypothesis. If identicalness and opposition are the two salient components underlying the perception of symmetry, then the pairs showing opposition should be chosen over those showing only identicalness.
3.1. Materials and Method
3.1.1. Participants
70 undergraduate students of Psychology and Education at the University of Verona, Italy (mean age 23.8; 45 females; 25 males).
3.1.2. Materials
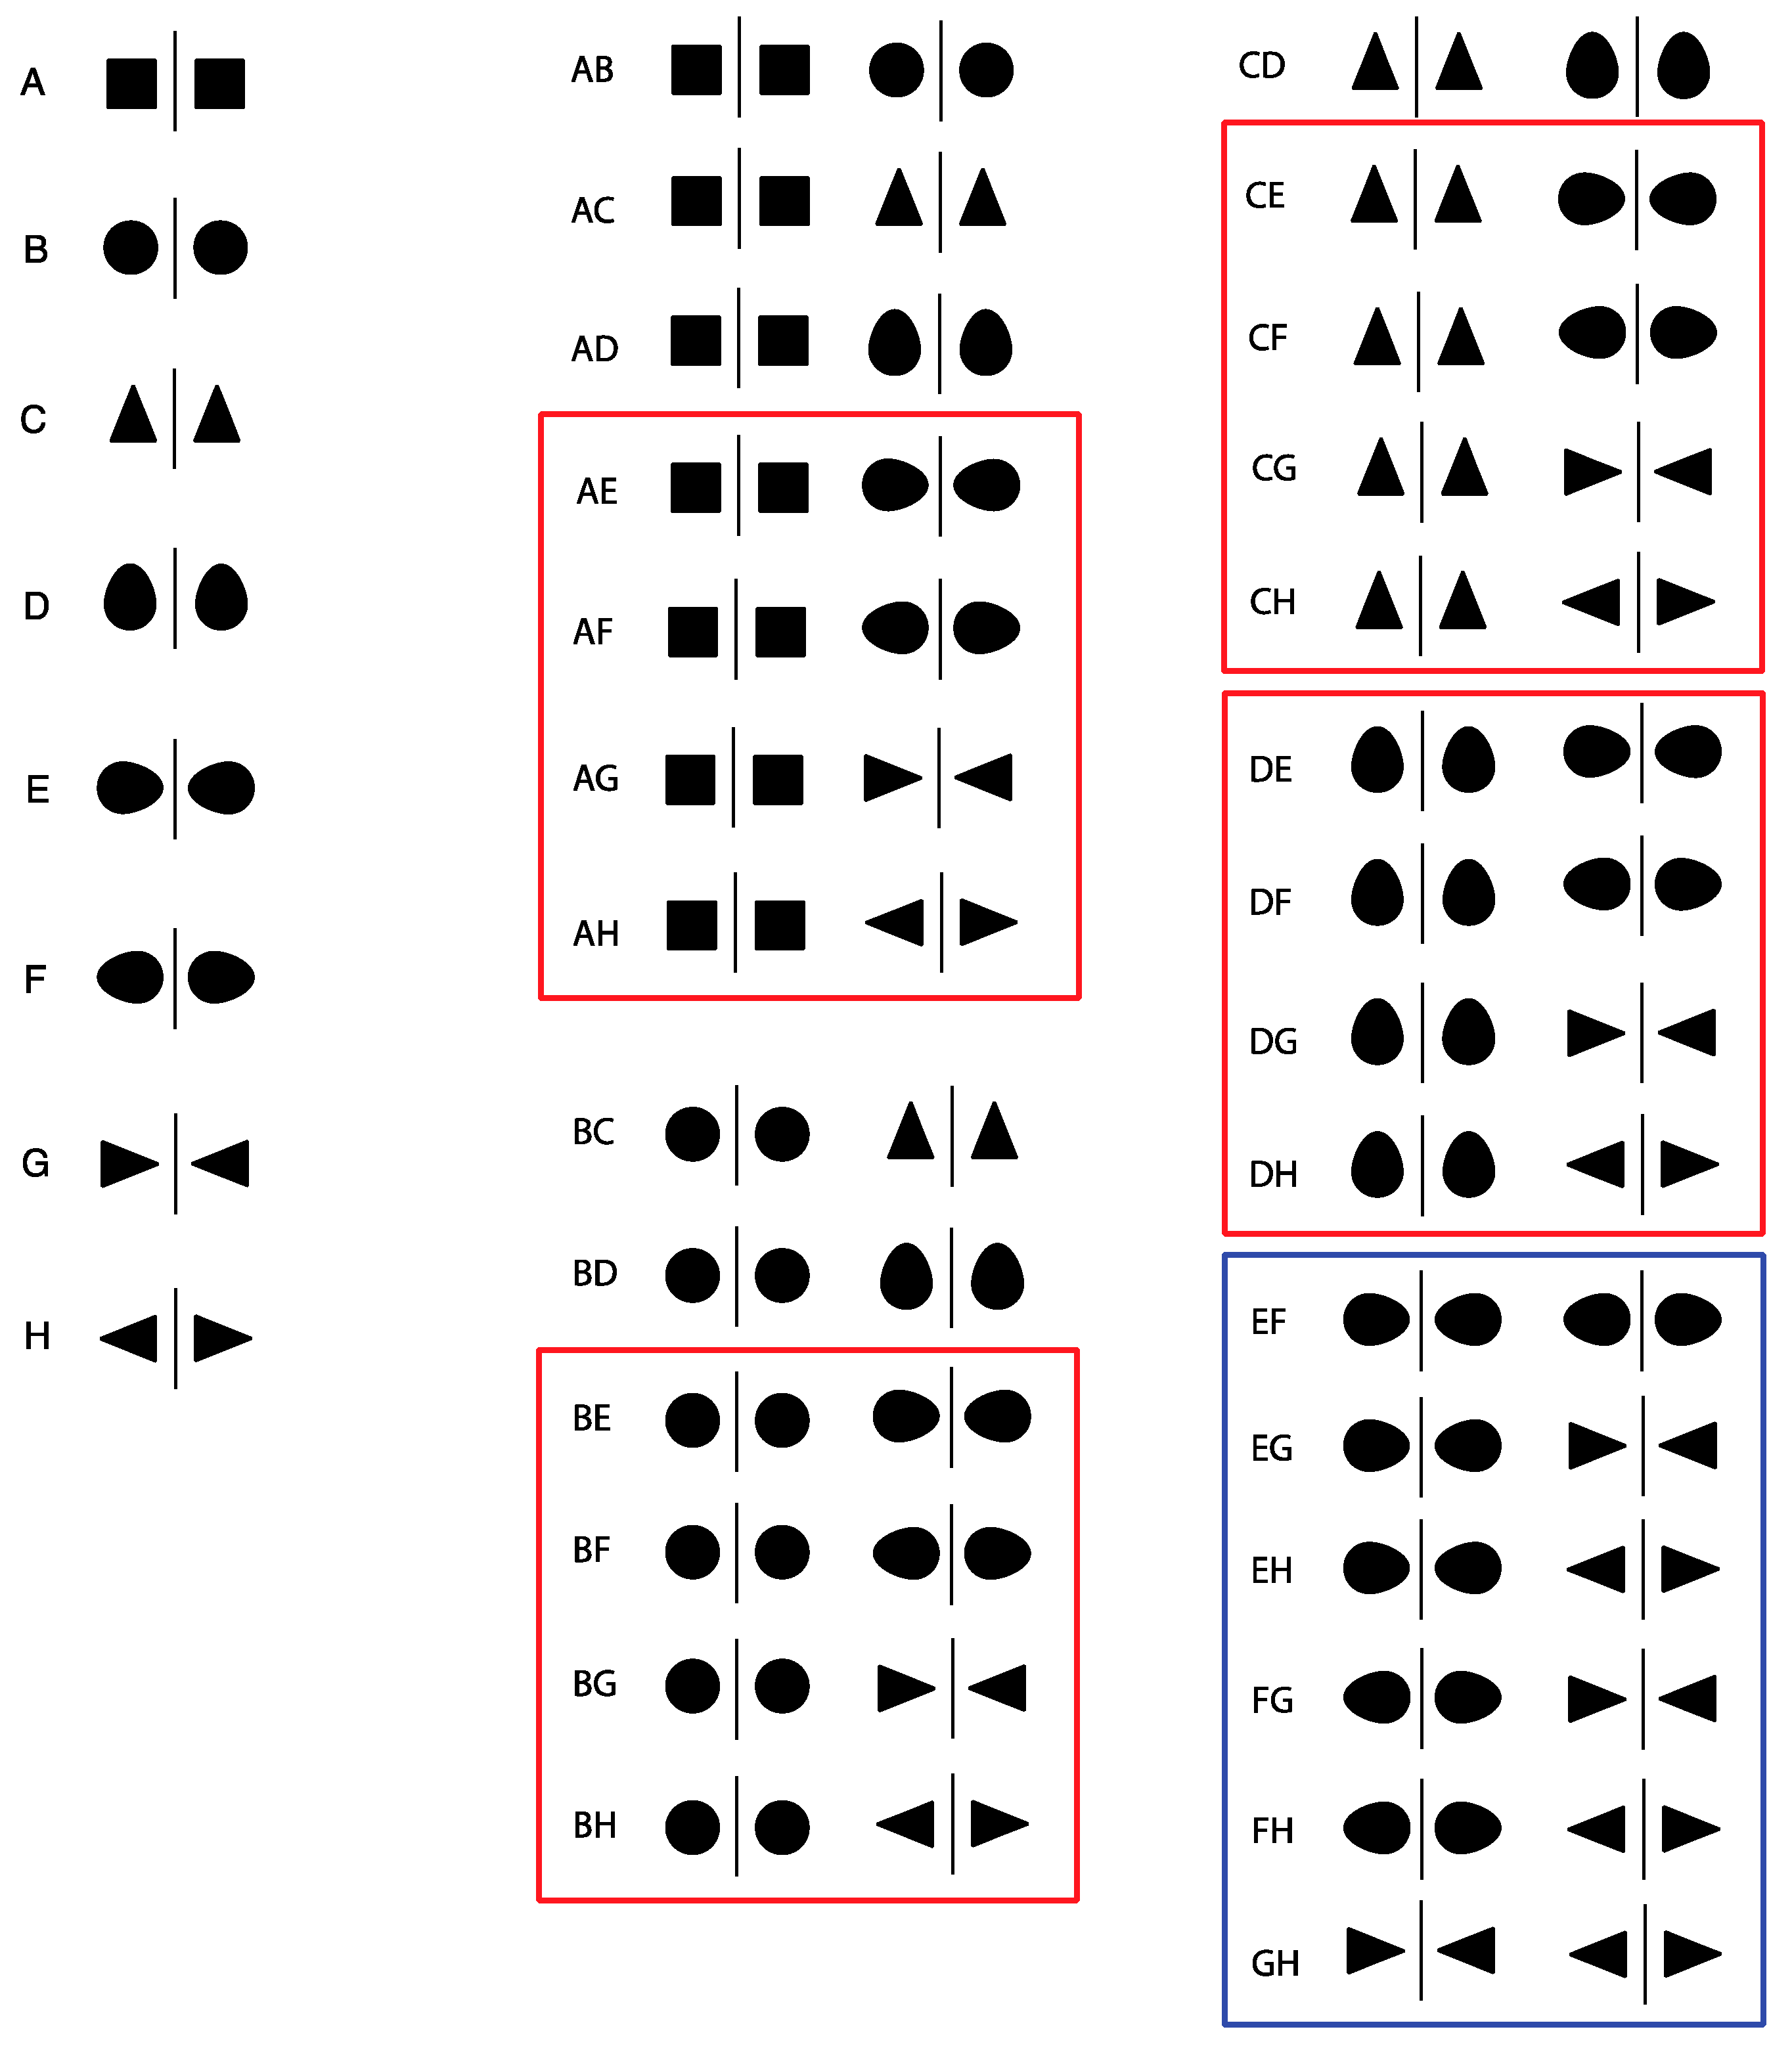
A 36-page booklet with each page containing two different configurations each consisting of a pair of shapes (the order of the pairs was randomized between participants and the order of the two configurations forming each pair was counterbalanced). Eight of the 36 pairs presented were catch trials and these consisted of a symmetrical configuration and a non-symmetrical configuration. They were introduced to check participants’ understanding of the task, but were then excluded from data analysis. The other pairs are shown in Figure 11.
3.1.3. Procedure
The experiment was conducted at the beginning of a class on a topic which was totally unrelated to the issue. Participants were seated 6 seats apart to prevent them from influencing each other. Each participant received a booklet. They were asked to choose which of two matched configurations they considered the best fit to their idea of a “symmetrical configuration”. They were told to start from the first page and move to the next one only after having completed the previous page. There were no time limits. All of the participants took less than 10 min to complete the task.
3.1.4. Statistical Analysis
The responses were analyzed using the Thurston Case V scaling (package “psych” [79]) and Generalized Mixed effect Models (GLMM).
3.1.5. Results
Figure 12 shows the scaling of the configurations based on a paired comparison model (goodness of fit of the model = 0.98). The results of the scaling are in clear agreement with the hypothesis; the configurations showing identicalness and opposition were generally preferred as representatives of symmetry as compared to configurations showing only identicalness.
Two further analyses were conducted on two subsets of the original data in order to analyze whether the perception of symmetry was preferentially associated with divergent configurations or convergent configurations or whether there was no difference between the two. A first GLMM (binomial family, with Participants and Stimulus pair as Random effects) was performed on the subset of stimuli with red borders in Figure 10 which consist of a configuration showing identicalness and another showing identicalness and opposition in a convergent pattern (i.e., AE, AG, BE, BG, CE, CG, DE, DG in Figure 10) as compared to a configuration showing identicalness and another showing identicalness and opposition in a divergent pattern (i.e., AF, AH, BF, BH, CF, CH, DF, DH in Figure 10). No significant difference emerged (χ2(1, 70) = 1.861, p = 0.172). It should be noted that participants were not directly asked to choose between a convergent configuration versus a divergent configuration but between a pattern showing identicalness and a pattern showing opposition (either divergent or convergent).
Conversely, when the participants were presented with the subset of stimuli in the blue border in Figure 10 (i.e., EF, EH, FG, GH) they were asked to make a forced choice between a divergent configuration and a convergent configuration. The GLMM performed on the responses to this set of stimuli revealed a significant effect of Orientation (χ2(1, 70) = 7.422, p = 0.006). Convergent patterns were selected more frequently than divergent patterns (EST = 0.536; SE = 0.197; z-ratio = 2.724; p = 0.006; d = 0.326).
4. Discussion
The study aimed to investigate adults’ naïve implicit and explicit idea of symmetry by means of various tasks. We started by studying the verbal definitions of “symmetrical configuration” provided by the participants. They rarely (3%) referred to the type of transformation that is usually presented as an example of symmetry in geometry textbooks, i.e., a point-by-point correspondence (see Figure 1) or a rotation around an axis of symmetry. It should be noted that demonstrating that two symmetrical objects correspond by rotating one object on a 3D dimension around the axis of symmetry in order to make it match the other, is a shortcut that works specifically for geometry on a plane. We cannot exclude the possibility that the participants (n = 12/105) who explicitly mentioned a coincidence between the two figures in response to question 1 were thinking in terms of this type of rotational transformation. However, since they did not explicitly state this, it cannot be taken for granted that this was the case.
The participants usually described symmetry in terms of an overall relationship of identicalness (cited in around 68% of the responses, see Table 1, b + d + f + g) or a mirror reflection (cited in around 35% of the total number of responses, see Table 1, c + d + g). Opposition was mentioned in less than 20% of the total number of responses (see Table 1, e + f + g). These findings indicate that the relationship which is perceptually evident between two shapes is a salient aspect of adults’ idea of symmetry (and that people refer to this rather than to geometry), but opposition seems not to be a salient aspect per se. One could argue that the participants in our study who mentioned the mirror structure in response to question 1 might have been thinking precisely of the oppositional component which characterizes mirror reflections. Again, this is not something that we can take for granted. What is clear is that, when in question 4, Study 1, the participants were asked to select which of three definitions represented the best description of symmetry, only 1/3 of them chose the reference to mere identicalness. The majority (2/3) preferred “identical and opposite” as the most fitting definition. This last finding is also in line with the results of the analyses of the drawings done by the participants which in the majority of cases (around 80%) used asymmetrical shapes rather than perfectly symmetrical shapes, i.e., their drawings clearly showed a reversed orientation of the two shapes around a mirror axis rather than configurations that masked this oppositional component. When the shapes had one internal axis of symmetry, the opposition element was evident, i.e., the participants had positioned the “Asym 1” shapes so that their internal axis of symmetry was orthogonal to the mirror axis, rather than parallel to the mirror axis which would have made their identicalness more evident. There was also a strong preference for symmetry around a vertical axis. This result confirms a finding which has been discussed at length in previous literature (see the introduction) and provides evidence that this preference can be extended not only to the visual detection of symmetry or to aesthetic preferences but also to the prototypical representation of symmetry that people have in mind.
In study 2, participants were presented with images and were asked to select the one which fit in better with their idea of symmetry. Again, a strong preference for configurations showing opposition emerged. However, it is not clear whether the participants’ perception of symmetry tended more towards convergent or divergent patterns, as defined by the orientation of the shapes, i.e., whether they pointed towards or away from the mirror axis. There were no indications of this in the configurations drawn in study 1 and only a partial preference for convergent configurations emerged in study 2 from an analysis of the pair comparisons which showed a direct match between convergent and divergent patterns.
In conclusion, the studies presented in this paper support the conclusion that identicalness is an important component in people’s naïve idea of symmetry, but it does not suffice: opposition complements it.
Potential Impact and Limitations of the Study
Both of the studies presented in this paper focus on configurations formed of two shapes with symmetry defining the relationship between them, rather than on configurations formed of one shape in which the symmetry is determined by the relationship between individual parts of the shape. We know from previous literature that symmetry is not detected in exactly the same way when it is a “within-object” relationship as compared to a “between-objects” relationship [43,44,80]. We also know that this distinction is not simply related to whether one shape/object or more shapes/objects are involved since, for instance, in band patterns, grouping establishes phenomenal motifs that parse the band in sub-unities thus transforming what, locally defined, are between-objects relationships into within-object relationships [81]. Our decision to concentrate on a specific type of configuration (formed of two shapes) was motivated by our interest in exploring symmetry as a specific visual relationship between two objects. This was the specific aim of the research and the generalizability of the results discussed here are of course limited to this area.
Despite this, the results of this research provide new evidence regarding the existence of a qualitative aspect which is inherent to the structure of what people think of as “symmetrical” and that it makes sense, therefore, to consider the issue of how well a configuration represents “symmetry”. This is not related to its geometrical definition or to aesthetic considerations but rather regards structural aspects related to the perceived relationship between two shapes. From a geometrical point of view, there are various different types of symmetry (e.g., central, bilateral etc.) and there may be various symmetrical axes but this does not make the property of “being symmetrical” qualitatively gradable. On the other hand, studies on aesthetic judgments of symmetry can assess and measure to what extent people appreciate a particular shape or configuration (e.g., [82,83,84,85]) and this goes to show that symmetrical patterns can be graded from a qualitative point of view based on the observer’s assessment of pleasantness. The studies presented in this paper, however, take a different approach. They show that a configuration may be perceived as being a better or worse exemplar of symmetry on the basis of some relational features which are evident, namely, opposition and identicalness. Our findings add to previous results which have shown, for instance, that the perception of symmetry is sensitive to aspects such as changes in the spatial arrangement of motifs, even when these alterations do not modify their formal classification [86].
One might raise the issue of whether the participants in study 2 chose images that made both identicalness and opposition evident since they were more salient (i.e., less redundant) and therefore attracted their attention. This would be interesting to investigate in the future. Since salience is closely linked to perceptual organization (e.g., [48]) and salient stimuli tend to be associated with beauty (e.g., [87]), one might also raise the question of whether the participants selected configurations which showed both identicalness and opposition because those were more aesthetically pleasing. However, we have no reason to believe that they had understood that the task involved indicating a preference. In effect, this issue is more promising when considered in the light of whether these “prototypical features” influence judgments of beauty and pleasantness. For example, it might be interesting to test whether judgments of beauty are associated with a specific balance between opposition and identicalness or with extreme evidence of one of these two elements or whether they are totally independent from these relational aspects.
Lastly, another issue concerns the potential influence of literacy. It has been shown that the spontaneous inclination to identify an image as the same, regardless of its left-right orientation (a phenomenon known as “mirror invariance” or “mirror generalization”), is inhibited by literacy. While mirror generalization is spontaneously found in infants (for a review, see [88]), in a same-different task involving mirror-reflected pairs, literate adults familiar with the Latin alphabet found it difficult to answer “same” to mirror-reversed stimuli than illiterate adults [89,90,91]. This has been explained in terms of the acquisition of a written system that incorporates mirrored letters (e.g., b and d), in the sense that this enhances sensitivity in the discrimination of lateral mirror-images (see also [92]). The participants in our study were all adults familiar with the Latin alphabet. A cross-cultural study in order to verify whether the sensitivity to contrasts in orientation which is a characteristic of the idea of symmetry according to our study is related to literacy or is a more general phenomenon may be worthwhile.
Acknowledgments
We thank Paola Boccacci for help in data collection (study 1).
Author Contributions
Ivana Bianchi, Marco Bertamini and Ugo Savardi conceived and designed the experiments; Ivana Bianchi and Ugo Savardi performed the experiments; Ivana Bianchi and Roberto Burro analyzed the data; Ivana Bianchi, Marco Bertamini, Roberto Burro and Ugo Savardi wrote the paper.
Conflicts of Interest
The authors declare no conflict of interest.
References
- Wagemans, J. Detection of visual symmetries. Spat. Vis. 1995, 9, 9–32. [Google Scholar] [CrossRef] [PubMed]
- Treder, M.S. Behind the looking-glass: A review on human symmetry perception. Symmetry 2010, 2, 1510–1543. [Google Scholar] [CrossRef]
- Eisenman, R. Preference for symmetry and the rejection of complexity. Psychon. Sci. 1967, 8, 169–170. [Google Scholar] [CrossRef]
- Enquist, M.; Arak, A. Symmetry, beauty and evolution. Nature 1994, 372, 169–172. [Google Scholar] [CrossRef] [PubMed]
- Enquist, M.; Johnstone, R.A. Generalization and the evolution of symmetry preferences. Proc. R. Soc. B Biol. Sci. 1997, 264, 1345–1348. [Google Scholar] [CrossRef]
- Jacobsen, T.; Hofel, L. Descriptive and evaluative judgment processes: Behavioral and electrophysiological indices of processing symmetry and aesthetics. Cognit. Affect. Behav. Neurosci. 2003, 3, 289–299. [Google Scholar] [CrossRef]
- Chen, C.C.; Wu, J.H.; Wu, C.C. Reduction of image complexity explains aesthetic preference for symmetry. Symmetry 2011, 3, 443–456. [Google Scholar] [CrossRef]
- Makin, A.D.J.; Bertamini, M.; Jones, A.; Holmes, T.; Zanker, J.M. A gaze-driven evolutionary algorithm to study aesthetic evaluation of visual symmetry. i-Perception 2016, 7. [Google Scholar] [CrossRef] [PubMed]
- Pecchinenda, A.; Bertamini, M.; Makin, A.D.J.; Ruta, N. The pleasantness of visual symmetry: Always, never or sometimes. PLoS ONE 2014, 9, e92685. [Google Scholar] [CrossRef] [PubMed]
- Bertamini, M.; Makin, A. Brain activity in response to visual symmetry. Symmetry 2014, 6, 975–996. [Google Scholar] [CrossRef]
- Cattaneo, Z. The neural basis of mirror symmetry detection: A review. J. Cognit. Psychol. 2017, 29, 259–268. [Google Scholar] [CrossRef]
- Pornstein, M.H.; Krinsky, S.J. Perception of symmetry in infancy—The salience of vertical symmetry and the perception of pattern wholes. J. Exp. Child Psychol. 1985, 39, 1–19. [Google Scholar] [CrossRef]
- Tyler, C.W.; Hardage, L.; Miller, R.T. Multiple mechanisms for the detection of mirror symmetry. Spat. Vis. 1995, 9, 79–100. [Google Scholar] [CrossRef] [PubMed]
- Wenderoth, P. The salience of vertical symmetry. Perception 1994, 23, 221–236. [Google Scholar] [CrossRef] [PubMed]
- Wenderoth, P. The effects of dot pattern parameters and constraints on the relative salience of vertical bilateral symmetry. Vis. Res 1996, 36, 2311–2320. [Google Scholar] [CrossRef]
- Bianchi, I.; Burro, R.; Pezzola, R.; Savardi, U. Matching visual and acoustic mirror forms. Symmetry 2017, 9, 39. [Google Scholar] [CrossRef]
- Cattaneo, Z.; Vecchi, T.; Fantino, M.; Herbert, A.M.; Merabet, L.B. The effect of vertical and horizontal symmetry on memory for tactile patterns in late blind individuals. Atten. Percept. Psychophys. 2013, 75, 375–382. [Google Scholar] [CrossRef] [PubMed]
- Wagemans, J.; Vangool, L.; Dydewalle, G. Detection of symmetry in tachistoscopically presented dot patterns—Effects of multiple axes and skewing. Atten. Percept. Psychophys. 1991, 50, 413–427. [Google Scholar] [CrossRef]
- Wagemans, J. Characteristics and models of human symmetry detection. Trends Cognit. Sci. 1997, 1, 346–352. [Google Scholar] [CrossRef]
- Csatho, A.; van der Vloed, G.; van der Helm, P.A. Blobs strengthen repetition but weaken symmetry. Vis. Res. 2003, 43, 993–1007. [Google Scholar] [CrossRef]
- Csatho, A.; van der Vloed, G.; van der Helm, P.A. The force of symmetry revisited: Symmetry-to-noise ratios regulate (a) symmetry effects. Acta Psychol. 2004, 117, 233–250. [Google Scholar] [CrossRef] [PubMed]
- Dastani, M.; Scha, R. Languages for gestalts of line patterns. J. Math. Psychol. 2003, 47, 429–449. [Google Scholar] [CrossRef]
- Nucci, M.; Wagemans, J. Goodness of regularity in dot patterns: Global symmetry, local symmetry, and their interactions. Perception 2007, 36, 1305–1319. [Google Scholar] [CrossRef] [PubMed]
- Olivers, C.N.L.; Chater, N.; Watson, G.D. Holography does not account for goodness: A critique of van der Helm and Leeuwenberg (1996). Psychol. Rev. 2004, 11, 242–260. [Google Scholar] [CrossRef] [PubMed]
- Palmer, S.E. Symmetry, transformation, and the structure of perceptual systems. In Organization and Representation in Perception; Beck, J., Ed.; Lawrence Erlbaum Associates: Hillsdale, NJ, USA, 1982; pp. 95–144. [Google Scholar]
- Palmer, S.E. The psychology of perceptual organization: A transformational approach. In Human and Machine Vision; Beck, J., Hope, B., Rosenfeld, A., Eds.; Academic Press: New York, NY, USA, 1983; Volume 1, pp. 269–339. [Google Scholar]
- Vanderhelm, P.A.; Leeuwenberg, E.L.J. Accessibility—A criterion for regularity and hierarchy in visual-pattern codes. J. Math. Psychol. 1991, 35, 151–213. [Google Scholar] [CrossRef]
- VanderHelm, P.A.; Leeuwenberg, E.L.J. Goodness of visual regularities: A nontransformational approach. Psychol. Rev. 1996, 103, 429–456. [Google Scholar] [CrossRef]
- VanderHelm, P.A.; Leeuwenberg, E.L.J. A Better Approach to Goodness: Reply to Wagemans. Psychol. Rev. 1999, 106, 622–630. [Google Scholar] [CrossRef]
- VanderHelm, P.A.; Leeuwenberg, E.L.J. Holographic Goodness Is Not That Bad: Reply to Olivers, Chater, and Watson. Psychol. Rev. 2004, 111, 261–273. [Google Scholar] [CrossRef]
- Wagemans, J.; Van Gool, L.; Swinnen, V.; Van Horebeek, J. Higher-order structure in regularity detection. Vis. Res. 1993, 33, 1067–1088. [Google Scholar] [CrossRef]
- Wagemans, J. Toward a better approach to goodness: Comments on van der helm and leeuwenberg (1996). Psychol. Rev. 1999, 106, 610–621. [Google Scholar] [CrossRef]
- Makin, A.D.; Wright, D.; Rampone, G.; Palumbo, L.; Guest, M.; Sheehan, R.; Cleaver, H.; Bertamini, M. An electrophysiological index of perceptual goodness. Cereb. Cortex 2016, 26, 4416–4434. [Google Scholar] [CrossRef] [PubMed]
- Bianchi, I.; Savardi, U. The opposite of a figure. Gestalt Theory 2006, 4, 354–374. [Google Scholar]
- Bianchi, I.; Savardi, U. The Perception of Contraries; Aracne: Roma, Italy, 2008. [Google Scholar]
- Gati, I.; Tversky, A. Weighting Common and Distinctive Features in Perceptual and Conceptual Judgments. Cognit. Psychol. 1984, 16, 341–370. [Google Scholar] [CrossRef]
- Gati, I.; Tversky, A. Recall of common and distinctive features of verbal and pictorial stimuli. Mem. Cognit. 1987, 15, 97–100. [Google Scholar] [CrossRef] [PubMed]
- Goldmeier, E. Similarity in visually perceived forms. Psychol. Issues 1972, 29, 1–131. [Google Scholar]
- Medin, D.L.; Goldston, R.L.; Gentner, D. Similarity involving attributes and relations: Judgments of similarity and difference are not inverses. Psychol. Sci. 1990, 1, 64–69. [Google Scholar] [CrossRef]
- Rock, I. Orientation and Form; Academic Press: New York, NY, USA, 1973. [Google Scholar]
- Sattath, S.; Tversky, A. On the Relation between Common and Distinctive features Models. Psychol. Rev. 1987, 94, 16–22. [Google Scholar] [CrossRef]
- Tversky, A. Features of similarity. Psychol. Rev. 1977, 84, 327–352. [Google Scholar] [CrossRef]
- Baylis, G.C.; Driver, J. Obligatory edge assignment in vision: The role of figure and part segmentation in symmetry detection. J. Exp. Psychol. Hum. Percept. Perform. 1995, 21, 1323–1342. [Google Scholar] [CrossRef]
- Koning, A.; Wagemans, J. Detection of symmetry and repetition in one and two objects: Structures versus strategies. Exp. Psychol 2009, 56, 5–17. [Google Scholar] [CrossRef] [PubMed]
- Weyl, H. Symmetry; Princeton University Press: Princeton, NJ, USA, 2016. [Google Scholar]
- Kubovy, M. Phenomenology, psychological. In Encyclopedia of Cognitive Science; Nadel, L., Ed.; Macmillan: Hampshire, UK, 2002; pp. 579–586. [Google Scholar]
- Thinés, G.; Costall, A.; Butterworth, G. Michotte’s Experimental Phenomenology of Perception, 2nd ed.; Routledge: Oxford, UK, 2015. [Google Scholar]
- Wagemans, J.; Elder, J.H.; Kubovy, M.; Palmer, S.E.; Peterson, M.A.; Singh, M. A Century of Gestalt Psychology in Visual Perception I. Perceptual Grouping and Figure-Ground Organization. Psychol. Bull. 2012, 138, 1172–1217. [Google Scholar] [PubMed]
- Wagemans, J.; Feldman, J.; Gepshtein, S.; Kimchi, R.; Pomerantz, J.R.; van der Helm, P.A.; van Leeuwen, C. A century of Gestalt psychology in visual perception: II. Conceptual and theoretical foundations. Psychol. Bull. 2012, 138, 1218–1252. [Google Scholar] [CrossRef] [PubMed]
- Croucher, C.J.; Bertamini, M.; Hecht, H. Naïve optics: Understanding the geometry of mirror reflections. J. Exp. Psychol. Hum. 2002, 28, 546–562. [Google Scholar] [CrossRef]
- Bianchi, I.; Savardi, U. What fits into a mirror: Naïve beliefs about the field of view. J. Exp. Psychol. Hum. Percept. Perform. 2012, 38, 1144–1158. [Google Scholar] [CrossRef] [PubMed]
- Kaiser, M.K.; Proffitt, D.R.; McCloskey, M. The development of beliefs about falling objects. Percept. Psychophys. 1985, 38, 533–539. [Google Scholar] [CrossRef] [PubMed]
- Huber, S.; Krist, H. When is the ball going to hit the ground? Duration estimates, eye movements, and mental imagery of object motion. J. Exp. Psychol. Hum. Percept. Perform. 2004, 30, 431–444. [Google Scholar] [CrossRef] [PubMed]
- McCloskey, M.; Washburn, A.; Felch, L. Intuitive physics: The straight-down belief and its origin. J. Exp. Psychol. Learn. Mem. Cognit. 1983, 9, 636–649. [Google Scholar] [CrossRef]
- Shanon, B. Aristotelianism, newtonianism and the physics of the layman. Perception 1976, 5, 241–243. [Google Scholar] [CrossRef] [PubMed]
- Hecht, H.; Bertamini, M. Understanding projectile acceleration. J. Exp. Psychol. Hum. Percept. Perform. 2000, 26, 730–746. [Google Scholar] [CrossRef] [PubMed]
- McCloskey, M.; Caramazza, A.; Green, B. Curvilinear motion in the absence of external forces: Naïve beliefs about the motion of objects. Science 1980, 210, 1139–1141. [Google Scholar] [CrossRef] [PubMed]
- McAfee, E.A.; Proffitt, D.R. Understanding the surface orientation of liquids. Cognit. Psychol. 1991, 23, 483–514. [Google Scholar] [CrossRef]
- Sholl, M.J.; Liben, L.S. Illusory tilt and Euclidean schemes as factors in performance on the water-level task. J. Exp. Psychol. Learn. Mem. Cognit. 1995, 21, 1624–1638. [Google Scholar] [CrossRef]
- Yates, J.; Bessman, M.; Dunne, M.; Jertson, D.; Sly, K.; Wendelboe, B. Are conceptions of motion based on a naïve theory or on prototypes? Cognition 1988, 29, 251–275. [Google Scholar] [CrossRef]
- Gregory, R.L. Mirrors in Mind; Freeman Spektrum: New York, NY, USA, 1966. [Google Scholar]
- Gregory, R.L. Mirror reversals. In The Oxford Companion to the Mind; Gregory, R.L., Ed.; Oxford University Press: Oxford, UK, 1987; pp. 491–493. [Google Scholar]
- Hecht, H.; Bertamini, M.; Gamer, M. Naïve optics: Acting on mirror reflections. J. Exp. Psychol. Hum. Percept. Perform. 2005, 31, 1023–1038. [Google Scholar] [CrossRef] [PubMed]
- Muelenz, C.; Hecht, H.; Gamer, M. Testing the egocentric mirror-rotation hypothesis. Seeing Perceiving 2010, 23, 373–383. [Google Scholar] [CrossRef] [PubMed]
- Bianchi, I.; Savardi, U. Contrariety in plane mirror reflections. In The Perception and Cognition of Contraries; Savardi, U., Ed.; Mc-Graw Hill: Milan, Italy, 2009; pp. 113–128. [Google Scholar]
- Bianchi, I.; Savardi, U. Grounding naïve physics and optics in perception. Balt. Int. Yearb. Cognit. Log. Commun. 2014, 6. [Google Scholar] [CrossRef]
- Savardi, U.; Bianchi, I.; Bertamini, M. Naïve predictions of motion and orientation in mirrors: From what we see to what we expect reflections to do. Acta Psychol. 2010, 134, 1–15. [Google Scholar] [CrossRef] [PubMed]
- Bertamini, M.; Spooner, A.; Hecht, H. Naïve optics: Predicting and perceiving reflections in mirrors. J. Exp. Psychol. Hum. Percept. Perform. 2003, 29, 982–1002. [Google Scholar] [CrossRef] [PubMed]
- Bianchi, I.; Bertamini, M.; Savardi, U. Differences between predictions of how a reflection behaves based on the behaviour of an object, and how an object behaves based on the behaviour of its reflection. Acta Psychol. 2015, 161, 54–63. [Google Scholar] [CrossRef] [PubMed]
- Bianchi, I.; Savardi, U. The relationship perceived between the real body and the mirror image. Perception 2008, 37, 666–687. [Google Scholar] [CrossRef] [PubMed]
- Bianchi, I.; Savardi, U.; Burro, R.; Martelli, M.F. Doing the opposite to what another person is doing. Acta Psychol. 2014, 151, 117–133. [Google Scholar] [CrossRef] [PubMed] [Green Version]
- Bates, D.; Machler, M.; Bolker, B.M.; Walker, S.C. Fitting linear mixed-effects models using lme4. arXiv, 2015; arXiv:1406.5823. [Google Scholar]
- Lenth, R.V. Least-squares means: The R package lsmeans. J. Stat. Softw. 2016, 69, 1–33. [Google Scholar] [CrossRef]
- Kuznetsova, A.; Bruun, B.P.; Haubo, B.C.R. lmerTest: Tests in Linear Mixed Effects Models. R Package Version 2.0-33. 2016. Available online: https://CRAN.R-project.org/package=lmerTest (accessed on 3 December 2016).
- Cohen, J. Statistical Power Analysis for the Behavioral Sciences, 2nd ed.; Academic Press: New York, NY, USA, 1988. [Google Scholar]
- Friendly, M. Mosaic displays for multi-way contingency tables. J. Am. Stat. Assoc. 1994, 89, 190–200. [Google Scholar] [CrossRef]
- Friendly, M. Visualizing Categorical Data. SAS Institute: Cary, NC, USA, 2000. Available online: http://www.math.yorku.ca/SCS/vcd/ (accessed on 25 December 2000).
- Meyer, D.; Zeileis, A.; Hornik, K. The Strucplot framework: Visualizing multi-way contingency tables with vcd. J. Stat. Softw. 2006, 17, 1–48. [Google Scholar] [CrossRef]
- Ravelle, W. psych: Procedures for Personality and Psychological Research; Northwestern University: Evanston, IL, USA, 2017. [Google Scholar]
- Bertamini, M.; Friedenberg, J.D.; Kubovy, M. Detection of symmetry and perceptual organization: The way a lock-and-key process works. Acta Psychol. 1997, 95, 119–140. [Google Scholar] [CrossRef]
- Strother, L.; Kubovy, M. Perceived complexity and the grouping effect in band patterns. Acta Psychol. 2003, 114, 229–244. [Google Scholar] [CrossRef]
- Bertamini, M.; Makin, A.D.J.; Rampone, G. Implicit association of symmetry with positive valence, high arousal and simplicity. i-Perception 2013, 4, 317–327. [Google Scholar] [CrossRef]
- Cardenas, R.A.; Harris, L.J. Symmetrical decorations enhance the attractiveness of faces and abstract designs. Evol. Hum. Behav. 2006, 27, 1–18. [Google Scholar] [CrossRef]
- Eysenck, H.J.; Castle, M. Training in art as a factor in the determination of preference judgements for polygons. Br. J. Psychol. 1970, 61, 65–81. [Google Scholar] [CrossRef] [PubMed]
- Jacobsen, T.; Hofel, L. Aesthetic judgments of novel graphic patterns: Analyses of individual judgments. Percept. Mot. Skills 2002, 95, 755–766. [Google Scholar] [CrossRef] [PubMed]
- Kubovy, M.; Strother, L. The perception of band patterns: Going beyond geometry. In Embedded Symmetries, Natural and Cultural; Washburn, D., Ed.; Amerind Foundation and University of New Mexico Press: Albuquerque, NM, USA, 2004; pp. 19–26. [Google Scholar]
- Makin, A.D.J.; Pecchinenda, A.; Bertamini, M. Implicit affective evaluation of visual symmetry. Emotion 2012, 12, 1021–1030. [Google Scholar] [CrossRef] [PubMed]
- Erlikhman, G.; Strother, L.; Barzakov, I.; Caplovitz, G.P. On the Legibility of Mirror-Reflected and Rotated Text. Symmetry 2017, 9, 28. [Google Scholar] [CrossRef]
- Danziger, E.; Pederson, E. Through the looking glass: Literacy, writing systems and mirror image discrimination. Writ. Lang. Lit. 1998, 1, 153–169. [Google Scholar] [CrossRef]
- Kolinsky, R.; Verhaeghe, A.; Fernandes, T.; Mengarda, E.J.; Grimm-Cabral, L.; Morais, J. Enantiomorphy through the looking glass: Literacy effects on mirror-image discrimination. J. Exp. Psychol. Gen. 2011, 140, 210–238. [Google Scholar] [CrossRef] [PubMed]
- Pegado, F.; Nakamura, K.; Braga, L.W.; Ventura, P.; Nunes Filho, G.; Pallier, C.; Jobert, A.; Morais, J.; Cohen, L.; Kolinsky, R.; et al. Literacy breaks mirror invariance for visual stimuli: A behavioral study with adult illiterates. J. Exp. Psychol. Gen. 2014, 143, 887–894. [Google Scholar] [CrossRef] [PubMed]
- Borst, G.; Ahr, E.; Roell, M.; Houdé, O. The cost of blocking the mirror generalization process in reading: Evidence for the role of inhibitory control in discriminating letters with lateral mirror-image counterparts. Pysychon. Bull. Rev. 2015, 22, 228–234. [Google Scholar] [CrossRef] [PubMed]
Figure 1.
The point by point transformation underlying the geometry of mirror symmetry (around a vertical axis). “Take any line l perpendicular to E and any point p on l (…). Reflection in E is that mapping of space upon itself, S: p → p’, that carries the arbitrary point p into its mirror image p’ with respect to E” ([45], pp. 4–5).

Figure 2.
Some errors emerged in tasks which required participants to predict the location and direction of motion in a reflection: (a) when the “real” person moved parallel to a vertical mirror on a wall, many people expected her reflection to appear at the farther edge of the mirror walking towards the “real person”; (b,c) when the “real person” moved at an angle towards a mirror, some people expected the reflection to move along the same trajectory with an opposite orientation (b) or along the same trajectory but with an identical orientation (c).
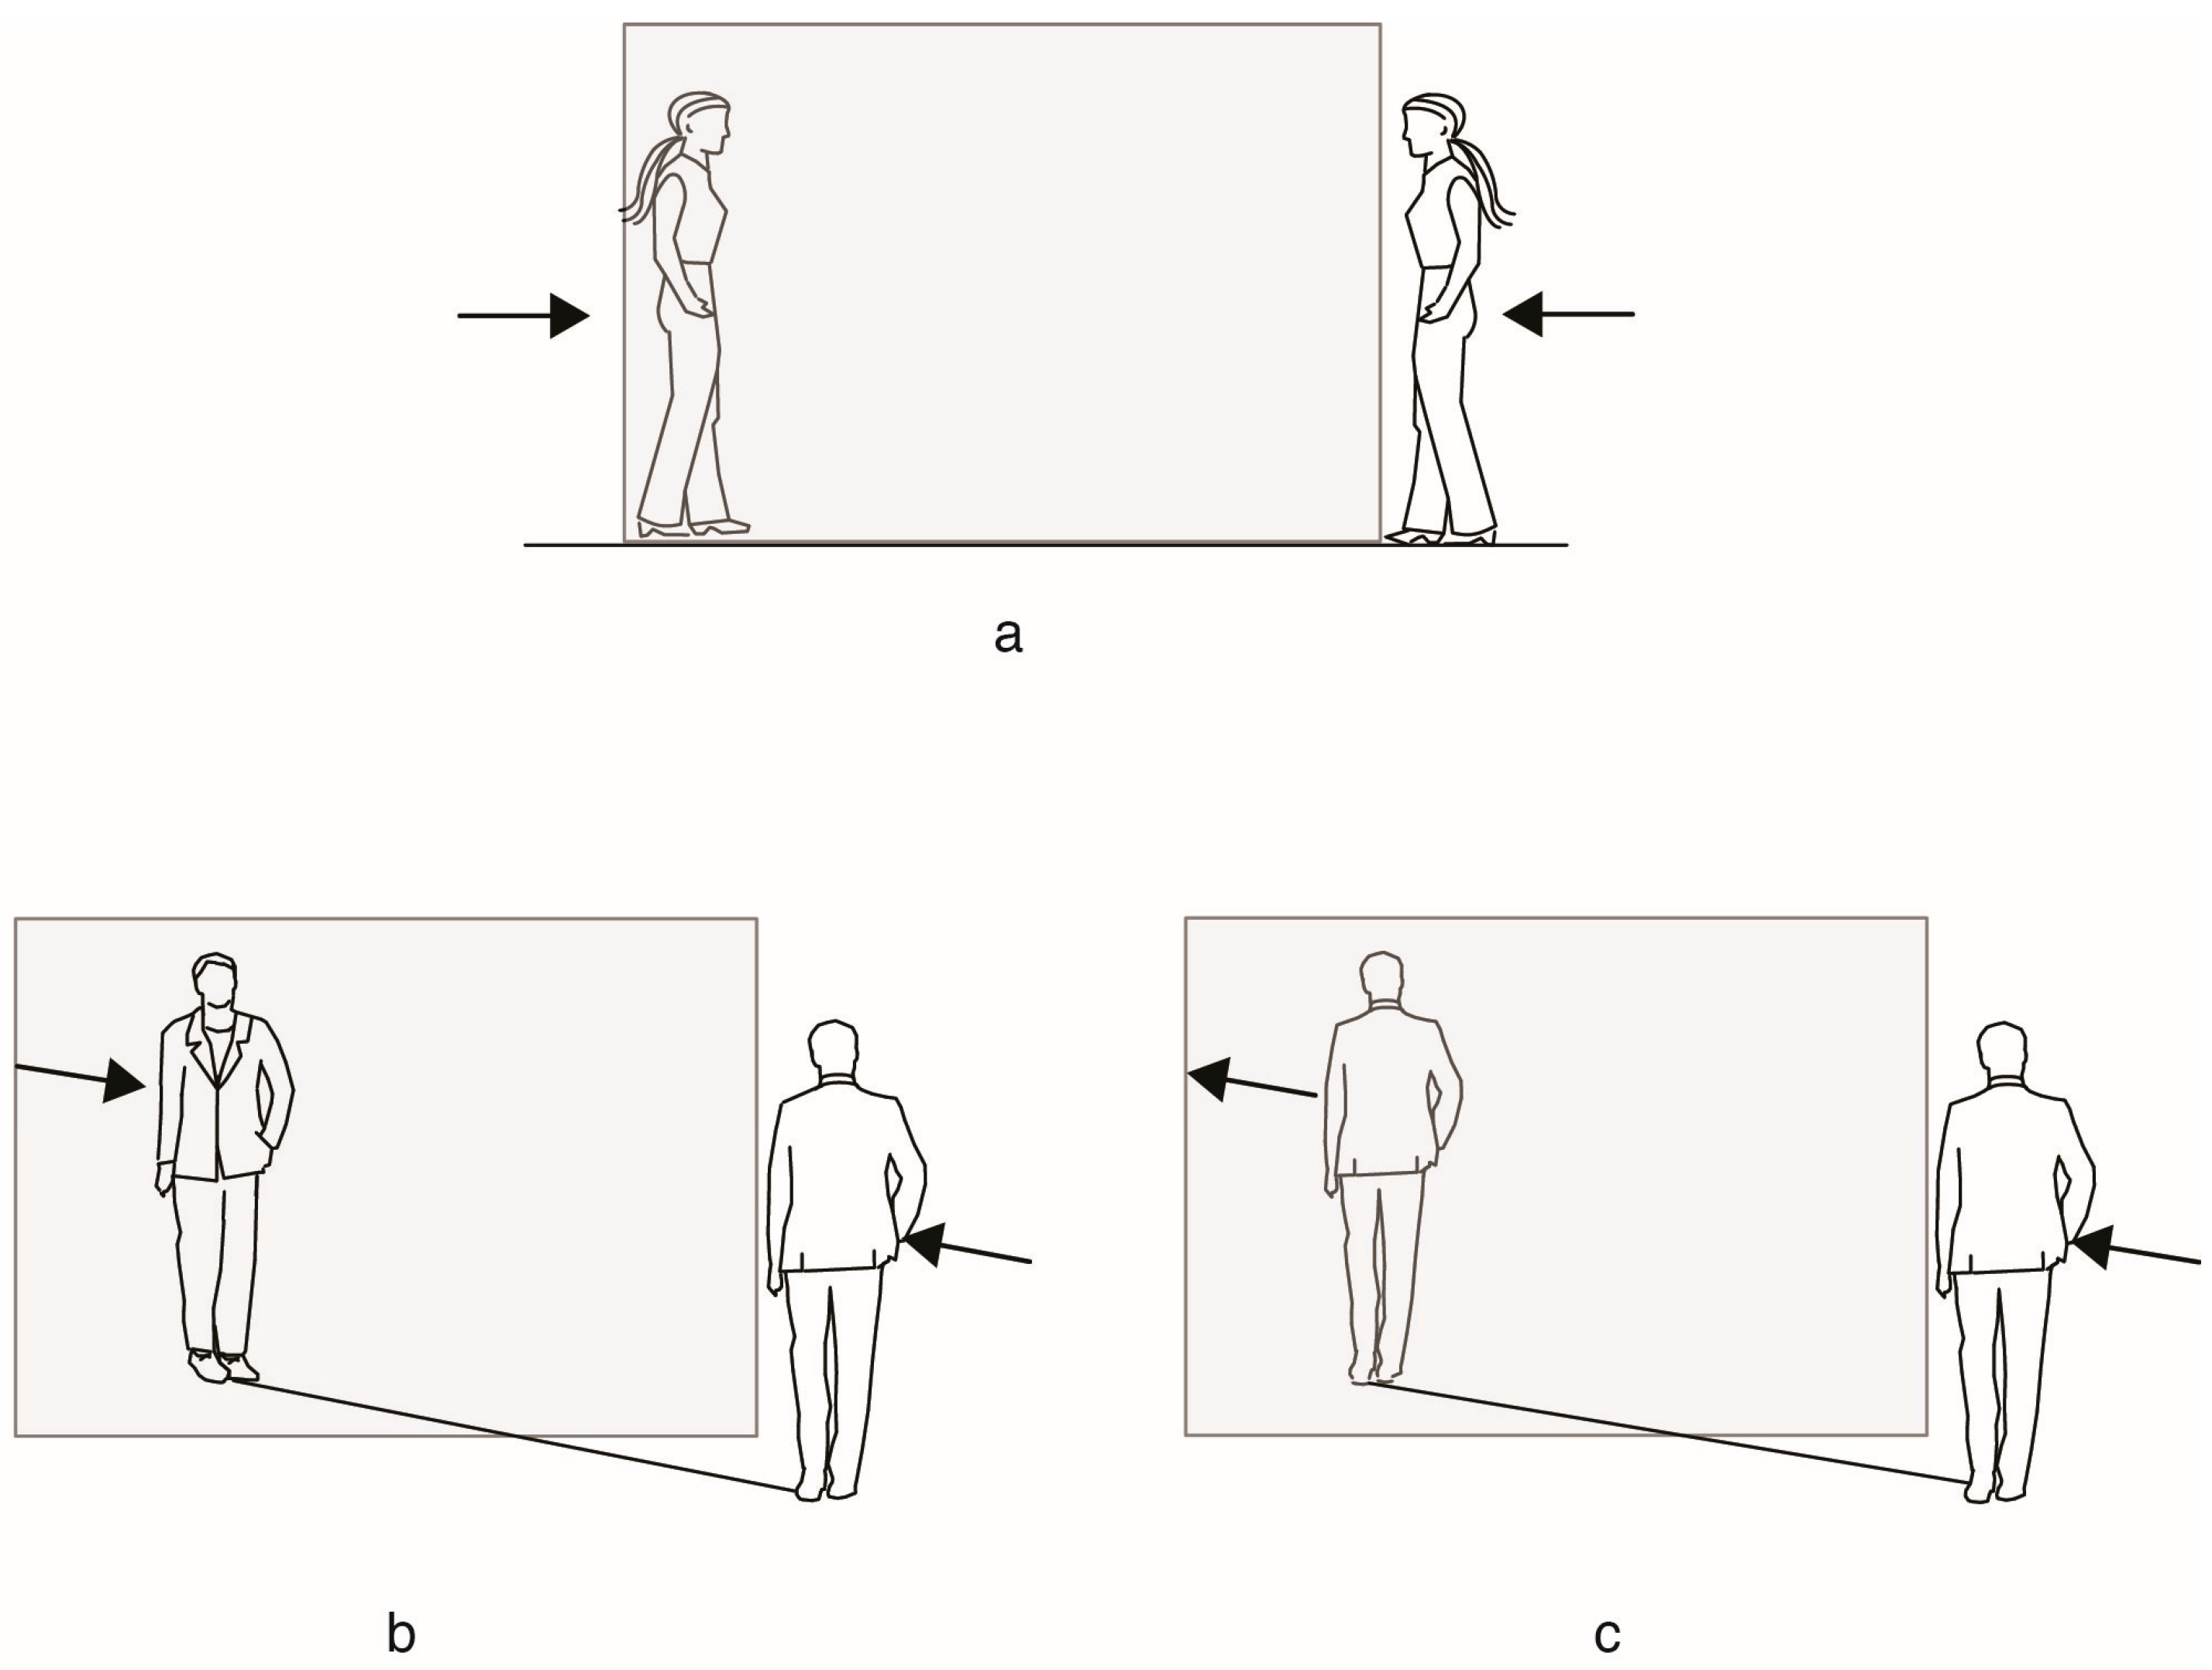
Figure 3.
Mirror symmetry applied to configurations that have different symmetrical structures. On the left: shapes which are symmetrical along the axis parallel to the mirror minimize the perception of contrariety (which remains relative only to the position of the shapes, i.e., one to the left and the other to the right of the mirror axis) and maximize perception of identicalness. On the right: shapes which are symmetrical only with respect to the axis which is orthogonal to the mirror axis but which are asymmetrical with respect to the axis parallel to the mirror axis make the opposite orientation easier to see (for farther explanations, see text).
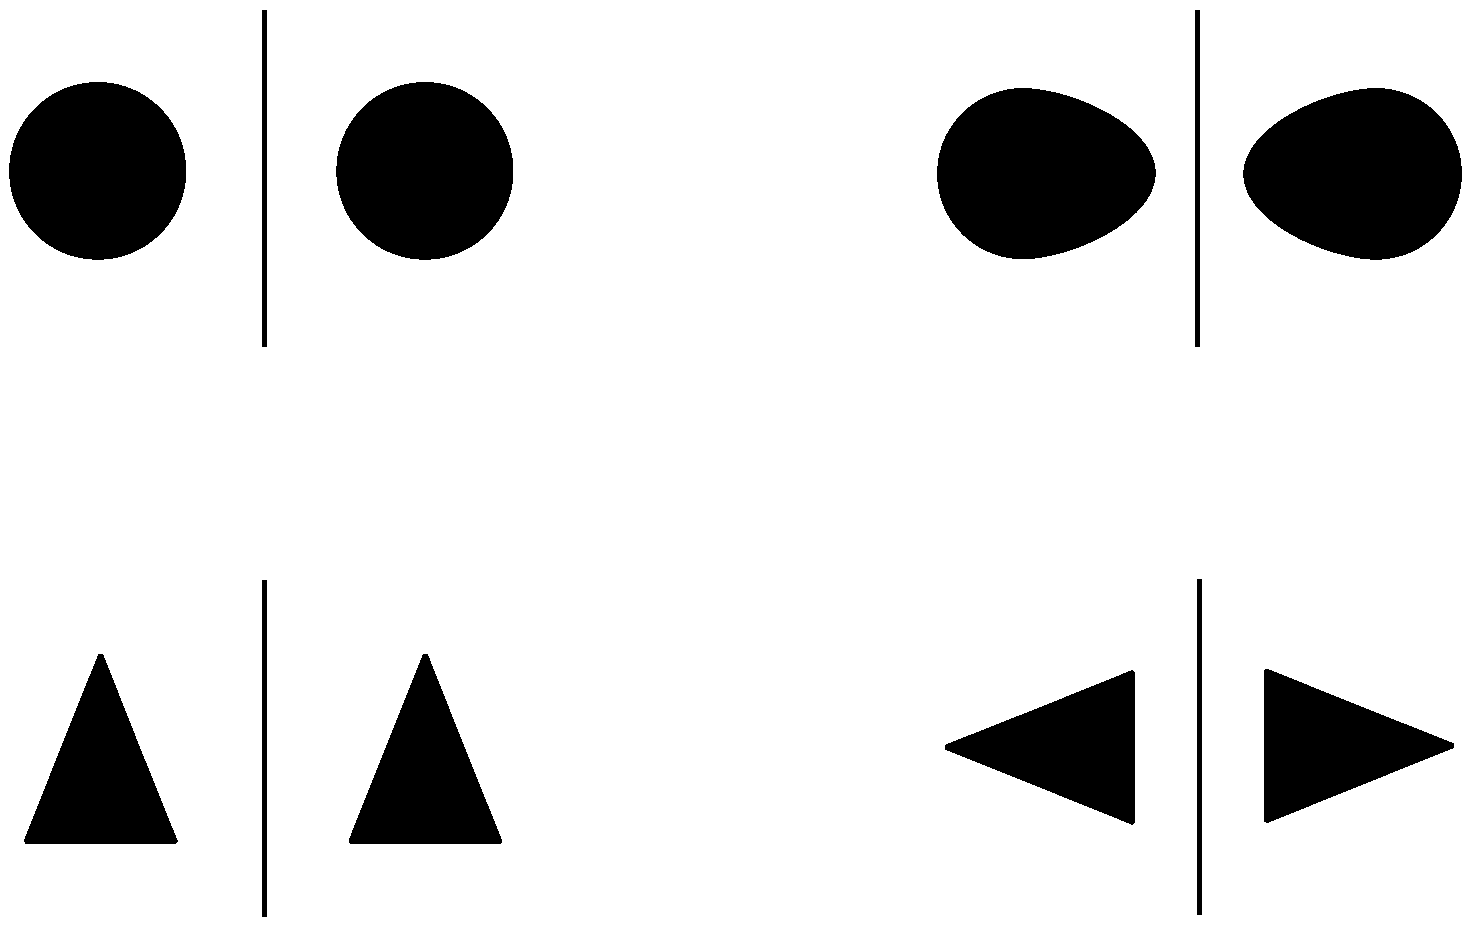
Figure 4.
The differences in perceptual impact of rotating the black shapes (original position: 0°) by, respectively, 20° and 90° angles with respect to the “mirror axis” (the solid vertical line). The dashed lines indicate the two internal orthogonal symmetry axes. The shapes in the first row (Sym) are symmetrical with respect to both their internal axes (indicated by small dashes); the shapes in the second row (Asym 1) are symmetrical with respect to one axis (small dashes) and asymmetrical with respect to the other axis (large dashes) and the shapes in the third row (Asym 2) are asymmetrical with respect to both internal axes (large dashes). For a further explanation, see the text.
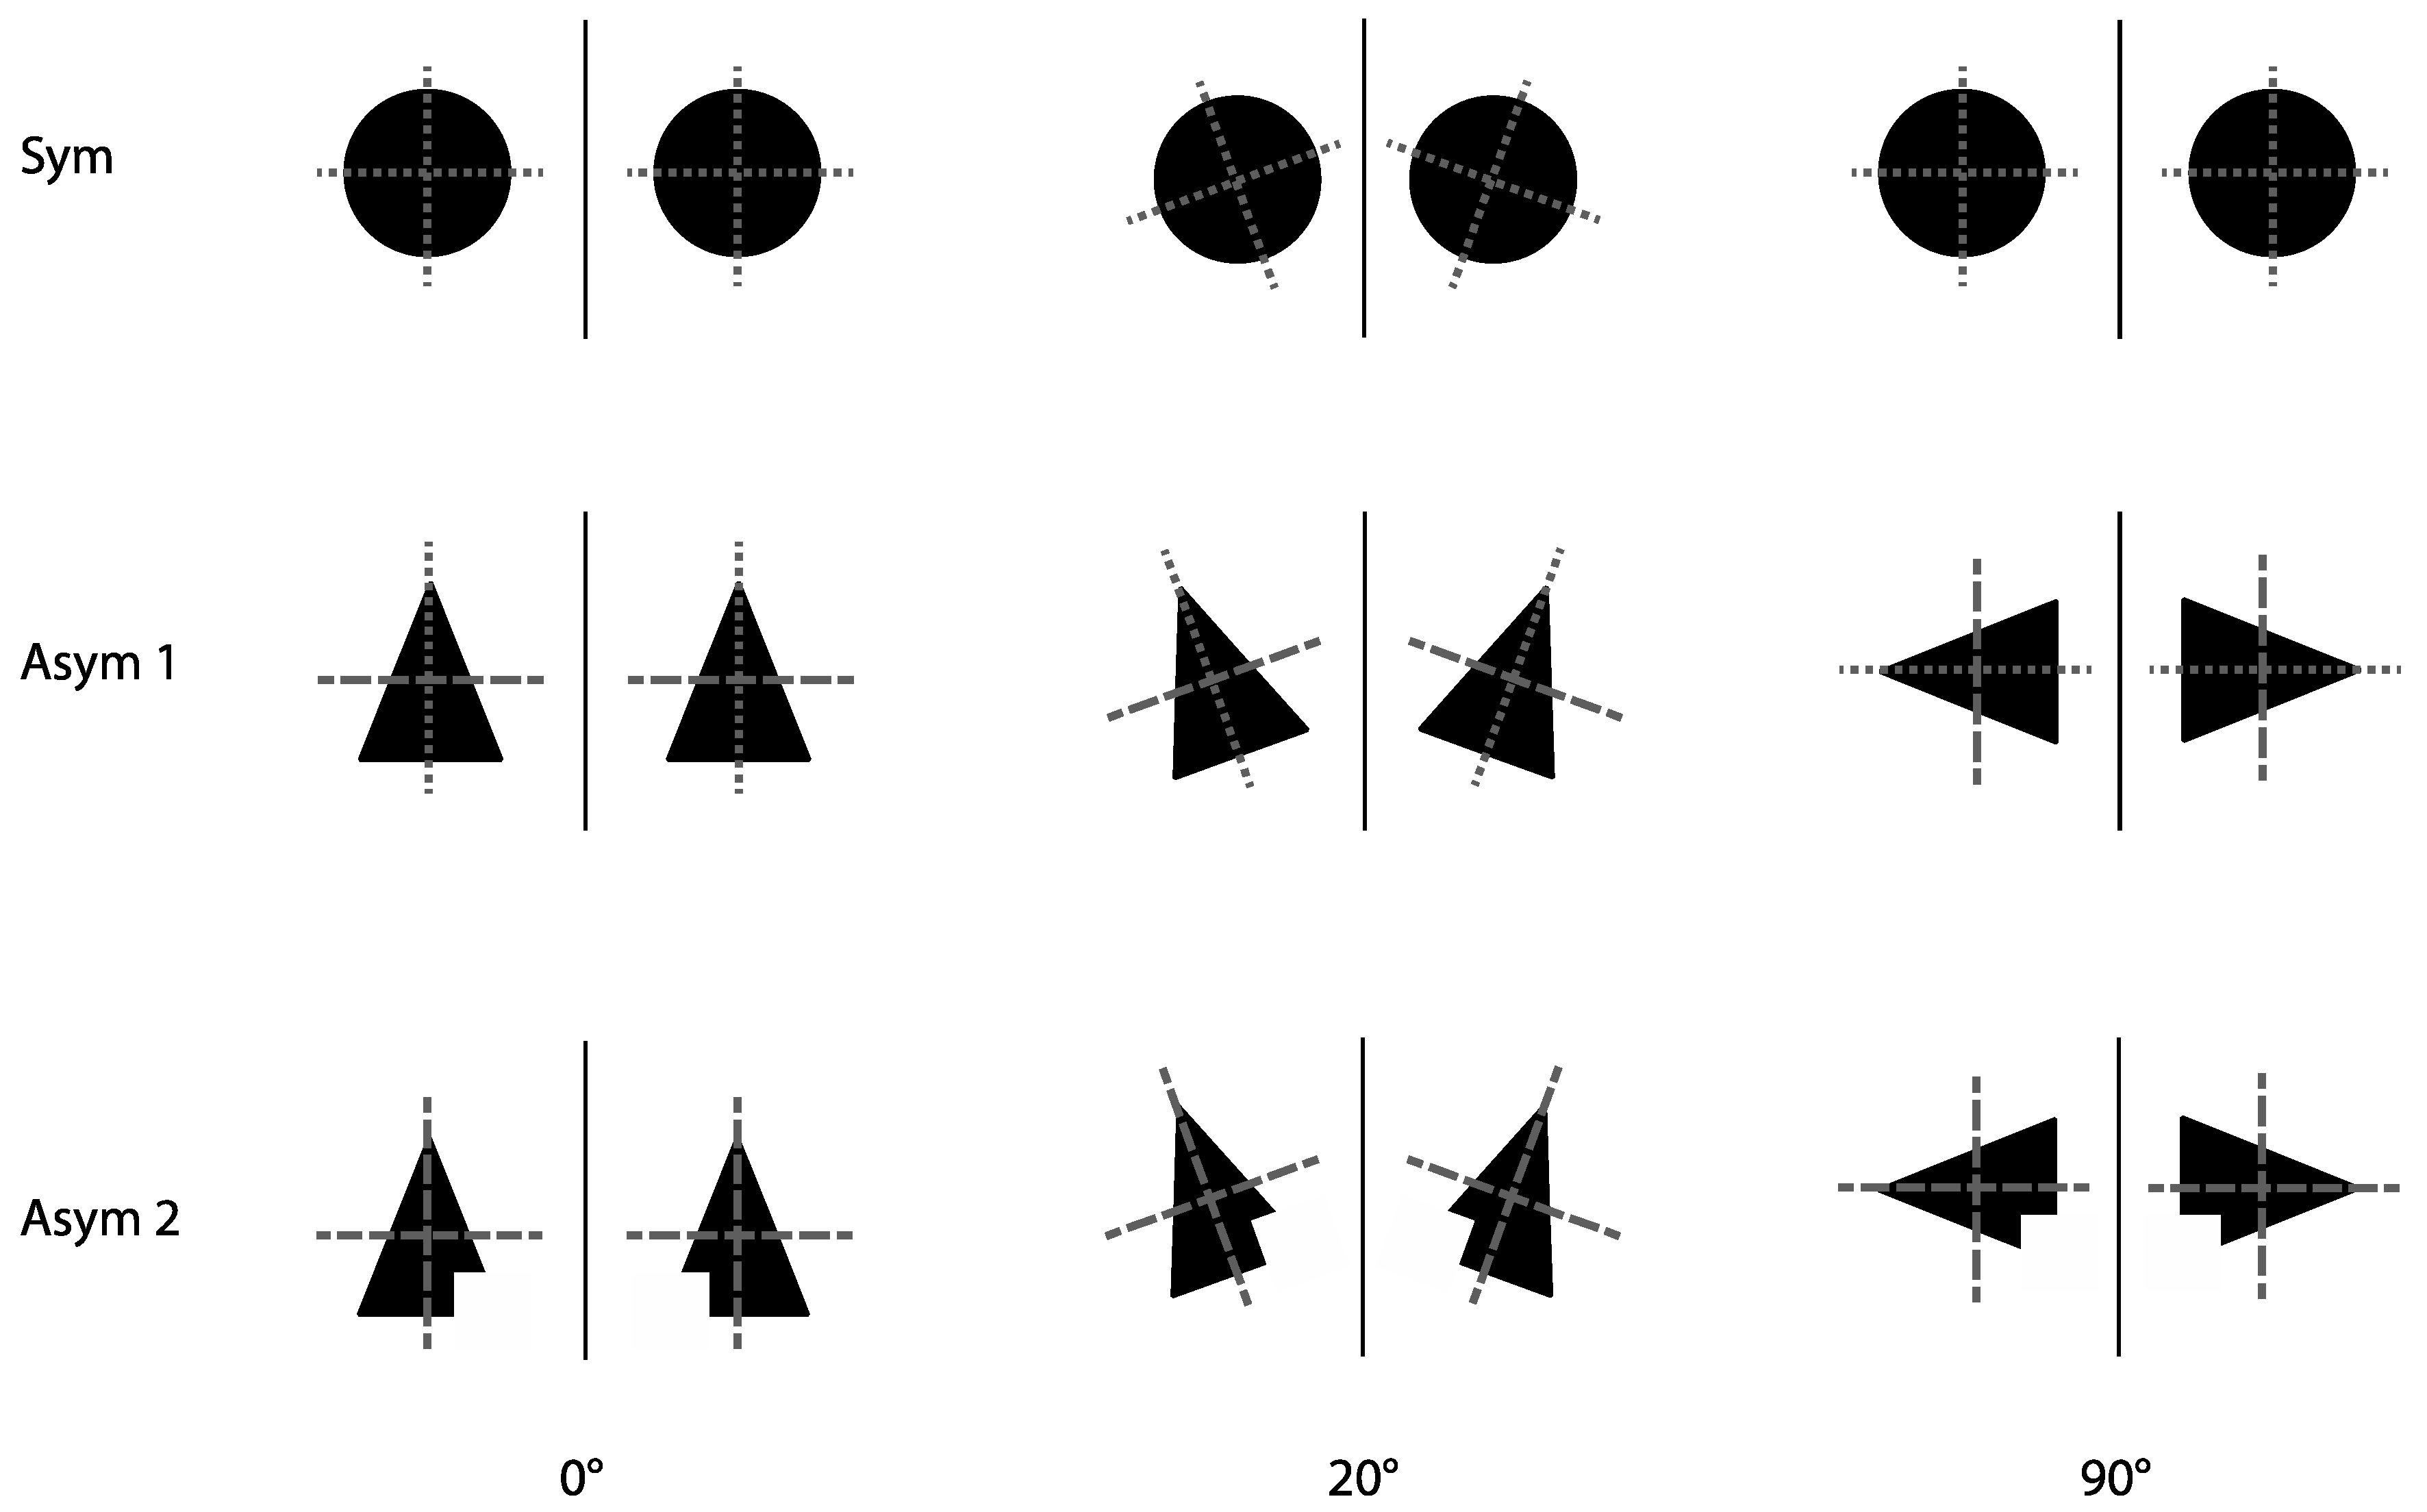
Figure 5.
Effect plot of the proportional use of each of the various response categories for question 1 (top graph) or chosen from among the three alternatives in question 4 (bottom graph). Proportions are reported on a logit link scale (as computed by the GLMMs described in the main text). Error bars represent a 95% confidence interval.
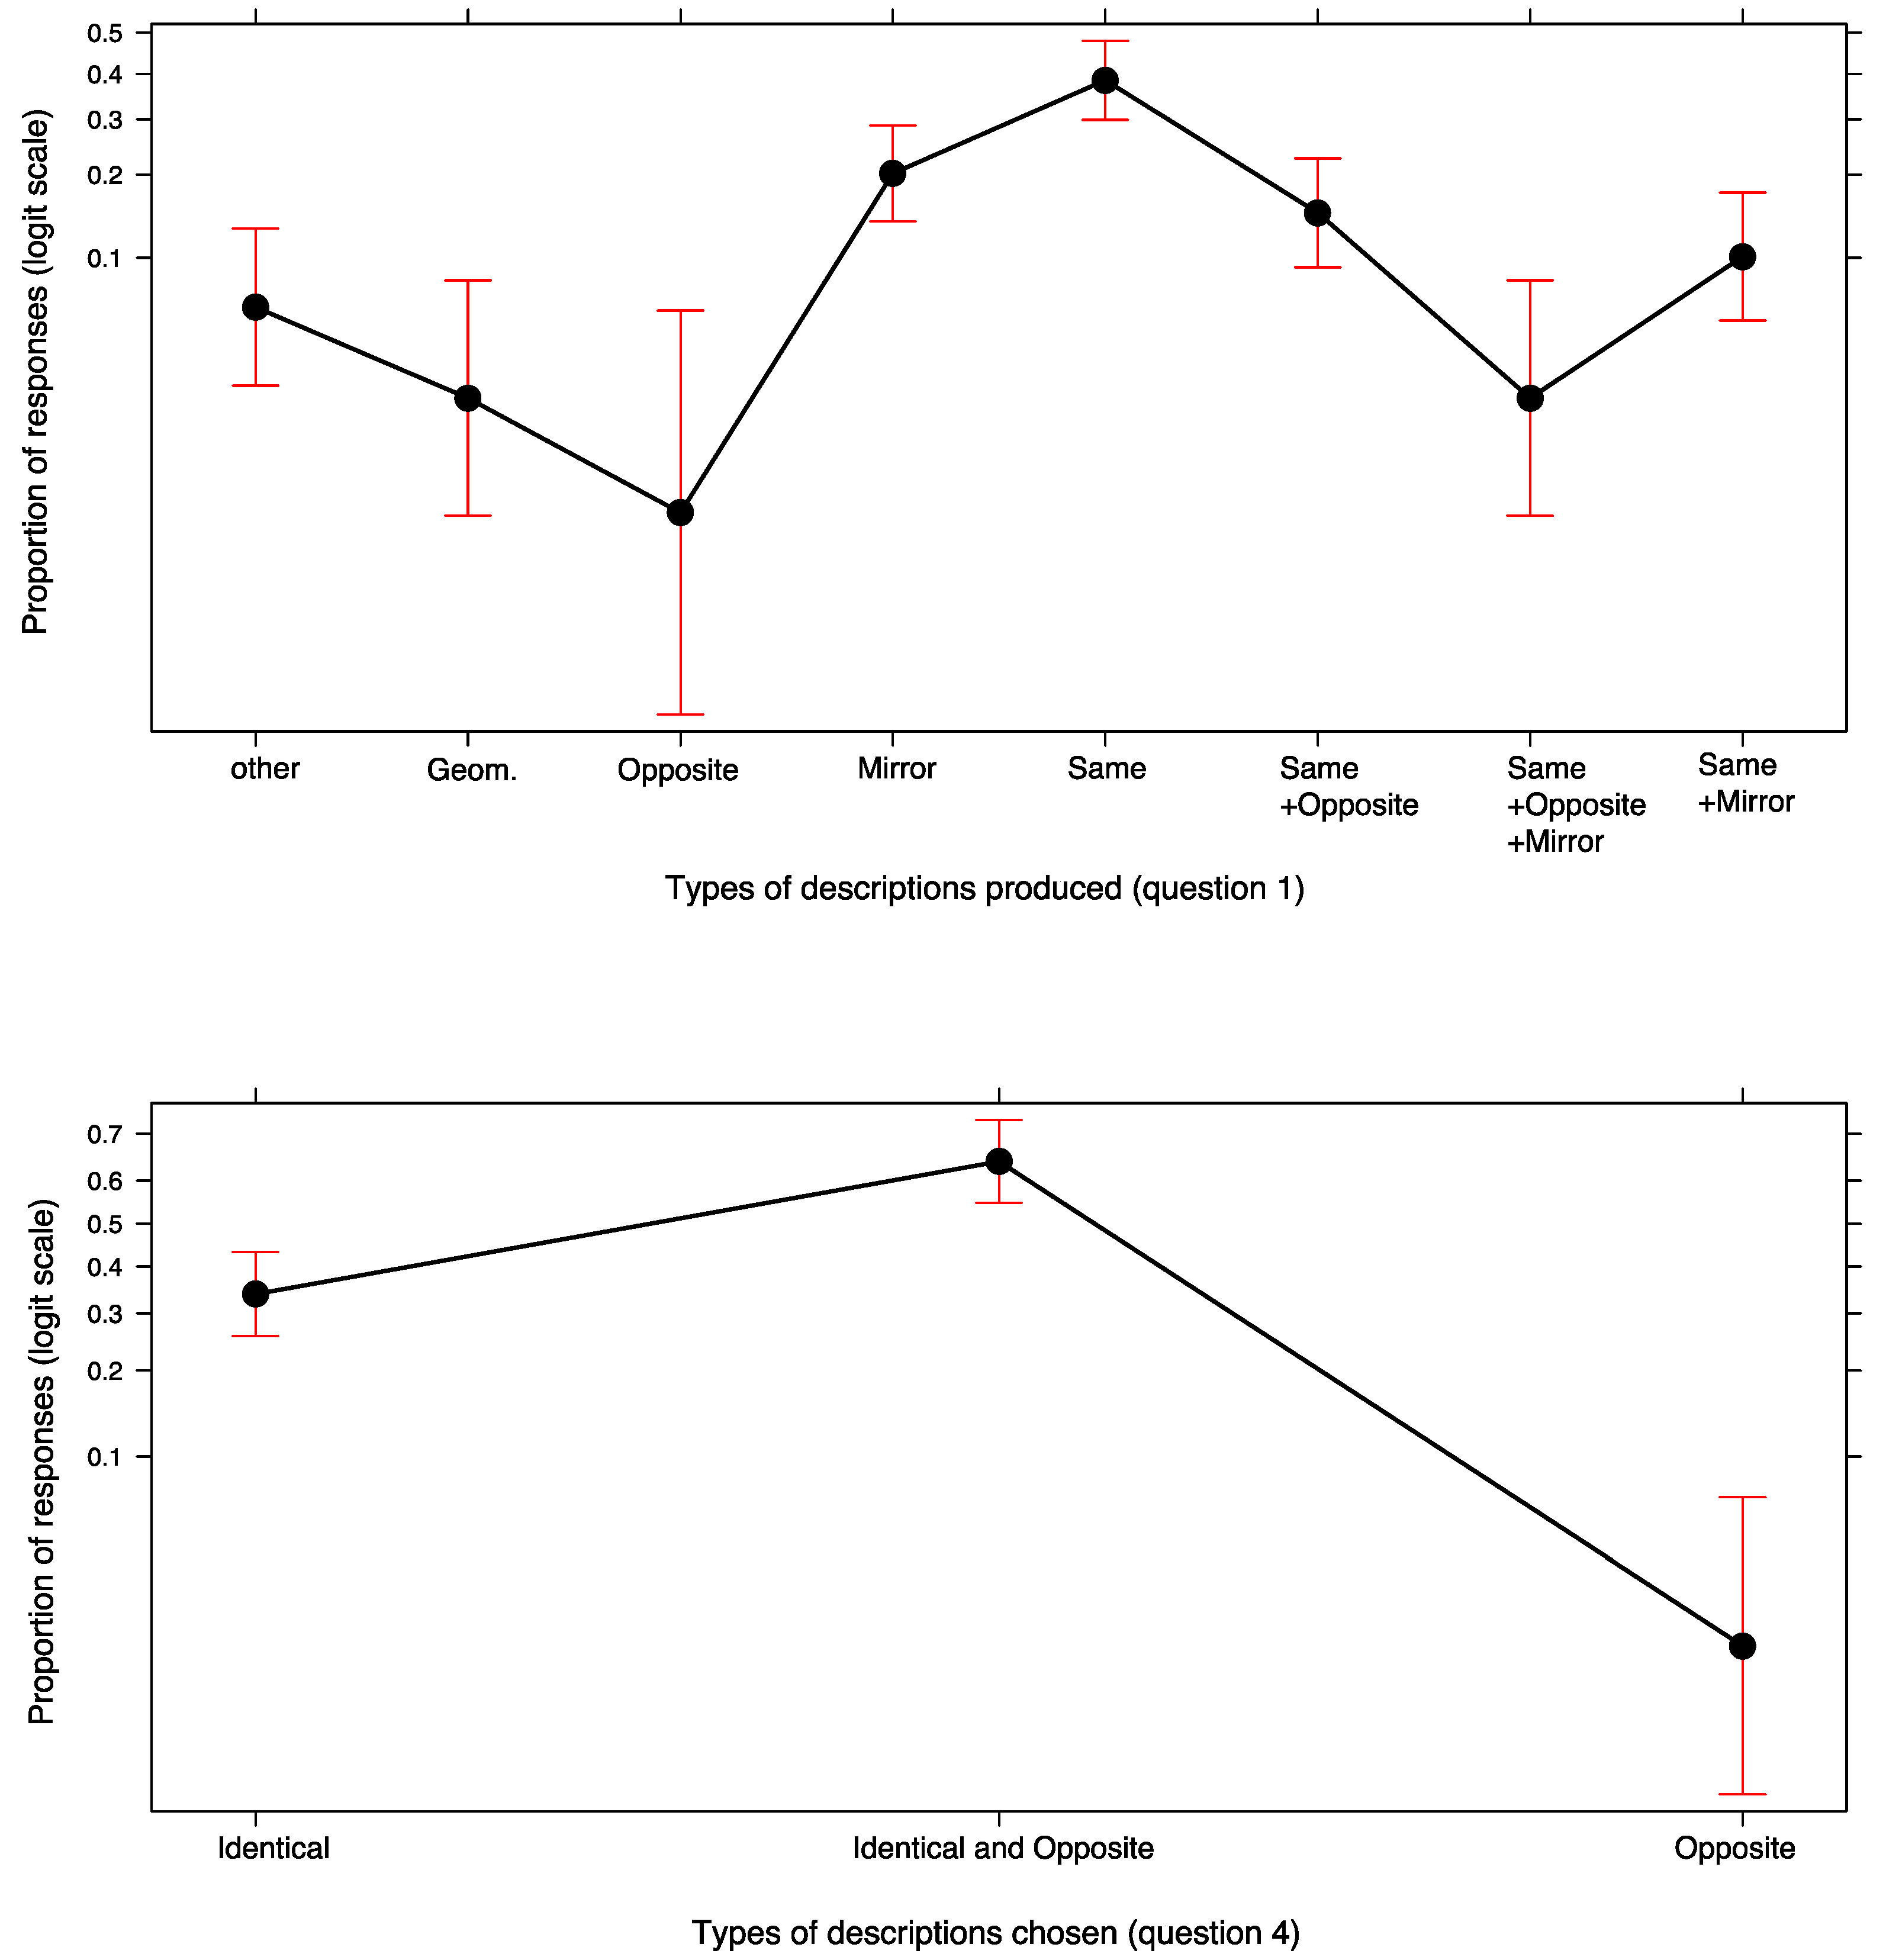
Figure 6.
Some of the drawings done by the participants as examples of their idea of symmetry (in response to questions 2 or 3).
Figure 6.
Some of the drawings done by the participants as examples of their idea of symmetry (in response to questions 2 or 3).
Figure 7.
Effect plots of the Orientation of the mirror axis in the configurations drawn by participants. Top graph: Main effect of mirror axis Orientation. Central graph: interaction between mirror axis Orientation and Drawing. Bottom graph: Main effect of a combined analysis of the two drawings done by each participant. In all plots, error bars represent a 95% confidence interval.

Figure 8.
Effect plot of the use of symmetrical and asymmetrical shapes in the drawings done by the participants to exemplify their idea of a “symmetrical configuration” (Asym 2 = asymmetrical with respect to both the vertical and horizontal axes; Asym 1 = symmetrical around one axis and asymmetrical with respect to the other; Sym = symmetrical with respect to both the vertical and horizontal axes). Error bars represent a 95% confidence interval.

Figure 9.
Effect plot of the Orientation (Orthogonal or Parallel) of the internal axis of symmetry of the shapes drawn by participants with respect to the mirror axis. Two examples of orthogonal configurations are shown on the left and one example of parallel configuration is shown on the right. Error bars represent a 95% confidence interval.

Figure 10.
Mosaic plot showing the association between the three Iconic Pair levels relating to the shapes drawn by participants as exemplar configurations (in terms of symmetry/asymmetry) and the responses to question 1 (mosaic on the left) and question 4 (mosaic on the right).
Figure 10.
Mosaic plot showing the association between the three Iconic Pair levels relating to the shapes drawn by participants as exemplar configurations (in terms of symmetry/asymmetry) and the responses to question 1 (mosaic on the left) and question 4 (mosaic on the right).

Figure 11.
The configurations used in the pair comparison task in study 2. The pairs inside the red borders are those instantiating a match between a configuration which shows only identicalness and another which shows both identicalness and opposition. The pairs inside the blue border are formed of two configurations both of which show identicalness and opposition. The configurations which are not inside a border are the pairs which are formed of two configurations, both of which only show identicalness.

Figure 12.
Scaling of the configurations used in the pair comparison task (based on the Thurston Case V scaling).
Figure 12.
Scaling of the configurations used in the pair comparison task (based on the Thurston Case V scaling).

Table 1.
The categories used to classify the definitions of symmetry produced by the participants in study 1 (in response to question 1). Examples of each type of description and the frequency of each category are presented.
Table 1.
The categories used to classify the definitions of symmetry produced by the participants in study 1 (in response to question 1). Examples of each type of description and the frequency of each category are presented.
| Types of Descriptions | Examples | Counts (and %) |
|---|---|---|
| a. Geometrical | [Shapes with corresponding points at the same distance from the axis of symmetry] | 3 (2.9%) |
| b. Same | [Identical shapes] [Perfectly overlapping shapes] [Identical, coincident shapes] [shapes of the same form] [Shapes of the same form and size] | 42 (40.0%) |
| c. Mirror | [Specular shapes] [Reflected shapes] | 22 (21.0%) |
| d. Same + Mirror | [Shapes with same form and size, specular to each other] [Similar shapes, as if reflected in a mirror] [Specular/shapes with the same characteristics] | 11 (10.5%) |
| e. Opposite | [Two opposite shapes] | 1 (1.0%) |
| f. Same + Opposite | [Identical shapes, but with one reversed with respect to the other] [Same but contrary shapes] [Same and opposite shapes] [Shapes with the same features but which are inverted left to right] | 16 (15.2%) |
| g. Same + Opposite + Mirror | [Reflected shapes: identical but reversed] [Specular shapes: identical but inverted] [Equal and opposite shapes, as if reflected in a mirror] | 3 (2.9%) |
| h. Other | [Two shapes, one near the other] [Shapes which are parallel to each other] | 7 (6.7%) |
| Total | 105 | |
| Missing | (missing responses or tautological responses) | 4 |
© 2017 by the authors. Licensee MDPI, Basel, Switzerland. This article is an open access article distributed under the terms and conditions of the Creative Commons Attribution (CC BY) license (http://creativecommons.org/licenses/by/4.0/).
Share and Cite
MDPI and ACS Style
Bianchi, I.; Bertamini, M.; Burro, R.; Savardi, U. Opposition and Identicalness: Two Basic Components of Adults’ Perception and Mental Representation of Symmetry. Symmetry 2017, 9, 128. https://doi.org/10.3390/sym9080128
AMA Style
Bianchi I, Bertamini M, Burro R, Savardi U. Opposition and Identicalness: Two Basic Components of Adults’ Perception and Mental Representation of Symmetry. Symmetry. 2017; 9(8):128. https://doi.org/10.3390/sym9080128
Chicago/Turabian StyleBianchi, Ivana, Marco Bertamini, Roberto Burro, and Ugo Savardi. 2017. "Opposition and Identicalness: Two Basic Components of Adults’ Perception and Mental Representation of Symmetry" Symmetry 9, no. 8: 128. https://doi.org/10.3390/sym9080128
Note that from the first issue of 2016, this journal uses article numbers instead of page numbers. See further details here.