Research on Lower Limb Motion Recognition Based on Fusion of sEMG and Accelerometer Signals


1
School of Information Engineering, Wuhan University of Technology, Wuhan 430070, China
2
Key Laboratory of Fiber Optic Sensing Technology and Information Processing, Ministry of Education, Wuhan University of Technology, Wuhan 430070, China
*
Author to whom correspondence should be addressed.
Symmetry 2017, 9(8), 147; https://doi.org/10.3390/sym9080147
Submission received: 22 June 2017
/
Revised: 30 July 2017
/
Accepted: 3 August 2017
/
Published: 6 August 2017
(This article belongs to the Special Issue Information Technology and Its Applications)
Abstract
:Since surface electromyograghic (sEMG) signals are non-invasive and capable of reflecting humans’ motion intention, they have been widely used for the motion recognition of upper limbs. However, limited research has been conducted for lower limbs, because the sEMGs of lower limbs are easily affected by body gravity and muscle jitter. In this paper, sEMG signals and accelerometer signals are acquired and fused to recognize the motion patterns of lower limbs. A curve fitting method based on median filtering is proposed to remove accelerometer noise. As for movement onset detection, an sEMG power spectral correlation coefficient method is used to detect the start and end points of active signals. Then, the time-domain features and wavelet coefficients of sEMG signals are extracted, and a dynamic time warping (DTW) distance is used for feature extraction of acceleration signals. At last, five lower limbs’ motions are classified and recognized by using Gaussian kernel-based linear discriminant analysis (LDA) and support vector machine (SVM) respectively. The results prove that the fused feature-based classification outperforms the classification with only sEMG signals or accelerometer signals, and the fused feature can achieve 95% or higher recognition accuracy, demonstrating the validity of the proposed method.
1. Introduction
According to data released by the China Disabled Persons’ Federation, there were about 85.2 million disabled people in China in 2010, among which the physically disabled make up the largest proportion, up to about 29.07% [1]. However, the data released on webpages for the disabled show that the actual prosthetic fitting rate is not high enough, and the demand for prosthetic and other auxiliary equipment is great [2]. Nowadays, research on lower limbs auxiliary equipment is more focused on how to realize autonomous control for patients and make auxiliary motion more natural and convenient. An electromyograghic (EMG) signal is the result of neuromuscular excitement and the release of bioelectricity during the human body’s autonomic movement; therefore, it can be used to identify the state of muscles and perceive movement intention. As it is noninvasive and portable, surface EMG (sEMG) signals have become the ideal signal source for rehabilitation equipment and prosthetics to achieve autonomous control [3,4].
In the past 10 years, research of sEMG-based human movement pattern recognition, especially movement identification of upper limbs, was widely conducted. The studies employed plentiful classification models and achieved good recognition effects [5,6], and the results were used to control humanoid machinery and artificial prosthesis [7]. However, research methods for the lower limbs are still immature, because the lower limb gait generation mechanism and adjustment methods are more complex [8]. However, similarly to the study of upper limbs, in order to realize the accurate identification of the lower limbs’ movements, the whole system is divided into several parts: preprocessing, feature extraction, pattern recognition, and post-processing. The research of feature extraction and pattern recognition is especially important.
Al-Ani et al. [9] extracted time-domain (TD) features (root mean square (RMS), mean absolute value, integrated absolute value, zero crossing, slope sign change (SSC), and waveform length) and a time-domain power spectrum descriptors (TDPSD) feature of sEMG, combined with five different classifiers (support vector machine (SVM), linear discriminant analysis (LDA), quadratic discriminant analysis, Bayes classifier, and extreme learning machine) to distinguish six movements including different grip and finger movements. Arjunan et al. [10] successfully identified and analyzed the force of muscle contraction and muscle fatigue by computing six different features of sEMG signals, including the normalized spectral index (NSM5), median frequency (MF), RMS, waveform length (WL), normalized root mean square (NRMS), and increase in synchronization (IIS). Besides, the independence in channel index (ICI) between multi-channel sEMG signals was used to measure the loss of motor units [11]. Some blind source separation (BSS) methods, such as independent component analysis (ICA) [12] and non-negative matrix factorization (NMF) were also used for sEMG signals to classify different motion modes. Recently, Xi et al. [13] analyzed and evaluated 15 feature extraction methods of sEMG signals (including time, frequency, time/frequency domain, and entropy) and five classification methods for the identification of seven activities of daily living, providing a sufficient experimental analysis for existing methods.
In addition to sEMG signals, some kinematics signals are usually applied to identify different motions of the lower limbs. The accelerometer signals are usually analyzed by using multiple principal component analysis (MSPCA) [14] or wavelet PCA [15] to classify different ways of walking. Also, the blind source separation method ICA could be used for accelerometer signals to distinguish the toe walking gait from normal gait in Idiopathic Toe Walkers (ITW) children [16]. In addition, the accelerometer signals were always used for physical activity monitoring [17] and fall detection [18,19].
In practical applications, the sEMG signals of the lower limbs are affected by the ground environment and gravity center shift, therefore the recognition effect is not ideal by using sEMG alone. On the other hand, using kinematics signals (such as accelerometer signals) alone can obtain a better recognition effect for different motions of the lower limbs. However, action segment detection and onset prediction are difficult to achieve, but it is much easier to achieve them with sEMG signals [20,21]. Besides, for the motions with a similar trend, the recognition effect is also not satisfactory by using accelerometer signals alone. Researches have indicated that better recognition results can be achieved when sEMG is combined with some kinds of kinematics signal sources [20,22,23].
Miller et al. [24] used LDA and SVM classifiers respectively to identify seven kinds of gait, and these two classifiers have equivalent performance during experiments. Huang et al. [25,26] divided a gait into four step phases according to plantar pressure changes, and proposed a method based on different phases, which realized the recognition of seven kinds of gait. The features of sEMG and plantar mechanic signals were analyzed and compared, and the results showed that if the two signal sources were fused, the recognition effect was obviously better than using sEMG or using mechanical signals alone, with a recognition rate of about 95%. Wu et al. [27] extracted the approximate entropy and basic-scale entropy of sEMG, and then combined pressure signals based on an analysis of the change rule of plantar pressure. Finally, fall detection was implemented successfully by SVM decision with a fusion of the two signal sources. Juan et al. [28] realized the identification and detection of lower limb movements by an integration of acceleration and sEMG signals, and achieved good results. Liu et al. [29] fused the sEMG and the hip angle and acceleration signals of the lower limbs, achieving the identification of lower limb motor patterns. Besides, Tikkanen et al. [30] combined EMG, heart rate, and accelerometer signals to estimate energy expenditure in four different motion modes on the treadmill. Even some devices were developed to acquire sEMG signals and kinematics signals synchronously [31].
Given that the requirement of an acceleration signal device is simple and portable, and the accelerometer signals contain rich gait information, two sources of signals—sEMG and acceleration—will be used in this paper for lower limb motion recognition. In current related research, the preprocessing of accelerometer signals and movement onset detection from continuous motion signals are always overlooked. Besides, the feature extraction methods for extracting features of signals with a higher separation degree, as well as more efficient classification methods, are still remaining to be further developed for lower limb motion recognition systems. All the above factors will affect the accuracy and stability of the final classification results, and only those recognition systems with high accuracy and good stability can be more effectively used for the actual control of intelligent devices. In this paper, sEMG signals and accelerometer signals are acquired and fused to recognize motion patterns of lower limbs. Firstly, a curve fitting method based on median filtering is proposed to remove accelerometer noise. As for movement onset detection, a sEMG power spectral correlation coefficient method is used to detect the start and end points of active signals. Next, time-domain features and wavelet coefficients of sEMG signals are extracted, and a dynamic time warping (DTW) distance is used for feature extraction of acceleration signals. Finally, five lower limbs’ motions are classified and recognized by using Gaussian kernel-based LDA and SVM, respectively. The results show that the fused feature-based classification outperforms the classification with only sEMG signals or accelerometer signals, and the fused feature can achieve 95% or higher recognition accuracy, demonstrating the validity of the proposed method.
2. Materials and Methods
2.1. Signal Acquisition
In the experiment, the surface EMG sensor and the analysis system produced by Biometrics (UK) are used to acquire sEMG signals (4 channels, 1000 Hz), and the Mini Attitude and Heading Reference System (AHRS) gesture board is used to acquire acceleration signals (3 axes, 100 Hz).
Five daily activities of lower limbs were studied in this paper, including squatting, standing, walking forward, walking upstairs, and walking downstairs. These actions are all daily activities, so it is easy to complete them in a laboratory environment without other additional devices. Acquiring sEMG signals from multiple channels will improve the recognition effect of different motions, and four to eight channels are selected in many studies. Many more channels may reduce the recognition effect because of the crosstalk between different channels of sEMG signals. Combining human anatomy and lots of experimental results, the biceps femoris, semitendinosus, rectus femoris, and vastus lateralis muscles were selected as the sticking points of electrodes in order to obtain effective sEMG signals. After the electrodes are pasted, the subject will do some simple actions of the lower limbs to test whether the signals of each channel are clear or whether there is obvious noise, so as to ensure that the paste positions of electrodes are correct and effective. In the experiment, each mode of motions requires multiple sets of data used for the analysis of the training process and the testing process. When acquiring data samples, each mode of motions should last for 15 s. In order to avoid the effects of muscle fatigue, a 2 min test is needed after finishing a motion.
The participants include four healthy subjects aged between 23 and 35 years old, and one amputated volunteer with a below-knee amputation. The amputated subjects completed the five lower limb motions by wearing artificial limbs in the experiment. All subjects gave their informed consent for inclusion before they participated in the study. The study was conducted with the approval of the Wuhan University of Technology.
2.2. Signal Preprocessing
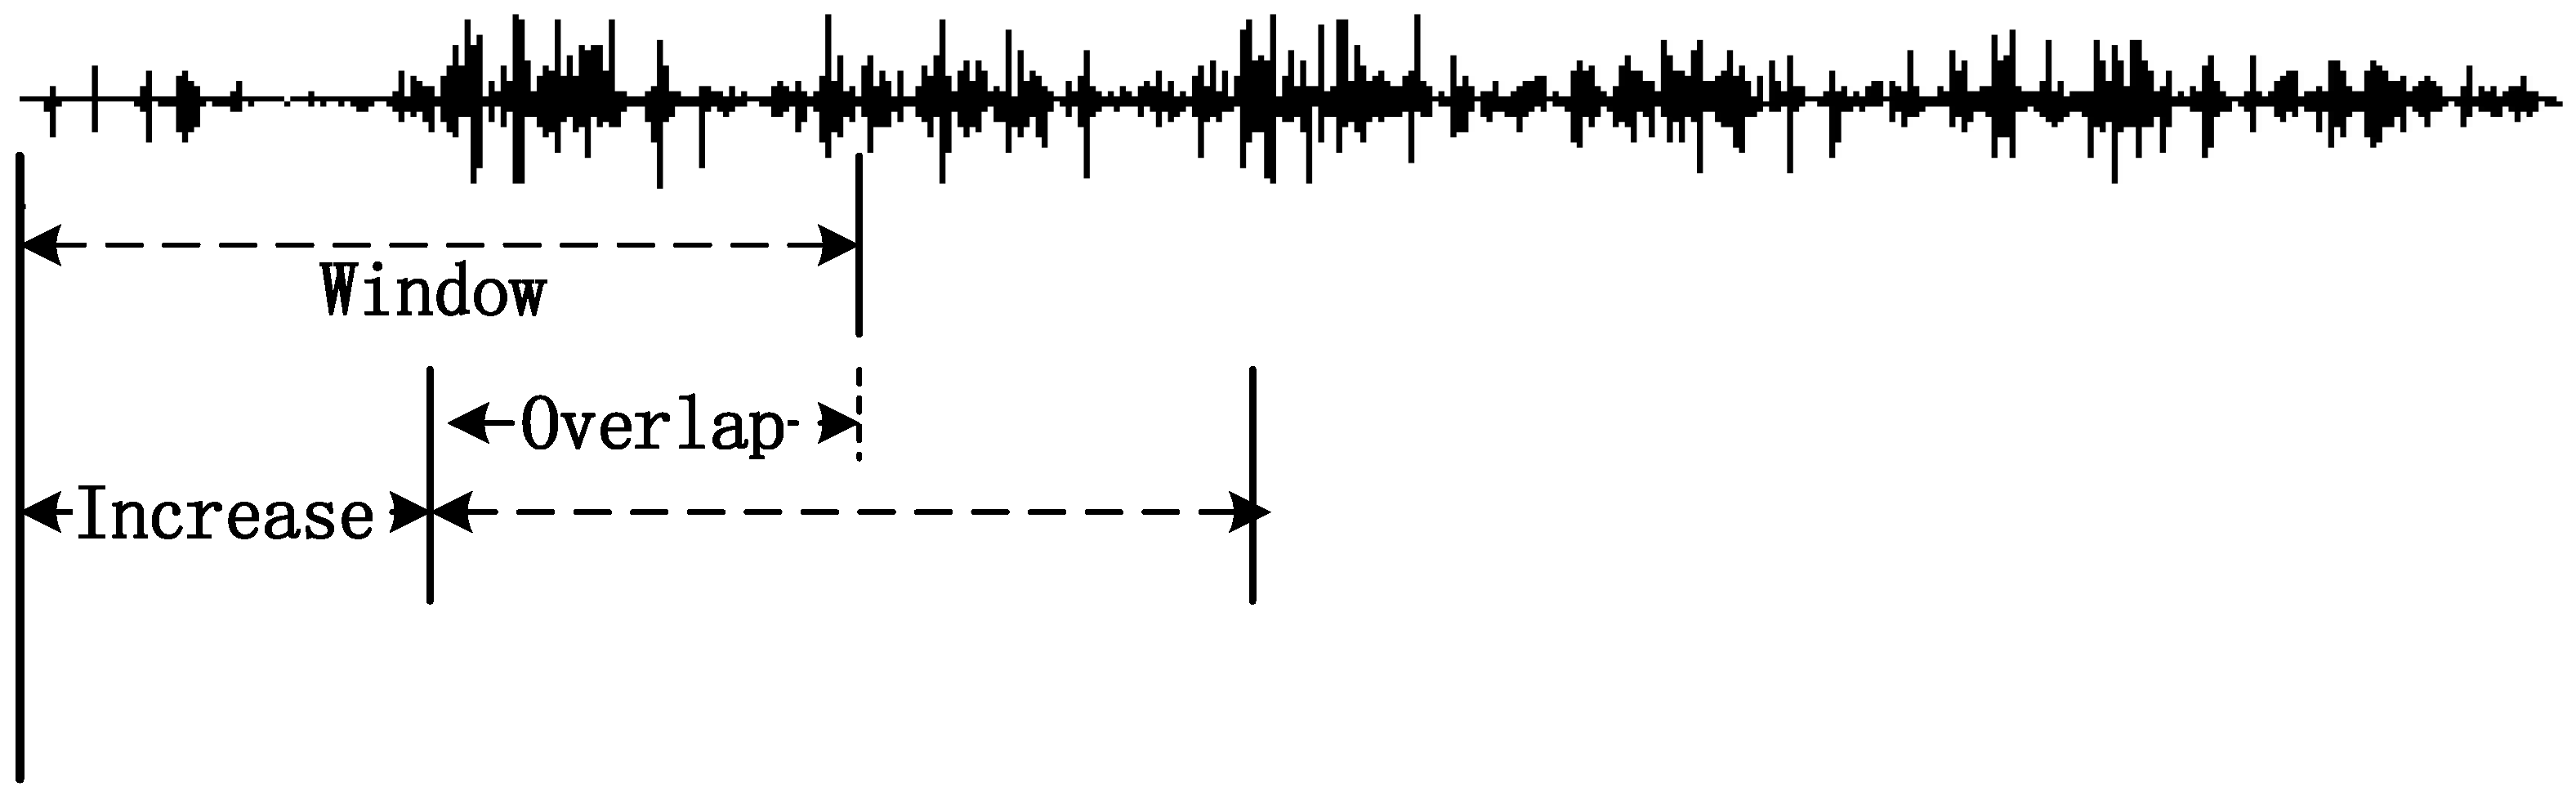
One of the most important aspects of EMG preprocessing is the selection of the size of the analysis window. Signals need to be processed with the window, and a current real-time signals segment is continuously obtained as the window moves. Huang et al. [27] noted in a gait study that the recognition rate would be higher, but the delay was too large when taking the signals of an entire gait circle as the input. It was advisable to split the signals with a smaller analysis window. There are two kinds of commonly used windows: non-overlapping analysis window and overlapping analysis window. In addition, the overlapping window can make the delay smaller and ensure the full utilization of the signals’ information. Phinyomark et al. [32] have studied different combinations of analysis window length and overlapping distance. The accuracy was the best when the window length was 500 ms and the sliding distance was 125 ms. When the analysis window gradually increased from 125 ms to 250 ms, the recognition rate was significantly improved. When the analysis window increased from 250 ms to 500 ms, the increase in recognition rate became flat. So, when the analysis window is too large, it is necessary to consider whether the delay is too long.
As shown in Figure 1, a sliding window analysis is used for signal preprocessing in this study. ‘Window’ refers to the length of the analysis window, and once the previous analysis is complete, the window slides forward at a distance of “Increase”. Studies have shown that increasing the length of the analysis window will increase the accuracy of the classification results, but will also increase the processing delay of the system [32,33]. In this study, different combinations of analysis window length and sliding distance were studied and analyzed by experiments, so as to ensure a better recognition effect and a smaller processing delay. The analysis window was increased from 200 ms to 250 ms, and the sliding distance was increased from 50 ms to 100 ms [34]. Finally, we set an analysis window length of 250 ms, and a sliding distance of 80 ms.
2.2.1. Movement Onset Detection of sEMG
When lower limbs are active, EMG signals are changed from the resting state to the active state. Movement onset detection is important for motion recognition [35]. EMG signal fluctuations increase as the muscles begin to be active, compared to the resting state [36].
The amplitude is low when the muscles are inactive. It is found by experiments that the correlation coefficient of the power spectrum corresponding to two neighboring sliding windows is small, in which situation the occasional fluctuations in sEMG signals can be almost completely filtered out. The amplitude increases when the muscles are active, and the correlation coefficient of the power spectrum corresponding to two neighboring sliding windows becomes big. Thus, the following method is used for movement onset detection.
- Use a sliding window to segment the whole data of each channel into n epochs and calculate the power spectrum
- Calculate the correlation coefficient between and .
- Calculate the sum of the maximum number of correlation coefficients corresponding to each channel, .
- Compare with a predefined threshold . If is greater than , EMG signals are recognized as in an active state.
- For the selection method of the threshold, Cheng et al. [28] found by experiment that the method for selecting the threshold is relatively stable and has a good repeatability according to the percentage of maximal voluntary contraction. The method is a reference in this study. Through experiments, 1% of the maximal voluntary contraction is set as the threshold of the moving average method and Teager–Kaiser operator, and 0.1% of the maximal voluntary contraction is set as the threshold of the power spectral correlation coefficient method.
2.2.2. De-Nosing of Accelerometer Signals
Due to the situation that error bits occur along with the signal transmission process in Mini AHRS, there will be a lot of glitches or continuous segments of noise existing in the collected accelerometer signals. As for the de-noising of such noise, the method based on a median filter is often used, the main process of which is to select a length of point neighborhood and replace the original points with the median of the neighborhood. The key factor of the median filter is the window size of the neighborhood. The more obvious fluctuations will be eliminated with a too-large window, while a too-small window will not achieve good results for the continuous noise segment. In practical application, the window size is selected by experiments and comparison while gradually increasing the window size. The method can eliminate the isolated noise points and the calculation is relatively simple and quick. Nevertheless, a lot of details are also filtered out when removing the signal noise, resulting in a too-smooth signal curve. On this basis, a median curve fitting-based accelerometer signal de-noising method is proposed in this study. For the signal in a point neighborhood window, the sample points are sorted by size. Only a few intermediate points are selected, and the points of the largest and the smallest value on both sides are removed, since such points are more likely to be noise. By doing a curve fitting calculation for these intermediate points, glitch noise can be removed, and the signal can be smooth as well.
Curve fitting is to use a function curve to approximate the known measurement data points, and then use the curve to calculate the value of other unknown points. When the form of the curve function is uncertain, the polynomial curve is generally used to fit. Assume that there are sample points , which are expressed by an m-th-order polynomial.
where is the fitting coefficient, and its matrix form can be written as:
As a result, , , and we can see that:
2.3. Feature Extraction
Feature extraction is a very important part of pattern recognition, and a good feature has higher resolution, which has a great influence on the recognition results [37].
2.3.1. Feature Extraction of EMG Signals
Nowadays, many methods of feature extraction have been proposed, among which time-domain features and the wavelet coefficient are most commonly used [38,39,40].
1. Time-Domain Features
The most commonly used time-domain features are Root Mean Square (RMS), Zero Crossing (ZC), Willison Amplitude (WAMP), SSC and Wave Length (WL).
- RMS can reflect the amplitude of signals:where is the number of samples in an analysis window.
- ZC is the number of times the waveform passes through the zero point, which reflects the frequency characteristics of the signals. If the zero point is set to be a range rather than a value, the noise introduced by the zero point can be reduced. When we select a threshold thr, the calculation formula of ZC is shown in Formula (5):where
- WAMP can reflect the relative fluctuation amplitude of a sample point and the next one.where . Through many experiments and contrasts, we set in this paper.
- SSC can be used as the supplementary information of the signal frequency.where in this paper.
- WL not only reflects the amplitude information of the signals, but also contains the fluctuation frequency information of the signals.The information contained in a single time-domain parameter is not abundant enough, therefore, in much research, multiple time-domain parameters are combined to obtain a more efficient feature vector [41].
2. Wavelet Transform
Wavelet transform (WT) is a time-frequency domain transformation with the ability to simultaneously locate the time and frequency. It mainly replaces the original trigonometric function basis in the Fourier transform, and selects the wavelet basis which satisfies the corresponding allowable conditions. The basis of the Fourier transform is infinite, but the wavelet basis is damped and the length is finite. There is only one frequency variable in the Fourier transform, while the wavelet transform has two variables: scale and translation , where the scale corresponds to different frequency variables, and the translation corresponds to the positioning on time.
For the signal , a continuous wavelet transform can be expressed as:
where function system can be expressed as:
The scale controls the scaling of the wavelet function, and the large value corresponds to the low frequency, with the corresponding becoming wider. The translation controls the translation of the wavelet function, which corresponds to different time scale. Besides, is the normalizing factor. In essence, the wavelet transform of the signal is actually the inner product of and , and the continuous wavelet transform quantitatively expresses the degree of correlation between the signal and each wavelet in the wavelet function system.
When a wavelet transform is used to decompose the EMG signal, what needs to be considered firstly is the mother wavelet and the decomposition scale. The mother wavelets mainly used in EMG processing are: Daubechies, Coiflets, Symlets, et al. Decomposition scales should also be chosen according to the actual situation. In this paper, multiple experiments with different mother wavelets and decomposition scales were carried out. Fisher’s Index (FI) was used to measure the separation degree of feature vectors. The larger the FI is, the higher the separation degree of the feature sets is, which is more conducive to a subsequent pattern classification. Experiments showed that the “sym4” mother wavelet with four wavelet decomposition had a higher FI, so it was chosen for the wavelet transform of this study.
2.3.2. Feature Extraction of Accelerometer Signals
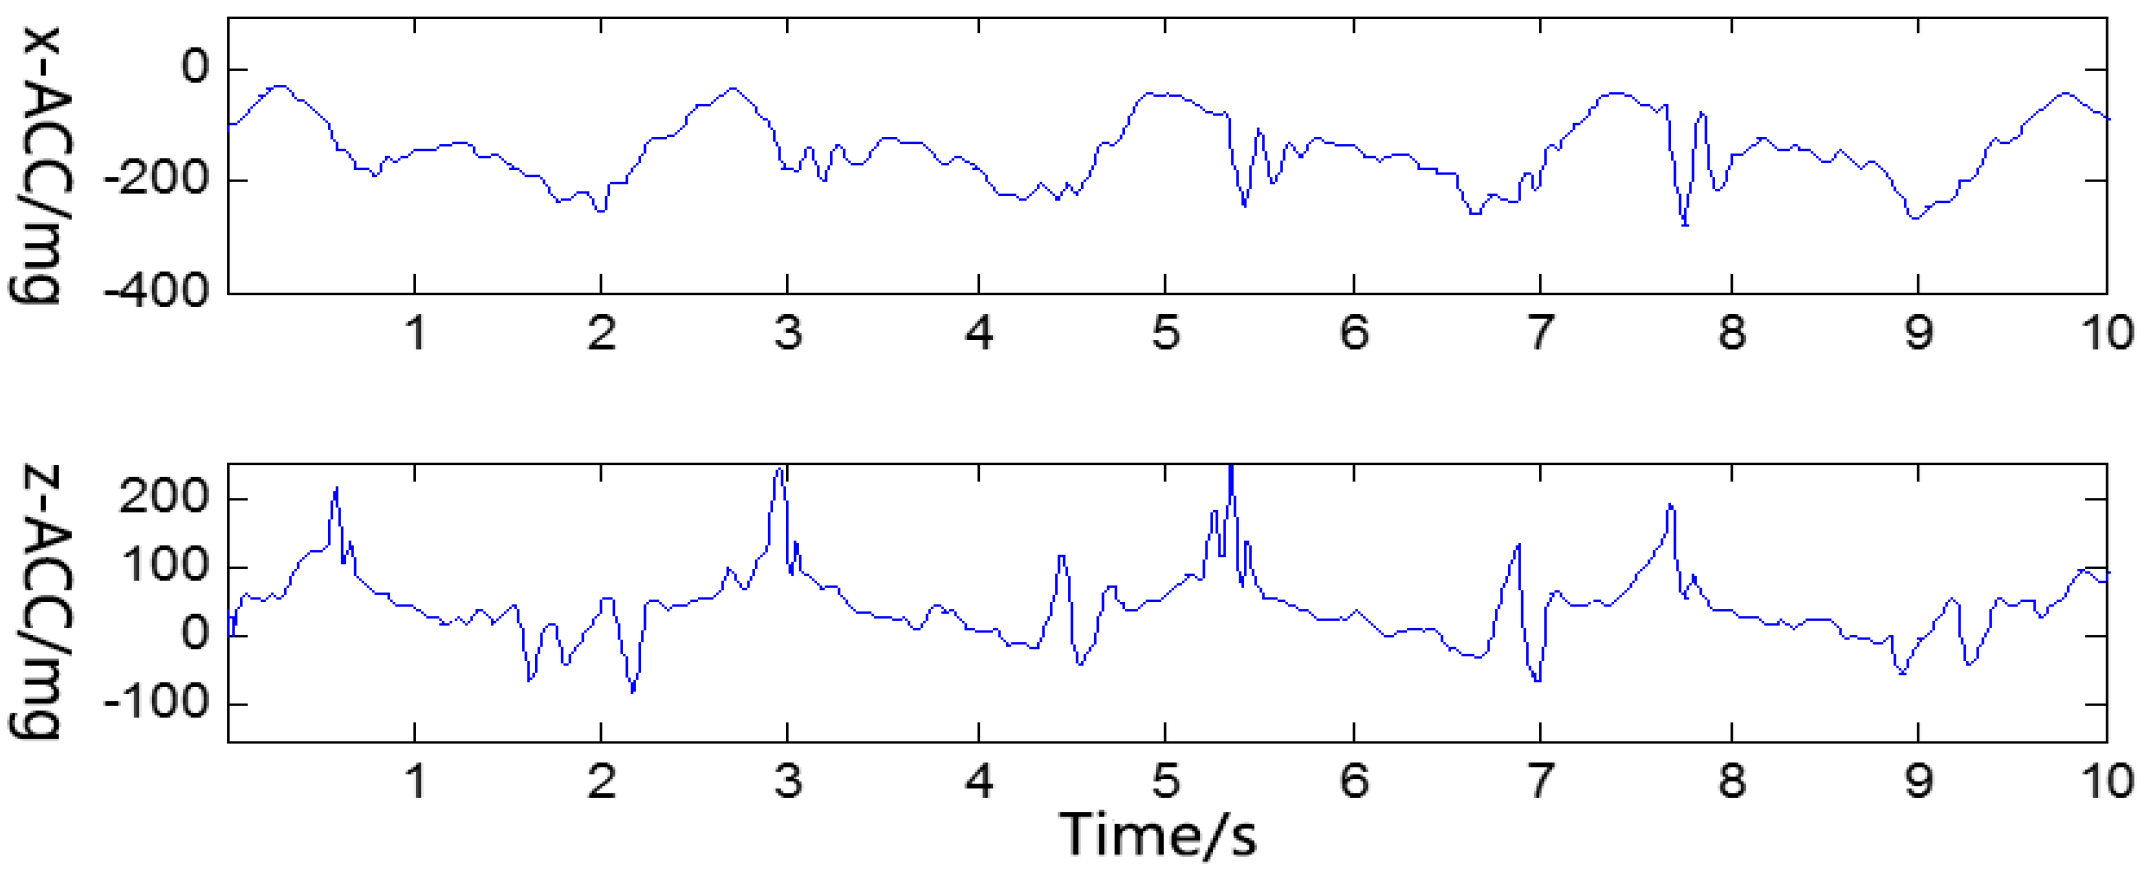
Figure 2 shows the change of x-axis and z-axis accelerometer signals when walking downstairs. It can be seen that in the same gait period, the accelerometer signals are sequential and periodic. Therefore, it is feasible to match the accelerometer signals of unknown motion patterns with a template built based on training samples, and the matching distance can be used to measure the acceleration change of unknown motions and find a more similar motion with the training samples.
Euclidean distance is a commonly used calculating distance, but sometimes it may not be suitable. It is assumed that there are two time sequences and , then we can get by using the computational formula of Euclidean distance: . In fact, the two matrix sequences are very similar. The DTW algorithm can be a good solution to this problem [45].
The DTW algorithm is most commonly used in speech signal processing. Due to the high randomness of speech signals, even if the same speaker is speaking the same word, the time length is different, namely the amplitude is different, and there will be uneven bending distortion along the time axis. It is similar to accelerometer signals. The time and distance can be combined by the DTW algorithm, and then the distance between the vectors of sequences with different length is compared.
Assume that the length of the test template is frames and the length of reference template is frames. Then, make the test template’s each frame number and set the horizontal axis of the two-dimensional grid to one-to-one correspondence, and mark the reference template’s frame number on the vertical axis. The corresponding vertical and horizontal lines can be drawn with the integer frame numbers, in which case each intersection in the grid represents the matching point between a frame in the test template and a frame in the training template. The DTW algorithm has two main steps, one is to calculate the distance between each frame of the two templates, that is to find the matching distance matrix; and the next step is to find the shortest path in the matching distance matrix.
In this paper, we restrict the research path, and the constraint conditions are shown in Formula (11).
where is the cumulative distance from the starting point to the intersection , and is the distance between the test template and the reference template point . For each of the five motions, we select a signal with a certain length to create a reference template.
Since the length of accelerometer signals in a 250 ms analysis window is approximately 25, in order to further reduce the computations, an averaged value for each three points is added to the test template, and the length of each test template is limited to eight dimensions. When making the reference template, the median is also taken from every three points.
To determine the start frame and the end frame, the test template is sliding and matching on the reference template . When the distance between the first frame and the k-th frame is smaller than the set threshold value , the k-th frame on is determined to be the start of the matching distance calculation. Then, the frame is found which meets the condition of within the range of to , and determine it as the end frame. If not found, the test template continues sliding backwards until the end of the reference template. The length of the reference template is about two gait cycles.
2.4. Recognition and Classification Methods
As for motion recognition based on sEMG, another key point is selection of classifiers, and the recognition effect will be very different when combining different feature vectors and classifiers [25,46]. Due to the development of pattern recognition, a lot of classifiers can be chosen, among which the most commonly used classifiers are LDA [47], ANN [48], and SVM [49]. In this paper, we will mainly use the LDA classifier and the SVM classifier to classify and validate the features, and make a comparative analysis.
2.4.1. LDA Classifier Based on Kernel Function
The basic idea of LDA is to project the samples of high-dimensional space into low-dimensional space. For example, if the sample space is H-dimensional, we can project the samples to a straight line along a certain direction, which is a one-dimensional space. For the H-dimensional vectors which are inseparable and overlapping with each other, the principle is to find a suitable direction “w” in projection, so that the different classes are separated as far as possible while the same class is gathered as much as possible. In this process, the Fisher criterion is usually used to find the direction.
For multi-class problems, the one-many portioning strategy on the basis of two-class problems is used. That is to successively regard the patterns belonging to the ω class and the patterns not belonging to the ω class as two classes, and then make discrimination. Because there may be points not considered to belong to the ω class every time, in order to avoid the phenomenon of unclassified, we regard the class from its closest point as the output.
LDA is simple, robust, and not prone to over-fitting. It is widely used and especially effective for linear problems. However, it is limited in nonlinear data processing. For this reason, the data can be projected nonlinearly into a feature space F, and then the Fisher discriminant criterion is calculated in F, which is called the kernel function-based LDA method. is used to represent the nonlinear function mapping X to F, that is . refers to the class to be classified. Then, the input sample can be represented as in the feature space. The mean value of the samples is:
The within-class scatter matrix , the total within-class scatter matrix , and the inter-class scatter matrix can be expressed in the feature space as:
The Fisher discriminant function in F is:
Finally, the projection of the final feature space on w can be transformed into the projection of on the direction .
By combining Equations (13) and (14), the discriminant function can be written as:
where , , , and is a matrix whose all items are .
In the choice of kernel function, the Gauss kernel function is used in this paper as the kernel function because of its good function approximation performance.
2.4.2. SVM Classifier Based on Grid Search Optimization
The SVM is proposed for small sample problems, and it has great advantages for nonlinear and high-dimensional pattern recognition. Besides, it has good ability to solve global optimization problems and will not fall into the local minimum [50]. SVM is a binary classification model, and the learning strategy is to find the optimal hyper-plane as the classification boundary to maximize the interval.
For the selection of SVM kernel functions, the commonly used functions are linear kernel, polynomial kernel, radial basis kernel, and sigmoid kernel. Many studies have shown that the Radial Basis Function (RBF) has better performance, and the linear kernel function is essentially a special case of the RBF. Compared with the polynomial kernel, RBF requires fewer parameters, and the number of the kernel function’s parameters directly affects the complexity of the function. As for the sigmoid kernel, it has similar performance to the RBF for some parameters. In the case that the feature dimension is not large, the RBF is selected in this paper. Meanwhile, since SVM is a binary classification model and multiple SVMs need to be set for multi-classification problems, we use the “one to other” approach in this paper.
The learning strategy of SVM is to find the optimal hyper-plane as the classification boundary to maximize the interval. The classification hyper-plane of samples is expressed as , and the interval of the hyper-plane is defined as . The maximum interval is an important concept of SVM. It is difficult to achieve complete data separation because of the influence of noise in reality. Over-fitting occurs easily when mapping the data to a very high dimension by a strong kernel function. Therefore, the system is expected to have a certain fault tolerance for noise and outliers, ensuring the robustness of the system. If the slack variable is added at this time, the original constraint equation can be changed to:
The constraint allows some points to appear at intervals smaller than 1, that is, outliers. The accurate classification will lead to some losses when discarding these outliers, but a bigger classification interval will be acquired, that is, more robust classification performance. Adding the loss to the target function, that is, penalty factor C, then the optimization problem can be written as:
The penalty factor C of the support vector machine (SVM) and the parameter g of the kernel function, that is, the variance in the radial basis, need to be selected appropriately. The basic method of selecting C and g is to search for the parameters through a grid, that is, to find the optimal solution in a certain sense by searching and comparing one by one, which is easy to implement. Grid search is to let C and g select discrete values in a certain range. Test results will be acquired taking the training set as input one by one. Final parameters will be determined according to the best result. In the search process, if multiple sets of results correspond to the highest recognition rate, the minimum C and the first set of g are selected because over-fitting occurs easily when C is too large.
In this paper, the method of two-level grid search is chosen. The step of each grid is gradually reduced. The first-level grid step is (3, 3). The best combination of C and g (Cbest1, gbest1) will be determined after the first level-grid search. Then, exact parameters will be selected with a smaller step. Experiments show that it is most appropriate that the step of C and g is set as (0.3, 0.3). At this point, the recognition rate will not be significantly improved with a smaller grid step, but the search time will increase. When the step increases, the time reduces, but the recognition rate decreases significantly. Therefore, the second-level grid is set at the size of 3 × 3 based on the first best grid point (Cbest1, gbest1) as the center, and the search step is set at (0.3, 0.3) for an accurate search.
When testing the training set, we adopt k-fold cross-validation in this paper to make the result more convincing. In addition, it is inevitable that there will be signal errors due to muscle jitter or errors of the system’s discrimination in the recognition results. In order to improve the accuracy and stability of the system, the Majority Vote (MV) algorithm is used to make decisions on the recognition results [51].
3. Results and Discussion
3.1. Analysis of EMG Signal Onset Detection
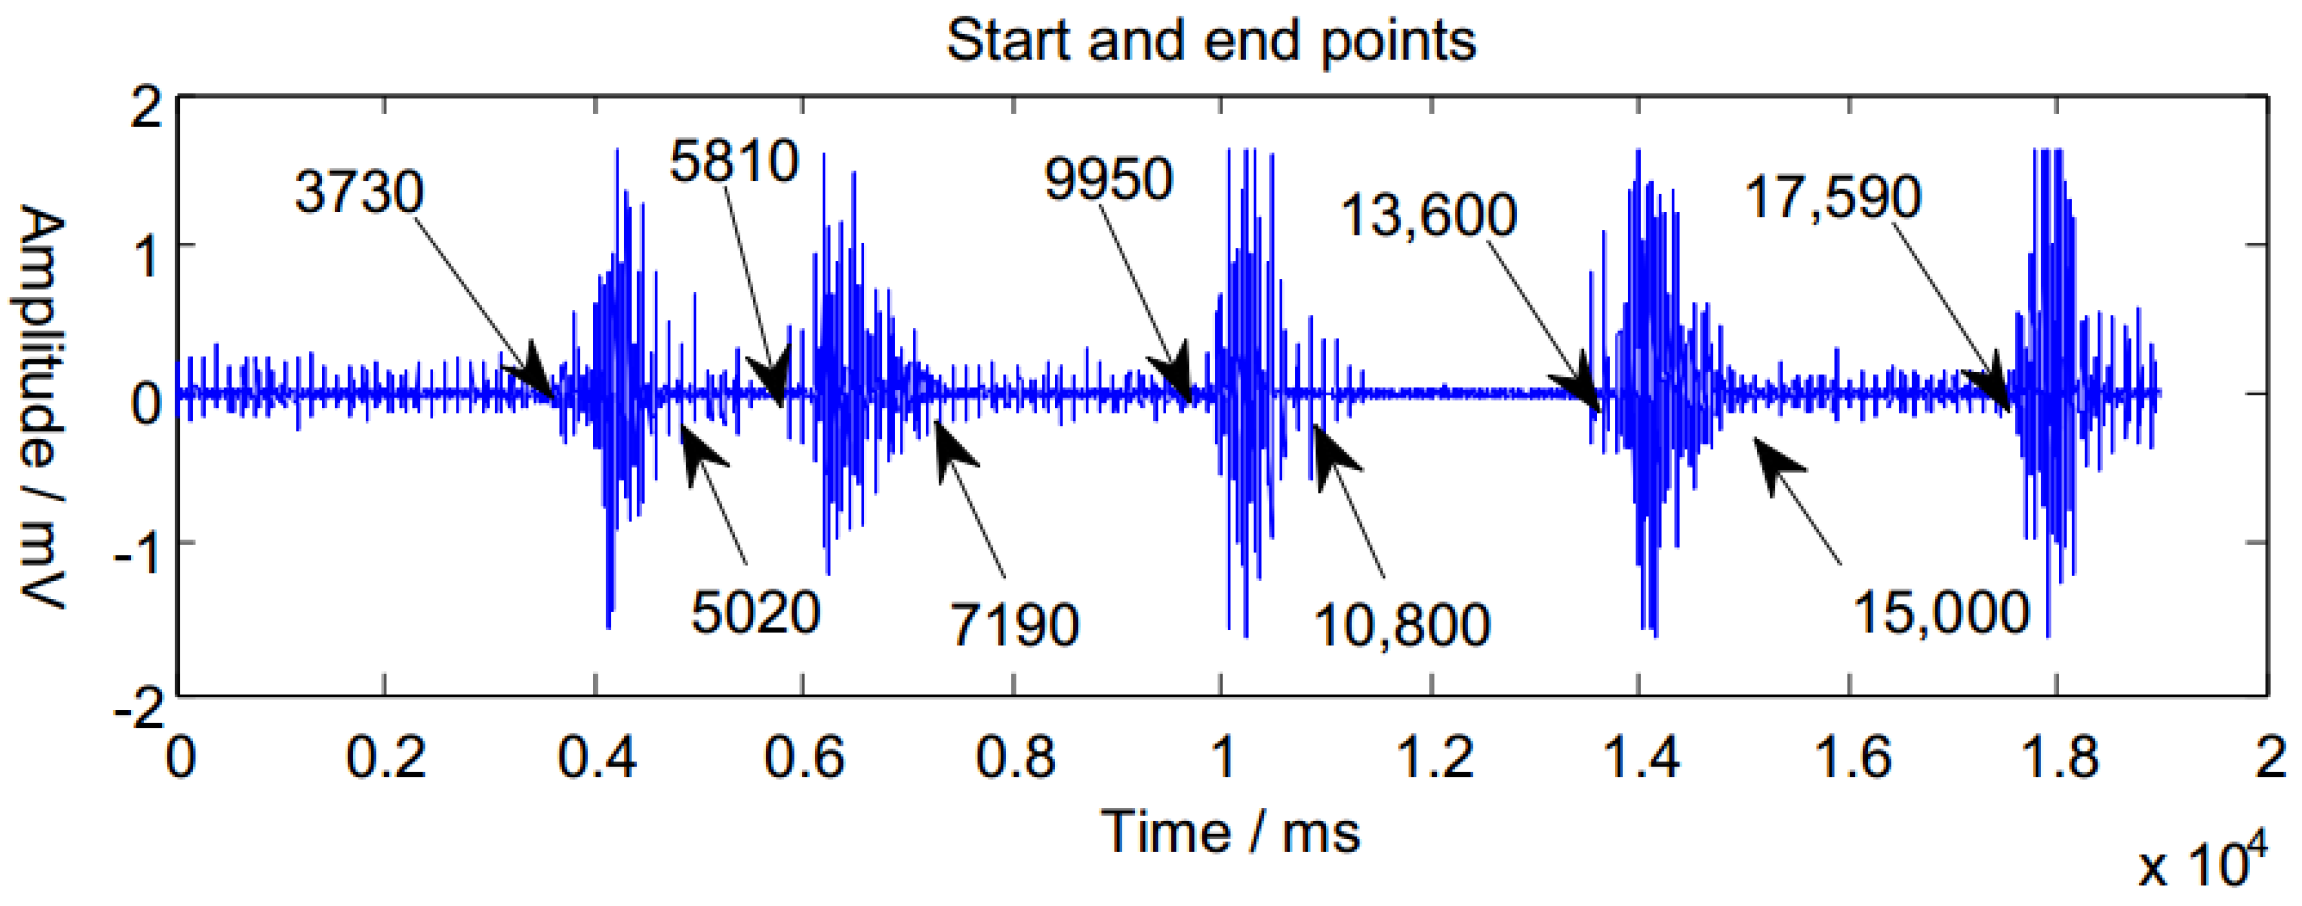
In order to verify the effectiveness of the proposed movement onset detection method, the moving average method and the Teager–Kaiser energy method were used to compare the detection results. The start and end points of the original signal were confirmed by observation as shown in Figure 3.
The three methods were employed for movement onset detection, respectively, and the results are shown in Table 1. The misjudged points are marked in bold with a short underline.
It can be seen that the moving average method has some mistakes in movement segment detection, but the two error points happen to be between the previous action start point and the next end point, thus the final segmentation will not be affected. The Teager–Kaiser operator can also get the start and end of the signal, but the resulting active segment will be shortened compared to the two other methods. The proposed power spectral correlation coefficient method can accurately determine the starting and ending points of the movement segment, and the signal length will not be lost. Besides, there is no misjudgment point for the signal, which indicates a good fault tolerance. In addition, the other signal segments are also processed as above, and the results also show that the proposed method can achieve good movement segment detection.
3.2. Analysis of Signal De-Noising Results
Error bits often occur along with the signal transmission. As shown in Figure 4, there are a lot of glitches or continuous segments of noise existed in the original accelerometer signals.
The commonly used median filtering method was used to deal with the noise, and the neighborhood window was set as . Then, the glitch noise could almost be filtered out completely, and the results are shown in Figure 5. However, many details of the accelerometer signals were also filtered out, resulting in a lack of information.
.
Then, we adopted the curve fitting method based on median filtering proposed in this paper to deal with the noise, and set the neighborhood window as through experiment contrasts, resulting in better performance. The results are shown in Figure 6.
3.3. Spatial Distribution of Features
In this paper, four-channel EMG signals were collected, so the time-domain feature dimension is 4, the number of wavelet coefficients is , and the DTW distance feature dimension of the accelerometer signals is equal to the number of lower limb motion classes, 5. In order to visually observe the spatial distribution of these features in two-dimensional space, the PCA method was used to reduce the dimension of these features to two dimensions.
After analyzing the features of accelerometer signal and sEMG, the two signal sources were merged, and the feature can be represented as . and represent the features of sEMG and accelerometer signals respectively, and the two features are synchronous.
Figure 7, Figure 8 and Figure 9 show the spatial distribution of features from healthy subjects. Figure 10 shows the spatial distribution of an amputated volunteer. (ds, ups, walk, up, sit represent walking downstairs, walking upstairs, walking forward, standing and squatting, respectively.)
From the spatial distribution in Figure 7, Figure 8, Figure 9 and Figure 10, we can see that these features all have some degree of separation. The separating degree of the accelerometer signal features of the five subjects is obvious, which proves the effectiveness of the proposed feature extraction method based on DTW distance. For the healthy subjects, the separating degree of the time-domain union feature is greater than that of a single time-domain feature, and the separating degree of the principal components of the wavelet coefficients is also significant. For the amputated subject, there is a certain degree of separation between the various features, in which the separating degree of the accelerometer signal features is most obvious. For this judgment, the method proposed in this paper has the prospect of applying to people with limb disabilities.
3.4. Analysis of Classification and Recognition Results
Firstly, the original LDA classifier and the Gaussian kernel-based LDA classifier are respectively used to classify different features in this study. For the time-domain features, multiple features are selected to be combined in much of the literature, and it can be seen from Figure 8 that the separating degree of the time-domain union feature is greater than that of a single time-domain feature. Therefore, only the results of the time-domain union feature are counted in the table. In this paper, the k-fold verification method is used to verify the classification effect of the used classifier. Here, k = 3, and the mean value of the recognition accuracy is calculated as the final recognition result for each subject. The classification results of the two kinds of LDA classifiers are shown in Table 2 and Table 3, where Subjects 1–4 are healthy subjects, and Subject 5 is the amputated subject.
It can be seen from Table 2 and Table 3 that the matching distance feature of the accelerometer signals based on the DTW algorithm proposed in this paper has the best performance compared to the time-domain union feature and wavelet feature of the sEMG signals. Meanwhile, because of the variation of the amplitude of sEMG signals in the movements of lower limbs, the recognition accuracy is low when using original LDA to classify the commonly used sEMG features, as little as 50–60% for healthy subjects, which further confirms that it is difficult to obtain good classification results from these features in the linear space, and it is necessary to classify the features in nonlinear space. Comparing Table 2 and Table 3, we can see that the classification accuracy of the Gaussian kernel-based LDA is improved by the nonlinear mapping of feature space, and the effect is obviously better than that of the original LDA.
The SVM is proposed for small sample problems, and it has great advantages for nonlinear and high-dimensional pattern recognition. As a result, the SVM classifier is also adopted to classify the different motion modes, where the kernel function is selected as the RBF kernel function, and the parameters C and g are selected by using the grid search optimization method discussed in Section 2.4.2. The classification results of the five subjects with SVM are shown in Table 4.
It can be seen from Table 3 and Table 4 that, for both the Gaussian kernel-based LDA classifier and the SVM classifier, the matching distance feature of accelerometer signals based on the DTW algorithm proposed in this paper has the best performance among these single features. Meanwhile, SVM has a higher accuracy and better stability of recognition results than the Gaussian kernel-based LDA for these single features.
However, the above motion recognition result is only up to 90% (by the accelerometer feature), which cannot meet the needs of the application. Additionally, the features of accelerometer signals and sEMG signals can be combined to achieve more satisfactory classification results (above 95%), as shown in Table 5. For the single features and the fused features, the classification results of the Gaussian kernel-based LDA and SVM are shown in Figure 11 and Figure 12, respectively.
It can be seen from the above tables and figures that for the lower limb motion recognition of the five subjects, the recognition effect with fused features of sEMG and accelerometer signals is better than the recognition effect with sEMG signals or accelerometer signals alone. In addition, for the healthy subjects, the wavelet feature of sEMG signals combined with an accelerometer feature will achieve a better recognition effect. For the amputated subject, a better recognition effect can be obtained by a Gaussian kernel-based LDA with the fused features of an sEMG time-domain union feature and an accelerometer feature, by SVM classifier; however, the results with the fused features of an sEMG wavelet feature and an accelerometer feature seem to be better. In general, the recognition effect of the SVM classifier is better than that of Gaussian kernel-based classifier, and the recognition effect with fused features is much better than that with an sEMG feature or an accelerometer feature alone.
4. Conclusions
In this paper, sEMG signals and accelerometer signals are fused to recognize different motion patterns of lower limbs. A median filtering-based curve fitting method is proposed to remove accelerometer noises, and an sEMG power spectral correlation coefficient method is proposed for movement onset detection, which are both more effective than current methods. Then, we mainly analyze the feature extraction methods for the sEMG and accelerometer signals, and introduce the extraction methods of time-domain features and wavelet transform coefficients commonly used for sEMG signals. Besides, the matching distance feature based on the DTW algorithm is proposed according to the periodic variational regularity of accelerometer signals.
At last, a Gaussian kernel-based LDA classifier and an SVM classifier are used for classification. The results show that the features of the accelerometer signals based on DTW matching distance have the biggest degree of separation, and the recognition effect with fused features of sEMG and accelerometer signals is much better than the recognition effect with the features of a single signal source. In addition, compared with Gaussian kernel-based LDA, SVM has the higher recognition rate and more stable performance in experiment. Among them, the recognition rate of SVM with the fused features of a wavelet coefficients feature and an accelerometer signal feature is the highest, between the range of 95.5% to 99.8% for different subjects. The average level of the recognition rate is as high as 98.1 ± 1.6(%), which is more excellent and more stable compared to the current state-of-art (about 95%). In addition, a good recognition effect and real-time performance can be obtained together by using a sliding window analysis in signal processing, making our approach more advantageous in the real-time control of intelligent devices.
However, the signal acquisition of this study is mainly from healthy subjects, and the study has not been applied to the real-time control of intelligent prosthesis yet. In a follow-up study, we will carry out experiments on more subjects with limb disabilities by cooperating with a rehabilitation hospital, so that our research has better application prospects in the intelligent control of prosthesis.
Acknowledgments
This work was supported by the National Natural Science Foundation of China (Grant Nos. 51675389 and 51475342) and the Fundamental Research Funds for the Central Universities (Grant No. 2017-IVA-051).
Author Contributions
Yanan Zhang conducted research for the related works; Weili Qi and Kun Chen conceived the research subject and designed the experiments; Weili Qi performed the experiments; Qingsong Ai and Yanan Zhang analyzed the data; and Qingsong Ai and Kun Chen wrote the paper. Quan Liu supervised the paperwork and provided a review, comments, assessment, etc. All authors have read and approved the final manuscript.
Conflicts of Interest
The authors declare no conflict of interest.
References
- China Disabled Persons’ Federation. Available online: http://www.cdpf.org.cn/sjzx/cjrgk/201206/t20120626_387581.shtml (accessed on 26 June 2012).
- China Disabled Persons’ Federation. Available online: http://www.cdpf.org.cn/zcwj/zxwj/201604/t20160401_548009.shtml (accessed on 1 April 2016).
- Wu, S.K.; Waycaster, G.; Shen, X. Electromyography-based control of active above-knee prostheses. Control Eng. Pract. 2011, 19, 875–882. [Google Scholar] [CrossRef]
- Hoover, C.D.; Fulk, G.D.; Fite, K.B. Stair Ascent with a Powered Transfemoral Prosthesis under Direct Myoelectric Control. IEEE/ASME Trans. Mechatron. 2013, 18, 1191–1200. [Google Scholar] [CrossRef]
- Xing, K.; Yang, P.; Huang, J.; Wang, Y.; Zhu, Q. A real-time EMG pattern recognition method for virtual myoelectric hand control. Neurocomputing 2014, 136, 345–355. [Google Scholar] [CrossRef]
- Zhang, Q.; Xi, X.; Ma, Y.; Luo, Z. Control Technology of Teleoperation Robot Based on EMG Signal. J. Basic Sci. Eng. 2013, 21, 1199–1209. (In Chinese) [Google Scholar]
- Liu, J.; Zhou, P. A Novel Myoelectric Pattern Recognition Strategy for Hand Function Restoration after Incomplete Cervical Spinal Cord Injury. IEEE Trans. Neural Syst. Rehabil. Eng. 2013, 21, 96–103. [Google Scholar] [CrossRef] [PubMed]
- Aoi, S.; Egi, Y.; Sugimoto, R.; Yamashita, T.; Fujiki, S.; Tsuchiya, K. Functional Roles of Phase Resetting in the Gait Transition of a Biped Robot From Quadrupedal to Bipedal Locomotion. IEEE Trans. Robot. 2012, 28, 1244–1259. [Google Scholar] [CrossRef] [Green Version]
- Al-Ani, A.; Koprinska, I.; Naik, G.R.; Khushaba, R.N. A dynamic channel selection algorithm for the classification of EEG and EMG data. In Proceedings of the International Joint Conference on Neural Networks (IJCNN), Vancouver, BC, Canada, 24–29 July 2016; pp. 4076–4081. [Google Scholar]
- Arjunan, S.P.; Kumar, D.K.; Naik, G. Computation and evaluation of features of surface electromyogram to identify the force of muscle contraction and muscle fatigue. BioMed Res. Int. 2014, 2014, 197960. [Google Scholar] [CrossRef] [PubMed]
- Arjunan, S.P.; Kumar, D.; Naik, G. Independence between two channels of surface electromyogram signal to measure the loss of motor units. Meas. Sci. Rev. 2015, 15, 152–155. [Google Scholar] [CrossRef]
- Naik, G.R.; Kumar, D.K.; Palaniswami, M. Signal processing evaluation of myoelectric sensor placement in low-level gestures: Sensitivity analysis using independent component analysis. Exp. Syst. 2014, 31, 91–99. [Google Scholar] [CrossRef]
- Xi, X.; Tang, M.; Miran, S.M.; Luo, Z. Evaluation of features extraction and recognition for activity monitoring and fall detection based on wearable sEMG sensors. Sensors 2017, 17, E1229. [Google Scholar] [CrossRef] [PubMed]
- Pendharkar, G.; Naik, G.R.; Acharyya, A.; Nguyen, H.T. Multiscale PCA to distinguish regular and irregular surfaces using tri axial head and trunk acceleration signals. In Proceedings of the 37th Annual International Conference of the IEEE Engineering in Medicine and Biology Society (EMBS), Milan, Italy, 25–29 August 2015; pp. 4122–4125. [Google Scholar]
- Naik, G.R.; Pendharkar, G.; Nguyen, H.T. Wavelet PCA for automatic identification of walking with and without an exoskeleton on a treadmill using pressure and accelerometer sensors. In Proceedings of the 38th Annual International Conference of the IEEE Engineering in Medicine and Biology Society (EMBS), Orlando, FL, USA, 16–20 August 2016; pp. 1999–2002. [Google Scholar]
- Pendharkar, G.; Naik, G.R.; Nguyen, H.T. Using blind source separation on accelerometry data to analyze and distinguish the toe walking gait from normal gait in ITW children. Biomed. Signal Process. Control 2014, 13, 41–49. [Google Scholar] [CrossRef]
- Yang, C.C.; Hsu, Y.L. A review of accelerometry-based wearable motion detectors for physical activity monitoring. Sensors 2010, 10, 7772–7788. [Google Scholar] [CrossRef] [PubMed]
- Kangas, M.; Konttila, A.; Lindgren, P.; Winblad, I.; Jamsa, T. Comparison of low-complexity fall detection algorithms for body attached accelerometers. Gait Posture 2008, 28, 285–291. [Google Scholar] [CrossRef] [PubMed]
- Liu, S.H.; Cheng, W.C. Fall detection with the support vector machine during scripted and continuous unscripted activities. Sensors 2012, 12, 12301–12316. [Google Scholar] [CrossRef] [PubMed]
- Young, A.J.; Kuiken, T.A.; Hargrove, L.J. Analysis of using EMG and mechanical sensors to enhance intent recognition in powered lower limb prostheses. J. Neural Eng. 2014, 11, 056021. [Google Scholar] [CrossRef] [PubMed]
- Wentink, E.C.; Schut, V.G.; Prinsen, E.C.; Rietman, J.S.; Veltink, P.H. Detection of the onset of gait initiation using kinematic sensors and EMG in transfemoral amputees. Gait Posture 2014, 39, 391–396. [Google Scholar] [CrossRef] [PubMed]
- Fan, Y. Study on Lower Limb Exoskeleton for Rehabilitation Based on Multi-source Information Fusion Including sEMG & Interactive Force and Its Clinical Trail. Ph.D. Thesis, Shanghai Jiao Tong University, Shanghai, China, 2014. (In Chinese). [Google Scholar]
- Xi, X.; Wu, H.; Zuo, J.; Luo, Z. Study on fall detection based on surface EMG and plantar pressure signal fusion. Chin. J. Sci. Instrum. 2015, 36, 2044–2049. (In Chinese) [Google Scholar]
- Miller, J.D.; Beazer, M.S.; Hahn, M.E. Myoelectric Walking Mode Classification for Transtibial Amputees. IEEE Trans. Biomed. Eng. 2013, 60, 2745–2750. [Google Scholar] [CrossRef] [PubMed]
- Huang, H.; Kuiken, T.A.; Lipschutz, R.D. A Strategy for Identifying Locomotion Modes Using Surface Electromyography. IEEE Trans. Biomed. Eng. 2009, 56, 65–73. [Google Scholar] [CrossRef] [PubMed]
- He, H.; Fan, Z.; Hargrove, L.J.; Zhi, D.; Rogers, D.R.; Englehart, K.B. Continuous Locomotion-Mode Identification for Prosthetic Legs Based on Neuromuscular–Mechanical Fusion. IEEE Trans. Biomed. Eng. 2011, 58, 2867–2875. [Google Scholar]
- Wu, H.; Xi, X.; Luo, Z. Fall Recognition Based on EMG Signal Entropy and PSO-SVM. Chin. J. Sens. Actuators 2015, 28, 1586–1590. (In Chinese) [Google Scholar]
- Cheng, J.; Chen, X.; Shen, M. A Framework for Daily Activity Monitoring and Fall Detection Based on Surface Electromyography and Accelerometer Signals. IEEE J. Biomed. Health Inform. 2013, 17, 38–45. [Google Scholar] [CrossRef] [PubMed]
- Liu, L.; Yang, P.; Liu, Z. Lower limb locomotion-mode identification based on multi-source information and particle swarm optimization algorithm. J. Zhejiang Univ. 2015, 49, 439–447. (In Chinese) [Google Scholar]
- Tikkanen, O.; Karkkainen, S.; Haakana, P.; Kallinen, M.; Pullinen, T.; Finni, T. EMG, heart rate, and accelerometer as estimators of energy expenditure in locomotion. Med. Sci. Sports Exerc. 2014, 46, 1831–1839. [Google Scholar] [CrossRef] [PubMed]
- Biagrtti, G.; Crippa, P.; Falaschetti, L.; Orcioni, S.; Turchetti, C. A Portable Wireless sEMG and Inertial Acquisition System for Human Activity Monitoring. In Proceedings of the International Conference on Bioinformatics and Biomedical Engineering, Granada, Spain, 26–28 April 2017; pp. 608–620. [Google Scholar]
- Phinyomark, A.; Quaine, F.; Charbonnier, S.; Serviere, C.; Tarpin-Bernard, F.; Laurillau, Y. EMG feature evaluation for improving myoelectric pattern recognition robustness. Exp. Syst. Appl. 2013, 40, 4832–4840. [Google Scholar] [CrossRef]
- Wang, G.; Ren, D. Classification of surface electromyographic signals by means of multifractal singularity spectrum. Med. Biol. Eng. Comput. 2013, 51, 277–284. [Google Scholar] [CrossRef] [PubMed]
- Li, Y.; Chen, X.; Zhang, X.; Zhou, P. Several practical issues toward implementing myoelectric pattern recognition for stroke rehabilitation. Med. Eng. Phys. 2014, 36, 754–760. [Google Scholar] [CrossRef] [PubMed]
- Lorrain, T.; Jiang, N.; Farina, D. Influence of the training set on the accuracy of surface EMG classification in dynamic contractions for the control of multifunction prostheses. J. NeuroEng. Rehabil. 2011, 8, 25. [Google Scholar] [CrossRef] [PubMed]
- Li, W.; Zhao, L.; Li, T.; Yan, L.; Zhao, C. Application of sEMG Signals in Upper Extremity Rehabilitation of Stroke Patients. Chin. J. Rehabil. Med. 2013, 28, 163–165. (In Chinese) [Google Scholar]
- Bunderson, N.E.; Kuiken, T.A. Quantification of Feature Space Changes with Experience during Electromyogram Pattern Recognition Control. IEEE Trans. Neural Syst. Rehabil. Eng. 2012, 59, 1804–1807. [Google Scholar] [CrossRef] [PubMed]
- Zhang, F.; Huang, H. Source Selection for Real-Time User Intent Recognition toward Volitional Control of Artificial Legs. IEEE J. Biomed. Health Inform. 2013, 17, 907–914. [Google Scholar] [CrossRef] [PubMed]
- Shin, S.; Tafreshi, R.; Langari, R. A performance comparison of hand motion EMG classification. In Proceedings of the 2014 Middle East Conference on Biomedical Engineering (MECBME), Doha, Qatar, 17–20 February 2014; pp. 353–356. [Google Scholar]
- Kim, D.H.; Cho, C.Y.; Ryu, J. Real-Time Locomotion Mode Recognition Employing Correlation Feature Analysis Using EMG Pattern. ETRI J. 2014, 36, 99–105. [Google Scholar] [CrossRef]
- Hargrove, L.J.; Simon, A.M.; Lipschutz, R.; Finucane, S.B.; Kuiken, T.A. Non-weight-bearing neural control of a powered transfemoral prosthesis. J. NeuroEng. Rehabil. 2013, 10, 62. [Google Scholar] [CrossRef] [PubMed]
- Puttasakuf, T.; Sangworasil, M.; Matsuura, T. Feature extraction of wavelet transform coefficients for sEMG classification. In Proceedings of the 7th Biomedical Engineering International Conference (BMEiCON), Fukuoka, Japan, 26–28 November 2014; pp. 1–4. [Google Scholar]
- Mane, S.M.; Kambli, R.A.; Kazi, F.S.; Singh, N.M. Hand Motion Recognition from Single Channel Surface EMG Using Wavelet & Artificial Neural Network. Procedia Comput. Sci. 2015, 49, 58–65. [Google Scholar]
- Varol, H.A.; Sup, F.; Goldfarb, M. Multiclass Real-Time Intent Recognition of a Powered Lower Limb Prosthesis. IEEE Trans. Biomed. Eng. 2010, 57, 542–551. [Google Scholar] [CrossRef] [PubMed]
- Wong, D.F.; Chao, L.S.; Zeng, X.; Vai, M.I.; Lam, H.L. Time series for blind biosignal classification model. Comput. Biol. Med. 2014, 54, 32–36. [Google Scholar] [CrossRef] [PubMed]
- Scheme, E.; Englehart, K. Electromyogram pattern recognition for control of powered upper-limb prostheses: State of the art and challenges for clinical use. J. Rehabil. Res. Dev. 2011, 48, 643–659. [Google Scholar] [CrossRef] [PubMed]
- Lu, Z.; Chen, X.; Li, Q.; Zhang, X.; Zhou, P. A hand gesture recognition framework and wearable gesture-based interaction prototype for mobile devices. IEEE Trans. Hum.-Mach. Syst. 2014, 44, 293–299. [Google Scholar] [CrossRef]
- Zhang, L. Pattern Recognition and Motion Analysis of sEMG. Master’s Thesis, JiLin University, JiLin, China, 2013. (In Chinese). [Google Scholar]
- Chen, Y. Motion Pattern Recognition of sEMG Signals based Upper Limb Self-rehabilitation Training. Ph.D. Thesis, Shandong University, Shandong, China, 2015. (In Chinese). [Google Scholar]
- Subasi, A. Classification of EMG signals using PSO optimized SVM for diagnosis of neuromuscular disorders. Comput. Biol. Med. 2013, 43, 576–586. [Google Scholar] [CrossRef] [PubMed]
- Amsuss, S.; Goebel, P.M.; Jiang, N.; Graimann, B.; Paredes, L.; Farina, D. Self-correcting pattern recognition system of surface EMG signals for upper limb prosthesis control. IEEE Trans. Biomed. Eng. 2014, 61, 1167–1176. [Google Scholar] [CrossRef] [PubMed]
Figure 1.
Settings of analysis window and sliding window.

Figure 2.
Change of accelerometer signals when walking down stairs.
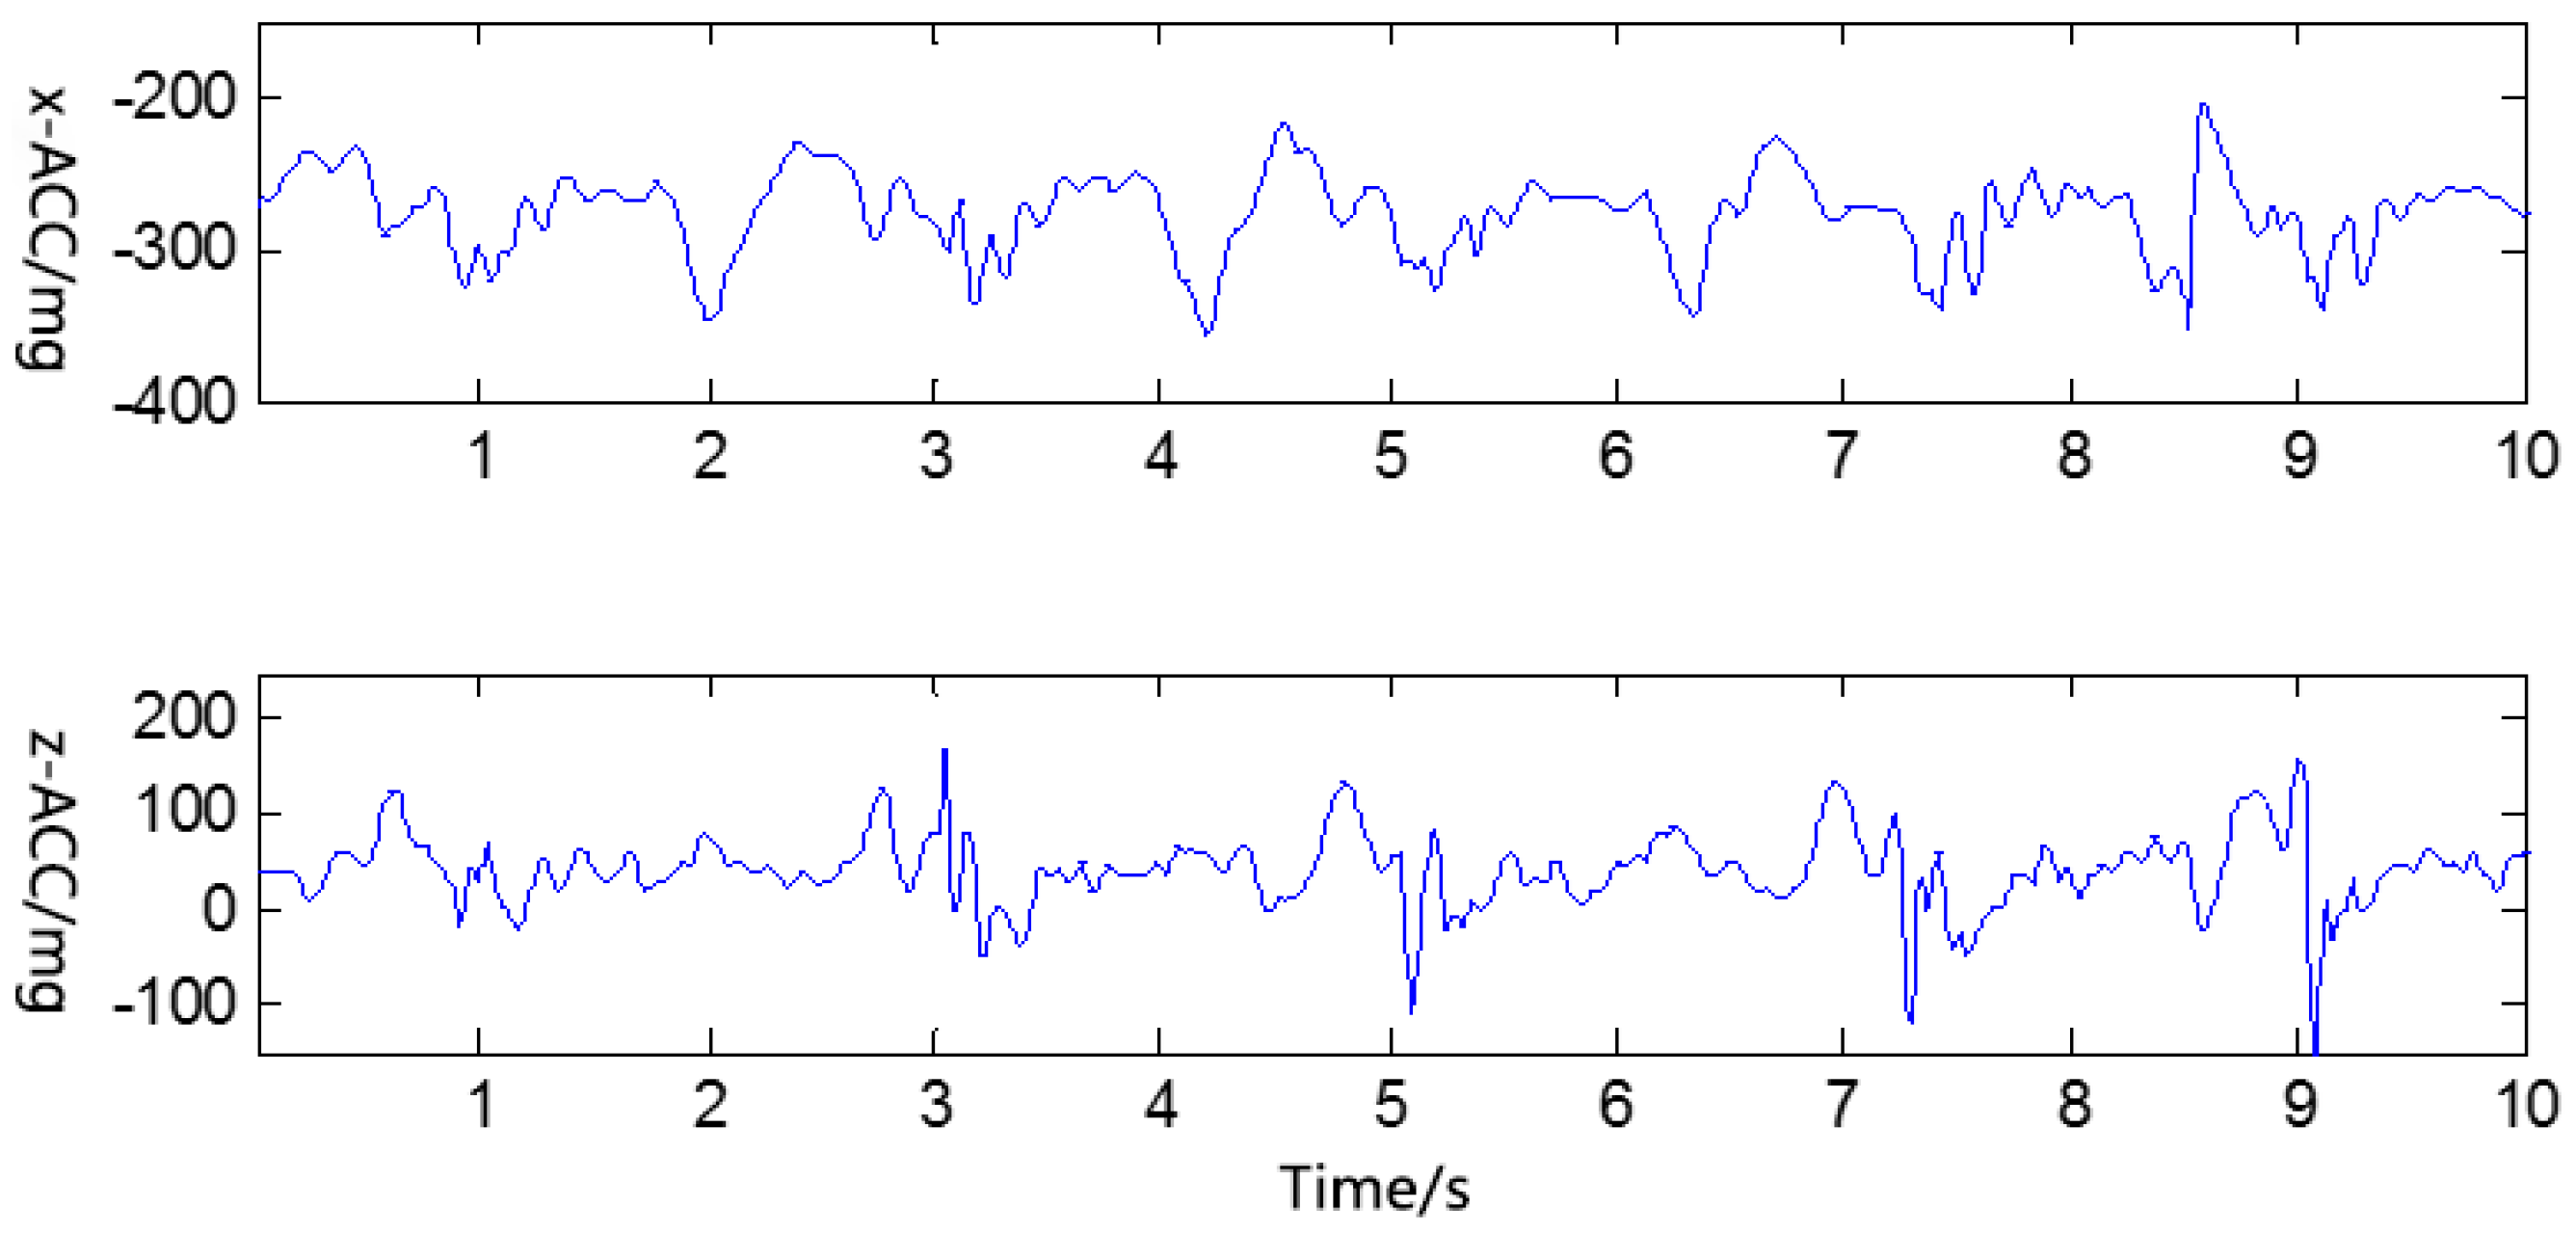
Figure 3.
Marks of start and end points of original signals.

Figure 4.
Original accelerometer signals when walking upstairs.
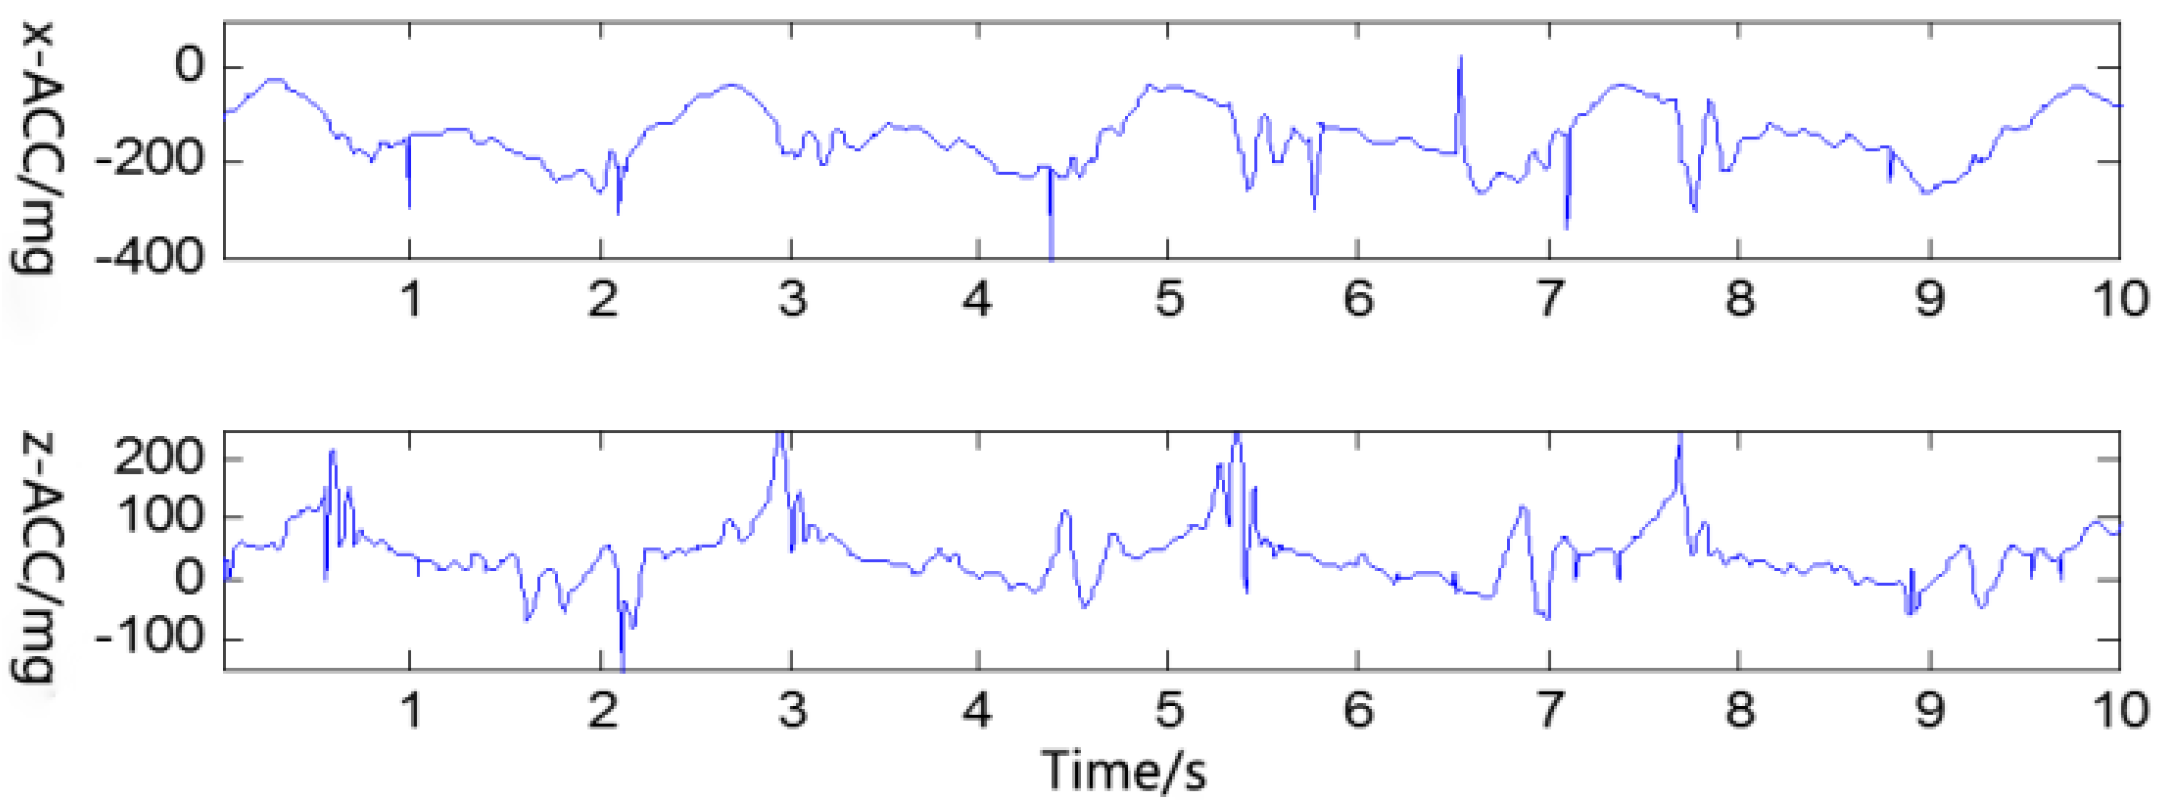
Figure 5.
De-noising results of median filtering when .
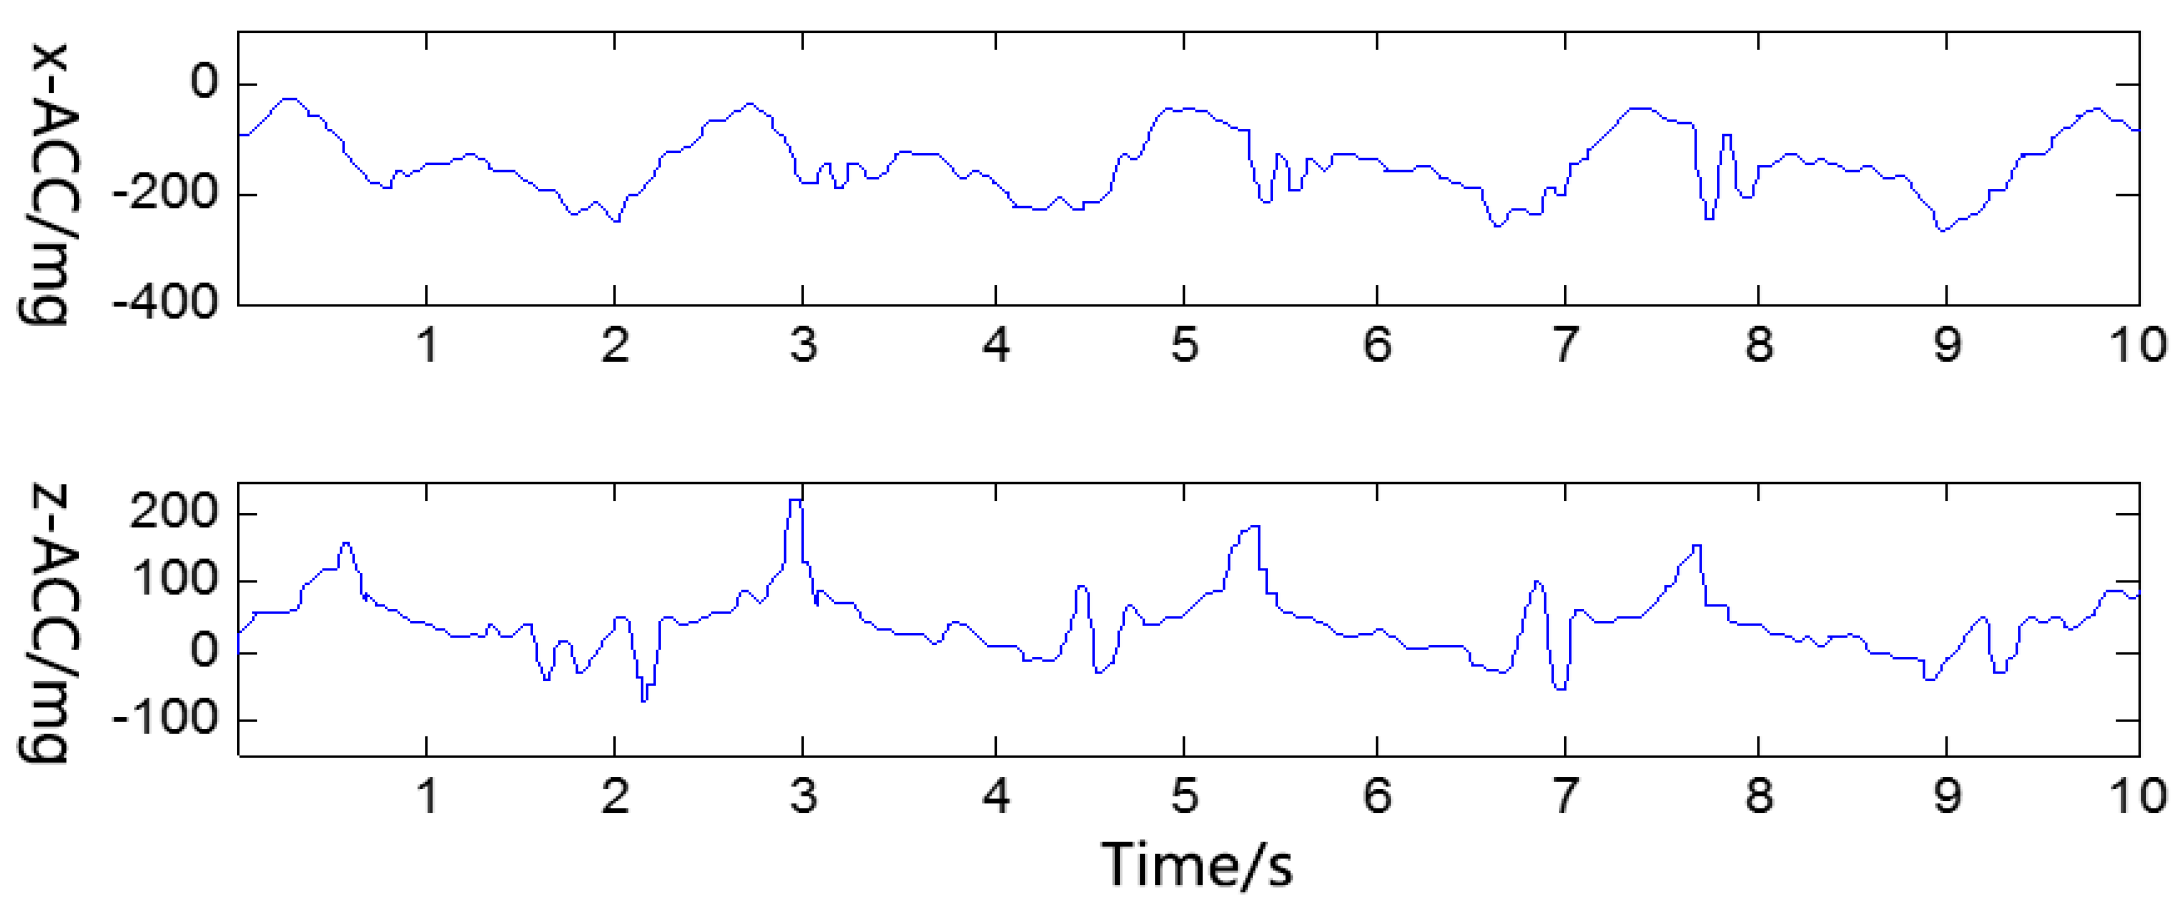
Figure 6.
De-noising results of curve fitting method based on median filtering.

Figure 7.
Spatial distribution of accelerometer signal features (ds, ups, walk, up, sit represent walking downstairs, walking upstairs, walking forward, standing and squatting, respectively).
Figure 7.
Spatial distribution of accelerometer signal features (ds, ups, walk, up, sit represent walking downstairs, walking upstairs, walking forward, standing and squatting, respectively).
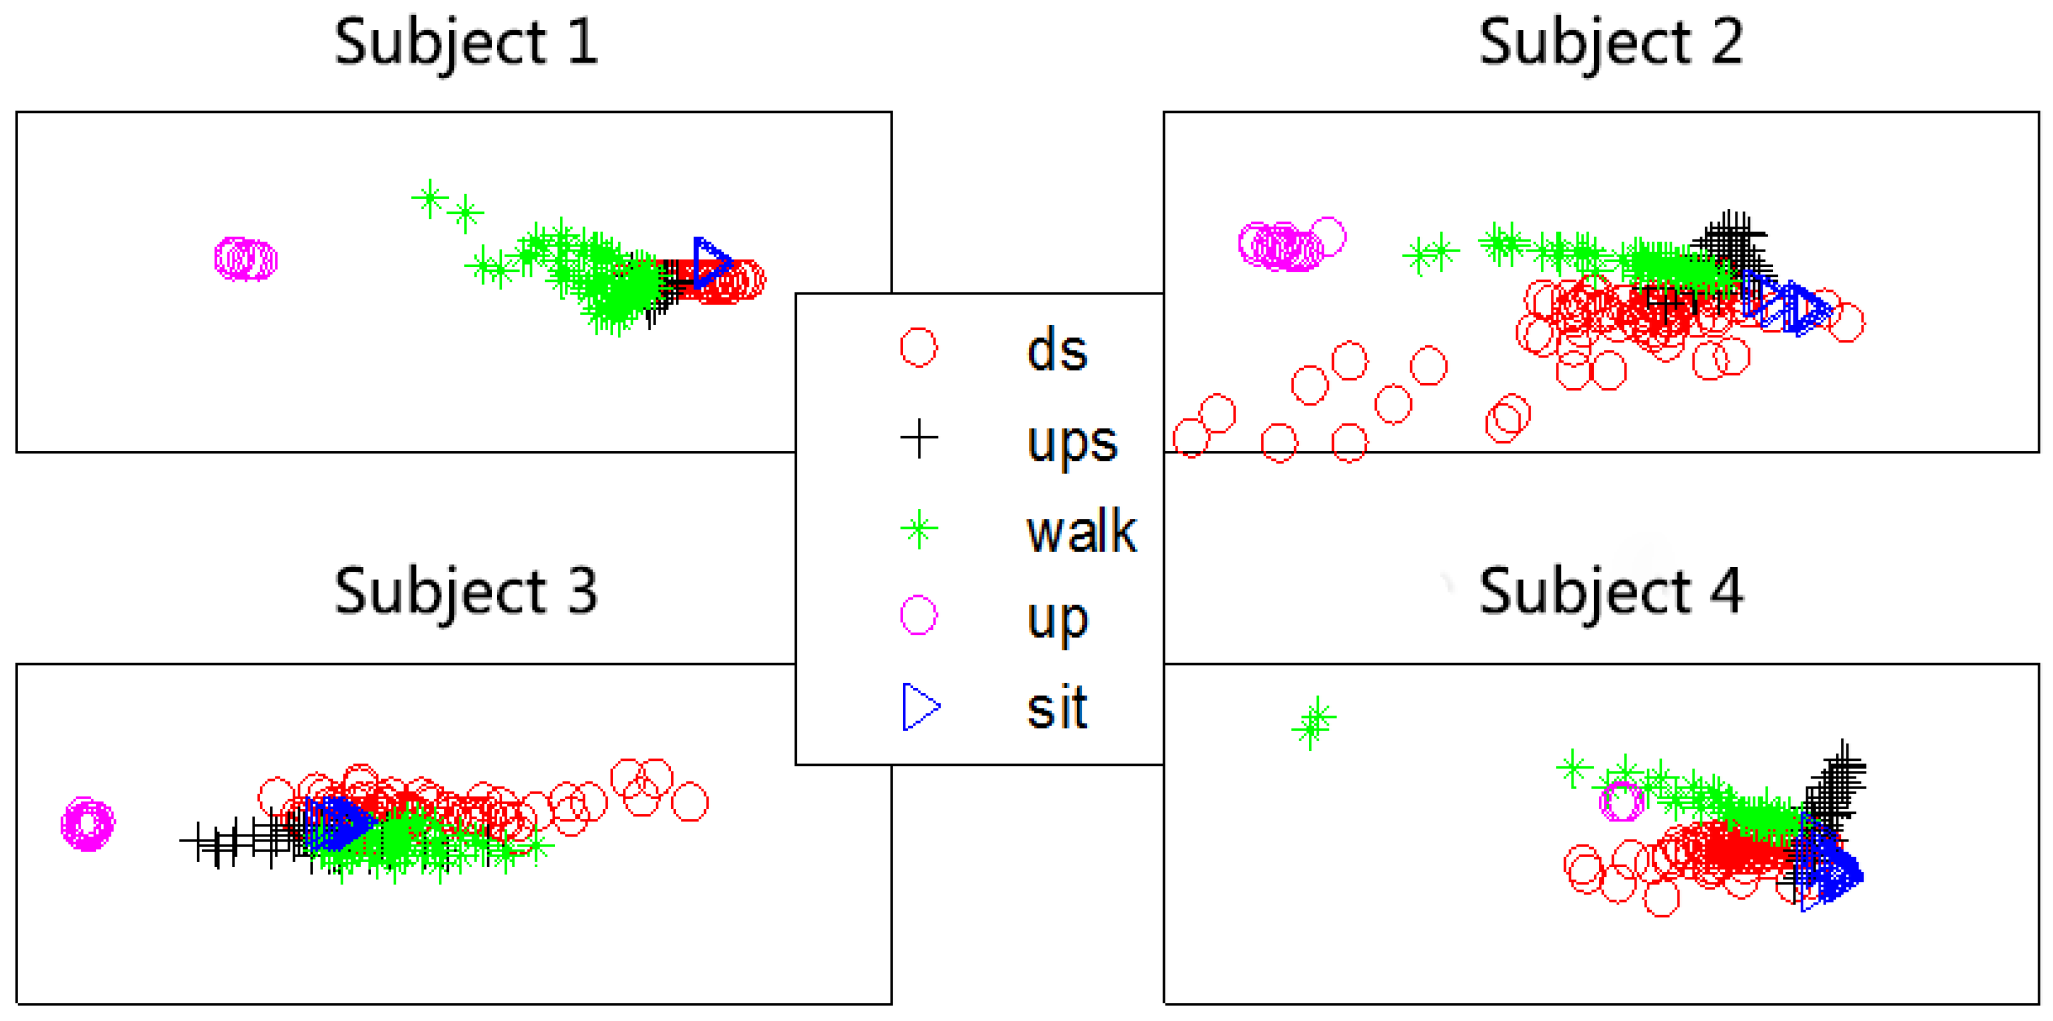
Figure 8.
Spatial distribution of surface electromyograghic (sEMG) time-domain features.
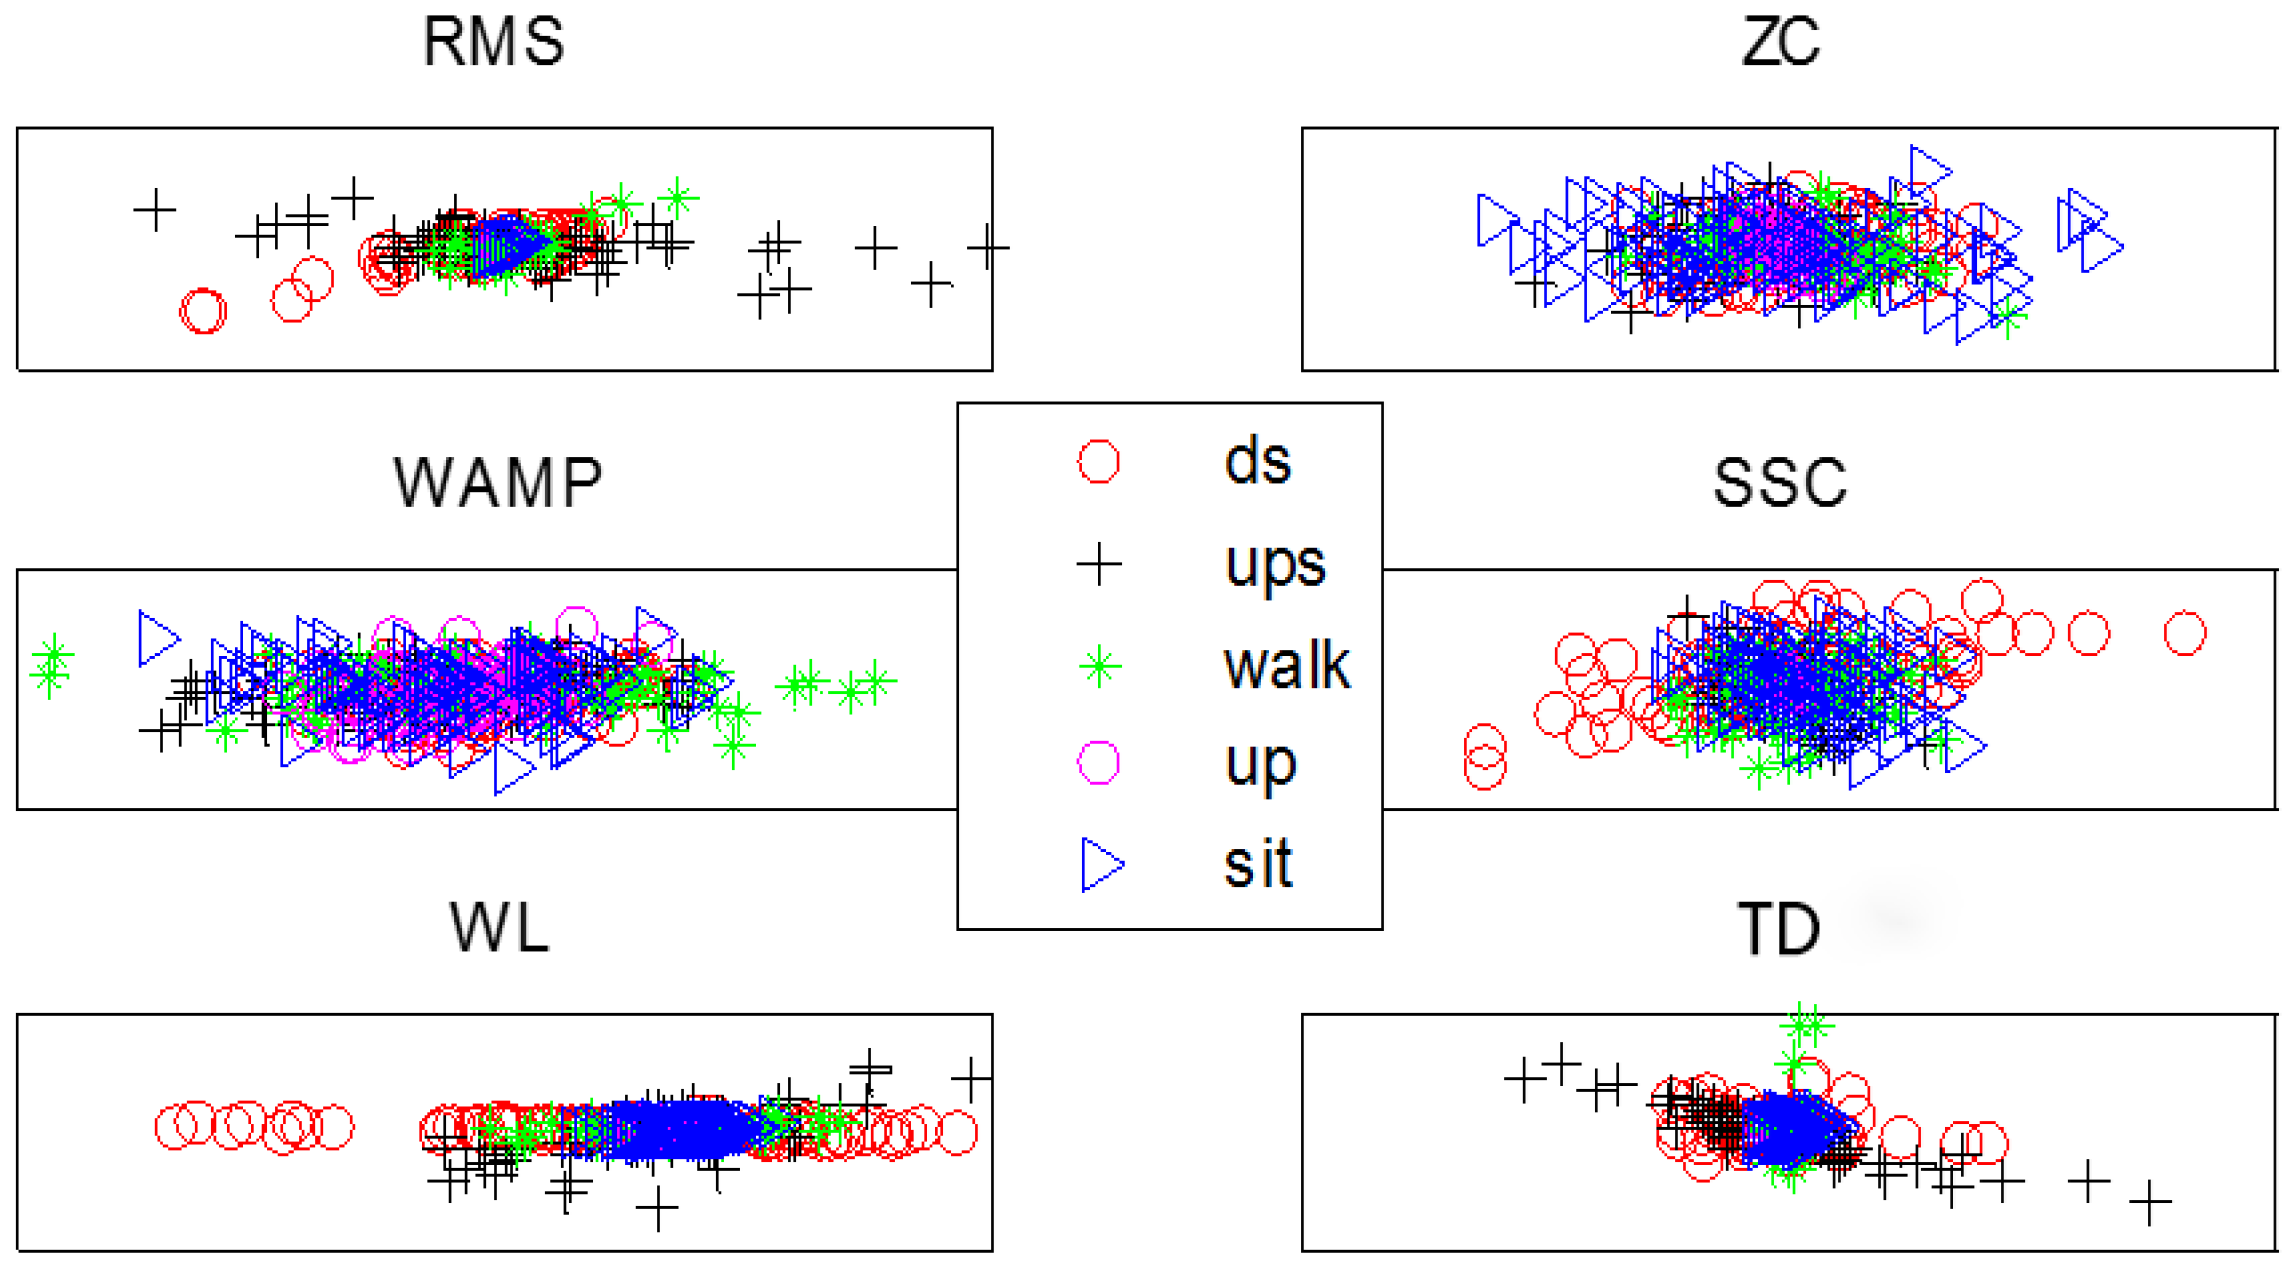
Figure 9.
Spatial distribution of sEMG wavelet principal component analysis (WT_PCA) features.
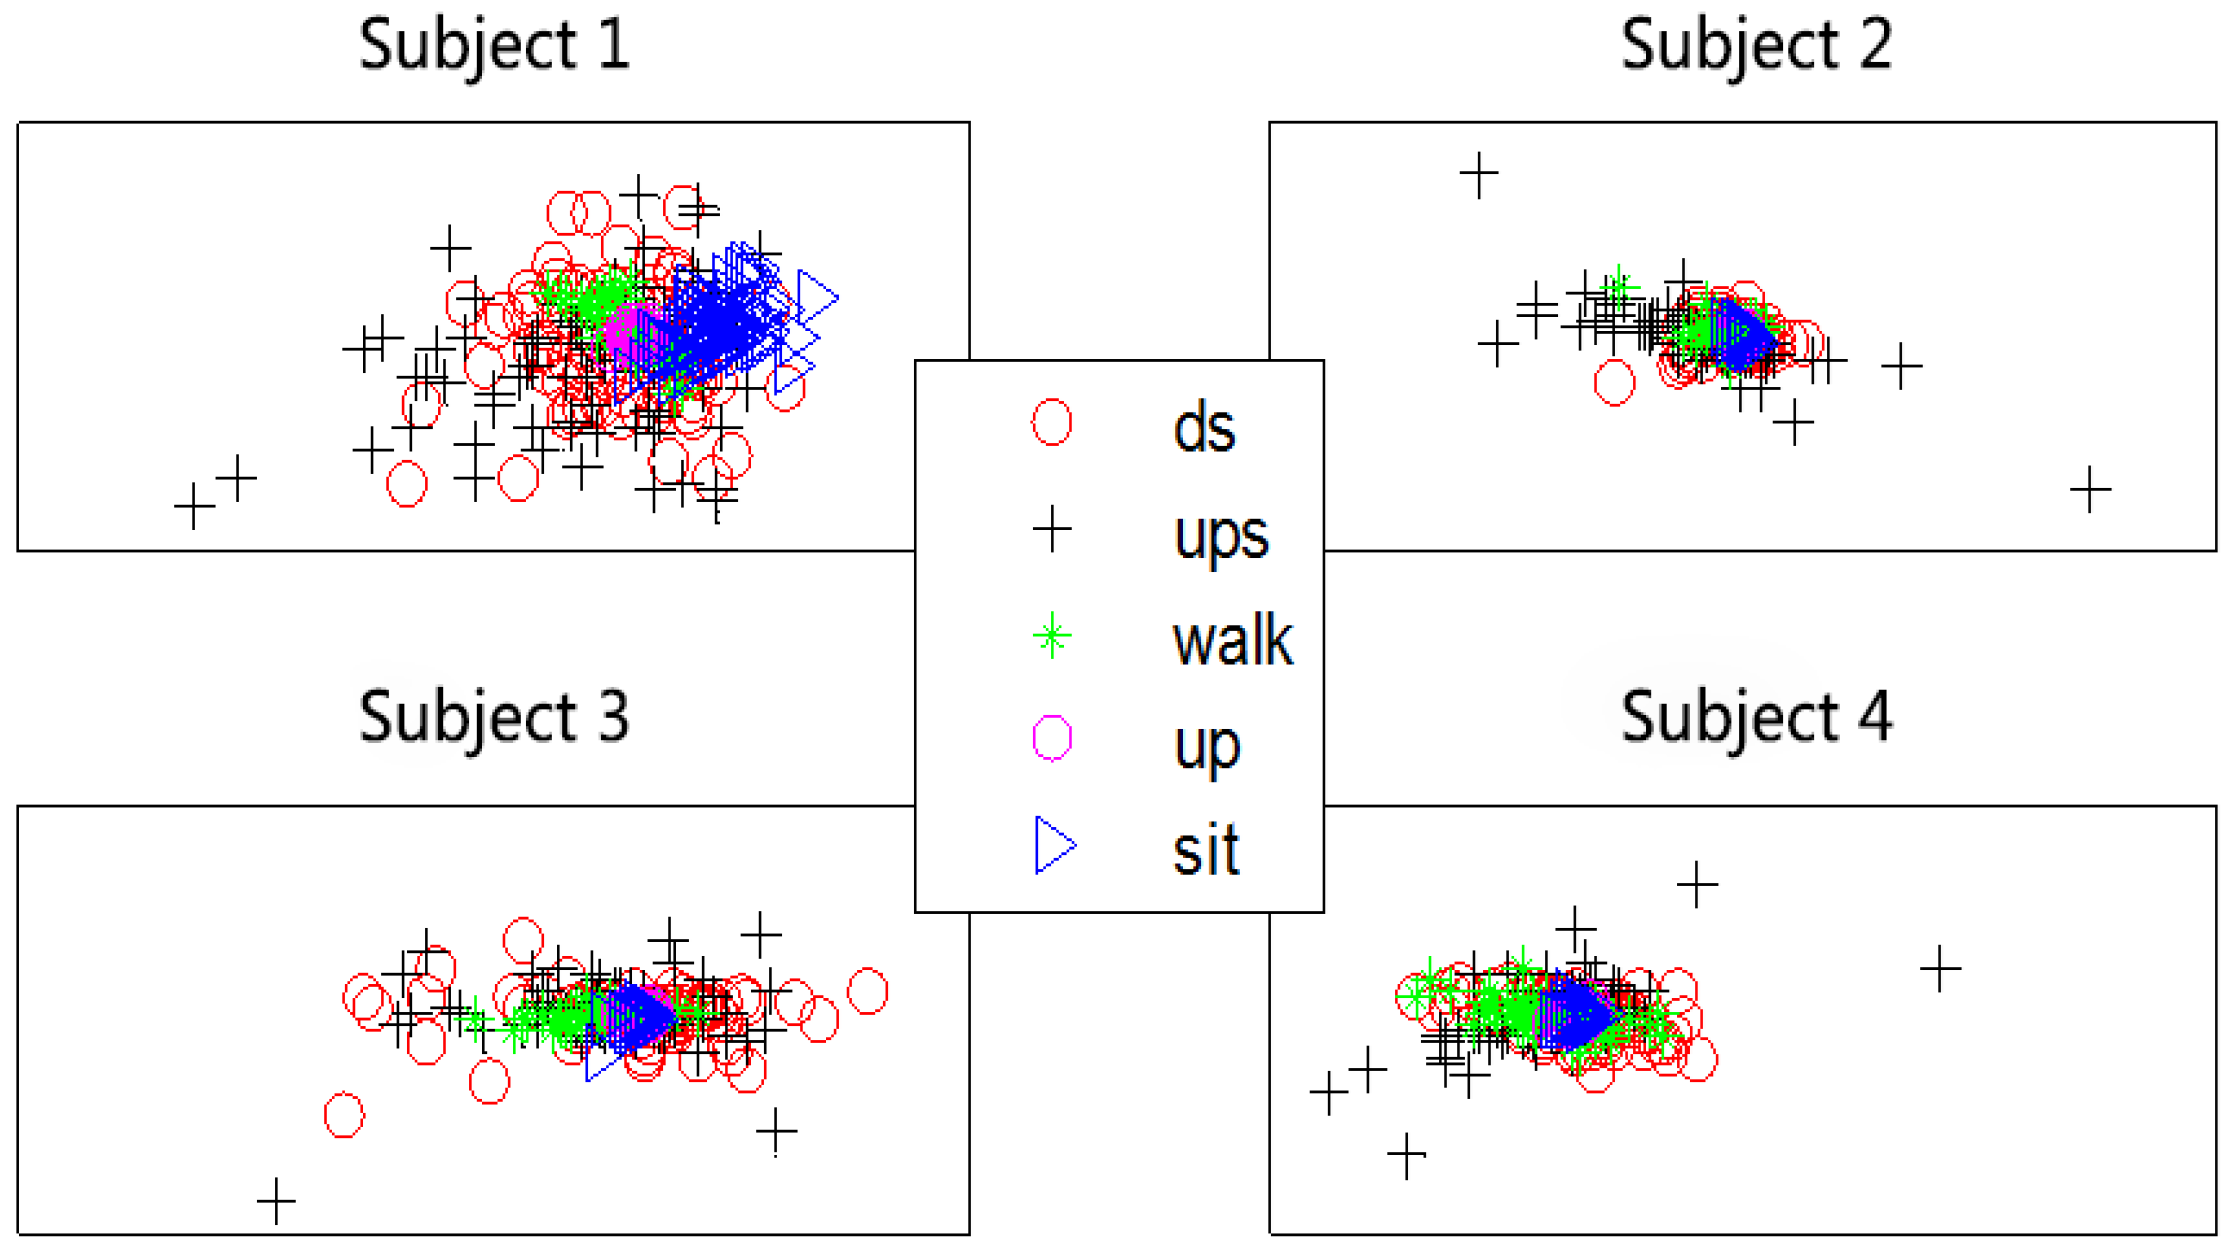
Figure 10.
Spatial distribution of features from Subject 5 (amputated volunteer).
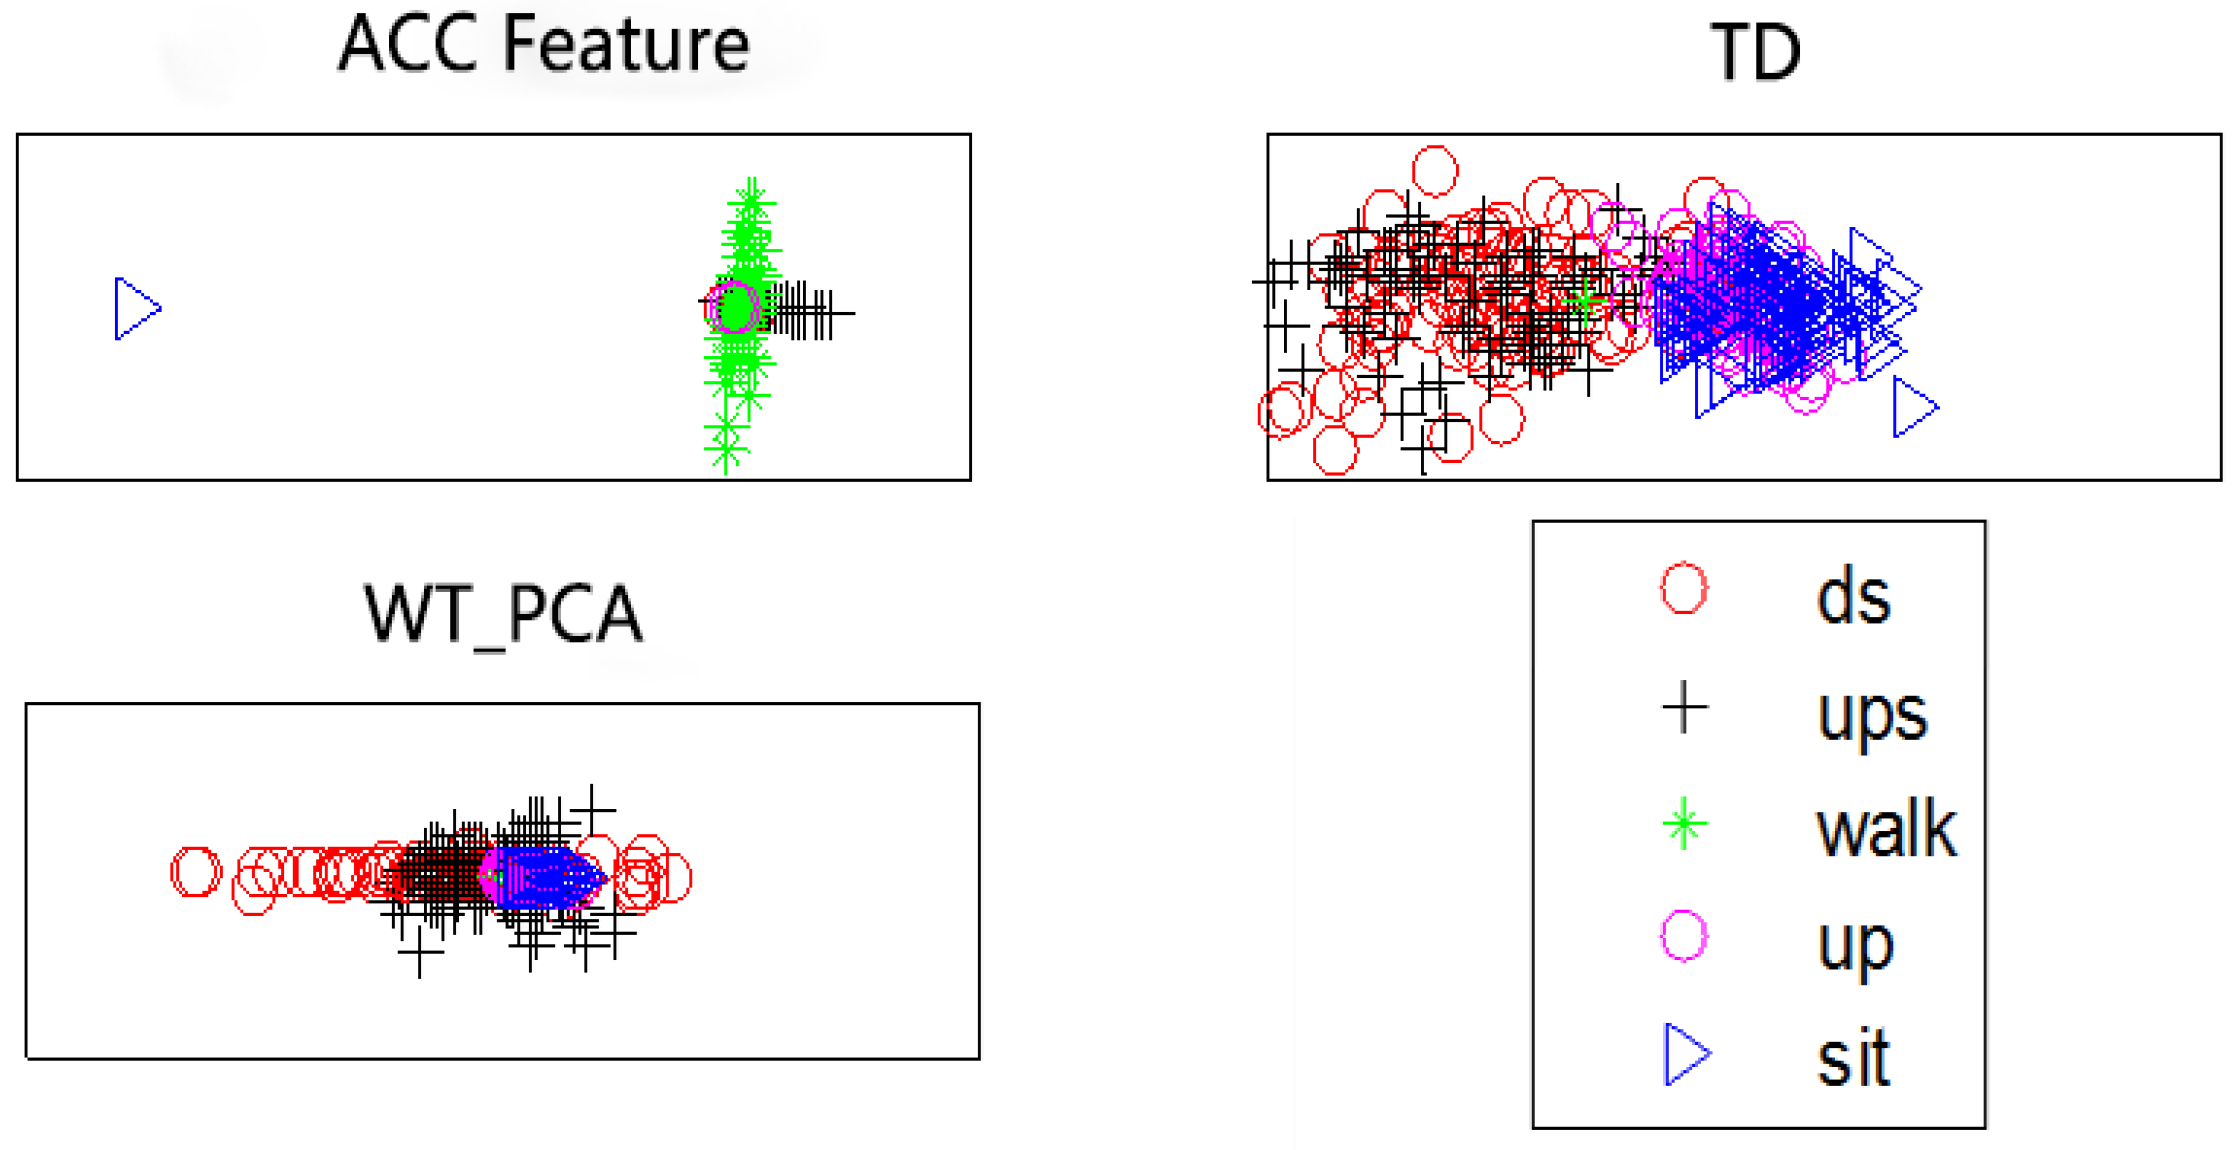
Figure 11.
Classification results of the Gaussian kernel-based LDA with five different features.
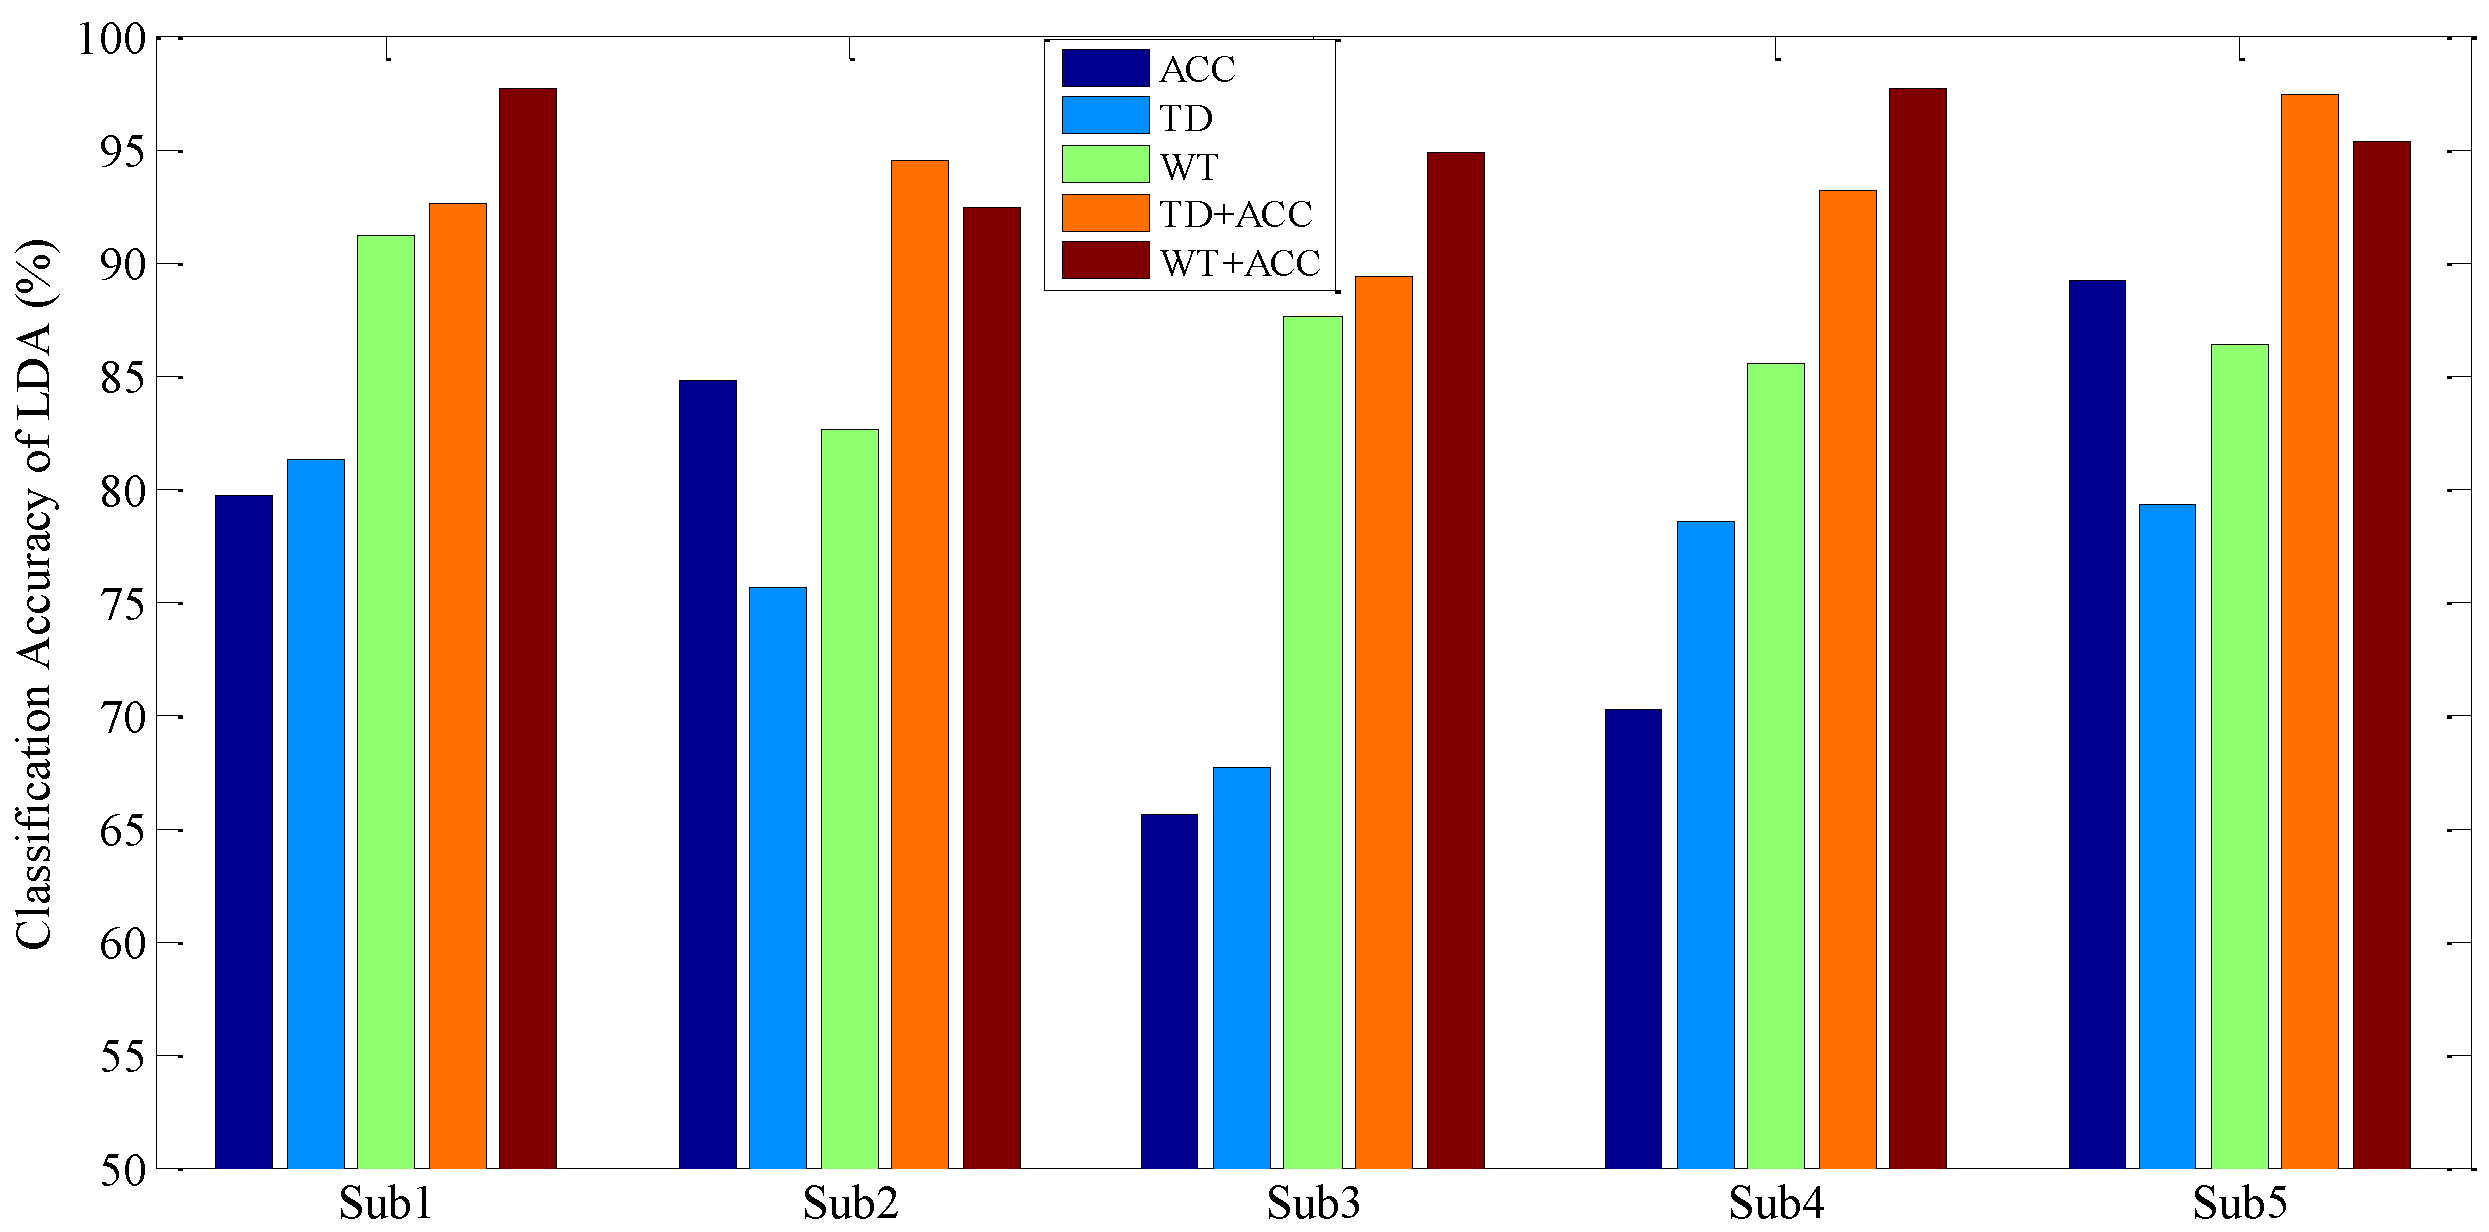
Figure 12.
Classification results of SVM with five different features.


Table 1.
Results of three methods for signal onset detection.
| Methods | Start Point (ms) | End Point (ms) |
|---|---|---|
| Moving average Method | 3800; 4800; 6100; 1000; 13,600; 13,900; 17,700 | 5100; 7200; 11,000; 14,900; |
| Teager–Kaiser operator | 3890; 5991; 9863; 13,735; 17,530 | 4451; 6475; 10,512; 14,274; 18,212 |
| Power spectral correlation coefficient | 3700; 5900; 9900; 13,600; 17,600 | 5000; 7200; 10,900; 15,000 |
Table 2.
Classification results of original linear discriminant analysis (LDA) (%). SD: standard deviation; ACC: accelerometer; TD: time-domain; WT: wavelet transform.
Table 2.
Classification results of original linear discriminant analysis (LDA) (%). SD: standard deviation; ACC: accelerometer; TD: time-domain; WT: wavelet transform.
| Subjects | ACC | TD | WT |
|---|---|---|---|
| 1 | 81.4 | 67.2 | 70.9 |
| 2 | 77.8 | 57.6 | 68.2 |
| 3 | 73.1 | 54.1 | 60.2 |
| 4 | 75.3 | 59.3 | 63.3 |
| 5 | 64.9 | 75.1 | 61.2 |
| Mean ± SD | 74.5 ± 6.2 | 62.6 ± 8.4 | 64.8 ± 4.6 |
Table 3.
Classification results of Gaussian kernel-based LDA (%).
| Subjects | ACC | TD | WT |
|---|---|---|---|
| 1 | 91.2 | 79.7 | 81.3 |
| 2 | 82.6 | 84.8 | 75.6 |
| 3 | 87.6 | 65.6 | 67.7 |
| 4 | 85.5 | 70.2 | 78.5 |
| 5 | 86.4 | 89.2 | 79.3 |
| Mean ± SD | 86.6 ± 3.1 | 77.9 ± 9.9 | 76.5 ± 5.3 |
Table 4.
Classification results using the support vector machine (SVM) classifier (%).
| Subjects | ACC | TD | WT |
|---|---|---|---|
| 1 | 93.7 | 87.3 | 86.2 |
| 2 | 90.5 | 86.5 | 80.9 |
| 3 | 87.6 | 67.3 | 71.7 |
| 4 | 90.5 | 72.3 | 74.2 |
| 5 | 92.4 | 91.9 | 82.3 |
| Mean ± SD | 90.9 ± 2.3 | 81.1 ± 10.6 | 79.1 ± 6.0 |
Table 5.
Classification results of fused features of sEMG and accelerometer signals (%).
| Subjects | Gaussian Kernel-Based LDA | SVM | ||
|---|---|---|---|---|
| TD + ACC | WT + ACC | TD + ACC | WT + ACC | |
| 1 | 96.2 | 97.7 | 98.4 | 99.8 |
| 2 | 94.5 | 92.4 | 96.0 | 95.5 |
| 3 | 89.4 | 94.9 | 94.9 | 98.1 |
| 4 | 93.2 | 97.7 | 95.1 | 99.0 |
| 5 | 97.4 | 95.3 | 93.6 | 97.9 |
| Mean ± SD | 94.1 ± 3.1 | 95.6 ± 2.2 | 95.6 ± 1.8 | 98.1 ± 1.6 |
© 2017 by the authors. Licensee MDPI, Basel, Switzerland. This article is an open access article distributed under the terms and conditions of the Creative Commons Attribution (CC BY) license (http://creativecommons.org/licenses/by/4.0/).
Share and Cite
MDPI and ACS Style
Ai, Q.; Zhang, Y.; Qi, W.; Liu, Q.; Chen, A.K. Research on Lower Limb Motion Recognition Based on Fusion of sEMG and Accelerometer Signals. Symmetry 2017, 9, 147. https://doi.org/10.3390/sym9080147
AMA Style
Ai Q, Zhang Y, Qi W, Liu Q, Chen AK. Research on Lower Limb Motion Recognition Based on Fusion of sEMG and Accelerometer Signals. Symmetry. 2017; 9(8):147. https://doi.org/10.3390/sym9080147
Chicago/Turabian StyleAi, Qingsong, Yanan Zhang, Weili Qi, Quan Liu, and And Kun Chen. 2017. "Research on Lower Limb Motion Recognition Based on Fusion of sEMG and Accelerometer Signals" Symmetry 9, no. 8: 147. https://doi.org/10.3390/sym9080147
Note that from the first issue of 2016, this journal uses article numbers instead of page numbers. See further details here.