A Robust Method for Finding the Automated Best Matched Genes Based on Grouping Similar Fragments of Large-Scale References for Genome Assembly

Abstract
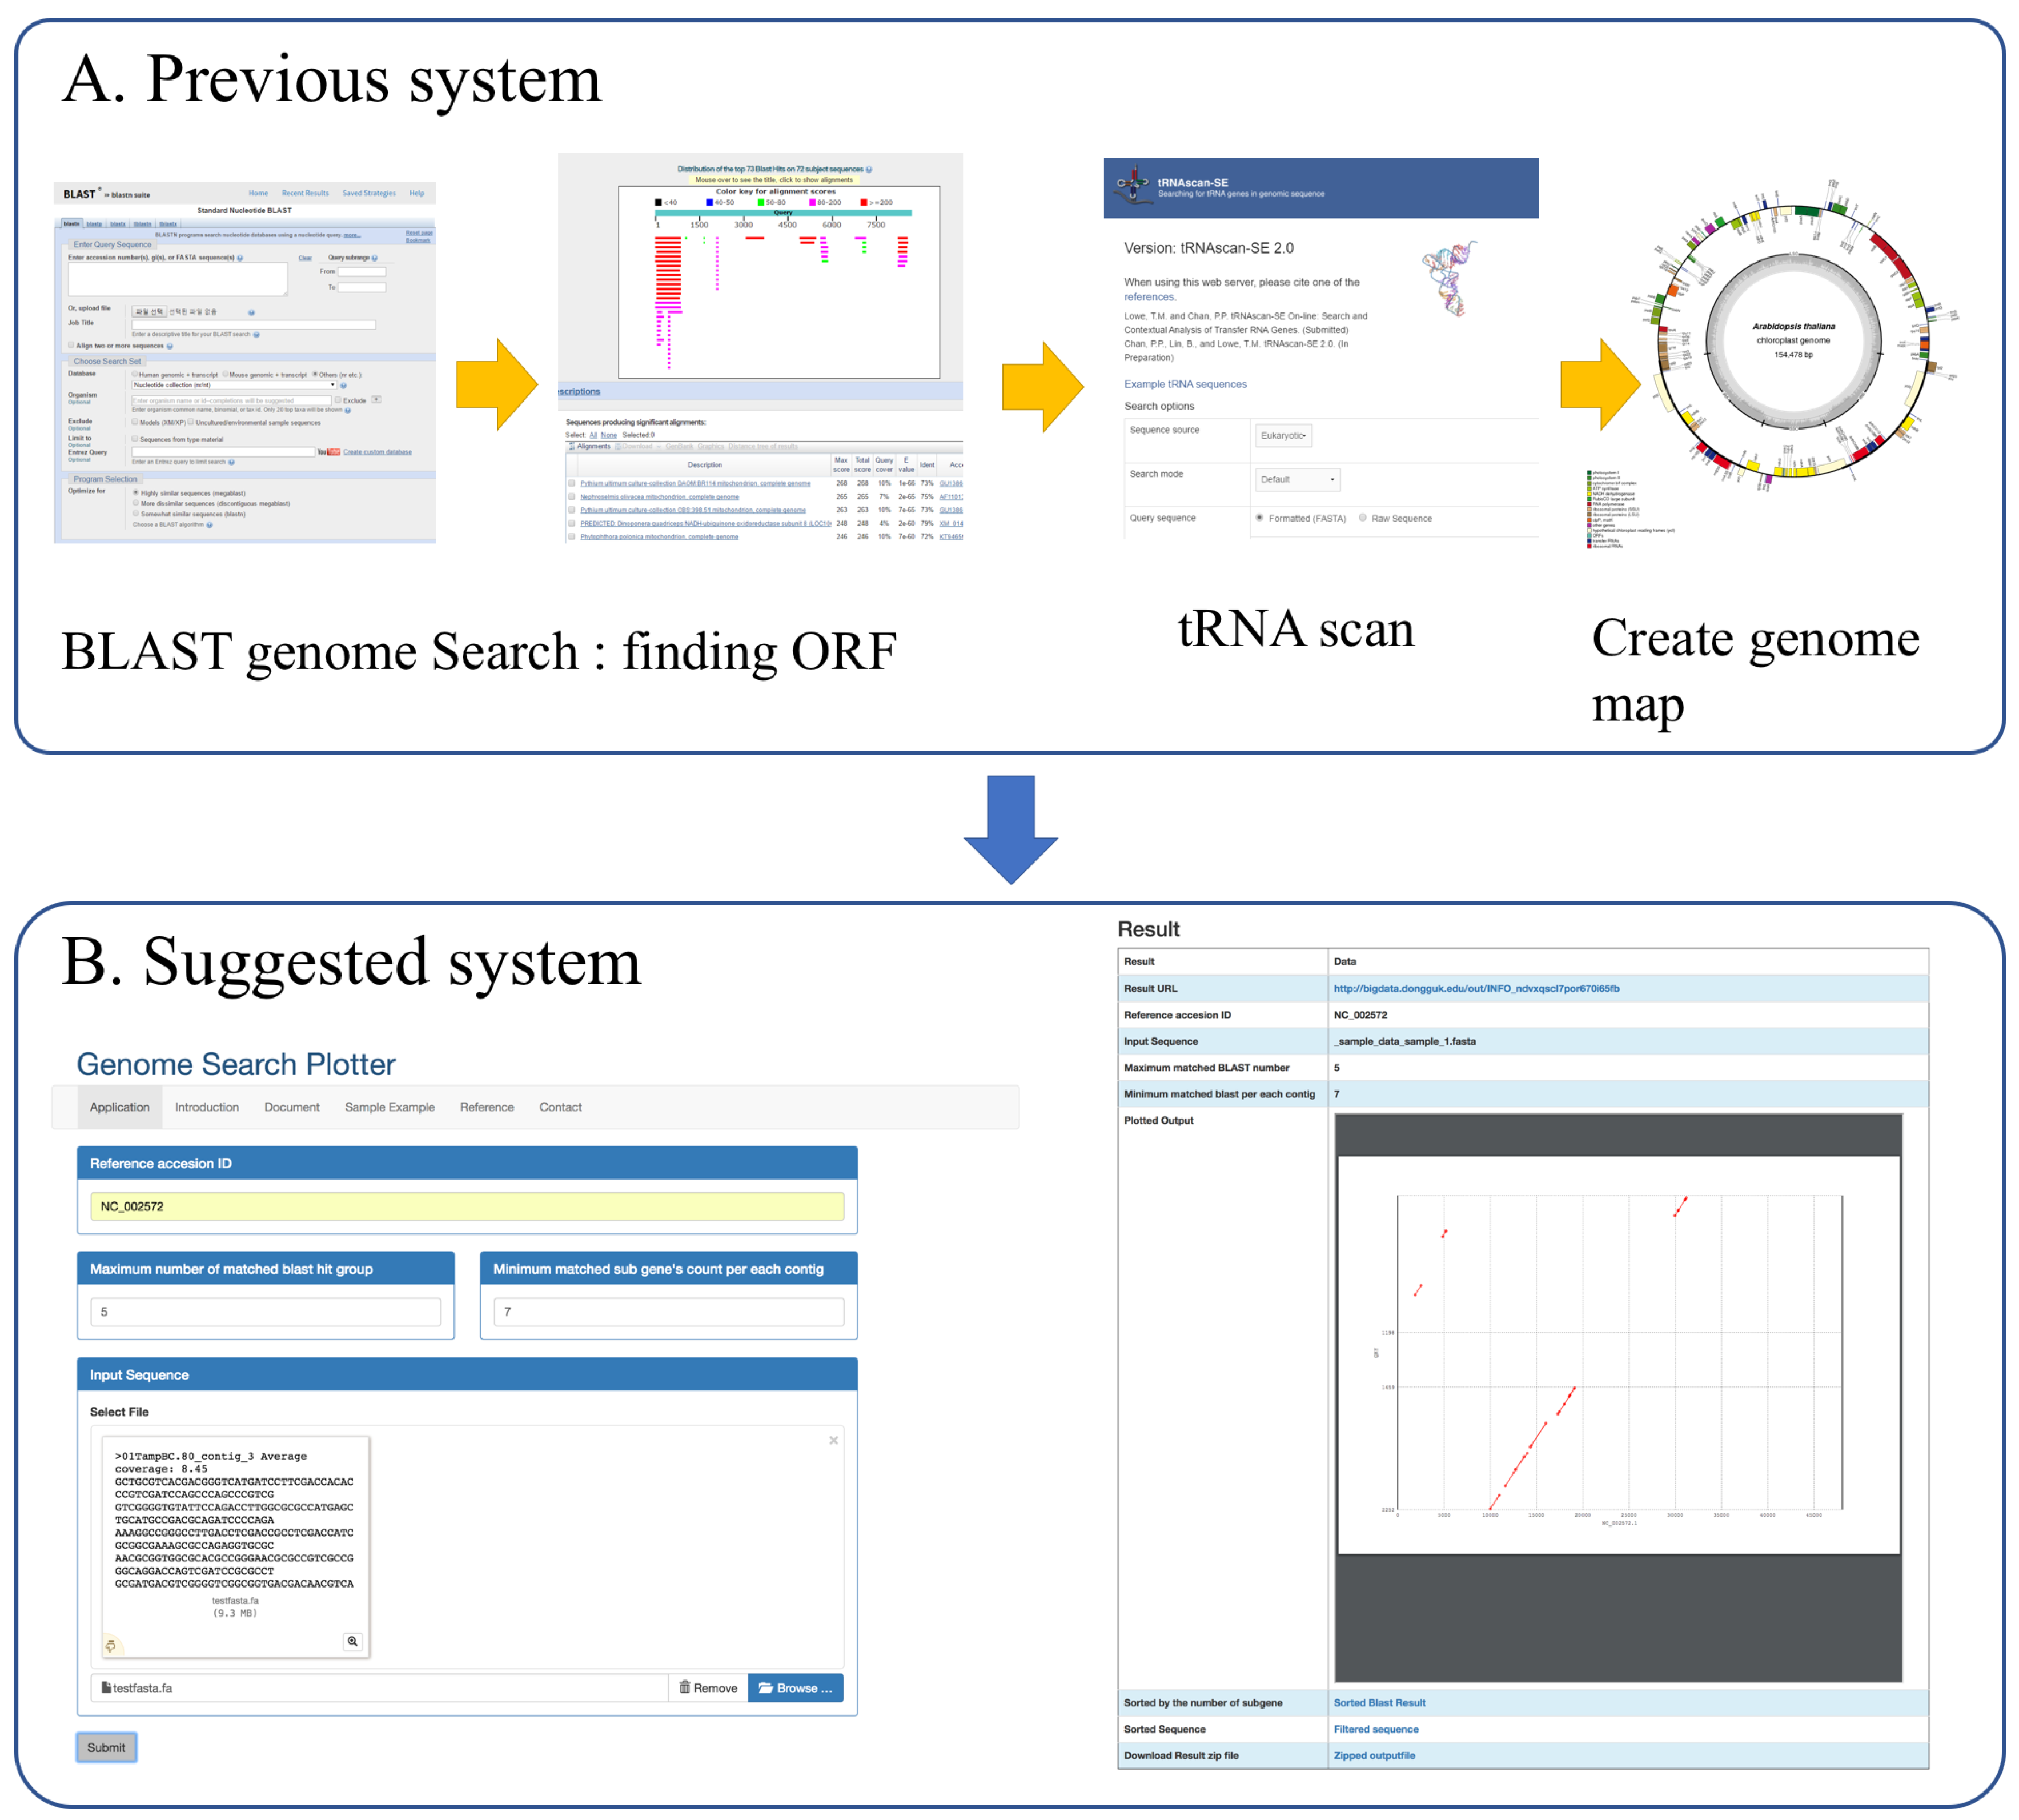
:1. Introduction
2. Implementation
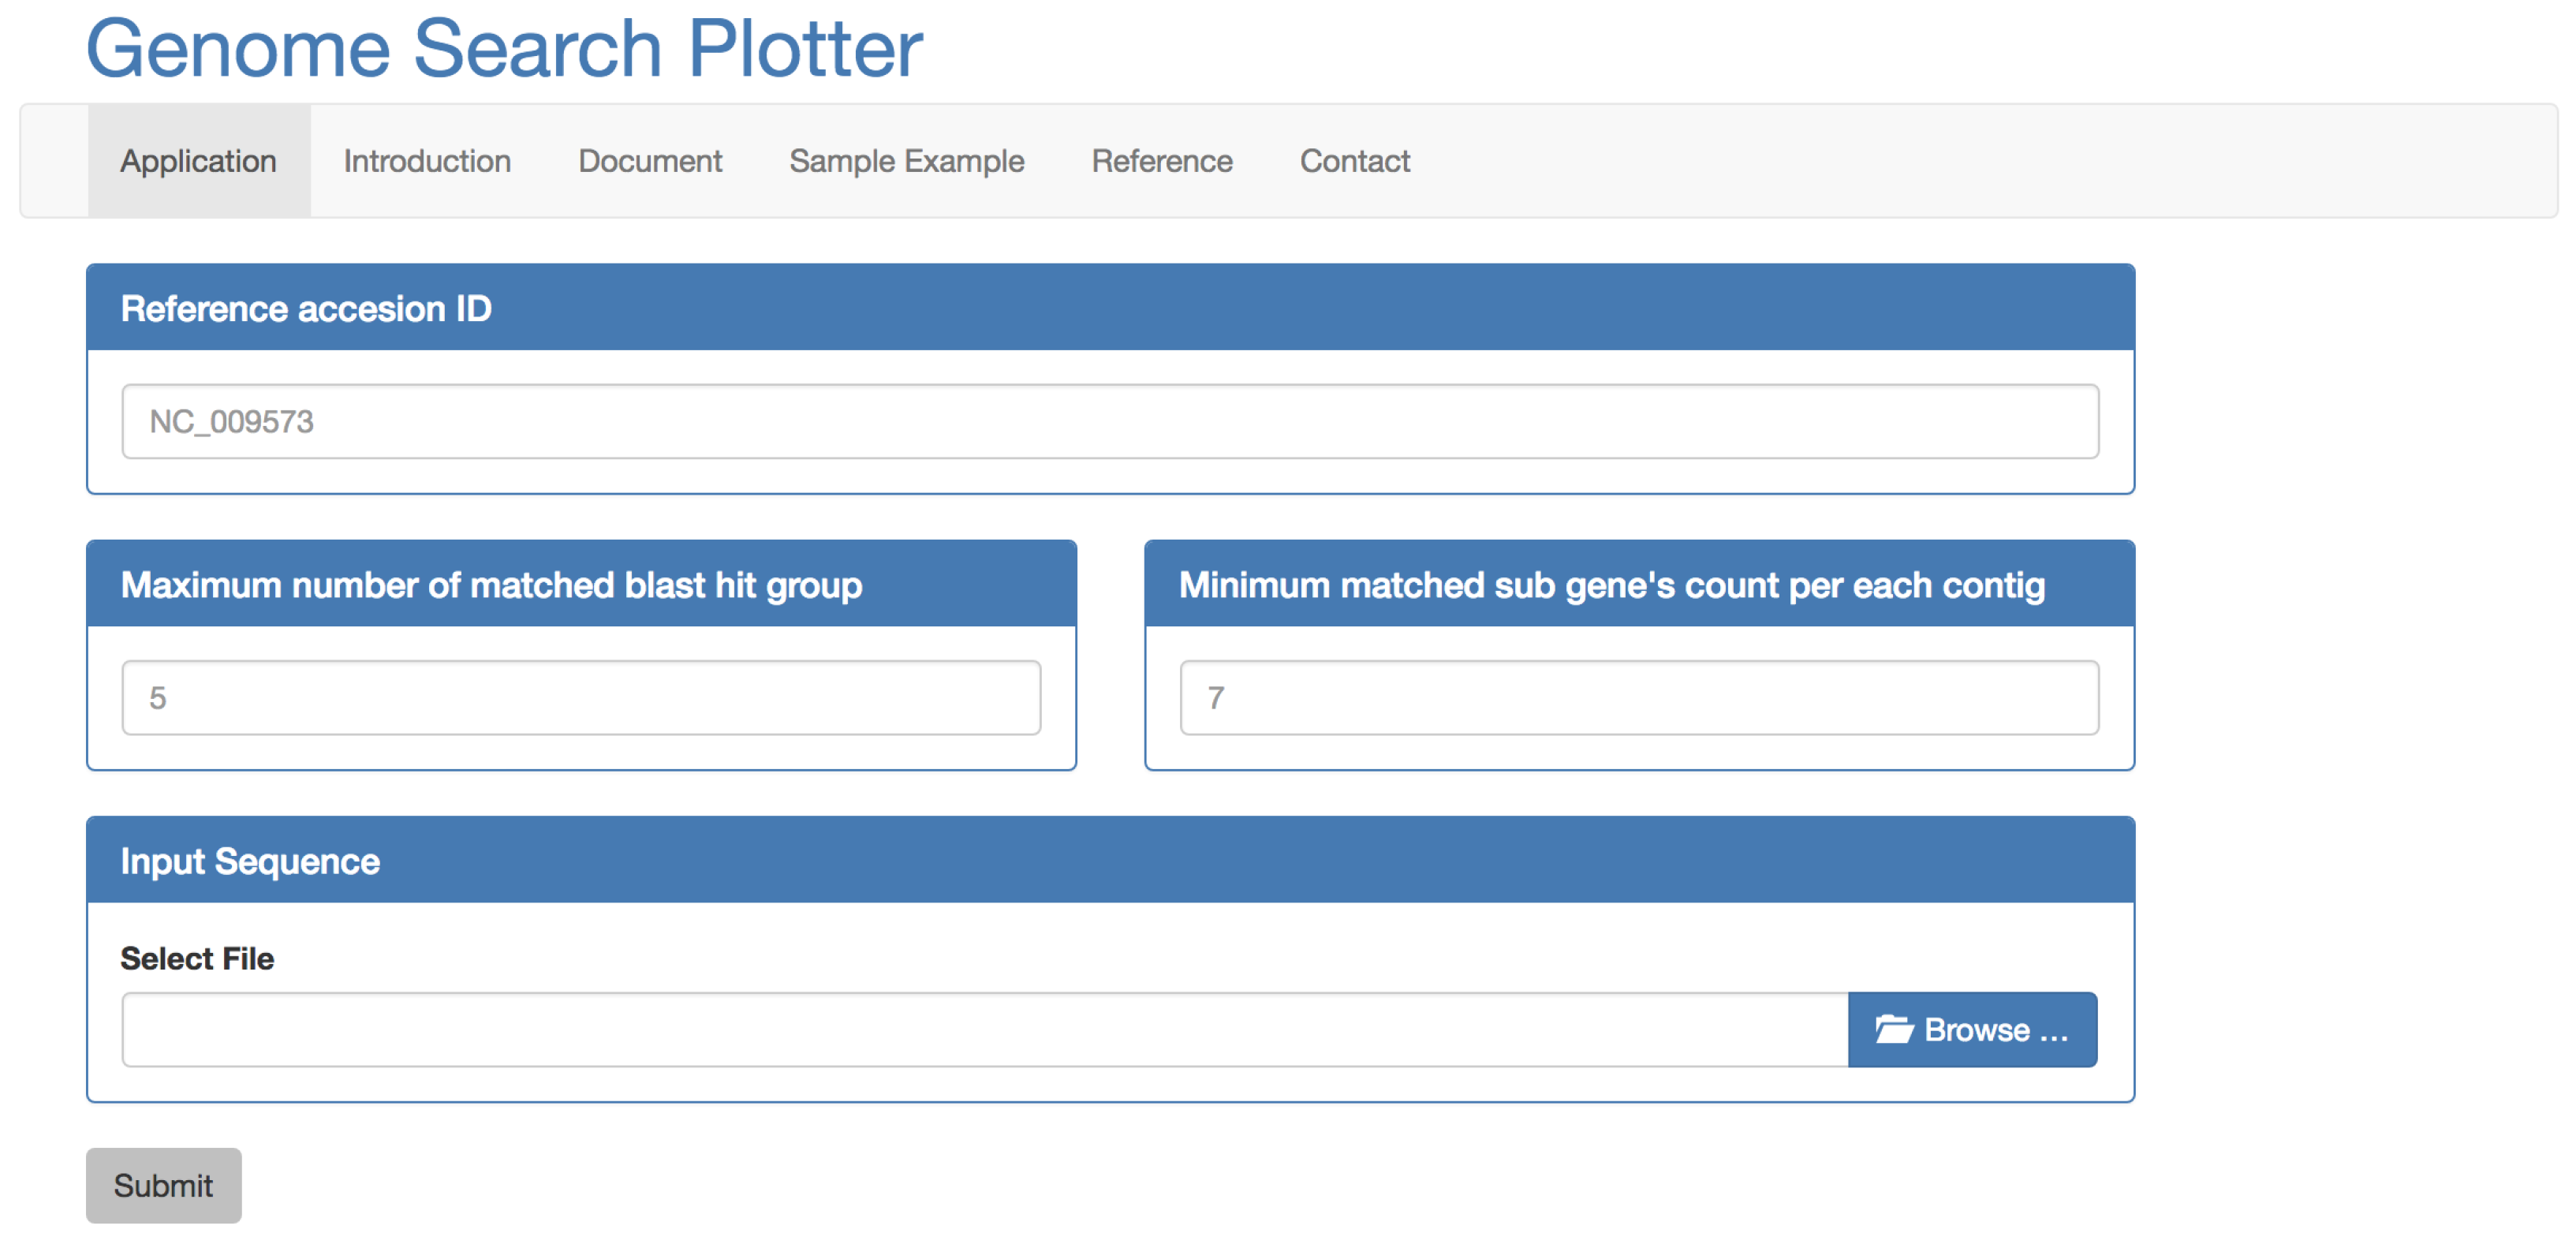
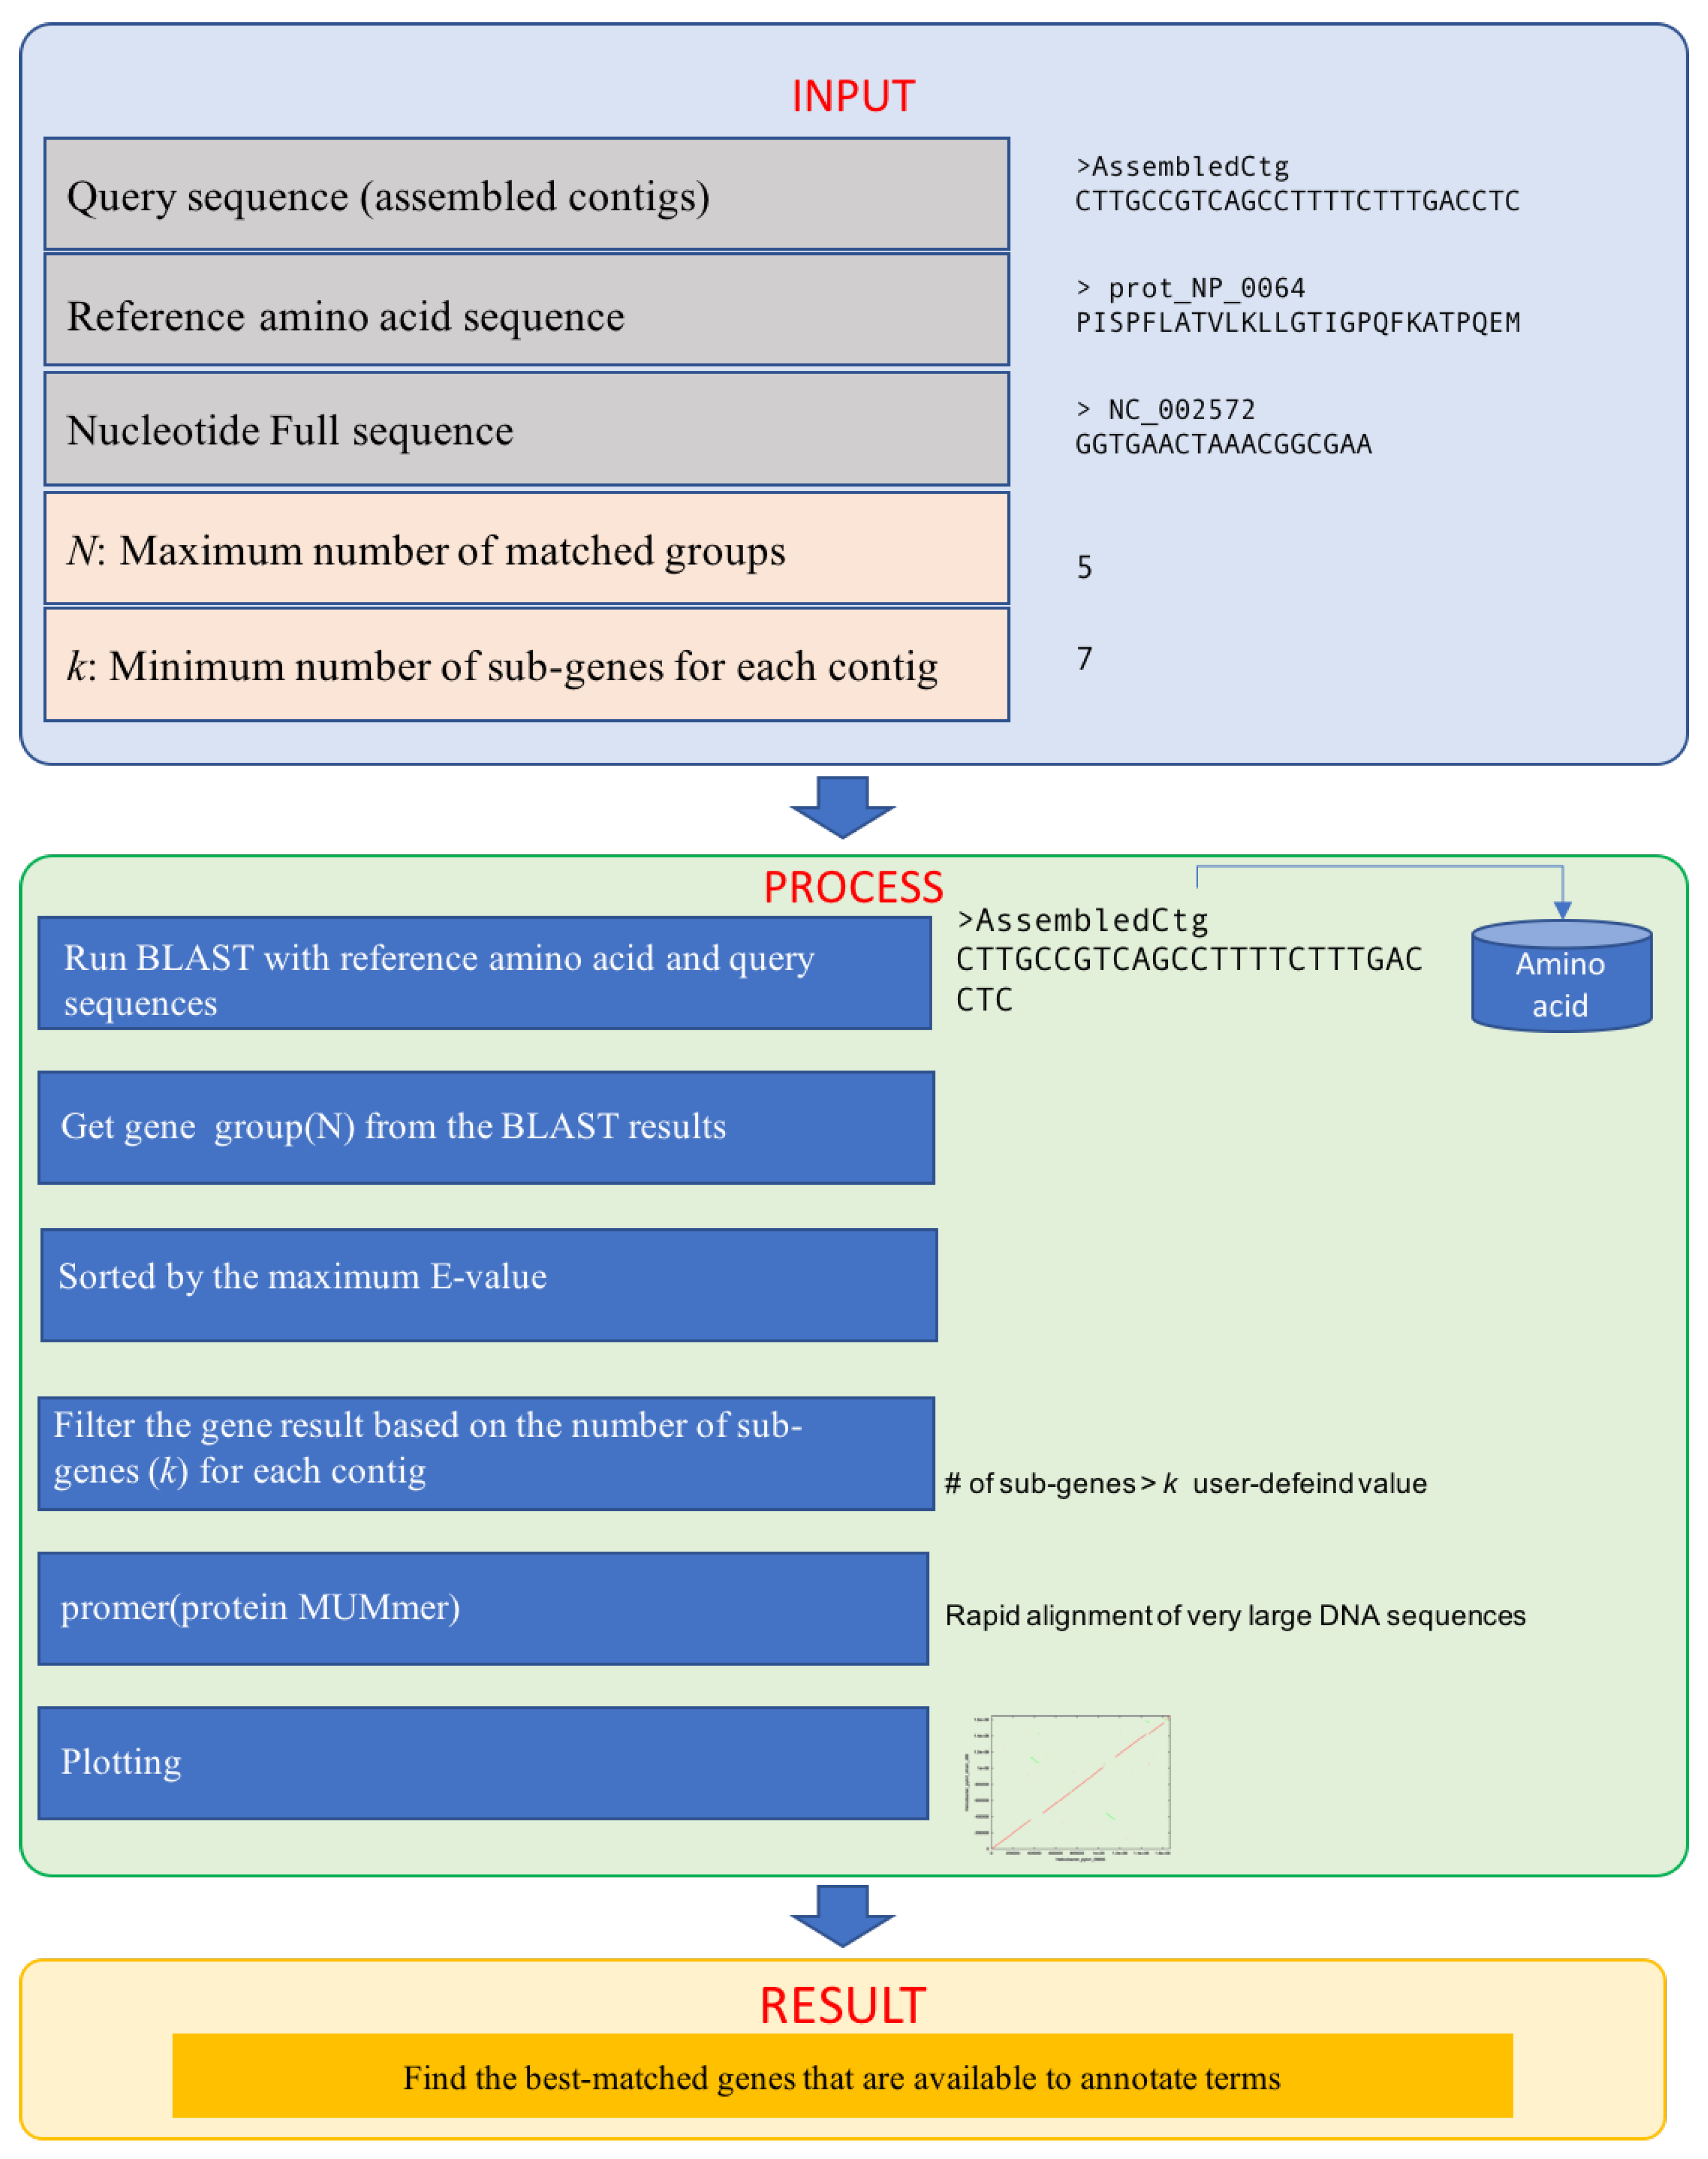
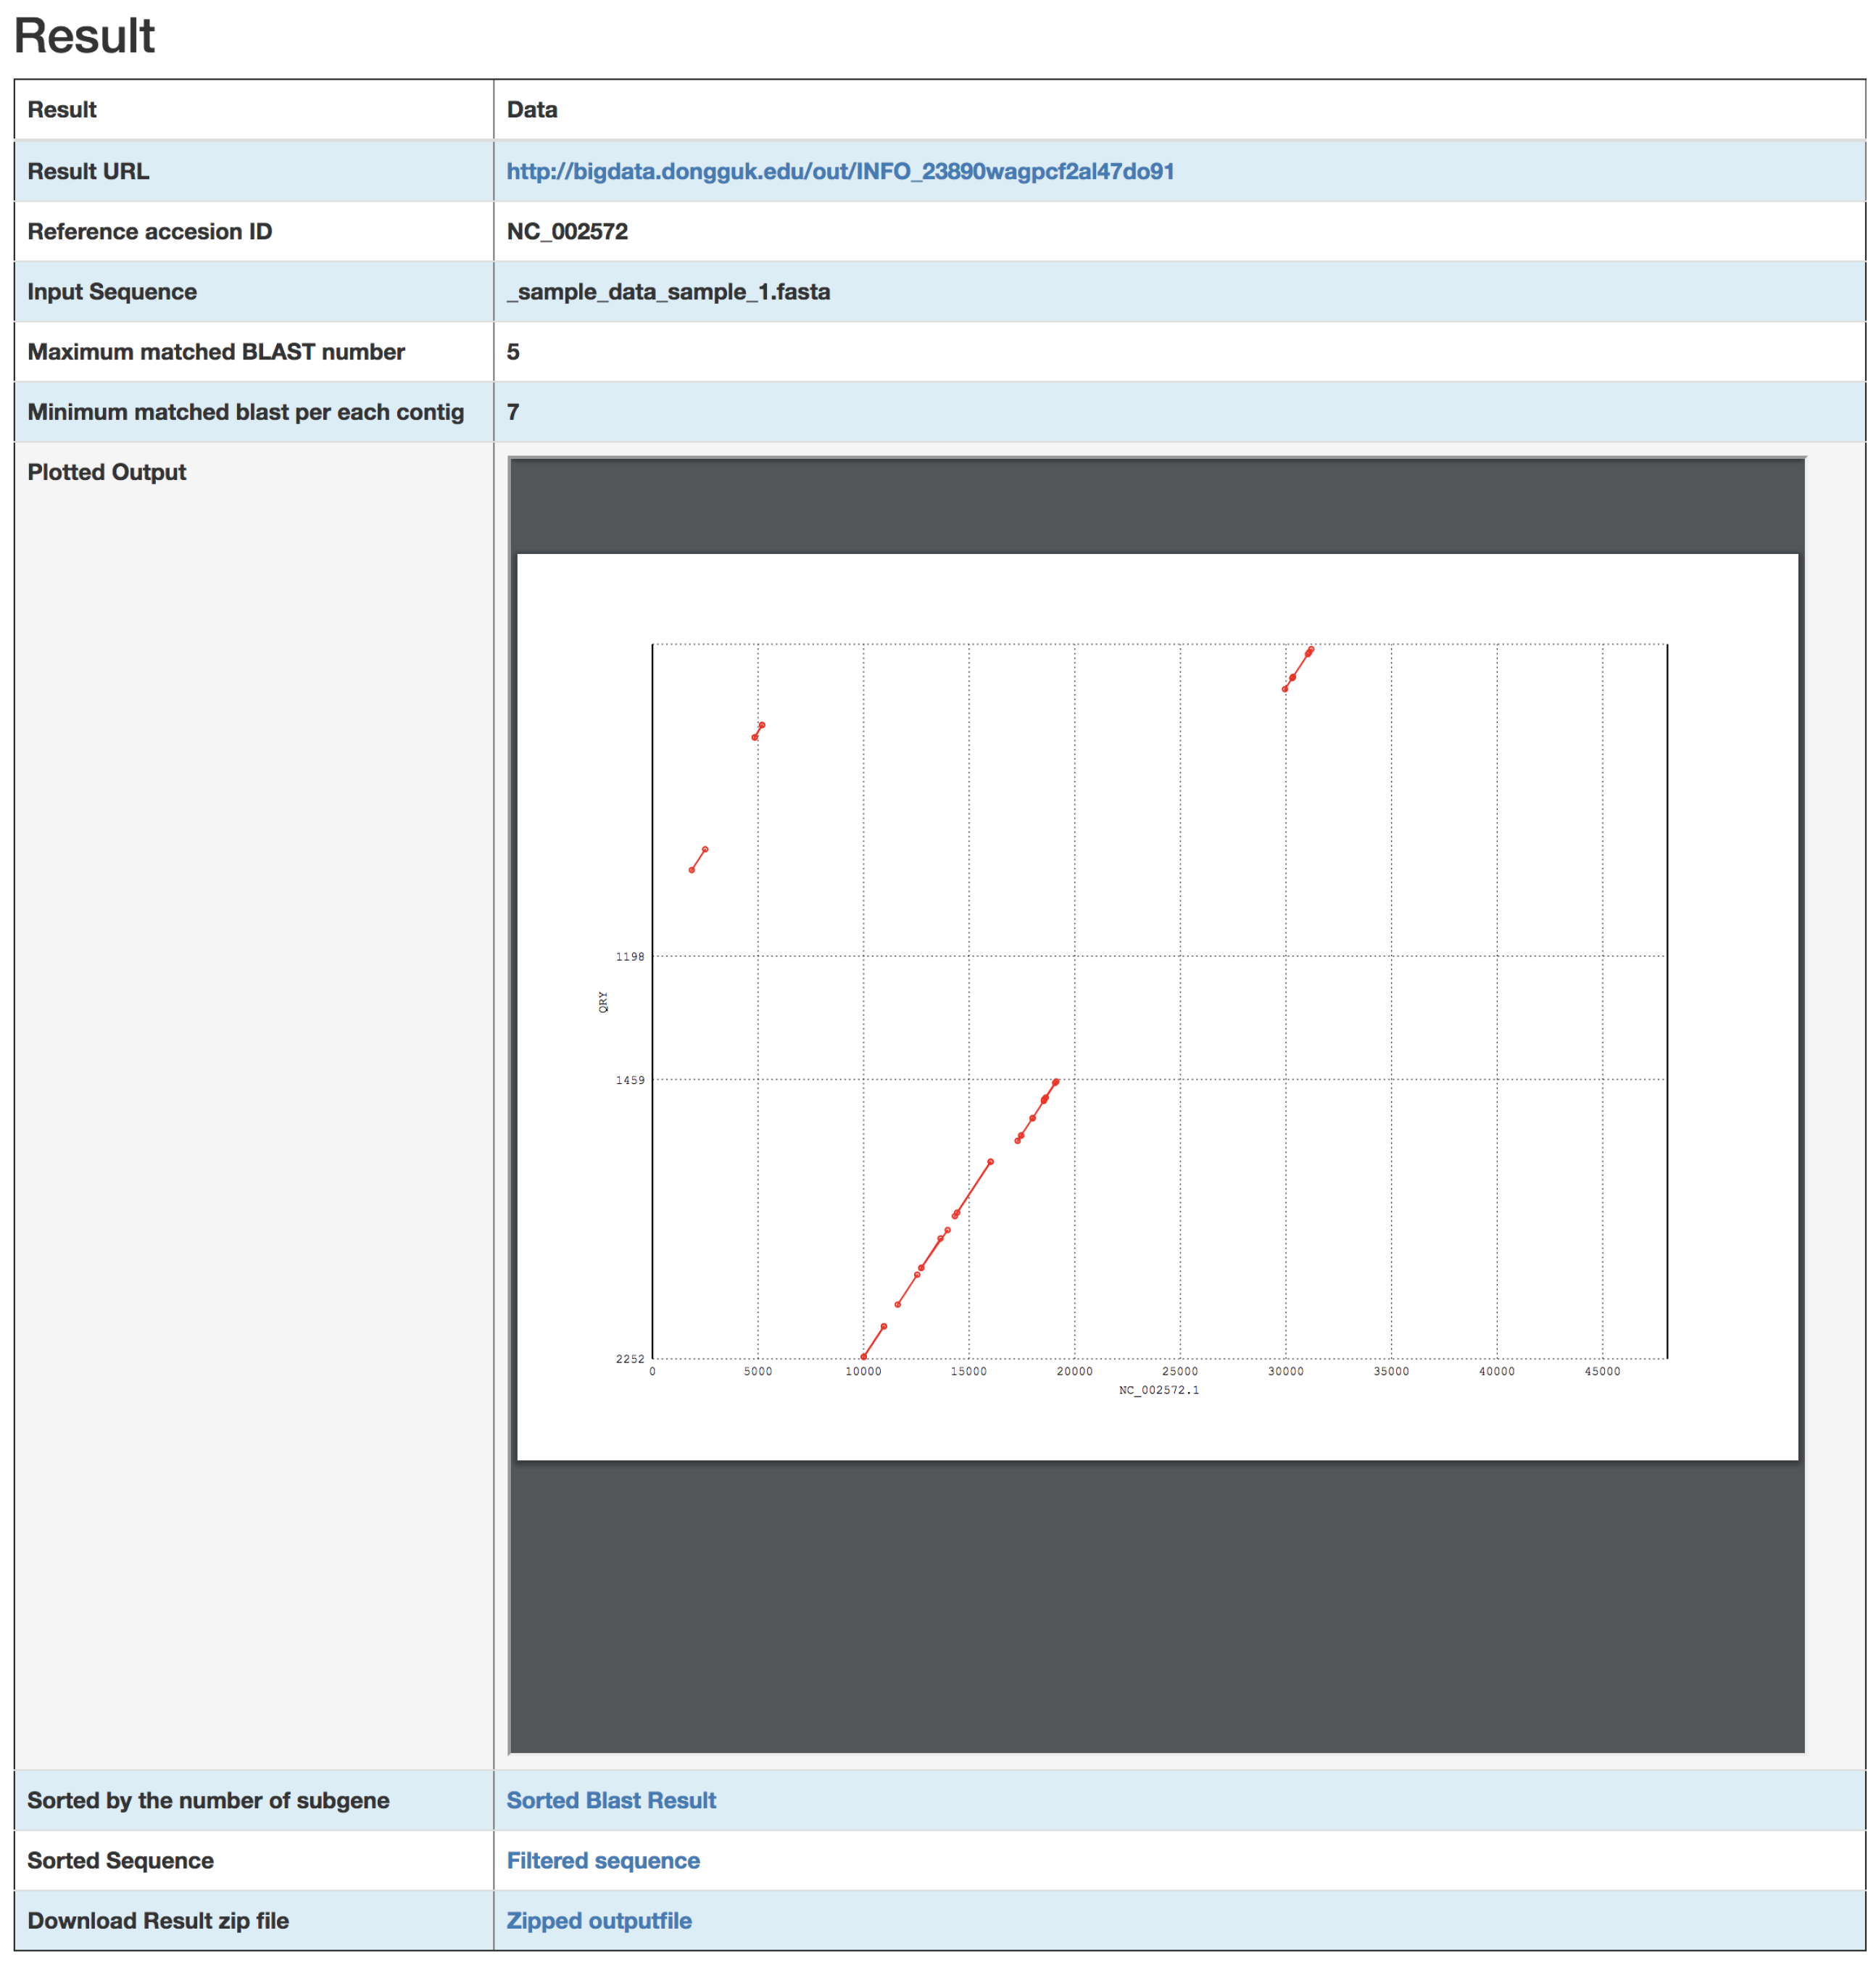
2.1. Inputs
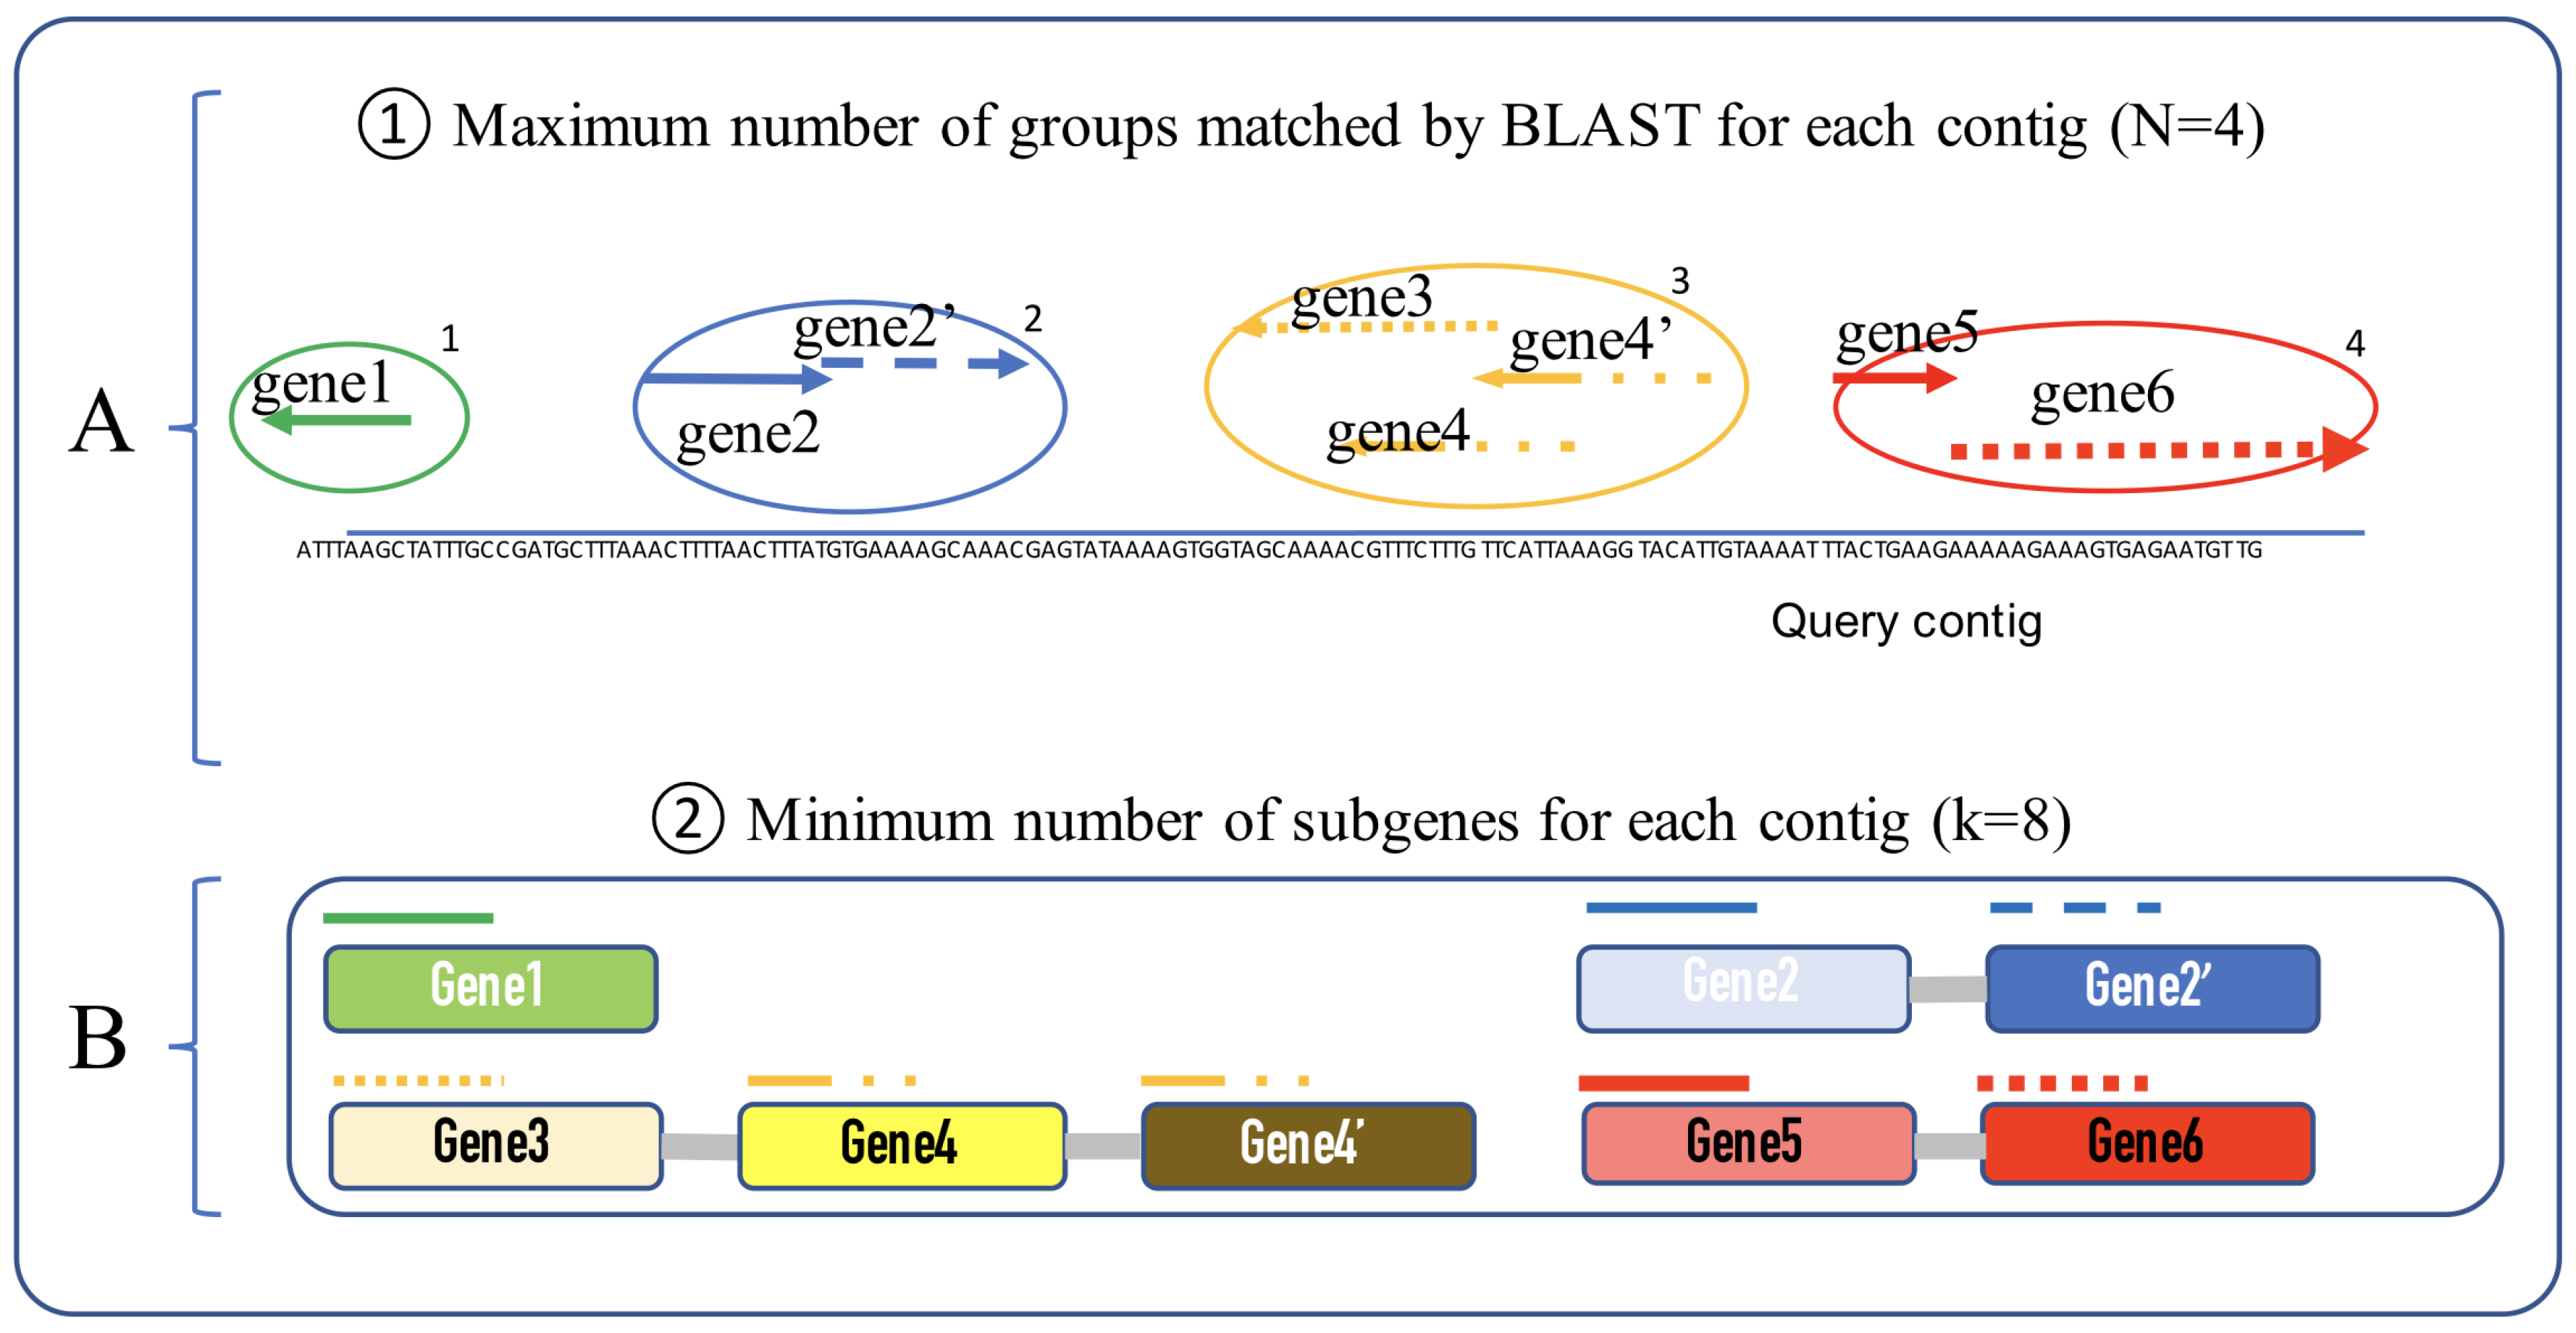
2.2. Process
- i: number of matched groups
- j: number of sub-genes for each group
- : gene group ID
- : gene group start position
- : gene group end position.
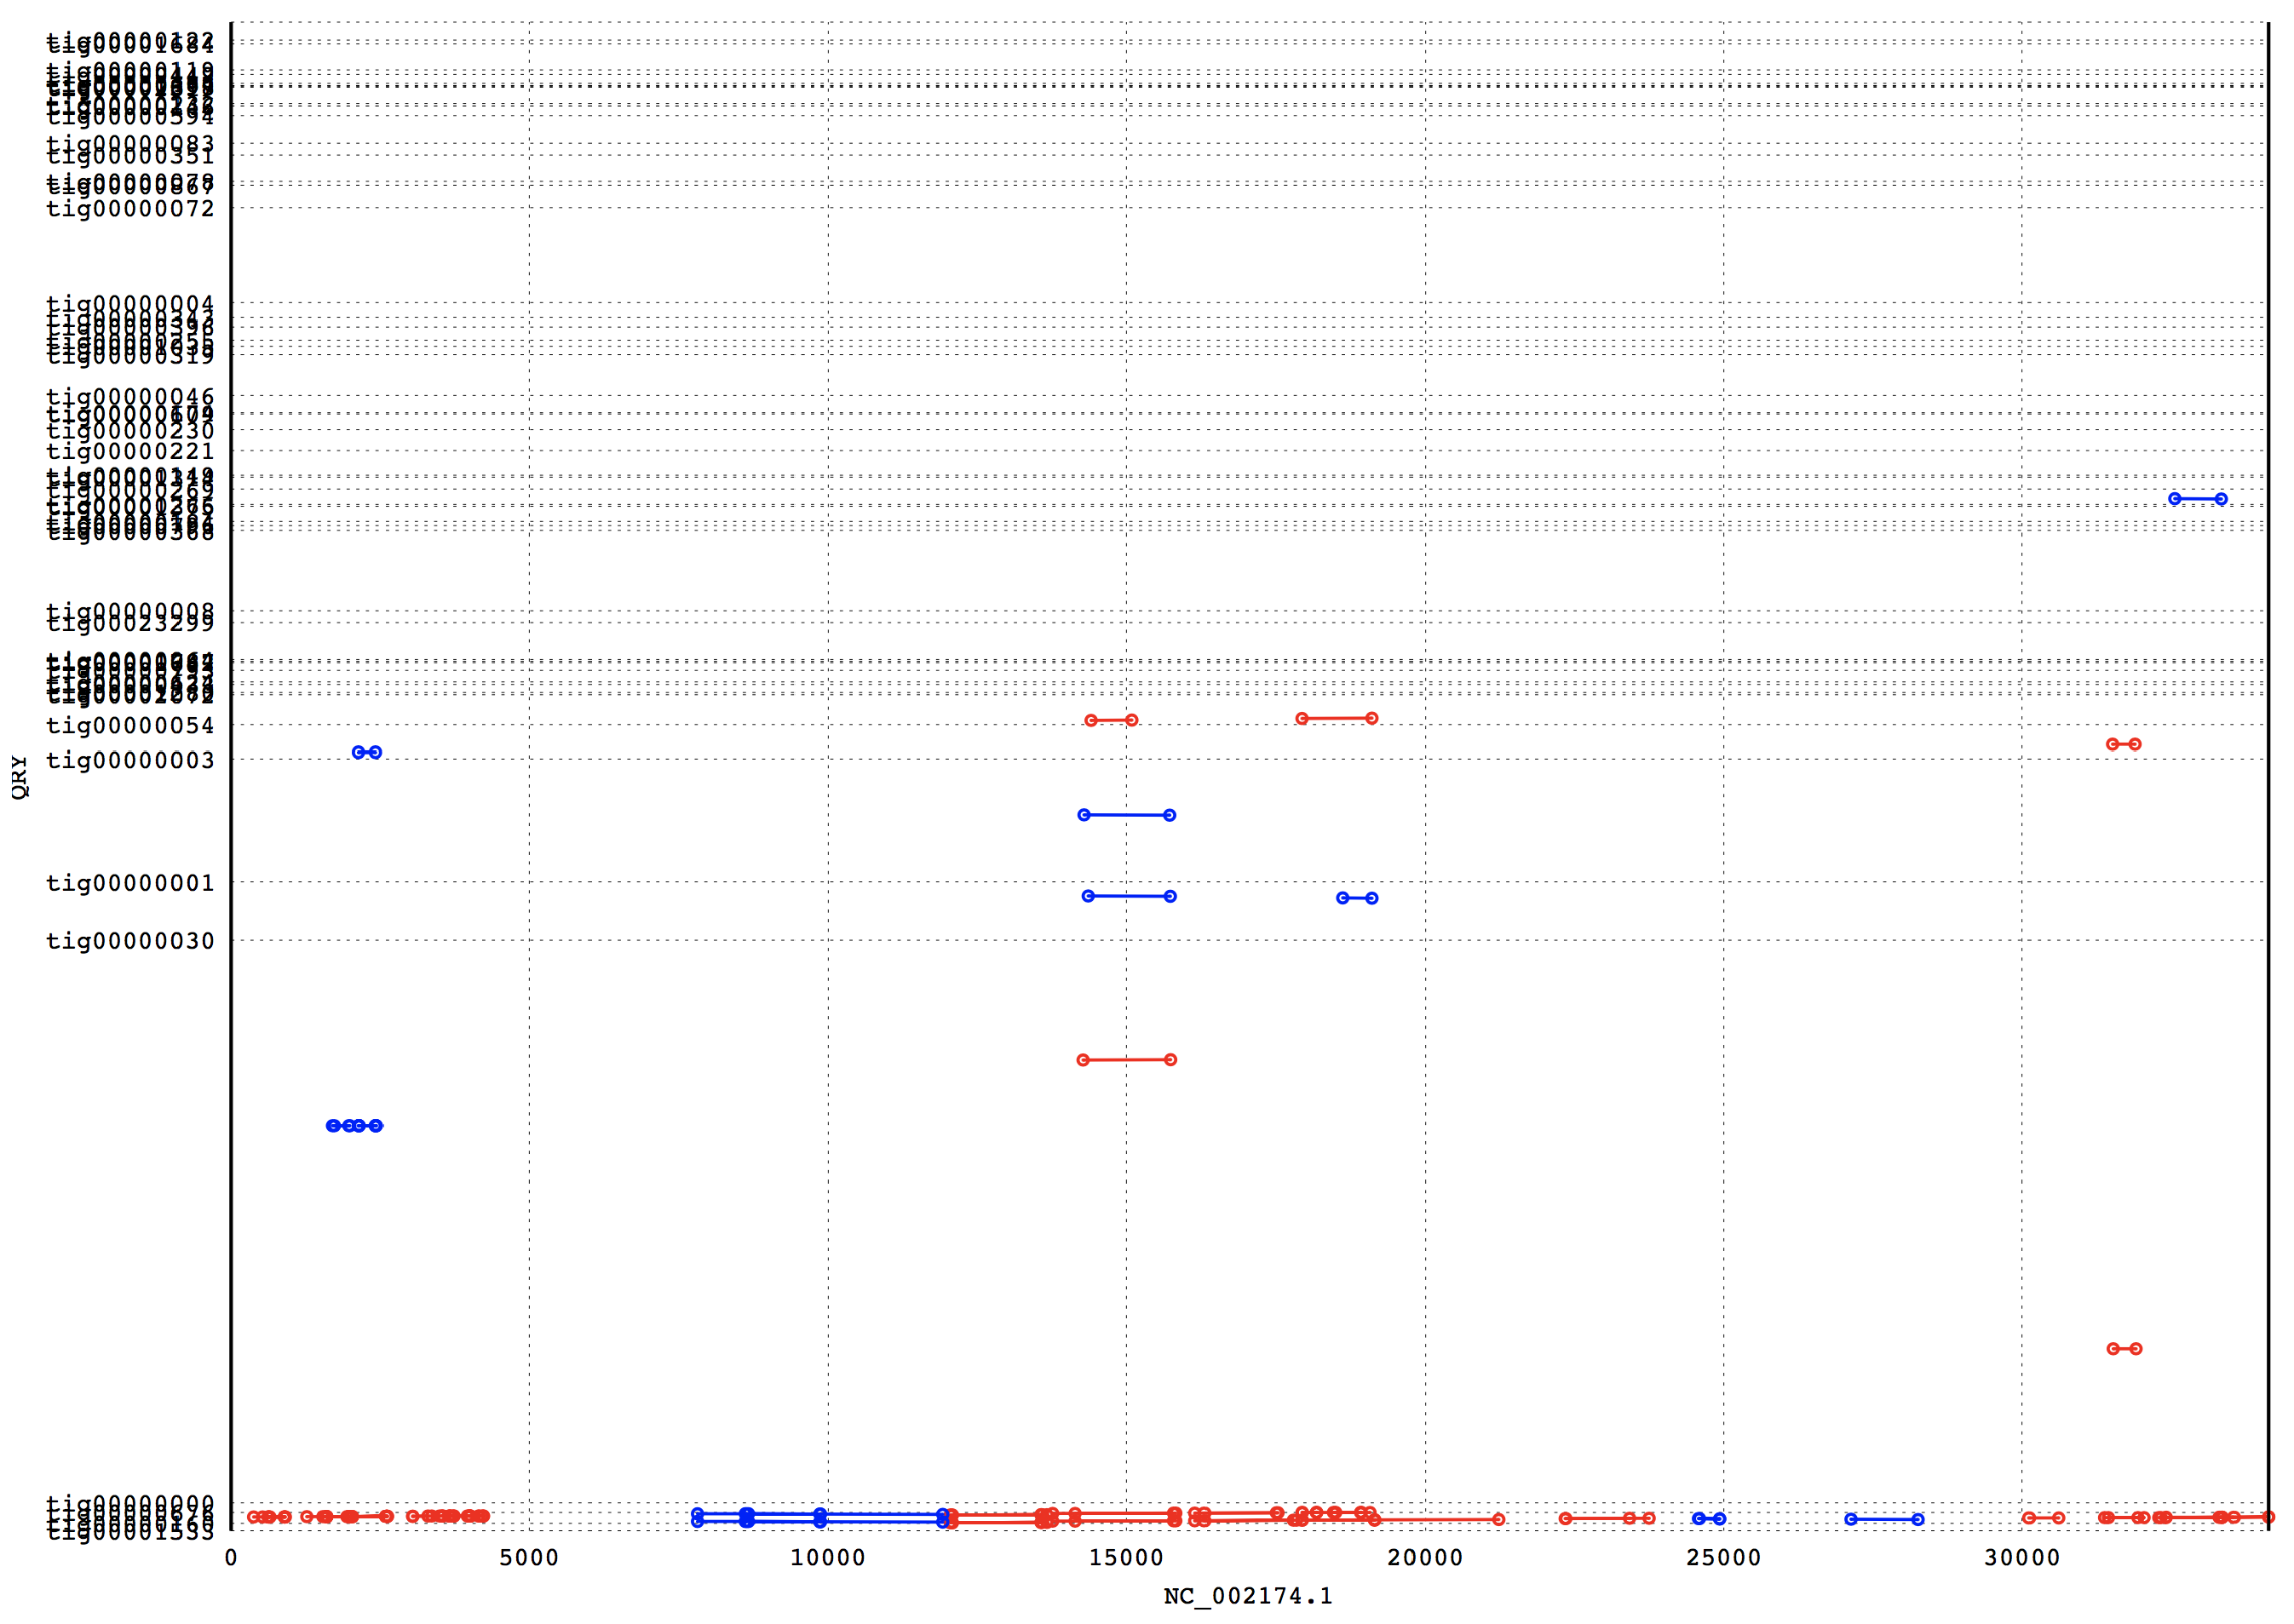
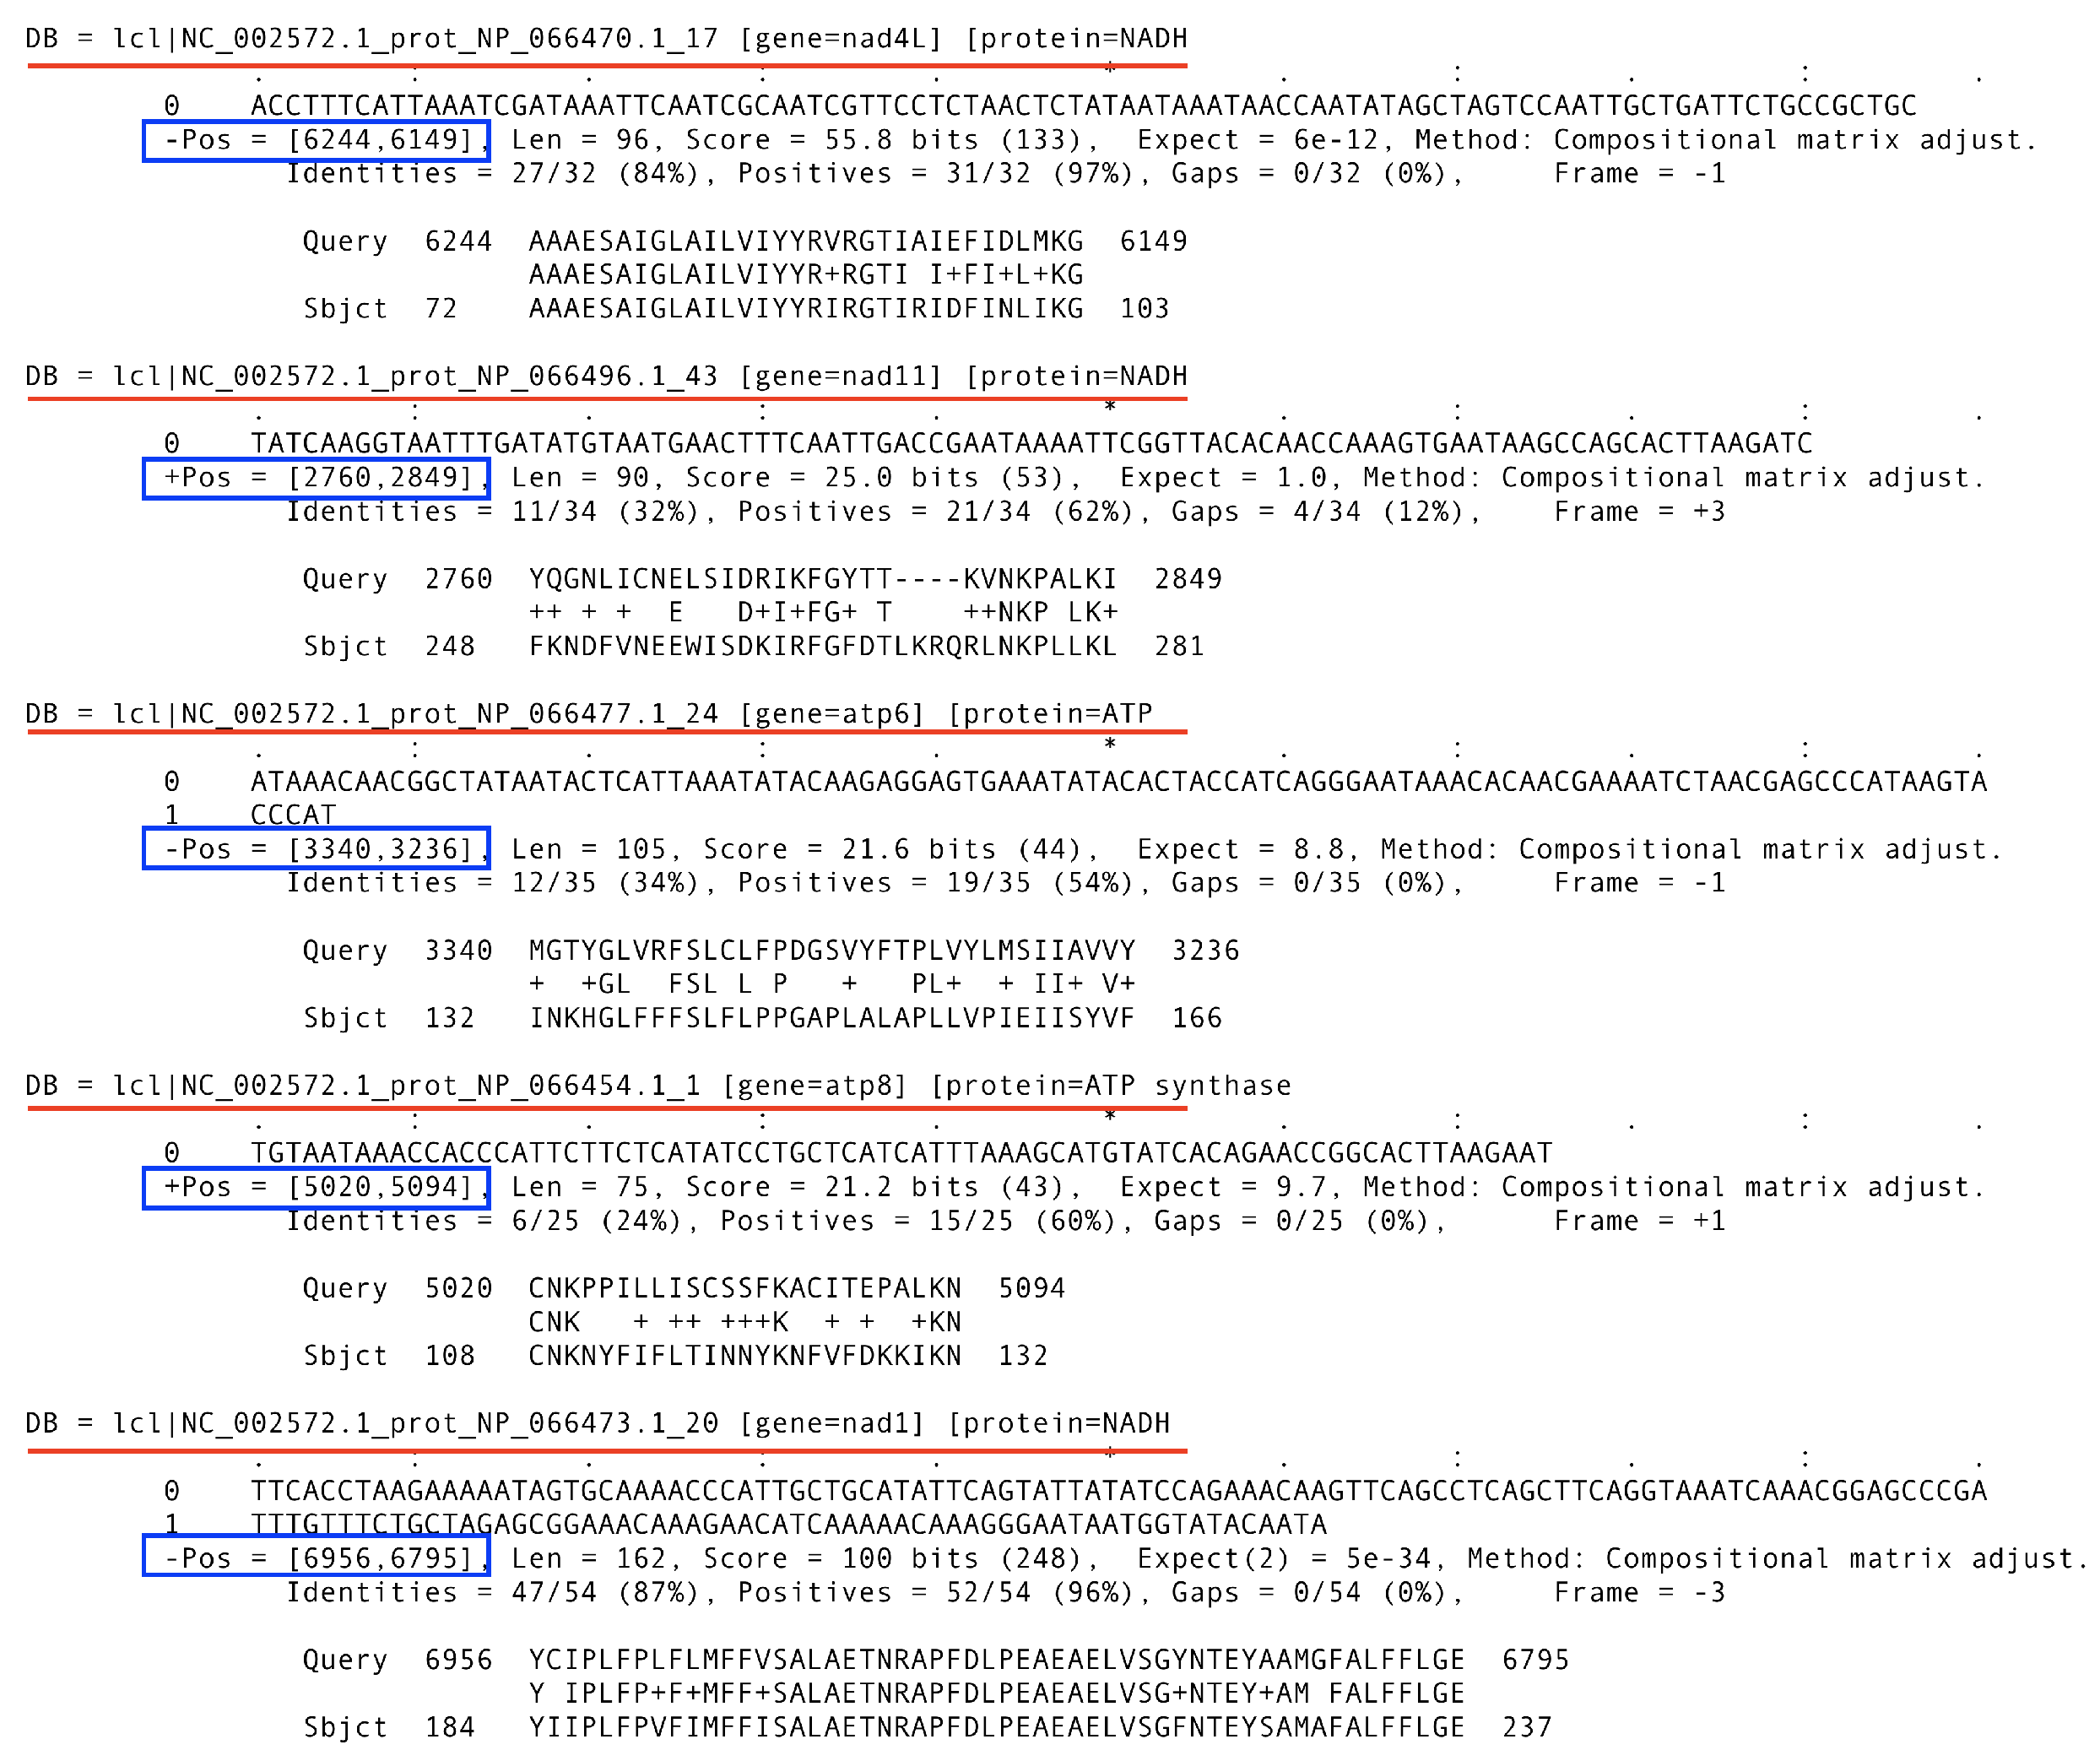
3. Results
4. Conclusions
Acknowledgments
Author Contributions
Conflicts of Interest
References
- Song, H.J.; Lee, J.; Graf, L.; Rho, M.; Qiu, H.; Bhattacharya, D.; Yoon, H.S. A novice’s guide to analyzing NGS-derived organelle and metagenome data. Algae 2016, 31, 137–154. [Google Scholar] [CrossRef]
- Snel, B.; Bork, P.; Huynen, M.A. Genome phylogeny based on gene content. Nat. Genet. 1999, 21, 108–110. [Google Scholar] [CrossRef] [PubMed]
- Yu, N.; Yu, Z.; Li, B.; Gu, F.; Pan, Y. A Comprehensive Review of Emerging Computational Methods for Gene Identification. J. Inf. Process. Syst. 2016, 12, 1–34. [Google Scholar]
- Zerbino, D.R.; Birney, E. Velvet: Algorithms for de novo short read assembly using de Bruijn graphs. Genome Res. 2008, 18, 821–829. [Google Scholar] [CrossRef] [PubMed]
- Miller, J.R.; Koren, S.; Sutton, G. Assembly Algorithms for Next-Generation Sequencing Data. Genomics 2010, 95, 315–327. [Google Scholar] [CrossRef] [PubMed]
- Parikesit, A.A.; Steiner, L.; Stadler, P.F.; Prohaska, S.J. Pitfalls of Ascertainment Biases in Genome Annotations—Computing Comparable Protein Domain Distributions in Eukarya. Malays. J. Fundam. Appl. Sci. 2014, 10, 64–73. [Google Scholar]
- Besemer, J.; Lomsadze, A.; Borodovsky, M. GeneMarkS: A self-training method for prediction of gene starts in microbial genomes. Implications for finding sequence motifs in regulatory regions. Nucleic Acids Res. 2001, 29, 2607–2618. [Google Scholar] [CrossRef] [PubMed]
- Lukashin, A.V.; Borodovsky, M. GeneMark.hmm: New solutions for gene finding. Nucleic Acids Res. 1998, 26, 1107–1115. [Google Scholar] [CrossRef] [PubMed]
- Delcher, A.L.; Bratke, K.A.; Powers, E.C.; Salzberg, S.L. Identifying bacterial genes and endosymbiont DNA with Glimmer. Bioinformatics 2007, 23, 673–679. [Google Scholar] [CrossRef] [PubMed]
- Burge, C.B.; Karlin, S. Finding the genes in genomic DNA. Curr. Opin. Struct. Biol. 1998, 3, 346–354. [Google Scholar] [CrossRef]
- Yeh, R.F.; Lim, L.P.; Burge, C.B. Computational Inference of Homologous Gene Structures in the Human Genome. Genome Res. 2001, 11, 803–816. [Google Scholar] [CrossRef] [PubMed]
- Larsen, T.S.; Krogh, A. EasyGene—A prokaryotic gene finder that ranks ORFs by statistical significance. BMC Bioinform. 2003, 4, 21. [Google Scholar] [CrossRef] [PubMed] [Green Version]
- Nielsen, P.; Krogh, A. Large-scale prokaryotic gene prediction and comparison to genome annotation. Bioinformatics 2005, 21, 4322–4329. [Google Scholar] [CrossRef] [PubMed]
- Hoff, K.J.; Stanke, M. WebAUGUSTUS—A web service for training AUGUSTUS and predicting genes in eukaryotes. Nucleic Acids Res. 2013, 41, W123–W128. [Google Scholar] [CrossRef] [PubMed]
- Bairoch, A.; Apweiler, R. The SWISS-PROT protein sequence database and its supplement TrEMBL in 2000. Nucleic Acids Res. 2000, 28, 45–48. [Google Scholar] [CrossRef] [PubMed]
- Kurtz, S.; Phillippy, A.; Delcher, A.L.; Smoot, M.; Shumway, M.; Antonescu, C.; Salzberg, S.L. Versatile and open software for comparing large genomes. Genome Biol. 2004, 5, R12. [Google Scholar] [CrossRef] [PubMed]
- Delcher, A.L.; Phillippy, A.; Carlton, J.; Salzberg, S.L. Fast algorithms for large-scale genome alignment and comparison. Nucleic Acids Res. 2002, 30, 2478–2483. [Google Scholar] [CrossRef] [PubMed]
- Kim, J.I.; Yoon, H.S.; Yi, G.; Kim, H.S.; Yih, W.; Shin, W. The Plastid Genome of the Cryptomonad Teleaulax amphioxeia. PLoS ONE 2015, 10, e0129284. [Google Scholar] [CrossRef] [PubMed]
- Lowe, T.M.; Eddy, S.R. tRNAscan-SE: A program for improved detection of transfer RNA genes in genomic sequence. Nucleic Acids Res. 1997, 25, 955–964. [Google Scholar] [CrossRef] [PubMed]
- Lohse, M.; Drechsel, O.; Kahlau, S.; Bock, R. OrganellarGenomeDRAW—A suite of tools for generating physical maps of plastid and mitochondrial genomes and visualizing expression data sets. Nucleic Acids Res. 2013, 41, W575–W581. [Google Scholar] [CrossRef] [PubMed]


© 2017 by the authors. Licensee MDPI, Basel, Switzerland. This article is an open access article distributed under the terms and conditions of the Creative Commons Attribution (CC BY) license (http://creativecommons.org/licenses/by/4.0/).
Share and Cite
Jung, J.; Kim, J.I.; Jeong, Y.-S.; Yi, G. A Robust Method for Finding the Automated Best Matched Genes Based on Grouping Similar Fragments of Large-Scale References for Genome Assembly. Symmetry 2017, 9, 192. https://doi.org/10.3390/sym9090192
Jung J, Kim JI, Jeong Y-S, Yi G. A Robust Method for Finding the Automated Best Matched Genes Based on Grouping Similar Fragments of Large-Scale References for Genome Assembly. Symmetry. 2017; 9(9):192. https://doi.org/10.3390/sym9090192
Chicago/Turabian StyleJung, Jaehee, Jong Im Kim, Young-Sik Jeong, and Gangman Yi. 2017. "A Robust Method for Finding the Automated Best Matched Genes Based on Grouping Similar Fragments of Large-Scale References for Genome Assembly" Symmetry 9, no. 9: 192. https://doi.org/10.3390/sym9090192