Compressional Behavior of Hydrous Orthoenstatite: Insight into the Nature of LVZ under Continental Plate


1
Department of Earth Sciences, National Cheng Kung University, Tainan 701, Taiwan
2
Hawaii Institute of Geophysics and Planetology, School of Ocean and Earth Science and Technology, University of Hawaii at Manoa, Honolulu, HI 96822, USA
*
Author to whom correspondence should be addressed.
Minerals 2020, 10(1), 71; https://doi.org/10.3390/min10010071
Submission received: 7 December 2019
/
Revised: 10 January 2020
/
Accepted: 12 January 2020
/
Published: 16 January 2020
(This article belongs to the Special Issue Mineral Physics—In Memory of Orson Anderson)
Abstract
:A suite of hydrous orthoenstatite crystals were synthesized at 5–7 GPa and 1100–1300 °C, corresponding to the mid upper mantle conditions in continental regions. The synthetic crystals presented a clear, inclusion-free, and euhedral form with a size range from 100 to a few hundred microns. The Al- and water content of crystals were less than 2 wt. % and ranging from ~500 ppm to 1000 ppm, respectively, characterized by Raman and IR spectroscopy, electron microscopy, and SIMS. The analysis shows that the capability of water incorporation for this suite of hydrous orthoenstatite is correlated to the Al-content in the crystal structure. To understand how the detailed crystal structure reflects the influence of water and Al, single crystal X ray diffraction analysis was performed for this suite of hydrous orthoenstatite. By comparing the results obtained at ambient conditions, we find that for low-level of Al-content, <2 wt. %, the Al3+ cation tends to occupy one of tetrahedral sites (TB) only. Analysis of the X ray diffraction results under high pressure indicates that the elasticity of orthoenstatites is insensitive to the presence of low-level water and Al. We use this finding to evaluate the velocity profile at the mid upper mantle of continental regions to compare with seismic observation. The comparison indicates that the cause of the low velocity zone in continental regions originates from the geotherm profile rather than the effect of water on the elasticity of mantle phases.
1. Introduction
The Mg-rich orthoenstatite (OEn) phase is one of the major mineral phases in lherzolite and harzburgite xenoliths, which put constraints on the composition of the lithosphere in continental regions [1]. To shed light on the physical state of the upper mantle, the elasticity of the anhydrous OEn phase has been investigated under high pressure and high temperature [2,3,4,5,6,7,8,9,10]. In terms of crystal chemistry, the pyroxene phase is a “nominally anhydrous mineral (NAM)”. Field evidence shows that the OEn phase often contains some amount of “water” within the crystal structure, up to 600–800 ppm, usually incorporated as hydroxyl, OH− [11,12,13]. It is well-known that the crystal chemistry (e.g., H+ concentration and minor elements) of mineral phases could have a different influence on the physical properties (e.g., [14,15,16,17,18]). Recent experiments indicate that the phase boundary of monoclinic enstatite (low-pressure phase to high-pressure phase) is noticeably shifted by the water content [19,20]. On the other hand, the phase transition in the hydrous orthoenstatite with low water-content at high pressure is only shifted by less than 1 GPa (from Pbca to P21/c) [21].
The experimental results also indicate that the presence of high Al-content in the synthetic orthoenstatite can enhance the water concentration up to 7500 ppm at low-pressure, but the Al content presented in orthopyroxene structure is depressed by the pressure effect [22,23,24]. The results of X-ray single-crystal diffraction experiments suggest that the site occupancy of H+ varies with the concentration of Al3+, as the H+ is located at the Si4+ site when the Al-content is fairly low. In contrast, H+ is located at both M and Si4+ sites when the Al-content was high in orthoenstatite [23,25]. To shed light on the effect of H+ incorporation in different crystallographic sites on elasticity, the compressional behavior of the hydrous OEn phase has to be investigated.
In the upper mantle, a low-velocity zone (LVZ) is characterized by low seismic velocity, high seismic attenuation and high electrical conductivity. Some potential causes of LVZ have been proposed, including: (1) change of geothermal gradient, (2) the presence of small amounts of the melt, and (3) the hydrogen present in the structure of NAMs [22,26,27,28,29,30]. In the wet mantle, the “water” can either be incorporated into the mantle phases to affect the elasticity, or exist as a hydrous fluid, which reduces the solidus of rock and may produce melt if the geotherm intersects with solidus [27,31,32]. The above factors have an effect on each other in the wet upper mantle. Among the mantle phases, the pyroxene phase is capable of carrying the highest water content at the mantle conditions [13,33]. As mentioned above, previous measurements on orthoenstatite were focused on anhydrous orthoenstatite. In order to evaluate the possible causes of LVZ in the continental regions, it is important to have access to the physical properties of hydrous pyroxene around the depth of LVZ. In this study, we investigated the compressional behavior of the orthoenstatite phase with crystal chemistry (Al3+ and water contents) under the mid upper mantle conditions.
2. Materials and Methods
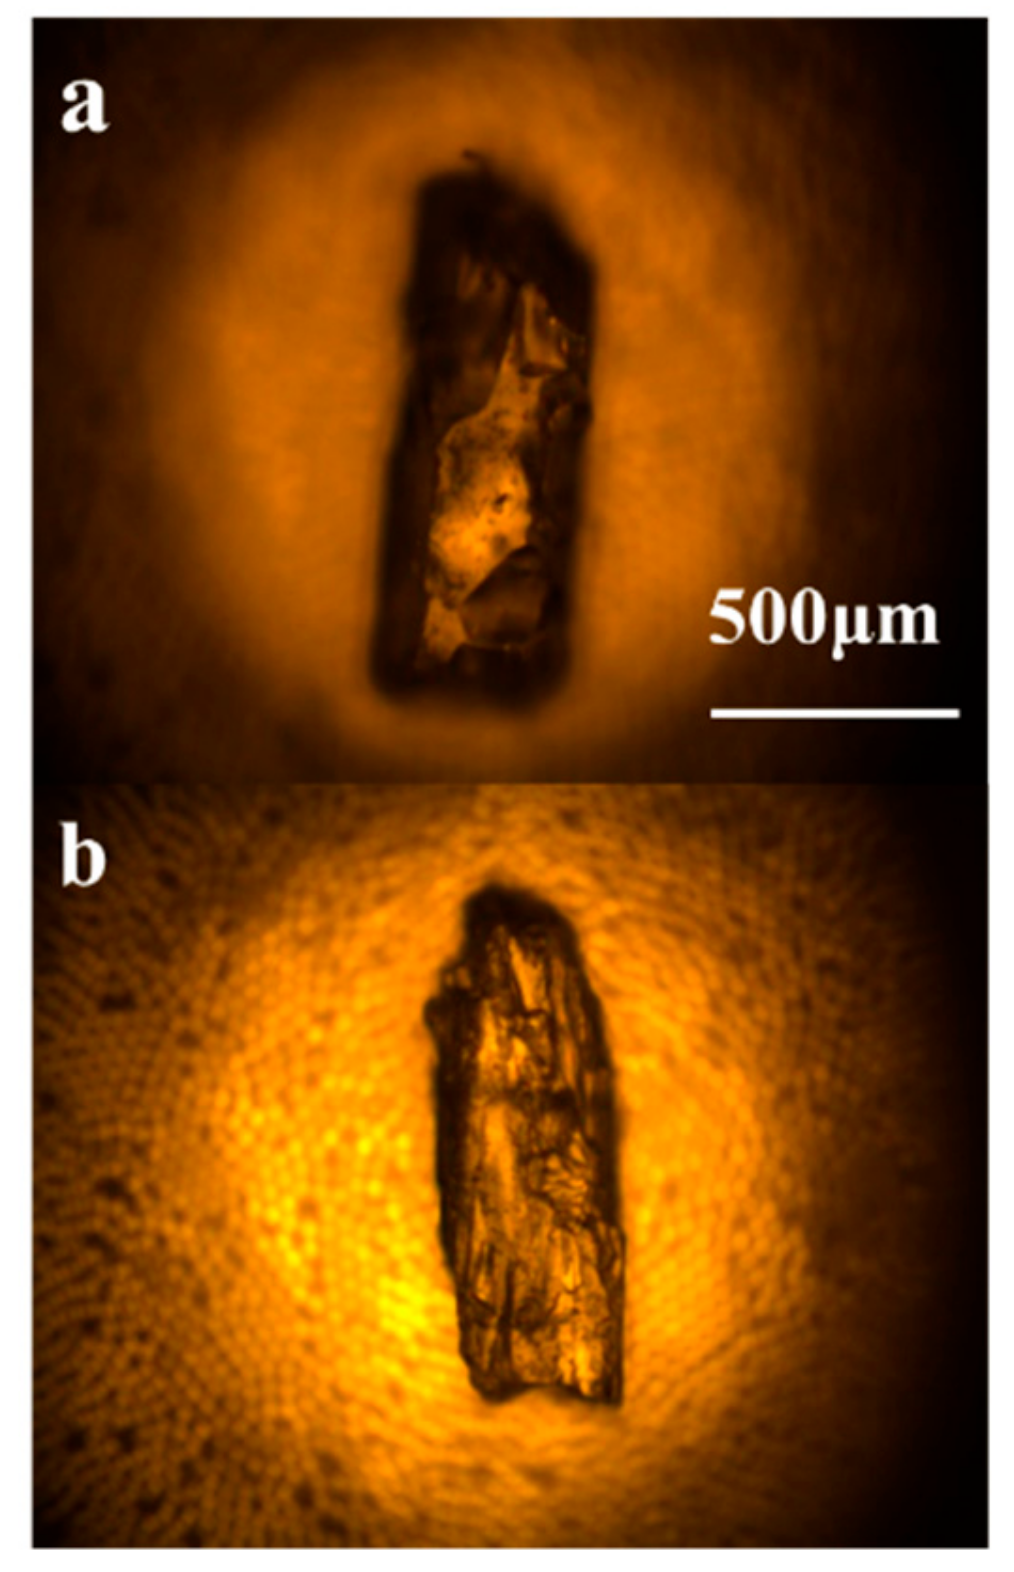
Single-crystal synthesis was carried out in a multi-anvil large volume high pressure apparatus installed at National Cheng Kung University (Tainan, Taiwan). The stoichiometry of the starting mixture of oxides, SiO2, MgO, Mg(OH)2, and Al(OH)3, was chosen to correspond to the composition of pure end-member or aluminous orthopyroxene. The MgSiO3 glass was used to synthesize anhydrous orthoenstatite, hereafter “OEn”, (R638). The synthesis was carried out at the pressure of 5–7 GPa and temperature of 1100–1300 °C. Experimental details are compiled in Table 1. The synthesized single crystals presented clear, inclusion-free and euhedral form (Figure 1). To identify the synthesized phase and verify the presence of [OH−] bonds, Raman spectroscopy measurements were carried out with the wavenumber range extended up to 4000 cm−1. The detailed characterization of [OH−] bands were performed by FTIR carried out at the Magmas and Volcanoes Laboratory of Clermont Auvergne University (Clermont-Ferrand, France). Figure 2 shows the Raman and IR spectra in the [OH−] vibrational region, collected from two crystals from runs R623 and R624 in this study. Water content was measured using the SIMS technique, with Cameca IMS-1280 ion microprobe installed at School of Ocean and Earth Science and Technology, University of Hawaii at Manoa (Honolulu, HI, USA), with the calibration curves constructed using standards employed in previous studies [34,35]. Chemical composition analyses were carried out by the electron microprobe in energy dispersive mode with FEI Quanta 250 electron microscopy installed at the Department of Earth Sciences, National Cheng Kung University.
X-ray single-crystal diffraction was performed at ambient conditions and at high pressure on a Bruker D8 Venture diffractometer equipped with IμS 3.0 Microfocus Source with Ag Kα radiation and a fixed-chi type goniometer installed at X-ray Atlas lab of the University of Hawaii at Manoa (Honolulu, HI, USA). Diffraction images were collected using PHOTON II detector. The tilting and rotation of the detector and the sample-to-detector distance were calibrated using NIST standard LaB6 powder. BX90 diamond anvil cells equipped with two 400-μm diameter culet diamonds were used for high pressure experiments. Rhenium gaskets were preindented to ~40 μm thicknesses and then ~180 μm diameter holes were laser-drilled at the center of gasket as sample chamber. Methanol-ethanol (4:1) mixture was loaded into the chamber as a pressure medium. Two ~10 μm ruby spheres were also loaded into the sample chamber to measure the pressure.
Diffraction images were analyzed using the APEX3 software package (v2018.1, Bruker AXS, Madison, WI, USA), including XPREP and SHELXL. Diffraction data were integrated using SAINT+ (Bruker-AXS) after exclusion of the non-sample diffraction spots and then corrected for absorption using the ABSORB software. Crystal symmetry and space group were determined by XPREP. Crystal structures were refined from the intensity data using the SHELXL software (2014/7, Bruker AXS, Madison, WI, USA). The cation occupancy parameters were constrained according to chemical analysis and charge balance. The balance formulas are shown in the following:
where X is molar number in chemical formula and Xobs is the value based on the chemical analysis. The instrumental errors were corrected according to NIST standard LaB6 powder following previous described procedure [21,36]. For high pressure experiments, the positions and intensities of ~400–600 unique peaks were extracted from the raw diffraction patterns at each pressure point. Dynamic masks were employed to correct for the regions on the detector shaded by the diamond-anvil cell. The rest of the data processing was carried out in a similar fashion to the data processed at ambient conditions.
Xobs = 4 XSi + 3 XAl + 2 XMg − 2 XO (charge balance)
Xobs = XSiA + XSiB (chemical analysis)
Xobs = XM1 +XM2 (chemical analysis)
3. Results and Discussion
In this study, we intended to synthesize anhydrous OEn by using mixed oxides (MgO and SiO2) and MgSiO3 glass for high pressure study. However, the Raman measurements showed that these “anhydrous phase” specimens (R626 and R638, starting with oxides and MgSiO3 glass) contained [OH−] signals. By comparing the integrated area of [OH−] bands of specimen R624, the water content of which was measured by SIMS, we estimated the crystals from R626 and R638 runs to contain ~300 ppm of water. Therefore, the specimens synthesized in this study are all hydrous phases. Chemical analysis of synthetic OEn is summarized in Table 2 and indicates that the synthetic pure Mg end-member specimens incorporated a small amount of aluminum (less than 0.34 Al2O3 wt. %), which were contaminated during the preparation of starting powder. This suite of low-Al content specimens, including R545, R598, R623, R626, and R638, will be referred to as Mg#100. The other two specimens, R608 and R624, contain Al2O3 at around 1.5–1.9 wt. % and will be referred as the Al-bearing OEn. The SIMS results indicate that the Al-bearing group contains about 800–1000 ppm of H2O, in contrast to Mg#100, which H2O content was around 400–500 ppm or less (Table 2). Figure 3a presents the relation of Al- and H2O- content of synthetic OEns in this study and [23], illustrating the Al-content having a strong influence of water incorporation in OEn structure, with higher Al concentration resulting in higher water content. The following discussion of water-dependence of the crystal structure will be highlighted by the influence of Al-replacement in the hydrous phase. Furthermore, based on the chemical analysis of Al-bearing OEn and the crystal-structure refinement, we observed that with less than 2 wt. % of Al2O3, the Al3+ cation only substitutes for Si4+ in tetrahedral site and prefers to occupy the SiB (i.e., TB) sites rather than the SiA (i.e., TA) sites, which is indicated as “AlB” occupancy in Supplementary Table S2 (R624 and R608).
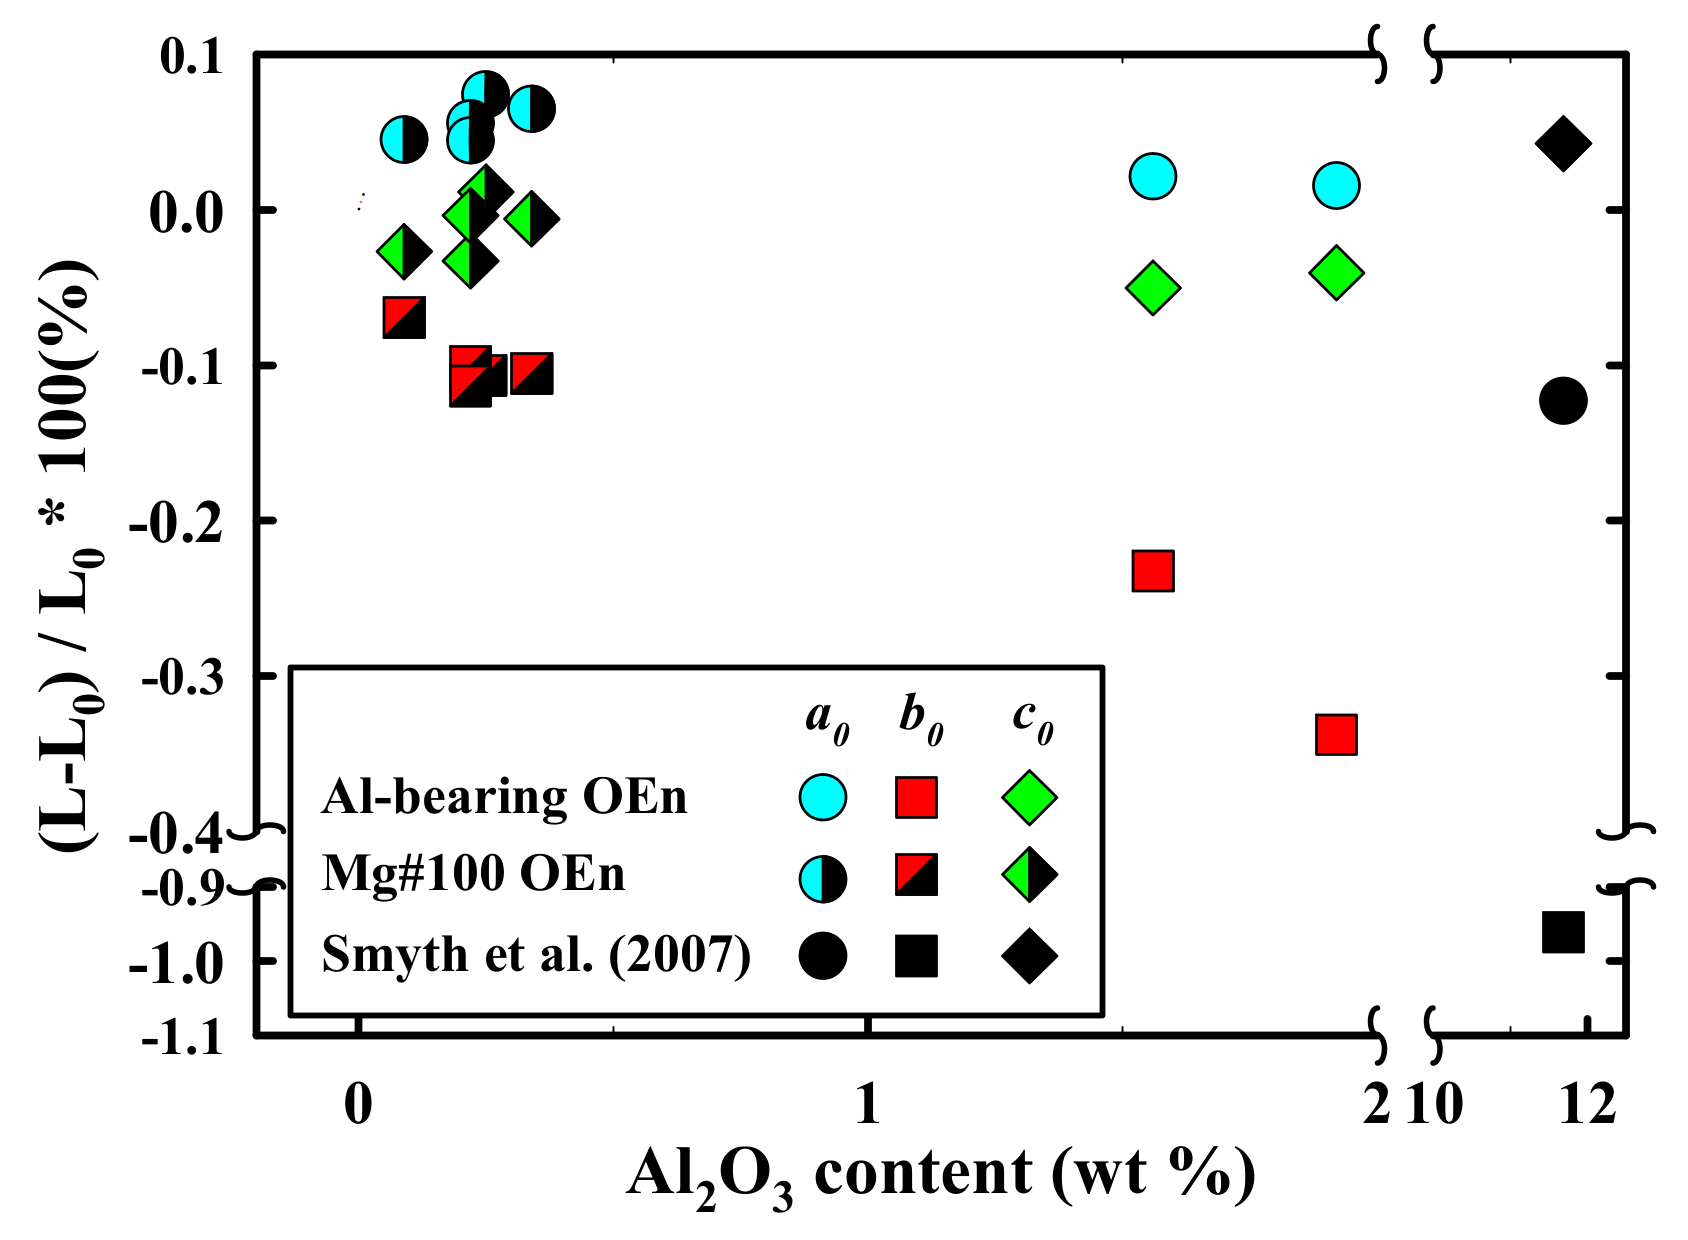
The X-ray diffraction result on the synthetic enstatite crystals clearly indicated orthorhombic symmetry with space group Pbca. X-ray diffraction measurements at ambient conditions were performed on six synthetic OEn specimens. Detailed refinement information is listed in Supplementary Tables S1 and S2. The cell volumes of the synthetic OEn investigated in this study (shown in Figure 3b, blue and half-filled blue circles) are distributed into two groups, corresponding to a detectable volume reduction caused by the Al-content incorporating in the structure. Compared with the anhydrous OEn from Ref. [37] (V0 = 831.4 Å3), the cell volumes of low-level water content OEn (less than 500 ppm, half-filled blue symbols in Figure 3b) are comparable within uncertainty, between 830.5 and 831.5 Å3. At higher water-content (~800–1000 ppm, blue symbols in Figure 3b), the measured cell volumes show systematically lower value (<830 Å3), compared with those of the hydrous Mg#100 (>830 Å3) specimens. The trend of the cell volume of hydrous OEn reduced by the water content observed in this study fits the earlier observation of high water-content Al-bearing specimen (11.7 wt. % of Al2O3 with 7500 ppm of water) presented by [23] (shown as black circle in Figure 3b). The relation of lengths of crystallographic axes and Al-content is illustrated in Figure 4. Within 2 wt. % Al2O3, the b-axial length presents a systematic decrease by more than 0.3%. In contrast, the a- and c-axial lengths remain roughly unchanged. When the OEn contains high Al2O3 content (~11.7 wt. %) as shown in [23], the b-axial length is dramatically shortened by 1%, while a and c-axes change only by ±0.1% (black symbols in Figure 4). Examination of the changes in unit cell parameters as a function of Al-content clearly shows that the reduction of cell volume is controlled by the shortening of b-axial length.
Pyroxene crystal structure contains two different polyhedra, SiO44− tetrahedra, marked as T(A, B), and M(1,2) octahedra. Through the detailed structural analysis of Mg#100 and Al-bearing OEn (Supplementary Tables S2 and S3), we note that the trend of tetrahedral volume of B-chain (VTB, diamond symbol) as function of Al-content presents a positive change (Figure 5a), whereas that of A-chain (VTA, circle symbols) remains unchanged, including the results of high Al-content OEn from the study of [23] (black symbols). In the case of the octahedral volumes of M1 and M2 sites (VM1,2), a decreasing trend presents as the Al-containing OEn is increasing in general, shown in Figure 5b. Furthermore, in the high Al-content OEn [23], the reduction of VM1 (the black circle in Figure 5b) is almost two times as large as that of VM2 (black diamonds in Figure 5b). The observed volume change as a function of Al-content can be explained by the analysis of crystal chemistry and the refined structural parameters obtained in this study and [23] (Supplementary Tables S2 and S3). When the Al-content is as low as <2 wt. % Al2O3, the larger Al3+ cation (ionic radius 0.53Å) tends to occupy the TA site rather than the TB site by replacing small Si4+ cation (ionic radius 0.40Å) (see item “AlB” in Supplementary Table S2). In contrast, when the Al-content is as high as ~11.7 wt. % of Al2O3 [23], the Al3+ cation occupies not only the tetrahedral site (TA) but also octahedral M1 site, replacing larger cation, like Mg2+ (ionic radius 0.72Å), resulting in M1 volume reduction by ~3.5%. On the other hand, the observation of minor volume reduction (~1%) in M1 and M2 sites for the low Al-content specimens in this study (<2.0 wt. %, blue filled symbols) is related to the introduction of vacancies in both sites, noted in Supplementary Table S2. The M2 volume reduction observed in [23] (black diamond in Figure 5b) is also caused by the vacancy incorporation.
Two high-pressure X ray diffraction experiments were performed on hydrous Mg#100 OEn (R598, 515 ppm of water) and hydrous Al-bearing OEn (R608, 1.56 wt. % of Al2O3 with 978 ppm of water) up to 15 GPa. The diffraction data were successfully indexed using the orthorhombic Pbca unit cell up to 13.2 and 10.0 GPa for Mg#100 OEn and Al-bearing OEn, respectively (Supplementary Table S4). The refinement details for Al-bearing OEn at high pressure are listed in Supplementary Table S5. Beyond the pressures mentioned above, the data became difficult to resolve for both runs due to a known phase transition at high pressure, from the Pbca phase to the P21/c phase, which was confirmed in previous studies [36,38]. Our high-pressure diffraction data suggest that the transition pressure for the Mg#100 phase and the Al-bearing phase were above 13.0 and 10.0 GPa, respectively.
Figure 6 shows the volume compression behavior of hydrous Mg#100 and Al-bearing OEn from this study, compared with previous studies on anhydrous Mg#100 [37] and hydrous Mg#100 with 600 ppm H2O [21]. All four datasets show similar compression behavior in orthoenstatite structure within Pbca stability field. This indicates that, below 1000 ppm, water/low Al-content in OEn has a small effect on the compression behavior of volume. As for the axial compressibility (Figure 7), all four OEn crystals with different crystal chemistry show the b-axis to be the most compressible, decreasing by about 3.5% at 12 GPa, while those a- and c-axes shorten between 2.0% and 2.5%, respectively. Taking a close look of the axial compression behavior (Figure 7), one can notice that the trends of b/b0 and c/c0 of the hydrous phases from this study (Mg#100 and Al-bearing) and [21] (Mg#100) follow those of anhydrous Mg#100 of [37] (empty symbols). The trends for the a-axis compressibility for the hydrous Al-bearing phase (with ~1000 ppm water) in this study and the hydrous Mg#100 (with ~620 ppm water) from [21] (red dashed line in Figure 7a) present a detectable difference from our hydrous Mg#100 (with ~520 ppm water) and the anhydrous Mg#100 from [37] (black dashed line in Figure 7a). The minor difference of compressibility in a-axis measured from our Al-bearing phase and Mg#100 in [21] does not affect the volume compressibility shown in Figure 6. At ambient conditions, the polyhedral volumes of the investigated Al-bearing OEn show a minor difference from those of anhydrous OEn from [37] (VTB, M1 and M2; Supplementary Table S3b). Under high pressure, the compressibility of tetrahedral voids (TA and TB) and octahedral voids (M1 and M2) of Al-bearing phase are comparable to those of anhydrous phase within uncertainty (Figure 8a,b).
We investigated the synthetic OEn single crystals with less than 2 wt. % of Al2O3 incorporating water content from ~500 ppm to near 1000 ppm, corresponding to the upper limit of hydration at mid-upper mantle conditions (depth of 150–250 km). The results of single-crystal X ray diffraction indicate that the detailed crystal structure of hydrous Al-doped OEn shows only minor difference from the anhydrous Mg#100 OEn at ambient conditions, and that compressional behavior for this series studied OEn is insensitive to current crystal chemistry (Figure 6, Figure 7 and Figure 8). The P-V results of this study suggest that the derived bulk modulus of hydrous low Al-bearing OEn is similar to that of anhydrous Mg#100 phase (Figure 6). The analysis of [39] indicated that the major elastic moduli, Cij (i = j, i = 1–6), of pyroxene are strongly correlated to the distortion of M1 and M2 octahedra. Our results on the compression of tetrahedra and octahedra do not show much difference from those of anhydrous Mg#100 phase. Therefore, we draw a conclusion that the elasticity of the studied OEn is insensitive to this level of Al- and water-content.
4. Geophysical Implications
In this study, the water content in our synthetic OEn phases was within the range of 500–1000 ppm, close to that observed in natural samples [33] and experimental values observed at the pressure of 5–7 GPa, temperature of 1100–1400 °C [22,24], corresponding to the depth of 200 ± 50 km. The OEn phase is a major mineral phase in addition to olivine, in continental petrological models. Here, we employ the current findings to explore the velocity profile of continental regions, where the LVZ is observed around 200–250 km depth [40]. For simplicity, we model by using only olivine and OEn phases in the weight ratios from 60:40 to 80:20, respectively, for the petrological compositions ranging from harzburgite to lherzolite. In the following illustration, the water content of the olivine phase is set to be at a maximum level of 1200 ppm, equilibrating with ~900 ppm H2O in Al-bearing OEn phase using the partitioning model of [24] (Dwater ~0.78) at conditions of 7.5 GPa, 1175 °C (Supplementary Table S6).
Among the upper mantle phases, olivine has been investigated most extensively, regarding how the elasticity is affected by a wide range of water content within the structure [41]. The elasticity of the hydrate olivine, with ~9000 ppm of water, are 0.6% and 0.4% for P and S waves, respectively, lower than those of anhydrous olivine. The water contents in our current investigated hydrous OEn phases is about the level of 1000 ppm, about one-ninth of samples in Ref. [41]. From the comparison of compressional behavior between anhydrous and hydrous OEn, we expect that the current water-content would not affect the elasticity too much. The compressibility study of hydrous diopside [42], with ~600 ppm of water, provide some evidence for that. Without available elasticity measured by optic-acoustic measurements (i.e., Brillouin scattering or ultrasonic measurement) for hydrous OEn phase, we use the reduction factor established from the hydrous olivine phase summarized by [41] to scale down the elastic velocities of hydrous OEn investigated in this study. The tested P-T conditions are set at shallow upper mantle (less than 250 km depth), and thus, a linear relation of VS as function pressure and temperature is employed. Here, we only use the shear wave data to compare the S wave seismic models from [40],
where VS(0) are S-wave velocity at ambient condition or high pressure-high temperature conditions, respectively, and dVS⁄dP and dVS⁄dT are the pressure and temperature derivatives of the velocity of olivine or enstatite, respectively. The thermoelastic parameters used in this study are presented in Table 3 [43,44,45]. Due to the measurements of the thermoelastic parameters for both hydrous olivine and OEn phases is incomplete, those parameters tabulated in Table 3 are from anhydrous phases. We tested the velocities of olivine and OEn under upper mantle conditions using the thermoelastic parameters in Table 3 along 100 Ma geotherm to compare with those calculated in [28]. The calculated S wave velocity profiles of olivine and OEn shared the same feature with those shown in Figure 4 of [28], displaying a velocity minimum around 150 km depth with Vs less 3% higher (the illustration is not shown in this study). This demonstrates that the simplified Equation (4) generates the same feature as reported in the previous study. We computed the pure olivine and OEn phases along the continental platform geotherm (solid black line in Figure 9, Tp = 1350 °C, the mantle potential temperature). As clearly shown in Figure 10, the shear velocities of hydrous-olivine and -OEn (the blue dashed lines next to the green and orange lines, respectively) are insensitive to the water content at the level of ~1000 ppm. The blue shed area is the resultant shear velocity profile of the continental petrological models (from harzburgite to lherzolite) calculated using a simple linear equation with different ratio in weight % of olivine and OEn. The calculated shear velocity profile for the continental area presents a broad low-velocity channel around the depth of 200 km, compared with the seismic models of Australia (yellow dashed line) and Canadian (red dashed line) areas where the LVZ presented below 200 km depth [40]. The difference of velocity minimum between our calculation and those seismic models is less than 1.7%, which can be reduced by introducing the low-velocity Ca-rich pyroxene into mineralogical assemblage models. The above modeling thermoelastic parameters are determined for end-member compositions, forsterite (Mg2SiO4) and enstatite (MgSiO3). To consider the iron effect on elasticity of olivine and OEn phases, the S wave velocity may reduce by ~3% for the modeled mineral assemblies when the Mg number for both phases remain roughly the same at upper mantle condition, Mg# = 92 ± 2. Ref. [14] pointed out that the elastic velocities of Al-bearing (5 wt. %) OEn is approximately 3% faster than those of Mg#100. At the upper mantle, the Al-content in OEN is the function of depth. To consider the effect of Al-content on the S wave velocity in Figure 10, we expect the increase of the magnitude of velocity drop from the depth of 100 km to 200 km. However, we do not know the elasticity behavior of hydrous Al-bearing OEn, when high Al-content may contain higher water in the crystal structure at ‘wet’ mantle condition. Considering the ratio of OEn phase decreasing upon the pressure increasing at upper mantle condition, the blue shaded zone in Figure 10 also gives the velocity trend, shifting towards left-side of area. The influence of crystal chemistry of NAM phases most likely is to show on the magnitude of velocity drop, not the depth of the velocity minimum channel and the width of the channel. The current geotherm model of the continental platform in Figure 9 would not satisfy the velocity minimum channel observed below 200 km depth, shown in the seismic models [40]. We also computed the shear velocity with harzburgite composition model (60 wt. % olivine: 40 wt. % OEn) along an averaged cratonic geotherm derived from heat flow of 40 mW/m2, suggested by [46], shown as black dashed line in Figure 9. The low-temperature geotherm results in a fast velocity drop (thick gray dashed line) and a deeper velocity minimum located at the depth of mantle adiabat, 250 km. By comparing different gradients of geotherms, we illustrate the depth of low-velocity channel strongly associated with the depth where the geotherm gradient turns from conductive mode (shallower than the empty red cross along the continental platform geotherm in Figure 9) to the condition of the mantle adiabat (at a depth of 250 km). Under the constraint of the seismic feature, the thermal gradient of the cratonic areas could be set between the continental platform and averaged cratonic regions in Figure 9, while considering the effect of thermal profile only.
VS = VS(0) + (dVS)/dP·ΔP + (dVS)/dT·ΔT
The water content of the measured OEn in this study (~1000 ppm) would be the upper bound under the upper mantle conditions according to the observation of natural mantle samples [13,33]. We use the amount of ~1000 ppm water in the OEn phase as a constraint to model the water content in the olivine phase utilizing the partitioning coefficient at a pressure of 7.5 GPa, temperature of ~1200 °C determined by [24], resulting in the estimated bulk water content to be 1000~1200 ppm for the petrology models employed in this study. As shown in Figure 9, the continental platform geotherm (solid black line) and the mantle solidus with 1000 ppm H2O (blue shaded area) could not intersect at the depth of 200 km or deeper. In this case, the origin of LVZ has little to do with partial melting at this depth, when the potential temperature was set around 1350 °C.
We demonstrated that the major influence of the depth and shape of LVZ in the continental area would be related to the character of the geothermal gradient, especially the depth segment from “conductive” mantle transforming to “adiabatic” mantle if the thermal effect is the major consideration. On the other hand, under such a cool continental geotherm, shown in Figure 9, if the cause of LVZ involves the melt, then the water content has to be higher than 1500 ppm at least in the mantle rock carried by the hydrous NAM minerals or free fluid. To investigate whether partial melting is involved in the origin of LVZ, the results of electrical conductivity measurements would need to provide additional constraints [49,50].
Supplementary Materials
The following are available online at https://www.mdpi.com/2075-163X/10/1/71/s1, Tables S1 to S6.
Author Contributions
Conceptualization, J.K.; methodology, J.K., P.D., F.T.-S.H.; validation, J.K., F.T.-S.H.; formal analysis, F.T.-S.H., P.D.; resources, J.K., P.D.; data curation, J.K., P.D., F.T.-S.H.; writing-original draft preparation, F.T.-S.H., J.K.; writing-review and editing, J.K., P.D., F.T.-S.H.; visualization, F.T.-S.H., J.K.; supervision, J.K.; project administration, J.K.; funding acquisition, J.K. All authors have read and agreed to the published version of the manuscript.
Funding
The research grants were funded by Ministry of Science and Technology, grant numbers MOST 106(107,108)-M-2116-010(080,015) (to J.K.). The visiting grants for F.H. was supported by the grants of MOST (to J.K.), Higher Education Sprout Project, Ministry of Education to the Headquarters of University Advancement at National Cheng Kung University(NCKU) and National Science Foundation grant EAR 1722969 (to P.D.). High-pressure facility at NCKU was partially supported by the grant of “Geochemical Precious Instrument Platform Project: Southern Branch Ministry of Science and Technology”. X-ray diffraction work was conducted using the X-ray Atlas instrument at the University of Hawaii, funded by NSF grant EAR 1541516 (to P.D.).
Acknowledgments
The authors are grateful to Gary Huss and Kazuhide Nagashima for the assistance of SIMS measurement and Gregory Finkelstein for the starting of diffraction work. ChingChien Li is thanked for IR measurement and sample R545 synthesis.
Conflicts of Interest
The authors declare that none has any conflict of interest.
References
- McDonough, W.F. Constraints on the composition of the continental lithospheric mantle. Earth Planet. Sci. Lett. 1990, 101, 1–18. [Google Scholar] [CrossRef]
- Frisillo, A.L.; Barsch, G.R. Measurement of single-crystal elastic-constants of bronzite as a function of pressure and temperature. J. Geophys. Res. 1972, 77, 6360–6384. [Google Scholar] [CrossRef]
- Webb, S.L.; Jackson, I. The pressure-dependence of the elastic-moduli of single-crystal ortho-pyroxene (Mg0.8Fe0.2) SiO3. Eur. J. Mineral. 1993, 5, 1111–1119. [Google Scholar] [CrossRef]
- Flesch, L.M.; Li, B.S.; Liebermann, R.C. Sound velocities of polycrystalline MgSiO3-orthopyroxene to 10 GPa at room temperature. Am. Mineral. 1998, 83, 444–450. [Google Scholar] [CrossRef]
- Angel, R.J.; Jackson, J.M. Elasticity and equation of state of orthoenstatite, MgSiO3. Am. Mineral. 2002, 87, 558–561. [Google Scholar] [CrossRef]
- Jackson, J.M.; Palko, J.W.; Andrault, D.; Sinogeikin, S.V.; Lakshtanov, D.L.; Wang, J.Y.; Bass, J.D.; Zha, C.S. Thermal expansion of natural orthoenstatite to 1473 K. Eur. J. Mineral. 2003, 15, 469–473. [Google Scholar] [CrossRef] [Green Version]
- Jackson, J.M.; Sinogeikin, S.V.; Carpenter, M.A.; Bass, J.D. Novel phase transition in orthoenstatite. Am. Mineral. 2004, 89, 239–244. [Google Scholar] [CrossRef]
- Jackson, J.M.; Sinogeikin, S.V.; Bass, J.D. Sound velocities and single-crystal elasticity of orthoenstatite to 1073 K at ambient pressure. Phys. Earth Planet. Inter. 2007, 161, 1–12. [Google Scholar] [CrossRef]
- Kung, J.; Li, B.S.; Uchida, T.; Wang, Y.B.; Neuville, D.; Liebermann, R.C. In situ measurements of sound velocities and densities across the orthopyroxene → high-pressure clinopyroxene transition in MgSiO3 at high pressure. Phys. Earth Planet. Inter. 2004, 147, 27–44. [Google Scholar] [CrossRef]
- Kung, J.; Jackson, I.; Liebermann, R.C. High-temperature elasticity of polycrystalline orthoenstatite (MgSiO3). Am. Mineral. 2011, 96, 577–585. [Google Scholar] [CrossRef]
- Skogby, H. Water in natural mantle minerals I: Pyroxenes. In Water in Nominally Anhydrous Minerals; Book Series: Reviews in Mineralogy & Geochemistry; Mineralogical Soc America: Chantilly, VA, USA, 2006; Volume 62, pp. 155–167. [Google Scholar]
- Beran, A.; Libowitzky, E. Water in natural mantle minerals II: Olivine, garnet and accessory minerals. In Water in Nominally Anhydrous Minerals; Book Series: Reviews in Mineralogy & Geochemistry; Mineralogical Society America: Chantilly, VA, USA, 2006; Volume 62, pp. 169–191. [Google Scholar]
- Demouchy, S.; Bolfan-Casanova, N. Distribution and transport of hydrogen in the lithospheric mantle: A review. Lithos 2016, 240, 402–425. [Google Scholar] [CrossRef]
- Chai, M.; Brown, J.M.; Slutsky, L.J. The elastic constants of an aluminous orthopyroxene to 12.5 GPa. J. Geophys. Res. Solid Earth 1997, 102, 14779–14785. [Google Scholar] [CrossRef]
- Frost, D.J.; Dolejs, D. Experimental determination of the effect of H2O on the 410-km seismic discontinuity. Earth Planet. Sci. Lett. 2007, 256, 182–195. [Google Scholar] [CrossRef]
- Poe, B.T.; Romano, C.; Nestola, F.; Smyth, J.R. Electrical conductivity anisotropy of dry and hydrous olivine at 8 GPa. Phys. Earth Planet. Inter. 2010, 181, 103–111. [Google Scholar] [CrossRef] [Green Version]
- Mao, Z.; Li, X.Y. Effect of hydration on the elasticity of mantle minerals and its geophysical implications. Sci. China-Earth Sci. 2016, 59, 873–888. [Google Scholar] [CrossRef]
- Chang, Y.Y.; Hsieh, W.P.; Tan, E.; Chen, J.H. Hydration-reduced lattice thermal conductivity of olivine in Earth’s upper mantle. Proc. Natl. Acad. Sci. USA 2017, 114, 4078–4081. [Google Scholar] [CrossRef] [Green Version]
- Withers, A.C.; Hirschmann, M.M. H2O storage capacity of MgSiO3 clinoenstatite at 8–13 GPa, 1,100–1,400 degrees C. Contrib. Mineral. Petrol. 2007, 154, 663–674. [Google Scholar] [CrossRef]
- Jacobsen, S.D.; Liu, Z.X.; Ballaran, T.B.; Littlefield, E.F.; Ehm, L.; Hemley, R.J. Effect of H2O on upper mantle phase transitions in MgSiO3: Is the depth of the seismic X-discontinuity an indicator of mantle water content? Phys. Earth Planet. Inter. 2010, 183, 234–244. [Google Scholar] [CrossRef]
- Xu, J.G.; Zhang, D.Z.; Fan, D.W.; Zhang, J.S.; Hu, Y.; Guo, X.Z.; Dera, P.; Zhou, W.G. Phase transitions in orthoenstatite and subduction zone dynamics: Effects of water and transition metal ions. J. Geophys. Res. Solid Earth 2018, 123, 2723–2737. [Google Scholar] [CrossRef]
- Mierdel, K.; Keppler, H.; Smyth, J.R.; Langenhorst, F. Water solubility in aluminous orthopyroxene and the origin of Earth’s asthenosphere. Science 2007, 315, 364–368. [Google Scholar] [CrossRef] [Green Version]
- Smyth, J.R.; Mierdel, K.; Keppler, H.; Langenhorst, F.; Dubrovinsky, L.; Nestola, F. Crystal chemistry of hydration in aluminous orthopyroxene. Am. Mineral. 2007, 92, 973–976. [Google Scholar] [CrossRef]
- Ferot, A.; Bolfan-Casanova, N. Water storage capacity in olivine and pyroxene to 14 GPa: Implications for the water content of the earth’s upper mantle and nature of seismic discontinuities. Earth Planet. Sci. Lett. 2012, 349, 218–230. [Google Scholar] [CrossRef]
- Takeda, H. Tetrahedral sizes of orthopyroxenes and silicon-aluminum ordering. Am. Mineral. 1973, 58, 1096–1097. [Google Scholar]
- Bell, D.R.; Rossman, G.R. Water in Earth’s Mantle—The role of nominally anhydrous minerals. Science 1992, 255, 1391–1397. [Google Scholar] [CrossRef] [PubMed]
- Hirschmann, M.M. Water, melting, and the deep Earth H2O cycle. Ann. Rev. Earth Planet. Sci. 2006, 34, 629–653. [Google Scholar] [CrossRef] [Green Version]
- Stixrude, L.; Lithgow-Bertelloni, C. Mineralogy and elasticity of the oceanic upper mantle: Origin of the low-velocity zone. J. Geophys. Res. Solid Earth 2005, 110. [Google Scholar] [CrossRef] [Green Version]
- Kawakatsu, H.; Kumar, P.; Takei, Y.; Shinohara, M.; Kanazawa, T.; Araki, E.; Suyehiro, K. Seismic evidence for sharp lithosphere-asthenosphere boundaries of oceanic plates. Science 2009, 324, 499–502. [Google Scholar] [CrossRef] [Green Version]
- Karato, S.I. On the origin of the asthenosphere. Earth Planet. Sci. Lett. 2012, 321, 95–103. [Google Scholar] [CrossRef]
- Green, D.H.; Hibberson, W.O.; Kovacs, I.; Rosenthal, A. Water and its influence on the lithosphere-asthenosphere boundary. Nature 2010, 467, 448–497. [Google Scholar] [CrossRef]
- Condie, K.C. The Mantle. In Earth as an Evolving Planetary System, 3rd ed.; Condie, K.C., Ed.; Elsevier Ltd.: Amsterdam, The Netherlands, 2016; Volume 3, pp. 89–133. [Google Scholar]
- Ingrin, J.; Skogby, H. Hydrogen in nominally anhydrous upper-mantle minerals: Concentration levels and implications. Eur. J. Mineral. 2000, 12, 543–570. [Google Scholar] [CrossRef]
- Peslier, A.H.; Luhr, J.F.; Post, J. Low water contents in pyroxenes from spinel-peridotites of the oxidized, sub-arc mantle wedge. Earth Planet. Sci. Lett. 2002, 201, 69–86. [Google Scholar] [CrossRef]
- Shimizu, K.; Ushikubo, T.; Hamada, M.; Itoh, S.; Higashi, Y.; Takahashi, E.; Ito, M. H2O, CO2, F, S, Cl, and P2O5 analyses of silicate glasses using SIMS: Report of volatile standard glasses. Geochem. J. 2017, 51, 299–313. [Google Scholar] [CrossRef]
- Finkelstein, G.J.; Dera, P.K.; Duffy, T.S. Phase transitions in orthopyroxene (En90) to 49 GPa from single-crystal X-ray diffraction. Phys. Earth Planet. Inter. 2015, 244, 78–86. [Google Scholar] [CrossRef] [Green Version]
- Periotto, B.; Balic-Zunic, T.; Nestola, F.; Katerinopoulou, A.; Angel, R.J. Re-investigation of the crystal structure of enstatite under high-pressure conditions. Am. Mineral. 2012, 97, 1741–1748. [Google Scholar] [CrossRef]
- Dera, P.; Finkelstein, G.J.; Duffy, T.S.; Downs, R.T.; Meng, Y.; Prakapenka, V.; Tkachev, S. Metastable high-pressure transformations of orthoferrosilite Fs82. J. Geophys. Res. Solid Earth 2013, 221, 15–21. [Google Scholar] [CrossRef]
- Duffy, T.S.; Vaughan, M.T. Elasticity of enstatite and its relationship to crystal-structure. J. Geophys. Res. Solid Earth Planets 1988, 93, 383–391. [Google Scholar] [CrossRef]
- Romanowicz, B. The thickness of tectonic plates. Science 2009, 324, 474–476. [Google Scholar] [CrossRef]
- Mao, Z.; Jacobsen, S.D.; Jiang, F.; Smyth, J.R.; Holl, C.M.; Frost, D.J.; Duffy, T.S. Velocity crossover between hydrous and anhydrous forsterite at high pressures. Earth Planet. Sci. Lett. 2010, 293, 250–258. [Google Scholar] [CrossRef]
- Gavrilenko, P.; Ballaran, T.B.; Keppler, H. The effect of Al and water on the compressibility of diopside. Am. Mineral. 2010, 95, 608–616. [Google Scholar] [CrossRef]
- Suzuki, I.; Anderson, O.L.; Sumino, Y. Elastic properties of a single-crystal forsterite Mg2SiO4, up to 1,200 K. Phys. Chem. Miner. 1983, 10, 38–46. [Google Scholar] [CrossRef]
- Darling, K.L.; Gwanmesia, G.D.; Kung, J.; Li, B.S.; Liebermann, R.C. Ultrasonic measurements of the sound velocities in polycrystalline San Carlos olivine in multi-anvil, high-pressure apparatus. Phys. Earth Planet. Inter. 2004, 143, 19–31. [Google Scholar] [CrossRef]
- Isaak, D.G. high-temperature elasticity of iron-bearing olivines. J. Geophys. Res. Solid Earth 1992, 97, 1871–1885. [Google Scholar] [CrossRef]
- Cammarano, F.; Romanowicz, B. Insights into the nature of the transition zone from physically constrained inversion of long-period seismic data. Proc. Natl. Acad. Sci. USA 2007, 104, 9139–9144. [Google Scholar] [CrossRef] [PubMed] [Green Version]
- Katz, R.F.; Spiegelman, M.; Langmuir, C.H. A new parameterization of hydrous mantle melting. Geochem. Geophys. Geosys. 2003, 4, 1073. [Google Scholar] [CrossRef]
- Green, D.H. Experimental petrology of peridotites, including effects of water and carbon on melting in the Earth’s upper mantle. Phys. Chem. Miner. 2015, 42, 95–122. [Google Scholar] [CrossRef]
- Dai, L.D.; Karato, S.I. Electrical conductivity of orthopyroxene: Implications for the water content of the asthenosphere. Proc. Jpn. Acad. Series B-Phys. Biol. Sci. 2009, 85, 466–475. [Google Scholar] [CrossRef] [Green Version]
- Jones, A.G.; Fullea, J.; Evans, R.L.; Muller, M.R. Water in cratonic lithosphere: Calibrating laboratory-determined models of electrical conductivity of mantle minerals using geophysical and petrological observations. Geochem. Geophys. Geosys. 2012, 13. [Google Scholar] [CrossRef] [Green Version]
Figure 1.
Samples of (a) hydrous Mg#100 (R623) and (b) Al-bearing OEn (R624).

Figure 2.
Polarized Raman and IR spectra (E parallel c axis) of hydrous OEn crystals in this study. The black and red lines are the data collected from Raman and FTIR spectroscopy, respectively.
Figure 2.
Polarized Raman and IR spectra (E parallel c axis) of hydrous OEn crystals in this study. The black and red lines are the data collected from Raman and FTIR spectroscopy, respectively.

Figure 3.
The relations between Al-content (a), cell volume (b) and water content among the investigated OEn crystals from this study and [23]. The half-filled and filled blue symbols are hydrous pure and Al-bearing OEn from this study, respectively; the black symbol is higher-aluminous OEn from the study of [23]. The error bars are smaller than the size of symbols. The details were described in text.

Figure 4.
The relative difference of cell parameters of investigated hydrous OEn as a function of Al-content. The circle, diamond and square represent a, b and c axis, respectively. The half-filled colored symbols represent the composition of Mg#100 and full colored to be Al-bearing crystals. The black symbols are the data from [23]. The cell parameter of a, b, and c in this figure were compared to those of anhydrous OEn presented in [37]. The error bars are smaller than the size of symbols.

Figure 5.
The relative difference of tetrahedral (TA and TB sites, (a)) and octahedral (M1 and M2 sites, (b)) volumes among investigated hydrous OEn as a function of Al-content. The half-filled colored symbols represent Mg#100 and full colored to be Al-bearing composition. The black symbols are the data from [23]. The polyhedral volumes in this figure were compared to those of anhydrous OEn presented in [37]. The error bars are smaller than the size of symbols.

Figure 6.
Pressure evolution of the normalized unit-cell volume of anhydrous and hydrous enstatite. The half-filled and filled orange symbols represent the hydrous #Mg100 and Al-bearing OEn from this work, respectively; the empty hexagonal symbols for data of anhydrous OEn from [37]; the filled hexagonal symbols for data of hydrous OEn from [21]. The dashed line is the third-order Birch-Murnaghan equation of state (EoS) fit from anhydrous OEn from [37]. The error bars of the data points are smaller than the size of symbols.

Figure 7.
Pressure evolution of normalized cell parameters of anhydrous and hydrous enstatite for (a) a/a0, (b) b/b0 and (c) c/c0. The half-filled and filled colored symbols represent the hydrous Mg#100 and Al-hydrous OEn from this work; the empty symbols for data of anhydrous OEn from [37]; the black symbols for data of hydrous OEn from [21]. The dashed black line is the fit of third-order Birch-Murnaghan equation of state (EoS) from [37] and the red dashed line in (a) represents the fit of Al-bearing OEn from this work and [21]. The error bars of the data points are smaller than the size of symbols.

Figure 8.
Evolution of tetrahedral (a) and octahedral (b) volumes as a function of pressure. The blue symbols represent the data of hydrous Al-bearing OEn from this work, and the empty symbols are the data from [37].
Figure 8.
Evolution of tetrahedral (a) and octahedral (b) volumes as a function of pressure. The blue symbols represent the data of hydrous Al-bearing OEn from this work, and the empty symbols are the data from [37].

Figure 9.
Solidus and thermal gradient as a function of depth discussed in this study. The continental geothermal gradient is from [32] and the averaged cratonic geotherm is from [46]. The dry and wet solidus are from [47,48], respectively. The geotherm above empty red cross represents the “conductive” geotherm and the mantle adiabat starts at a depth of 250 km at the upper mantle. The blue shaded area is the P-T conditions of synthetic orthoenstatite crystals in this study.

Figure 10.
Shear wave velocity of olivine and OEn, and modeled continental petrological compositions computed along different geotherms as a function of depth in the continental area. The green and orange curves represent the velocity of anhydrous olivine and OEn phases. The long-dashed blue lines are the velocities of hydrous OEn and olivine. The blue shaded zone represents the shear velocity computed from different mineralogical assembly using different weight ratios of olivine and OEn. The thick grey dashed line represents the shear velocity computed from the low-temperature geotherm [46]. The short-dashed lines are reprinted from the shear velocity model of [40], including Australia craton (yellow) and Canadian craton (red). The details are described in the text.


Table 1.
Experimental conditions of crystal synthesis and products.
| Run | Pressure (GPa) | Temperature (°C) | Crystal Size Long-Axis Lengths (μm) | Run Products | |
|---|---|---|---|---|---|
| Anhydrous (intended) | |||||
| R638 | 5.5 | 1300 | 50–150 | OEn | |
| R626 | 6 | 1200 | 100–400 | OEn | |
| Hydrous | |||||
| R598 | 5 | 1200 | 100–300 | OEn | |
| R545 | 5 | 1400 | 100–300 | OEn | |
| R623 | 5.5 | 1200 | 500–1000 | OEn, Coe 1 | |
| Al-bearing hydrous | |||||
| R624 | 5.5 | 1200 | 400–700 | OEn | |
| R608 | 7 | 1200 | 200–400 | OEn, Ol 2 | |
1 Coe, coesite; 2 Ol, olivine.
Table 2.
Chemical compositions of synthesized orthoenstatite.
| Phase | Run No. | MgO (wt. %) | SiO2 (wt. %) | Al2O3 (wt. %) | Water (ppm) |
|---|---|---|---|---|---|
| Hydrous Mg#100 | R545 | 40.39 ± 0.30 | 61.13 ± 0.49 | 0.13 ± 0.03 | 319 ± 40 |
| OEn | R598 | 38.60 ± 0.05 | 58.47 ± 0.09 | 0.25 ± 0.07 | 515 ± 75 |
| R623 | 38.30 ± 0.56 | 59.51 ± 0.74 | 0.09 ± 0.07 | 417 ± 18 | |
| R626 * | 38.66 ± 0.18 | 60.59 ± 0.33 | 0.34 ± 0.05 | 300–400 * | |
| R638 * | 38.36 ± 0.18 | 60.78 ± 0.35 | 0.22 ± 0.04 | 300–400 * | |
| Hydrous Al-bearing | R608 | 38.08 ± 0.13 | 58.56 ± 0.27 | 1.56 ± 0.09 | 978 ± 117 |
| OEn | R624 | 37.69 ± 0.79 | 58.73 ± 1.15 | 1.92 ± 0.66 | 849 ± 69 |
* Both R626 and R638 were intended to be the anhydrous OEn, but obvious OH− bands were observed by Raman and IR measurements. The concentration of water was estimated by comparing the area of OH− bands with those of R608. The details were described in text.
Table 3.
Elastic properties of olivine and orthoenstatite at high pressure and high temperature.
| Olivine | Orthoenstatite | ||
|---|---|---|---|
| Anhydrous | Hydrous (0.9 wt. %) | Anhydrous | |
| VS(0) (km/s) | 5.03 a | 5.01 b | 4.88 c |
| δVS/δP (km/s/GPa) | 0.032 d | 0.029 b | 0.035 e |
| δVS/δT (km/s/K) | −0.00037 f | −0.00041 c | |
© 2020 by the authors. Licensee MDPI, Basel, Switzerland. This article is an open access article distributed under the terms and conditions of the Creative Commons Attribution (CC BY) license (http://creativecommons.org/licenses/by/4.0/).
Share and Cite
MDPI and ACS Style
Hua, F.T.-S.; Dera, P.; Kung, J. Compressional Behavior of Hydrous Orthoenstatite: Insight into the Nature of LVZ under Continental Plate. Minerals 2020, 10, 71. https://doi.org/10.3390/min10010071
AMA Style
Hua FT-S, Dera P, Kung J. Compressional Behavior of Hydrous Orthoenstatite: Insight into the Nature of LVZ under Continental Plate. Minerals. 2020; 10(1):71. https://doi.org/10.3390/min10010071
Chicago/Turabian StyleHua, Florian Tian-Siang, Przemyslaw Dera, and Jennifer Kung. 2020. "Compressional Behavior of Hydrous Orthoenstatite: Insight into the Nature of LVZ under Continental Plate" Minerals 10, no. 1: 71. https://doi.org/10.3390/min10010071
Note that from the first issue of 2016, this journal uses article numbers instead of page numbers. See further details here.