Article

The Bridgmanite–Akimotoite–Majorite Triple Point Determined in Large Volume Press and Laser-Heated Diamond Anvil Cell

by
Britany L. Kulka
1,
Jonathan D. Dolinschi
1,
Kurt D. Leinenweber
2,
Vitali B. Prakapenka
3 and
Sang-Heon Shim
1,*
1
School of Earth and Space Exploration, Arizona State University, Tempe, AZ 85287, USA
2
Eyring Materials Center, Arizona State University, Tempe, AZ 85287, USA
3
GeoSoilEnviroCars, University of Chicago, Chicago, IL 60439, USA
*
Author to whom correspondence should be addressed.
Minerals 2020, 10(1), 67; https://doi.org/10.3390/min10010067
Submission received: 11 December 2019 / Revised: 7 January 2020 / Accepted: 9 January 2020 / Published: 15 January 2020
(This article belongs to the Special Issue Mineral Physics—In Memory of Orson Anderson)

Abstract

:
The bridgmanite–akimotoite–majorite (Bm–Ak–Mj or BAM) triple point in MgSiO3 has been measured in large-volume press (LVP; COMPRES 8/3 assembly) and laser-heated diamond anvil cell (LHDAC). For the LVP data, we calculated pressures from the calibration provided for the assembly. For the LHDAC data, we conducted in situ determination of pressure at high temperature using the Pt scale at synchrotron. The measured temperatures of the triple point are in good agreement between LVP and LHDAC at 1990–2000 K. However, the pressure for the triple point determined from the LVP is 3.9 ± 0.6 GPa lower than that from the LHDAC dataset. The BAM triple point determined through these experiments will provide an important reference point in the pressure–temperature space for future high-pressure experiments and will allow mineral physicists to compare the pressure–temperature conditions measured in these two different experimental methods.

1. Introduction

Accurate determination of pressure ( P ) and temperature ( T ) is essential for laboratory experiments to contribute to the geophysical understandings of the deep interiors of Earth, other planets in the solar system, and exoplanets. As Orson Anderson demonstrated through his important work, thermal equations of state (EOS) of the standard materials can be used for estimating pressures from measurements of volume and temperature in high-pressure experiments [1].
The development of third-generation synchrotron facilities in the late 1990s and early 2000s enabled in situ measurements of phase boundaries and physical properties, allowing mineral physicists to take advantage of the thermal EOS established by Anderson and others. However, early experiments found that results from different pressure scales and different experimental techniques differed by 2–3 GPa for the important phase boundaries near the 660-km discontinuity [2,3,4,5,6]. Intense efforts have been made since then [7,8,9], but the discrepancy for some important phase boundaries still remain unresolved [10,11]. Other potential sources of the discrepancy have been investigated. For example, pressure effects on the thermocouple electromotive force (emf) calibration are important for large-volume press (LVP) experiments [12,13,14]. Spectroradiometry has been the standard method for temperature measurements in laser heating, but optical effects from diamond anvils and thermal gradients could potentially introduce artifacts in the measured temperature [15,16,17,18]. While the accuracies of spectroradiometry through LHDAC [19] and thermocouple emf [13,14] have been separately investigated, temperatures from spectroradiometry and thermocouples have never been cross examined at high pressure to our knowledge.
Comparing phase boundaries provides an opportunity to examine the pressure and temperature scales in high-pressure apparatuses. However, in such an effort, it is difficult to separate pressure effects and temperature effects [10]. It is desirable to have a reference point in the P T space for such comparison. At pressures between 20 and 24 GPa, the triple point exists between bridgmanite (Bm), akimotoite (Ak), and majorite (Mj) in MgSiO3. Not only does understanding of the triple point provide a new opportunity to compare pressures and temperatures measured in different techniques but also the triple point itself is important in geophysics for understanding the origin of the seismic discontinuity structures near 660-km depths. Although the 660-km discontinuity has been related mainly to the post-spinel transition in Mg2SiO4 for many decades [20], it has been well known that the phase boundaries in MgSiO3 can exist at depths very close to the 660-km discontinuity and therefore affect the complex discontinuity structures at the bottommost mantle transition zone [21,22]. In this paper, we report the triple point between Bm, Ak, and Mj (BAM) in pure MgSiO3 measured in both LVP and LHDAC. We compare the pressure and temperature of the BAM triple point from those two separate measurements and discuss possible sources of discrepancy between LVP and LHDAC.

2. Methods

2.1. Large-Volume Press (LVP)

High-pressure LVP experiments were conducted in the 1100-ton multi-anvil press at the Eyring Materials Center at Arizona State University (ASU). The LVP consists of eight second-stage anvils surrounding the cell assembly, six first-stage anvils surrounding the second-stage anvils, and a support ring surrounding the first-stage anvils. The second-stage anvils are tungsten carbide, have a 3.0-mm truncation on each corner, and were used with injection-molded ceramic octahedra with 8.0-mm edges [23]. All LVP experiments reported here were conducted with the COMPRES 8/3 assembly (more information on the assembly can be found in Walker et al. [24] and Leinenweber et al. [23]).
Each assembly used a cylindrical Re-capsule made from a 3 × 6 mm2 sheet of rhenium foil that was filled with pure MgSiO3 glass synthesized using the containerless laser levitation method [25,26]. This capsule was place inside of an MgO sleeve within the Re-furnace and LaCrO3 sleeve. The Re-furnace and LaCrO3 sleeve were placed inside the octahedron. The completed assembly was placed on top of four second-stage anvils with four other second-stage anvils placed on top once inside of the LVP.
Pressures for each run were raised at a rate of 400 psi/h, and temperatures were raised to target temperatures at a constant rate of 100 K/min. Heating of the assemblies lasted 30–60 min to reach chemical equilibrium. Temperature was monitored just above the capsule in the assembly by a W5Re- W%26Re (type C) thermocouple. The run was held at target temperature for the heating duration until quenched. Pressure began being pumped down immediately after quenching at a rate of 400 psi/h. Once at ambient conditions, the assembly was recovered for analysis (Table 1).
For the pressure calculation, we used the calibration for COMPRESS 8/3 assembly reported by Leinenweber et al. [23], including the reported thermal effects. In that study, in situ X-ray diffraction was acquired in LVP at the Advanced Photon Source (APS), Argonne National Lab. The oil pressure was calibrated for the capsule pressure using tungsten thermal EOS [27] (Table 1). The LVP at beamline 13-IDD of the GeoSoilEnviroCARS sector uses a split module (T-cup) while the press at ASU uses a Walker module. These and other factors could result in different friction effects in the two different presses. The equivalence of the forces on the two presses was confirmed by using a steel cube fitted with a strain gauge and by measuring the strain on the cube at the two different installations.
In order to understand the thermal gradient in the sample chamber, we conducted a calculation on the cell assembly we used through the approach presented in Hernlund et al. [28] using thermal conductivity data valid to 1300 K. The temperature calculation showed a 65-K temperature difference between the coldest (thermocouple position) and the warmest spots in the sample. If the calculation is extrapolated to 2000 K, the difference could be about 110 K, although it is uncertain. For the runs with single phase observation (all but one), the temperature values represent the lower bound for the stability of the observed phases, and therefore, the runs can confirm the stability of the observed phases up to approximately 100 K higher temperatures than the values presented in Table 1 based on our modeling. However, because the thermal gradient modeling can be affected by uncertainty sources different from our experiment, we will focus on the experimentally measured temperatures and observed phases.
Recovered LVP samples were sliced axially and were carefully polished using alumina sandpaper. For phase identification, Raman spectroscopy was used for all LVP products in 1D point and 2D scanning modes at ASU. Laser wavelength was 532.22 nm, and the beam size was 2 μm. Measurements were taken for 1000 accumulations of 1-s exposures each (16 min total) on each spot at 30–45 mW of laser power.

2.2. Laser-Heated Diamond Anvil Cell (LHDAC)

The same MgSiO3 glass used in LVP was loaded in diamond-anvil cell (DAC) #1 in LHDAC experiments (Table 2). The sample powder was mixed with 10 wt% Pt powder, which served as the pressure calibrant and laser coupler for heating. Pressure was calculated by combining the measured unit-cell volume and temperature with the thermal EOS by Dorogokupets and Dewaele [29]. The powder mixture was pressed into a foil which was 100–200 μm in size and 15–20 μm thick. The foil was loaded into a laser-drilled hole in a pre-indented rhenium gasket using a micromanipulator (Axis Pro SS, Micro Support Co., Ltd., Shizuoka, Japan). The foil was supported by 5 spacers that consisted of <15 μm pure sample grains on each side of the diamond culet. Argon gas (Ar) was loaded as a pressure medium and thermal insulator in a gas loading system (GLS1500, Sanchez Technologies, Frépillon, France) at 1450 bar pressure at ASU.
For measurements in DACs #2 and #3, we used Ak as a starting material. The Ak sample was synthesized in the LVP at ASU. For sufficient amount of akimotoite sample, we conducted the synthesis in a 10/5 COMPRES assembly with Re foil capsule filled with MgSiO3 glass. The synthesis conditions were 22 GPa (corresponding to a ram force of 720 tonnes) and 1473 K for 1 h. After quenching, the capsule was cut in half with a diamond wire saw and analyzed with Raman to ensure pure Ak product. The Ak sample was removed from the capsule and ground in an agate mortar under acetone for 20 min. The sample powder was mixed with 10 wt% Pt powder, which once again served as the pressure calibrant [29] and laser coupler. The mixture was again pressed into a foil of the same size as the MgSiO3 sample. For these samples, we used NaCl as a pressure medium, which was dried at 100 °C for 24 h. Thin foils of NaCl were loaded into the sample chamber above and below the sample foil. All samples were compressed in symmetric-type DAC utilizing type Ia standard design 400 μm diamond anvils.
LHDAC data was acquired using monochromatic XRD in DAC at sector 13-IDD of the GeoSoilEnviroCARS (GSECARS) at the Advanced Photon Source (APS) utilizing the double-sided laser heating system. The laser beams were coaxially aligned with the X-ray beam to measure diffraction patterns on the heating spot. The typical beam diameters for the X-ray beam and laser heating spot are 5 μm and 20 μm, respectively.
The 2D diffraction images were acquired using a Dectris Pilatus detector at GSECARS 13-IDD and then integrated into 1D diffraction patterns using calibration parameters obtained from the LaB6 standard in DIOPTAS software [30]. Diffraction images were exposed for 5–10 s and were collected before, during, and after heating. The diffraction images were analyzed, and phases were identified using PeakPo software [31]. Pt peaks were fitted with pseudo-Voigt profile function to obtain the peak positions in PeakPo. Pressure was calculated with pytheos [32]. The unit-cell volume of Pt was calculated with the 111 and 200 peaks and some with the 220 peak as well.

3. Results

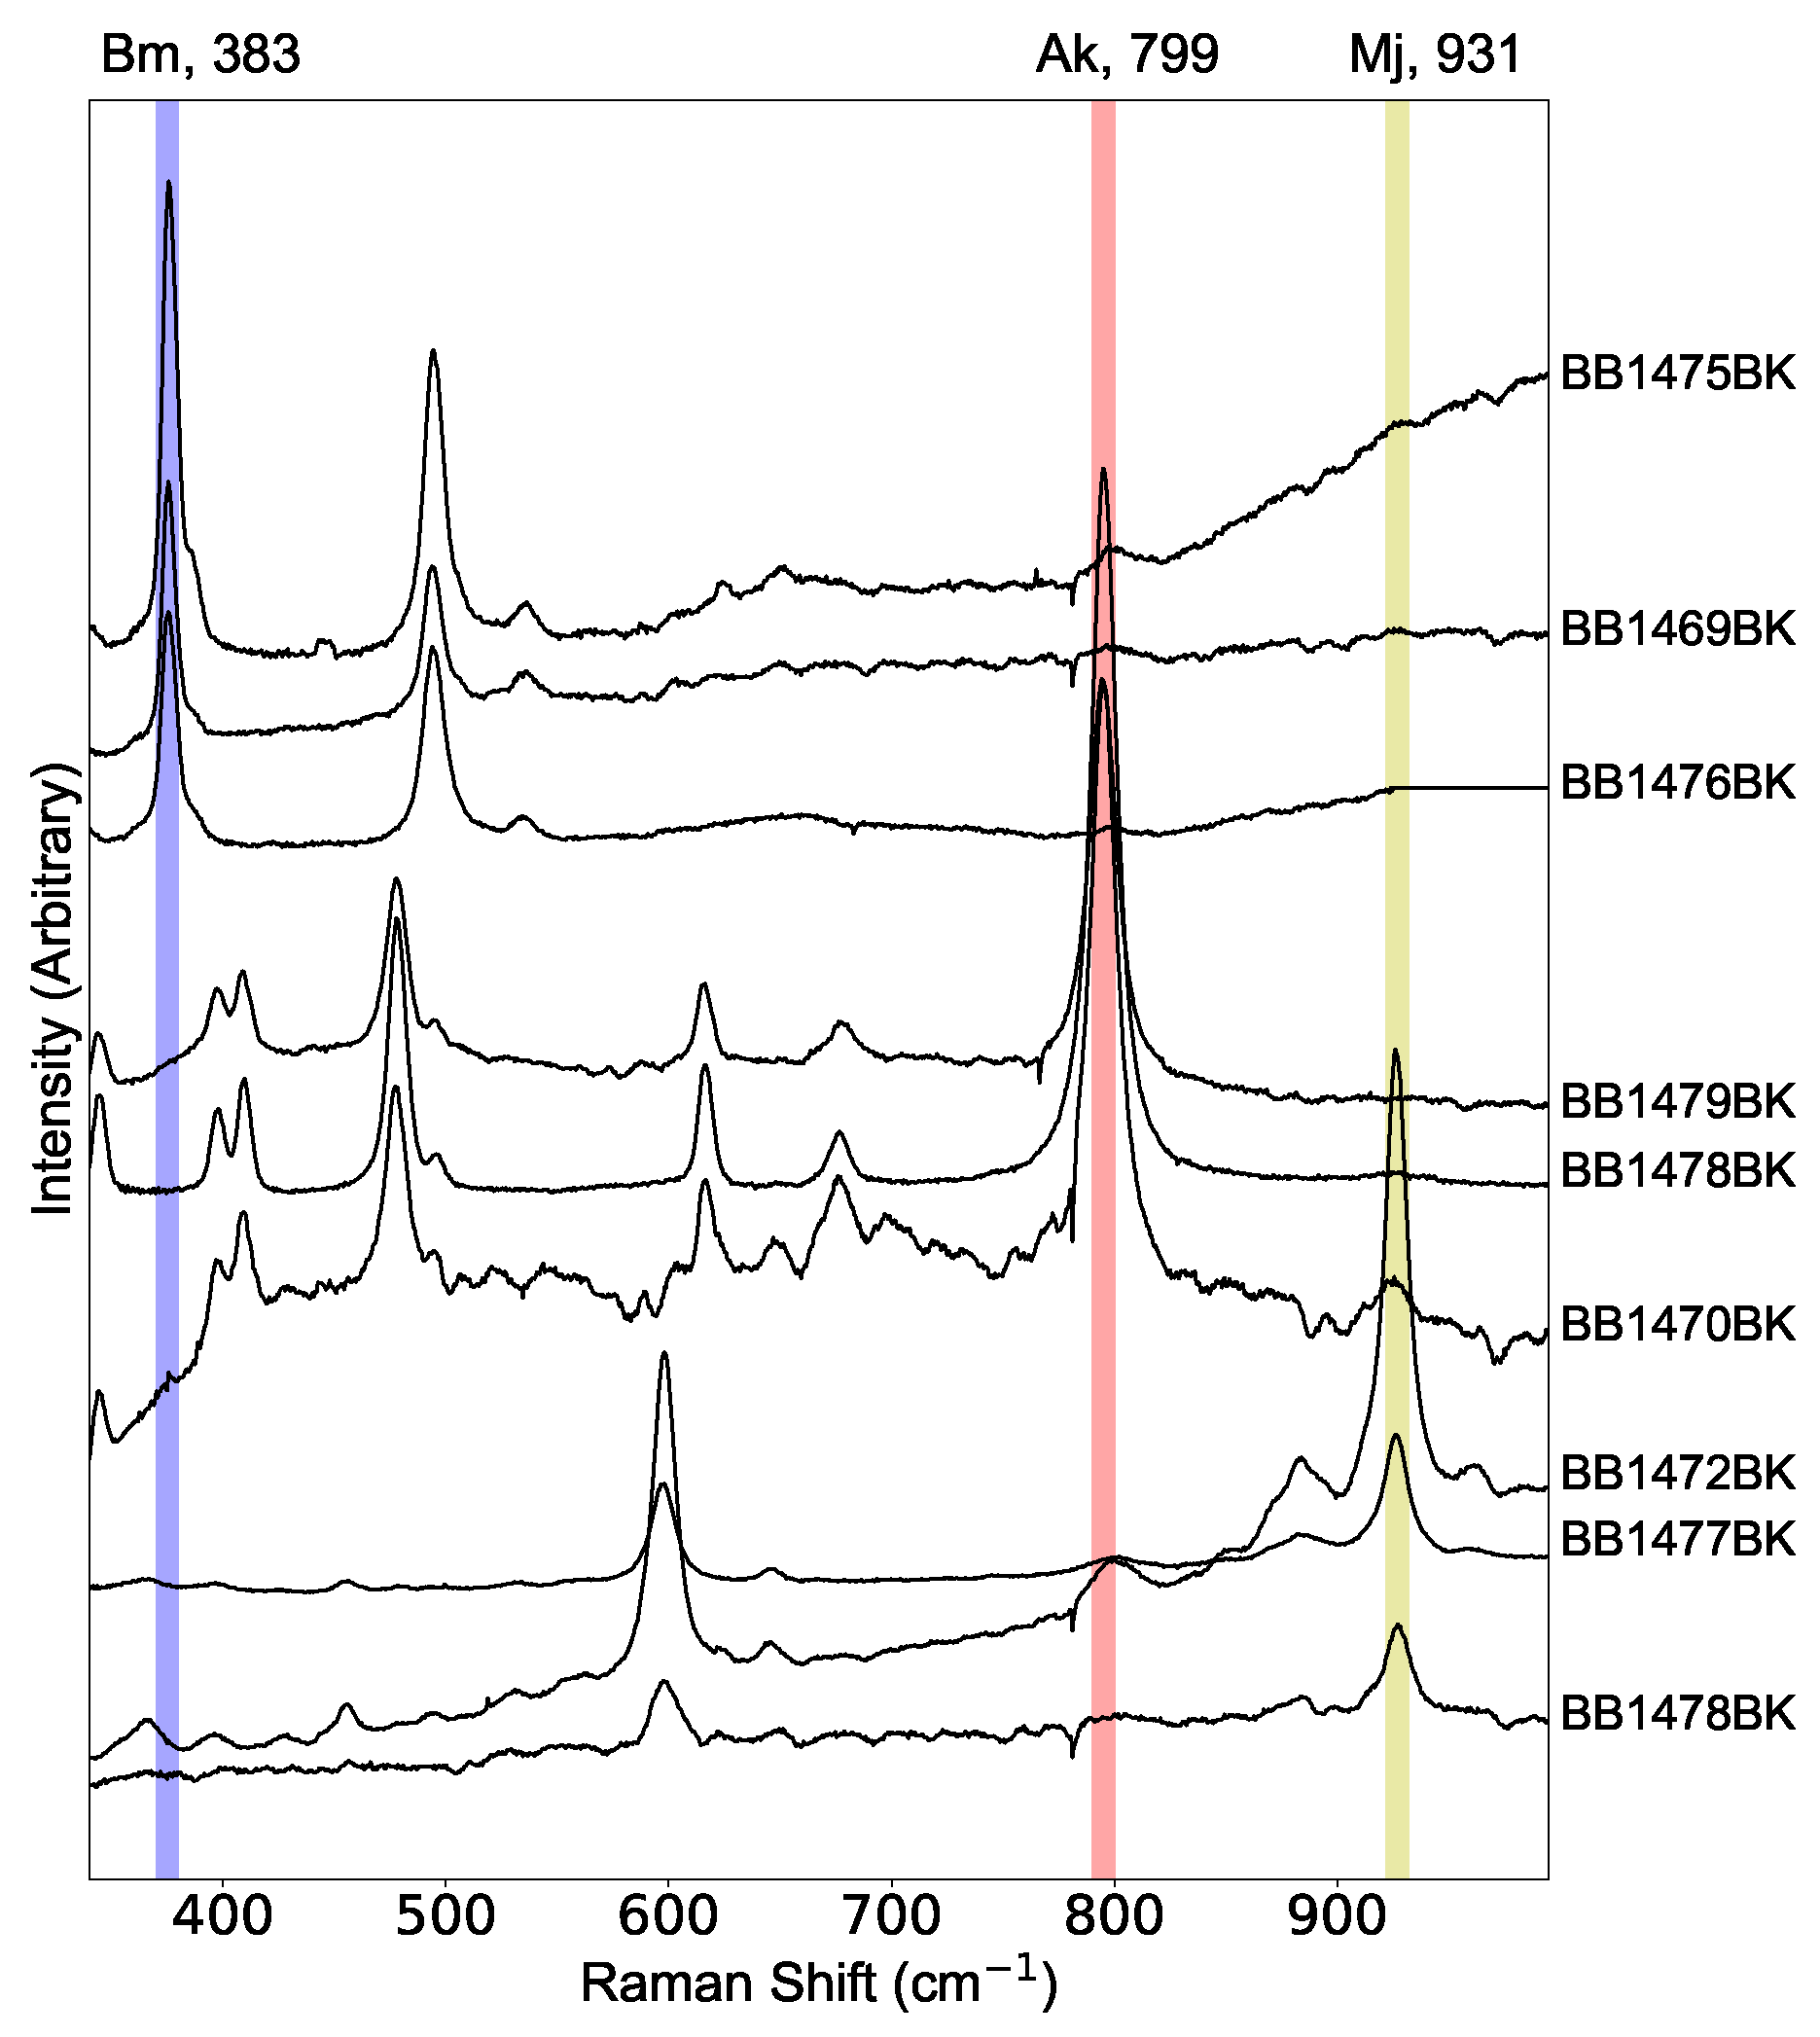
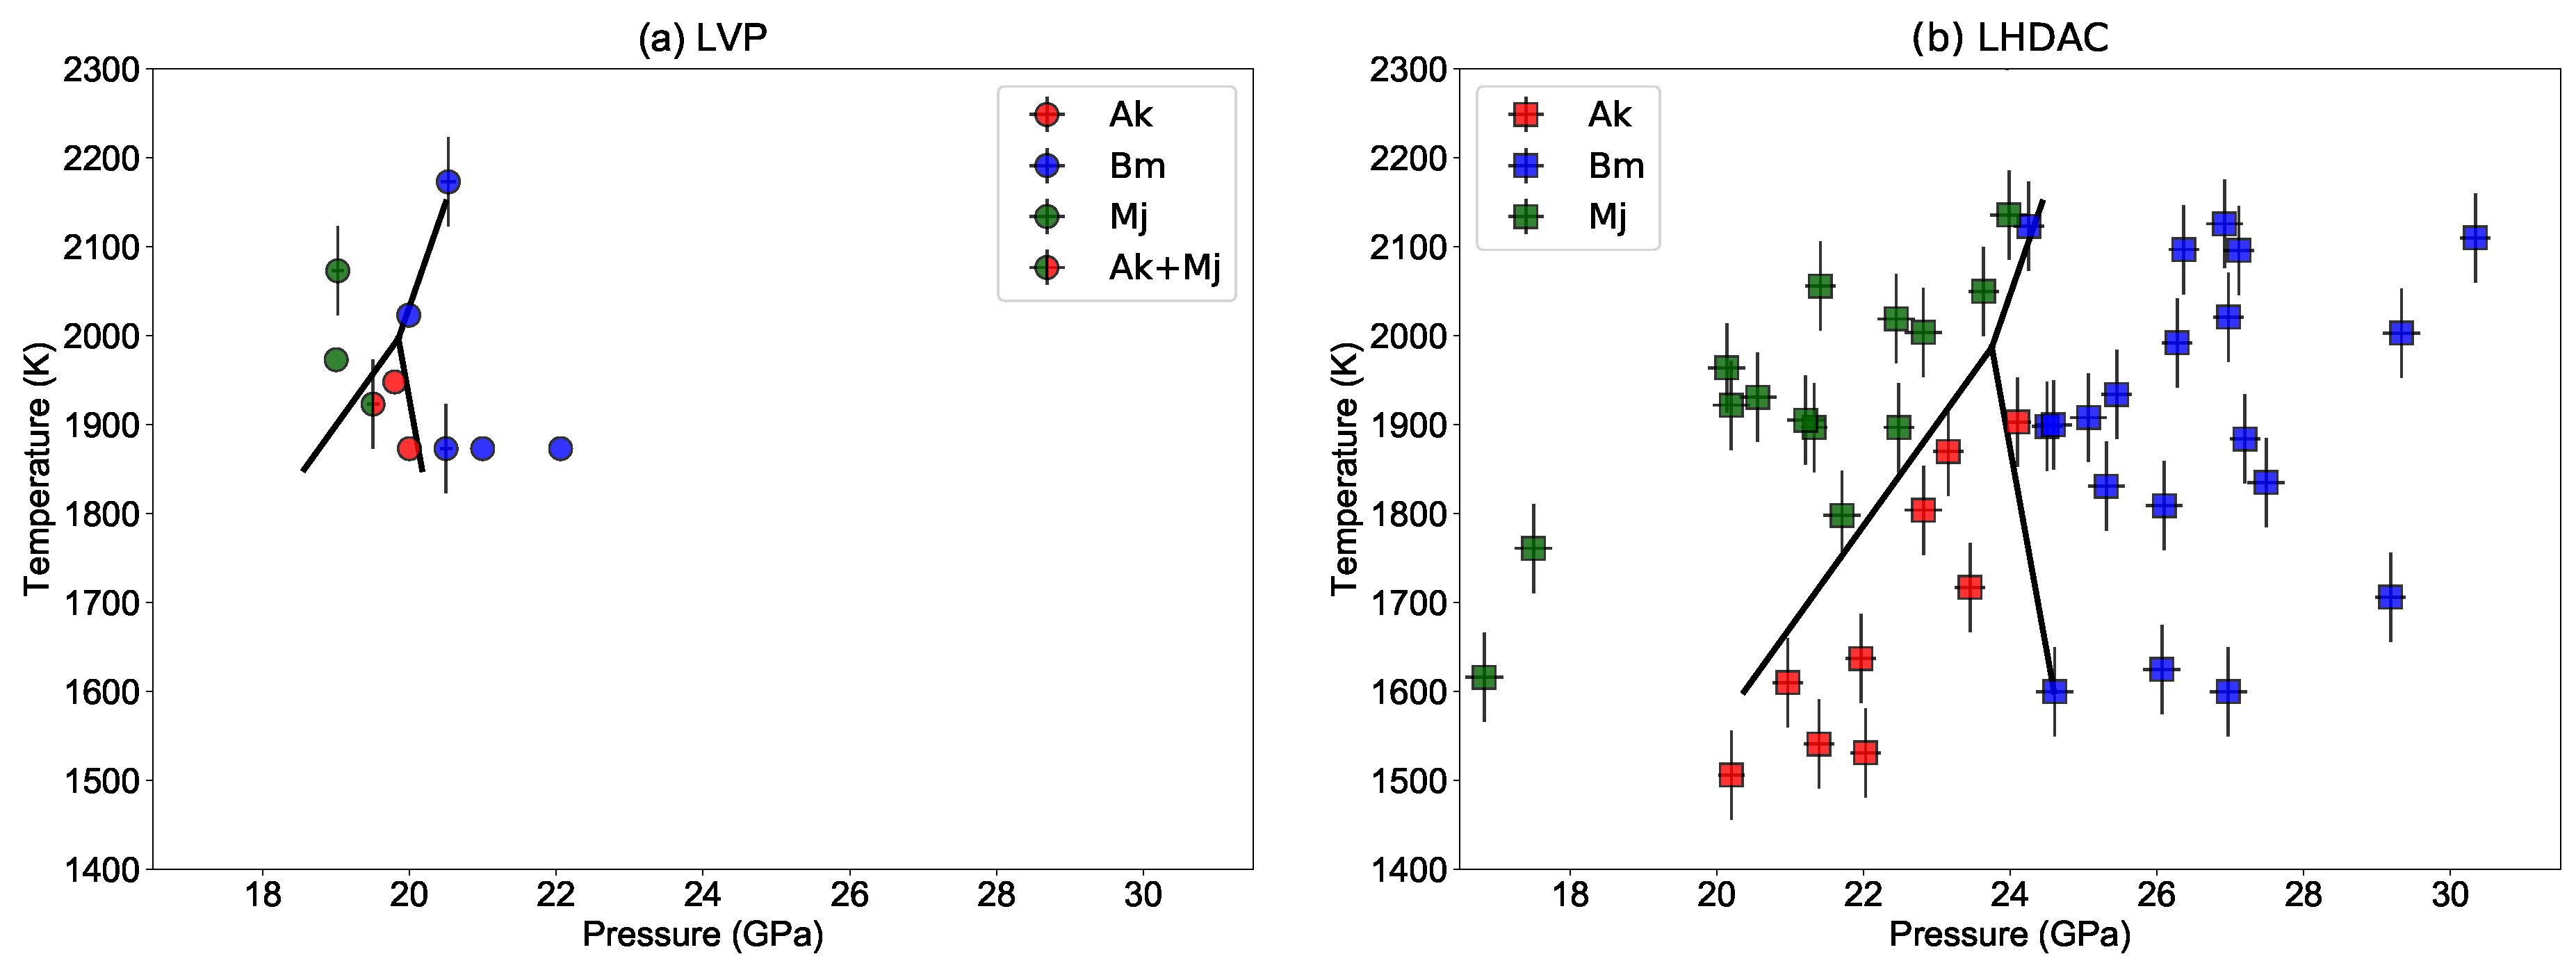
3.1. Large-Volume Press

Raman spectroscopy was used to identify the recovered samples. Bm was identified by the strong modes at 383 and 501 cm−1 (Figure 1), and a weaker mode at 542 cm−1 also appeared clearly in spectra. Ak was identified by the strong modes at 480 and 799 cm−1 along with a few other weaker modes. Mj was identified by the strong modes at 602 and 931 cm−1. The peak positions for all three phases are in good agreement with those reported in the literature [33,34,35,36].
For sample BB1478BK, we identified both Ak and Mj phases located at different areas within the sample: Ak was found within the cooler region of the sample (outer area close to capsule), and Mj was found within the warmer region of the sample (center and equatorial region of capsule). This sample with two phases allows us to tightly constrain the Ak–Mj phase boundary (and therefore the BAM triple point).
We inspected the samples under a stereomicroscope. The Bm samples are white and light-gray, and semi-translucent with 5–10 μm crystals. The Ak samples are dark-gray with light-gray speckled throughout and with 2–5 μm crystals. The Mj samples are gray to light-gray in color with the middle of the sample being lighter in color and with <5 μm crystals.
We chose to conduct LVP experiments at a narrow PT field to make high-resolution determination of the BAM triple point. The observations of both Mj and Ak in one sample (BB1478BK) provide a tight constraint on the location of the Ak–Mj boundary (Figure 2a). The observations of Ak at 19.5 GPa and 1923 K and of Mj at 19 GPa and 1973 K indicate that the Ak–Mj boundary temperature should not exceed ∼2000 K at 19–20 GPa. The observations of Ak at 20 GPa and 1873–1948 K and Bm at 20.5–22 GPa and 1873–2023 K suggest that the Ak–Bm boundary should be located between these pressures in the LVP experiments. In this determination, we adopted the Clapeyron slopes of the three boundaries from Ishii et al. [37]. Combining these constraints with other data points, the P T condition for the triple point is determined to be 19.9 ± 0.4 GPa and 2000 ± 50 K in our LVP experiments on MgSiO3. We attempted to fit the data with different Clapeyron slopes [4]. Because of the narrow P T region of our study and the better agreement in the Clapeyron slopes of these boundaries in the literature, our determined P T conditions for the triple point are not sensitive to the choice of the Clapeyron slopes of the boundaries.

3.2. Laser-Heated Diamond Anvil Cell
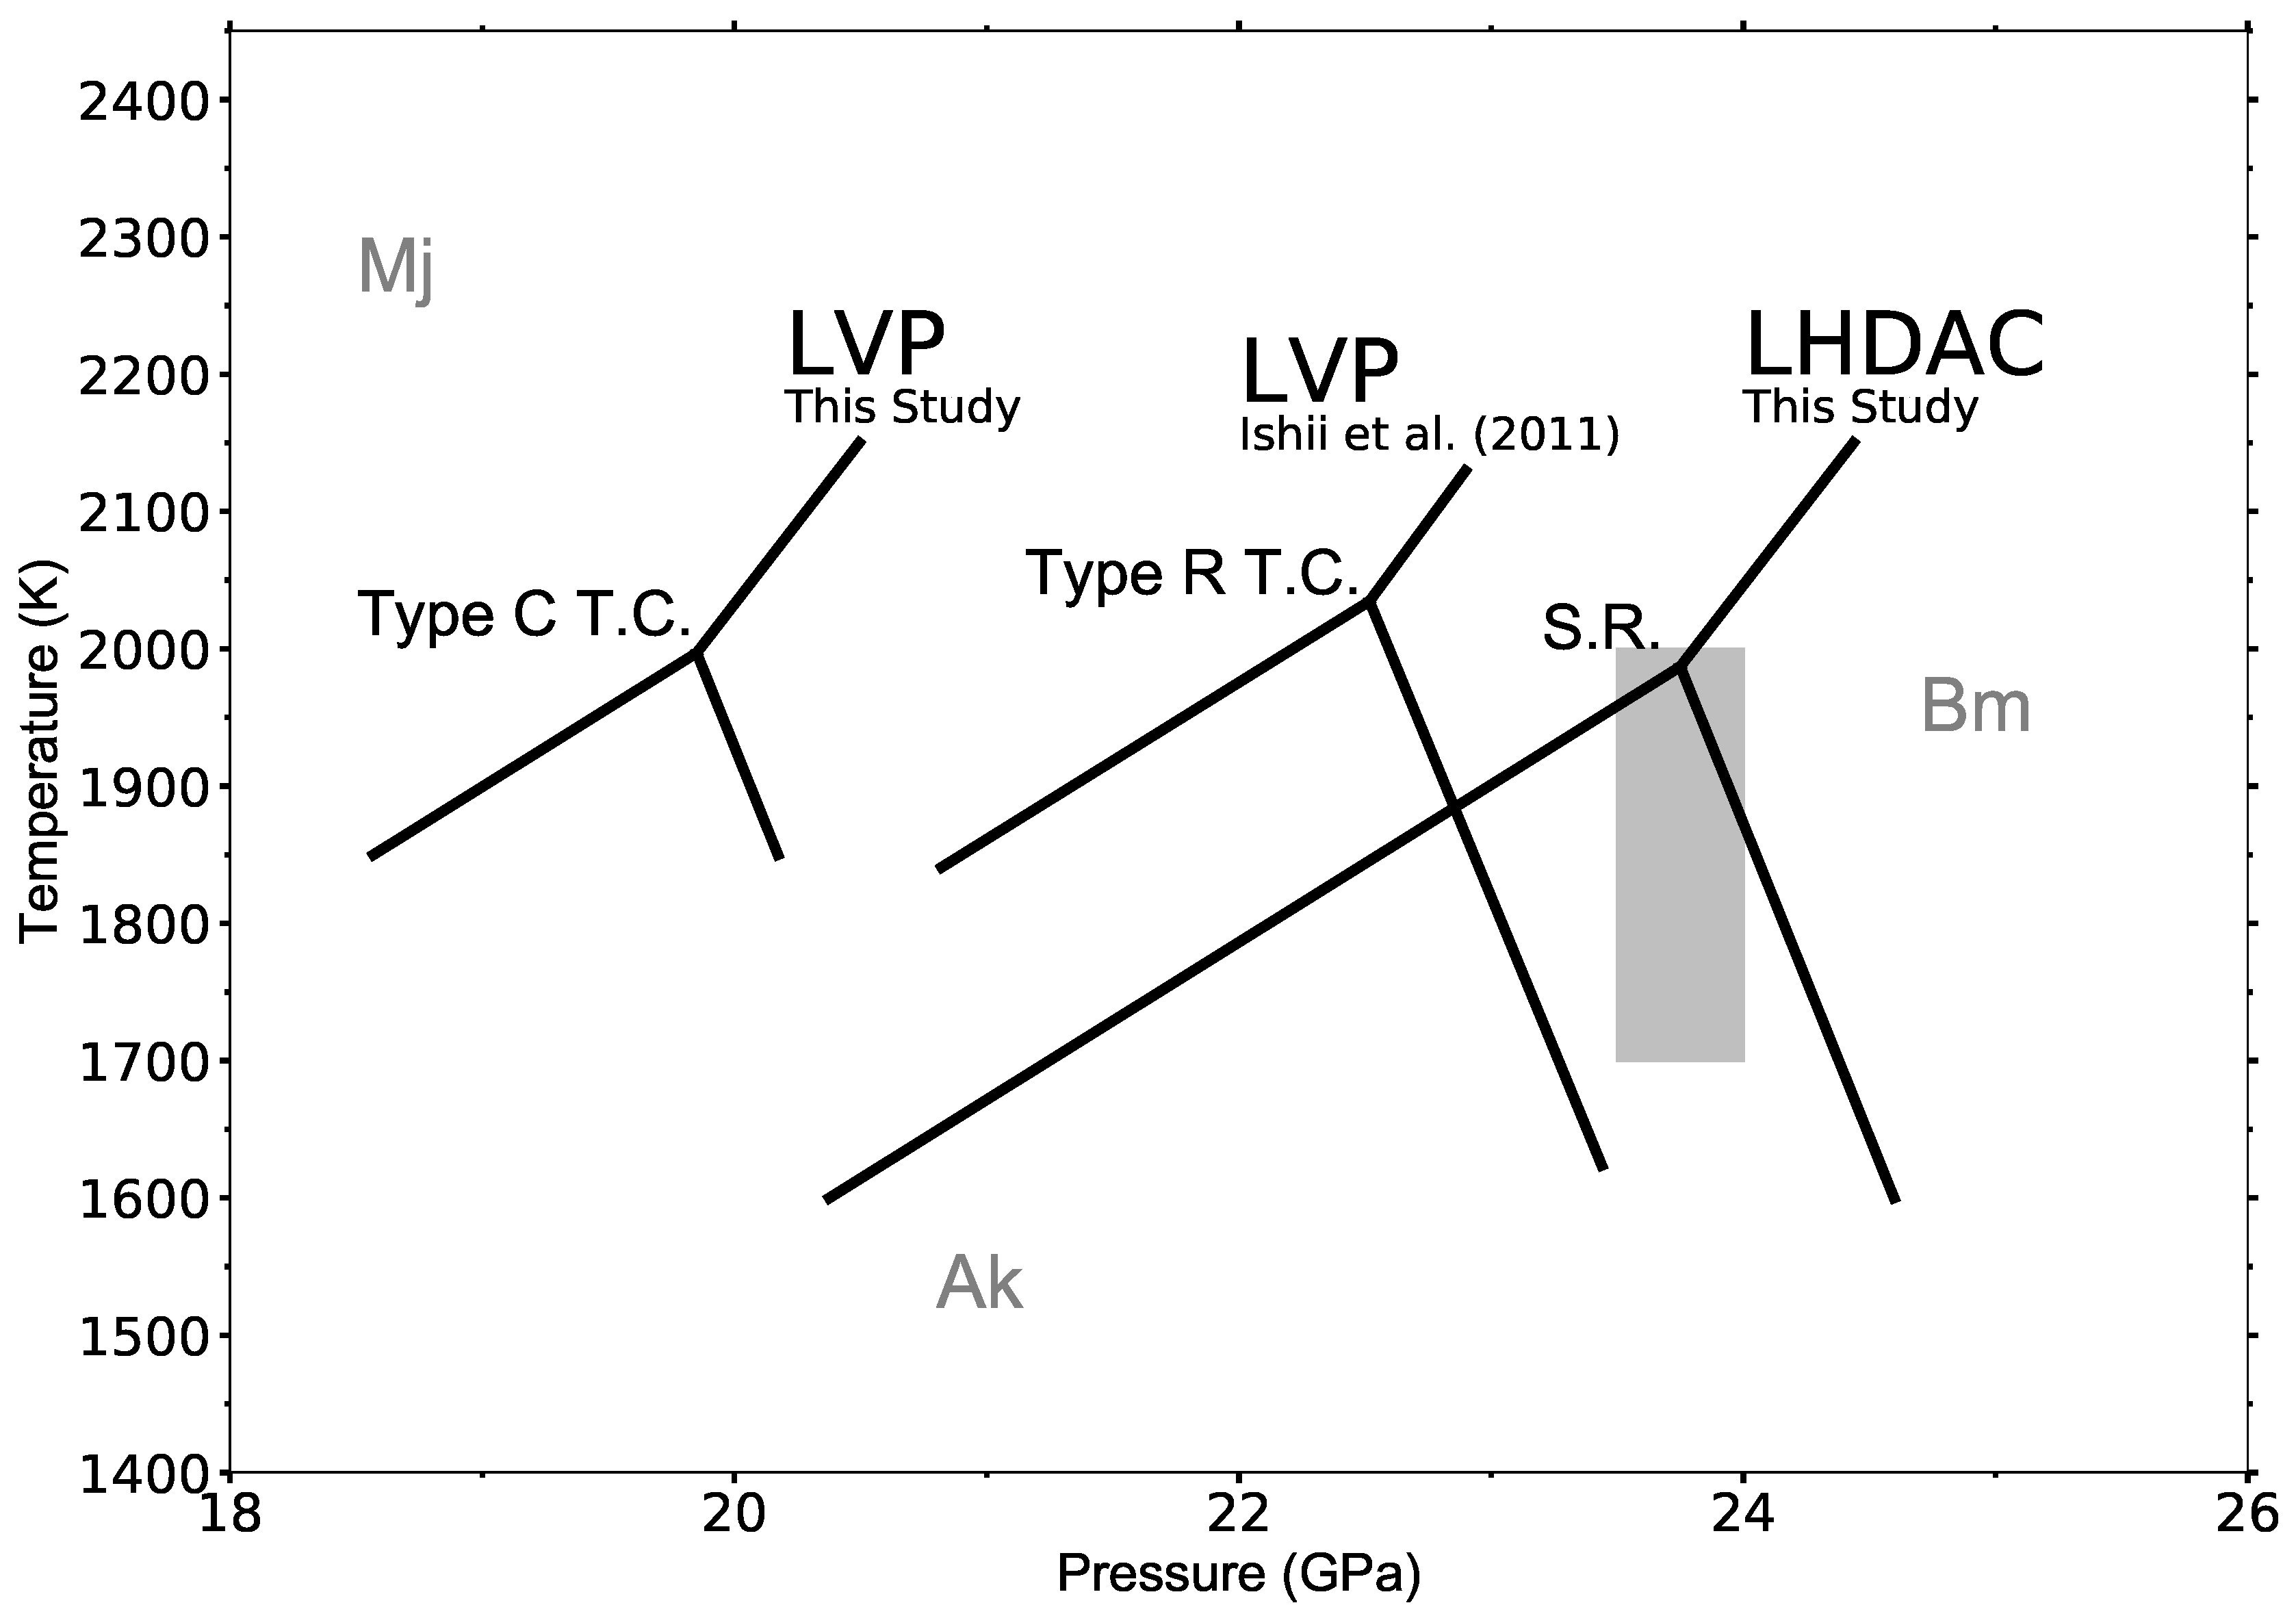
Three DAC were used to acquire data for the BAM triple point. Cell #1 loaded with the MgSiO3 glass starting material was used to determine the Mj–Bm phase boundary through rapid heating into the Mj field and then by slowly increasing temperature to gain pressure through thermal pressure effects until the first Bm peaks were observed (Figure 3a). In order to avoid forming Ak, rapid heating was conducted because Ak could remain as a metastable phase and could overlap with the Bm and Mj diffraction peaks. Rapid heating was accomplished by aiming the heating laser beam at a previously heated spot. Once the desired temperature was reached, the sample was rapidly translated by moving the LHDAC such that the heating laser was aimed at an adjacent unheated spot and thus reached target temperature quickly without a slow laser power ramp up. Once the Mj peaks are observed, the temperature was increased slowly until the first Bm peaks form. The location in P T space where this happens was used to determine the Mj–Bm phase boundary (Figure 2b).
The experiments with cells #2 and #3 loaded with the Ak starting material were designed to constrain the boundaries between Ak and Mj and between Ak and Bm. Temperature was raised slowly until the first observation of the Bm or Mj diffraction peaks.
Mj was mainly identified through the 040, 323, and 431 peaks. The 444 and 046 peaks were observable in some patterns, and these helped to further confirm the presence of Mj. Ak was identified with the 10 2 ¯ , 104, 110, 20 4 ¯ , and 11 6 ¯ peaks. The 113 peak was sometimes used, but it overlaps enough with the Mj 125 peak that it was less useful. Finally, Bm was identified with the 111, 200, 120, 210, 022, 122, 121, 023, and 221 peaks. Higher 2 θ peaks were used to confirm the presence of Bm, if available. Similar to our LVP analysis, the BAM triple point was constrained by moving the three phase boundaries in the P T space while we fixed the Clapeyron slopes of the boundary to those reported in Ishii et al. [37]. The P T condition for the BAM triple point from our LHDAC dataset is 23.8 ± 0.6 GPa and 1990 ± 100 K.

4. Discussion

The P T conditions of the Bm–Ak–Mj (BAM) triple point that we obtained are 19.9 ± 0.4 GPa and 2000 ± 50 K for LVP and 23.8 ± 0.6 GPa and 1990 ± 100 K for LHDAC (Figure 4). Despite the fact that they can be biased by different systematic error sources (such as pressure effects on thermocouple emf calibration in LVP and optical effects on spectroradiometry through diamond anvils in LHDAC), a remarkable agreement was found in temperature for the triple point from both techniques. To our knowledge, this is the first direct cross examination of the two temperature measurement techniques. Such an agreement may not necessarily be applicable for pressures much lower or much higher than the range in which we conducted our measurements, i.e., 20–24 GPa, because some of the perceived systematic error sources could be pressure dependent, such as pressure effects on thermocouple emf calibration. However, for the pressure range of the mantle transition zone, our result provides important experimental confirmation for comparing temperature measurements from LVP and LHDAC experiments.
Our results suggest that pressure calibration is the most important issue to resolve in comparing LVP and LHDAC datasets of a 3.9 GPa difference. So far, LHDAC studies have reported systematically higher pressures for the phase boundaries in the mantle transition zone by 2–3 GPa compared with LVP studies [2,3,4,6,10]. Our new results reported here also confirm the trend but with a greater magnitude. The difference is particularly important to resolve because the COMPRES 8/3 assembly and its pressure calibration [23] have been widely used in high-pressure studies.
The calibration for the 8/3 assembly was conducted through in situ measurements using the tungsten EOS [27] in Leinenweber et al. [23]. For our LHDAC experiments, we chose to use the thermal EOS of Pt by Dorogokupets and Dewaele [29]. This pressure scale is known to yield better agreements with the Au and MgO scales according to Ye et al. [11] for a wide pressure range. In order to ensure the consistency between LHDAC and LVP results, it would be useful to examine the agreements between the W scale and the Pt scale at in situ high P T . However, the high shear strength of tungsten can be a potential issue for the accurate determination on its EOS [38,39]. Therefore, the COMPRES 8/3 assembly can be calibrated using other pressure standards. Pt, Au, and MgO could be good candidates as they have been used widely in LHDAC. However, despite the agreements over a larger pressure range, the MgO, Au, and Pt scales by Dorogokupets and Dewaele [29] are different by ∼2 GPa at 20–40 GPa and high temperatures according to Ye et al. [11]. Therefore, an important challenge still remains for the thermal EOS of important materials at the pressure range for the mantle transition zone. It is notable that some of the standard materials (particularly Au) have low melting temperatures compared with the mantle geotherm at pressures of 30 GPa, potentially causing significant anharmonic effects in their EOS or even abnormal premelting behaviors.
The seismic properties of the 660-km discontinuity are in general agreement with those of the post-spinel transition [40]. Ishii et al. [37] showed that the Ak–Bm boundary should be close to the post-spinel boundary within 1 GPa [37]. Figure 4 shows that the Ak–Bm and Mj–Bm boundaries in MgSiO3 measured by LHDAC are closer to the P T conditions expected for the 660-km discontinuity. Does this mean that LHDAC yields more reliable results for the location of the phase boundary? This approach is not desirable as the experimental methods should be able to address the question of whether the mantle phase boundaries are indeed the source of the 660-km discontinuity rather than the other way around.
Some former LVP studies have measured the Ak–Mj, Mj–Bm, and Ak–Bm boundaries in pure MgSiO3 and inferred the triple point [4,37,45]. However, the reported P T conditions for the boundaries and the triple point do not agree with each other: the discrepancy can be as large as 2 GPa in pressure and 300 K in temperature among the LVP measurements. In terms of temperature, our results are in best agreement with the most recent report by Ishii et al. [37]. They reported stability of Ak up to 1973 K at 22.3 GPa, and the triple point in their phase diagram can be inferred to be 2035 ± 60 K, which is in agreement with our LVP and LHDAC results on the temperature of the Bm–Ak–Mj (BAM) triple point within 100 K. This agreement is encouraging in that at least the recent studies converge on the temperature of the BAM triple point within 100 K even between different high-pressure techniques (LVP and LHDAC) and between different temperature measurement techniques (thermocouple W5%Re-W26%Re in our LVP study; Pt/Pt-13%Rh in the LVP study by Ishii et al. [37]; and spectroradiometry in our LHDAC study). As efforts are being made for enhancing the accuracy of thermocouple emf calibrations at high pressures [13,14], it remains to be seen if future calibration work on the thermocouples used in this study and in Ishii et al. [37] can find further improvement in the agreement.
The pressure inferred for the BAM triple point in Ishii et al. [37] is between our LVP and LHDAC results, located approximately in the middle (Figure 4). They calibrated pressures at high temperatures based on previously reported boundaries in Mg2SiO4, MgSiO3, and MgAl2O4 (see Ishii et al. [37] for references) which are all different in pressure calculation methods. If we were to use the same Ak–Bm transition pressure point (at 1873 K and 22.3 GPa) that is used in Ishii et al. [37] as an internal calibration point, our multi-anvil BAM triple point would lie at almost the same P and T as that in Ishii et al. [37]. Although it would depend on experimental setup, including the sample geometry and anvil materials, possible pressure change during heating is an important factor to consider for improving pressure estimation in LVP experiments [46]. In order to further gain insight into the differences between the DAC and LVP pressures and to possibly close the gap, it would be worthwhile to make detailed measurements on the BAM triple point in situ using the same sample and Pt pressure standard that was used in the LHDAC.

5. Conclusions

We have established the location of the phase boundaries involving bridgmanite, akimotoite, and majorite with both large-volume press (LVP) and laser-heated diamond anvil cell (LHDAC). With the use of these two techniques, we were able to determine the location of the bridgmanite–akimotoite–majorite (BAM) triple point where these three phases are at equilibrium. The results indicate that the temperature of the BAM triple point established with the two techniques are in agreement: W5%Re-W26%Re thermocouple used in LVP and spectroradiometry in LHDAC constrain the temperature of the BAM triple point between 1990 K and 2000 K. Our result is also in good agreement with the temperature measured by Ishii et al. [37] despite the fact that they used a different thermocouple (Pt-Pt13%Rh). This result now enables direct comparison of the experimental results at the P T conditions of the mantle transition zone for temperature. Furthermore, the BAM triple point P T condition reported here can be used as a reference point for calibrating pressure and temperature in high-pressure experiments. Unlike conventional “fixed-pressure points” that are often used in LVP calibration, the BAM triple point does not need an assumption of zero thermal effects on such points. Our study also reveals that the pressure measurement is the main source for the discrepancy between LVP studies and between LVP and LHDAC results. This result now calls for efforts in improving pressure measurement techniques in LVP and LHDAC.

Author Contributions

Conceptualization, S.-H.S. and K.D.L.; methodology, V.B.P.; software, S.-H.S.; validation, B.L.K. and J.D.D.; formal analysis, B.L.K. and J.D.D.; investigation, B.L.K. and J.D.D.; resources, S.-H.S.; data curation, B.L.K., J.D.D., and S.-H.S.; writing—original draft preparation, B.L.K., J.D.D., and S.-H.S.; writing—review and editing, K.D.L. and S.-H.S.; visualization, B.L.K. and J.D.D.; supervision, S.-H.S.; funding acquisition, S.-H.S. All authors have read and agreed to the published version of the manuscript.

Funding

The work has been supported by the NSF (EAR1725094) and NASA (80NSSC18K0353). D.S. was supported partially by the Keck Foundation (PI: P. Buseck). The results reported herein benefit from collaborations and information exchange within NASA’s Nexus for Exoplanet System Science (NExSS) research coordination network sponsored by NASA’s Science Mission Directorate. Synchrotron measurements were conducted at the Advanced Photon Source, a Department of Energy (DOE) Office of Science User Facility operated for the DOE Office of Science by Argonne National Laboratory under Contract DE-AC02-06CH11357. The synchrotron X-ray diffraction experiments were conducted at GSECARS (University of Chicago, Sector 13), Advanced Photon Source (APS). GSECARS is supported by the NSF-Earth Science (EAR-1128799) and DOE-GeoScience (DE-FG02-94ER14466).

Acknowledgments

We thank four anonymous reviewers and the editors. We acknowledge the use of facilities within the Eyring Materials Center at Arizona State University.

Conflicts of Interest

The authors declare no conflict of interest.

Abbreviations

The following abbreviations are used in this manuscript:
PPressure
TTemperature
LVPLarge-volume press
LHDACLaser-heated diamond anvil cell
AkAkimotoite
MjMajorite
BmBridgmanite
BAMBridgmanite–Akimotoite–Majorite

References

  1. Anderson, O.L. The Grüneisen ratio for the last 30 years. Geophys. J. Int. 2000, 143, 279–294. [Google Scholar] [CrossRef] [Green Version]
  2. Irifune, T.; Nishiyama, N.; Kuroda, K.; Inoue, T.; Isshiki, M.; Utsumi, W.; Funakoshi, K.i.; Urakawa, S.; Uchida, T.; Katsura, T.; et al. The postspinel phase boundary in Mg2SiO4 determined by in situ X-ray diffraction. Science 1998, 279, 1698–1700. [Google Scholar] [CrossRef] [PubMed]
  3. Shim, S.H.; Duffy, T.S.; Shen, G. The post-spinel transformation in Mg2SiO4 and its relation to the 660-km seismic discontinuity. Nature 2001, 411, 571. [Google Scholar] [CrossRef] [PubMed]
  4. Hirose, K.; Komabayashi, T.; Murakami, M.; Funakoshi, K.I. In situ measurements of the majorite-akimotoite-perovskite phase transition boundaries in MgSiO3. Geophys. Res. Lett. 2001, 28, 4351–4354. [Google Scholar] [CrossRef] [Green Version]
  5. Katsura, T.; Yamada, H.; Shinmei, T.; Kubo, A.; Ono, S.; Kanzaki, M.; Yoneda, A.; Walter, M.J.; Ito, E.; Urakawa, S.; et al. Post-spinel transition in Mg2SiO4 determined by high PT in situ X-ray diffractometry. Phys. Earth Planet. Inter. 2003, 136, 11–24. [Google Scholar] [CrossRef]
  6. Fei, Y.; Van Orman, J.; Li, J.; Van Westrenen, W.; Sanloup, C.; Minarik, W.; Hirose, K.; Komabayashi, T.; Walter, M.; Funakoshi, K.I. Experimentally determined postspinel transformation boundary in Mg2SiO4 using MgO as an internal pressure standard and its geophysical implications. J. Geophys. Res. Solid Earth 2004, 109, B02305. [Google Scholar] [CrossRef] [Green Version]
  7. Fei, Y.; Ricolleau, A.; Frank, M.; Mibe, K.; Shen, G.; Prakapenka, V. Toward an internally consistent pressure scale. Proc. Nat. Acad. Sci. USA 2007, 104, 9182–9186. [Google Scholar] [CrossRef] [Green Version]
  8. Sinogeikin, S.; Bass, J.; Prakapenka, V.; Lakshtanov, D.; Shen, G.; Sanchez-Valle, C.; Rivers, M. Brillouin spectrometer interfaced with synchrotron radiation for simultaneous X-ray density and acoustic velocity measurements. Rev. Sci. Instrum. 2006, 77, 103905. [Google Scholar] [CrossRef]
  9. Li, B.; Kung, J.; Uchida, T.; Wang, Y. Simultaneous equation of state, pressure calibration and sound velocity measurements to lower mantle pressures using multi-anvil apparatus. In Advances in High-Pressure Technology for Geophysical Applications; Elsevier: Amsterdam, The Netherlands, 2005; pp. 49–66. [Google Scholar]
  10. Ye, Y.; Gu, C.; Shim, S.H.; Meng, Y.; Prakapenka, V. The postspinel boundary in pyrolitic compositions determined in the laser-heated diamond anvil cell. Geophys. Res. Lett. 2014, 41, 3833–3841. [Google Scholar] [CrossRef]
  11. Ye, Y.; Prakapenka, V.; Meng, Y.; Shim, S.H. Intercomparison of the gold, platinum, and MgO pressure scales up to 140 GPa and 2500 K. J. Geophys. Res. Solid Earth 2017, 122, 3450–3464. [Google Scholar] [CrossRef]
  12. Getting, I.; Kennedy, G. Effect of pressure on the emf of chromel-alumel and platinum-platinum 10% rhodium thermocouples. J. Appl. Phys. 1970, 41, 4552–4562. [Google Scholar] [CrossRef]
  13. Nishihara, Y.; Fuke, K.; Tange, Y.; Higo, Y. Determination of pressure effect on thermocouple electromotive force using multi-anvil apparatus. High Press. Res. 2016, 36, 121–139. [Google Scholar] [CrossRef]
  14. Nishihara, Y.; Doi, S.; Kakizawa, S.; Higo, Y.; Tange, Y. Effect of pressure on temperature measurements using WRe thermocouple and its geophysical impact. Phys. Earth Planet. Inter. 2019, 298, 106348. [Google Scholar] [CrossRef]
  15. Boehler, R. High-pressure experiments and the phase diagram of lower mantle and core materials. Rev. Geophys. 2000, 38, 221–245. [Google Scholar] [CrossRef]
  16. Shen, G.; Rivers, M.L.; Wang, Y.; Sutton, S.R. Laser heated diamond cell system at the Advanced Photon Source for in situ X-ray measurements at high pressure and temperature. Rev. Sci. Instrum. 2001, 72, 1273–1282. [Google Scholar] [CrossRef]
  17. Kavner, A.; Panero, W.R. Temperature gradients and evaluation of thermoelastic properties in the synchrotron-based laser-heated diamond cell. Phys. Earth Planet. Inter. 2004, 143, 527–539. [Google Scholar] [CrossRef]
  18. Deng, J.; Du, Z.; Benedetti, L.R.; Lee, K.K. The influence of wavelength-dependent absorption and temperature gradients on temperature determination in laser-heated diamond-anvil cells. J. Appl. Phys. 2017, 121, 025901. [Google Scholar] [CrossRef]
  19. Lin, J.F.; Sturhahn, W.; Zhao, J.; Shen, G.; Mao, H.K.; Hemley, R.J. Absolute temperature measurement in a laser-heated diamond anvil cell. Geophys. Res. Lett. 2004, 31, L14611. [Google Scholar] [CrossRef] [Green Version]
  20. Bullen, K. The problem of the Earth’s density variation. Bull. Seismol. Soc. Am. 1940, 30, 235–250. [Google Scholar]
  21. Ai, Y.; Zheng, T.; Xu, W.; He, Y.; Dong, D. A complex 660 km discontinuity beneath northeast China. Earth Planet. Sci. Lett. 2003, 212, 63–71. [Google Scholar] [CrossRef]
  22. Day, E.A.; Deuss, A. Reconciling PP and PP precursor observations of a complex 660 km seismic discontinuity. Geophys. J. Int. 2013, 194, 834–838. [Google Scholar] [CrossRef] [Green Version]
  23. Leinenweber, K.D.; Tyburczy, J.A.; Sharp, T.G.; Soignard, E.; Diedrich, T.; Petuskey, W.B.; Wang, Y.; Mosenfelder, J.L. Cell assemblies for reproducible multi-anvil experiments (the COMPRES assemblies). Am. Mineral. 2012, 97, 353–368. [Google Scholar] [CrossRef]
  24. Walker, D.; Carpenter, M.; Hitch, C. Some simplifications to multianvil devices for high pressure experiments. Am. Mineral. 1990, 75, 1020–1028. [Google Scholar]
  25. Tangeman, J.A.; Phillips, B.L.; Navrotsky, A.; Weber, J.R.; Hixson, A.D.; Key, T.S. Vitreous forsterite (Mg2SiO4): Synthesis, structure, and thermochemistry. Geophys. Res. Lett. 2001, 28, 2517–2520. [Google Scholar] [CrossRef]
  26. Shim, S.H.; Catalli, K. Compositional dependence of structural transition pressures in amorphous phases with mantle-related compositions. Earth Planet. Sci. Lett. 2009, 283, 174–180. [Google Scholar] [CrossRef]
  27. Hixson, R.; Fritz, J. Shock compression of tungsten and molybdenum. J. Appl. Phys. 1992, 71, 1721–1728. [Google Scholar] [CrossRef]
  28. Hernlund, J.; Leinenweber, K.; Locke, D.; Tyburczy, J.A. A numerical model for steady-state temperature distributions in solid-medium high-pressure cell assemblies. Am. Mineral. 2006, 91, 295–305. [Google Scholar] [CrossRef]
  29. Dorogokupets, P.; Dewaele, A. Equations of state of MgO, Au, Pt, NaCl-B1, and NaCl-B2: Internally consistent high-temperature pressure scales. High Press. Res. 2007, 27, 431–446. [Google Scholar] [CrossRef]
  30. Prescher, C.; Prakapenka, V.B. DIOPTAS: A program for reduction of two-dimensional X-ray diffraction data and data exploration. High Press. Res. 2015, 35, 223–230. [Google Scholar] [CrossRef]
  31. Shim, S.H. PeakPo—A python software for X-ray diffraction analysis at high pressure and high temperature. Zenodo 2017. Available online: https://zenodo.org/record/3376238#.Xhn22S2ZM1I (accessed on 14 January 2020).
  32. Dan Shim, S.-H. Pytheos—A Python Tool Set For Equations Of State. 2017. Available online: https://zenodo.org/record/802392#.Xhn2iC2ZM1I (accessed on 14 January 2020).
  33. Williams, Q.; Jeanloz, R.; McMillan, P. Vibrational spectrum of MgSiO3 perovskite: Zero-pressure Raman and mid-infrared spectra to 27 GPa. J. Geophys. Res. Solid Earth 1987, 92, 8116–8128. [Google Scholar] [CrossRef]
  34. Gillet, P.; Guyot, F.; Wang, Y. Microscopic anharmonicity and equation of state of MgSiO3-perovskite. Geophys. Res. Lett. 1996, 23, 3043–3046. [Google Scholar] [CrossRef]
  35. Rauch, M.; Keppler, H.; Häfner, W.; Poe, B.; Wokaun, A. A pressure-induced phase transition in MgSiO3-rich garnet revealed by Raman spectroscopy. Am. Mineral. J. Earth Planet. Mater. 1996, 81, 1289–1292. [Google Scholar]
  36. Okada, T.; Narita, T.; Nagai, T.; Yamanaka, T. Comparative Raman spectroscopic study on ilmenite-type MgSiO3 (akimotoite), MgGeO3, and MgTiO3 (geikielite) at high temperatures and high pressures. Am. Mineral. 2008, 93, 39–47. [Google Scholar] [CrossRef]
  37. Ishii, T.; Kojitani, H.; Akaogi, M. Post-spinel transitions in pyrolite and Mg2SiO4 and akimotoite–perovskite transition in MgSiO3: Precise comparison by high-pressure high-temperature experiments with multi-sample cell technique. Earth Planet. Sci. Lett. 2011, 309, 185–197. [Google Scholar] [CrossRef]
  38. Millett, J.; Gray III, G.; Bourne, N. Measurement of the shear strength of pure tungsten during one-dimensional shock loading. J. Appl. Phys. 2007, 101, 033520. [Google Scholar] [CrossRef]
  39. He, D.; Duffy, T.S. X-ray diffraction study of the static strength of tungsten to 69 GPa. Phys. Rev. B 2006, 73, 134106. [Google Scholar] [CrossRef]
  40. Lebedev, S.; Chevrot, S.; van der Hilst, R.D. Seismic evidence for olivine phase changes at the 410-and 660-kilometer discontinuities. Science 2002, 296, 1300–1302. [Google Scholar] [CrossRef] [Green Version]
  41. Dziewonski, A.M.; Anderson, D.L. Preliminary reference Earth model. Phys. Earth Planet. Inter. 1981, 25, 297–356. [Google Scholar] [CrossRef]
  42. Brown, J.; Shankland, T. Thermodynamic parameters in the Earth as determined from seismic profiles. Geophys. J. Int. 1981, 66, 579–596. [Google Scholar] [CrossRef]
  43. Kennett, B.L.; Engdahl, E.; Buland, R. Constraints on seismic velocities in the Earth from traveltimes. Geophys. J. Int. 1995, 122, 108–124. [Google Scholar] [CrossRef]
  44. Katsura, T.; Yoneda, A.; Yamazaki, D.; Yoshino, T.; Ito, E. Adiabatic temperature profile in the mantle. Phys. Earth Planet. Inter. 2010, 183, 212–218. [Google Scholar] [CrossRef]
  45. Sawamoto, H. Phase diagram of MgSiO3 at pressures up to 24 GPa and temperatures up to 2200 °C: Phase stability and properties of tetragonal garnet. High Press. Res. Miner. Phys. 1987, 209, 219. [Google Scholar]
  46. Ishii, T.; Huang, R.; Fei, H.; Koemets, I.; Liu, Z.; Maeda, F.; Yuan, L.; Wang, L.; Druzhbin, D.; Yamamoto, T.; et al. Complete agreement of the post-spinel transition with the 660-km seismic discontinuity. Sci. Rep. 2018, 8, 6358. [Google Scholar] [CrossRef] [PubMed] [Green Version]
Figure 1. Raman spectra of the samples recovered from the Large-Volume Press (LVP) runs: The vertical lines highlight the key peaks for the identification of Bm (blue) at 383 cm−1, Ak (red) at 799 cm−1, and Mj (yellow) at 931 cm−1. An LVP run ID is provided to each spectrum (Table 1).
Minerals 10 00067 g001
Figure 2. Data points from our (a) LVP and (b) LHDAC experiments: The red, green, and blue symbols represent Ak, Mj, and Bm, respectively. The estimated phase boundaries and triple point are shown. We fixed the Clapeyron slopes of the involved phase boundaries to those reported in Ishii et al. [37] and then adjusted the location of the phase boundaries to fit our data points. Our LVP triple point is located at 2000 ± 50 K and 19.9 ± 0.4 GPa. Our LHDAC triple point is located at 1990 ± 100 K and 23.8 ± 0.6 GPa.
Minerals 10 00067 g002
Figure 3. Two-dimensional diffraction images of LHDAC data (top) with integrated 1D diffraction patterns (bottom): (a) the formation of Bm, shown in blue, across the Mj/Bm phase boundary and (b) the stability of Ak and absence of Bm. We provide P T conditions of the diffraction measurements. The colored vertical bars in the 2D image and the colored ticks in the 1D pattern show the diffraction peak positions of different phases. We found some weak diffraction features possibly from Ak and Stv (stishovite) in Figure 3a and Stv and Pc (periclase) in Figure 3b. They are likely formed as transient phases due to kinetics and differential elemental diffusion during phase transition.
Minerals 10 00067 g003
Figure 4. The phase boundaries between bridgmanite, akimotoite, and majorite and the triple point between them: The gray rectangular area represents pressure–temperature conditions expected for the 660-km discontinuity [41,42,43,44].
Minerals 10 00067 g004
Table 1. Large-volume press runs performed in this study: Estimated uncertainty for pressure is 0.5 GPa. Estimated uncertainty without the pressure effects on thermocouple is 5 K. We assigned an uncertainty of ±50 K for the runs where we estimated temperature through applied voltage calibrated for thermocouple. T: temperature, P: pressure, O.P.: oil pressure, F: force in metric tons, t: heating duration.
Run IDT (K)O.P. (psi)P (GPa)F(ton)t (min)Product
BB1434JD2173 ± 5500020.551530Bm
BB1438JD2023 ± 5450020.046330Bm
BB1469BK1873 ± 5493722.061160Bm
BB1470BK1873 ± 5436520.044960Ak
BB1472BK2073 ± 50410319.042130Mj
BB1475BK1873 ± 5489221.050460Bm
BB1476BK1875 ± 50460920.547560Bm
BB1477BK1973 ± 5402519.041430Mj
BB1478BK1923 ± 50419219.543230Ak + Mj
BB1479BK1948 ± 5434420.044730Ak
Table 2. Experimental runs in a Laser-Heated Diamond Anvil Cell (LHDAC) in this study. DAC: diamond-anvil cell, PM: pressure medium, SM: starting material, XE: X-ray energy, Gl: MgSiO3 glass. Other abbreviations are the same as in Table 1.
DAC IDSettingSpot IDP (GPa)T (K)Product
#1PM: Ar120.21506Ak
SM: Gl221.31897Mj
XE: 37 keV324.11903Ak
421.01610Ak
521.42056Mj
622.01531Ak
723.21870Ak
830.32110Bm
926.42097Bm
1024.51717Bm
1127.21884Bm
1223.51717Ak
1329.21706Bm
1424.32123Bm
1527.12096Bm
1626.31992Bm
1727.02021Bm
1825.51934Bm
1921.41541Ak
2022.51897Mj
2123.62050Mj
2222.01637Ak
#2PM: NaCl116.81616Mj
SM: Ak217.51761Mj
XE: 30 keV322.42019Mj
420.11964Mj
524.02349Mj
620.61931Mj
724.02136Mj
820.21922Mj
921.21905Mj
1026.11809Bm
1121.71798Mj
1222.81804Ak
1322.82004Mj
1427.51835Bm
1529.32003Bm
#3PM: NaCl126.11625Bm
SM: Ak227.01600Bm
XE: 30 keV324.61900Bm
425.31831Bm
525.11908Bm
624.61600Bm
726.92126Bm

