Application of Supervised Machine-Learning Methods for Attesting Provenance in Catalan Traditional Pottery Industry


1
Department of Geology, Campus de la UAB, Autonomous University of Barcelona, 08193 Bellaterra, Catalonia, Spain
2
Independent researcher, Professional Data Scientist, 17400 Breda, Catalonia, Spain
3
Department of Geosciences, IDAEA-CSIC, Jordi Girona 18-26, 08034 Barcelona, Catalonia, Spain
*
Author to whom correspondence should be addressed.
Minerals 2020, 10(1), 8; https://doi.org/10.3390/min10010008
Submission received: 18 November 2019
/
Revised: 10 December 2019
/
Accepted: 18 December 2019
/
Published: 20 December 2019
(This article belongs to the Special Issue Industrial Minerals)
Abstract
:The traditional pottery industry was an important activity in Catalonia (NE Spain) up to the 20th century. However, nowadays only few workshops persist in small villages were the activity is promoted as a touristic attraction. The preservation and promotion of traditional pottery in Catalonia is part of an ongoing strategy of tourism diversification that is revitalizing the sector. The production of authenticable local pottery handicrafts aims at attracting cultivated and high-purchasing power tourists. The present paper inspects several approaches to set up a scientific protocol based on the chemical composition of both raw materials and pottery. These could be used to develop a seal of quality and provenance to regulate the sector. Six Catalan villages with a renowned tradition of local pottery production have been selected. The chemical composition of their clays and the corresponding fired products has been obtained by Energy dispersive X-ray fluorescence (EDXRF). Using the obtained geochemical dataset, a number of unsupervised and supervised machine learning methods have been applied to test their applicability to define geochemical fingerprints that could allow inter-site discrimination. The unsupervised approach fails to distinguish samples from different provenances. These methods are only roughly able to divide the different provenances in two large groups defined by their different SiO2 and CaCO3 concentrations. In contrast, almost all the tested supervised methods allow inter-site discrimination with accuracy levels above 80%, and accuracies above 85% were obtained using a meta-model combining all the predictive supervised methods. The obtained results can be taken as encouraging and demonstrative of the potential of the supervised approach as a way to define geochemical fingerprints to track or attest the provenance of samples.
Keywords:
pottery industry; local products; clay; provenance; predictive modeling; supervised methods; geochemistry; XRF1. Introduction
Spain is one of the leading countries in the EU within the ceramic sector, concentrating about half the total European production of wall and floor tiles (in particular within the Castelló region) and with a significant production of sanitary ware, bricks, roof tiles, and refractory materials. All these products are manufactured using rather uniformed extrusion processes. In contrast, handcrafted pottery produced using more or less traditional methods is becoming a receding activity. The traditional pottery industry was an important activity in many places within Catalonia (NE Spain), in the past and also in recent times. More than 70 different localities had a specific local production during the 20th century [1]. However, in most production centers the activity has stopped, or it has diminished drastically. The few locations were traditional pottery production persists are mainly small villages were the activity is promoted as a touristic attraction.
Tourism is a key economic sector for Spain (it accounts for 10–15% of the GDP). More than 70 million people are visiting the country every year, and Catalonia is among the main destinations. The preservation and promotion of traditional pottery in Catalonia is part of a strategy of tourism diversification undertaken by municipalities in cooperation with other higher governmental actors. The production of authenticable local pottery handicrafts aims at attracting cultivated and high-purchasing power tourists that could counterbalance the expectable recession of mass tourism due to market saturation.
In this context, the production of traditional pottery should no longer be an uncontrollable activity. The authenticity of the production methods and, equally important, of the traditionally used raw materials (local clays) are crucial to provide an honest and genuine product offer. Similar approaches have demonstrated to be very effective to protect and certify products, particularly in the food and beverage sectors [2,3].
As far as we know, traditional pottery production in Catalonia is nowadays restricted to less than 100 workshops and potters in around 10 villages. Most of these villages produce pottery as a touristic attraction and events like ceramic festivals (including pottery workshops and demonstrations) are regularly organized (often annually or biannually). However, in these festivals, and also in local shops, the ceramic products that are presented for sale are not always produced locally (but imported from other places), sometimes they are not strictly produced following traditional methods (but using semi-industrial methods) or they are produced using imported clays instead of the local raw materials. Some local potters use stamps to characterize their productions, but besides certifying the ceramist, it would be very useful to develop a methodology that could certify the use of the local raw materials of every local production. In this way, quality production with certified local souvenirs (such as hand-crafted tableware and other clay-modelling art) would be possible.
Multi-element chemical analyses have a long tradition of use for the characterization of clays and pottery (e.g., [4,5,6]). However, the choice of the analytical method, the right set of elements to be analyzed or the multivariate method to process the obtained data are under discussion [7]. In this paper, we present a number of statistical approaches to characterize geochemically the local raw materials along with the corresponding ceramics from six Catalan villages. The goal is challenging as the six sites concentrate in a small area and some of them share essentially the same geological context.
The six selected villages are rural towns with local pottery being used as a touristic attraction. The traditional activity is particularly supported by their town councils but also by provincial and regional governments. The villages are Esparreguera, La Bisbal, Quart, Breda, Verdú and Sant Julià de Vilatorta (Figure 1), and in all of them but one (Sant Julià) there are still active workshops and all of them but one (Esparreguera) belong to the Spanish ‘Asociación de Ciudades de la Cerámica (AeCC)’. Extensive information on the past and present productions can be found in [1].
- Esparreguera is the closest village to Barcelona (~35 km north-west of it) and the biggest one of the six selected, with a population of ~22,000 people. There is still one potter working in this area and from 2018 there is a museum in the village devoted to pottery. Many types of pieces were produced with the exception of cookware.
- La Bisbal d’Empordà (~100 km north-east of Barcelona, near the Costa Brava) has a population of about 11,000 people. The village is advertised as one of the leading pottery centers in Catalonia with many shopping areas focusing on pottery sales and a museum that promotes the local cultural heritage connected with pottery and ceramics [8]. There are 35 active pottery companies and small workshops. Besides the pottery market, clays from La Bisbal are exploited by four companies that sell it mainly within Spain. The town has been declared “craft area of interest” by the Catalan government and the EU registered trade mark “Ceràmica de la Bisbal” acts as a protected designation of origin [9]. However, the trademark only attests local producers but not the use of local clays.
- Quart is another of the selected villages (~80 km north-east of Barcelona), it is a smaller rural town (~3600 people) only ~15 km east of La Bisbal with the granitic Gavarres mountain ranges between both. A refurbished old brickyard hosts, from 2011, the local pottery museum. The ceramics tradition in Quart can be traced back to the 14th century [10]. The production is known by both red and black colored products. At present there are five active pottery producers in the village.
- Breda (~50 km north-east of Barcelona) is another small rural town (~3700 people) with active pottery workshops. However, the local clays have been currently replaced by imported clays. Comparatively, the pottery industry in Breda has been historically one of the most important in Catalonia. Pottery constituted practically half the total registered industries during late 18th century and early 19th century. However, nowadays there are only seven active workshops and small pottery industries in the village. From 2003 an old workshop hosts a cultural center devoted to the local history of pottery production.
- Verdú is even a smaller village (only about 1000 inhabitants) located ~90 km west of Barcelona, with six active pottery workshops, its pottery industry goes back to Roman times and it is well documented since the 13th century [1]. The typical pottery from Verdú is black colored (fired in reducing conditions) and the main produced item is the earthenware pitcher.
- Sant Julià de Vilatorta (~60 km north of Barcelona and 3000 inhabitants) in another of the selected villages. It has a long tradition on glazed pottery, in the early 20th century there were 32 active workshops but unfortunately nowadays there is no one and there is not available precise information on the extraction points of local clays. There are ongoing local initiatives to revive the pottery tradition of Sant Julià including ceramics festivals and a project to create a pottery school.
The aim of the work is finding a common geochemical fingerprint that could group together both clays and pottery from a given town and that could allow discrimination from similarly defined clusters for the other towns. The mineralogical changes that occur during the clay-to-pottery transformation prevent the use of other commonly used techniques for characterization of clays such as XRD or FTIR and Raman spectroscopies. Such techniques are sometimes indeed useful to characterize clays (e.g., [11,12]) or firing conditions in ceramic materials (e.g., [13]) but they cannot be used to group together clays and the corresponding ceramics. Therefore, chemical analysis is required, although some problems can also arise using elemental analysis. For instance, the concentration of some elements can decrease during the pottery production due to the formation of volatile compounds by thermal decomposition [14]. Other elements can have a high variance within a considered cluster (including both clays and ceramics) and some strong correlations between elements can provoke problems for statistics-based methods of analyses [15].
In the field of archaeological sciences, and specifically in provenance studies of pottery, data is often obtained by X-ray fluorescence analysis (XRF) or other elemental analysis techniques. The processing of the large chemical datasets that are obtained is usually addressed by application of statistical methods that predict groups or relations between samples [16,17]. The classical approach is to use unsupervised methods such as principal component analysis (PCA), hierarchical cluster analysis (HCA), k-means, or factor analysis (FA). Extensive literature can be found on the application of such techniques to address pottery provenance issues (e.g., [18,19,20]). In this paper, we show that these methods are not very useful to meet our objective and we explore the possibilities of a number of supervised methods (k-nearest neighbors analysis (kkNN), random forest (RF), generalized linear models (Glmnet) and linear discriminant analysis (LDA)) that work much better for our purpose.
2. Materials and Methods
2.1. Sampled Areas and Materials
For this study, 80 samples of clays outcropping in the vicinity of the selected villages were taken into account (Table 1). All of them are geological Cenozoic formations, the exact extraction points of clay were determined through existing bibliography [21,22] and oral sources. When original extraction points were no longer available, sampling was performed on nearby equivalent geological outcrops (Figure 2). The sampled materials for every village were:
- Esparreguera: red clays (six samples) from decimetric layers inserted in proximal alluvial fan deposits belonging to the northern margin of the Vallès-Penedès basin (Miocene epoch, Vallesian age (11.2–8.9 Ma)). Additionally, four samples of the fault flour outcropping at the edge of the basin margin, in the main normal Vallès-Penedès fault, were also sampled as this material was traditionally added to the red clays [1].
- La Bisbal: ochre and red clays deposited in an alluvial plain environment (also Miocene epoch, Vallesian age) connected to the Gavarres massif. (17 samples)
- Quart: red clay levels within arkosic sandstones (possibly Pliocene) that belong to a system of alluvial fans linked to the Gavarres massif. (11 samples)
- Breda: red, black and white clays from relatively thin levels within sandstones (early Pliocene, ~5 Ma) deposited in an alluvial fan environment with predominance of igneous and metamorphic clasts from Variscan granitoids and the uplifted palaeozoic basement. (11 samples).
- Verdú: grey and red clayey and calcareous marls from an environment of distal alluvial fans and lacustrine limestones (Oligocene epoch, Chattian/Rupelian age (~28 Ma)) (23 samples).
- Sant Julià: red clays from relatively thin levels within sandstones and conglomerates (Eocene epoch, possibly Lutetian, ~45 Ma) deposited in an alluvial fan proximal environment. Initially 18 samples were obtained but 10 resulted to bear a high CaCO3 content (>25 wt.%) inconsistent with the Ca content of the corresponding ceramics and therefore they were discarded. These 10 samples possibly belong to a nearby formation of calcareous red marls. Therefore, eight samples were retained from Sant Julià.
Sampling of clays was performed by removing organic and soils layers and focusing on clays thin layers (avoiding coarser sized layers). However, most clay samples contain actually silt and very fine sand fractions. Nevertheless, the clay samples were neither sieved nor levigated because silt and sand fractions were also present on many pottery samples.
Besides the clay samples from the six selected areas, 101 samples of pottery likely produced by firing clays from the sampled formations were taken into account (Table 1). The pottery shards were obtained through local museums, active pottery workshops, local historians and retired potters. The selection criterion was the high probability that the pottery was really produced using local clays. For the Breda pottery samples, the presence of ceramic stamps even allowed the identification of the local potter and the production period (19–20th century) [23]. Pottery samples from Sant Julià are dated in the 17th century, and those from Esparreguera, Quart, and Bisbal are also from the 19–20th century like Breda. Finally, 27 extra newly produced pottery samples were added to samples from each locality (3–6 per studied site). These were prepared in form of small ceramic briquettes from local clays, firing them in a gasoil kiln during 10 h (including the heating ramp) reaching a maximum temperature of ~1000 °C for 2 h.
2.2. Mineralogical Analyses
A basic mineralogical and petrographic characterization was performed on several representative specimens of both clay and pottery samples from all the studied villages. Specimens were prepared as thin sections to be viewed using a petrographic microscope; other specimens were prepared from clay-suspension drops as well as ceramic powder that were deposited on aluminum discs to obtain X-ray diffraction (XRD) patterns. A Panalytical X’Pert powder diffractometer with θ-θ geometry, Cu anode X-ray tube and a PIXcel1D detector has been used. Additionally, determination of the calcium carbonate content in clay specimens was determined by a volumetric method by adding hydrochloric acid and measuring the CO2 released.
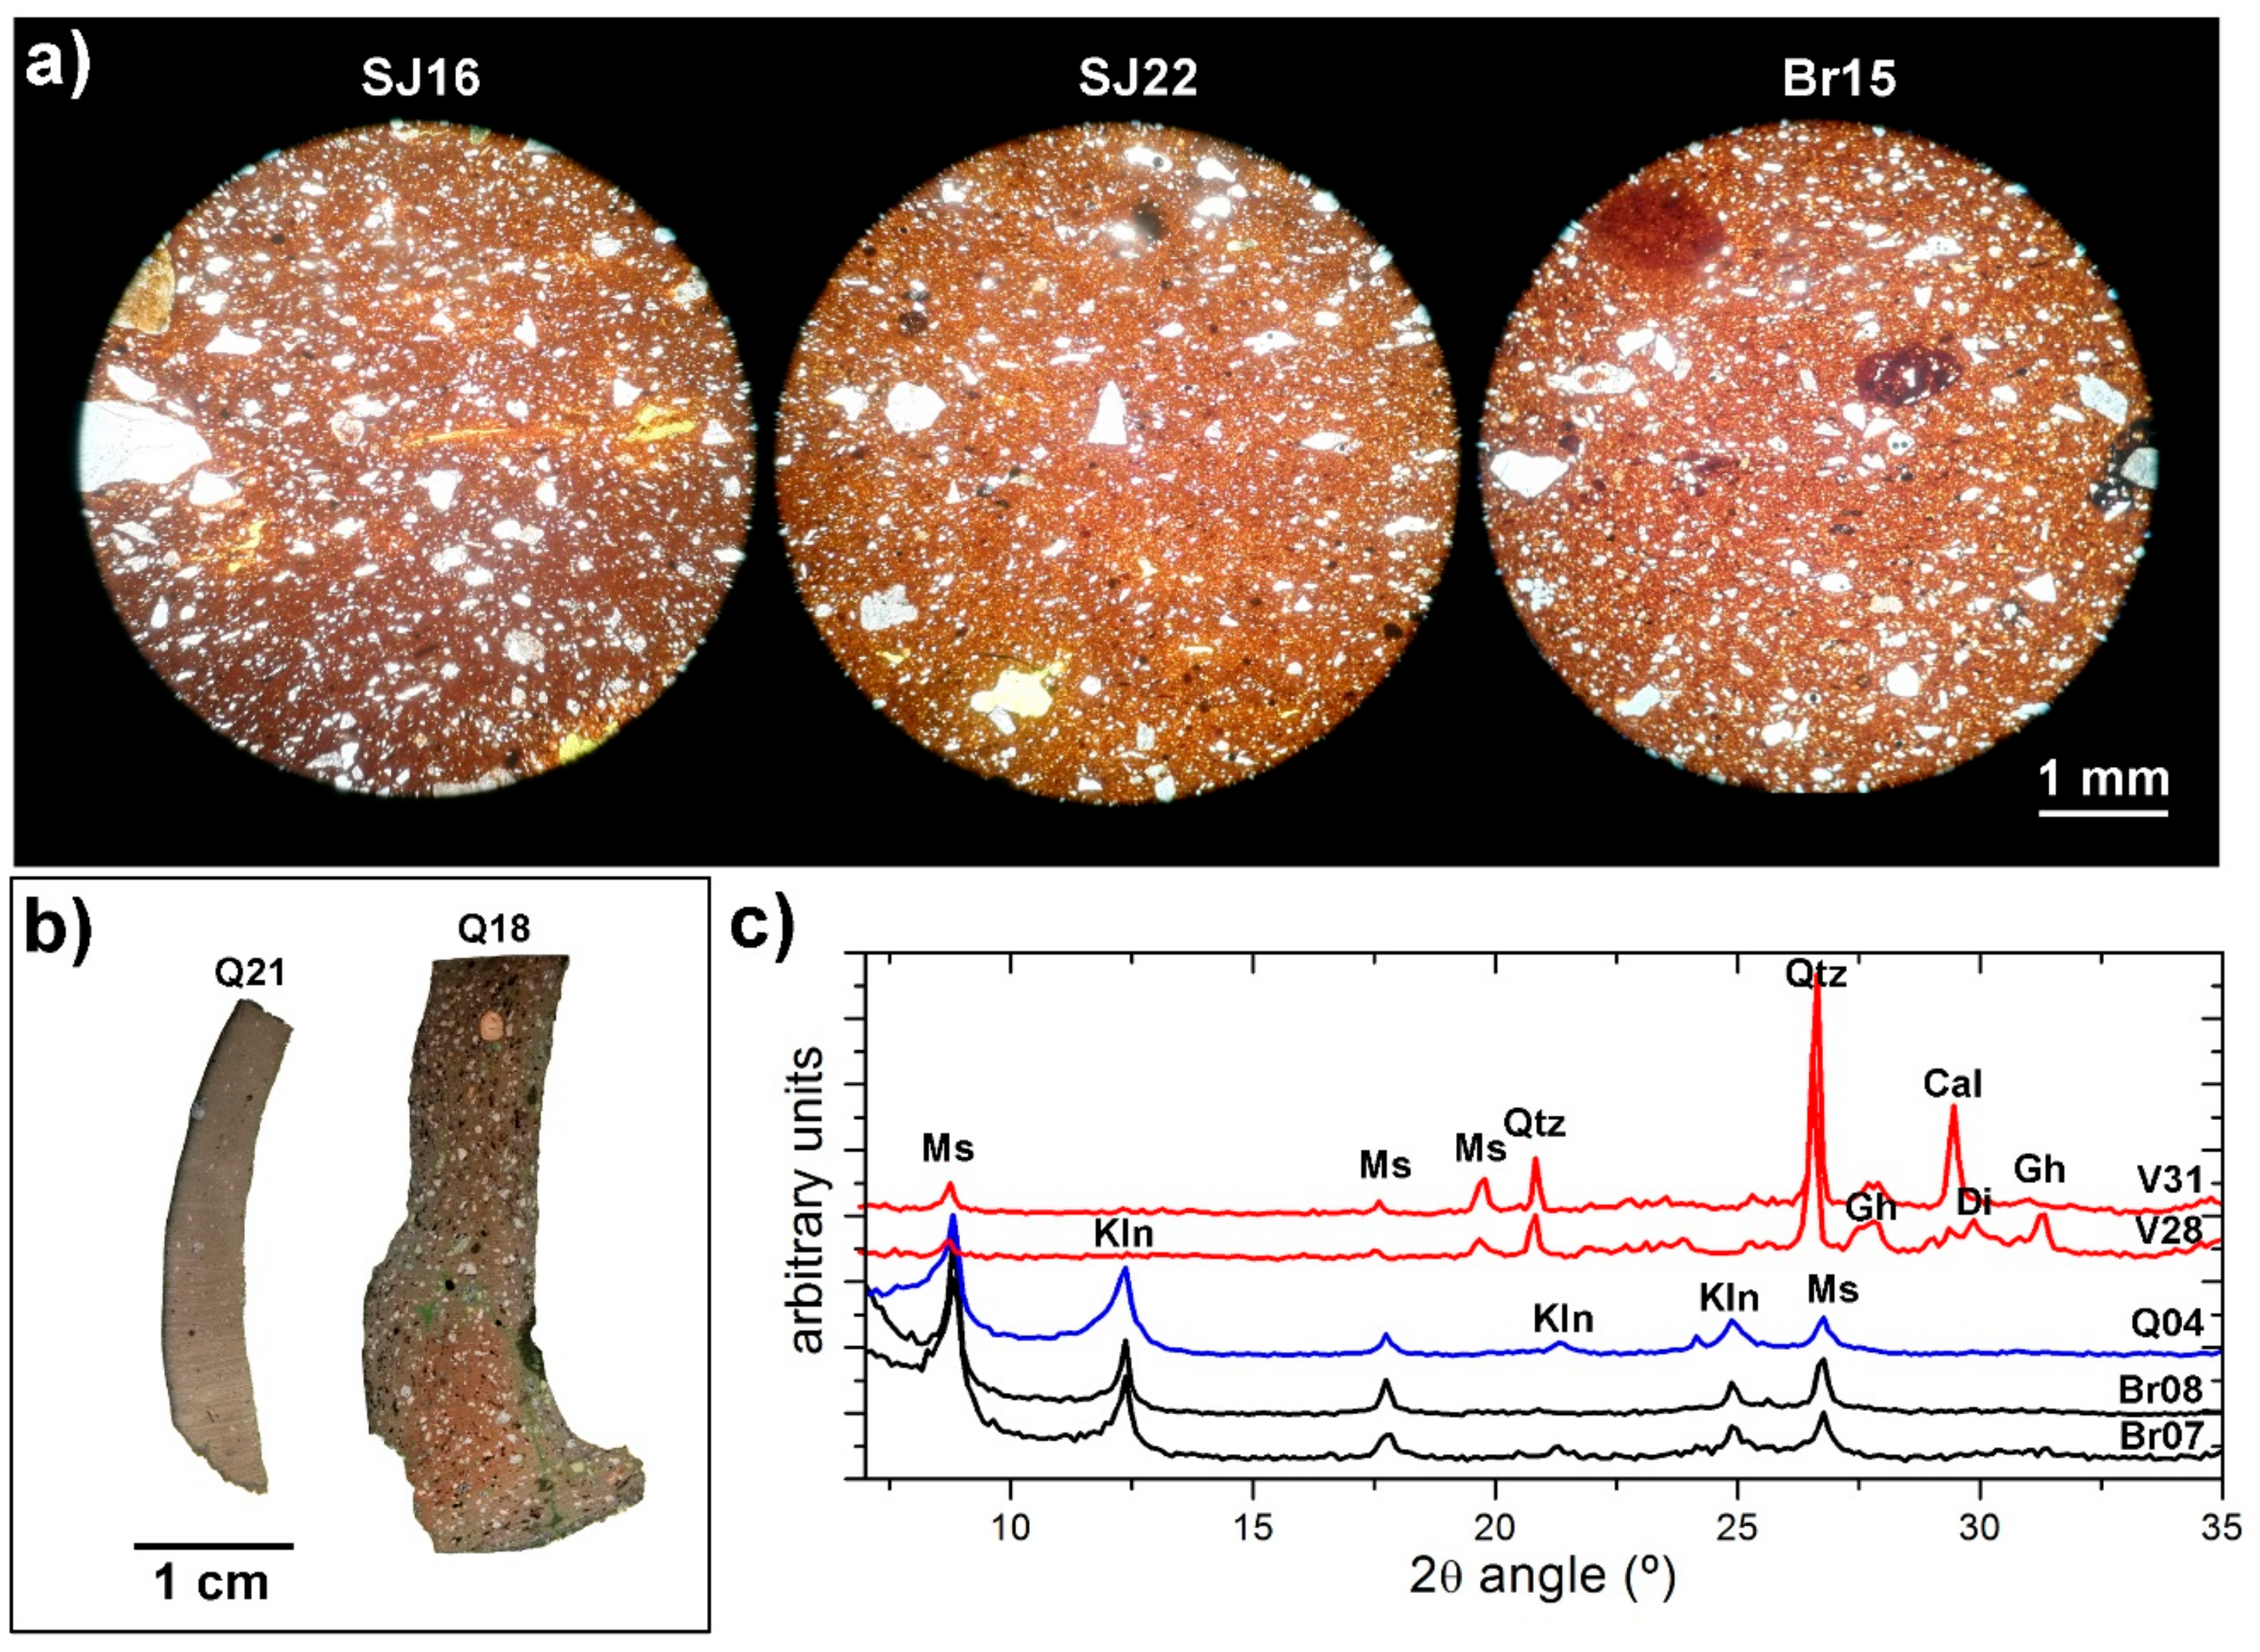
Petrographic results reveal that pottery productions from a given studied town can appear very different in terms of amount and size of the non-plastic inclusions (see Figure 3b). Perhaps the only clear trend is the predominance of fine-grained pastes for productions from Verdú. For pastes bearing large inclusions, quartz is dominant basically on all studied sites and therefore textural distinction between sites is not possible (Figure 3a). The XRD patterns of clays from the different sites share common features, exhibiting a mixture of characteristic peaks of mica-type and kaolinite-type minerals (Figure 3c). Only occasionally did calcite and/or quartz appear in the analyzed clay-fractions. In contrast XRD patterns of pottery shards can exhibit quite different signals, even for shards from a given town (Figure 3c), possibly this is the result of different firing conditions. Calcimetries revealed the presence of calcite in most clay specimens from Verdú, La Bisbal and Esparreguera.
2.3. EDXRF Analysis
Besides basic mineralogical and petrographic characterization, the main analytical tool used has been Energy Dispersive X-ray fluorescence to obtain the required elemental data. That is the data that has been used to apply different statistical methods to identify a distinct geochemical fingerprint for each studied rural town (including their clays and pottery). Common sample preparation for geological materials and earthen objects has been undertaken consisting in the conversion of solid powdered samples into flat surface pellet specimens. Clays were first oven dried at 60 °C until constant weight. Glaze from glazed pottery shards was completely removed by scraping it using a drill. The shards were also oven dried as the clays and afterwards they were ground using a laboratory mill (Pulverissette™, Fritsch GmbH, Idar-Oberstein, Germany) to pass a 125 µm mesh.
Clay and pottery powders for analysis were prepared as pressed powder pellets following the methodology reported in [24] and using a methyl-methacrylate resin as a binding agent. 5 g of sample were mixed and homogenized with 0.8 g of binder (Elvacite™ commercial resin). The resulting powder was poured into a pressing die (40 mm in diameter) and pressed at a pressure of 20 T. The resulting pellet of tablet was then ready for analysis.
A commercially available benchtop EDXRF spectrometer (S2 Ranger, Bruker/AXS, GmbH, Karlsruhe, Germany) was used in the present study. This instrument is equipped with a Pd target X-ray tube (50 W power max.) and a XFLASH™ LE Silicon Drift Detector (SDD), ultra-thin beryllium window (0.3 μm thickness) with a resolution lower than 129 eV at Mn-Kα line for a count rate of 100,000 counts-per-second (cps). In this LE configuration of SDD detectors, the intensities for Na K-alpha and Mg K-alpha are, respectively, close to around four times higher than the intensity recorded by conventional SDD detectors. The instrument is also equipped with nine primary filters that can be used in front of the tube before X-ray beam reaches the sample surface in order to improve measuring conditions for the elements of interest and it can operate under vacuum conditions.
The software used to control the equipment, to build calibrations, and to perform spectral data treatment was SPECTRA.EDX package (Bruker AXS, GmbH, Karlsruhe, Germany). This software can perform the full line profile fitting, deconvolutions when lines overlap, intensity corrections for inter-elemental effects and qualitative, semiquantitative or full-quantitative routines.
All the samples were analyzed to obtain a spectrum for the identification of all the elements present in samples. Quantification was made by the assisted fundamental parameters approach included in the above-mentioned software using certified BAS BCS-315 and ECRM 776-1 firebricks as reference materials. Analysis was made in a vacuum atmosphere allowing better detection of low Z elements and using different conditions of voltage to properly excite low, medium and high atomic number elements existing at the samples. Current was automatically adjusted to obtain a fixed counting rate of 100,000 cps. Total measuring time was set at 400 s as a trade-off between an acceptable repeatability of measurements and total analysis time.
The net intensity of each analytical line was calculated by subtracting the theoretical background adjusted by a polynomial function to the obtained experimental spectra.
2.4. Data Processing
Data processing was performed using available scripts from RStudio (the integrated development environment for R software). In rough outlines, all the samples (both clays and baked clays) display similar assemblies of elements. From the obtained data, only those elements present (above their detection limit) have been taken into account. Besides that, Ca, S and Pb values have been disregarded, the first (Ca) because it shows a very strong inverse correlation with Si values, S because it shows a very high dispersion with many samples exhibiting values below the corresponding detection limit and Pb due to evidence of contamination from glazes in glazed pottery, even after glaze removal. The list of elements that have been taken into account to test several statistical machine learning approaches to classify geochemically the samples from each village have been: Al, Si, Fe, Na, Mg, Cl, K, Ti, Cr, Mn, Ni, Cu, Zn, Rb, Sr, Y, Zr, and Nb. Both unsupervised and supervised modeling of data has been applied to the datasets containing values for this list of elements.
Unsupervised learning is a way of organizing data that helps to find previously unknown patterns in datasets without pre-existing class labels. In contrast, supervised machine-learning relies on prior knowledge of the class labels. Some unsupervised methods, and particularly principal component analysis (PCA), are widely used in archaeometry to facilitate the identification of compositional groups and determining the chemical basis of group separation and extensive literature can be found on the subject. In contrast the use of supervised methods is quite scarce. However, some incursions within the supervised methods domain had also been done previously, from the pioneering works of [17,25] to much more recent papers [26,27,28] that focus particularly on the artificial neural network (ANN) approach.
In the processing of the obtained data some unsupervised models have been tested and, as it will be shown, all of them fail to produce data groups with good correlation with the real classes. The widely used hierarchical cluster analysis (HCA), k-means and PCA will be used to illustrate the low performance of such models. The HCA algorithm produces a tree diagram (dendrogram) according to a given metric and linkage criterion (e.g., [29,30]), the k-means algorithm identifies k clusters from a given dataset, every cluster is identified with a centroid and the corresponding data, the algorithm basically tries to keep inter-cluster data as similar as possible, while the centroids are as different as possible [31]. PCA logic is based on the concepts of linear correlation and variance. PCA is a dimensionality reduction technique, starting with the features (i.e., the chemical values) describing a set of objects (i.e., our samples), the target defines other variables that are linearly uncorrelated with each other. The output is a new set of variables defined as linear combinations of the initial features. The new variables are ranked on the basis of their relevance. The number of the new variables is less than or equal to the initial number of features and it is possible to select the most relevant features. Then, it is possible to define a smaller set of features, reducing the problem dimension, see page 169 in [32].
Taking into account that the provenance of the analyzed samples is known (i.e., the class labels are known for each object) supervised models can also be used to process the data. Starting from the whole experimental dataset, it is possible to constitute a training dataset [26]. The labelled geochemical data is then used to build models that proxy for class characteristics. After optimization of the model parameters, the model is finally tested with new objects. The best performing predictive model can be selected looking at their ability to predict class memberships for these new objects. In this study, an 80% portion of the total dataset was used to train the models and the remaining data was used for model testing. The dataset was divided randomly using a specific seed in such a way that all the models tested in this study use the same train and test sets. The performance of the different tested models was evaluated using the widely employed confusion or error matrix [33], where each row represents the distribution of samples from an actual class among the predicted classes organized in columns (or vice versa). As the predicted and actual classes are presented in the same order, the successful predictions (usually called hits or true positives) concentrate along the main diagonal of the matrix, whilst unsuccessful predictions lie outside the diagonal. Additionally, an overall value of accuracy was computed as the ratio between hits and the total number of objects (i.e., samples). An overall accuracy value of 1 would indicate 100% of success and therefore no errors.
Predictive modeling of the training set was conducted using five machine learning algorithms and finally a combination of all them. These algorithms were called from packages within the freely available Caret R library:
- Weighted k-nearest neighbors (kkNN) [34], its basic idea is that a new object will be classified according to the class that have their k-nearest neighbors. The R package used was class.
- Random forest (RF) [35,36], this algorithm is based on the concept of decision tree (a series of yes/no questions asked to the data that in the end lead to a predicted class). The RF model deals with many decision trees (i.e., a forest) using random sampling to build the trees and random subsets of features when splitting nodes of the trees. The R package used was randomForest.
- Artificial neural network (ANN) [37], a mathematical mimic of human learning where individual processing elements are organized in layers. The input layer receives the weighted values of the features of an object to produce new values through so called activation functions; these values will be also weighted and transferred to new layers until reaching the output which is made of as many elements as classes. The obtained values are used to assign a class to the object. The R package used was nnet.
- Linear discriminant analysis (LDA) [38,39], similarly to the PCA logic, delineates a new set of variables defined as linear combinations of the initial features reducing the dimensionality of the problem, but instead of looking for the maximum variance, LDA maximizes the separability among classes (the distance between their means) and simultaneously minimizes the internal scatter within each class. The R package used was lda.
- Generalized linear models (Glmnet) [40,41]. These are generalization models of a linear relationship between the output variable (class) and a set of input variables (features) where the distribution of the output variable can be non-normal and non-continuous and the function linking input and output variables can be more complex than a simple identity function. Specifically, the Glmnet algorithm incorporates regularization (i.e., reduction of variance) by the lasso and elastic-net methods to avoid overfitting (i.e., noise fitting). The R package used was Glmnet.
- Stack of models. With the aim of improving the accuracy of the predictions, information from multiple models (i.e., a stack of models, see [42]) was used to generate a new model using a random forest approach to the predictions from different models. The R package used was randomForest.
All these models, including the stack of models, were optimized during the training step. This was done following a homogeneous approach for all the models and included a first phase of traincontrol using the repeatedcv method:
fit_control<-trainControl(method="repeatedcv",number=10,repeats=2,savePredictions="final",classProbs=TRUE)
preproc=c("center","scale")
Then, in a second phase, the best optimizable parameters to improve the attained accuracy were automatically spotted with code lines as in the following example:
BASE.lrm<-train(target~.,Dataset[train,],method="glmnet",metric="Accuracy",preProc=preproc,trControl=fit_control)
3. Results
3.1. EDXRF Analysis
The full set of chemical analyses can be downloaded from the Supplementary Material Section (Table S1). Table 2 shows a summary of the normalized chemical analyses with the major and minor element means (values are in weight percent of corresponding oxides) as well as those of the trace elements (values are in native element parts-per-million) for every studied locality. The associated standard deviation values give an indication of the internal variance within each group of data. Apart from Si and Ca values, for the remaining major elements, mean concentration values appear very similar in all the studied villages. Regarding the mean values for the minor elements, it is worth noting that almost all of them (Rb and Zr are the exceptions) show very high coefficients of variation (often above 40%) indicating a very high dispersion of values within each locality. Some major elements such as Na, S, Cl and occasionally also Ca also show very high variation coefficients. This highlights the difficulty to extract relevant data from the analyses, and therefore the use of statistical methods is indispensable.
3.2. Unsupervised Modeling
HCA and k-means are both unsuccessful to group the different samples in their corresponding locations. Firstly, HCA could be an unsuitable classification method because the expectable clustering structure for the studied sites should not be particularly hierarchical but flat. In any case, the resulting HCA dendrogram can be cut at a certain level to produce a set of six clusters. These should contain a rather homogeneous number of samples (33 to 37) distributed according to the real distribution of samples per village (as appears in Table 1). However, the distribution of samples per cluster is clearly heterogeneous (Table 3). Two clusters (X1 and X3) contain more than 70% of the samples. Grosso modo X3 contains most of the samples from three real clusters (Breda, Sant Julià and Quart) and X1 contains most of the samples from Verdú and around half those from Esparreguera. The samples from the remaining real cluster (La Bisbal) appear scattered in the six predicted clusters. A slightly more balanced distribution of samples per class is obtained using the k-means model but still is far from being close to an acceptable result. The k-means model has been set to obtain six clusters (Table 4). This time three predicted clusters are big, amounting around 75% of the samples and the other three only contain the remaining 25%. Again, the predicted clusters do not contain samples from a preponderate location. For instance, the X3 cluster groups together most of the samples from Breda, half those from Quart and a third of those from Sant Julià, or X6 contains most of the samples from Verdú, half those from Esparreguera and a third of those from La Bisbal. Samples from La Bisbal, and this time also from Sant Julià, appear scattered within the six predicted clusters. It is worth of note that some similarities can be found between the predicted clusters using HCA and k-means, for instance many samples from Breda, Sant Julià and Quart tend to group in a single cluster and something similar occurs with those from Verdú and Esparreguera.
The results from PCA also fail to discriminate most of the clusters. Despite being a multivariate technique, the obtained result privileges mainly a single variable. From the new set of variables, PC1 alone can explain ~94% of the variance and PC2 nearly the 4%, therefore all the other new variables only hold the remaining 2% of variance. Besides that, looking at the definition of the two main principal components (Table 5 and inset in Figure 4) it is apparent that PC1 is basically the SiO2 content and PC2 a combination of the Fe2O3 and Al2O3 content. Figure 4 depicts the corresponding biplot where samples have been colored according to their known provenance. PC2 is actually a non-discriminant variable because samples from all the studied localities show a similar range of variability along the PC2 axis. Regarding PC1 (i.e., SiO2), this single variable allows a net distinction between samples from Breda (high SiO2 content) and Verdú (low SiO2 content). Most of the samples from la Bisbal and Esparreguera are also relatively low in SiO2, and therefore they lie scattered basically in the same area along with the samples from Verdú. On the other hand, most of the samples from Sant Julià and Quart are comparatively richer in SiO2 and they align with the samples from Breda, defining actually a straight line in the biplot (and therefore reveal a correlation between PC1 and PC2 for the samples from these three villages).
3.3. Supervised Modeling
Using the training dataset (a random 80% portion of the total dataset) every model was optimized to attain the maximum accuracy; this implied the automatic selection of different parameters for each model:
- Weighted k-nearest neighbors (kkNN). Optimization was done by defining the values of three parameters of the model: Kmax = 5, distance = 2 and kernel = optimal; these parameters determine the way to define the neighbors and their distance to a given object.
- Random forest (RF). The method rf gives the possibility to modulate three different parameters; mtry, splitrule and min.node.size. After optimization they were fixed as mtry = 19, splitrule = extratrees and min.node.size = 1. Mtry is the number of variables randomly sampled as candidates at each tree split.
- Artificial neural network (ANN). After optimization the best architecture for the ANN classifier was found to be made of a single hidden layer of 5 units using a weight decay value of 0.1 (this is a multiplier factor for the weighted factors to avoid overfitting).
- Linear discriminant analysis (LDA). No parameters were modulated for this straightforward model.
- Generalized linear models (Glmnet). Only two parameters were optimized, α = 1 and λ=0.00488. The first implies that the lasso regularization was used and λ is the regularization penalty.
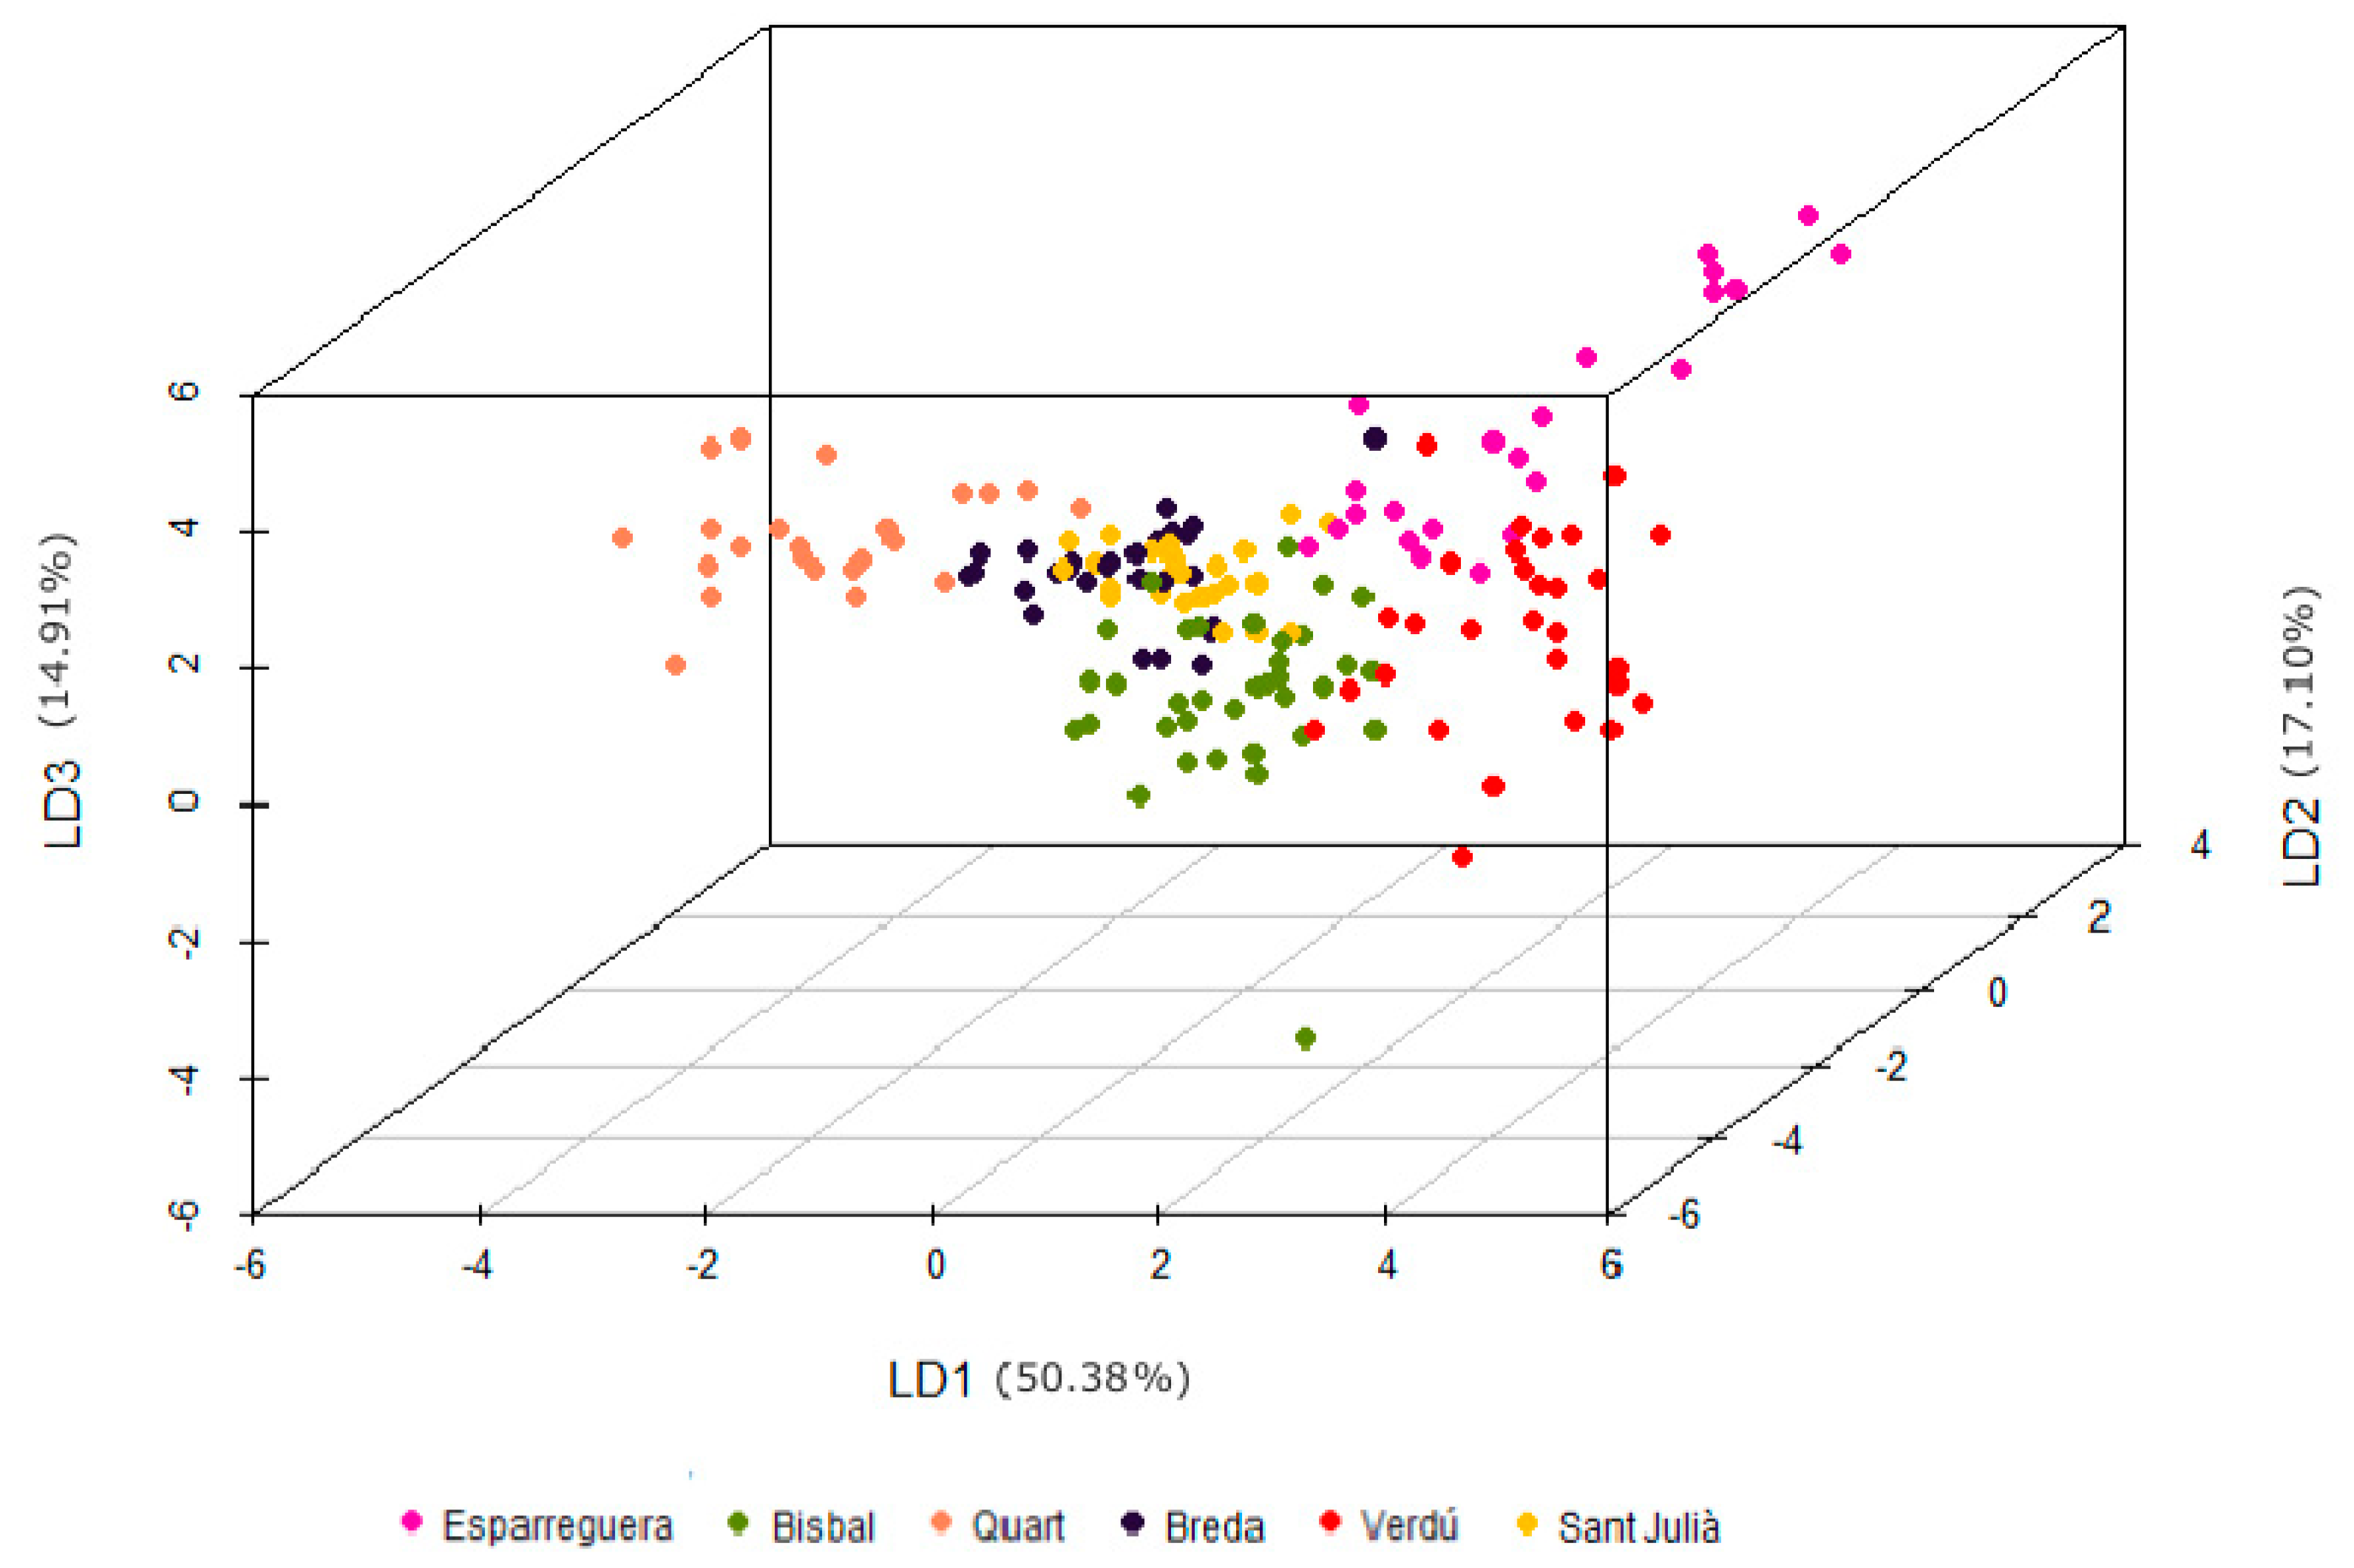
LDA is the only model without optimization of parameters during the training step. However, training of this model results in the definition of the new relevant variables as linear combination of the initial features (similarly to the unsupervised PCA model) that maximize the separation between clustered classes. Figure 5 is the corresponding 3D plot (for the three main discriminants) of the trained dataset and it becomes apparent that the clouds representing every class have little or no overlap. It is worth to note that, unlike PCA, the new variables are no longer essentially defined with a single compositional feature (see in Table 6, for instance that the main contributors to LD1 are SiO2, MgO and K2O whilst PC1 was essentially SiO2 alone). Besides that, variance is not concentrated in a single variable. Therefore, the LDA model really uses a multidimensional space to separate the different clusters and to take advantage of all the available data. In contrast, PCA was so strongly biased to SiO2 that basically only one dimension was used to separate the samples and yet unsuccessfully.
After the training step, each parametrized model was tested using the remaining 20% of the total dataset not used during the training step (precisely named test dataset). Table 7 contains the corresponding confusion matrices.
All the models exhibit a high rate of successful class prediction for the 42 samples from the test dataset, with accuracies > 80% and RF attains the highest (88.1%). Esparreguera and La Bisbal are the classes that seem harder to predict successfully, in contrast Sant Julià is a class particularly well predicted by all the testes models. However, through the analysis of a correlation matrix, it can be seen that, besides these trends, there are not clear correlations between the results from each model. For instance, the LDA model is not very good at predicting the provenance of samples from Esparreguera (only three out of seven are well predicted) and in contrast both ANN is much more efficient at it (six out of seven). However, the LDA model is the best at predicting the provenance of samples from Breda. The lack of clear correlations between the models augurs well for the chances to increase the obtained accuracy using a combined approach (stack of models). Table 8 shows the corresponding confusion matrix for the stack of models.
The stack is a meta-model or a combination of all models. Instead of using a single classification model based on experimental features (the chemical composition of samples), the stack approach uses the predictions of the different classifiers as features. However, using this combined approach the accuracy reaches 88.1%, a value already obtained using the RF approach.
4. Discussion
Unsupervised methods are widely used in provenance studies of pottery and particularly PCA is routinely applied [43] to define geochemical and/or petrographic groups within sampled materials from archaeological workshops and consumption centers. However, the presented results show that these methods would have failed to detect and distinguish a mixed ensemble containing pottery from the six studied production centers. The geographical proximity, inherent chemical variability and a similar geological context could explain the difficulty to distinguish geochemically the different sites.
The presented results for the three unsupervised methods (HCA, k-means and PCA) agree on detecting roughly two different classes: on the one hand samples with a relative high Si content (mainly those from Breda, Quart and Sant Julià) and on the other hand those with a comparatively lower Si content (predominantly samples from Verdú, Esparreguera and La Bisbal). The preponderant role of SiO2 has been clearly illustrated by the PCA results, as the main composed variable (PC1) is basically defined as SiO2 and it bears almost all the variance (94%). The higher SiO2 content reflects a higher mineralogical abundance of quartz in the clays from Breda, Quart and Sant Julià, possibly correlated with a coarser grain size. The chemical analyses reveal an inverse correlation between Si and Ca, and indeed mineralogically there is a higher calcite content in the clays from Verdú, Esparreguera, and La Bisbal (and higher Ca-bearing minerals within the corresponding pottery). However, these are just general trends that cannot be used alone to identify productions from a given locality. Unsupervised methods do not produce distinguishable clusters that could be correlated with the actual provenance of the clay and pottery samples; the results only indicate roughly two different classes. When the number of classes is fixed to be six the different classes appear to be quantitatively highly imbalanced and formed by a mixture of samples from different sites. Therefore, these methods cannot be used to define a geochemical fingerprint to track or certify the provenance of the samples.
In contrast, the tested supervised methods, through a machine learning approach, have been able to develop predictive models of provenance with accuracies above 80%, sometimes has high as 88.1%. Such level of accuracy can be considered very high, actually accuracies around 75% have been considered enough to rate a predictive model on soil prediction as successful [26]. This potentially opens the possibility for developing a tool that could predict the class of unknown samples, with an about 90% of accuracy, that could be used to certify the provenance of pottery productions with that level of probability.
Nevertheless, it should be noted that the accuracy predictions are performed using the test dataset, which has been defined as the 20% of the total dataset. As the full dataset contains the chemical analysis of 208 samples, there are only 42 samples within the test dataset. Taking into account that the samples come from six different localities it turns out that the capacity of the models to predict provenance is computed using only a very few test samples per site (for instance in the case of La Bisbal 9 test samples were used, and for Quart, only four). It is known that the success of machine learning methods depends on the amount and quality of available data [44] and a minimum total dataset size of 100 samples has been hypothesized as the lower limit to apply machine learning methods in materials research [45]. The presented results have been derived with a dataset of 208 (just above double the hypothesized minimum size), therefore an enlarged dataset would be required to increase the confidence on the obtained accuracy. However, a significant increase of the experimental dataset is time and cost consuming, the obtained results can be taken as encouraging and demonstrative of the potential of the supervised approach as a way to define geochemical fingerprints to track or certify the provenance of samples.
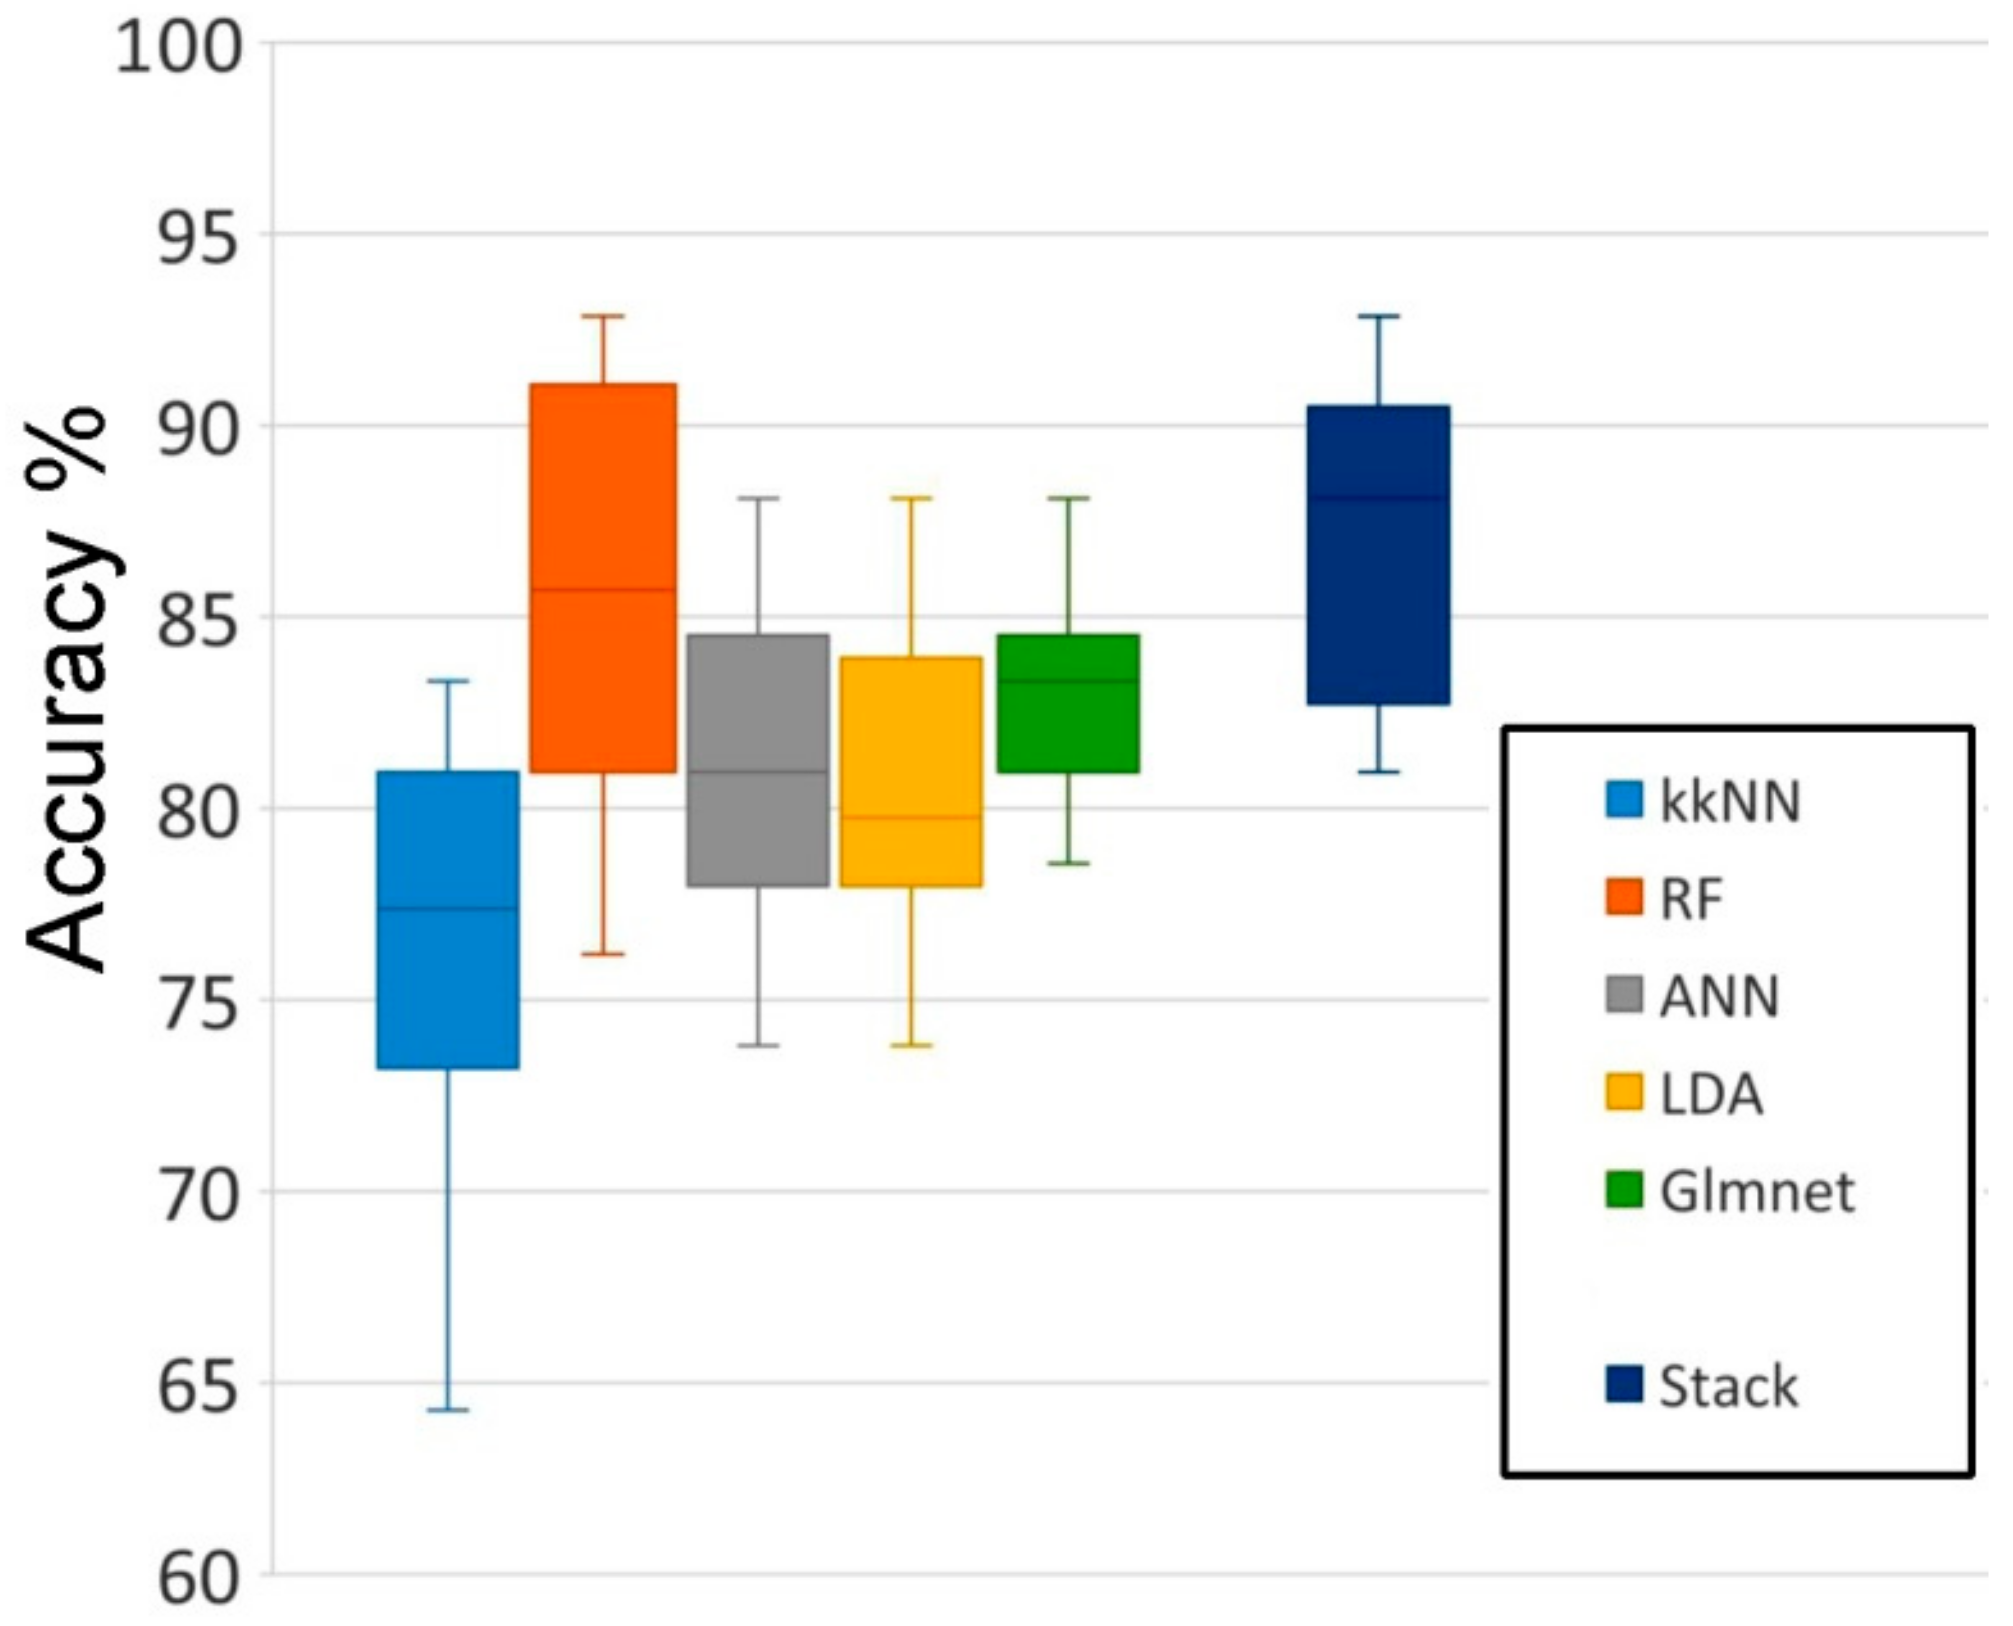
With the currently available dataset it is possible to further analyze the significance of the obtained results by repeatedly performing the full training and test process using different splits of training and test data. In the previous section it has been always used a particular split obtained using always the same random seed. Ten different seeds have been used to generate ten different splits that have been applied to every supervised model (and also to the stack of all the models), the obtained accuracies are not always exactly the same and therefore it is possible to analyze the distribution of the obtained accuracies for every tested method, and the results are shown in Figure 6.
The obtained distributions of accuracy are relatively narrow. kkNN is the model that produces statistically lower accuracies, in some occasions even below 70%. Three models (ANN, LDA and Glmnet) yield accuracies with interquartile ranges between 78% and 85%. Finally, the best performing models are RF and the stacked meta model, both exhibiting a distribution of accuracies that expand above 90%. However, the distribution of the stack of models is narrower and keeping its median value at 88.1%. Therefore, the results using different splits confirm that the ‘stack of models’ approach is the best classification approach.
5. Conclusions
Supervised machine learning methods have proven to be useful to extract geochemical fingerprints (for both clays and pottery from a given site) and these allow inter-site discrimination with accuracy levels of 80% and above.
Unsupervised methods are classically used in archaeometry to enable the identification of compositional pottery groups to distinguish between local products from a given workshop and different exports. Nevertheless, these methods have failed to distinguish the raw materials and pottery products from the six studied villages. The presented results should warn archaeometrists against the careless use of such methods, particularly if the distinction between closely related provenances is envisaged.
In the modern context of revitalization of the traditional pottery production in Catalonia, the presented approach based on supervised machine learning methods could be the useful to develop effectively a scientific protocol to control this industry. The protocol has the potential to make feasible the introduction of seals of quality and provenance to regulate the sector. Periodic chemical analyses (lead and cadmium) on ceramic products are already performed for articles intended to come into contact with foodstuffs to meet the European and Spanish regulations. A similar approach including an exhaustive compositional characterization could be implemented for those potters that would like to certify the use of local raw materials.
The geographical closeness and similar geological context for the six studied localities highlight the robustness of the presented approach that could easily be exported to other pottery centers and similar problematics.
Supplementary Materials
The following is available online at https://www.mdpi.com/2075-163X/10/1/8/s1, Table S1: Full set of chemical analyses (clays, pottery and briquettes) for the six studied localities.
Author Contributions
Conceptualization and fieldwork (clay and shard sampling) by A.A. and L.C., experimental work (clay firing) by A.A. and chemical analyses by A.A. and I.Q. Formal analyses of data by A.A. and M.A. writing—first draft preparation by A.A. and L.C.; writing—review and editing, all authors. All authors have read and agreed to the published version of the manuscript.
Funding
This research was funded by the Spanish Ministerio de Economía y Competitividad, grant number CGL2013-42167-P.
Acknowledgments
We are grateful to Anna Pallàs, Eduard Recasens and Jenifer Obama for their contribution to fieldwork, sample preparation and experimental measurements. We want also to thank all the institutions that have contributed to the work with pottery samples: Ceràmiques Sedó, Terracotta museum, Terrissa de Quart museum, Terrissers de Quart association and Rocaguinarda museum. Finally, we would like to thank the editor as well as the anonymous reviewers for their valuable remarks and comments.
Conflicts of Interest
The authors declare no conflict of interest.
References
- Romero, A.; Rosal, J. La Terrissa a Catalunya; Brau Edicions SL: Figueres, Spain, 2014; ISBN 841588513X. [Google Scholar]
- Vandecandelaere, E.; Teyssier, C.; Barjolle, D.; Jeanneaux, P.; Fournier, S.; Beucherie, O. Strengthening Sustainable Food Systems Through Geographical Indications; Invest. Centre. Dir. Invest. eng no. 13; FAO: Rome, Italy, 2018. [Google Scholar]
- Gonzálvez, A.; Llorens, A.; Cervera, M.L.; Armenta, S.; de la Guardia, M. Elemental fingerprint of wines from the protected designation of origin Valencia. Food Chem. 2009, 112, 26–34. [Google Scholar] [CrossRef]
- Pollard, A.M.; Batt, C.M.; Stern, B.; Young, S.M.M. Analytical Chemistry in Archaeology; Cambridge University Press: Cambridge, UK, 2007; ISBN 9780511607431. [Google Scholar]
- Pollard, A.M.; Heron, C. Archaeological Chemistry; The Royal Society of Chemistry: Cambridge, UK, 2008; ISBN 978-0-85404-262-3. [Google Scholar]
- Mommsen, H. Short Note: Provenancing of Pottery—The Need for an Integrated Approach? Archaeometry 2004, 46, 267–271. [Google Scholar] [CrossRef]
- Kuleff, I.; Djingova, R. Provenance study of pottery; choice of elements to be determined. ArchéoSciences Rev. d’Archéométrie 1996, 20, 57–67. [Google Scholar] [CrossRef]
- Pagespetit, A.B. La Ceràmica; Diputació de Girona/Caixa de Girona: Olot, Spain, 1993; Volume 42, ISBN 84-8067-019-3. [Google Scholar]
- Batista, D. La Bisbal crea una marca de denominación de origen para proteger sus productos cerámicos. Expansión.com, 4 April 2012. [Google Scholar]
- Pairolí, M. Quart: Natura, Història i Artesania; Ajuntament de Quart: Girona, Spain, 1998; ISBN 84-923701-1-4. [Google Scholar]
- Nayak, P.S.; Singh, B.K. Instrumental characterization of clay by XRF, XRD and FTIR. Bull. Mater. Sci. 2007, 30, 235–238. [Google Scholar] [CrossRef] [Green Version]
- Zhou, X.; Liu, D.; Bu, H.; Deng, L.; Liu, H.; Yuan, P.; Du, P.; Song, H. XRD-based quantitative analysis of clay minerals using reference intensity ratios, mineral intensity factors, Rietveld, and full pattern summation methods: A critical review. Solid Earth Sci. 2018, 3, 16–29. [Google Scholar] [CrossRef]
- Sanjurjo-Sánchez, J.; Montero Fenollós, J.L.; Barrientos, V.; Polymeris, G.S. Assessing the firing temperature of Uruk pottery in the Middle Euphrates Valley (Syria): Bevelled rim bowls. Microchem. J. 2018, 142, 43–53. [Google Scholar] [CrossRef]
- Morgan, D.J. Thermal analysis—including evolved gas analysis—of clay raw materials. Appl. Clay Sci. 1993, 8, 81–89. [Google Scholar] [CrossRef]
- Aitchison, J. The Statistical Analysis of Compositional Data; Blackburn Press: Caldwell, NJ, USA, 2003. [Google Scholar]
- Panchuk, V.; Yaroshenko, I.; Legin, A.; Semenov, V.; Kirsanov, D. Application of chemometric methods to XRF-data–A tutorial review. Anal. Chim. Acta 2018, 1040, 19–32. [Google Scholar] [CrossRef]
- Baxter, M.J. A review of supervised and unsupervised pattern recognition in archaeometry. Archaeometry 2006, 48, 671–694. [Google Scholar] [CrossRef]
- Munita, C.S.; Paiva, R.P.; Alves, M.A.; de Oliveira, P.M.S.; Momose, E.F. Provenance Study of Archaeological Ceramic. J. Trace Microprobe Technol. 2003, 21, 697–706. [Google Scholar] [CrossRef]
- Scarpelli, R.; Robustelli, G.; Clark, R.J.H.; De Francesco, A.M. Scientific investigations on the provenance of the black glazed pottery from Pompeii: A case study. Mediterr. Archaeol. Archaeom. 2017, 17, 1–10. [Google Scholar]
- Buxeda, I.; Garrigós, J.; Cau Ontiveros, M.A.; Kilikoglou, V. Chemical Variability in Clays and Pottery from a Traditional Cooking Pot Production Village: Testing Assumptions in Pereruela*. Archaeometry 2003, 45, 1–17. [Google Scholar] [CrossRef] [Green Version]
- Boleda Cases, R. La Ceràmica Negra de Verdú. Cantirers i Terrissaires; Grup de Recerques de les Terres de Ponent: Verdú, Spain, 2014; ISBN 9788461685875. [Google Scholar]
- Rocas, X.; Roqué, C. Terres i terreres: la matèria primera de la indústria ceràmica bisbalenca. Estud. del Baix Empordà 2015, 34, 13–53. [Google Scholar]
- Coll i Castanyer, J. Breda Històrica i Actual; Montblanc: Granollers, Spain, 1971. [Google Scholar]
- Marguí, E.; Queralt, I.; Van Grieken, R. Sample Preparation for X-Ray Fluorescence Analysis. In Encyclopedia of Analytical Chemistry; Wiley: New York, NY, USA, 2016; pp. 1–25. ISBN 9780470027318. [Google Scholar]
- Bell, S.; Croson, C. Artificial neural networks as a tool for archaeological data analysis. Archaeometry 1998, 40, 139–151. [Google Scholar] [CrossRef]
- Oonk, S.; Spijker, J. A supervised machine-learning approach towards geochemical predictive modelling in archaeology. J. Archaeol. Sci. 2015, 59, 80–88. [Google Scholar] [CrossRef]
- Barone, G.; Mazzoleni, P.; Spagnolo, G.V.; Raneri, S. Artificial neural network for the provenance study of archaeological ceramics using clay sediment database. J. Cult. Herit. 2019, 38, 147–157. [Google Scholar] [CrossRef]
- Charalambous, E.; Dikomitou-Eliadou, M.; Milis, G.M.; Mitsis, G.; Eliades, D.G. An experimental design for the classification of archaeological ceramic data from Cyprus, and the tracing of inter-class relationships. J. Archaeol. Sci. Rep. 2016, 7, 465–471. [Google Scholar] [CrossRef]
- Wilson, A.L. Elemental analysis of pottery in the study of its provenance: A review. J. Archaeol. Sci. 1978, 5, 219–236. [Google Scholar] [CrossRef]
- Zhu, J.; Shan, J.; Qiu, P.; Qin, Y.; Wang, C.; He, D.; Sun, B.; Tong, P.; Wu, S. The multivariate statistical analysis and XRD analysis of pottery at Xigongqiao site. J. Archaeol. Sci. 2004, 31, 1685–1691. [Google Scholar] [CrossRef]
- Kanungo, T.; Mount, D.M.; Netanyahu, N.S.; Piatko, C.D.; Silverman, R.; Wu, A.Y. An efficient k-means clustering algorithm: Analysis and implementation. IEEE Trans. Pattern Anal. Mach. Intell. 2002, 24, 881–892. [Google Scholar] [CrossRef]
- Usuelli, M. R Machine Learning Essentials; Packt Publishing: Birmingham, UK, 2014; ISBN 178398774X. [Google Scholar]
- Stehman, S.V. Selecting and interpreting measures of thematic classification accuracy. Remote Sens. Environ. 1997, 62, 77–89. [Google Scholar] [CrossRef]
- Hechenbichler, K.; Schliep, K. Weighted k-Nearest-Neighbor Techniques and Ordinal Classification. Sonderforschungsbereich 2004, 386, 1–16. [Google Scholar]
- Barandiaran, I. The random subspace method for constructing decision forests. IEEE Trans. Pattern Anal. Mach. Intell. 1998, 20, 832–844. [Google Scholar]
- Breiman, L. Random Forests. Mach. Learn. 2001, 45, 5–32. [Google Scholar] [CrossRef] [Green Version]
- Basheer, I.; Hajmeer, M.N. Artificial Neural Networks: Fundamentals, Computing, Design, and Application. J. Microbiol. Methods 2001, 43, 3–31. [Google Scholar] [CrossRef]
- Tharwat, A.; Gaber, T.; Ibrahim, A.; Hassanien, A.E. Linear discriminant analysis: A detailed tutorial. Ai Commun. 2017, 30, 169–190. [Google Scholar] [CrossRef] [Green Version]
- Kassambara, A. Machine Learning Essentials: Practical Guide in R.; STHDA: Marseille, France, 2018. [Google Scholar]
- McCullagh, P.; Nelder, J.A. Generalized Linear Models, 2nd ed.; Chapman & Hall/CRC: London, UK, 1989; ISBN 9780412317606. [Google Scholar]
- Friedman, J.; Hastie, T.; Tibshirani, R. Regularization Paths for Generalized Linear Models via Coordinate Descent. J. Stat. Softw. 2010, 33, 1–22. [Google Scholar] [CrossRef] [Green Version]
- Džeroski, S.; Ženko, B. Is Combining Classifiers with Stacking Better than Selecting the Best One? Mach. Learn. 2004, 54, 255–273. [Google Scholar] [CrossRef] [Green Version]
- Angourakis, A.; Martínez Ferreras, V.; Torrano, A.; Gurt Esparraguera, J.M. Presenting multivariate statistical protocols in R using Roman wine amphorae productions in Catalonia, Spain. J. Archaeol. Sci. 2018, 93, 150–165. [Google Scholar] [CrossRef]
- Schmidt, J.; Marques, M.R.G.; Botti, S.; Marques, M.A.L. Recent advances and applications of machine learning in solid-state materials science. npj Comput. Mater. 2019, 5, 83. [Google Scholar] [CrossRef]
- Zhang, Y.; Ling, C. A strategy to apply machine learning to small datasets in materials science. npj Comput. Mater. 2018, 4, 25. [Google Scholar] [CrossRef] [Green Version]
Figure 1.
The selected traditional pottery centers (red dots) located around Barcelona (black dot).

Figure 2.
Geographical maps (top) and geological maps (bottom) of the sampling sites (red dots) around the studied pottery centers; scale is the same for all the maps. The concentric ring in the northern sampled site in Esparreguera indicates the sampled fault flour site.
Figure 2.
Geographical maps (top) and geological maps (bottom) of the sampling sites (red dots) around the studied pottery centers; scale is the same for all the maps. The concentric ring in the northern sampled site in Esparreguera indicates the sampled fault flour site.

Figure 3.
(a) Petrographic thin sections of three pottery samples, textural features of SJ22 (Sant Julià) and Br15 (Breda) appear quite similar. (b) Petrographic cross sections for two pottery samples from Quart exhibiting very different gran size. (c) XRD patters from several clay (Q04, Br08 and Br07) and pottery (V28 and V31) samples with indication of the main phases: Ms: muscovite-type, Kln: kaolinite-type, Qtz: quartz, Cal: calcite, Gh: ghelenite, Di: diopside.

Figure 4.
PCA biplot of factor scores for the first two principal components for all the processed samples. Inset: PCA biplot of the most relevant variables.
Figure 4.
PCA biplot of factor scores for the first two principal components for all the processed samples. Inset: PCA biplot of the most relevant variables.

Figure 5.
3D scatter plot using the three main LDA linear discriminants.

Figure 6.
Boxplot with the accuracy variation for each model using different splits.


Table 1.
Summary of the retrieved and analyzed samples.
| Village | Clays | Pottery Shards | Ceramic Briquettes | Total Samples |
|---|---|---|---|---|
| Esparreguera | 10 | 18 | 5 * | 33 |
| Bisbal | 17 | 15 | 4 | 36 |
| Quart | 11 | 19 | 3 | 33 |
| Breda | 11 | 18 | 4 | 33 |
| Verdú | 23 | 9 | 5 | 37 |
| Sant Julià | 8 | 22 | 6 | 36 |
| 208 | ||||
* 2 briquettes were produced using samples of fault flour.
Table 2.
Arithmetic means (m) and standard deviations (σ) of the chemical composition for the samples (clay, pottery and briquettes samples merged) from every investigated location.
Table 2.
Arithmetic means (m) and standard deviations (σ) of the chemical composition for the samples (clay, pottery and briquettes samples merged) from every investigated location.
| Compound | Village | |||||||||||
|---|---|---|---|---|---|---|---|---|---|---|---|---|
| Esparreguera | La Bisbal | Quart | Breda | Verdú | Sant Julià | |||||||
| m | σ | m | σ | m | σ | m | σ | m | σ | m | σ | |
| SiO2 (%) | 56.4 | 5.1 | 57.4 | 8.2 | 67.6 | 4.3 | 69.9 | 2.6 | 48.2 | 6.2 | 66.5 | 3.7 |
| Al2O3 (%) | 11.5 | 1.9 | 11.5 | 1.9 | 13.1 | 1.2 | 12.5 | 0.9 | 9.9 | 1.4 | 12.3 | 1.1 |
| Fe2O3 (%) | 8.6 | 1.7 | 8.1 | 1.5 | 8.6 | 1.9 | 8.3 | 1.5 | 9.2 | 1.7 | 8.5 | 1.7 |
| MgO (%) | 4.1 | 1.9 | 1.8 | 0.4 | 1.2 | 0.4 | 1.4 | 0.3 | 3.5 | 0.7 | 1.7 | 0.3 |
| CaO (%) | 11.9 | 7.2 | 14.6 | 10.9 | 2.0 | 3.2 | 0.8 | 0.2 | 22.6 | 9.8 | 3.1 | 4.2 |
| Na2O (%) | 0.5 | 0.2 | 0.4 | 0.2 | 0.5 | 0.2 | 0.5 | 0.2 | 0.5 | 0.1 | 0.6 | 0.2 |
| K2O (%) | 4.2 | 0.8 | 4.2 | 0.6 | 4.7 | 0.2 | 4.5 | 0.5 | 4.1 | 0.9 | 5.1 | 0.5 |
| TiO2 (%) | 1.3 | 0.2 | 1.4 | 0.2 | 1.5 | 0.3 | 1.5 | 0.2 | 1.2 | 0.1 | 1.2 | 0.2 |
| SO3 (%) | 0.5 | 0.7 | 0.1 | 0.2 | 0.1 | 0.2 | 0.0 | 0.0 | 0.1 | 0.1 | 0.1 | 0.1 |
| Cl (%) | 0.3 | 0.6 | 0.1 | 0.1 | 0.1 | 0.1 | 0.1 | 0.1 | 0.1 | 0.1 | 0.2 | 0.4 |
| Mn (ppm) | 386 | 55 | 372 | 171 | 335 | 71 | 259 | 58 | 352 | 39 | 314 | 54 |
| Cr (ppm) | 283 | 138 | 232 | 138 | 223 | 107 | 242 | 75 | 252 | 96 | 273 | 123 |
| Ni (ppm) | 53 | 53 | 46 | 51 | 44 | 29 | 36 | 24 | 33 | 37 | 52 | 45 |
| Cu (ppm) | 89 | 50 | 69 | 50 | 66 | 49 | 51 | 33 | 85 | 42 | 80 | 61 |
| Zn (ppm) | 189 | 87 | 164 | 67 | 157 | 74 | 168 | 108 | 200 | 64 | 161 | 95 |
| Rb (ppm) | 271 | 63 | 278 | 45 | 373 | 37 | 303 | 35 | 272 | 56 | 331 | 36 |
| Sr (ppm) | 233 | 84 | 320 | 188 | 133 | 74 | 122 | 26 | 479 | 125 | 183 | 53 |
| Y2 (ppm) | 30 | 14 | 39 | 19 | 54 | 18 | 45 | 12 | 29 | 13 | 37 | 17 |
| Zr (ppm) | 520 | 99 | 572 | 195 | 546 | 151 | 701 | 129 | 349 | 151 | 526 | 78 |
| Nb (ppm) | 20 | 10 | 22 | 19 | 34 | 13 | 24 | 11 | 17 | 10 | 23 | 9 |
| Pb (ppm) | 810 | 1431 | 369 | 566 | 145 | 136 | 719 | 678 | 67 | 38 | 877 | 1055 |
Table 3.
HCA cluster prediction (cutting the dendrogram to produce six clusters).
| Predicted Class | Actual Class | Samples within the Predicted Class | |||||
|---|---|---|---|---|---|---|---|
| Esparreguera | Bisbal | Quart | Breda | Verdú | Sant Julià | ||
| X1 | 18 | 11 | 1 | 0 | 26 | 0 | 56 |
| X2 | 7 | 9 | 1 | 0 | 1 | 3 | 21 |
| X3 | 7 | 9 | 25 | 25 | 0 | 29 | 95 |
| X4 | 0 | 2 | 6 | 8 | 0 | 4 | 20 |
| X5 | 0 | 2 | 0 | 0 | 6 | 0 | 8 |
| X6 | 1 | 3 | 0 | 0 | 4 | 0 | 8 |
Table 4.
K-means cluster prediction (setting six clusters).
| Predicted Class | Actual Class | Samples within the Predicted Class | |||||
|---|---|---|---|---|---|---|---|
| Esparreguera | Bisbal | Quart | Breda | Verdú | Sant Julià | ||
| X1 | 8 | 10 | 1 | 0 | 1 | 2 | 22 |
| X2 | 0 | 1 | 5 | 6 | 0 | 4 | 16 |
| X3 | 0 | 1 | 17 | 24 | 0 | 12 | 54 |
| X4 | 0 | 3 | 0 | 0 | 10 | 0 | 13 |
| X5 | 7 | 9 | 9 | 3 | 0 | 18 | 46 |
| X6 | 18 | 12 | 1 | 0 | 26 | 0 | 57 |
Table 5.
PCA coefficients for the two main principal components.
| PC1 (93.69%) | PC2 (3.94%) | |
|---|---|---|
| SiO2 | −0.9863 | −0.0511 |
| Al2O3 | −0.1321 | 0.5063 |
| Fe2O3 | 0.0145 | 0.8187 |
| MgO | 0.0883 | 0.1522 |
| Na2O | −0.0027 | −0.0083 |
| K2O | −0.0398 | 0.2118 |
| TiO2 | −0.0082 | 0.0512 |
| Cl | 0.0036 | −0.0017 |
| MnO | 0.0004 | 0.0014 |
| Cr2O3 | −0.0001 | 0.0037 |
| NiO | −0.0001 | 0.0006 |
| CuO | 0.0001 | 0.0002 |
| ZnO | 0.0001 | 0.0020 |
| Rb2O | −0.0004 | 0.0018 |
| SrO | 0.0017 | −0.0001 |
| Y2O3 | −0.0001 | 0.0002 |
| ZrO2 | −0.0014 | −0.0023 |
| Nb2O5 | −0.0001 | 0.0003 |
Table 6.
LDA coefficients for the four main linear discriminants.
| Compound | Linear Discriminants | |||
|---|---|---|---|---|
| LD1 | LD2 | LD3 | LD4 | |
| SiO2 | −1.190 | 1.210 | 0.467 | −0.635 |
| Al2O3 | −0.363 | −0.595 | 0.352 | 0.940 |
| Fe2O3 | 0.299 | 0.329 | −0.302 | −0.038 |
| MgO | 0.764 | 0.678 | 1.216 | −0.081 |
| Na2O | 0.139 | 0.141 | 0.056 | −0.404 |
| K2O | 0.648 | 0.776 | −1.216 | −0.391 |
| TiO2 | 0.300 | −0.202 | 0.262 | 0.202 |
| Cl | −0.295 | 0.113 | 0.127 | 0.079 |
| MnO | 0.071 | −0.160 | 0.338 | 0.315 |
| Cr2O3 | 0.115 | 0.511 | −0.138 | −0.273 |
| NiO | −0.111 | −0.666 | −0.413 | 0.524 |
| CuO | 0.035 | 0.030 | 0.375 | −0.611 |
| ZnO | −0.073 | 0.283 | 0.006 | −0.109 |
| Rb2O | −0.549 | −1.052 | 1.075 | −0.529 |
| SrO | 0.064 | −0.415 | −0.898 | −0.138 |
| Y2O3 | −0.398 | −0.394 | −0.110 | −0.407 |
| ZrO2 | 0.295 | 0.412 | −0.811 | 0.718 |
| Nb2O5 | −0.139 | 0.138 | 0.030 | 0.197 |
Table 7.
Confusion matrix and accuracy for each supervised model (kkNN, RF, ANN, LDA and Glmnet).
| kkNN-Based Provenance Classification | ||||||
| Actual class | Predicted class | |||||
| Esparreguera | Bisbal | Quart | Breda | Verdú | Sant Julià | |
| Esparreguera | 5 | 0 | 0 | 0 | 1 | 1 |
| Bisbal | 1 | 7 | 0 | 0 | 1 | 0 |
| Quart | 0 | 0 | 2 | 2 | 0 | 0 |
| Breda | 0 | 0 | 1 | 5 | 0 | 0 |
| Verdú | 0 | 0 | 0 | 0 | 8 | 0 |
| Sant Julià | 0 | 0 | 0 | 0 | 0 | 8 |
| Accuracy 83.3% | ||||||
| RF-based provenance classification | ||||||
| Actual class | Predicted class | |||||
| Esparreguera | Bisbal | Quart | Breda | Verdú | Sant Julià | |
| Esparreguera | 4 | 0 | 0 | 0 | 2 | 1 |
| Bisbal | 0 | 9 | 0 | 0 | 0 | 0 |
| Quart | 0 | 0 | 4 | 0 | 0 | 0 |
| Breda | 0 | 0 | 1 | 5 | 0 | 0 |
| Verdú | 0 | 0 | 0 | 0 | 8 | 0 |
| Sant Julià | 0 | 1 | 0 | 0 | 0 | 7 |
| Accuracy 88.1% | ||||||
| ANN-based provenance classification | ||||||
| Actual class | Predicted class | |||||
| Esparreguera | Bisbal | Quart | Breda | Verdú | Sant Julià | |
| Esparreguera | 6 | 0 | 0 | 0 | 1 | 0 |
| Bisbal | 0 | 6 | 1 | 1 | 1 | 0 |
| Quart | 0 | 0 | 4 | 0 | 0 | 0 |
| Breda | 1 | 1 | 0 | 4 | 0 | 0 |
| Verdú | 1 | 1 | 0 | 0 | 6 | 0 |
| Sant Julià | 0 | 0 | 0 | 0 | 0 | 8 |
| Accuracy 81.0% | ||||||
| LDA-based provenance classification | ||||||
| Actual class | Predicted class | |||||
| Esparreguera | Bisbal | Quart | Breda | Verdú | Sant Julià | |
| Esparreguera | 3 | 0 | 0 | 0 | 2 | 2 |
| Bisbal | 0 | 7 | 0 | 1 | 0 | 1 |
| Quart | 0 | 0 | 4 | 0 | 0 | 0 |
| Breda | 0 | 0 | 0 | 6 | 0 | 0 |
| Verdú | 0 | 1 | 0 | 0 | 7 | 0 |
| Sant Julià | 0 | 0 | 0 | 0 | 0 | 8 |
| Accuracy 83.3% | ||||||
| Glmnet-based provenance classification | ||||||
| Actual class | Predicted class | |||||
| Esparreguera | Bisbal | Quart | Breda | Verdú | Sant Julià | |
| Esparreguera | 5 | 0 | 0 | 0 | 2 | 0 |
| Bisbal | 0 | 7 | 1 | 1 | 0 | 0 |
| Quart | 0 | 1 | 3 | 0 | 0 | 0 |
| Breda | 0 | 1 | 0 | 5 | 0 | 0 |
| Verdú | 0 | 1 | 0 | 0 | 7 | 0 |
| Sant Julià | 0 | 0 | 0 | 0 | 0 | 8 |
| Accuracy 83.3% | ||||||
Table 8.
Confusion matrix and accuracy for the stack of models.
| Actual Class | Predicted Class | |||||
|---|---|---|---|---|---|---|
| Esparreguera | Bisbal | Quart | Breda | Verdú | Sant Julià | |
| Esparreguera | 4 | 0 | 0 | 0 | 0 | 0 |
| Bisbal | 0 | 9 | 0 | 0 | 0 | 1 |
| Quart | 0 | 0 | 4 | 1 | 0 | 0 |
| Breda | 0 | 0 | 0 | 5 | 0 | 0 |
| Verdú | 2 | 0 | 0 | 0 | 8 | 0 |
| Sant Julià | 1 | 0 | 0 | 0 | 0 | 7 |
| Accuracy 88.1% | ||||||
© 2019 by the authors. Licensee MDPI, Basel, Switzerland. This article is an open access article distributed under the terms and conditions of the Creative Commons Attribution (CC BY) license (http://creativecommons.org/licenses/by/4.0/).
Share and Cite
MDPI and ACS Style
Anglisano, A.; Casas, L.; Anglisano, M.; Queralt, I. Application of Supervised Machine-Learning Methods for Attesting Provenance in Catalan Traditional Pottery Industry. Minerals 2020, 10, 8. https://doi.org/10.3390/min10010008
AMA Style
Anglisano A, Casas L, Anglisano M, Queralt I. Application of Supervised Machine-Learning Methods for Attesting Provenance in Catalan Traditional Pottery Industry. Minerals. 2020; 10(1):8. https://doi.org/10.3390/min10010008
Chicago/Turabian StyleAnglisano, Anna, Lluís Casas, Marc Anglisano, and Ignasi Queralt. 2020. "Application of Supervised Machine-Learning Methods for Attesting Provenance in Catalan Traditional Pottery Industry" Minerals 10, no. 1: 8. https://doi.org/10.3390/min10010008
Note that from the first issue of 2016, this journal uses article numbers instead of page numbers. See further details here.