Geological Prospection of Placer Chromium Deposits in the Waropen Regency—Indonesia (New Guinea) Using the Method of Indicator Minerals


Abstract
:1. Introduction
2. Materials and Methods
3. The Geological Structure of the Area
4. Results of Analyses
4.1. Mineralogy and Geochemistry of the Beach Sediments
4.2. Mineralogy and Geochemistry of Alluvial Sediments from Botawa River
4.3. Indicator Minerals
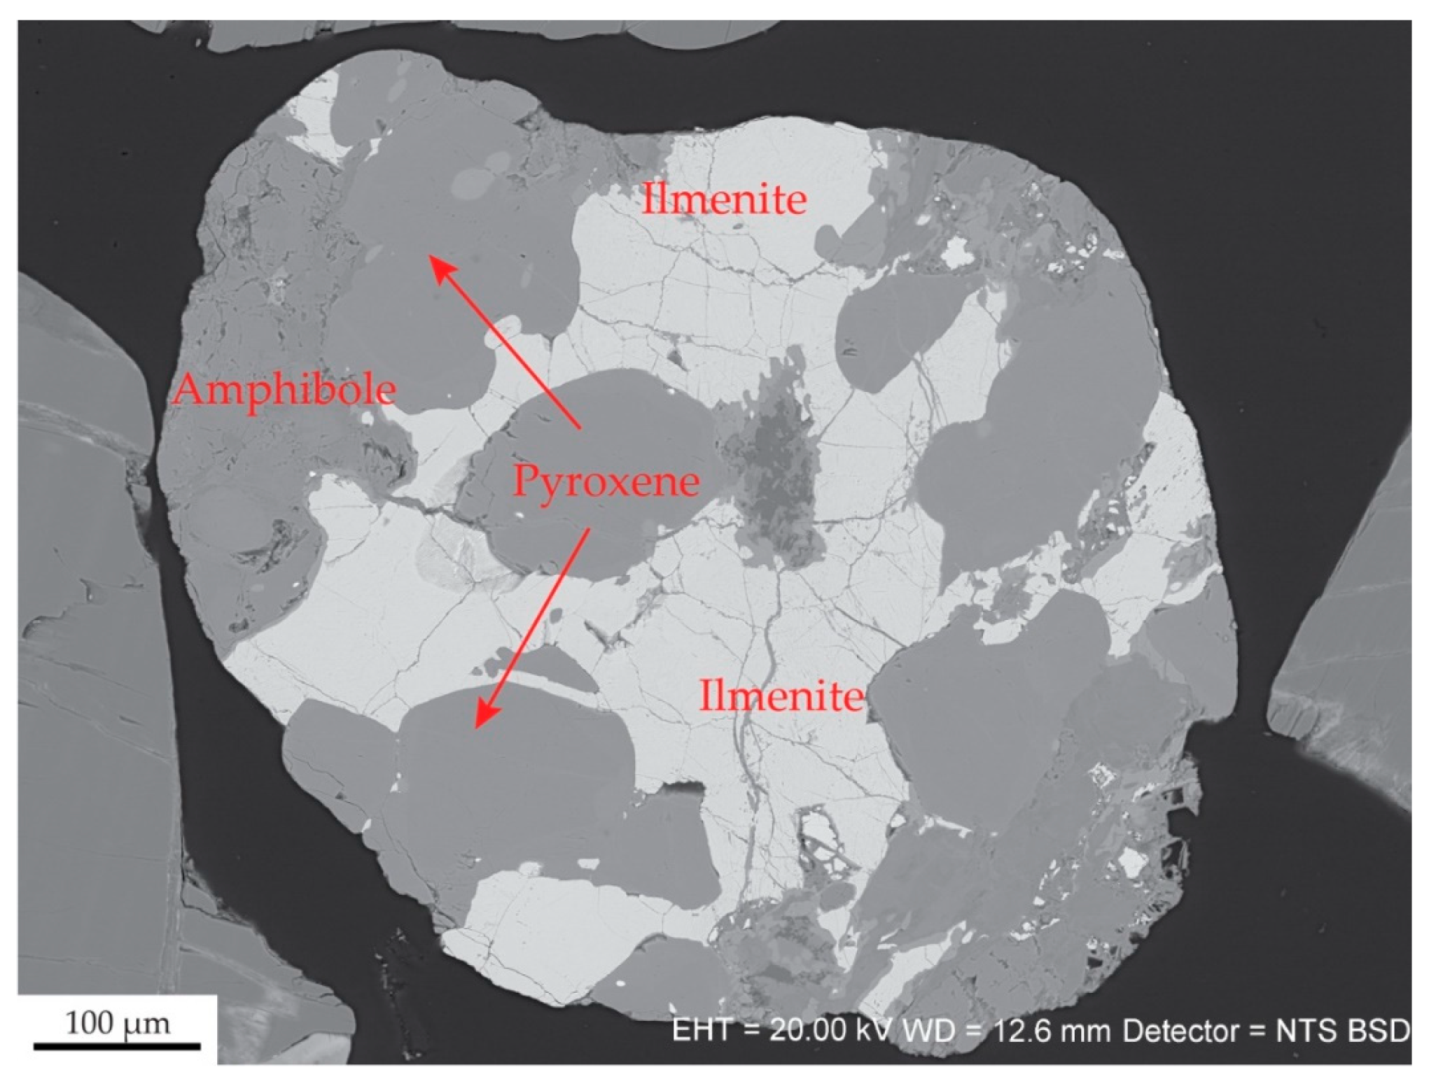
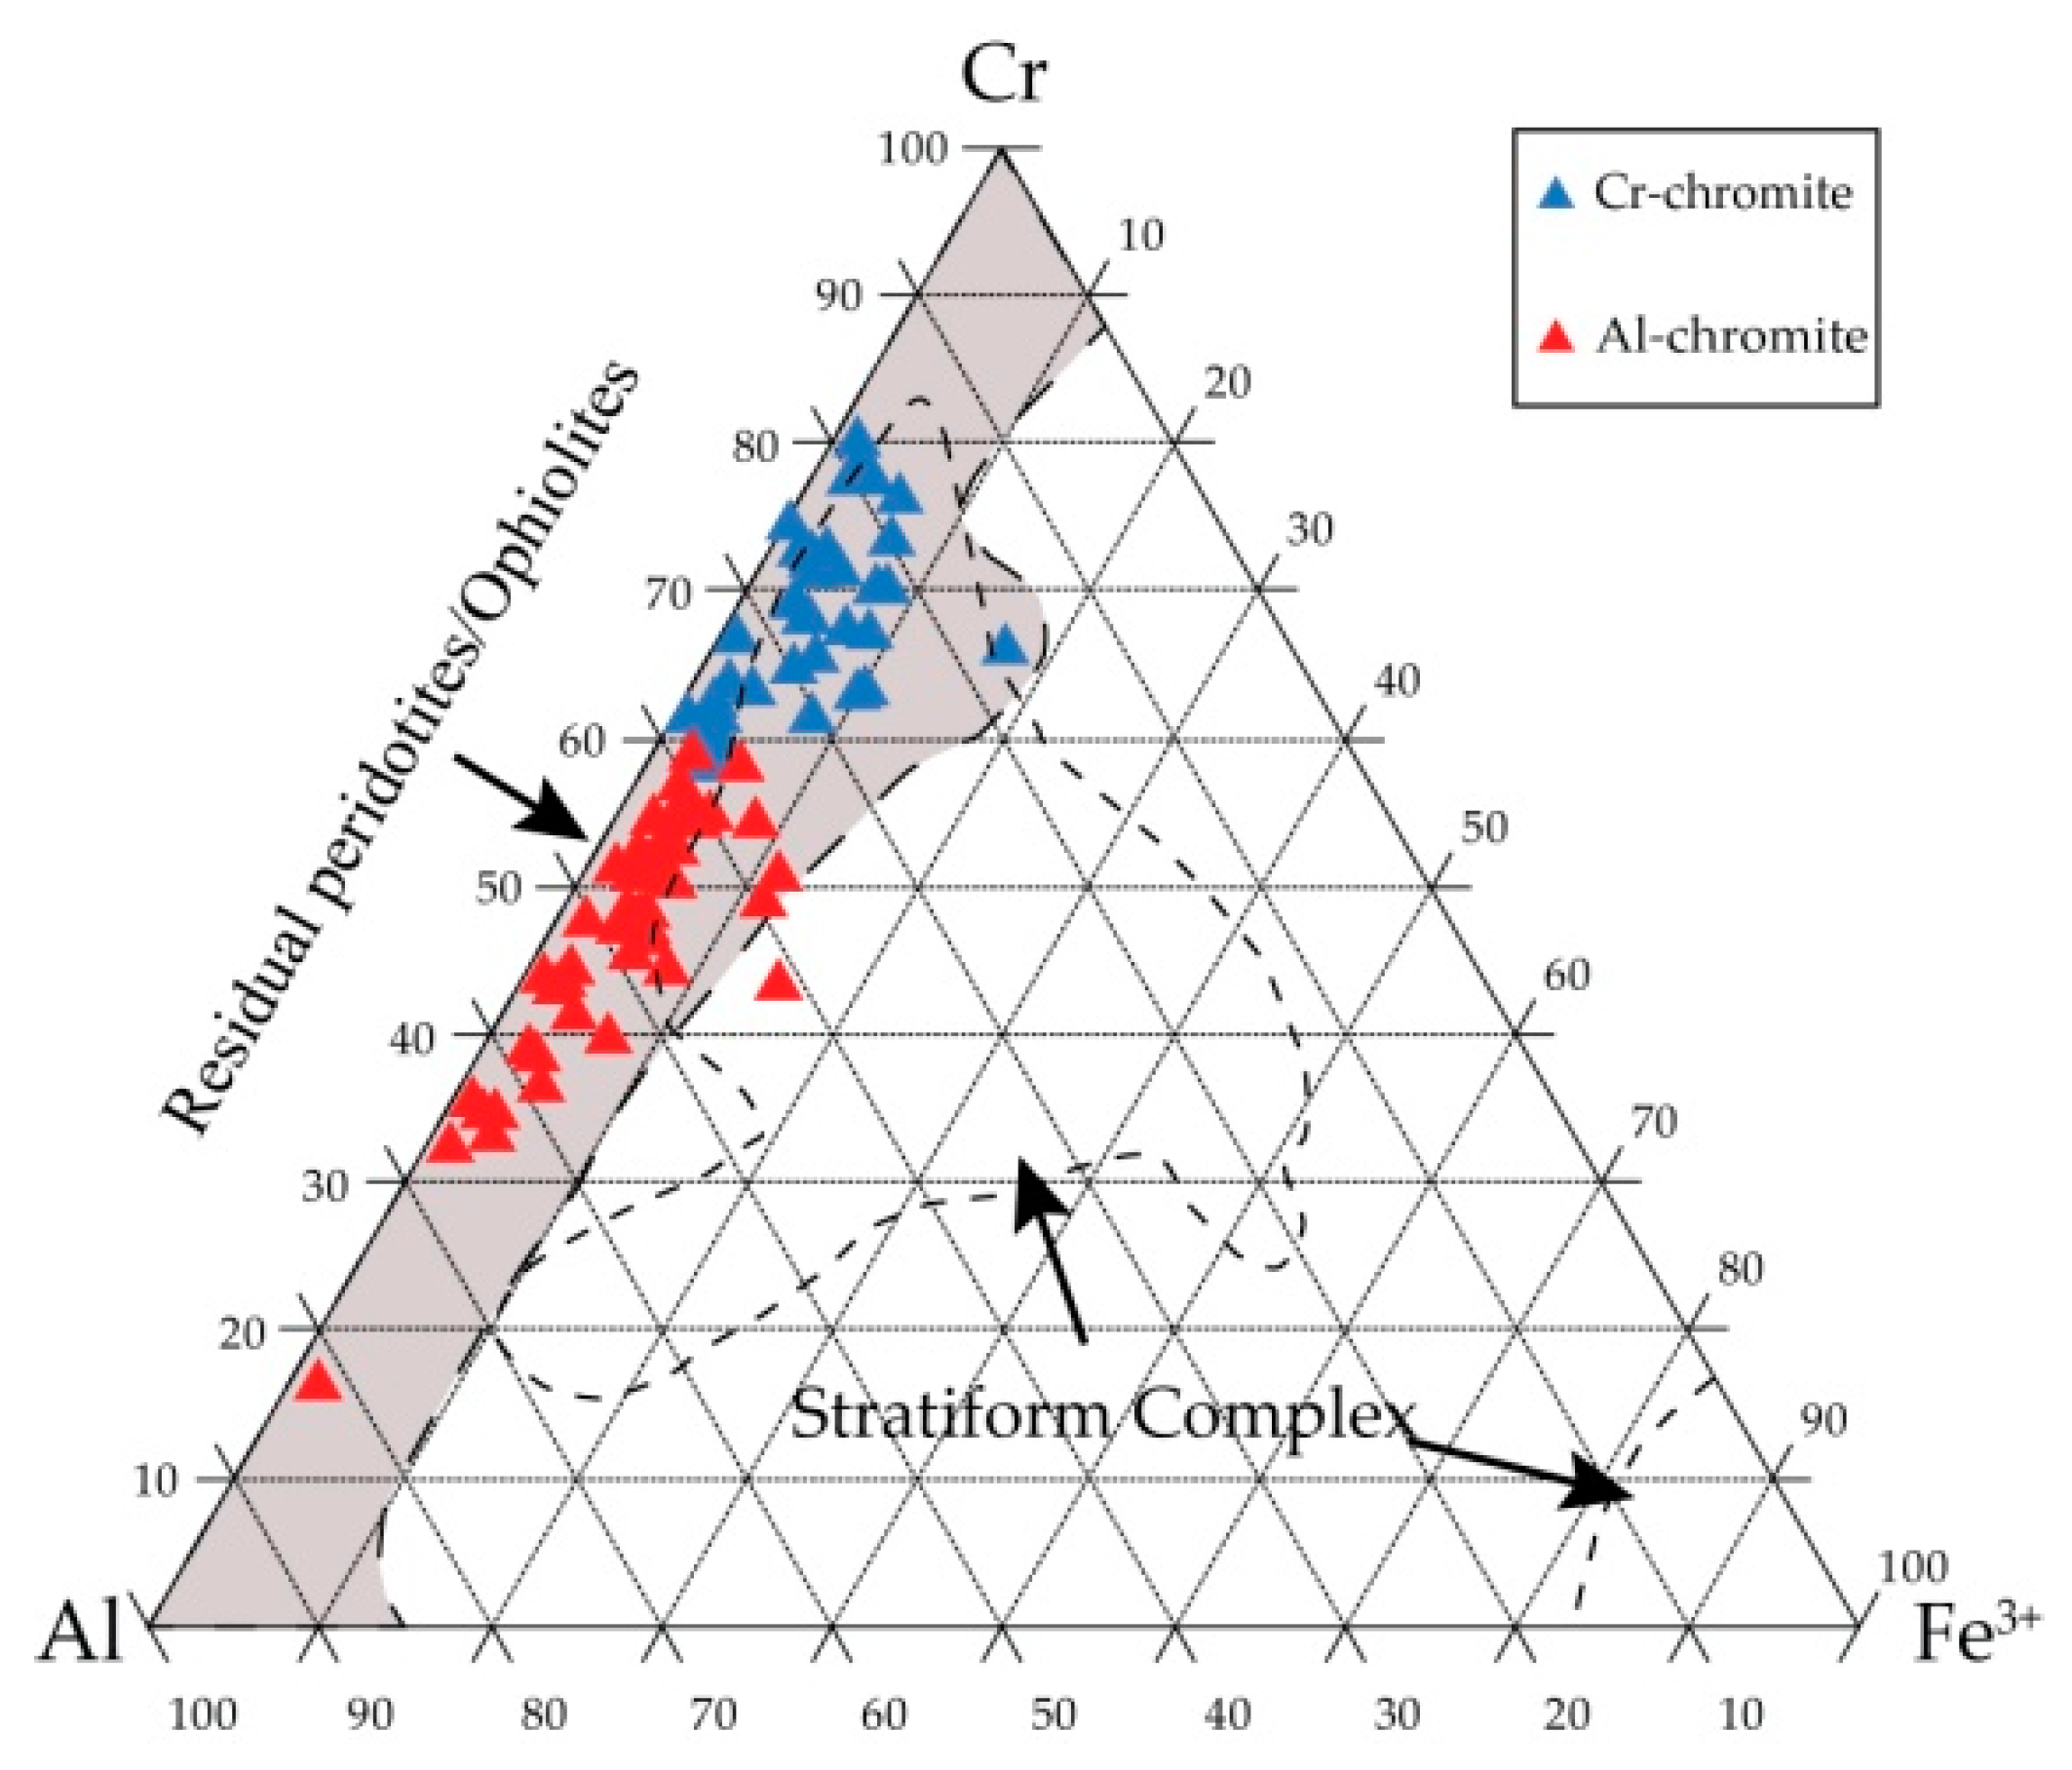
4.3.1. Chromian Spinel
4.3.2. Olivine
4.3.3. Ortho- and Clinopyroxenes
5. Discussion
5.1. Provenance Area
5.2. Source of Indicator Minerals
5.3. Parental Magma
5.4. Further Exploration and Research Destination
6. Conclusions
Author Contributions
Funding
Acknowledgments
Conflicts of Interest
References
- McClenaghan, M.B.; Plouffe, A.; Paulen, R.C.; Houlé, M.; Jackson, S.E.; Peter, J.M. Overview of Indicator Mineral Research at the Geological Survey of Canada—An Update. Explore 2016, 170, 4–15. [Google Scholar]
- McClenaghan, M.B. Indicator Mineral Methods in Mineral Exploration. Geochem. Explor. Environ. Anal. 2005, 5, 233–245. [Google Scholar] [CrossRef] [Green Version]
- Morton, A.C.; Hallsworth, C. Stability of Detrital Heavy Minerals During Burial Diagenesis. In Developments in Sedimentology; Mange, M.A., Wright, D.T., Eds.; Elsevier Science: Amsterdam, The Netherlands, 2007; Volume 58, pp. 215–240. [Google Scholar] [CrossRef]
- Pisiak, L.K.; Canil, D.; Lacourse, T.; Plouffe, A.; Ferbey, T. Magnetite as an Indicator Mineral in the Exploration of Porphyry Deposits: A Case Study in Till Near the Mount Polley Cu-Au Deposit, British Columbia, Canada. Econ. Geol. 2017. [Google Scholar] [CrossRef] [Green Version]
- Cooke, D.R.; Agnew, P.; Hollings, P.; Baker, M.; Chang, Z.; Wilkinson, J.J.; White, N.C.; Zhang, L.; Thompson, J.; Fox, N.; et al. Porphyry Indicator Minerals (PIMS) and Porphyry Vectoring and Fertility Tools (PVFTS)-Indicators of Mineralization Styles and Recorders of Hypogene Geochemical Dispersion Halos. In Proceedings of the Exploration 17, Sixth Decennial International Conference on Mineral Exploration, Toronto, Canada, 27 July 2017; pp. 457–470. [Google Scholar]
- Savel’Eva, G.N.; Batanova, V.G.; Sobolev, A.V.; Kuz’Min, D.V. Minerals of Mantle Peridotites: Indicators of Chromium Ores in Ophiolites. Dokl. Earth Sci. 2013, 452, 963–966. [Google Scholar] [CrossRef]
- McClenaghan, M.B.; Cabri, L.J. Review of Gold and Platinum Group Element (PGE) Indicator Minerals Methods for Surficial Sediment Sampling. Geochem. Explor. Environ. Anal. 2011, 11, 251–263. [Google Scholar] [CrossRef]
- Zhmodik, S.M.; Nesterenko, G.V.; Airiyants, E.V.; Belyanin, D.K.; Kolpakov, V.V.; Podlipsky, M.Y.; Karmanov, N.S. Alluvial Platinum-Group Minerals as Indicators of Primary PGE Mineralization (Placers of Southern Siberia). Russ. Geol. Geophys. 2016, 50, 524–534. [Google Scholar] [CrossRef]
- Stendal, H.; Theobald, P.K. Heavy-Mineral Concentrates in Geochemical Exploration. In Handbook of Exploration Geochemistry; Hale, M., Plant, J.A., Eds.; Elsevier Science: Amsterdam, The Netherlands, 1994; Volume 6, pp. 185–225. [Google Scholar] [CrossRef]
- Gurney, J.J. A Correlation between Garnets and Diamonds in Kimberlites. In Kimberlite Occurrence and Origin: A Basis for Conceptual Models in Exploration 8; Geology Department and University Extension, University of Western Australia: Perth, Australia, 1984; pp. 143–166. [Google Scholar]
- Zozulya, D.R.; Peltonen, P.; O’Brien, H. Pyrope and Cr-Diopside as Indicators of Mantle Structure and Diamond Depth Facies in the Kola Region. Geol. Ore Depos. 2008, 50, 524–534. [Google Scholar] [CrossRef]
- Plant, J.A.; Hale, M.; Ridgeway, J. Regional Geochemistry Based on Stream Sediment Sampling. In Exploration 87 Proceeding AEG symp; Ontario Geological Survey: Toronto, ON, Canada, 1989; Volume 3, pp. 384–404. [Google Scholar]
- Hall, R. Indonesia, Geology. In Encyclopedia of Islands; Gillespie, R.C.D., Clauge, D., Eds.; University of California Press: Berkeley, CA, USA, 2009; pp. 454–460. [Google Scholar]
- Katili, J.A. Volcanism and Plate Tectonics in the Indonesian Island Arcs. Tectonophysics 1975, 26, 165–188. [Google Scholar] [CrossRef]
- Ernowo, O.P. Review of Chromite Deposits of Indonesia. Bul. Sumber Daya Geol. 2010, 5, 10–19. [Google Scholar]
- Stowe, C.W.S. Compositions and tectonic settings of chromite deposits through time. Econ. Geol. 1994, 89, 528–546. [Google Scholar] [CrossRef]
- Cameron, E.N. Evolution of the lower critical zone, central sector, eastern bushveld complex and its chromite deposits. Econ. Geol. 1980, 75, 845–871. [Google Scholar] [CrossRef]
- Eales, H.V.; Botha, W.J.; Hattingh, P.J.; De Klerk, W.J.; Maier, W.D.; Odgers, A.T.R. The mafic rocks of the Bushveld complex: A review of emplacement and crystallization history and mineralization, in the light of recent data. J. African Earth Sci. 1993, 16, 121–142. [Google Scholar] [CrossRef]
- Alapieti, T.T.; Kujanpaa, J.; Lahtinen, J.J.; Papunen, H. The Kemi stratiform chromitite deposit, northern Finland. Econ. Geol. 1989, 84, 1057–1077. [Google Scholar] [CrossRef]
- Alapieti, T.T.; Filén, B.A.; Lahtinen, J.J.; Lavrov, M.M.; Smolkin, V.F.; Voitsekhovsky, S.N. Early Proterozoic layered intrusions in the northeastern part of the Fennoscandian Shield. Mineral. Petrol. 1990, 42, 1–22. [Google Scholar] [CrossRef]
- Higgins, S.J.; Snyder, G.A.; Mitchell, J.N.; Taylor, L.A.; Sharkov, E.V.; Bogatikov, O.A.; Grokhovskaya, T.L.; Chistyakov, A.V.; Ganin, V.A.; Grinevich, N.G. Petrology of the Early Proterozoic Burakovsky layered intrusion, southern Karelia, Russia: Mineral and whole-rock major-element chemistry. Can. J. Earth Sci. 1997, 34, 390–406. [Google Scholar] [CrossRef]
- Sharkov, E.V.; Bogatikov, O.A.; Grokhovskaya, T.L.; Chistyakov, A.V.; Ganin, V.A.; Grinevich, N.G.; Snyder, G.A.; Taylor, L.A. Petrology and Ni-Cu-Cr-PGE mineralization of the largest mafic pluton in europe: The early proterozoic burakovsky layered intrusion, Karelia, Russia. Int. Geol. Rev. 1995, 37, 509–525. [Google Scholar] [CrossRef]
- Beqiraj, A.; Masi, U.; Violo, M. Geochemical characterization of podiform chromite ores from the ultramafic massif of Bulqiza (Eastern Ophiolitic Belt, Albania) and hints for exploration. Explor. Min. Geol. 2000, 9, 149–156. [Google Scholar] [CrossRef]
- Uysal, I.; Tarkian, M.; Sadiklar, M.B.; Zaccarini, F.; Meisel, T.; Garuti, G.; Heidrich, S. Petrology of Al- and Cr-Rich Ophiolitic Chromitites from the Muǧla, SW Turkey: Implications from composition of chromite, solid inclusions of platinum-group mineral, silicate and base-metal mineral and Os-isotope geochemistry. Contrib. Mineral. Petrol. 2009, 158, 659–674. [Google Scholar] [CrossRef]
- Uysal, I.; Sadiklar, M.B.; Tarkian, M.; Karsli, O.; Aydin, F. Mineralogy and Composition of the Chromitites and their Platinum-Group Minerals from Ortaca (Muǧla-SW Turkey): Evidence for ophiolitic chromitite genesis. Mineral. Petrol. 2005, 83, 219–242. [Google Scholar] [CrossRef]
- Hock, M.; Friedrich, G.; Plüger, W.L.; Wichowski, A. Refractory- and Metallurgical-Type Chromite Ores, Zambales Ophiolite, Luzon, Philippines. Miner. Depos. 1986, 21, 190–199. [Google Scholar] [CrossRef]
- Yumul, G.P.; Balce, G.R.; Dimalanta, C.B.; Datuin, R.T. Distribution, Geochemistry and Mineralization Potentials of Philippine Ophiolite and Ophiolitic Sequences. Ofioliti 1997, 22, 47–56. [Google Scholar]
- Yumul, G.P.; Balce, G.R. Supra-Subduction Zone Ophiolites As Favorable Hosts For Chromitite, Platinum And Massive Sulfide Deposits. J. Southeast. Asian Earth Sci. 1994, 10, 65–79. [Google Scholar] [CrossRef]
- Mosier, D.L.; Singer, D.A.; Moring, B.C.; Galloway, J.P. Podiform Chromite Deposits—Database and Grade and Tonnage Models; U.S. Geological Survey Scientific Investigations Report 5157: Reston, VA, USA, 2012; pp. 1–54. [Google Scholar]
- Allen, J.E. Geological investigation of the chromite deposits of California. Calif. J. Mines Geol. 1941, 37, 101–167. [Google Scholar]
- Pigram, C.J.; Davies, H.L. Terranes and the accretion history of the New Guinea orogen. BMR J. Aust. Geol. Geophys. 1987, 10, 193–211. [Google Scholar]
- Szamałek, K.; Konopka, G.; Zglinicki, K.; Marciniak-Maliszewska, B. New potential source of rare earth elements. Gospod. Surowcami Miner. Miner. Resour. Manag. 2013, 29, 59–76. [Google Scholar] [CrossRef]
- Dow, D.B.; Hartono, U. The Nature of the Crust Underlying Cenderawasih (Geelvink) Bay, Irian Jaya. Proc. 11th Ann. Conv. Indon. Petrol. Assoc. 1982, 203–210. [Google Scholar] [CrossRef]
- McAdoo, R.L.; Haebig, J.C. Tectonic Elements of the North Irian Basin. Proc. 27th Ann. Conv. Indon. Petrol. Assoc. 1999, 545–562. [Google Scholar] [CrossRef]
- Babault, J.; Viaplana-Muzas, M.; Legrand, X.; Van Den Driessche, J.; González-Quijano, M.; Mudd, S.M. Source-to-Sink Constraints on Tectonic and Sedimentary Evolution of the Western Central Range and Cenderawasih Bay (Indonesia). J. Asian Earth Sci. 2018, 156, 265–287. [Google Scholar] [CrossRef] [Green Version]
- Blott, S.J.; Pye, K. Gradistat: A Grain Size Distribution and Statistics Package for the Analysis of Unconsolidated Sediments. Earth Surf. Process. Landforms 2001, 26, 1237–1248. [Google Scholar] [CrossRef]
- Folk, R.L.; Ward, W.C. Brazos River bar [Texas]; a study in the significance of grain size parameters. J. Sediment. Res. 1957, 27, 3–26. [Google Scholar] [CrossRef]
- Hall, R. Cenozoic Geological and Plate Tectonic Evolution of SE Asia and the SW Pacific: Computer-Based Reconstructions, Model and Animations. J. Asian Earth Sci. 2002, 20, 353–434. [Google Scholar] [CrossRef]
- Gaina, C.; Müller, D. Cenozoic Tectonic and Depth/Age Evolution of the Indonesian Gateway and Associated Back-Arc Basins. Earth-Science Rev. 2007, 83, 177–203. [Google Scholar] [CrossRef]
- Baldwin, S.L.; Fitzgerald, P.G.; Webb, L.E. Tectonics of the New Guinea Region. Annu. Rev. Earth Planet. Sci. 2012, 40, 495–520. [Google Scholar] [CrossRef] [Green Version]
- Cullen, A.B.; Pigott, J.D. Post-Jurassic Tectonic Evolution of Papua New Guinea. Tectonophysics 1989, 162, 291–302. [Google Scholar] [CrossRef]
- Jaques, A.L.; Robinson, G.P. The Continent/Island-Arc Collision in Northern Papua New Guinea. BMR J. Aust. Geol. Geophys. 1977, 2, 289–303. [Google Scholar]
- Davies, H.L. The Geology of New Guinea—The Cordilleran Margin of the Australian Continent. Episodes 2012, 35, 87–102. [Google Scholar] [CrossRef]
- Hamilton, W. Tectonics of the Indonesian Region; US Government Printing Office: Washington, DC, USA, 1979. [Google Scholar]
- Monnier, C.; Girardeau, J.; Pubellier, M.; Polvé, M.; Permana, H.; Bellon, H. Petrology and Geochemistry of the Cyclops Ophiolites (Irian Jaya, East Indonesia): Consequences for the Cenozoic Evolution of the North Australian Margin. Mineral. Petrol. 1999, 65, 1–28. [Google Scholar] [CrossRef]
- Cloos, M.; Sapiie, B.; Van Ufford, A.Q.; Weiland, R.J.; Warren, P.Q.; McMahon, T.P. Collisional Delamination in New Guinea: The Geotectonics of Subducting Slab Breakoff. Spec. Pap. Geol. Soc. Am. 2005, 400, 1–51. [Google Scholar] [CrossRef]
- Hill, K.C.; Hall, R. Mesozoic-Cenozoic Evolution of Australia’s New Guinea Margin in a West Pacific Context. In Special Paper of the Geological Society of America; Geological Society of America: Boulder, CO, USA, 2003; Volume 372, pp. 265–290. [Google Scholar] [CrossRef] [Green Version]
- Dickinson, W.R. Forearc Basins. In Tectonics of Sedimentary Basins; Busby, C.J., Ingersoll, R.V., Eds.; Blackwell Science: Oxford, UK, 1995; pp. 221–262. [Google Scholar]
- Arai, S. Chemistry of Chromian Spinel in Volcanic Rocks as a Potential Guide to Magma Chemistry. Mineral. Mag. 1992, 56, 173–184. [Google Scholar] [CrossRef] [Green Version]
- Schulze, D.J. Origins of Chromian and Aluminous Spinel Macrocrysts from Kimberlites in Southern Africa. Can. Mineral. 2001, 39, 361–376. [Google Scholar] [CrossRef] [Green Version]
- Deer, W.A.; Howie, R.A.; Zussman, J. Rock-Forming Minerals. In Volume 2A: Single-Chain Silicates; Geological Society of London: London, UK, 1997; Volume 2A, pp. 198–290. ISBN 1897799853. [Google Scholar]
- Pubellier, M.; Ali, J.; Monnier, C. Cenozoic Plate Interaction of the Australia and Philippine Sea Plates: “Hit-and-Run” Tectonics. Tectonophysics 2003, 363, 181–199. [Google Scholar] [CrossRef]
- Pubellier, M.; Monnier, C.; Maury, R.; Tamayo, R. Plate Kinematics, Origin and Tectonic Emplacement of Supra-Subduction Ophiolites in SE Asia. Tectonophysics 2004, 392, 9–36. [Google Scholar] [CrossRef]
- Zhou, M.F.; Robinson, P.T.; Su, B.X.; Gao, J.F.; Li, J.W.; Yang, J.S.; Malpas, J. Compositions of Chromite, Associated Minerals and Parental Magmas of Podiform Chromite Deposits: The Role of Slab Contamination of Asthenospheric Melts in Suprasubduction Zone Environments. Gondwana Research. 2014, 26, 262–283. [Google Scholar] [CrossRef]
- Dick, H.J.B.; Bullen, T. Chromian Spinel as a Petrogenetic Indicator In Abyssal and Alpine-Type Peridotites and Spatially Associated Lavas. Contrib. Mineral. Petrol. 1984, 86, 54–76. [Google Scholar] [CrossRef]
- Morton, A.C.; Hallsworth, C.R. Processes Controlling the Composition of Heavy Mineral Assemblages in Sandstones. Sediment. Geol. 1999, 124, 3–29. [Google Scholar] [CrossRef]
- Garzanti, E.; Andò, S. Chapter 20 Heavy Mineral Concentration in Modern Sands: Implications for Provenance Interpretation. In Developments in Sedimentology; Mange, M.A., Wright, D.T., Eds.; Elsevier Science: Amsterdam, The Netherlands, 2007; Volume 58, pp. 517–541. [Google Scholar] [CrossRef]
- Komar, P.D. The Entrainment, Transport and Sorting of Heavy Minerals by Waves and Currents. In Developments in Sedimentology; Mange, M.A., Wright, D.T., Eds.; Elsevier Science: Amsterdam, The Netherlands, 2007; Volume 58, pp. 3–44. [Google Scholar] [CrossRef]
- Sevastjanova, I.; Hall, R.; Alderton, D. A Detrital Heavy Mineral Viewpoint on Sediment Provenance and Tropical Weathering in SE Asia. Sediment. Geol. 2012, 280, 179–194. [Google Scholar] [CrossRef]
- Milliman, J.D. Sediment Discharge to the Ocean from Small Mountainous Rivers: The New Guinea Example. Geo-Marine Lett. 1995, 15, 127–133. [Google Scholar] [CrossRef]
- Zglinicki, K. The Geological-Mineralogical Characteristic of the Contemporary Coastal Marine Sediments of Jayapura Regency (Indonesian Part of New Guinea). Ph.D. Thesis, University of Warsaw, Warsaw, Poland, 2016; pp. 1–163. (In Polish). [Google Scholar]
- Kamenetsky, V.S.; Crawford, A.J.; Meffre, S. Factors Controlling Chemistry of Magmatic Spinel: An Empirical Study of Associated Olivine, Cr-Spinel and Melt Inclusions from Primitive Rocks. J. Petrol. 2001, 42, 655–671. [Google Scholar] [CrossRef] [Green Version]
- Pearce, J.A. Supra-Subduction Zone Ophiolites. The Search for Modern Analogue. In Ophiolite Concept and the Evolution of Geologic Thought; Dilek, Y., Newcomb, S., Eds.; Geological Society of America: Boulder, CO, USA, 2003; pp. 269–294. [Google Scholar] [CrossRef]
- Zhou, M.F.; Robinson, P.T.; Malpas, J.; Edwards, S.J.; Qi, L. REE and PGE Geochemical Constraints on the Formation of Dunites in the Luobusa Ophiolite, Southern Tibet. J. Petrol. 2005, 46, 615–639. [Google Scholar] [CrossRef] [Green Version]
- Stevens, R.E. Composition of Some Chromites of the Western Hemisphere. Am. Mineral. 1944, 29, 1–34. [Google Scholar]
- Jan, M.Q.; Windley, B.F. Chromian Spinel-Silicate Chemistry in Ultramafic Rocks of the Jijal Complex, Northwest Pakistan. J. Petrol. 1990, 31, 667–715. [Google Scholar] [CrossRef]
- Pagé, P.; Bédard, J.H.; Schroetter, J.M.; Tremblay, A. Mantle Petrology and Mineralogy of the Thetford Mines Ophiolite Complex. Lithos 2008, 100, 255–292. [Google Scholar] [CrossRef]
- Dickey, J.S. A Hypothesis of Origin for Podiform Chromite Deposits. Geochim. Cosmochim. Acta 1975, 39, 1061–1074. [Google Scholar] [CrossRef]
- Leblanc, M.; Nicolas, A. Ophiolitic Chromitites. Int. Geol. Rev. 1992, 34, 653–686. [Google Scholar] [CrossRef]
- Zhou, M.F.; Robinson, P.T.; Bai, W.J. Formation of Podiform Chromitites by Melt/Rock Interaction in the Upper Mantle. Miner. Depos. 1994, 29, 98–101. [Google Scholar] [CrossRef]
- Zhou, M.F.; Malpas, J.; Robinson, P.T.; Sun, M.; Li, J.W. Crystallization of Podiform Chromitites from Silicate Magmas and the Formation of Nodular Textures. Resour. Geol. 2001, 51, 1–6. [Google Scholar] [CrossRef]
- Gervilla, F.; Proenza, J.A.; Frei, R.; González-Jiménez, J.M.; Garrido, C.J.; Melgarejo, J.C.; Meibom, A.; Díaz-Martínez, R.; Lavaut, W. Distribution of Platinum-Group Elements and Os Isotopes in Chromite Ores from Mayarí-Baracoa Ophiolitic Belt (Eastern Cuba). Contrib. Mineral. Petrol. 2005, 150, 589–607. [Google Scholar] [CrossRef]
- González-Jiménez, J.M.; Griffin, W.L.; Proenza, J.A.; Gervilla, F.; O’Reilly, S.Y.; Akbulut, M.; Pearson, N.J.; Arai, S. Corrigendum to ‘Chromitites in Ophiolites: How, Where, When, Why? Part II. The Crystallisation of Chromitites’. Lithos 2014, 189, 140–158. [Google Scholar] [CrossRef]
- González-Jiménez, J.M.; Proenza, J.A.; Gervilla, F.; Melgarejo, J.C.; Blanco-Moreno, J.A.; Ruiz-Sánchez, R.; Griffin, W.L. High-Cr and High-Al Chromitites from the Sagua de Tánamo District, Mayarí-Cristal Ophiolitic Massif (Eastern Cuba): Constraints on Their Origin from Mineralogy and Geochemistry of Chromian Spinel and Platinum-Group Elements. Lithos 2011, 125, 101–121. [Google Scholar] [CrossRef]
- Pagé, P.; Barnes, S.J. Using Trace Elements in Chromites to Constrain the Origin of Podiform Chromitites in the Thetford Mines Ophiolite, Québec, Canada. Econ. Geol. 2009, 104, 997–1018. [Google Scholar] [CrossRef]
- Arai, S. Compositional Variation of Olivine-Chromian Spinel in Mg-Rich Magmas as a Guide to Their Residual Spinel Peridotites. J. Volcanol. Geotherm. Res. 1994, 59, 303–310. [Google Scholar] [CrossRef]
- Zhou, M.F.; Robinson, P.T.; Malpas, J.; Li, Z. Podiform Chromitites in the Luobusa Ophiolite (Southern Tibet): Implications for Melt-Rock Interaction and Chromite Segregation in the Upper Mantle. J. Petrol. 1996, 37, 3–21. [Google Scholar] [CrossRef] [Green Version]
- Pearce, J.A.; Barker, P.F.; Edwards, S.J.; Parkinson, I.J.; Leat, P.T. Geochemistry and Tectonic Significance of Peridotites from the South Sandwich Arc-Basin System, South Atlantic. Contrib. Mineral. Petrol. 2000, 139, 36–53. [Google Scholar] [CrossRef]
- Zaccarini, F.; Garuti, G.; Proenza, J.A.; Campos, L.; Thalhammer, O.A.R.; Aiglsperger, T.; Lewis, J.F. Chromite and Platinum Group Elements Mineralization in the Santa Elena Ultramafic Nappe (Costa Rica): Geodynamic Implications. Geol. Acta. 2011, 9, 407–423. [Google Scholar] [CrossRef]
- Rollinson, H. The Geochemistry of Mantle Chromitites from the Northern Part of the Oman Ophiolite: Inferred Parental Melt Compositions. Contrib. Mineral. Petrol. 2008, 156, 273–288. [Google Scholar] [CrossRef]
- Maurel, C.; Maurel, P. Etude Experimentale de La Distribution de l’aluminium Entre Bain Silicate Basique et Spinelle Chromifere. Implications Petrogenetiques: Teneur En Chrome Des Spinelles. Bull. Mineral. 1982, 105, 197–202. [Google Scholar] [CrossRef]
- Dönmez, C.; Keskin, S.; Günay, K.; Çolakoğlu, A.O.; Çiftçi, Y.; Uysal, İ.; Türkel, A.; Yıldırım, N. Chromite and PGE geochemistry of the Elekdağ Ophiolite (Kastamonu, Northern Turkey): Implications for deep magmatic processes in a supra-subduction zone setting. Ore Geol. Rev. 2014, 57, 216–228. [Google Scholar] [CrossRef]
- Hall, R. The Plate Tectonics of Cenozoic SE Asia and the Distribution of Land and Sea. In Biogeogr. Geol. Evol. SE Asia; Hall, R., Holloway, J.D., Eds.; Backhuys Publishers: Leiden, The Netherlands, 1998; pp. 99–131. [Google Scholar]


| Element | Standard | Analytical Line | Crystal | Detection Limit in wt% | σ (wt%) |
|---|---|---|---|---|---|
| Si | Diopside | Kα | TAP | 0.03 | 0.00–0.02 |
| Ti | Rutile | Kα | LPET | 0.02–0.03 | 0.02 |
| Al | Orthoclase | Kα | TAP | 0.03 | 0.12–0.30 |
| Fe | Fe2O3 | Kα | LIF | 0.10–0.12 | 0.40–0.48 |
| V | V2O5 | Kα | LIF | 0.07–0.11 | 0.07–0.08 |
| Cr | Cr2O3 | Kα | PET | 0.06–0.08 | 0.34–0.51 |
| Mg | Diopside | Kα | TAP | 0.02–0.03 | 0.16–0.22 |
| Ca | Diopside | Kα | PET | 0.03–0.06 | 0.00–0.03 |
| Na | Albite | Kα | TAP | 0.07–0.10 | 0.00–0.09 |
| K | Orthoclase | Kα | PET | 0.02–0.05 | 0.00–0.04 |
| Mn | Rhodonite | Kα | LIF | 0.11–0.12 | 0.10–0.11 |
| Co | CoO | Kα | LIF | 0.13–0.14 | 0.12–0.13 |
| Cu | Cuprite | Kα | LIF | 0.15–0.22 | 0.16–0.19 |
| Zn | Sphalerite | Kα | LIF | 0.20–0.23 | 0.18–0.19 |
| Ni | NiO | Kα | LIF | 0.11–0.14 | 0.00–0.12 |
| Sample | <2.0 mm | 1.0 mm | 0.5 mm | 0.25 mm | 0.125 mm | 0.063 mm | Sieve Residue | Sorting | GSS 1 | GSO 2 | GSK 3 | GSP 4 |
|---|---|---|---|---|---|---|---|---|---|---|---|---|
| NMI 0095 | 0.66 | 1.07 | 2.02 | 14.19 | 80.26 | 1.58 | 0.22 | Moderately sorted | 2.36 | 0.52 | −0.26 | 1.23 |
| NMI 0096 | 0.00 | 0.01 | 0.06 | 8.74 | 87.35 | 1.97 | 1.87 | Well sorted | 2.46 | 0.41 | −0.14 | 1.03 |
| NMI 0114 | 0.00 | 0.02 | 0.42 | 9.24 | 83.73 | 4.41 | 2.19 | Well sorted | 2.48 | 0.48 | −0.03 | 1.28 |
| NMI 0115 | 0.00 | 0.13 | 0.26 | 0.60 | 41.79 | 37.57 | 19.65 | Moderately sorted | 3.43 | 1.33 | 0.43 | 1.57 |
| NMI 0116 | 0.04 | 0.31 | 1.02 | 7.12 | 69.69 | 17.30 | 4.52 | Well sorted | 2.68 | 0.68 | 0.16 | 1.40 |
| NMI 0119 | 5.00 | 2.40 | 6.62 | 19.81 | 55.46 | 6.15 | 4.55 | Poorly sorted | 2.10 | 1.20 | −0.33 | 1.69 |
| NMI 0121 | 5.75 | 1.04 | 4.18 | 41.26 | 47.56 | 0.19 | 0.04 | Moderately sorted | 1.91 | 0.96 | −2.80 | 1.36 |
| NMI 0122 | 6.02 | 0.00 | 0.04 | 3.40 | 73.37 | 13.10 | 4.06 | Moderately sorted | 2.58 | 0.97 | −0.18 | 2.85 |
| NMI 0123 | 4.08 | 0.04 | 1.45 | 51.40 | 42.93 | 0.10 | 0.00 | Moderately sorted | 1.90 | 0.70 | −0.02 | 0.90 |
| NMI 0125 | 5.46 | 0.10 | 2.42 | 32.93 | 57.89 | 1.12 | 0.09 | Moderately sorted | 2.05 | 0.96 | −0.41 | 1.46 |
| NMI 0126 | 0.04 | 0.07 | 0.23 | 7.99 | 90.35 | 0.97 | 0.36 | Well sorted | 2.46 | 0.40 | −0.14 | 1.02 |
| Sample | Southern Region | Northern Region | |||||||||
|---|---|---|---|---|---|---|---|---|---|---|---|
| NMI 0095 | NMI 0096 | NMI 0115 | NMI 0116 | NMI 0126 | NMI 0114 | NMI 0119 | NMI 0121 | NMI 0122 | NMI 0123 | NMI 0125 | |
| Oxides in wt% | |||||||||||
| SiO2 | 58.83 | 61.22 | 62.94 | 59.99 | 62.17 | 57.78 | 52.37 | 53.77 | - | - | - |
| Al2O3 | 10.49 | 8.84 | 11.34 | 10.62 | 7.99 | 12.00 | 9.51 | 8.31 | - | - | - |
| Fe2O3 | 8.37 | 6.60 | 6.53 | 6.67 | 4.52 | 6.73 | 5.63 | 7.89 | - | - | - |
| MgO | 8.99 | 10.61 | 6.28 | 8.04 | 8.10 | 7.30 | 7.12 | 13.32 | - | - | - |
| CaO | 1.29 | 1.85 | 1.69 | 2.44 | 5.42 | 2.74 | 8.63 | 6.29 | - | - | - |
| Na2O | 1.77 | 1.55 | 1.73 | 1.72 | 1.57 | 1.90 | 1.67 | 1.17 | - | - | - |
| K2O | 1.03 | 1.06 | 1.34 | 1.26 | 0.90 | 1.46 | 1.15 | 0.67 | - | - | - |
| TiO2 | 0.89 | 0.34 | 0.63 | 0.53 | 0.38 | 0.64 | 0.49 | 0.74 | - | - | - |
| P2O5 | 0.21 | 0.14 | 0.14 | 0.14 | 0.12 | 0.15 | 0.11 | 0.11 | - | - | - |
| MnO | 0.11 | 0.06 | 0.09 | 0.09 | 0.06 | 0.08 | 0.08 | 0.15 | - | - | - |
| Cr2O3 | 1.17 | 0.93 | 0.16 | 0.14 | 0.14 | 0.01 | 0.11 | 0.66 | - | - | - |
| LOI | 6.50 | 7.90 | 6.90 | 8.10 | 8.30 | 8.80 | 12.80 | 6.50 | - | - | - |
| Total | 99.78 | 99.81 | 99.86 | 99.83 | 99.83 | 99.85 | 99.84 | 99.70 | - | - | - |
| Element in ppm | |||||||||||
| Ni | 437 | 507 | 292 | 379 | 320 | 344 | 315 | 556 | 334 | 350 | 446 |
| Co | 29.4 | 45.9 | 32.1 | 30.7 | 24.1 | 28.7 | 25.6 | 42 | 28 | 26 | 55 |
| Mo | 0.3 | 0.2 | 0.2 | 0.3 | 0.2 | 0.3 | 0.4 | 2.7 | 2.6 | 2.5 | 1.6 |
| Pb | 21 | 17.3 | 18.2 | 17.5 | 8.7 | 17.3 | 14.1 | 5.7 | 15.6 | 8.5 | 11.7 |
| Cu | 7.2 | 10.2 | 9.9 | 10.1 | 5.0 | 12.2 | 9.4 | 7.1 | 7.4 | 8.8 | 12.6 |
| Zn | 76 | 178 | 82 | 95 | 88 | 99 | 79 | 106 | 82 | 73 | 181 |
| Sn | 1.2 | 2.5 | 1.8 | 1.6 | 1.4 | 1.9 | 1.4 | 1.4 | 1.8 | 1.9 | 1.6 |
| V | 72 | 206 | 92 | 104 | 84 | 110 | 91 | 150 | 98 | 98 | 254 |
| W | 0.4 | 0.6 | 0.5 | 0.7 | 0.4 | 0.7 | 0.6 | <0.5 | <0.5 | <0.5 | <0.5 |
| Ag | 0.1 | 2.9 | 2.3 | 2.4 | 6.1 | 2.0 | 2.8 | <0.5 | <0.5 | <0.5 | <0.5 |
| Element in ppb | |||||||||||
| Au | 3 | 4 | 3 | 4 | 4 | 3 | 3 | 3 | 4 | 3 | 3 |
| Pt | <3 | <3 | <3 | <3 | 6 | <3 | <3 | <3 | <3 | <3 | <3 |
| Pd | <2 | 2 | <3 | <2 | <2 | <2 | <2 | <2 | <2 | <2 | <2 |
| Sample | WAR 32 | WAR 33 | WAR 29 | WAR 30 | WAR 31 |
|---|---|---|---|---|---|
| Oxide in wt%. | |||||
| Cr2O3 | 6.69 | 4.76 | 24.83 | 17.19 | 20.25 |
| Fe2O3 | 11.88 | 21.42 | 48.01 | 47.18 | 56.83 |
| TiO2 | 1.68 | 1.68 | 3.67 | 3.66 | 3.93 |
| Element in ppm | |||||
| Mo | 5.9 | 3.2 | 5.0 | 4.1 | 2.7 |
| Cu | 12.0 | 21.1 | 37.3 | 38.3 | 36.9 |
| Pb | 14.0 | 6.1 | 15.3 | 5.8 | 62.4 |
| Zn | 409 | 431 | 1247 | 1004 | 1045 |
| Ni | 237.7 | 329.1 | 492.6 | 461.5 | 411.7 |
| Co | 95 | 98 | 321 | 252 | 265 |
| Sn | 1.3 | 1.9 | 1.6 | 1.5 | 2.2 |
| V | 404 | 681 | 1786 | 1710 | 2026 |
| W | <0.5 | <0.5 | <0.5 | <0.5 | <0.5 |
| Ag | <0.5 | <0.5 | <0.5 | 4.7 | <0.5 |
| Au | - | - | - | - | 3.05 |
| Pt (ppb) | - | - | - | - | 8 |
| Pd | - | - | - | - | 11 |
| Sample Oxide in wt% | High-Cr Spinels | High-Al Spinels | ||||||||||||||
|---|---|---|---|---|---|---|---|---|---|---|---|---|---|---|---|---|
| 1/1. | 4/1. | 98/1. | 125/12. | 125/27. | 125/28. | 125/39. | 125/47. | 6/1. | 7/1. | 21/1. | 25/.1 | 42/1. | 44/1. | 45/1. | 46/1. | |
| SiO2 | 0.00 | 0.00 | 0.01 | 0.06 | 0.04 | 0.00 | 0.00 | 0.04 | 0.00 | 0.00 | 0.04 | 0.02 | 0.02 | 0.03 | 0.01 | 0.05 |
| TiO2 | 0.15 | 0.19 | 0.12 | 0.12 | 0.21 | 0.09 | 0.12 | 0.09 | 0.11 | 0.12 | 0.15 | 0.07 | 0.44 | 0.07 | 0.19 | 0.08 |
| Al2O3 | 17.32 | 13.87 | 12.20 | 9.73 | 9.31 | 13.83 | 12.87 | 16.81 | 26.11 | 20.75 | 21.86 | 23.30 | 20.91 | 33.45 | 26.27 | 28.46 |
| Fe2O3 | 2.64 | 3.22 | 3.53 | 1.86 | 2.53 | 7.67 | 2.14 | 0.56 | 3.72 | 1.46 | 3.35 | 1.67 | 4.12 | 2.71 | 1.18 | 1.15 |
| V2O3 | 0.18 | 0.31 | 0.22 | 0.11 | 0.21 | 0.20 | 0.26 | 0.32 | 0.26 | 0.30 | 0.31 | 0.24 | 0.26 | 0.12 | 0.18 | 0.20 |
| Cr2O3 | 50.01 | 51.94 | 55.36 | 60.33 | 58.30 | 49.00 | 55.70 | 52.80 | 39.96 | 47.10 | 44.31 | 44.70 | 43.62 | 33.64 | 43.31 | 40.57 |
| FeO | 18.41 | 22.78 | 18.97 | 16.99 | 21.77 | 20.29 | 18.28 | 18.29 | 16.88 | 18.44 | 18.38 | 17.18 | 20.17 | 13.82 | 15.36 | 16.19 |
| MgO | 10.17 | 6.87 | 9.54 | 10.75 | 7.35 | 8.45 | 9.88 | 10.57 | 12.33 | 10.55 | 10.85 | 11.74 | 9.77 | 14.88 | 13.50 | 12.95 |
| CaO | 0.01 | 0.04 | 0.01 | 0.00 | 0.02 | 0.01 | 0.01 | 0.00 | 0.01 | 0.01 | 0.02 | 0.00 | 0.00 | 0.02 | 0.04 | 0.05 |
| MnO | 0.31 | 0.45 | 0.31 | 0.23 | 0.34 | 0.33 | 0.20 | 0.28 | 0.23 | 0.28 | 0.23 | 0.25 | 0.30 | 0.22 | 0.20 | 0.19 |
| CoO | 0.00 | 0.00 | 0.13 | 0.11 | 0.08 | 0.05 | 0.00 | 0.00 | 0.00 | 0.00 | 0.04 | 0.07 | 0.05 | 0.06 | 0.02 | 0.20 |
| CuO | 0.00 | 0.00 | 0.08 | 0.00 | 0.00 | 0.00 | 0.00 | 0.00 | 0.00 | 0.00 | 0.10 | 0.02 | 0.00 | 0.14 | 0.00 | 0.15 |
| ZnO | 0.41 | 0.34 | 0.15 | 0.09 | 0.22 | 0.37 | 0.00 | 0.01 | 0.15 | 0.17 | 0.14 | 0.13 | 0.23 | 0.11 | 0.19 | 0.19 |
| NiO | 0.03 | 0.00 | 0.01 | 0.06 | 0.09 | 0.13 | 0.03 | 0.09 | 0.12 | 0.06 | 0.10 | 0.10 | 0.04 | 0.17 | 0.10 | 0.15 |
| Total | 99.67 | 100.08 | 100.64 | 100.43 | 100.49 | 100.50 | 99.60 | 99.84 | 99.87 | 99.27 | 99.90 | 99.47 | 99.91 | 99.42 | 100.55 | 100.59 |
| apfu | ||||||||||||||||
| Si | 0.00 | 0.00 | 0.00 | 0.01 | 0.01 | 0.00 | 0.00 | 0.01 | 0.00 | 0.00 | 0.01 | 4.35 | 0.00 | 0.01 | 0.00 | 0.01 |
| Ti | 0.03 | 0.04 | 0.02 | 0.02 | 0.04 | 0.02 | 0.02 | 0.02 | 0.02 | 0.02 | 0.03 | 0.01 | 0.08 | 0.01 | 0.03 | 0.02 |
| Al | 5.25 | 4.34 | 3.76 | 3.01 | 2.95 | 4.28 | 3.98 | 5.08 | 7.51 | 6.20 | 6.46 | 6.82 | 6.25 | 9.23 | 7.45 | 8.03 |
| Fe3+ | 0.51 | 0.64 | 0.70 | 0.37 | 0.51 | 1.52 | 0.42 | 0.11 | 0.68 | 0.28 | 0.63 | 0.31 | 0.79 | 0.48 | 0.21 | 0.21 |
| V | 0.04 | 0.07 | 0.05 | 0.02 | 0.05 | 0.04 | 0.06 | 0.07 | 0.05 | 0.06 | 0.06 | 0.05 | 0.05 | 0.02 | 0.04 | 0.04 |
| Cr | 10.16 | 10.91 | 11.45 | 12.52 | 12.41 | 10.17 | 11.55 | 10.70 | 7.71 | 9.44 | 8.78 | 8.78 | 8.74 | 6.23 | 8.24 | 7.67 |
| Fe2+ | 3.96 | 5.06 | 4.15 | 3.73 | 4.90 | 4.46 | 4.01 | 3.92 | 3.45 | 3.91 | 3.85 | 3.57 | 4.28 | 2.71 | 3.09 | 3.24 |
| Mg | 3.90 | 2.72 | 3.72 | 4.21 | 2.95 | 3.31 | 3.86 | 4.04 | 4.49 | 3.99 | 4.05 | 4.35 | 3.69 | 5.20 | 4.84 | 4.62 |
| Ca | 0.00 | 0.01 | 0.00 | 0.00 | 0.00 | 0.00 | 0.00 | 0.00 | 0.00 | 0.00 | 0.00 | 0.00 | 0.00 | 0.00 | 0.01 | 0.01 |
| Mn | 0.07 | 0.10 | 0.07 | 0.05 | 0.08 | 0.07 | 0.05 | 0.06 | 0.05 | 0.06 | 0.05 | 0.05 | 0.07 | 0.04 | 0.04 | 0.04 |
| Co | 0.00 | 0.00 | 0.03 | 0.02 | 0.02 | 0.01 | 0.00 | 0.00 | 0.00 | 0.00 | 0.01 | 0.01 | 0.01 | 0.01 | 0.00 | 0.04 |
| Cu | 0.00 | 0.00 | 0.02 | 0.00 | 0.00 | 0.00 | 0.00 | 0.00 | 0.00 | 0.00 | 0.02 | 0.00 | 0.00 | 0.02 | 0.00 | 0.03 |
| Zn | 0.08 | 0.07 | 0.03 | 0.02 | 0.04 | 0.07 | 0.00 | 0.00 | 0.03 | 0.03 | 0.03 | 0.02 | 0.04 | 0.02 | 0.03 | 0.03 |
| Ni | 0.00 | 0.00 | 0.00 | 0.01 | 0.01 | 0.01 | 0.00 | 0.01 | 0.01 | 0.01 | 0.01 | 0.01 | 0.00 | 0.01 | 0.01 | 0.01 |
| Cr# | 0.66 | 0.72 | 0.75 | 0.81 | 0.81 | 0.70 | 0.74 | 0.68 | 0.51 | 0.60 | 0.58 | 0.56 | 0.58 | 0.40 | 0.53 | 0.49 |
| Mg# | 0.50 | 0.35 | 0.47 | 0.53 | 0.38 | 0.43 | 0.49 | 0.51 | 0.57 | 0.50 | 0.51 | 0.55 | 0.46 | 0.66 | 0.61 | 0.59 |
| Fe3+# | 0.03 | 0.04 | 0.04 | 0.02 | 0.03 | 0.09 | 0.03 | 0.01 | 0.04 | 0.02 | 0.04 | 0.02 | 0.05 | 0.03 | 0.01 | 0.01 |
| Cr | 63.83 | 68.63 | 71.98 | 78.76 | 78.17 | 63.71 | 72.42 | 67.35 | 48.49 | 59.31 | 55.33 | 55.17 | 55.42 | 39.08 | 51.81 | 48.24 |
| Al | 32.95 | 27.32 | 23.64 | 18.93 | 18.61 | 26.80 | 24.94 | 31.96 | 47.22 | 38.94 | 40.68 | 42.88 | 39.59 | 57.92 | 46.85 | 50.46 |
| Fe3+ | 3.22 | 4.05 | 4.37 | 2.31 | 3.23 | 9.49 | 2.65 | 0.68 | 4.29 | 1.75 | 3.98 | 1.96 | 4.98 | 2.99 | 1.35 | 1.30 |
| FeO/MgO | 1.81 | 3.32 | 1.99 | 1.58 | 2.96 | 2.40 | 1.85 | 1.73 | 1.37 | 1.75 | 1.69 | 1.46 | 2.06 | 0.93 | 1.14 | 1.25 |
| Cr/Fe | 4.55 | 3.83 | 4.72 | 6.11 | 4.59 | 3.40 | 5.21 | 5.31 | 3.73 | 4.51 | 3.92 | 4.53 | 3.45 | 3.91 | 4.99 | 4.50 |
| Estimated composition for parental magmas | ||||||||||||||||
| Al2O3 melt | 13.78 | 12.62 | 11.95 | 10.76 | 10.53 | 12.60 | 12.23 | 13.62 | 15.78 | 14.83 | 15.04 | 15.31 | 14.86 | 16.80 | 15.80 | 16.13 |
| TiO2 melt | 0.25 | 0.29 | 0.12 | 0.22 | 0.31 | 0.18 | 0.22 | 0.19 | 0.08 | 0.12 | 0.29 | - | 0.44 | - | 0.46 | - |
| FeO/MgO melt | 0.46 | 0.99 | 0.44 | 0.18 | 0.79 | 0.63 | 0.40 | 0.42 | 0.32 | 0.49 | 0.47 | 0.36 | 0.65 | 0.06 | 0.15 | 0.28 |
| Sample | ||||||||||||||||
|---|---|---|---|---|---|---|---|---|---|---|---|---|---|---|---|---|
| 1/1. | 13/1. | 14/1. | 18/1. | 19/1. | 24/1. | 57/1. | 58/1. | 59/1. | 65/1. | 66/1. | 2/2. | 4/2. | 6/7. | 8/9. | 41/10. | |
| wt% | ||||||||||||||||
| SiO2 | 41.14 | 40.94 | 41.09 | 41.13 | 41.04 | 41.42 | 41.16 | 40.59 | 41.10 | 41.07 | 41.10 | 40.73 | 40.42 | 40.56 | 41.22 | 40.63 |
| TiO2 | 0.01 | 0.02 | 0.02 | 0.02 | 0.03 | 0.00 | 0.01 | 0.02 | 0.02 | 0.00 | 0.00 | 0.00 | 0.00 | 0.00 | 0.00 | 0.00 |
| Al2O3 | 0.00 | 0.00 | 0.00 | 0.00 | 0.01 | 0.00 | 0.00 | 0.00 | 0.00 | 0.00 | 0.00 | 0.00 | 0.00 | 0.00 | 0.00 | 0.00 |
| Cr2O3 | 0.01 | 0.01 | 0.00 | 0.01 | 0.00 | 0.00 | 0.04 | 0.03 | 0.00 | 0.00 | 0.00 | 0.01 | 0.00 | 0.03 | 0.00 | 0.00 |
| FeO | 10.11 | 10.04 | 9.83 | 9.96 | 8.98 | 7.76 | 9.31 | 9.91 | 8.82 | 9.89 | 9.23 | 9.56 | 10.21 | 9.74 | 9.87 | 10.34 |
| MnO | 0.09 | 0.15 | 0.11 | 0.11 | 0.12 | 0.13 | 0.19 | 0.17 | 0.14 | 0.12 | 0.10 | 0.17 | 0.09 | 0.16 | 0.11 | 0.09 |
| MgO | 48.84 | 48.54 | 48.67 | 48.76 | 49.89 | 50.37 | 49.65 | 48.70 | 49.80 | 49.22 | 49.32 | 48.98 | 49.26 | 48.54 | 48.89 | 48.56 |
| CaO | 0.04 | 0.02 | 0.02 | 0.17 | 0.02 | 0.05 | 0.03 | 0.03 | 0.01 | 0.02 | 0.02 | 0.01 | 0.02 | 0.01 | 0.03 | 0.02 |
| NiO | 0.39 | 0.29 | 0.41 | 0.32 | 0.45 | 0.41 | 0.32 | 0.42 | 0.45 | 0.37 | 0.33 | 0.21 | 0.18 | 0.12 | 0.20 | 0.30 |
| Total | 100.62 | 99.99 | 100.15 | 100.50 | 100.54 | 100.13 | 100.70 | 99.87 | 100.35 | 100.68 | 100.10 | 99.67 | 100.18 | 99.18 | 100.31 | 99.94 |
| apfu | ||||||||||||||||
| Si | 1.004 | 1.004 | 1.006 | 1.005 | 0.998 | 1.005 | 1.000 | 0.998 | 1.000 | 1.001 | 1.004 | 1.001 | 0.992 | 1.002 | 1.006 | 0.999 |
| Ti | 0.000 | 0.000 | 0.000 | 0.000 | 0.000 | 0.000 | 0.000 | 0.000 | 0.000 | 0.000 | 0.000 | 0.000 | 0.000 | 0.000 | 0.000 | 0.000 |
| Al | 0.000 | 0.000 | 0.000 | 0.000 | 0.000 | 0.000 | 0.000 | 0.000 | 0.000 | 0.000 | 0.000 | 0.000 | 0.000 | 0.000 | 0.000 | 0.000 |
| Cr | 0.000 | 0.000 | 0.000 | 0.000 | 0.000 | 0.000 | 0.001 | 0.000 | 0.000 | 0.000 | 0.000 | 0.000 | 0.000 | 0.001 | 0.000 | 0.000 |
| Fe | 0.206 | 0.206 | 0.201 | 0.204 | 0.183 | 0.157 | 0.189 | 0.204 | 0.180 | 0.201 | 0.188 | 0.196 | 0.209 | 0.201 | 0.201 | 0.213 |
| Mn | 0.002 | 0.003 | 0.002 | 0.002 | 0.002 | 0.003 | 0.004 | 0.004 | 0.003 | 0.002 | 0.002 | 0.004 | 0.002 | 0.003 | 0.002 | 0.002 |
| Mg | 1.776 | 1.775 | 1.776 | 1.777 | 1.809 | 1.822 | 1.799 | 1.786 | 1.807 | 1.788 | 1.796 | 1.794 | 1.802 | 1.788 | 1.779 | 1.781 |
| Ca | 0.001 | 0.006 | 0.000 | 0.004 | 0.001 | 0.001 | 0.001 | 0.001 | 0.000 | 0.001 | 0.001 | 0.000 | 0.001 | 0.000 | 0.001 | 0.001 |
| Ni | 0.008 | 0.006 | 0.008 | 0.006 | 0.009 | 0.008 | 0.006 | 0.008 | 0.009 | 0.007 | 0.006 | 0.004 | 0.004 | 0.002 | 0.004 | 0.006 |
| Fo (%) | 89.51 | 89.46 | 89.72 | 89.62 | 90.72 | 91.92 | 90.31 | 89.59 | 90.83 | 89.77 | 90.41 | 89.97 | 89.50 | 89.74 | 89.73 | 89.25 |
| Fa | 10.38 | 10.37 | 10.16 | 10.26 | 9.15 | 7.94 | 9.49 | 10.22 | 9.02 | 10.10 | 9.49 | 9.85 | 10.41 | 10.10 | 10.16 | 10.66 |
| Tp | 0.09 | 0.16 | 0.11 | 0.10 | 0.12 | 0.13 | 0.19 | 0.18 | 0.14 | 0.12 | 0.10 | 0.18 | 0.09 | 0.17 | 0.12 | 0.09 |
| Mg# | 0.90 | 0.90 | 0.90 | 0.90 | 0.91 | 0.92 | 0.90 | 0.90 | 0.91 | 0.90 | 0.90 | 0.90 | 0.90 | 0.90 | 0.90 | 0.89 |
| Enstatite | Diopside | Augite | Augite | Pigeonite | |||||||||||||
|---|---|---|---|---|---|---|---|---|---|---|---|---|---|---|---|---|---|
| wt% | |||||||||||||||||
| SiO2 | 55.17 | 56.17 | 57.12 | 55.65 | 55.16 | 57.29 | 56.49 | 50.04 | 50.12 | 52.53 | 51.70 | 51.88 | 51.52 | 50.79 | 51.48 | 51.34 | 54.46 |
| TiO2 | 0.05 | 0.07 | 0.02 | 0.04 | 0.03 | 0.01 | 0.02 | 0.40 | 0.48 | 0.28 | 0.10 | 0.19 | 0.12 | 0.19 | 0.25 | 0.44 | 0.06 |
| Al2O3 | 4.23 | 2.71 | 1.16 | 2.86 | 3.53 | 1.11 | 2.08 | 3.94 | 3.62 | 1.30 | 4.39 | 4.26 | 3.91 | 5.63 | 6.10 | 1.82 | 4.19 |
| Cr2O3 | 0.84 | 0.79 | 0.38 | 0.56 | 0.58 | 0.58 | 0.60 | 0.17 | 0.00 | 0.04 | 0.99 | 0.81 | 0.88 | 1.08 | 0.97 | 0.01 | 0.89 |
| Fe2O3 | 0.00 | 0.00 | 0.00 | 0.00 | 0.12 | 0.00 | 0.00 | 3.66 | 3.85 | 2.51 | 1.13 | 1.27 | 1.51 | 1.63 | 0.93 | 1.91 | 0.44 |
| FeO | 6.58 | 6.24 | 6.59 | 6.52 | 6.12 | 6.44 | 6.29 | 3.82 | 3.93 | 5.65 | 0.96 | 1.28 | 0.81 | 1.04 | 2.29 | 11.53 | 5.09 |
| MnO | 0.13 | 0.07 | 0.20 | 0.15 | 0.16 | 0.13 | 0.15 | 0.21 | 0.17 | 0.51 | 0.06 | 0.12 | 0.10 | 0.06 | 0.12 | 0.35 | 0.16 |
| MgO | 32.78 | 33.49 | 33.99 | 33.38 | 33.32 | 33.47 | 33.62 | 14.76 | 13.95 | 15.04 | 16.18 | 16.25 | 16.62 | 15.44 | 17.48 | 13.38 | 31.62 |
| CaO | 0.53 | 0.71 | 0.74 | 0.41 | 0.37 | 0.61 | 0.91 | 22.60 | 23.76 | 22.30 | 24.43 | 24.18 | 24.18 | 23.72 | 19.68 | 19.27 | 2.68 |
| Na2O | 0.04 | 0.01 | 0.03 | 0.03 | 0.02 | 0.00 | 0.06 | 0.19 | 0.20 | 0.33 | 0.18 | 0.23 | 0.08 | 0.42 | 0.67 | 0.30 | 0.06 |
| K2O | 0.00 | 0.00 | 0.00 | 0.00 | 0.00 | 0.00 | 0.00 | 0.00 | 0.00 | 0.00 | 0.00 | 0.00 | 0.00 | 0.01 | 0.00 | 0.00 | 0.00 |
| NiO | 0.12 | 0.13 | 0.14 | 0.15 | 0.13 | 0.15 | 0.12 | 0.00 | 0.00 | 0.00 | 0.03 | 0.11 | 0.09 | 0.04 | 0.05 | 0.02 | 0.08 |
| Total | 100.68 | 100.37 | 100.38 | 99.74 | 99.52 | 99.87 | 100.34 | 99.78 | 100.09 | 100.49 | 100.13 | 100.58 | 99.82 | 100.05 | 99.99 | 100.36 | 99.73 |
| apfu | |||||||||||||||||
| Si | 1.906 | 1.937 | 1.969 | 1.930 | 1.914 | 1.977 | 1.951 | 1.856 | 1.861 | 1.940 | 1.879 | 1.880 | 1.879 | 1.850 | 1.859 | 1.930 | 1.894 |
| Ti | 0.001 | 0.002 | 0.000 | 0.001 | 0.001 | 0.000 | 0.000 | 0.011 | 0.013 | 0.008 | 0.003 | 0.005 | 0.003 | 0.005 | 0.007 | 0.013 | 0.002 |
| Al | 0.172 | 0.110 | 0.047 | 0.117 | 0.144 | 0.045 | 0.085 | 0.172 | 0.158 | 0.057 | 0.188 | 0.182 | 0.168 | 0.242 | 0.259 | 0.081 | 0.172 |
| Cr | 0.023 | 0.022 | 0.010 | 0.015 | 0.016 | 0.016 | 0.016 | 0.005 | 0.000 | 0.001 | 0.028 | 0.023 | 0.025 | 0.031 | 0.028 | 0.000 | 0.025 |
| Fe3+ | 0.000 | 0.000 | 0.000 | 0.000 | 0.003 | 0.000 | 0.000 | 0.102 | 0.107 | 0.070 | 0.031 | 0.035 | 0.041 | 0.045 | 0.025 | 0.054 | 0.012 |
| Fe2+ | 0.183 | 0.180 | 0.190 | 0.189 | 0.178 | 0.186 | 0.182 | 0.118 | 0.122 | 0.174 | 0.029 | 0.039 | 0.025 | 0.032 | 0.069 | 0.363 | 0.148 |
| Mn | 0.004 | 0.002 | 0.006 | 0.005 | 0.005 | 0.004 | 0.004 | 0.007 | 0.005 | 0.016 | 0.002 | 0.004 | 0.003 | 0.002 | 0.004 | 0.011 | 0.005 |
| Mg | 1.688 | 1.722 | 1.747 | 1.726 | 1.724 | 1.773 | 1.730 | 0.816 | 0.772 | 0.828 | 0.876 | 0.878 | 0.904 | 0.838 | 0.941 | 0.750 | 1.640 |
| Ca | 0.020 | 0.026 | 0.027 | 0.015 | 0.014 | 0.023 | 0.034 | 0.898 | 0.945 | 0.882 | 0.951 | 0.939 | 0.945 | 0.926 | 0.762 | 0.776 | 0.100 |
| Na | 0.002 | 0.000 | 0.002 | 0.002 | 0.001 | 0.000 | 0.004 | 0.014 | 0.015 | 0.023 | 0.012 | 0.016 | 0.006 | 0.030 | 0.047 | 0.022 | 0.004 |
| K | 0.000 | 0.000 | 0.000 | 0.000 | 0.000 | 0.000 | 0.000 | 0.000 | 0.000 | 0.000 | 0.000 | 0.000 | 0.000 | 0.000 | 0.000 | 0.000 | 0.000 |
| Ni | 0.003 | 0.003 | 0.004 | 0.004 | 0.004 | 0.004 | 0.003 | 0.000 | 0.000 | 0.000 | 0.001 | 0.003 | 0.003 | 0.001 | 0.001 | 0.000 | 0.002 |
| Mg# | 0.90 | 0.91 | 0.90 | 0.90 | 0.90 | 0.91 | 0.91 | 0.87 | 0.86 | 0.83 | 0.97 | 0.96 | 0.97 | 0.96 | 0.93 | 0.67 | 0.92 |
| En * | 0.89 | 0.89 | 0.89 | 0.89 | 0.90 | 0.90 | 0.89 | 0.46 | 0.42 | 0.44 | 0.47 | 0.47 | 0.48 | 0.47 | 0.53 | 0.40 | 0.87 |
| Fs * | 0.10 | 0.09 | 0.10 | 0.09 | 0.09 | 0.09 | 0.09 | 0.07 | 0.07 | 0.09 | 0.02 | 0.02 | 0.01 | 0.02 | 0.04 | 0.19 | 0.08 |
| Wo * | 0.01 | 0.01 | 0.01 | 0.01 | 0.01 | 0.01 | 0.01 | 0.49 | 0.51 | 0.47 | 0.51 | 0.51 | 0.50 | 0.52 | 0.43 | 0.41 | 0.05 |
© 2020 by the authors. Licensee MDPI, Basel, Switzerland. This article is an open access article distributed under the terms and conditions of the Creative Commons Attribution (CC BY) license (http://creativecommons.org/licenses/by/4.0/).
Share and Cite
Zglinicki, K.; Kosiński, P.; Piestrzyński, A.; Szamałek, K. Geological Prospection of Placer Chromium Deposits in the Waropen Regency—Indonesia (New Guinea) Using the Method of Indicator Minerals. Minerals 2020, 10, 94. https://doi.org/10.3390/min10020094
Zglinicki K, Kosiński P, Piestrzyński A, Szamałek K. Geological Prospection of Placer Chromium Deposits in the Waropen Regency—Indonesia (New Guinea) Using the Method of Indicator Minerals. Minerals. 2020; 10(2):94. https://doi.org/10.3390/min10020094
Chicago/Turabian StyleZglinicki, Karol, Paweł Kosiński, Adam Piestrzyński, and Krzysztof Szamałek. 2020. "Geological Prospection of Placer Chromium Deposits in the Waropen Regency—Indonesia (New Guinea) Using the Method of Indicator Minerals" Minerals 10, no. 2: 94. https://doi.org/10.3390/min10020094