The Influence of Fly Ash on Mechanical Properties of Clay-Based Ceramics


1
Department of Physics, Faculty of Natural Sciences, Constantine the Philosopher University in Nitra, Tr. A. Hlinku 1, 94974 Nitra, Slovakia
2
Department of Materials Engineering and Chemistry, Faculty of Civil Engineering, Czech Technical University in Prague, Thákurova 7, 166 29 Prague, Czech Republic
*
Author to whom correspondence should be addressed.
Minerals 2020, 10(10), 930; https://doi.org/10.3390/min10100930
Submission received: 26 August 2020
/
Revised: 16 October 2020
/
Accepted: 19 October 2020
/
Published: 21 October 2020
(This article belongs to the Special Issue Clay Minerals and Waste Fly Ash Ceramics)
Abstract
:Elastic properties of mixtures of illitic clay, thermal power plant fly ash (fluidized fly ash—FFA and pulverized fly ash—PFA), and grog were investigated during the heating and cooling stages of the firing. The grog part in the mixtures was replaced with 10, 20, 30, and 40 mass% of the fly ash, respectively. The temperature dependence of Young’s modulus was derived using the dynamical thermomechanical analysis, in which dimensions and mass determined from thermogravimeric and thermodilatometric results were used. Flexural strength was measured at the room temperature using the three-point bending test. The following results were obtained: (1) Bulk density showed a decreasing trend up to 900 °C and a steep increase above 900 °C. During cooling, the bulk density slightly increased down to the room temperature. (2) Young’s modulus increased significantly during heating up to ~300 °C. Dehydroxylation was almost not reflected in Young’s modulus. At temperatures higher than 800 °C, Young’s modulus began to increase due to sintering. (3) During cooling, down to the glass transformation, Young’s modulus slightly increased and then began to slightly decrease due to microcracking between phases with different thermal expansion coefficients. (4) Around the β→α quartz transition, radial stresses on the quartz grain altered from compressive to tensile, creating microcracks. Below 560 °C, the radial stress remained tensile, and consequently, the microcracking around the quartz grains and a decreasing Young’s modulus continued. (5) With a lower amount of PFA and FFA, a higher Young’s modulus was reached after sintering. The final values of Young’s modulus, measured after firing, show a decreasing trend and depend linearly on the part of fly ash. (6) The flexural strength measured after firing decreased linearly with the amount of the fly ash for both mixtures.
1. Introduction
Industrial and agricultural sectors and cities produce large amounts of waste. Waste is grouped based on the source and effects into four main categories: sewage sludge, ashes, inorganic and organic wastes [1]. As societies strive to develop new ways to recycle and incorporate waste into new products, they must consider the large mass flow and high temperatures required to make such processes viable. One type of waste with a high potential for use in ceramic materials is fly ash, a by-product of coal combustion in thermal power-plants.
As a waste material, fly ash is often stored in landfills, where it is a source of pollution of surrounding areas in the form of dust and toxic substances, such as heavy metals and sulfur compounds. Ashes mainly contain particles with dimensions of (50–100) μm, therefore no extra milling is needed. The composition of ashes is similar to that of a raw traditional ceramic mixture with a negligible content of organic matter. Several previously published studies [2,3,4,5,6,7,8,9] concluded that fly ash can be used as an additive in ceramic material and may substitute other raw components. A ceramic mixture of clay with fly ash can be used for the production of tiles or bricks. This idea is not new, but the utilization of fly ash in the ceramic industry still has not reached its full potential.
Cultrone and Sebastián [10] found that a 5 mass% of fly ash addition leads to reduction in bulk density and improvement in resistance against defects induced by salt crystallization. Chandra et al. [11] examined mixtures of kaolin and fly ash (up to 80 mass%) after firings in the temperature interval from 800 °C to 1150 °C. Wall tiles containing 60 mass% of the fly ash sintered at 950 °C reached sufficient compressive strength and a low firing shrinkage. Lingling et al. [12] replaced clay with fly ash in a high volume ratio (up to 80 mass%), reaching the compressive strength of 25 MPa after firing at 1050 °C for 8 h. The possibility of using fly ash in the production of art ceramics was investigated in [13]. Promising results with respect to potential utilization of fly ash in the production of ceramic materials are also found in [2,4,8,9,14]. In a recent study [15], the potential use of fluidized bed combustion fly ash for the production of bricks was examined. The positive effect of fly ash substitution was the reduction in firing shrinkage and a decrease in bulk density. On the other hand, Young’s modulus and mechanical strength decreased dramatically with fly ash substitution, and 30 mass% of fly ash was found to be the maximum acceptable portion in ceramic mixtures fired at 1100 °C. The influence of fly ash on the flexural strength of ceramics (kaolinite, illite, and fly ash) fired at 1080 °C was studied by Sokolář and Smetanová [4]. Fly ash caused a decrease in the flexural strength, a contraction after firing, and an increase in the water absorbability. It can be said that the addition of fly ash worsens some parameters of ceramics. Despite this, most studies conclude that fly ash is a suitable admixture for the production of building ceramics. The addition of fly ash also decreases the firing temperature. Another benefit is the binding of heavy metals from fly ash into the structure of the ceramic body during its sintering [16,17].
In this study, pulverized firing fly ash (PFA) and fluidized fly ash (FFA) from the power plant Nováky (Slovakia) were examined for their potential use in the production of building ceramics.
2. Materials and Methods
The samples were made from three basic input materials—Illitic clay, coal fly ash, and grog. Illitic clay from Füzérradvány (north-eastern Hungary), was used. The second component in the samples was fly ash from thermal power plant ENO Nováky (Slovakia). Two ashes were used:
- fly ash from a fluidized bed combustion boiler operating at 850 °C (FFA),
- fly ash from a pulverized combustion boiler operating at 1400 °C (PFA).
The third component was grog prepared from illitic clay heated up to 1100 °C for 90 min. Clay, grog, and fly ash were crushed, milled, and sieved (200 µm mesh).
The chemical composition of clay, PFA, and FFA are given in Table 1 [5,6,7] and their initial mineral composition is given in Table 2 [5,6,7]. The grog was used to simulate a non-plastic component used for traditional ceramics production. Grog has a chemical composition similar to illite, because during its preparation, mainly H2O was removed. K2O is known for its fluxing action, therefore grog contains a lot of glassy phase created during heating above ~900 °C [18]. Due to the desulfurization technology used in a fluidized boiler, FFA contained a significant amount of CaO. According to Table 2, it was partially bound in calcite, anorthite, and gypsum, however, some amount of free CaO was still present in FFA.
To prevent the reaction of free CaO with water during the preparation of samples, FFA was mixed with distilled water to create Ca(OH)2. During open air drying at the room temperature, the reaction Ca(OH)2 + CO2 → CaCO3 + H2O took place. Afterwards, FFA was crushed and sieved again. Only fractions below 200 μm were used for the preparation of samples.
After these procedures, the studied samples (denoted as PF and FF, respectively) were prepared according to Table 3. The grog part was replaced with 10, 20, 30, and 40 mass% of fly ash (PFA or FFA). Additionally, a reference sample without fly ash was prepared (labeled as F0). The prepared powders were mixed with water, and plastic mass was extruded to obtain cylindrical samples with a diameter of 12 mm. Then, the samples were dried in open air till the equilibrium moisture was reached, which represented, depending on the composition, (1.5–3.0) mass% of the physically bound water. The dry samples were cut to lengths needed for the analyses.
Temperature dependence of Young’s modulus (E) was derived using the dynamical thermomechanical analysis (D-TMA). This analysis is based on measuring the dimensions, mass of the sample, and its resonant frequency of the fundamental mode of flexural vibrations. To determine the resonant frequency, the impulse excitation technique was used [19]. Young’s modulus was calculated from the formula given in [20], adapted for temperature-dependent quantities
where l0, d0, and m0 are the initial length, diameter, and mass of the sample at the room temperature, and f(t) is the resonant frequency. Δl(t)/l0 and Δm(t)/m0 are the relative linear thermal expansion and the relative mass change of the sample at temperature t. As follows from Equation (1), calculation of Young’s modulus requires actual dimensions and the mass at temperature t. They were determined from the thermodilatometric (TDA) and thermogravimetric (TG) results. The correction coefficient for the used sample Ø12 × 106 mm and Poisson’s ratio = 0.2 was incorporated into the numerical factor of Equation (1).
The TG and differential thermal analysis (DTA) of the compact samples (Ø12 × 12 mm) were done on analyzer Derivatograph 1000 (MOM, Budapest, Hungary), in which a pressed alumina reference sample with dimensions Ø12 × 12 mm was used. The TDA was carried out using a horizontal push-rod alumina dilatometer on samples with dimensions of Ø12 × 30 mm.
D-TMA and TDA were performed in the cycle 20 °C → 1100 °C → 20 °C, while TG and DTA were only performed during heating 20 °C → 1050 °C. All these analyses were performed in the static air atmosphere with the heating/cooling rate of 5 °C·min−1 and without soaking at the highest temperature.
Flexural strength was measured at the room temperature using the three-point bending test [21,22] on samples with dimensions of 6.5 × 6.5 × 80 mm. The span of cylindrical supports was (74.50 ± 0.10) mm. The applied force increased with the rate of (4.80 ± 0.05) N·s−1. The samples for three-point bending tests were fired in electric furnace with the temperature regime: heating to 1100 °C with the rate of 5 °C·min−1 → 5 min soaking → cooling to room temperature with the rate of 10 °C·min−1.
3. Results and Discussion
3.1. DTA and TG
Results of the DTA are shown in Figure 1. The DTA shows that the samples with PFA and FFA contained a significant amount of water. This is visible as an endotherm in the DTA curves at around 125–170 °C, reflecting the release of the physically bound water from surfaces of crystals in both samples (PF and FF) and dehydration of gypsum (CaSO4·2H2O) in FF samples [23]. A significant exothermic reaction took place between 300 °C and 450 °C, which intensity correlated with PFA and FFA content—More PFA or FFA in the sample led to a more intensive exothermic DTA peak. This reaction could be ascribed to thermal oxidation of the remaining organic substances (as it was confirmed by evolved gas analysis, not shown here). Other visible endothermic processes were the dehydroxylation of illite (minimum at 585 °C and 700 °C) in PF and FF samples, decomposition of calcite (minimum at 805 °C [24]) in FF samples and vitrification (minimum at 960 °C) in PF and FF samples. There was also a small exothermic maximum at around ~930 °C in Figure 1, which was visible for samples FF30 and FF40. It corresponds to the anorthite crystallization [25]. These minerals were created from the dehydroxylated illite and components of FFA.
TG curves have a typical shape for clays, comprising of steps representing mass losses from the release of the physically bound water, constituent water, and CO2 from burned organic substances and decomposition of calcite (see Figure 2). These steps were in a good correlation with endothermic and exothermic peaks in DTA. The total mass loss (determined at 900 °C) increased with the amount of PFA and FFA. It had a linear relationship for PF samples (Δm/m0 = 4.310 + 0.016 c(PFA); R2 = 0.866; c(PFA) is a part of PFA in mass%) and also for FF samples (Δm/m0 = 4.310 + 0.141 c(FFA); R2 = 0.988; c(FFA) is a part of FFA in mass%), see Figure 3.
3.2. Thermal Expansion
The thermodilatometric curves (see Figure 4) showed the expansion of all PF samples with a step between 500 °C and 600 °C as a consequence of the dehydroxylation of illite and the α → β transition of quartz. Beginning from 900 °C, intensive sintering took place and its rate increases with the part of PFA. Total relative shrinkage, registered at the room temperature, depends linearly on the amount of PFA (Δl/l0 = 4.770 + 0.071 c(PFA); R2 = 0.992; c(PFA) is a part of PFA in mass%), see Figure 5. The reason was the high glassy phase content in PFA and partially the fluxing action of iron oxides. This result is positive from the point of view of PFA sinterability. On the other hand, rapid changes in dimensions bring additional problems to the production process during the firing. If the obtained fitting equation is used, the total shrinkage for sample with 70 mass% of fly ash will be 9.74%, which is in good agreement with the results in the study of Sokolar and Smetanova [4], where it was from 4.9% to 11.2%. The differences could be caused by different chemical composition of used clays and fly ashes, preparation of samples or firing regime.
The relative expansion of FF samples during their heating up to 900 °C was similar to the results for PF samples (see Figure 4). It was characterized by a modest expansion before dehydroxylation, an increasing expansion during dihydroxylation, and the α → β transformation of quartz between ~400 °C and ~700 °C. The presence of FFA decreased the sintering temperature. A positive effect of FFA presence was the decrease in the sintering shrinkage, which was particularly visible for FF30 and FF40. This could be explained by the presence of anorthite in the fired samples. The total relative shrinking registered at the room temperature depended linearly on the amount of FFA (Δl/l0 = 4.770–0.092 c(FFA); R2 = 0.929; c(FFA) is a part of FFA in mass%), see Figure 5.
3.3. Bulk Density
Bulk density (ρ) calculated from the TG and TDA results (see Figure 6) showed a decreasing trend up to 900 °C because of the mass loss, which was more intensive than thermal expansion. Above 900 °C, intensive sintering begins, which led to a steep increase in the bulk density up to 1100 °C. Then, during cooling, when only the β → α transition of quartz occurred and the mass was constant, the bulk density slightly increased down to the room temperature.
The final values of the bulk density linearly depended on the content of PFA and FFA, see Figure 7. For PFA, it was as follows: ρ = 1.870 − 0.003·c(PFA); R2 = 0.802; c(PFA) is a part of PFA in mass%. Similarly, for FFA, it was: ρ = 1.870 − 0.014·c(FFA); R2 = 0.973; c(FFA) is a part of FFA in mass%. A lower bulk density has advantages: lower bulk density is generally reflected in better thermal insulation properties of the building ceramics.
3.4. Young’s Modulus
The results of D-TMA of the samples with PFA and FFA are shown in Figure 8 and Figure 9. The behavior of Young’s modulus (E) during heating (see Figure 8) was qualitatively the same for all samples up to 900 °C. Young’s modulus increased significantly during heating up to ~300 °C despite a decrease in the bulk density (see Figure 6) and the increase in the thermal expansion (see Figure 4). This behavior is typical for samples containing kaolinite and/or illite, if the samples are not completely dried [26,27]. When water is in pores, molecules of H2O and products of their dissociation adsorbed on surface defects are removed by heat, the crystals set closer to each other, and stronger contacts are created by the van der Waals forces.
In the temperature interval from 300 °C to 800 °C, a typical decrease in Young’s modulus caused by the weakening of the internal bounds in crystals was observed. Here, two processes took place, namely dehydroxylation of illite and the α → β transition of quartz. In the dehydroxylation region, the structure of illite changed irreversibly and became more defected and disordered, deteriorating the mechanical properties, which was reflected in a decrease in Young’s modulus between 500 °C and 700 °C.
At temperatures higher than 800 °C, Young’s modulus began to increase for all studied samples. This was caused by the solid-state sintering and sintering in the liquid phase at the highest temperatures. Some irregularities were presented in the curves of Young’s modulus at the temperatures above 1000 °C. These were caused by creation of the viscous glassy phase in the samples, which suppressed free resonant vibrations. It brought difficulties in the measurement, and some scatter of the results.
Another reason for the improvement of Young’s modulus was that new phases were created above 800 °C when dehydroxylated illite changes into a partially disordered structure. It was not possible to distinguish the effects of the high-temperature processes (in particular, the anorthite crystallization in FF samples) on Young’s modulus, and only the mutual influence of sintering and creation of new phases could be observed. After the maximum temperature of 1100 °C was reached, and the cooling stage of the firing began, sintering temporarily continued because of the high temperature; however, its intensity decreased with the decreasing temperature. Until the temperature of the glass transformation at ~750 °C was reached, Young’s modulus slightly increased in its values. Under the glass transformation temperature, Young’s modulus began to slightly decrease due to microcracking between phases with different thermal expansion coefficients [18]. Around the β → α quartz transition at 573 °C, quartz grains shrank steeply, and radial mechanical stresses on the quartz grain surfaces altered from compressive to tensile, creating micro-cracks in their close vicinity. During this alteration, no stress acts on the grain as a mathematical model [28], and experimental study [5,18] showed in previous studies. This leads to the creation of the V-shape minimum [29], which is visible in Figure 9. At temperatures below 560 °C, the radial stress remained tensile, and consequently, microcracking around the quartz grains continued, which caused decreasing Young’s modulus down to the room temperature. The circumferential cracks are formed [18,28,29]. The result is a sample with a relatively high number of circumferential microcracks around the quartz grains.
Some impact of the PFA and FFA presence in the samples on Young’s modulus was observed. The lower amount of PFA and FFA, the higher Young’s modulus was reached after sintering. The final values of Young’s modulus measured at the room temperature after heating at 1100 °C showed a decreasing trend (see Figure 10) and depend linearly on the part of fly ash for PF samples: E = 32.140−0.109·c(PFA); R2 = 0.762; c(PFA) is a part of PFA in mass%. However, a trend was exponential for the FF samples: E = 32.140·e−0.033·c(FFA); R2 = 0.987; c(FFA) is a part of FFA in mass%.
3.5. Mechanical Strength
The flexural strength (σf) was measured at the room temperature after firing at 1100 °C (see Figure 11). The strength decreased linearly for PF samples: σf = 38.077−0.389·c(PFA); R2 = 0.973; c(PFA) is a part of PFA in mass%, and exponentially for FF samples σf = 38.077·e−0.037·c(FFA); R2 = 0.999; c(FFA) is a part of FFA in mass%.
A direct linear correlation was valid between Young’s modulus and the mechanical strength. Consequently, if Young’s modulus decreased with the PFA and FFA content, the same was observed for the mechanical strength. An explanation of this behavior could be based on microcracks, the amount of which increased with part of the PFA and FFA in the samples. If the obtained fitting equations are used, the flexural strength for the sample with 70 mass% of fly ash will be 10.8 MPa or 2.8 MPa, which is not in good agreement with the results obtained in the study of Sokolář and Smetanová [4] where it varied from 17.2 MPa to 31.3 MPa. The differences could be caused, as it was mentioned for results of firing shrinkage, by the different chemical composition of used clays and fly ashes, preparation of samples, or firing regime.
Mechanical strength (compressive or flexural) is a parameter of the highest importance for building ceramics. Mechanical strength of a common fired brick depends on the composition of the clay and the degree of firing. The compressive strength of the clay bricks may vary from 3.5 MPa to 35 MPa [30]. Flexural strength 1.5 MPa is sufficient for small tiles which are not mechanically loaded [8]. According to Griffith and Vaculik [31], the flexural strength of the fired clay brick is 3.55 MPa, and Young’s modulus is 52.7 GPa. Results show that the flexural strength laid between 22 MPa and 32 MPa for samples with PFA and between 8 MPa and 25 MPa for samples with FFA (see Figure 11). Since the compressive strength can be 7–10 times higher than the flexural strength, the compressive strength expects high values compared with the written above, which were obtained on industrial bricks. These bricks are much larger than laboratory samples (used in this research) and contain many defects in their microstructure (cracks, voids, inhomogeneities), which cause the rupture.
Testing of brick prisms indicates that Youngs’ modulus of bricks falls between 700 and 1200 times the flexural strength [32]. It means, that Young’s modulus can be 3.5 GPa–35 GPa if the flexural strength is multiplied by 1000. The value of Young’s modulus 12.7 GPa is given for a fired clay brick. It follows from our results shown in Figure 10, that Young’s modulus varied (in dependence on the fly ash content) between 8 GPa and 33 GPa for samples with FFA and between 27 GPa and 33 GPa for samples with PFA. These values are in accordance with those published in [30,32] but are lesser than Young’s modulus in [31]. When the numerical values of Young’s modulus (8 GPa–33 GPa for FFA) and (27 GPa–33 GPa for PFA) are compared with flexural strength (9 MPa–38 MPa for FFA) and (23 MPa–38 MPa for PFA), it can be seen that flexural strength is numerically ~1000 times less than Young’s modulus, i.e., similarly as given in [32].
4. Conclusions
The elastic properties of samples of illitic clay, thermal power plant fly ash (fluidized fly ash—FFA and pulverized fly ash—PFA), and grog were investigated during heating and cooling stage of the firing. Grog, which was used to simulate a non-plastic component in the mixtures, was prepared from illitic clay heated at 1100 °C for 90 min. Clay, grog, and fly ash were crushed, milled and sieved (200 µm mesh). The grog part was replaced with 10, 20, 30, and 40 mass% of the fly ash, respectively. Prepared powders were mixed with water and a plastic mass was extruded to obtain cylindrical samples with diameter of 12 mm.
Development of the bulk density was calculated from the TG and TDA results. Temperature dependence of Young’s modulus was derived using the dynamical thermomechanical analysis in which dimensions and mass at actual temperature were used. Flexural strength was measured at the room temperature using the three-point bending test.
It was found that:
- The TDA shows expansion of all samples with a step between 500 °C and 600 °C as a consequence of dehydroxylation and the α → β transition of quartz. Beginning at 900 °C, intensive sintering took place, the rate of which increased with the part of PFA. Total shrinking after firing depended linearly on the amount of PFA and FFA. The reason was a high glassy phase content in PFA and FFA.
- Bulk density showed a decreasing trend up to 900 °C because of the mass loss, which was more intensive than thermal expansion. Above 900 °C, a steep increase in the bulk density up to 1100 °C was observed. Then, during cooling, the bulk density slightly increased down to the room temperature.
- Young’s modulus increased significantly during heating up to ~300 °C when water was removed from pores. Crystals set closer to each other and stronger contacts were created.
- Dehydroxylation was almost not reflected in Young’s modulus. At temperatures higher than 800 °C, Young’s modulus began to increase for all mixtures. This was caused by the solid-state sintering and sintering in the liquid phase at the highest temperatures.
- During cooling, until the glass transformation at ~750 °C was reached, Young’s modulus slightly increased. Under this temperature, Young’s modulus began to decrease slightly due to microcracking between phases with different thermal expansion coefficients.
- At around the β → α quartz transition, quartz grains shrank steeply and radial mechanical stresses on the quartz grain surfaces altered from compressive to tensile, creating micro-cracks in their close vicinity. At temperatures below 560 °C, the radial stress remained tensile, and consequently microcracking around the quartz grains continued, which caused decrease in Young’s modulus down to the room temperature.
- The lower the amount of PFA and FFA, the higher Young’s modulus was reached after sintering.
The presence of fly ash in clay ceramics (up to 40 mass%) decreases Young’s modulus and mechanical strength. In spite of this, their values are high enough to be used ceramics such as the production of bricks and tiles.
Author Contributions
Conceptualization, T.H. and A.T.; methodology, T.H.; investigation, T.H., J.O. and A.T.; writing—original draft preparation, I.Š. and T.H.; writing—review and editing, I.Š., T.H., J.O., A.T.; visualization, A.T.; supervision, A.T.; funding acquisition, T.H. and J.O. All authors have read and agreed to the published version of the manuscript.
Funding
This research was funded by Ministry of Education of Slovak Republic, grants number VEGA 1/0810/19 and VEGA 1/0425/19.
Conflicts of Interest
The authors declare no conflict of interest. The funders had no role in the design of the study; in the collection, analyses, or interpretation of data; in the writing of the manuscript, or in the decision to publish the results.
References
- Velasco, P.M.; Ortiz, M.P.M.; Giró, M.A.M.; Velasco, L.M. Fired clay bricks manufactured by adding wastes as sustainable construction material—A review. Constr. Build. Mater. 2014, 63, 97–107. [Google Scholar] [CrossRef]
- Queralt, I.; Querol, X.; López-Soler, A.; Plana, F. Use of coal fly ash for ceramics: A case study for a large Spanish power station. Fuel 1997, 76, 787–791. [Google Scholar] [CrossRef]
- Olgun, A.; Erdogan, Y.; Ayhan, Y.; Zeybek, B. Development of ceramic tiles from coal fly ash and tincal ore waste. Ceram. Int. 2005, 31, 153–158. [Google Scholar] [CrossRef]
- Sokolar, R.; Smetanova, L. Dry pressed ceramic tiles based on fly ash-clay body: Influence of fly ash granulometry and pentasodium triphosphate addition. Ceram. Int. 2010, 36, 215–221. [Google Scholar] [CrossRef]
- Knapek, M.; Húlan, T.; Dobroň, P.; Chmelík, F.; Trník, A.; Štubňa, I. Acoustic emission during firing of the illite-based ceramics with fly ash addition. Acta Phys. Pol. A 2015, 128, 783–786. [Google Scholar] [CrossRef]
- Kováč, J.; Trník, A.; Medveď, I.; Štubňa, I.; Vozár, L. Influence of fly ash added to a ceramic body on its thermophysical properties. Therm. Sci. 2016, 20, 603–612. [Google Scholar] [CrossRef]
- Húlan, T.; Trník, A.; Medveď, I.; Štubňa, I.; Kaljuvee, T. Building ceramics with an addition of pulverized combustion fly ash from the thermal power plant Nováky. AIP Conf. Proc. 2016, 1752, 040009. [Google Scholar] [CrossRef]
- Sokolar, R.; Vodova, L. The effect of fluidized fly ash on the properties of dry pressed ceramic tiles based on fly ash-clay body. Ceram. Int. 2011, 37, 2879–2885. [Google Scholar] [CrossRef]
- Zimmer, A.; Bergmann, C.P. Fly ash of mineral coal as ceramic tiles raw material. Waste Manag. 2007, 27, 59–68. [Google Scholar] [CrossRef]
- Cultrone, G.; Sebastián, E. Fly ash addition in clayey materials to improve the quality of solid bricks. Constr. Build. Mater. 2009, 23, 1178–1184. [Google Scholar] [CrossRef]
- Chandra, N.; Sharma, P.; Pashkov, G.L.; Voskresenskaya, E.N.; Amritphale, S.S.; Baghel, N.S. Coal fly ash utilization: Low temperature sintering of wall tiles. Waste Manag. 2008, 28, 1993–2002. [Google Scholar] [CrossRef] [PubMed]
- Xu, L.L.; Guo, W.; Wang, T.; Yang, N.R. Study on fired bricks with replacing clay by fly ash in high volume ratio. Constr. Build. Mater. 2005, 19, 243–247. [Google Scholar] [CrossRef]
- Mukherji, S.K.; Machhoya, B.B.; Savsani, R.M.; Vyas, D.R.; Dan, T.K. The utilization of fly ash in the preparation of ceramic tableware and artware. Br. Ceram. Trans. 1993, 92, 254–257. [Google Scholar]
- Sola, O.C.; Yayla, M.; Sayin, B.; Atis, C.D. The effects of different types of fly ash on the compressive strength properties of briquettes. Adv. Mater. Sci. Eng. 2011, 2011, 430604. [Google Scholar] [CrossRef] [Green Version]
- Húlan, T.; Trník, A.; Kaljuvee, T.; Uibu, M.; Štubňa, I.; Kallavus, U.; Traksmaa, R. The study of firing of a ceramic body made from illite and fluidized bed combustion fly ash. J. Therm. Anal. Calorim. 2017, 127, 79–89. [Google Scholar] [CrossRef]
- Zhang, H.Y.; Zhao, Y.C.; Qi, J.Y. Study on use of MSWI fly ash in ceramic tile. J. Hazard. Mater. 2007, 141, 106–114. [Google Scholar] [CrossRef]
- Erol, M.; Kuçukbayrak, S.; Ersoy-Meriçboyu, A. Comparison of the properties of glass, glass-ceramic and ceramic materials produced from coal fly ash. J. Hazard. Mater. 2008, 153, 418–425. [Google Scholar] [CrossRef]
- Knapek, M.; Húlan, T.; Minárik, P.; Dobroň, P.; Štubňa, I.; Stráská, J.; Chmelík, F. Study of microcracking in illite-based ceramics during firing. J. Eur. Ceram. Soc. 2016, 36, 221–226. [Google Scholar] [CrossRef]
- Štubňa, I.; Húlan, T.; Trník, A.; Vozár, L. Uncertainty in the determination of Young’s modulus of ceramics using the impulse excitation technique at elevated temperatures. Acta Acust. United Acust. 2018, 104, 269–276. [Google Scholar] [CrossRef]
- ASTM International. ASTM C 1259-15. Standard Test Method for Dynamic Young’s Modulus, Shear Modulus and Poisson’s Ratio for Advanced Ceramics by Impulse Excitation of Vibration; ASTM International: West Conshohocken, PA, USA, 2015. [Google Scholar]
- Štubňa, I.; Sin, P.; Trník, A.; Vozár, L. Measuring the flexural strength of ceramics at elevated temperatures—An uncertainty analysis. Meas. Sci. Rev. 2014, 14, 35–40. [Google Scholar] [CrossRef]
- ASTM International. ASTM C 1161-18. Standard Test Method for Flexural Strength of Advanced Ceramics at Ambient Temperature; ASTM International: West Conshohocken, PA, USA, 2018. [Google Scholar]
- Tydlitát, V.; Trník, A.; Scheinherrová, L.; Podoba, R.; Černý, R. Application of isothermal calorimetry and thermal analysis for the investigation of calcined gypsum–lime–metakaolin–water system. J. Therm. Anal. Calorim. 2015, 122, 115–122. [Google Scholar] [CrossRef]
- Galan, I.; Glasser, F.P.; Andrade, C. Calcium carbonate decomposition. J. Therm. Anal. Calorim. 2013, 111, 1197–1202. [Google Scholar] [CrossRef]
- Cultrone, G.; Rodriguez-Navrro, C.; Sebastian, E.; Cazalla, O.; De La Torre, M.J. Carbonate and silicate phase reactions during ceramic firing. Eur. J. Miner. 2001, 13, 621–634. [Google Scholar] [CrossRef] [Green Version]
- Jankula, M.; Húlan, T.; Štubňa, I.; Ondruška, J.; Podoba, R.; Šín, P.; Bačík, P.; Trník, A. The influence of heat on elastic properties of illitic clay Radobica. J. Ceram. Soc. Jpn. 2015, 123, 874–879. [Google Scholar] [CrossRef]
- Štubňa, I.; Šín, P.; Trník, A.; Podoba, R.; Vozár, L. Development of Young’s modulus of the green alumina porcelain raw mixture. J. Aust. Ceram. Soc. 2014, 50, 36–42. [Google Scholar]
- Štubňa, I.; Mánik, M.; Húlan, T.; Trník, A. Development of stress on quartz grain in illite ceramics during cooling stage of firing. J. Ceram. Soc. Jpn. 2020, 128, 117–123. [Google Scholar] [CrossRef] [Green Version]
- Chmelík, F.; Trník, A.; Pešička, J.; Štubňa, I. Creation of microcracks in porcelain during firing. J. Eur. Ceram. Soc. 2011, 31, 2205–2209. [Google Scholar] [CrossRef]
- Bureau of Indian Standards. IS 1077. Common Burnt Clay Building Bricks—Specification; Bureau of Indian Standards: New Delhi, India, 1992.
- Griffith, M.C.; Vaculik, J. Out-of-plane flexural strength of unreinforced clay brick masonry walls. TMS J. 2007, 25, 53–68. [Google Scholar]
- The Brick Industry Association. Technical Notes 3A. Brick Masonry Material Properties; The Brick Industry Association: Reston, VA, USA, 1992. [Google Scholar]
Figure 1.
Differential thermal analysis (DTA) of PF (left) and FF (right) samples.
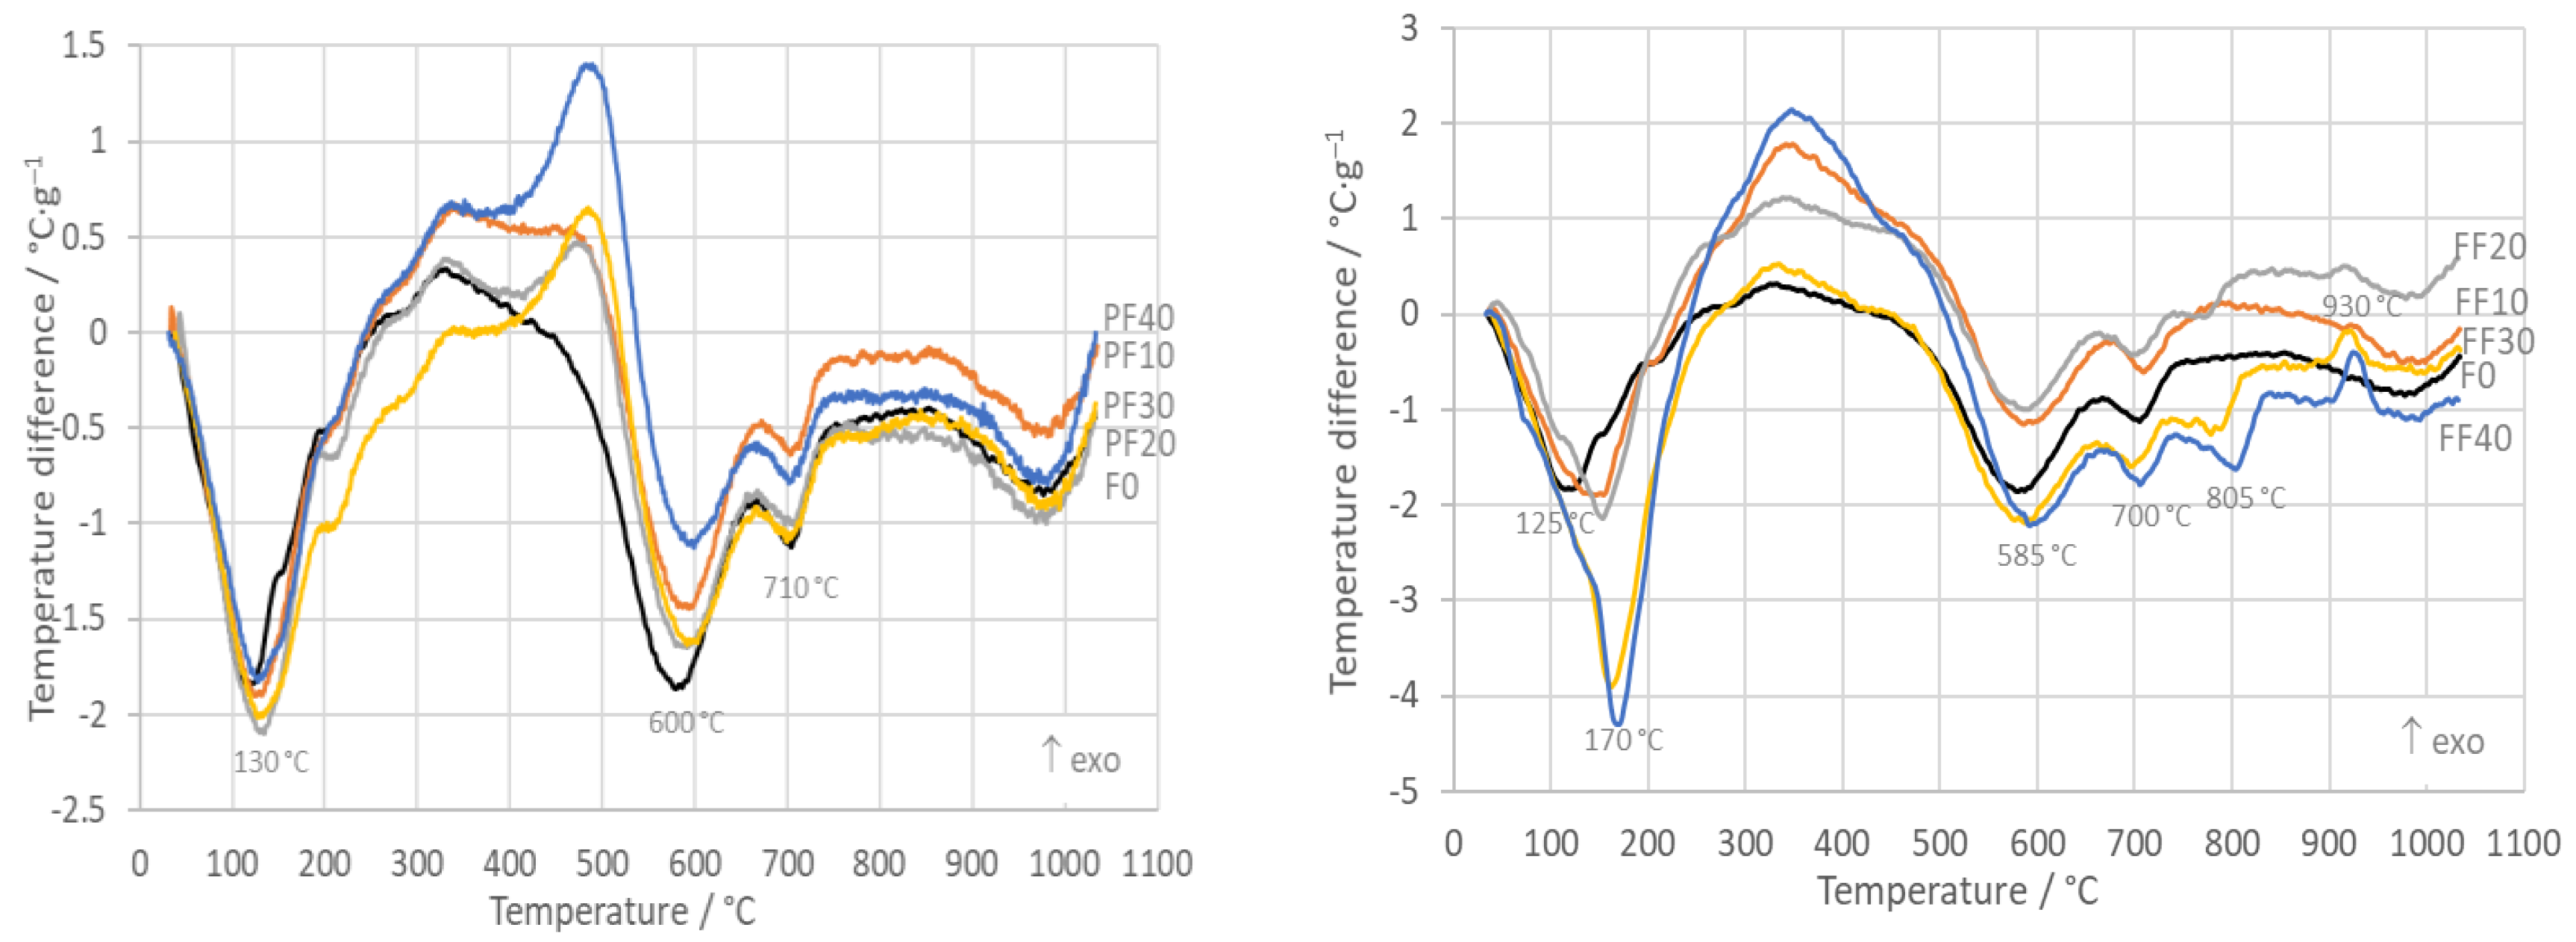
Figure 2.
The mass change of PF (left) and FF (right) samples.

Figure 3.
The total mass loss of PF (left) and FF (right) samples (determined at 900 °C).
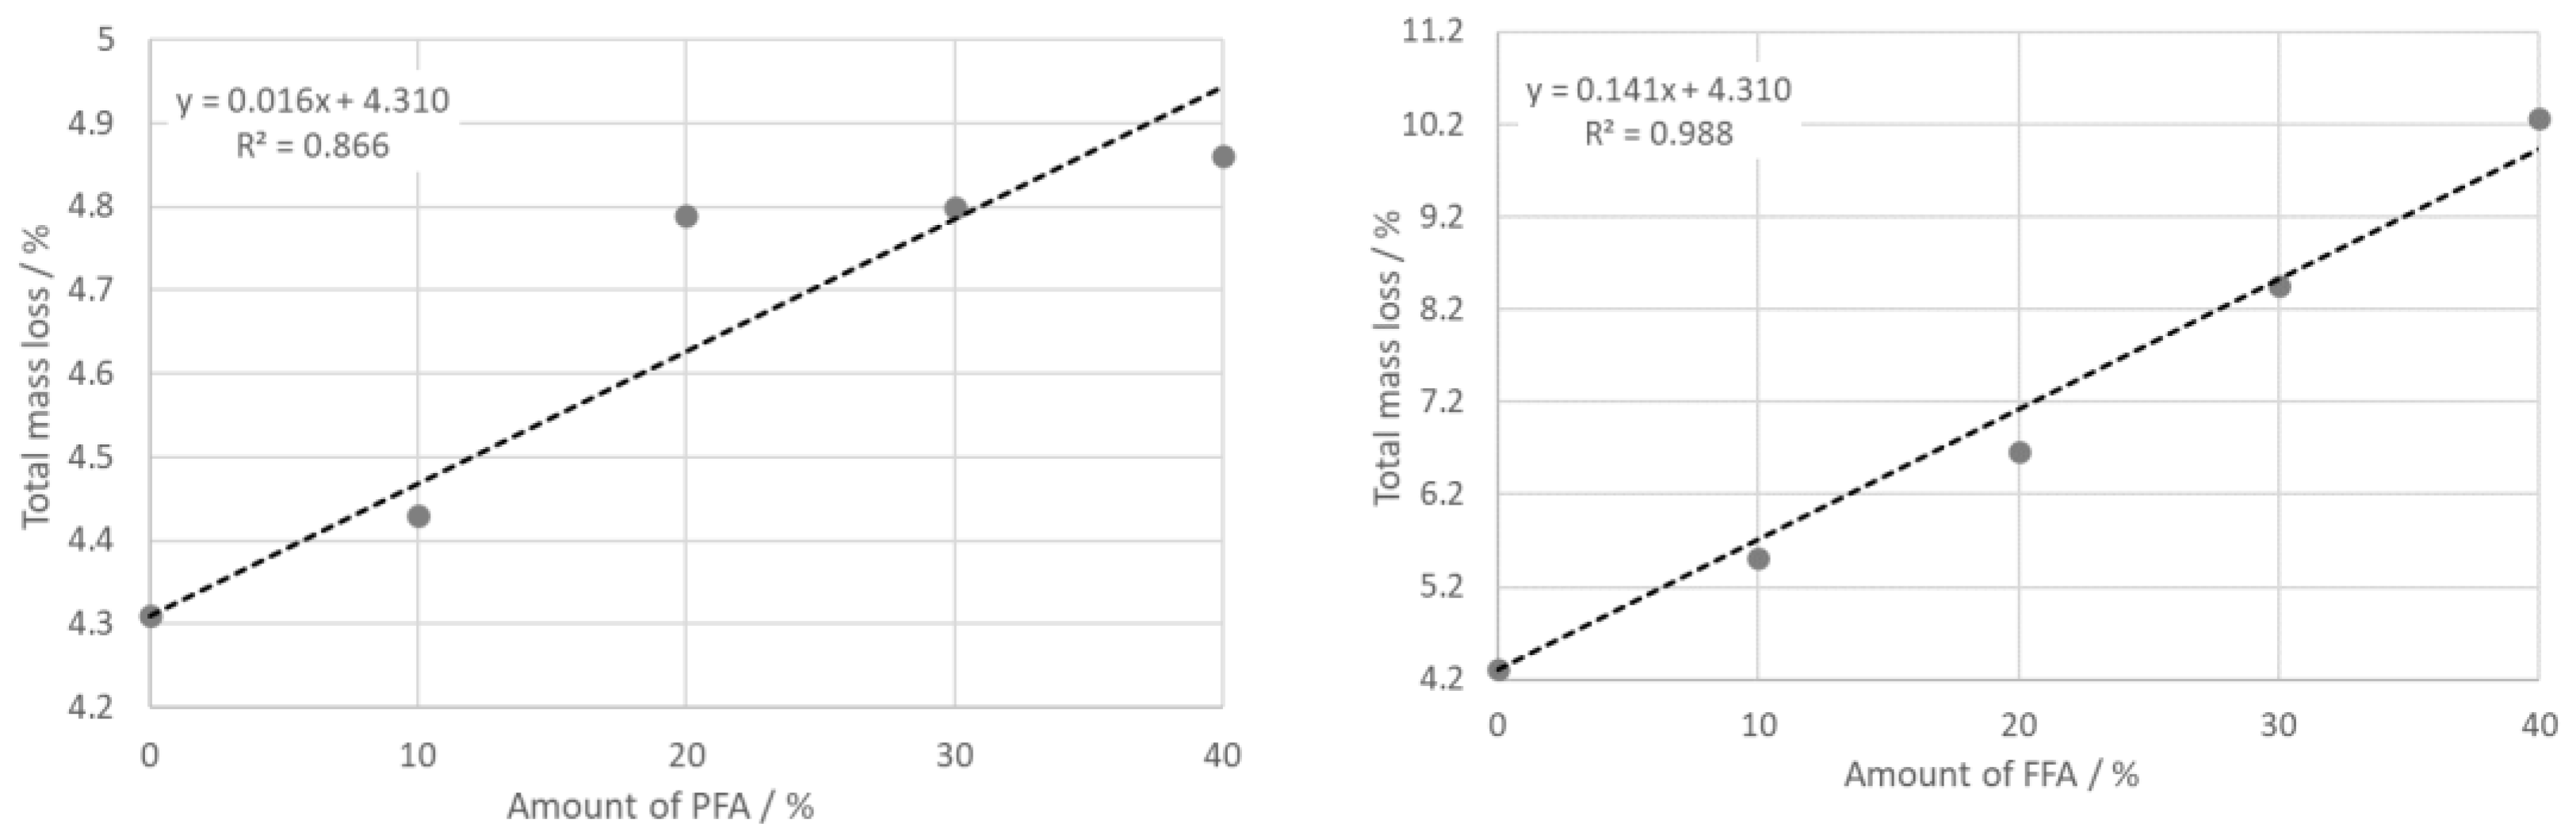
Figure 4.
The thermal expansion of PF (left) and FF (right) samples (dashed lines correspond to the cooling stage of the firing).
Figure 4.
The thermal expansion of PF (left) and FF (right) samples (dashed lines correspond to the cooling stage of the firing).

Figure 5.
Total relative shrinkage of PF (left) and FF (right) samples (measured at the room temperature after firing at 1100 °C).
Figure 5.
Total relative shrinkage of PF (left) and FF (right) samples (measured at the room temperature after firing at 1100 °C).
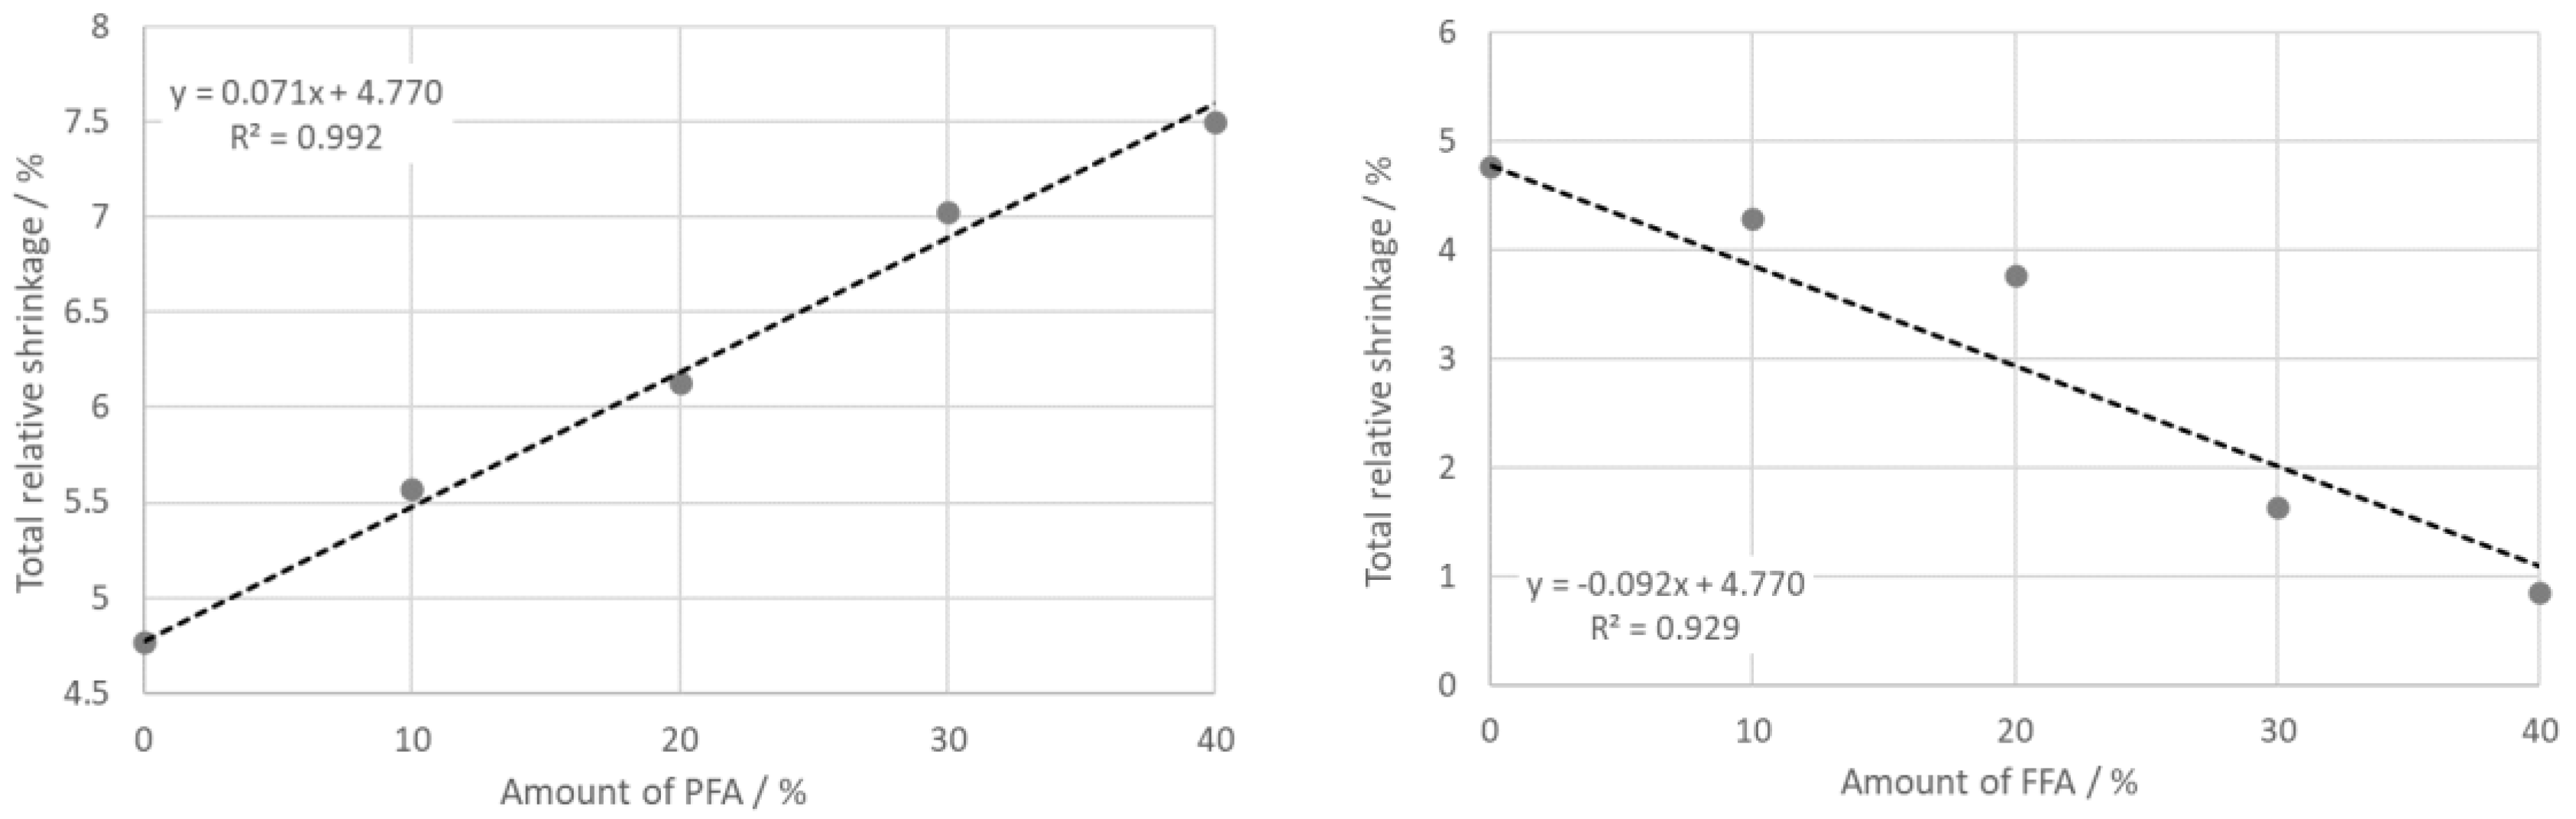
Figure 6.
The bulk density of PF (left) and FF (right) samples (dashed lines correspond to the cooling stage of the firing).
Figure 6.
The bulk density of PF (left) and FF (right) samples (dashed lines correspond to the cooling stage of the firing).

Figure 7.
The bulk density of PF (left) and FF (right) samples (measured at the room temperature after firing at 1100 °C).
Figure 7.
The bulk density of PF (left) and FF (right) samples (measured at the room temperature after firing at 1100 °C).

Figure 8.
The Young’s modulus of PF (left) and FF (right) samples up to 1000 °C.
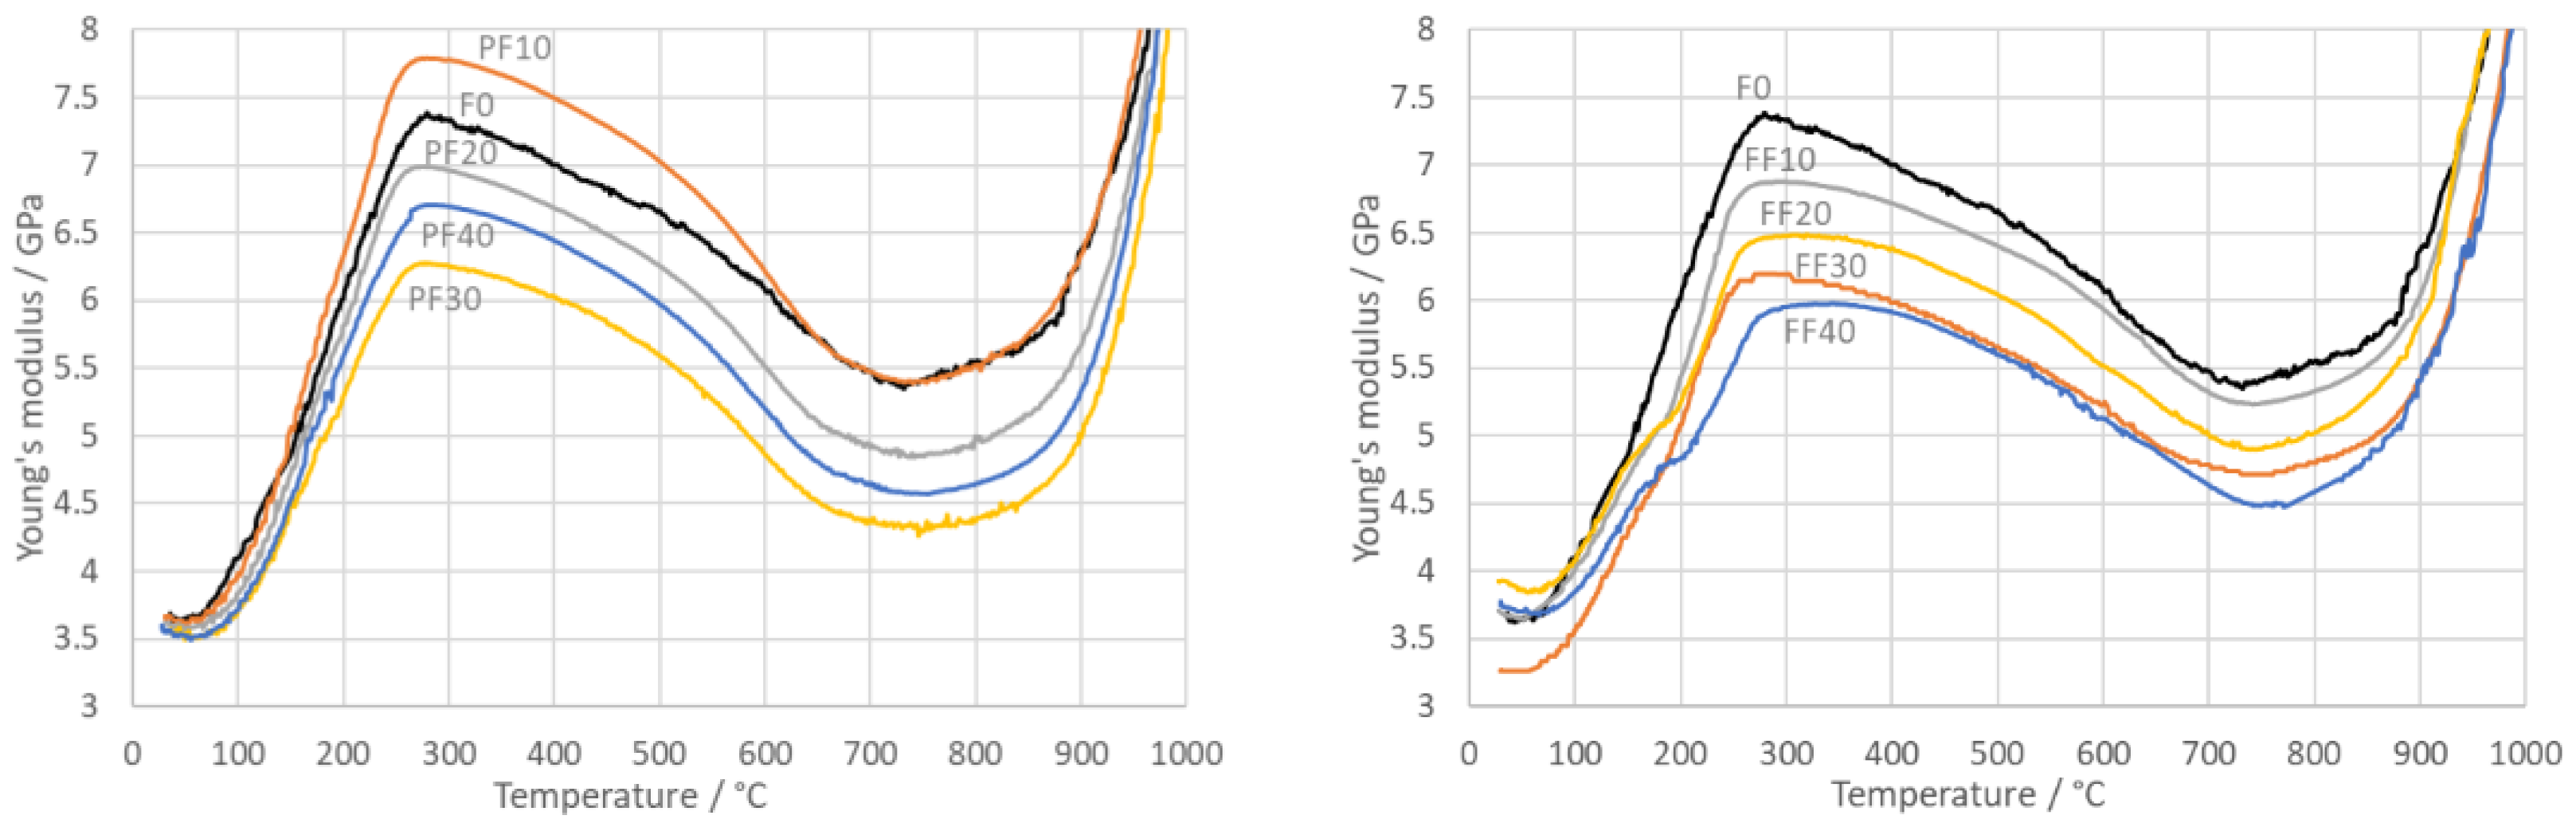
Figure 9.
The Young’s modulus of PF (left) and FF (right) samples (dashed lines correspond to the cooling stage of the firing).
Figure 9.
The Young’s modulus of PF (left) and FF (right) samples (dashed lines correspond to the cooling stage of the firing).

Figure 10.
Young’s modulus of PF (left) and FF (right) samples (measured at the room temperature after firing at 1100 °C).
Figure 10.
Young’s modulus of PF (left) and FF (right) samples (measured at the room temperature after firing at 1100 °C).

Figure 11.
The flexural strength of PF (left) and FF (right) samples (measured at the room temperature after firing at 1100 °C).
Figure 11.
The flexural strength of PF (left) and FF (right) samples (measured at the room temperature after firing at 1100 °C).


Table 1.
The chemical composition of illite, pulverized firing fly ash (PFA) and fluidized fly ash (FFA) (in mass%).
Table 1.
The chemical composition of illite, pulverized firing fly ash (PFA) and fluidized fly ash (FFA) (in mass%).
| SiO2 | Al2O3 | Fe2O3 | TiO2 | CaO | MgO | K2O | Na2O | L.O.I. | |
|---|---|---|---|---|---|---|---|---|---|
| clay | 58.00 | 24.00 | 0.60 | 0.05 | 0.38 | 1.70 | 7.85 | 0.10 | 7.30 |
| PFA | 55.90 | 19.70 | 10.60 | 0.59 | 4.80 | 1.89 | 2.00 | 0.80 | 1.30 |
| FFA | 35.50 | 12.20 | 6.10 | 0.32 | 29.2 | 2.90 | 1.20 | 0.69 | 1.80 |
L.O.I.—loss on ignition.
Table 2.
The mineral composition of input materials (in mass%).
| Mineral | Clay | Grog | FFA | PFA |
|---|---|---|---|---|
| illite | 80.0 | - | - | - |
| montmorillonite | 4.0 | - | - | - |
| quartz | 12.0 | 10.0 | 17.5 | 3.0 |
| mullite | - | 11.0 | - | - |
| calcite | - | - | 11.0 | 0.5 |
| orthoclase | 4.0 | - | - | - |
| anorthite | - | - | 10.0 | 11.0 |
| magnetite | - | - | - | 5.5 |
| gypsum | - | - | 1.5 | - |
| amorphous (undefined) | - | 79.0 | 60.0 | 80.0 |
Table 3.
The composition of the studied PF and FF samples (in mass%).
| Sample | Clay | Grog | PFA | Sample | Clay | Grog | FFA |
|---|---|---|---|---|---|---|---|
| F0 | 60 | 40 | 0 | F0 | 60 | 40 | 0 |
| PF10 | 60 | 30 | 10 | FF10 | 60 | 30 | 10 |
| PF20 | 60 | 20 | 20 | FF20 | 60 | 20 | 20 |
| PF30 | 60 | 10 | 30 | FF30 | 60 | 10 | 30 |
| PF40 | 60 | 0 | 40 | FF40 | 60 | 0 | 40 |
Publisher’s Note: MDPI stays neutral with regard to jurisdictional claims in published maps and institutional affiliations. |
© 2020 by the authors. Licensee MDPI, Basel, Switzerland. This article is an open access article distributed under the terms and conditions of the Creative Commons Attribution (CC BY) license (http://creativecommons.org/licenses/by/4.0/).
Share and Cite
MDPI and ACS Style
Húlan, T.; Štubňa, I.; Ondruška, J.; Trník, A. The Influence of Fly Ash on Mechanical Properties of Clay-Based Ceramics. Minerals 2020, 10, 930. https://doi.org/10.3390/min10100930
AMA Style
Húlan T, Štubňa I, Ondruška J, Trník A. The Influence of Fly Ash on Mechanical Properties of Clay-Based Ceramics. Minerals. 2020; 10(10):930. https://doi.org/10.3390/min10100930
Chicago/Turabian StyleHúlan, Tomáš, Igor Štubňa, Ján Ondruška, and Anton Trník. 2020. "The Influence of Fly Ash on Mechanical Properties of Clay-Based Ceramics" Minerals 10, no. 10: 930. https://doi.org/10.3390/min10100930
Note that from the first issue of 2016, this journal uses article numbers instead of page numbers. See further details here.