Multi-Scale Measurements of Neolithic Ceramics—A Methodological Comparison of Portable Energy-Dispersive XRF, Wavelength-Dispersive XRF, and Microcomputer Tomography


Abstract
:1. Introduction
1.1. Main Aim and Question
1.2. Archaeological Context of the Used Ceramics
2. Materials and Methods
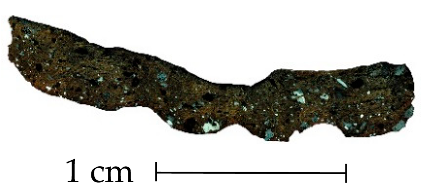
2.1. Optical Description: Macroscopic and Thin-Section Microscopy
2.2. Analytical Methods
2.2.1. Portable Energy-Dispersive X-Ray Fluorescence Spectrometry (Portable XRF)
2.2.2. Wavelength Dispersive X-ray Fluorescence Spectrometry (WD-XRF)
2.2.3. X-ray Microtomography (µCT)
3. Comparison of Results Derived by Various Methods
3.1. Macroscopic and Microscopic Observation
3.2. Chemical Compositions (Portable XRF vs. WD-XRF)
- Potassium, Rb, Ti, V, Y, Zn, and Zr contents agreed well independent of technique used (WD-XRF and portable XRF) and portable XRF measurements on powder, heated powder or break planes.
- Portable XRF measurements resulted in slightly higher Fe concentration compared to WD-XRF, but measurements on powder, heated powder or break planes agreed well.
- Portable XRF measurements led to Cr values that were distinctly higher compared to WD-XRF, but again measurements on powder, heated powder or break planes agreed well.
- Aluminium, Ca, Mg, Si, P, and Sr measured by p-ed XRF were lower compared to WD-XRF by element-specific factors. Agreement existed between powder and heated powder measurements, but measurements of break planes disagreed with powder measurements.
- Niobium did not show an off-set that could be clearly related to over- or underestimated values. This might be due to the fact that Nb-contents were close to detection limits. Agreement existed again between powder and heated powder measurements, but measurements of break planes provided random contents of the respective elements.
- With the exception of the 3 elements (Al, Cr, and Si), the quantity of all elements measured with the portable XRF device could be corrected by multiplying the results by the relevant coefficients from the regression equations.
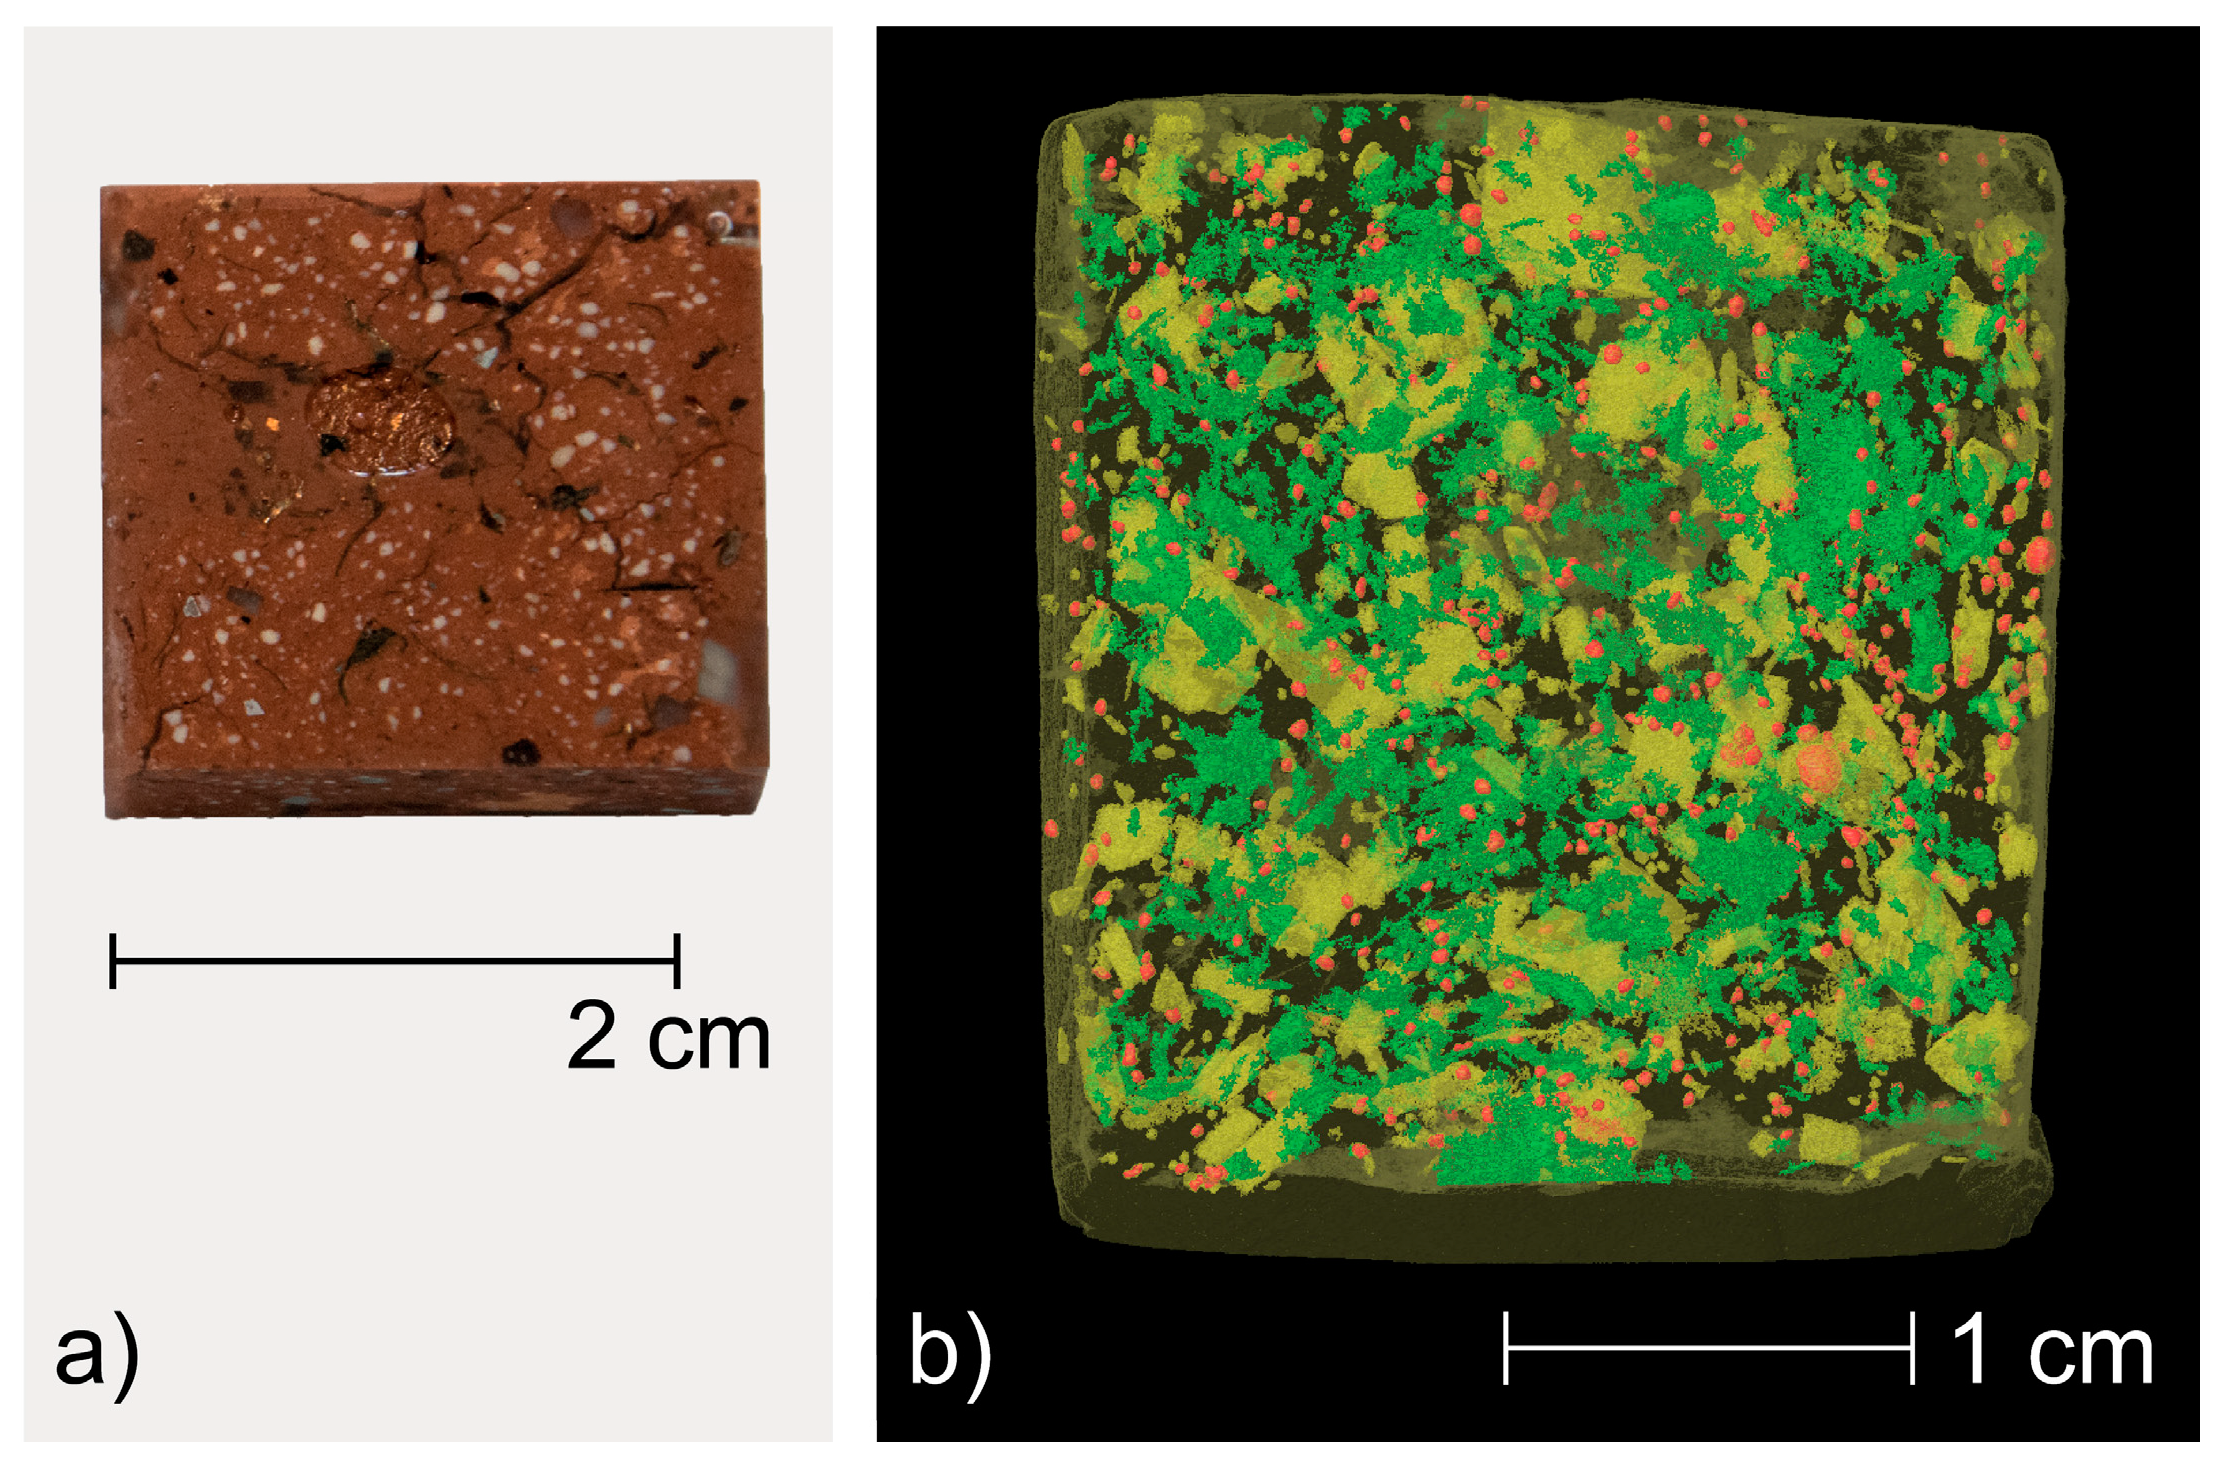
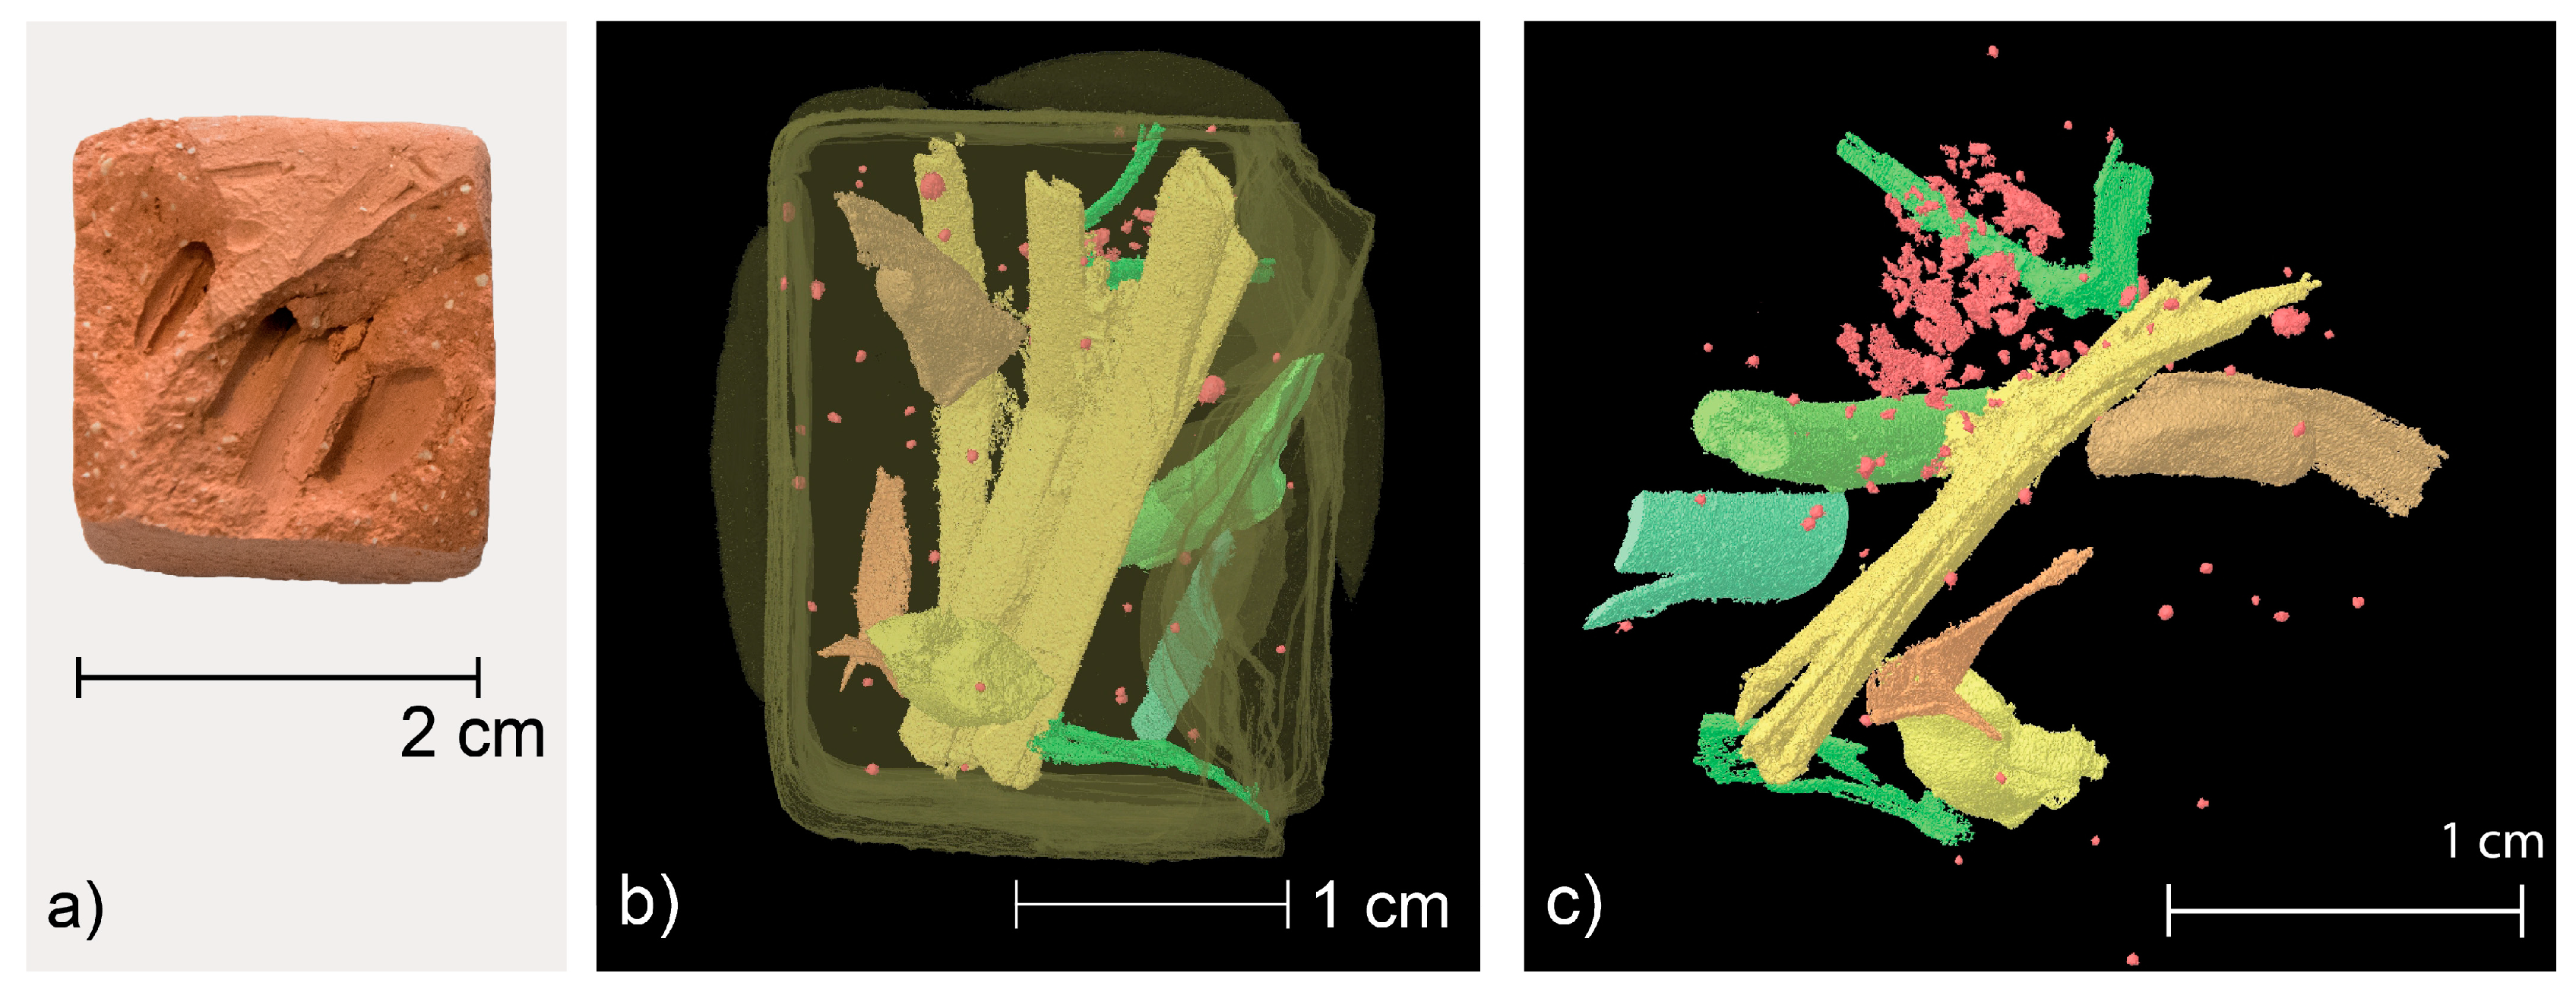
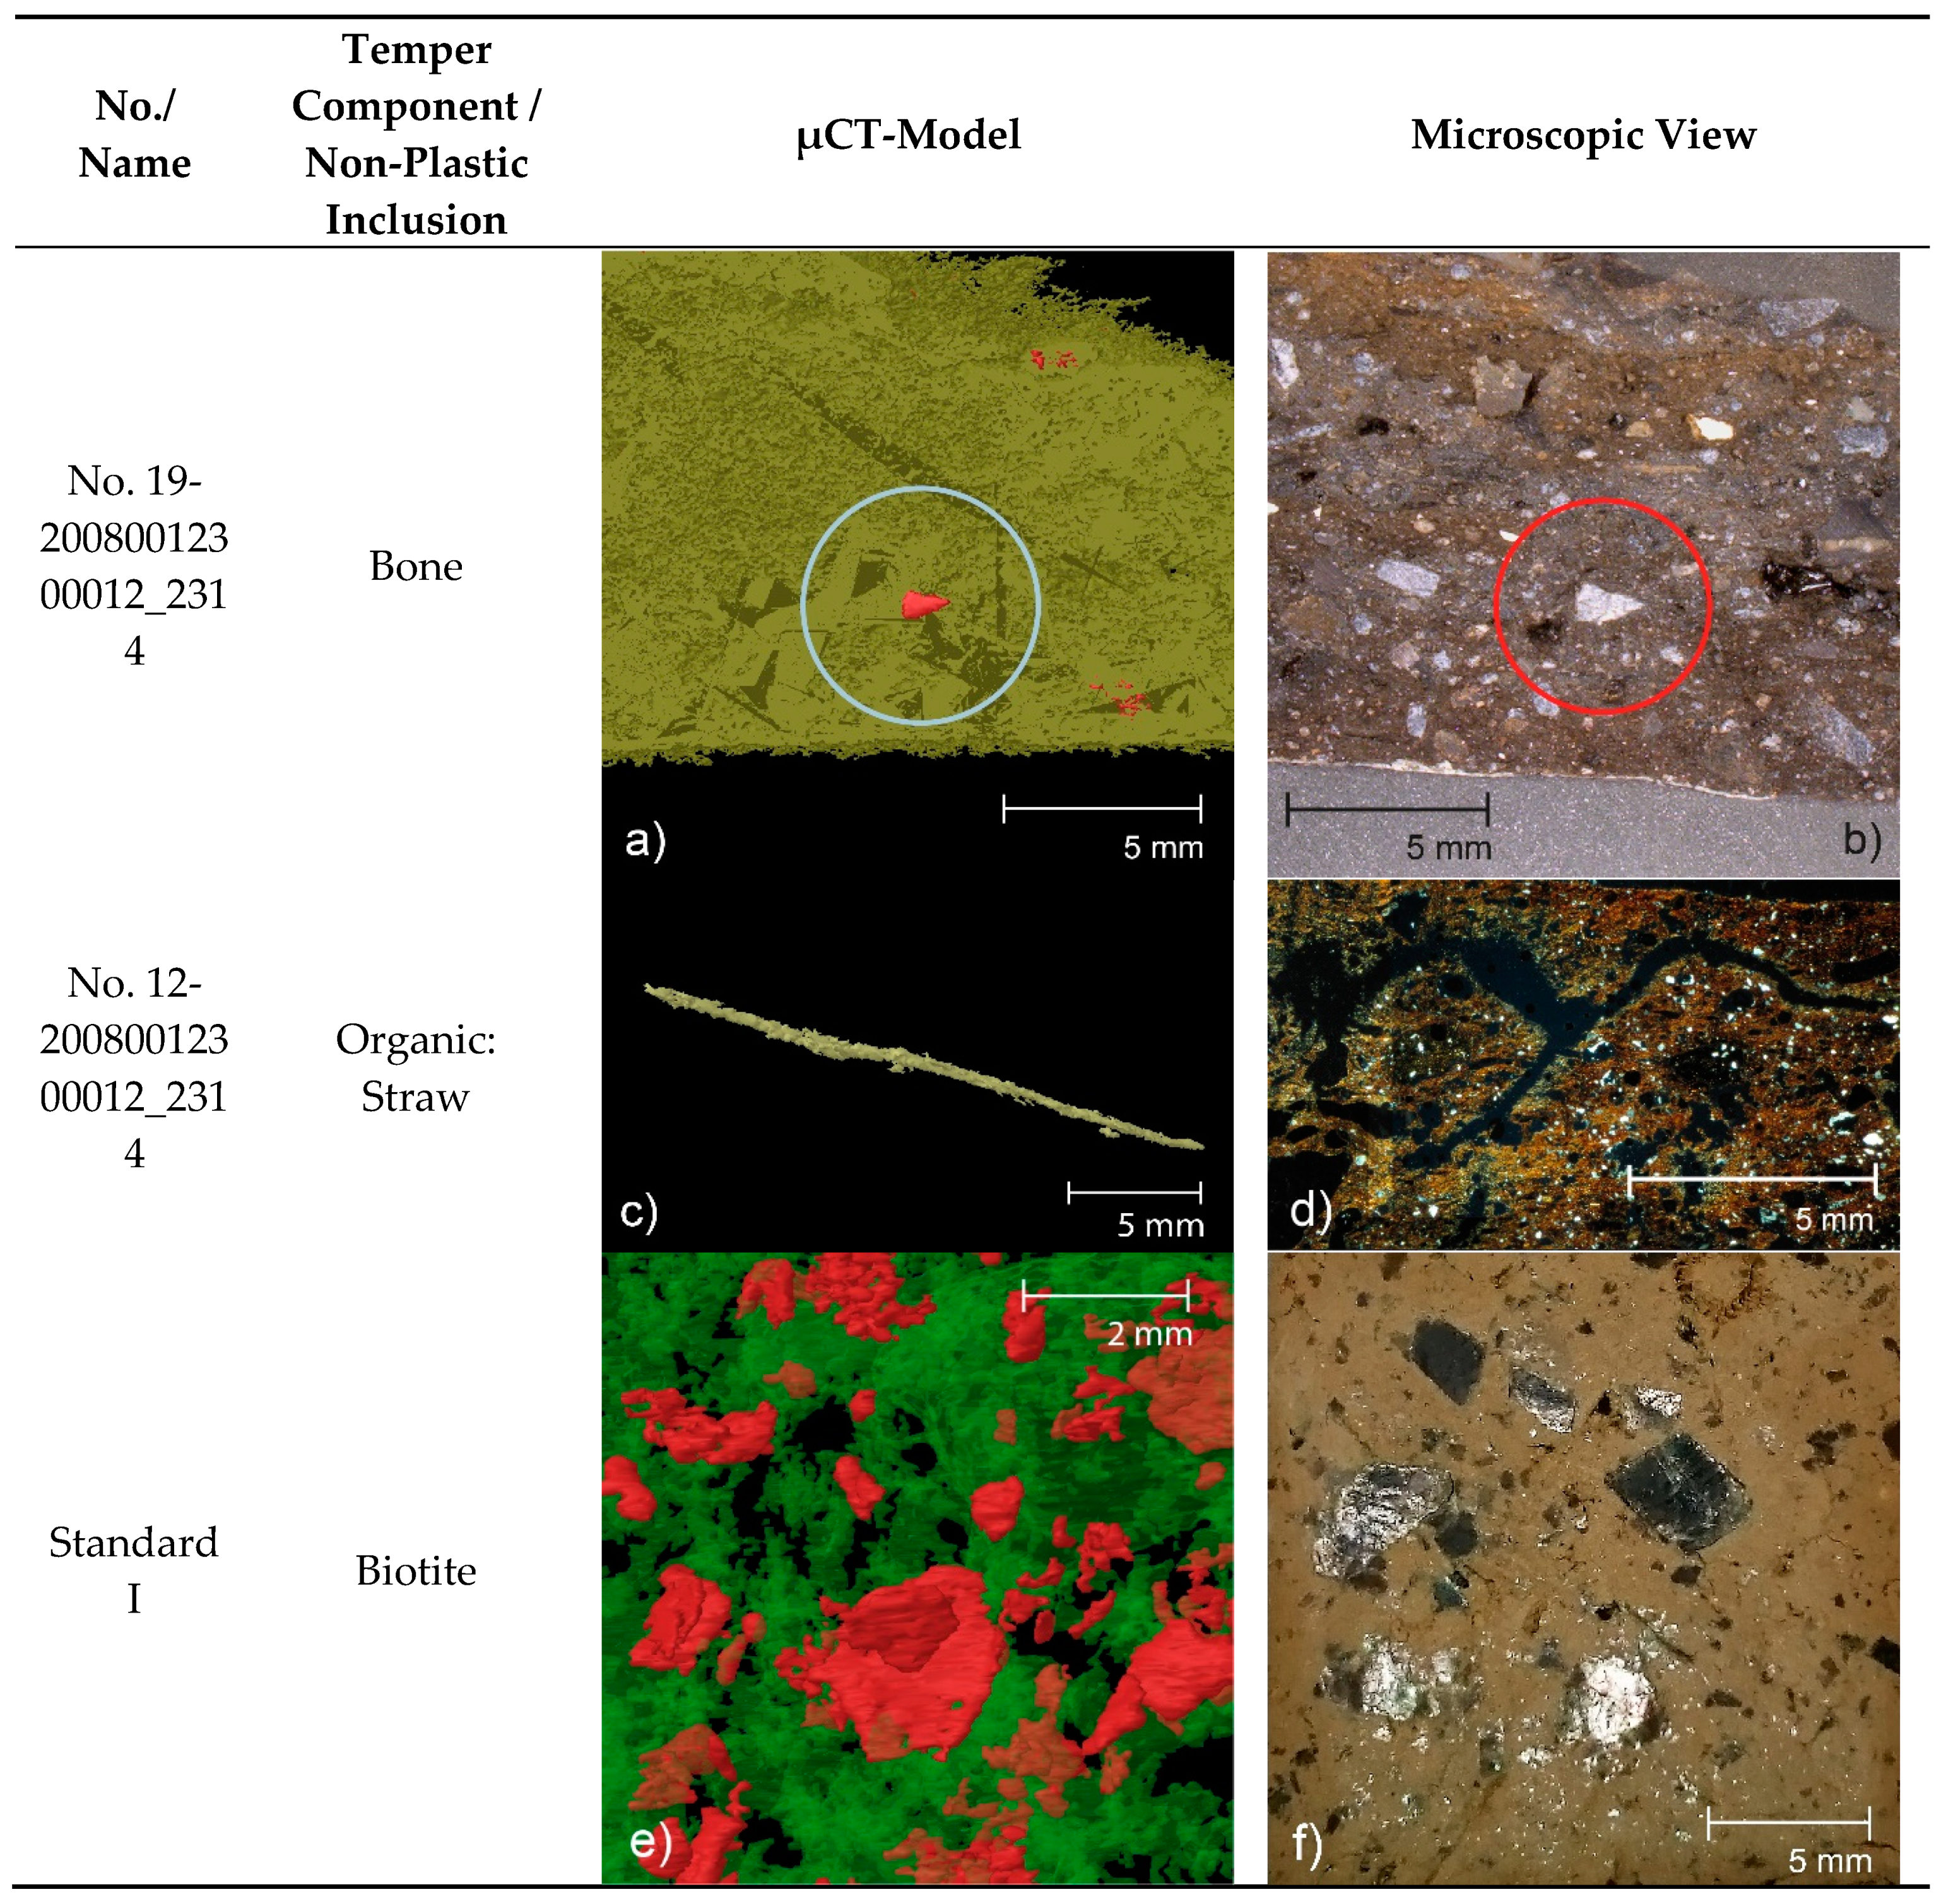
3.3. Characterisation of Components and Porosities by 2D and 3D Sections
4. Concluding Remarks and Outlook
- 1.
- Destructive method by thin sections and macroscopic investigation
- 2.
- Non-destructive method of portable XRF
- 3.
- Destructive method by pulverized samples with portable XRF and WD-XRF
- 4.
- Non-destructive method of μCT
Supplementary Materials
Author Contributions
Funding
Acknowledgments
Conflicts of Interest
References
- Behrendt, S.; Mielke, D.P.; Tagle, R. Provenienzuntersuchungen im Vergleich—Neue Wege zur archäometrischen Untersuchung phönizischer Keramik. Madr. Mitt. 2012, 53, 187–219. [Google Scholar]
- Brorsson, T.; Blank, M.; Fridén, I. Mobility and exchange in the Middle Neolithic: Provenance studies of Pitted Ware and Funnel Beaker pottery from Jutland, Denmark and the west coast of Sweden. J. Archaeol. Sci. Rep. 2018, 20, 662–674. [Google Scholar] [CrossRef]
- Ceccarelli, L.; Rossetti, I.; Primavesi, L.; Stoddart, S. Non-destructive method for the identification of ceramic production by portable X-rays Fluorescence (pXRF). A case study of amphorae manufacture in central Italy. J. Archaeol. Sci. Rep. 2016, 10, 253–262. [Google Scholar] [CrossRef]
- Daszkiewicz, M.; Schneider, G. Möglichkeiten und Grenzen zerstörungsfreier Analysen von Keramik mit pXRF. In Archäometrie und Denkmalpflege 2012, Metalla Sonderheft 5; Schlütter, F., Greiff, S., Prange, M., Eds.; Bergbaumuseum Bochum: Bochum, Germany, 2012; pp. 167–170. [Google Scholar]
- Daszkiewicz, M.; Schneider, G.; Schmid, S.G.; Bobryk, E. Grouping of Nabataean Pottery from Petra (Jordan) Using PXRF and Other Techniques. In Archäometrie und Denkmalpflege 2013, Metalla Sonderheft 6; Hauptmann, A., Mecking, O., Prange, M., Eds.; Bergbaumuseum Bochum: Bochum, Germany, 2013; pp. 138–142. [Google Scholar]
- Frahm, E. Ceramic studies using portable XRF: From experimental tempered ceramics to imports and imitations at Tell Mozan, Syria. J. Archaeol. Sci. 2018, 90, 12–38. [Google Scholar] [CrossRef]
- Frankel, D.; Webb, J.M. Pottery production and distribution in prehistoric Bronze Age Cyprus. An application of pXRF analysis. J. Archaeol. Sci. 2012, 39, 1380–1387. [Google Scholar] [CrossRef]
- Helfert, M. Die portable energiedispersive Röntgenfluoreszenzanalyse (P-ED-RFA)—Studien zu methodischen und analytischen Grundlagen ihrer Anwendung in der archäologischen Keramikforschung. In Naturwissenschaftliche Analysen vor- und Frühgeschichtlicher Keramik III. Methoden, Anwendungsbereiche, Auswertungsmöglichkeiten UPA 238; Ramminger, B., Stilborg, O., Eds.; Habelt: Bonn, Germany, 2013; pp. 14–47. [Google Scholar]
- Karacic, S.; Osborne, J.F. Eastern mediterranean economic exchange during the iron Age: Portable x-ray fluorescence and neutron activation analysis of cypriot-style pottery in the amuq valley, Turkey. PLoS ONE 2016, 11, e0166399. [Google Scholar] [CrossRef]
- Ramminger, B.; Stilborg, O. (Eds.) Naturwissenschaftliche Analysen vor- und Frühgeschichtlicher Keramik III. Methoden, Anwendungsbereiche, Auswertungsmöglichkeiten, UPA 238; Habelt: Bonn, Germany, 2013. [Google Scholar]
- Shugar, A.N.; Mass, J.L. (Eds.) Handheld XRF for Art and Archaeology; Studies in Archaeological Sciences 3 Leuven University Press: Leuven, Belgium, 2012; pp. 423–448. [Google Scholar]
- Behrendt, S.; Mielke, D.P.; Tagle, R. Die portable Röntgenfluoreszenzanalyse (p-RFA) in der Keramikforschung: Grundlagen und Potenzial. Restaur. Archäologie. Konserv. Restaur. Technol. Archäometrie 2012, 5, 93–111. [Google Scholar]
- Helfert, M.; Böhme, D. Herkunftsbestimmung von römischer Keramik mittels portabler energiedispersiver Röntgenfluoreszenzanalyse (P-ED-RFA)—Erste Ergebnisse einer anwendungsbezogenen Teststudie. In Naturwissenschaftliche Analysen vor- und Frühgeschichtlicher Keramik I. Methoden, Anwendungsbereiche, Auswertungsmöglichkeiten UPA 176; Ramminger, B., Stilborg, O., Eds.; Habelt: Bonn, Germany, 2010; pp. 11–30. [Google Scholar]
- Helfert, M.; Mecking, O. Möglichkeiten und Grenzen der portablen RFA zur Herkunftsbestimmung von Keramik. In Archäometrie und Denkmalpflege 2010, Metalla 3; Hahn, O., Hauptmann, A., Modarressi-Therani, D., Prange, M., Eds.; Bergbaumuseum Bochum: Bochum, Germany, 2010; pp. 107–109. [Google Scholar]
- Magetti, M. Chemical Analyses of Ancient Ceramics: What for? Chimia 2001, 55, 923–930. [Google Scholar]
- Schultze, E.; Liubichev, M.V.; Daszkiewicz, M.; Bobryk, E.; Schneider, G. (Eds.) Archaeoceramological Studies of Pottery from Voitenke Chernyakhov culture (Ukraine). LRCW3. Late Roman Coarse Wares, Cooking Wares and Amphorae in the Mediterranean. Archaeology and archaeometry. Comparison between western and eastern Mediterranean. BAR Int. Ser. 2010, 2185, 1023–1033. [Google Scholar]
- Menne, J. Keramik aus Megalithgräbern in Nordwestdeutschland. Interaktionen und Netzwerke der Trichterbecherwestgruppe; Frühe Monumentalität und soziale Differenzierung 16; Habelt: Bonn, Germany, 2018. [Google Scholar]
- Behrendt, S.; Mielke, D.P.; Tagle, R. Provenienzuntersuchungen im Vergleich—Neue Ansätze zur Klassifizierung von Keramik. In Archäometrie und Denkmalpflege 2010, Metalla 3; Hahn, O., Hauptmann, A., Modarressi-Therani, D., Prange, M., Eds.; Bergbaumuseum Bochum: Bochum, Germany, 2010; pp. 113–115. [Google Scholar]
- Böhme, D. Portable XRF—Möglichkeiten und Grenzen. In Archäometrie und Denkmalpflege 2010, Metalla 3; Hahn, O., Hauptmann, A., Modarressi-Therani, D., Prange, M., Eds.; Bergbaumuseum Bochum: Bochum, Germany, 2010; pp. 26–28. [Google Scholar]
- Helfert, M.; Mecking, O.; Lang, F.; Kaenel, H.-M. Neue Perspektiven für die Keramikanalytik. Zur Evaluation der portablen energiedispersiven Röntgenfluoreszenzanalyse (P-ED-RFA) als neues Verfahren für die geochemische Analyse von Keramik in der Archäologie. Frankf. Elektron. Rundsch. Altert. 2011, 14, 1–30. [Google Scholar]
- Schneider, G.; Daszkiewicz, M. Testmessungen mit einem tragbaren Gerät für engerdispersive Röntgenfluoreszenz (P-XRF) zur Bestimmung der chemischen Zusammensetzung archäologischer Keramik. In Archäometrie und Denkmalpflege 2010, Metalla 3; Hahn, O., Hauptmann, A., Modarressi-Therani, D., Prange, M., Eds.; Bergbaumuseum Bochum: Bochum, Germany, 2010; pp. 110–112. [Google Scholar]
- Daszkiewicz, M.; Schneider, G. Klassifizierung von Keramik durch Nachbrennen von Scherben. Z. Schweiz. Archäologie Kunstgesch. 2001, 58, 25–32. [Google Scholar]
- Brindley, A.L. The Typochronology of TRB West Group Pottery. Palaeohistoria 1986, 28, 93–132. [Google Scholar]
- Mennenga, M. Zwischen Elbe und Ems. Die Siedlungen der Trichterbecherkultur in Nordwestdeutschland; Frühe Monumentalität und soziale Differenzierung 13; Habelt: Bonn, Germany, 2017. [Google Scholar]
- Kramer, A.; Mennenga, M.; Nösler, D.; Jöns, H.; Bittmann, F. Neolithic Settlement and Land Use History in Northwestern Germany—First Results from an Interdisciplinary Research Project. In Siedlung, Grabenwerk, Großsteingrab. Studien zu Gesellschaft, Wirtschaft und Umwelt der Trichterbechergruppen im Nördlichen Mitteleuropa. Frühe Monumentalität und soziale Differenzierung 2; Hinz, M., Müller, J., Eds.; Habelt: Bonn, Germany, 2012; pp. 317–336. [Google Scholar]
- Kramer, A.; Bittmann, F.; Nösler, D. New insights into vegetation dynamics and settlement history in Hümmling, north-western Germany, with particular reference to the Neolithic. Veg. Hist. Archaeobotany 2014, 23, 461–478. [Google Scholar] [CrossRef]
- Behre, K.-E. Die Einengung des neolithischen Lebensraumes in Nordwestdeutschland durch klimabedingte Faktoren: Meeresspiegelanstieg und großflächige Ausbreitung von Mooren. In Klimaveränderung und Kulturwandel in Neolithischen Gesellschaften Mitteleuropas, 6700–2200 v. Chr; RGZM-Tagungen 1; Gronenborn, D., Alram-Stern, E., Eds.; RGZM: Mainz, Germany, 2005; pp. 209–220. [Google Scholar]
- Bakker, R. The emergence of agriculture on the Drenthe Plateau. A Palaeobotanical Study Supported by High-Resolution 14C Dating; DGUF Archäologische Ber; DGUF-Verlag: Kerpen, Germany, 2003. [Google Scholar]
- Castel, I.I.Y. Late Holocene eolian drift sands in Drenthe (The Netherlands). In Netherlands Geographical Studies 133; Koninklijk Nederlands Aardrijkskundig Genootschap: Amsterdam/Utrecht, The Netherlands, 1991. [Google Scholar]
- Sprockhoff, E. Atlas der Megalithgräber Deutschlands; Teil 3: Niedersachsen—Westfalen; Habelt: Bonn, Germany, 1975; Volumes 90–106, pp. 107–112. [Google Scholar]
- Schlicht, E. Vorgeschichte des Hümmlings. 1. Teil. Die Steinzeit. Ph.D. Thesis, University Kiel, Kiel, Germany, 1941. [Google Scholar]
- Schlicht, E. Arbeitsberichte und Mitteilungen. Urgeschichtliche Denkmalpflege. Fundbericht für das Jahr 1953. JbEHB 1954, 2, 193–195. [Google Scholar]
- Schlicht, E. Untersuchungen an zerstörten Megalithgräbern. In Zur Ur- und Frühgeschichte Nordwestdeutschlands. Neue Untersuchungen aus dem Gebiete zwischen Ijssel und Ostsee. Festschrift K. H. Friesen; Zylmann, P., Ed.; Lax: Hildesheim, Germany, 1956; pp. 69–70. [Google Scholar]
- Schlicht, E. Urgeschichtliche Denkmalpflege. Fundbericht für die Jahre 1954 und 1955. JbEHB 1957, 4, 137–139. [Google Scholar]
- Schlicht, E. Die Funde aus dem Megalithgrab 2 von Emmeln, Kreis Meppen; Studien zur Keramik der Trichterbecherkultur im Gebiet zwischen Weser und Zuidersee. Göttinger Schriften zur Vor- und Frühgeschichte 9; Seminar für Ur- und Frühgeschichte der Georg-August-Universität: Wachholtz Neumünster, Germany, 1968. [Google Scholar]
- Schlicht, E. Die Funde aus dem Steingrab 2 von Emmeln, Kr. Meppen. Germania 1968, 43, 351–354. [Google Scholar]
- Schlicht, E. Das Megalithgrab 7 von Gross Berssen, Kreis Meppen. Studien zur Keramik der Trichterbecherkultur im Gebiet zwischen Weser und Zuidersee. Göttinger Schriften zur Vor-und Frühgeschichte 12; Seminar für Ur- und Frühgeschichte der Georg-August-Universität: Wachholtz Neumünster, Germany, 1972. [Google Scholar]
- Schlicht, E. Meine Ausgrabungen im Rahmen der Emslanderschließung. JbEHB 1982, 28, 29–30. [Google Scholar]
- Fansa, M. Die Keramik der Trichterbecherkultur aus dem Megalithgrab 1 von Ostenwalde, Kreis Aschendorf-Hümmling. Ein Versuch zur Klassifikation und Dokumentation steinzeitlicher Keramik. Neue Ausgrab. Forsch. Niedersachs. 1978, 12, 33–77. [Google Scholar]
- Tempel, W.D. Bericht über die Ausgrabung des Megalithgrabes I in Ostenwalde, Gemeinde Werlte, Kreis Aschendorf-Hümmling. Neue Ausgrab. Forsch. Niedersachs. 1978, 12, 1–31. [Google Scholar]
- Struckmeyer, K. Keramikanalysen an Funden aus Emmeln 2, Groß Berßen 7 und Werpeloh 43, Ldkr. Emsland. In Keramik aus Megalithgräbern in Nordwestdeutschland. Interaktionen und Netzwerke der Trichterbecherwestgruppe; Frühe Monumentalität und soziale Differenzierung 16; Menne, J., Ed.; Habelt: Bonn, Germany, 2018; pp. 315–319. [Google Scholar]
- Struckmeyer, K. Keramikanalysen an Funden aus Flögeln, Ldkr. Cuxhaven, Lavenstedt, Ldkr. Rotenburg (Wümme), und Visbek, Ldkr. Vechta. In Zwischen Elbe und Ems. Die Siedlungen der Trichterbecherkultur in Nordwestdeutschland; Frühe Monumentalität und soziale Differenzierung 13; Mennenga, M., Ed.; Habelt: Bonn, Germany, 2017; pp. 421–435. [Google Scholar]
- Struckmeyer, K. Archäometrische Analysen an Keramikmaterial aus Nordwestdeutschland. Siedl. Küstenforschung Südlichen Nordseegebiet 2015, 38, 107–121. [Google Scholar]
- Struckmeyer, K. Archäometrische Analysen an Keramik aus dem Megalithgrab “Denghoog” (LA 85). In Denghoog–Großeibstadt–Rastorf; Frühe Monumentalität und soziale Differenzierung 5; Wunderlich, M., Koch, J.K., Dieck, P., Eds.; Habelt: Bonn, Germany, 2014; pp. 127–132. [Google Scholar]
- Struckmeyer, K. Archaeometric Analysis of Pottery Technology in the Funnel Beaker Culture. A case study: Tannenhausen, East Frisia (Germany). J. Neolithic Archaeol. 2013, 15, 55–63. [Google Scholar]
- Baier, I.; Struckmeyer, K. Tonangebend! Archäometrische Methoden in der Keramikanalyse. Archäologie Niedersachs. 2017, 20, 97–100. [Google Scholar]
- Nösler, D.; Struckmeyer, K.; Jöns, H. Neue Forschungen zur Tradition, Technologie und Kommunikationsstrukturen des Töpferhandwerks der Trichterbecherkultur—Erste Ergebnisse archäometrischer Untersuchungen. In Siedlung, Grabenwerk, Großsteingrab. Studien zu Gesellschaft, Wirtschaft und Umwelt der Trichterbechergruppen im nördlichen Mitteleuropa; Frühe Monumentalität und soziale Differenzierung 2; Hinz, M., Müller, J., Eds.; Habelt: Bonn, Germany, 2012; pp. 463–471. [Google Scholar]
- Dreibrodt, S.; Furholt, M.; Hofmann, R.; Hinz, M.; Cheben, I. P-ed-XRF-geochemical signatures of a 7300 year old Linear Band Pottery house ditch fill at Vráble-Vel’lké Lehemby, Slovakia-House inhabitation and post-deposital processes. Quat. Int. 2017, 438, 131–143. [Google Scholar] [CrossRef] [Green Version]
- Hunt, A.M.W.; Speakman, R.J. Portable XRF analysis of archaeological sediments and ceramics. J. Archaeol. Sci. 2015, 53, 626–638. [Google Scholar] [CrossRef]
- Speakman, R.J.; Little, N.C.; Creel, D.; Miller, M.R.; Inanez, J.G. Sourcing ceramics with portable XRF spectrometers? A comparison with INAA using Mimbres pottery from the American Southwest. J. Archaeol. Sci. 2011, 38, 3483–3496. [Google Scholar] [CrossRef]
- Daszkiewicz, M.; Schneider, G. Analysis of chemical composition of ancient ceramics. Novensia 2014, 25, 200–206. [Google Scholar]
- Schiavon, N.; Soria, V.; Arruda, A.M.; Beltrame, M.; Mirao, J. “Losanga” decorated imitations of Italic Late Republican black gloss tableware from South-Western Iberia: A multi-analytical/microchemical characterization. Microchem. J. 2016, 124, 712–718. [Google Scholar] [CrossRef]
- International Atomic Energy Agency. Survey of Reference Materials. Environmentally Related Reference Volumes 2, Materials for Trace Elements, Nuclides and Microcontaminants, IAEA-TECDOC 1996, 880. Available online: https://inis.iaea.org/collection/NCLCollectionStore/_Public/27/059/27059426.pdf (accessed on 21 October 2020).
- Kahl, W.-A.; Hinkes, R.; Feeser, V.; Holzheid, A. Microfabric and anisotropy of elastic waves in sandstone—An observation using high-resolution X-ray microtomography. J. Struct. Geol. 2013, 49, 35–49. [Google Scholar] [CrossRef]
- Daszkiewicz, M.; Schneider, G.; Baranowski, M.; Petrut, D.; Rusu-Bolindeţ, V.; Man, N. Moesian and Dacian sigillata—Exploring regional patterns. A methodological approach using chemical analysis by WD-XRF and p-ED-XRF. Rei CretariÆ RomanÆ Fautorum Acta 2018, 45, 541–559. [Google Scholar]


| No. | Sample | Site | Cate-Gory 1 | X-ray Micro-Tomography | Thin Section No. 2 | Portable XRF Fracture | Portable XRF Powder | WD-XRF |
|---|---|---|---|---|---|---|---|---|
| 1 | 20080021200009_2253 | WP43 | 4/b | ✓ | ✓ | ✓ | ✓ | |
| 2 | 20080015500007_2281 | WP43 | 5/b | ✓ | 360 | ✓ | ✓ | ✓ |
| 3 | 20080027800005_0 | WP43 | s | ✓ | 362 | ✓ | ✓ | ✓ |
| 4 | 20080024000005_125 | WP43 | f | ✓ | ✓ | ✓ | ✓ | |
| 5 | 20080031400002_2325 | WP43 | f | ✓ | 358 | ✓ | ✓ | ✓ |
| 6 | 20080118100021_603 | E2 | 3/b | ✓ | 369 | ✓ | ✓ | ✓ |
| 7 | 20080020100025_1112 | E2 | 4/b | ✓ | ✓ | ✓ | ✓ | |
| 8 | 20080020100013_796 | E2 | 4/b | ✓ | 370 | ✓ | ✓ | ✓ |
| 9 | 20080107300006_1310 | E2 | f | ✓ | ✓ | ✓ | ✓ | |
| 10 | 20080107300009_1138 | E2 | f | ✓ | 367 | ✓ | ✓ | ✓ |
| 11 | 20080029600055_2221 | GB7 | 3/b | ✓ | ✓ | ✓ | ✓ | |
| 12 | 20080029600009_2008 | GB7 | 5/b | ✓ | ✓ | ✓ | ✓ | |
| 13 | 20080022500017_2106 | GB7 | c | ✓ | 364 | ✓ | ✓ | ✓ |
| 14 | 20080011500010_2077 | GB7 | f | ✓ | ✓ | ✓ | ✓ | |
| 15 | 20080022500016_2103 | GB7 | f | ✓ | ✓ | ✓ | ✓ | |
| 16 | 20080020100013_769_ht | E2 | 4/b | 370 | ✓ | |||
| 17 | 20080015500007_2281_ht | WP43 | 5/b | 360 | ✓ | |||
| 18 | 20080027800005_0_ht | WP43 | s | 362 | ✓ | |||
| 19 | 20080012300012_2314 | WP 43 | s | ✓ | 361 | |||
| 20 | Standard I | ✓ | ||||||
| 21 | Standard II | ✓ |
| Standard GBW07411 | |||||
|---|---|---|---|---|---|
| Element | Literature [53] | I After Maintenance 2014 Mean ± Standard Deviation | II Before Maintenance 2019 Mean ± Standard Deviation | III After Maintenance 2019 Mean ± Standard Deviation | IV With New X-ray Tube in 2019 1 Mean ± Standard Deviation |
| Ce [ppm] | 66.3 | 68 ± 5 | 91 ± 8 | 90 ± 4 | 88 ± 5 |
| Ba [ppm] | 550 | 668 ± 12 | 692 ± 24 | 766 ± 21 | 757 ± 27 |
| Sn [ppm] | 64.3 | 31 ± 2 | 35 ± 2 | 70 ± 2 | 70 ± 3 |
| Cd [ppm] | 28.2 | 28 ± 3 | 28 ± 2 | 34 ± 3 | 33 ± 3 |
| Nb [ppm] | 15.1 | 11 ± 1 | 18 ± 2 | 13 ± 1 | 13 ± 1 |
| Zr [ppm] | 192 | 184 ± 2 | 182 ± 2 | 191 ± 3 | 190 ± 3 |
| Y [ppm] | 24.2 | 25 ± 2 | 25 ± 2 | 24 ± 1 | 24 ± 1 |
| Sr [ppm] | 130 | 129 ± 1 | 86 ± 1 | 128 ± 1 | 128 ± 1 |
| Rb [ppm] | 111 | 114 ± 2 | 115 ± 1 | 118 ± 2 | 118 ± 1 |
| As [ppm] | 205 | 169 ± 8 | 162 ± 10 | 150 ± 9 | 159 ± 12 |
| Pb [ppm] | 2700 | 2865 ± 29 | 2677 ± 16 | 2707 ± 10 | 2708 ± 10 |
| Zn [ppm] | 3800 | 3826 ± 3 | 3857 ± 10 | 3812 ± 19 | 3810 ± 17 |
| Cu [ppm] | 65.4 | 50 ± 6 | 42 ± 3 | 62 ± 4 | 60 ± 6 |
| Fe [wt.%] | 5.60 | 5.70 ± 0.04 | 5.54 ± 0.01 | 5.57 ± 0.01 | 5.57 ± 0.01 |
| Mn [wt.%] | 0.97 | 0.96 ± 0.01 | 0.92 ± 0.01 | 0.98 ± 0.01 | 0.98 ± 0.01 |
| Cr [ppm] | 59.6 | 113 ± 20 | 117 ± 10 | 147 ± 13 | 146 ± 12 |
| V [ppm] | 88.5 | 94.2 ± 12 | 90 ± 12 | 93 ± 10 | 95 ± 25 |
| Ti [ppm] | 4100 | 3855 ± 167 | 3624 ± 185 | 4474 ± 155 | 4483 ± 170 |
| Ca [wt.%] | 3.1 | 3.1 ± 0.04 | 3.1 ± 0.02 | 3.1 ± 0.01 | 3.1 ± 0.02 |
| K [wt.%] | 1.7 | 1.7 ± 0.02 | 1.7 ± 0.03 | 1.7 ± 0.01 | 1.7 ± 0.01 |
| Al [wt.%] | 6.4 | 3.2 ± 0.38 | 5.9 ± 0.51 | 6.1 ± 0.16 | 5.9 ± 0.41 |
| P [ppm] | 1400 | 3227 ± 134 | 1155 ± 163 | 1179 ± 49.3 | 1139 ± 77.4 |
| Si [wt.%] | 22 | 15 ± 0.95 | 20 ± 1.44 | 23 ± 0.47 | 22 ± 0.94 |
| Mg [wt.%] | 2.20 | 0.61 ± 0.14 | 1.86 ± 0.16 | 1.88 ± 0.06 | 1.88 ± 0.16 |
| bal [ppm] | n/a 2 | 680,827 | 599,993 | 563,506 | 572,249 |
| Ink Filler Ball Diameters | Volume of One Ball | Volume of All Balls | Volume of Pore Space 1 | Pore Space [%] |
|---|---|---|---|---|
| 2.4 mm (minimum) | 7.2 mm3 | 702 mm3 | 1513 mm3 | 68 |
| 2.5 mm (average) | 8.3 mm3 | 794 mm3 | 1421 mm3 | 64 |
| 2.6 mm (maximum) | 9.2 mm3 | 893 mm3 | 1322 mm3 | 60 |
| No. | Sample | Sample Overview | Macroscopic Description | Thin Section | Description Thin Section 1 | ||
|---|---|---|---|---|---|---|---|
| (1) | (2) | (3) | |||||
| 1 | 20080021200009_2253 | 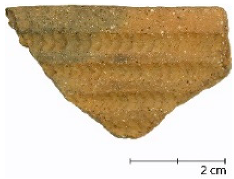 | ++++ | + | qtz, (altered) fsp, mafic minerals (?) | 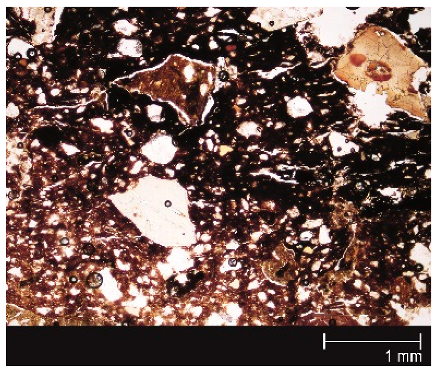 | |
| 2 | 20080015500007_2281 |  | +++ | + | qtz, (altered) fsp, mafic minerals (?), rock fragments (?) | 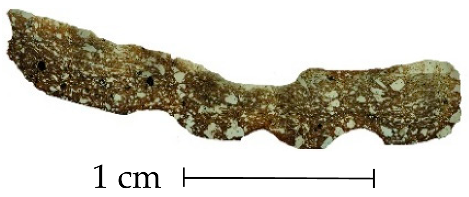 | rock fragments (granitic components), qtz, organic components |
 | |||||||
| 3 | 20080027800005_0 | 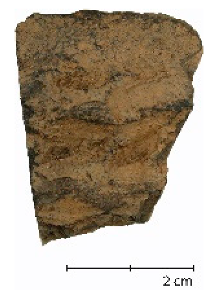 | ++ | ++ | qtz, (altered) fsp, mafic minerals (?), rock fragments (?) | 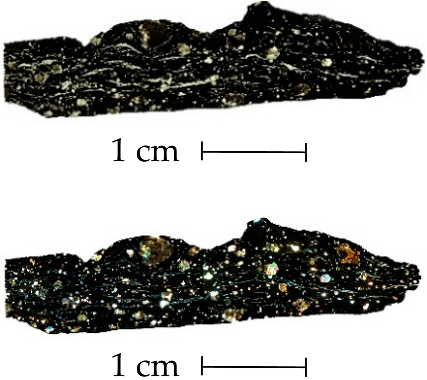 | |
| 4 | 20080024000005_125 | 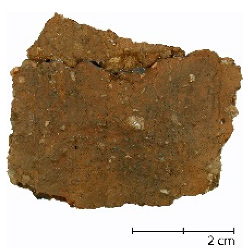 | + | +++ | qtz, fsp | ||
| 5 | 20080031400002_2325 | 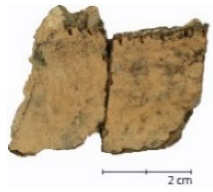 | +++++ | +++++ | qtz, fsp (?) | 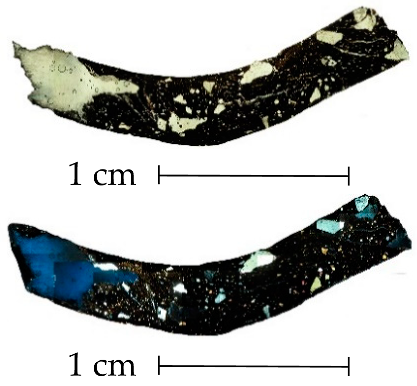 | rock fragments (granitic components), qtz, organic components |
| 6 | 20080118100021_603 | 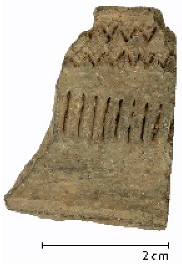 | +++++ | + | qtz, fsp (?) | 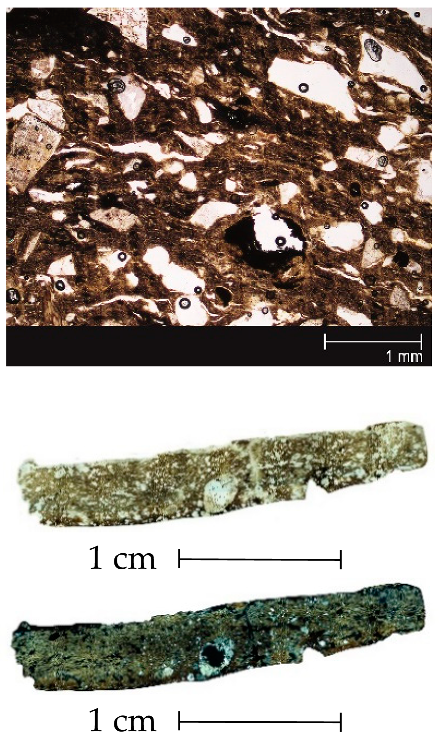 | rock fragments (granitic components), qtz |
| 7 | 20080020100025_1112 | 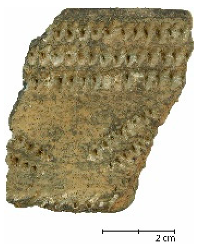 | + | +(+) | qtz, fsp (?) | ||
| 8 | 20080020100013_796 |  | ++ | ++ | qtz, fsp (?) | 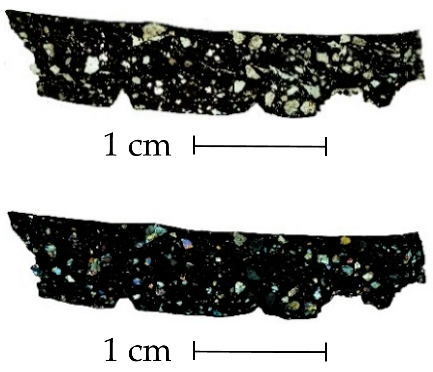 | rock fragments (granitic components), qtz, organic components |
| 9 | 20080107300006_1310 |  | +++ | +(+) | qtz, fsp | ||
| 10 | 20080107300009_1138 |  | ++++ | +(+) | qtz, fsp |  | rock fragments (granitic components), qtz |
| 11 | 20080029600055_2221 |  | ++++ | +(+) | qtz, fsp | ||
| 12 | 20080029600009_2008 |  | +++ | +(+) | qtz, fsp | ||
| 13 | 20080022500017_2106 |  | ++ | ++(+) | qtz, fsp | 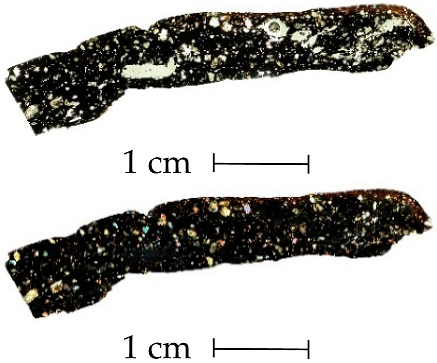 | rock fragments (granitic components), qtz |
| 14 | 20080011500010_2077 | 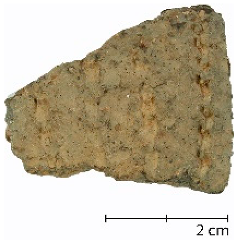 | + | +++ | qtz, fsp (?) | ||
| 15 | 20080022500016_2103 | 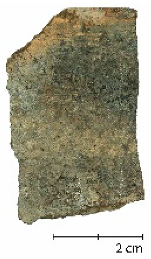 | +++++ | ++ | qtz, fsp (?) (very small frag-ments) | ||
| No.1 | Category 2 | Total Object Volume in mm³ | Porosity in %3 | 3D Section of 1 × 1 cm | 2D (Detail) Slice of 3D Section |
|---|---|---|---|---|---|
| 6 | 3 | 2062 | 6.65 | 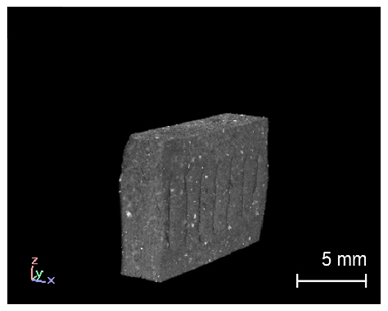 | 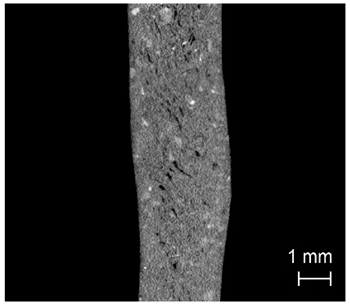 |
| 11 | 3 | 2791 | 5.94 |  | 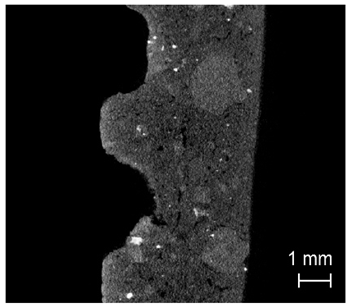 |
| 1 | 4 | 1783 | 5.01 | 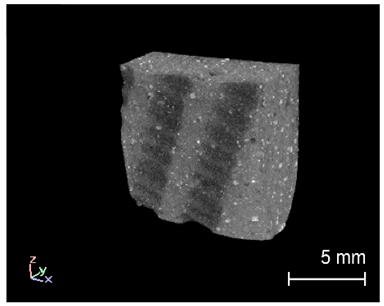 | 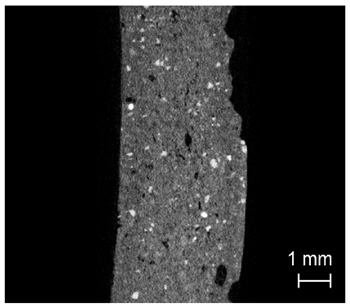 |
| 7 | 4 | 5701 | 10.88 |  | 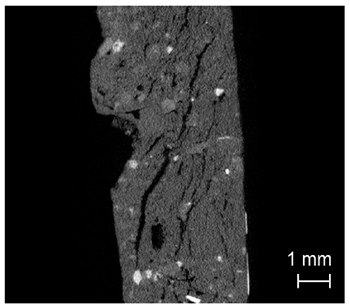 |
| 8 | 4 | 5618 | 7.23 | 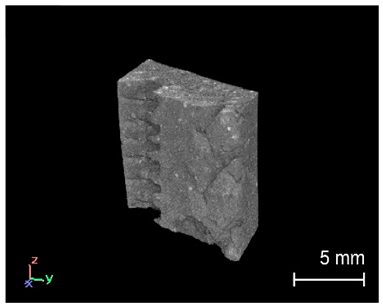 | 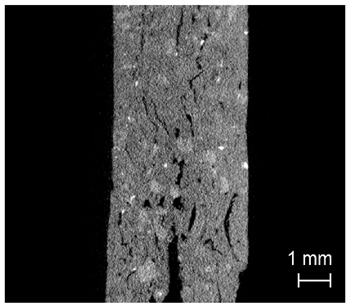 |
| 2 | 5 | 1169 | 1.48 |  | 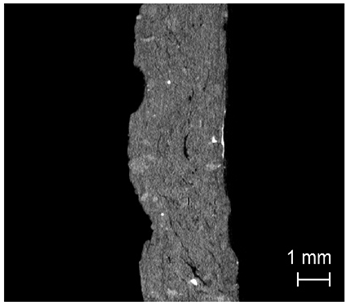 |
| 12 | 5 | 2321 | 2.93 |  |  |
| 4 | f | 2824 | 12.20 | 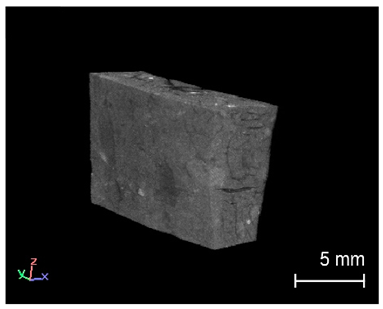 | 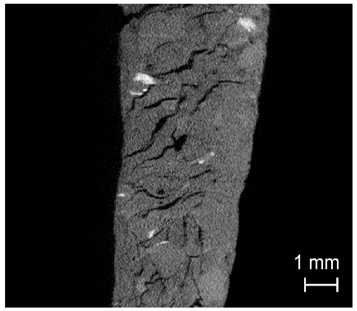 |
| 5 | f | 1167 | 3.37 | 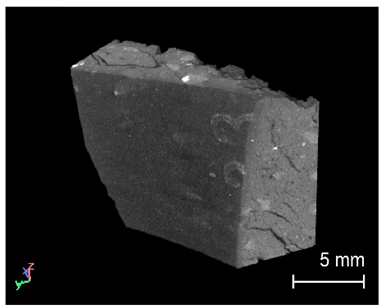 | 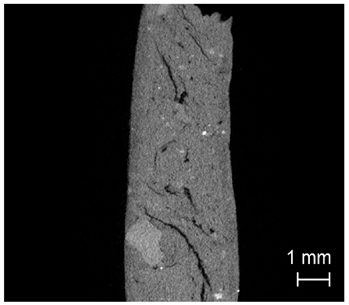 |
| 9 | f | 1638 | 1.98 |  |  |
| 10 | f | 1507 | 5.99 | 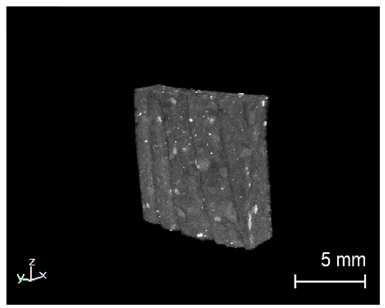 | 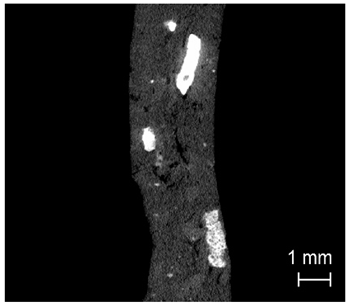 |
| 14 | f | 2276 | 1.81 | 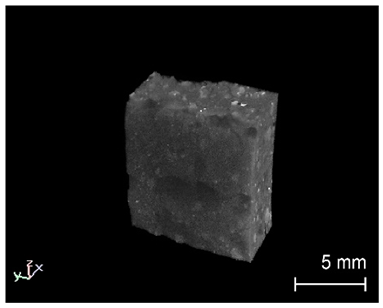 | 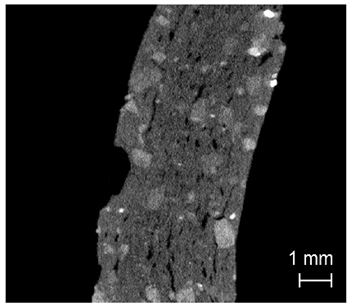 |
| 15 | f | 4076 | 6.47 | 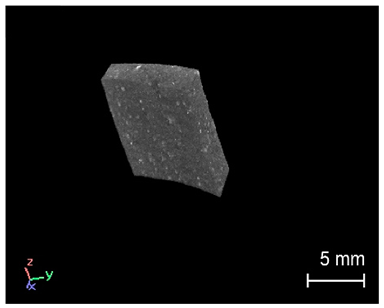 |  |
| 13 | c | 923 | 4.95 |  | 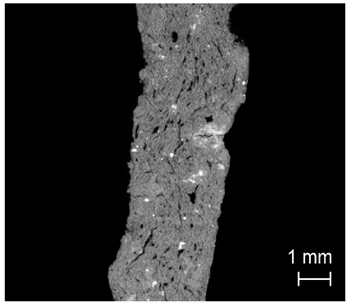 |
| 3 | s | 2672 | 4.30 | 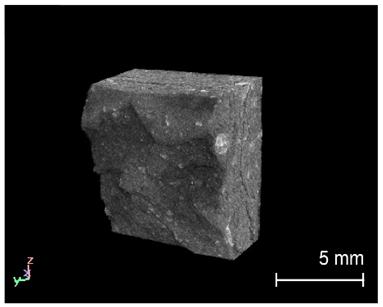 | 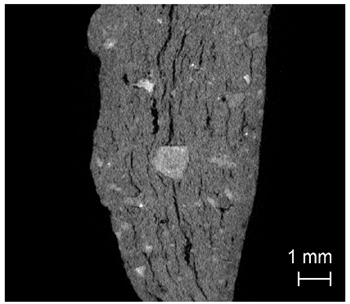 |
Publisher’s Note: MDPI stays neutral with regard to jurisdictional claims in published maps and institutional affiliations. |
© 2020 by the authors. Licensee MDPI, Basel, Switzerland. This article is an open access article distributed under the terms and conditions of the Creative Commons Attribution (CC BY) license (http://creativecommons.org/licenses/by/4.0/).
Share and Cite
Menne, J.; Holzheid, A.; Heilmann, C. Multi-Scale Measurements of Neolithic Ceramics—A Methodological Comparison of Portable Energy-Dispersive XRF, Wavelength-Dispersive XRF, and Microcomputer Tomography. Minerals 2020, 10, 931. https://doi.org/10.3390/min10100931
Menne J, Holzheid A, Heilmann C. Multi-Scale Measurements of Neolithic Ceramics—A Methodological Comparison of Portable Energy-Dispersive XRF, Wavelength-Dispersive XRF, and Microcomputer Tomography. Minerals. 2020; 10(10):931. https://doi.org/10.3390/min10100931
Chicago/Turabian StyleMenne, Julia, Astrid Holzheid, and Christopher Heilmann. 2020. "Multi-Scale Measurements of Neolithic Ceramics—A Methodological Comparison of Portable Energy-Dispersive XRF, Wavelength-Dispersive XRF, and Microcomputer Tomography" Minerals 10, no. 10: 931. https://doi.org/10.3390/min10100931