Article

Microbial Origin of the Organic Matter Preserved in the Cayo Coco Lagoonal Network, Cuba

1
Biogéosciences, UMR 6282 CNRS, Université Bourgogne Franche-Comté, 6 Boulevard Gabriel, 21000 Dijon, France
2
Departments of Marine Sciences & Geosciences, University of Connecticut, Groton, CT 06340, USA
*
Author to whom correspondence should be addressed.
Minerals 2020, 10(2), 143; https://doi.org/10.3390/min10020143
Submission received: 29 November 2019 / Revised: 3 February 2020 / Accepted: 4 February 2020 / Published: 7 February 2020
(This article belongs to the Special Issue Microbialites: Preservation of Extant and Extinct Systems)

Abstract

:
The southern part of the tropical Cayo Coco Island (Cuba) hosts a complex, highly evaporative and marine-fed lagoonal network. In the easternmost lagoon of this network, hypersaline conditions favour the development of complex sedimentary microbial ecosystems within the water column at the bottom water-sediment interface and on the shore. Some of these ecosystems are producing microbial mats and biofilms with variable mineralisation rates, depending on their location. Since the mineralisation of these microbial deposits is rare, the sedimentary record does not provide a direct window on the evolution of these ecosystems or their distribution through space and time. However, microbial deposits also produce copious amounts of organic matter, which may be used to decipher any microbial-related origin within the sedimentary record. Microbial mats and biofilms were identified as the potential source of organic material in addition to the surrounding mangrove, soils and suspended particulate matter (SPM). The origin and evolution of the sedimentary organic matter preserved within the lagoonal sediments has been analysed using geochemical parameters such as elemental (TOC, TN and [C/N]atomic ratio) and isotopic (δ13Corg and δ15NTN) signals on four sedimentary cores retrieved from different locations in the lagoon and compared with the geochemical signatures of the potential sources. Despite the high potential for organic matter accumulation in the studied lagoon, the TOC and TN downcore values in sediments that were analysed (i.e., micritic muds and bioclastic sands) remain very low compared to the sediment-water interface. The relative contributions of the different potential sources of organic matter were estimated using [C/N]atomic ratios and δ13Corg values. The δ15NTN signature was discarded as a source signature as it records synsedimentary, early diagenetic, secondary evolution of the nitrogen signal associated with OM remineralisation (i.e., denitrification). Finally, among the microbial deposits, the slime recognised in the permanently submersed zone of the waterbody appears to be the main contributor to the organic matter preserved within the sediments of the lagoon. SPM, mainly composed of microbial-rich particles, also contribute and cannot be ruled out as a source.

1. Introduction

Coastal lagoons are shallow, semi-enclosed waterbodies which are temporally or permanently connected with the open sea through one or several inlets. These ecosystems are characterised by the mixing of saline and fresh waters, and typically support abundant life and specific ecosystems. These coastal environments often accumulate copious amount of organic matter [1]. However, degradation processes (biotic or abiotic) drastically reduce the amount of organic matter that can be trapped and ultimately preserved. Sediments are an important sink for a wide range of nutrients, and act as reservoirs for organic matter [2,3]. The sedimentary organic matter in coastal lagoons mainly originates from in situ primary production and recycling, terrestrial inputs (e.g., soils, plants) and bacterial production within the sediments itself [3]. The relative contribution of these sources depends on local environmental factors such as the climate, hydrodynamic conditions, nutrient supply and redox conditions of the water column and sediments. Variations in these factors may modify the abundance and composition of sedimentary organic matter [4,5]. As the composition of the organic matter and its susceptibility to remineralisation depend on the origin (e.g., terrestrial, marine, microbial-derived, plant-derived), it appears crucial to assess the relative contribution of the different sources to understand the mechanisms of preservation of organic matter and their role in biogeochemical cycles [6]. Owing to hydrocarbon exploration, numerous studies have investigated the dynamics of organic matter in marine environments [7,8,9,10]. A combination of different geochemical proxies, such as the total organic carbon to nitrogen (C/N) ratio and stable carbon and nitrogen isotopes have been used to identify the sources of organic matter in marine settings [11,12]. However, the use of these geochemical proxies can be applied to investigate biogeochemical processes in coastal lagoons.
Coastal sediments provide a high-resolution geological record, especially that of recent time. Temporal and spatial environmental changes (natural or anthropogenic), notably those of organic matter, are captured in the sediment column [13,14,15,16,17,18,19,20]. Recently, organic carbon dynamics and cycle have been the focus of several studies in lagoonal environments in the tropics [7,21,22,23,24,25,26,27,28]. However, data from Cuba are scarce. Alonso-Hernandez et al. [21] investigated carbon and nitrogen elemental composition and isotopic signals in a core collected from a coastal lagoon (Guanaroca) situated on the south side of the island. The main sources of organic matter to sediments identified in that study were a mixture of terrestrial vascular plants (~48%) and freshwater phytoplankton (~8%), with minimal contribution from the marine component (~16%). The respective contribution of these different sources could have been modified by anthropogenic activities in recent decades [21]. However, active management since 1980 has allowed the Guanaroca lagoon to gradually regain the ability to exchange freshwater [21]. As a consequence, the sources of organic matter appear to return to their natural (pre-anthropogenic) configuration.
The lagoonal systems located in the north coast of Cuba (Atlantic Ocean) have not been subject to organic matter-focused studies. Specifically, the Cayo Coco lagoonal network may differ from the southern Cuba lagoons by its abundant microbial deposits, which thrive in this system and whose role is frequently underestimated [29,30]. The microbial deposits showed a carbonate mineralisation potential varying from no mineralisation to the formation of a thin continuous carbonate crust [29]. The capacity of the microbial mats to be mineralised depends on external factors (e.g., fluctuation of immersion and emersion, hydrological balance, water circulation, bathymetry, salinity, temperature and alkalinity) or internal factors (ecological interactions, metabolic activities coexisting in microbial mats) [29,30,31,32,33,34,35,36]. The characterisation of organic matter in and near the Cayo Coco lagoonal network offers an opportunity to discuss the origin, transformation modalities and preservation potential in the fossil record. This work in the Cayo Coco lagoonal network: (1) identifies the main sources of organic matter and analyses the isotopic and elemental compositions; (2) characterises the pathway of organic matter transformation in the sediments through the study of four cores collected in a transect crossing the lagoon; and (3) discusses the potential of preservation of the organic matter in the sedimentary record.

2. Setting

Cayo Coco is located in the northern coast of Cuba, facing the Atlantic Ocean (Figure 1). This area experiences a tropical savannah climate, with a dry season extending from November to April, and a wet season from May to October [37]. Two maxima in precipitation are recorded during the wet season, the first in June and the second one in September/October, contributing a large part of the ca. 1000 mm annual precipitations [37]. However, excess in annual evaporation (from 2100 to 2200 mm; [38]) leads to a strongly negative hydrological balance. The vegetation is dominated by mangrove in the south and west of the island and a dry evergreen forest in the north and east [39]. Palynological investigations performed on a core from a coastal sinkhole (Cenote Jennifer) indicate that (i) mangrove and associated vegetation were dominant since 2500 cal yr BP [40], and (ii) no major vegetation changes have occurred during this period. Analysis of sediments from a nearby lagoon (Laguna de Leche [41]) confirmed that no major environmental changes (including climatic) have impacted the vegetation of this area during the late Holocene.
Cayo Coco, a part of the 200 km long “Jardines del Rey” archipelago, extends over 370 km², and is associated with an active coral reef (Figure 1A). This island is separated from the mainland by a ca. 20 km wide, shallow, marine fed, embayment locally referred to as Perros Bay (Figure 1B). Despite constant connections with the Atlantic Ocean through a few channels, Perros Bay experiences frequent shifts to hypersaline conditions (up to 80‰; [29,42,43]). The large seasonal variations in salinity (from ca. 30‰ to 70‰ [44]) and temperature (monthly averages ranging from 20.0 to 32.5 °C [37]) result from the combined effects of the changes in seawater input, the shallow water depth (<3 m, with 40% of the embayment is 30–50 cm deep) and the fluctuating meteorological conditions. The construction of an artificial causeway crossing Perros Bay further modified the water circulation in the embayment, especially on the western side, where the surface seawater inputs are limited.
The south side of Cayo Coco comprises a complex lagoonal network with successive partially to fully connected shallow (<1 m) lagoons (Figure 1C). Each lagoon constitutes a depression presenting an egg shape (NNE-SSE elongation), 500 m in width and ranging from 500 m to 1000 m in length. The lagoonal network is positioned over a Pleistocene substratum composed of highly pedogenised limestones [29]. These limestones initially consist of ooid and bioclastic wackestones to grainstones deposited in shoreface to lagoonal environments. A reworking of the deposits by aeolian processes forming coastal dunes explains the peculiar morphography of the actual lagoonal network. Paleodunes represent topographic highs separating the individual lagoons that formed in depressions between them [29]. A strong pedogenesis, indicated by the presence of rhizocretions, micritisation and grainification processes, affected these deposits before lithification was complete, suggesting early emersion periods [29]. The shape of the substratum, and thus, of the network, limits surface water circulation, further restricting the water mass. As the Cayo Coco lagoonal network is connected to Perros Bay to the west, the restriction gradually increases toward the east where the lagoonal network is closed. The result is a spatial variation of the physical, chemical and biological properties along a west-east transect [29], progressively excluding grazers and increasing the saturation index of carbonate minerals. This condition supports the development of extensive microbial mats, the abundance and mineralisation potential of which increase with the degree of restriction. In addition to these spatial gradients, the water level of the lagoonal network, and thus, the surface water circulation potential, changes with changing meteorological conditions. Intense rainy episodes during summer lead to an increase of the water level, which may exceed the elevation of the inter-lagoons highs, and result in an effective surface circulation in the entire lagoonal network [29]. In contrast, the surface flow is limited or even stops in the eastern part of the network, the farthest removed from the connections with Perros Bay, during the dry period. Satellite and aerial images have shown that a dynamic water level equilibrium is maintained throughout the network, even when some lagoons are disconnected from surface flow. This suggests a subsurface water exchange with Perros Bay, ensuring persistent flooding of all the lagoons in the network.
Our study focused on the easternmost lagoon of the network (Figure 2), which harbours the greatest microbial mat diversity and abundance of the network [29] and is in close proximity to mangroves. This lagoon is disconnected from the others most of the time. The connection is restored only when the water level rises high enough to flood an ephemeral channel crossing the 50 m wide bioclastic bar separating this lagoon from its western neighbour, or when the water level exceeds the elevation of the entire bar. These alternating conditions between confinement and semi-opening lead to fluctuations in the physico-chemical conditions. The salinity varies annually between 54‰ (wet season, July 2014) and 75‰ (dry season, January 2013). Moreover, some metazoans tolerate sustained hypersaline conditions, but rapid fluctuations prevent nonversatile species from becoming established. As a result, the metazoan diversity of this lagoon is low, limited to a few fish-, insect-, gastropod- and arthropod-species, especially during the dry season associated with higher salinity values. Substantial accumulation of bivalve (Anomalocardia auberiana) and gastropod (mostly Cerithium eburneum) shells are encountered around the edges of the lagoon and in cores, but none are currently alive.

3. Materials and Methods

3.1. Sampling and Preparation

Sediments cores were sampled using 5 cm diameter PMMA core liners deployed by hand using constant pressure, removed and quickly capped and sealed at both ends. Mineralising microbial mats, soils and plant fragments were cut with a clean knife and stored in PVC boxes. The nonmineralised microbial mat (slime) was sampled and packed in 60 mL falcon tubes. SPM were sampled in the field from water filtration using 0.45 µm GF/C filters, previously burned. All samples were handled with care to minimise disturbance of the sediments and kept refrigerated at 4 °C until further processing in the laboratory. In order to investigate the origin and the incorporation of the organic matter, sediments were sieved into three particle size fractions (≥2000 µm, 200–2000 µm and ≤200 µm diameter). The mass of each fraction was recorded after 24h-drying at 60 °C. Particles >2000 µm were not investigated, as they were mostly composed of large bioclasts and only represent a small part (<3% of a dry weight basis) of the sediments.

3.2. Microscopy and Mineralogy

The microbial mats and sediment samples were observed using binocular and polarising light microscopy (Nikon AZ100; Nikon Corporation, Tokyo, Japan). Their structure and composition were further studied by scanning electron microscopy (SEM) using a Hitachi TM-1000 Tabletop SEM (Hitachi High-Technologies Corporation, Tokyo, Japan) and by cryoSEM using a Philips XL 30 field emission gun (FEG; Philips International BV, Amsterdam, The Netherlands) equipped with a FEI Nova NanoSEM 450 (FEI, Hillsboro, OR, USA. Cryofixation freezing of samples at −195 °C was followed by transfer under a controlled environment using a cryo transfer shuttle (Leica EM VCT100, Leica Microsystems, Buffalo Grove, IL, USA) into a modular high vacuum system (Leica EM MED020; Leica Microsystems, Buffalo Grove, IL, USA) for cold-fracturing, freeze-etching and platinum coating. Samples were then transferred to the SEM for imaging using the EM VCT100 shuttle (Leica Microsystems, Buffalo Grove, IL, USA), under a high vacuum condition, onto a nitrogen cold stage.
The mineralogical composition of the samples was analysed by X-ray diffractometry (XRD), using a Bruker D4 Endeavor diffractometer (Bruker Corporation, Billerica, MA, USA) with CuKα radiations combined with a LynxEye detector and Ni filter, under 40 kV voltage and 25 mA intensity.

3.3. Elemental and Stable Isotope Analyzes

Total organic carbon (TOC) and total nitrogen (TN) content, as well as the stable carbon (δ13Corg) and nitrogen (δ15NTN) isotopic compositions, were analysed at the Biogeosciences Laboratory (Université Bourgogne Franche-Comté, Dijon, France) on a Vario MICRO cube elemental analyser (Elementar, Hanau, Germany) coupled in continuous flow mode to an IsoPrime stable isotope ratio mass spectrometer (EA-IRMS) (Isoprime, Manchester, UK).
Prior to geochemistry analyses, the carbonate fraction was removed by acid treatment. About 2 g of each sample was decarbonated with HCl (2 N) for 1 h. The carbonate-free samples were washed with ultrapure water (18.2 MΩ/cm) and centrifuged until a neutral pH was obtained. The insoluble fraction recovered was then dried at 60 °C for 24 h and crushed to a fine powder using an agate mortar. For EA-IRMS analyses, ~8 mg for soils, ~4 mg for plants, ~5 mg for each interval sampled on sediment cores and ~2 mg for microbial mats were weighed into tin capsule (5 × 9 mm). To analyse the SPM samples, GF/C filters were crushed and treated with HCl acid vapour in order to remove the carbonate phase before crushing and drying at 60 °C.
The TOC and TN contents were normalised to the total mass of sample (mNaCl excluded) and expressed as dry weight percentages (dry wt. %). In this study, the [C/N] ratio refers to the atomic ratio.
The δ13Corg and δ15NTN isotopic composition are expressed using the δ-notation in parts per mil (‰). They correspond to the relative difference between isotopic ratios of the sample with conventional standards, Vienna Pee Dee Belemnite (VPDB) for carbon [45] and atmospheric N2 for nitrogen [46], as follows:
δ13C or δ15N (‰) = [(Rsample/Rstandard) − 1] × 1000
where Rsample = isotopic ratio of the sample, and Rstandard = isotopic ratio of the conventional standard with R = 13C/12C or 15N/14N.
Certified reference materials USGS40 L-Glutamic acid (C = 40.8 wt. %; δ13CVPDB = −26.39 ± 0.04‰; N = 9.52 wt. %; δ15NAIR = −4.5 ± 0.1‰) and IAEA-600 Caffeine (δ13CVPDB = −27.77 ± 0.04‰; δ15NAIR = +1.0 ± 0.2‰) were used for both elemental and isotopic calibrations. The analytical reproducibility of the mass spectrometer was ±0.15‰ for the δ13C and ± 0.2‰ for the δ15N based on replicate analyses of (standards or samples, or both). Triplicate analyses were performed for each sample.

3.4. Data Processing

The mean and standard deviation values (±1σ) of the elemental and isotopical parameters (TOC, TN, [C/N]atomic ratio, δ13C and δ15N) were calculated from the triplicate measurements for each sample. Comparisons between the different fractions, facies and cores were carried out using a one-way analysis of variance (ANOVA) and computed with the Past [47] software (version 2.17c). The results were reported with a confidence level of 95% (p-values of 0.05).

4. Results

4.1. Sediment Characterisation

The sediments comprising the present lagoonal system can be grouped into three main categories: micritic muds, bioclastic sands (Figure 3) and microbial deposits (Figure 4). The main characteristics of these deposits are described below, and more information can be found in Bouton et al. [29].

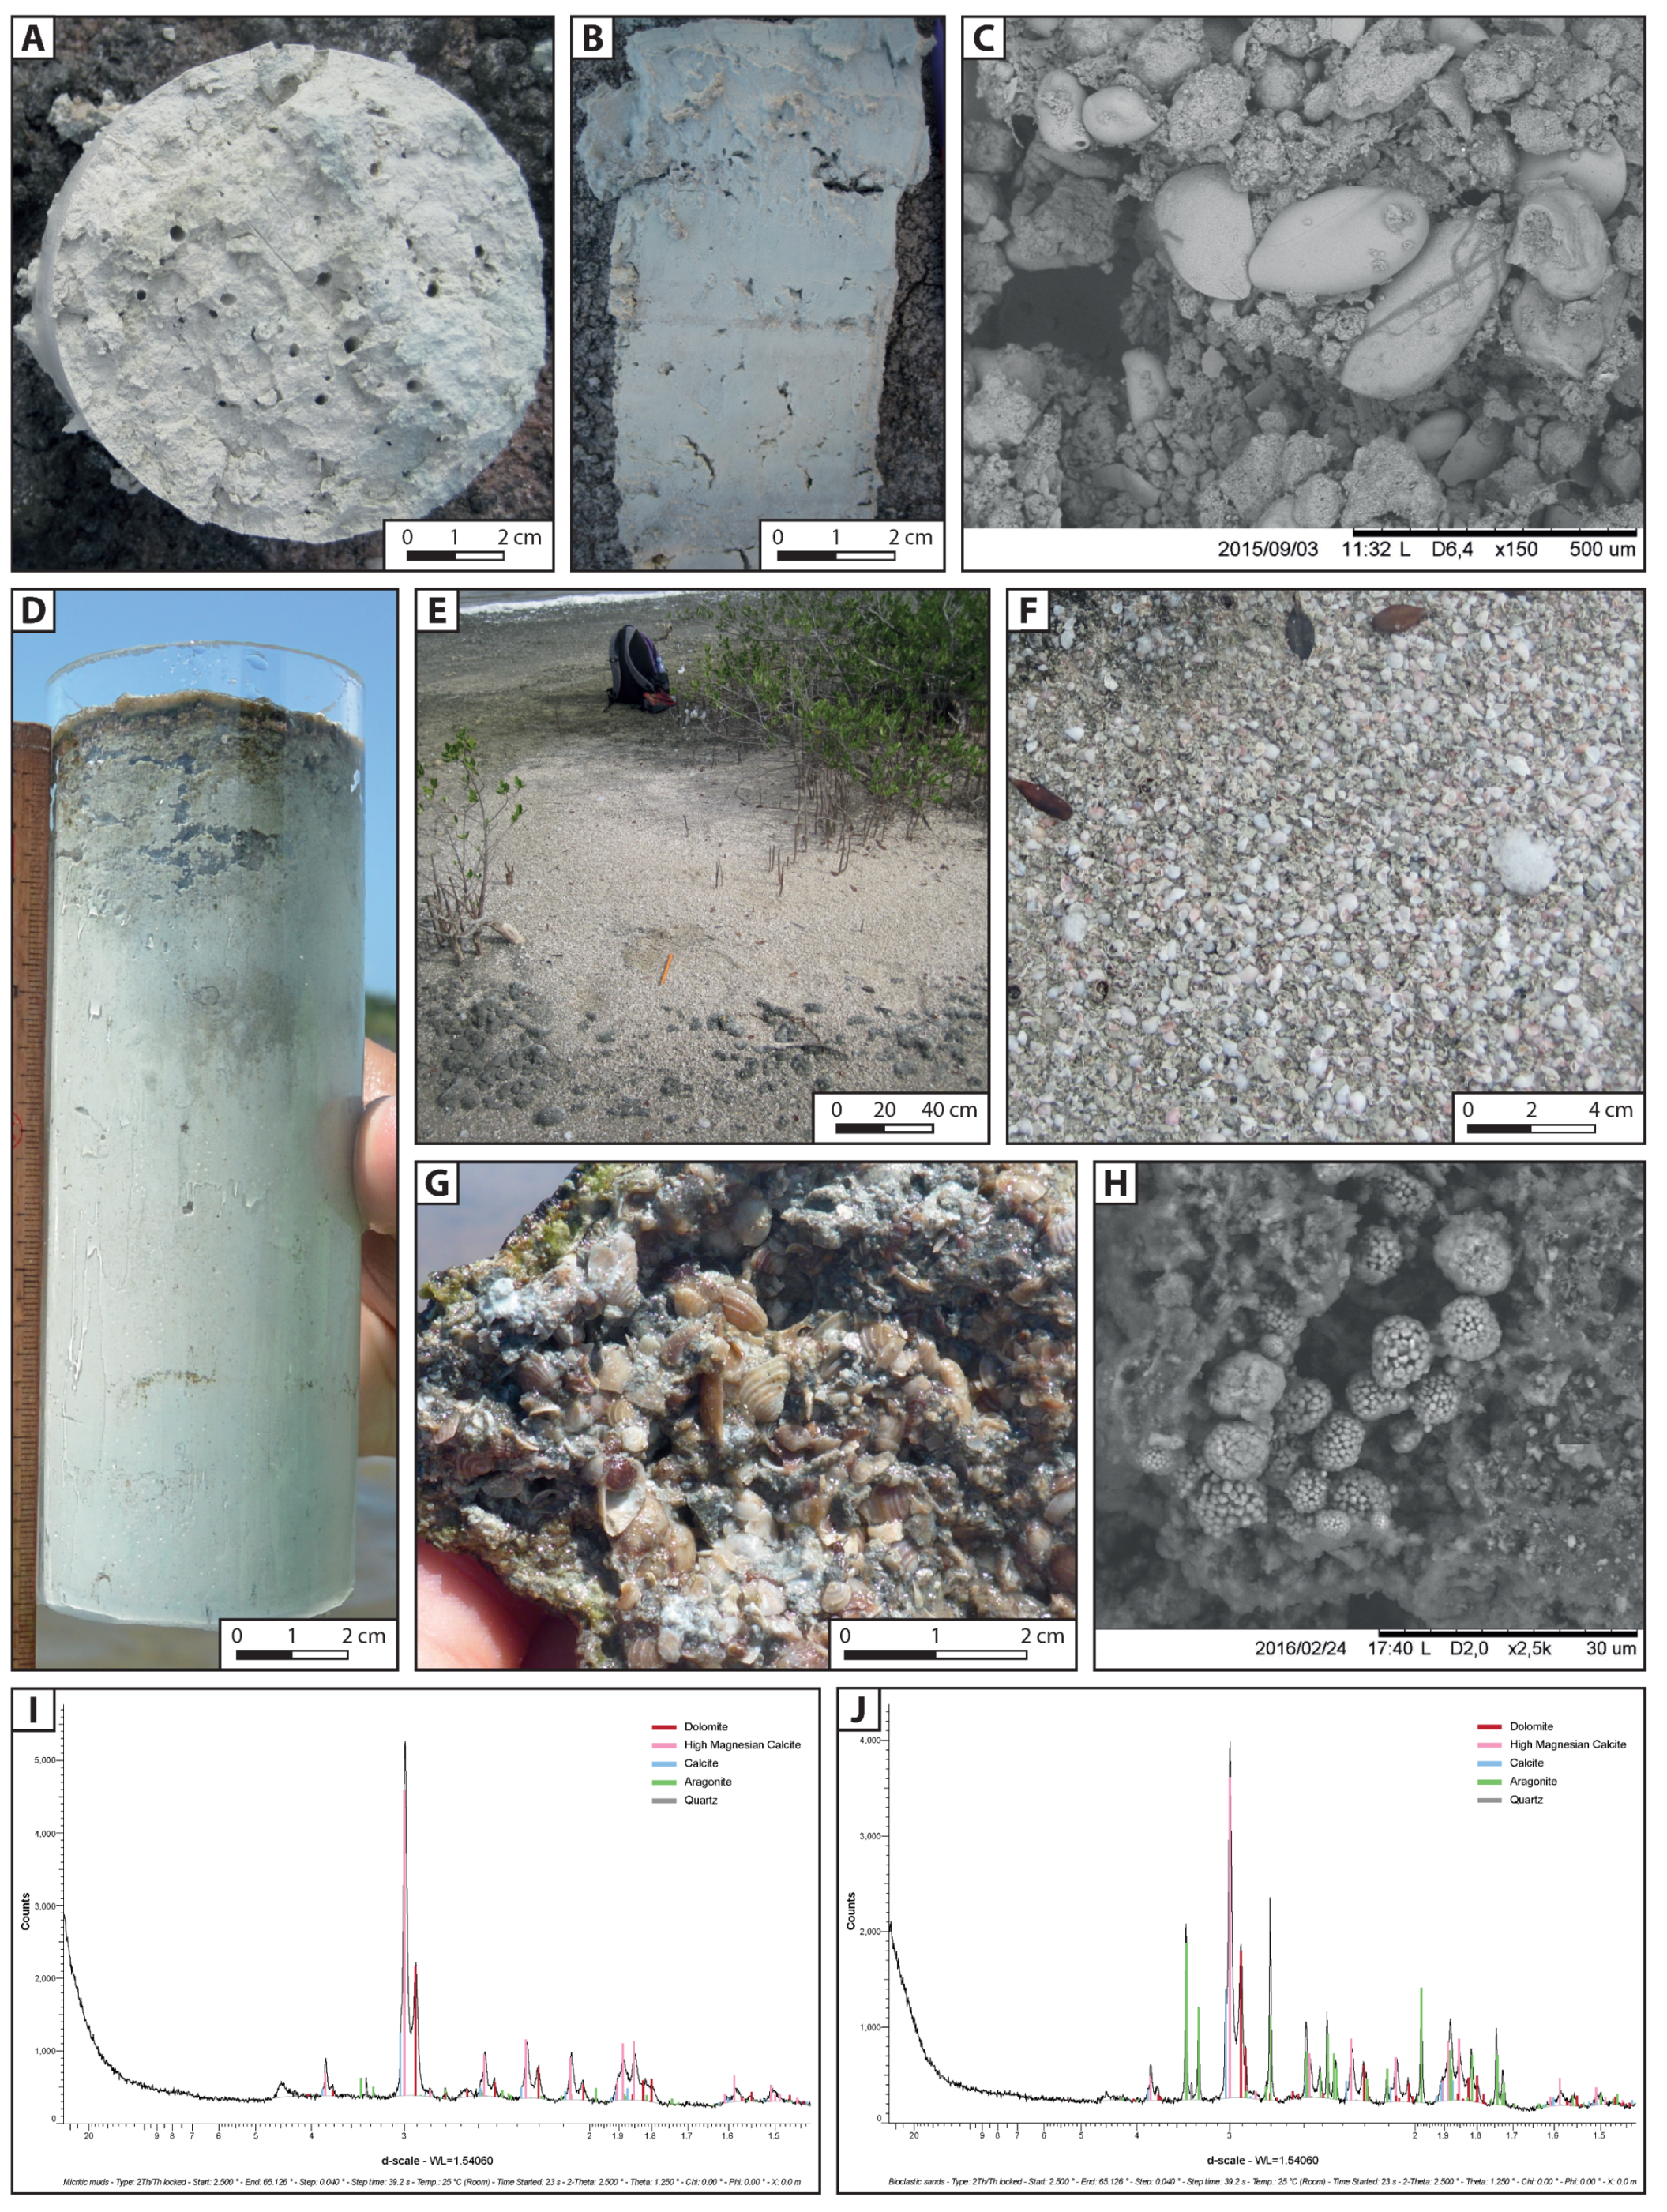
4.1.1. Micritic Muds

Micritic muds (Figure 3A,D) are mostly made up of HMC (high-magnesium calcite) and microdolomite, which, combined, usually account for more than 85% of the bulk sediment (Figure 3I). The grains associated with these minerals are mostly mud-sized, have irregular shapes and can be interpreted as peloids (Figure 3C). Bivalves (complete to disarticulated A. auberiana), foraminifers (Miliolina sp.), ostracods and gastropods (C. eburneum) constitute secondary grains, i.e., up to 15% of the total sediment. The micritic muds usually display a light grey colour, even though some parts can become darker when associated with cubic and framboid pyrites grains, as evidenced by SEM (Figure 3H).

4.1.2. Bioclastic Sands

Bioclastic sands (Figure 3E,G) are mostly composed of disarticulated and fragmented bivalves (A. auberiana), and a few intact to fragmented gastropods (mostly C. eburneum) made of aragonite (Figure 3J). No living specimens of both taxa were found during the three field campaigns. Despite their clast-supported character, these bioclastic sands comprise a highly variable micritic mud matrix which was either entirely absent (especially on surface) to almost completely filling the inter-granular porosity.

4.1.3. Microbial Deposits

Microbial deposits are widespread in the Cayo Coco lagoonal network, especially on the eastern part, where they appear the most diversified and well-developed [29]. Three microbial structures could be recognised, comprising two types of microbial mats: (i) a mineralising microbial mat, (ii) a microbial slime. Microbial mats are (vertically) laminated organosedimentary structures embedded in an extracellular organic matrix [48,49,50]; and in addition (iii) a nonstructured, EPS-rich, microbial deposit referred as biofilm.
(i) The mineralising microbial mat (Figure 4A,B) is characterised by a high cohesiveness and a wide range of mineralisation states, from no visible mineral products (by the naked eye) to a thin crust of carbonate developing on top of or inside the microbial mat. Depending on the location and local conditions, the mineralising microbial mats have variety of macrofabrics (e.g., flat, pustular, hemispheroids, ridges and terraces; [29]). The thickness varies from a few mm to more than 10 cm. Horizontal laminations change with depth due to different dominant microbial population [31,48,49,50,51,52]. The green colour of the upper lamina is indicative of filamentous cyanobacterial communities; below, a pink lamina forms due to the presence of anoxygenic phototrophs; deeper in the mats, a brown to black lamina depicts the presence of FeS, resulting from anaerobic heterotrophic metabolism, especially sulphate-reducing bacteria (SRB).
(ii) The slime is a nonmineralised microbial mat with a high EPS content and is characterised by a gelatinous quality, i.e., a low cohesiveness (Figure 4C,E). Its thickness ranges between 1 and 25 cm. The slime is usually composed of three layers displaying a dark to light grey transition with depth, coinciding with a decrease in organic matter content. In situ pH measurements within the slime during daytime revealed a decrease with depth down to slightly acidic conditions (pH ca. 6.6), which is probably controlled by fermentation and sulphide production [53,54]. This decrease highlights a transition from oxic to anoxic conditions [55].
(iii) The microbial biofilm (Figure 4H,I) is observed in voids within micritic sediments. This cryptic biofilm is an unstructured, thin (<1 mm), reddish to brown layer with a low cohesiveness (Figure 4H,I).

4.2. Depositional Environments

The amplitude and frequency of water level fluctuations within the Cayo Coco lagoonal network define four areas with specific hydrodynamic conditions and facies distribution. Each of these constitutes a specific depositional environment (Figure 2A), ranging from mostly immersed (Zone I) to constantly submersed (Zone IV).

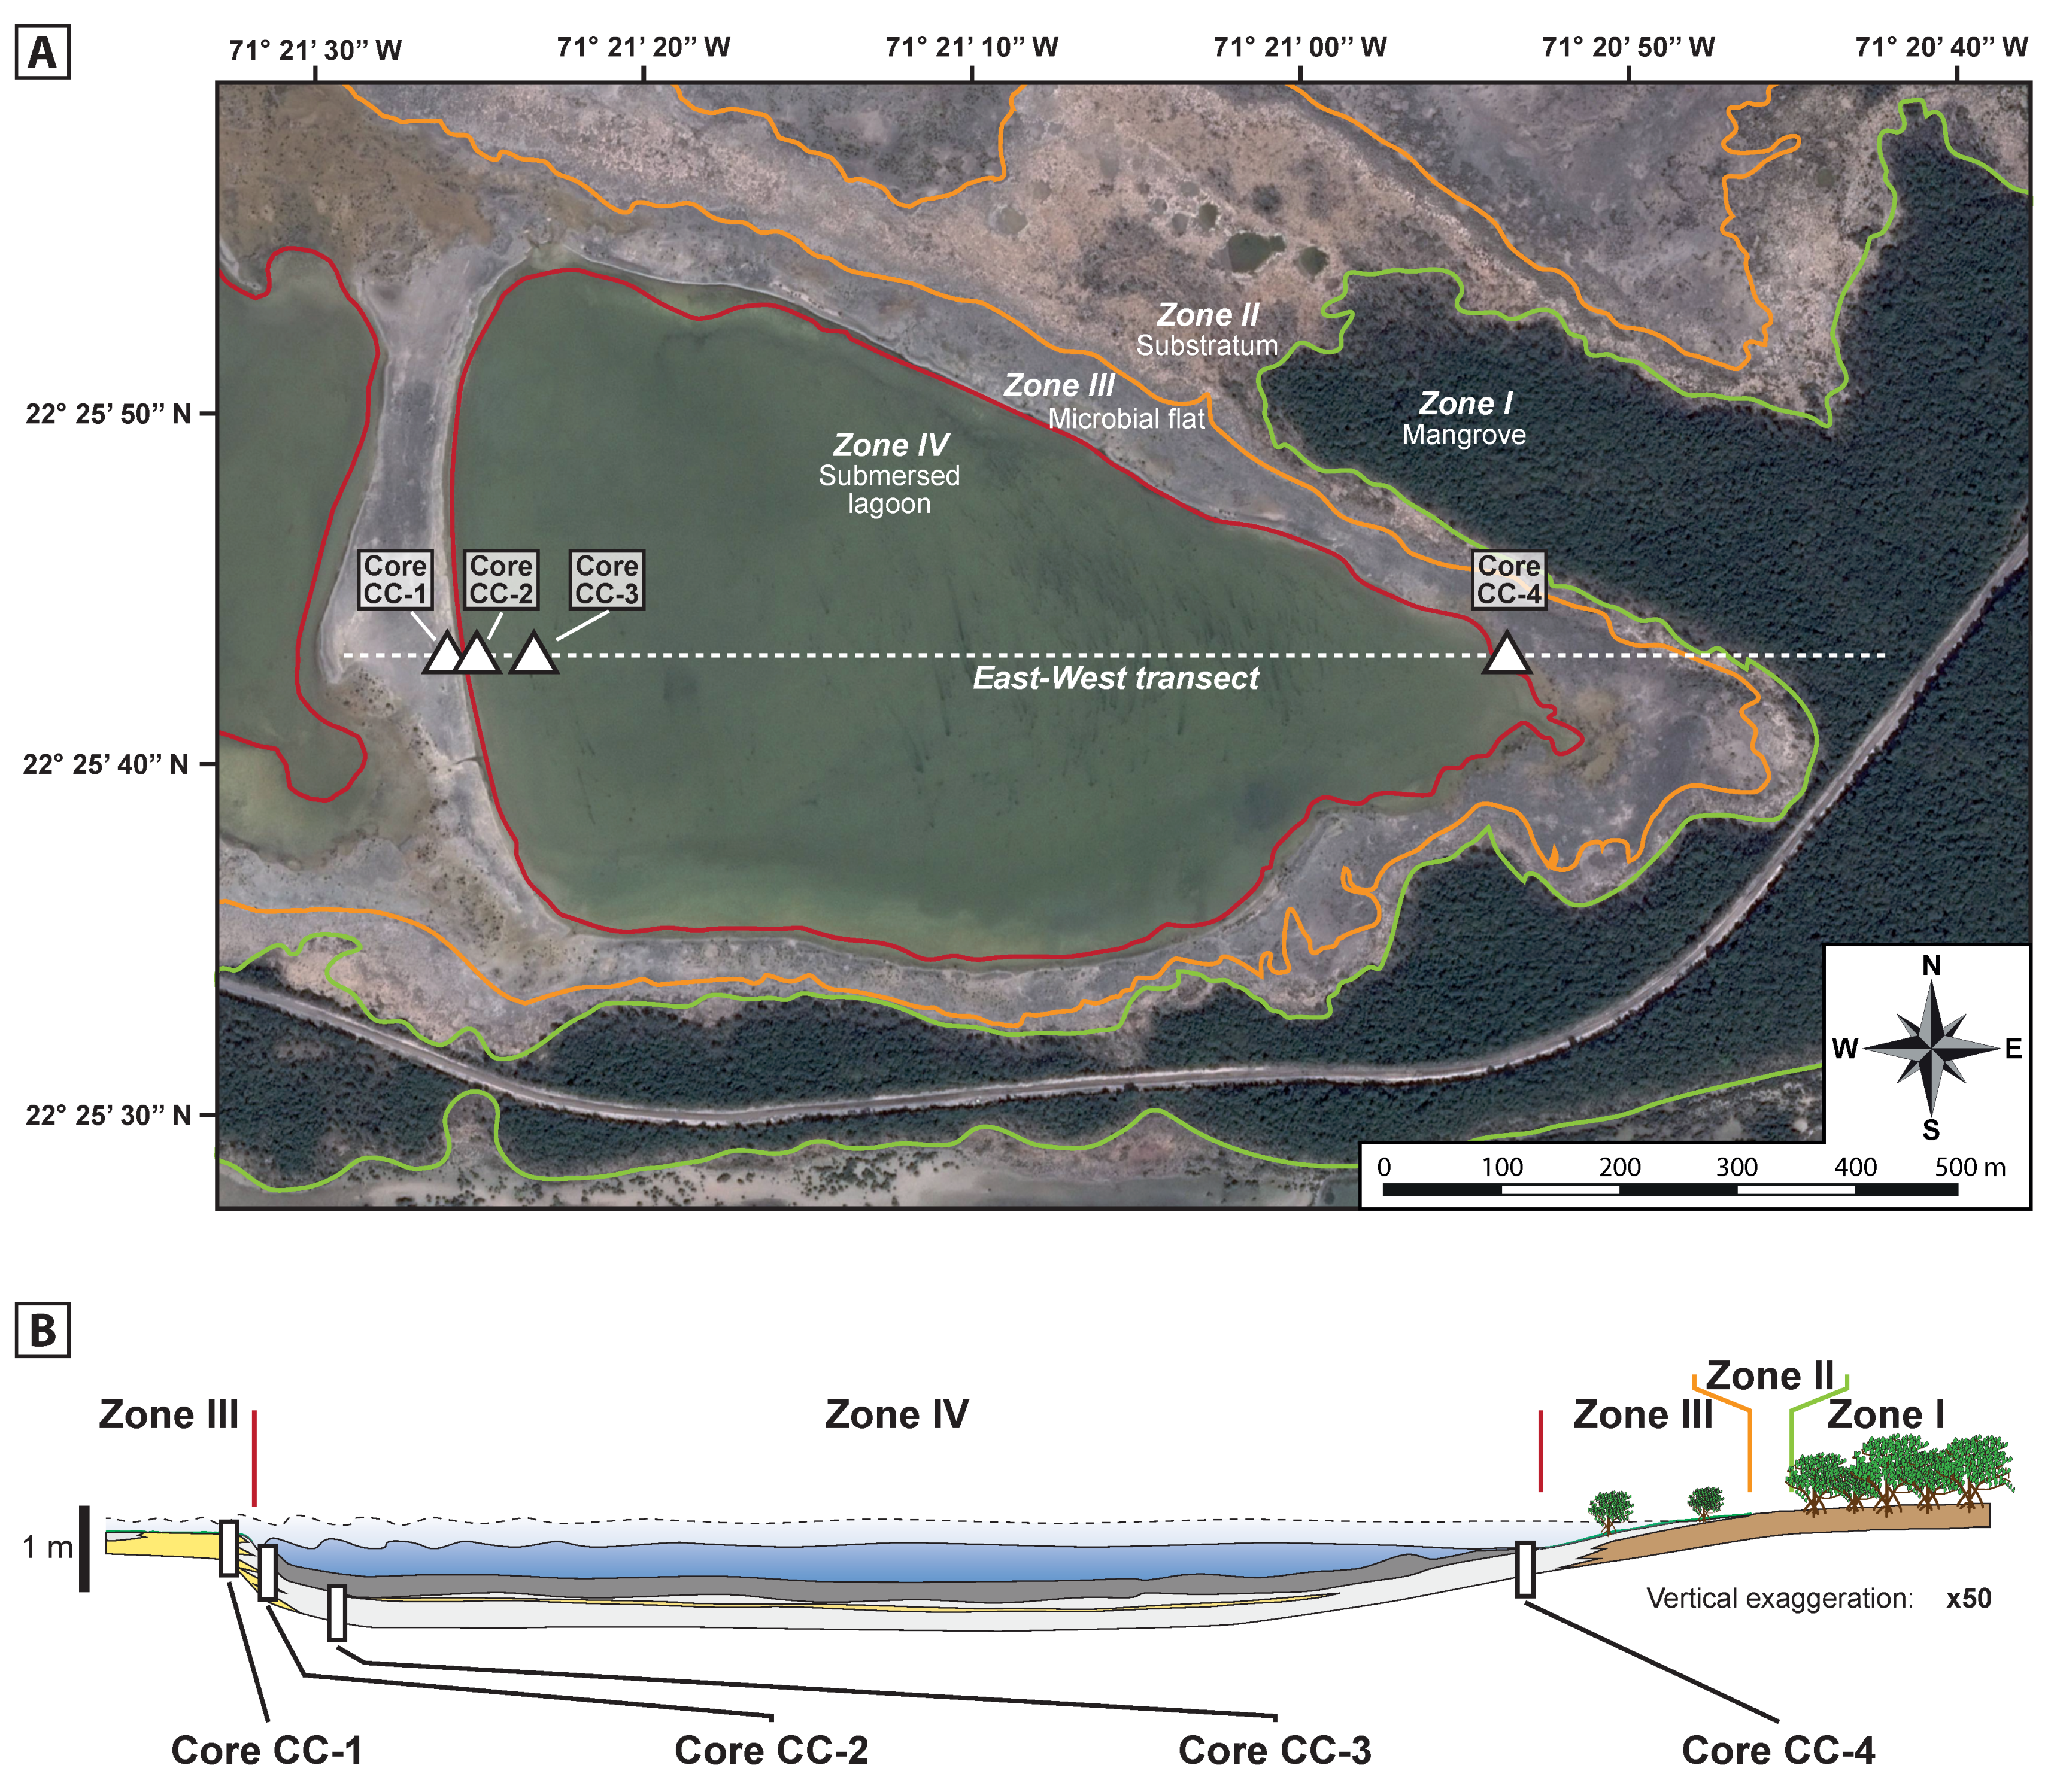
4.2.1. Zone I: Mangrove

This zone marks the external border of the lagoonal network extending to the north, east and occasionally to the southeast; the western edge is lacking as it connected to the Perros Bay. As the investigated lagoon lies in the south-eastern part of the network, it borders a mangrove zone in the south and east. In the south, the mangrove is limited to a ca. 200 m wide belt, separating the lagoonal network from Perros Bay (Figure 1C). The belt widens toward the north-east, where it connects to the main vegetation cover of Cayo Coco. This zone is permanently immersed all year round, with the exception the lagoonward parts that may be flooded briefly during exceptionally high water levels.
The zone is covered by mangrove vegetation, mostly composed by the halophytes Avicennia Germinans (black mangrove) and a few Rhizophora mangle (red mangrove) associated with Sarcocornia perennis and Batis maritima. These salt-tolerant species are adapted to the episodic flooding. The composition of this flora gradually changes into a dry evergreen forest [39] dominated by Metopium browneii, Lysiloma latisliquum, Bursera simaruba and Coccoloba diversifolia [56], with distance increasing from the lagoon. This vegetation cover developed over a Pleistocene substratum.

4.2.2. Zone II: Substratum Area

The boundary between Zones I and II is marked by a drastic decrease in the vegetation cover. The lagoonward species of the Zone I (i.e., the mangrove trees, S. perennis and B. maritima) are still the most common, but their distribution becomes sparse and random. The substratum still consists of Pleistocene pedogenised limestones with a lighter vegetation cover. Zone II, situated ca. 30 cm above the dynamic water equilibrium level of the lagoon, is usually immersed, but can still be flooded when the water level peaks. Circular voids, attributed to a past vegetation cover, cross-cut caliche crusts and the Pleistocene substratum, are locally filled by micritic muds and bioclastic sands, which was deposited when the lake level was flooded this area [29]. Microbial deposits are composed of mineralising microbial mats (nonlithified, sometimes mineralising) and microbialites (lithified).

4.2.3. Zone III: Microbial Flat

Zone III is located along the shore and extends between maximum and minimum water levels. The vegetation cover is sparse in this zone, dominated by mangrove trees and shorter plant as S. perennis and B. maritima. Lagoonward, the boundary with Zone IV coincides with the dynamic equilibrium shoreline; Zone III is thus immersed at low water level but becomes flooded at increasing water level. The boundary with Zone II is marked by the transition from the outcropping Pleistocene substratum (Zone II) to the deposits of the actual lagoonal system (i.e., micritic muds, bioclastic sands and microbial deposits), which underlines the average extension of the lagoon during the mean high-water level. The fluctuating immersed/submersed conditions affecting Zone III appear to be favourable to the development of microbial mats, which cover all surfaces. Below the microbial mats, micritic muds are the main component of the sediments, with local interbedding (sharp to progressive contacts) of cm- to several dm-thick bioclastic sands. The degree of mineralisation also displayed strong spatial variations, from very low, especially in the leeside in the east, to extensive in the western windward area. This degree of mineralisation also varies depending on the duration of the flooding episodes [29]. Relics of past microbial mats and cryptic microbial biofilms can be found deeper in the sediments. Microbial mat relics are embedded within the micritic muds and preserved in situ (not tilted or reworked; Figure 4F,G). They have a similar internal organisation to that observed just below the surface mats. Contrary to surface mats which cover hundreds of square metres, the lateral extension of microbial mat relics is reduced to a few square centimetres.

4.2.4. Zone IV: Submersed Lagoon

The upper boundary of Zone IV coincides with the lagoon extension at dynamic water equilibrium level, making this zone constantly submersed. The boundary with Zone III is defined as the transition from a mineralising microbial mat-dominated area to an area with nonmineralised slime. The slime proliferates to cover almost the entire lagoon sediment-water interfaces when the water depth exceeds ca. 20 cm. Below the slime, micritic muds are interbedded with bioclastic sands. SEM observations and XRD analysis of core CC-2 in this zone revealed the presence of framboidal and cubic pyrite minerals along the entire core, from the superficial microbial slime to bottom (Figure 3H).

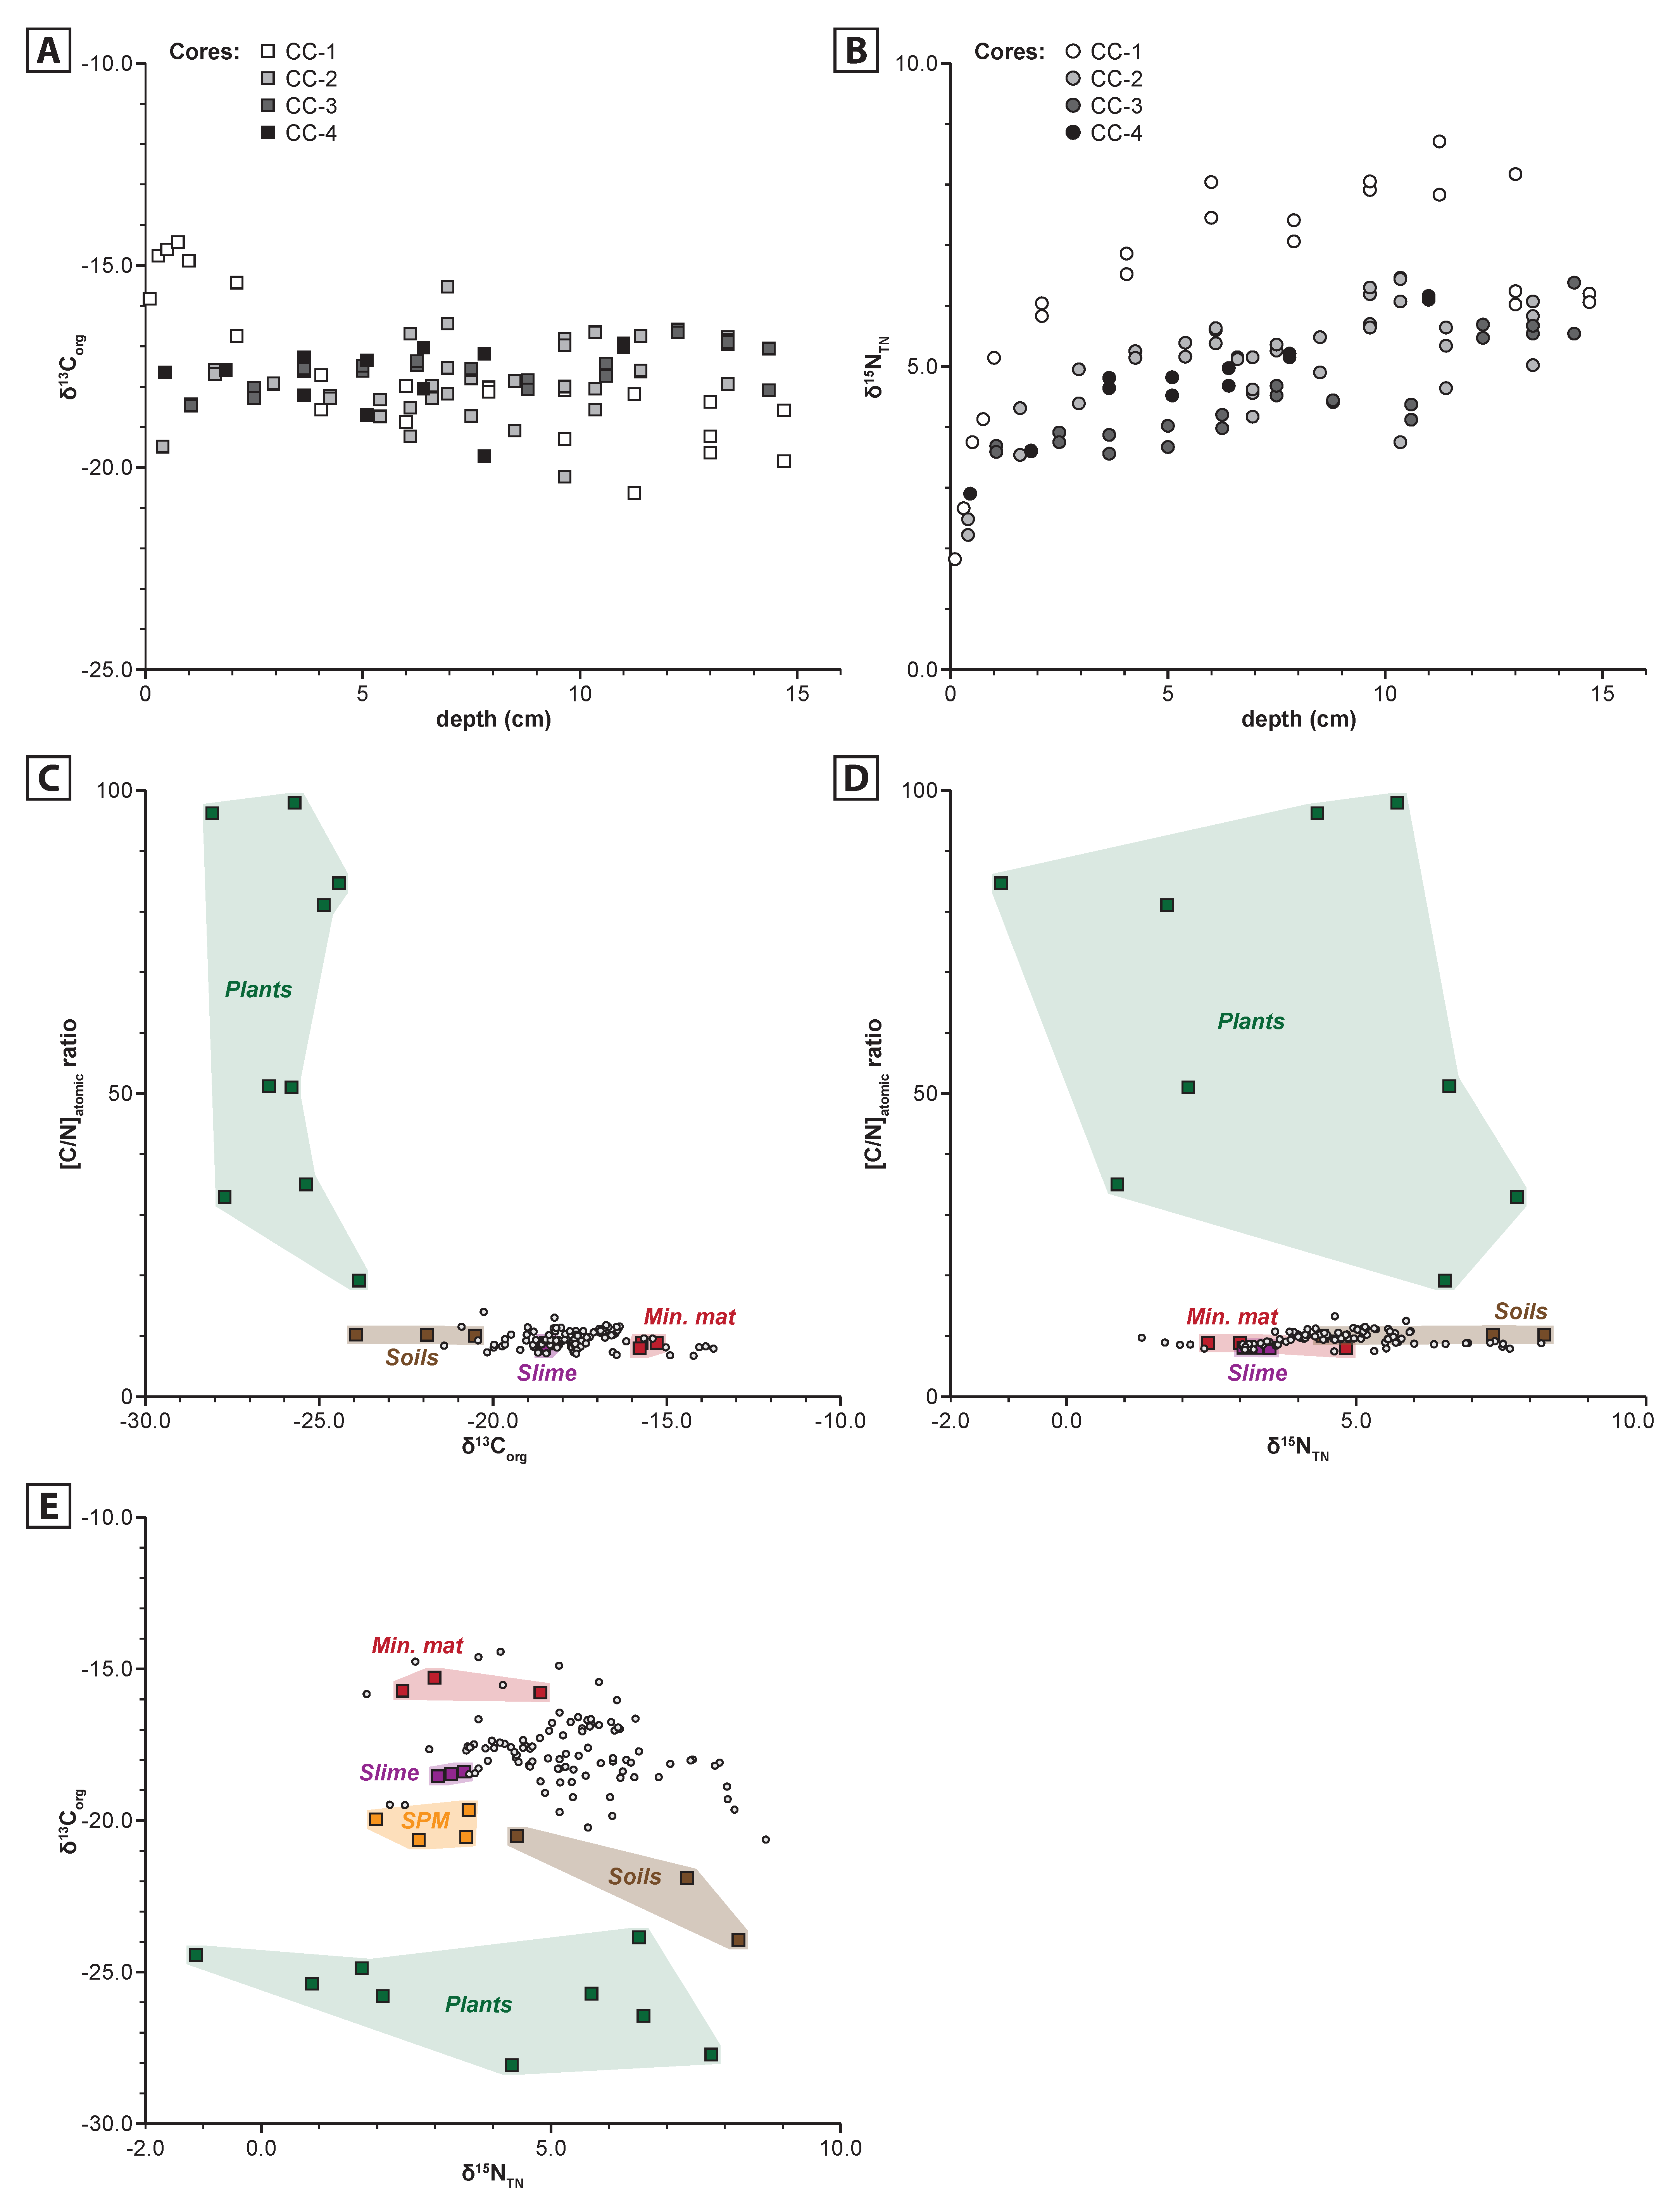
4.3. Organic Matter Sources

Different sources of organic matter were found throughout all of the depositional environments. Their elemental content (i.e., TOC, TN and [C/N]atomic ratios) and isotopic signature (δ13Corg and δ15NTN) are shown in Table 1.
Zones I and II, usually immersed, are covered by a scattered (Zone II) to dense (Zone I) plant cover, which likely constitute the primary source of organic matter in this area. In the vicinity of the lagoon, the tree and shrub cover is dominated by the mangrove species A. germinans. Isotopic (δ13Corg and δ15NTN) values are similar in the different parts of the plant (i.e., the young and mature branches the leaves and the buds; Table 1), while the elemental compositions appear more variable. However, the different values are consistent with a Calvin-Benson cycle carbon fixation metabolic pathway, i.e., C3 plants, like A. germinans [57]. In the neighbouring area of the lagoon, the short vegetation is usually dominated by S. perennis and B. maritima. The S. perennis is a perennial herb or small shrub previously classified as a species of Salicornia. The green branches are produced in the current growth season; those from previous years appear brown. Similar to the A. germinans, the δ13Corg values of the S. perennis appear homogenous, regardless of the part of the plant (Table 1). As in all other plants investigated (e.g., B. maritima), the elemental composition of the various plant parts differ significantly, but the isotopic signal only slightly varies. Interactions of decaying plants with the underlying Pleistocene substratum formed a thin (<10 cm) soil horizon in the lagoonward part of Zone I; soil development is reduced in Zone II due to the scarcity of the plant cover. Three soils were sampled in the Zone I. Despite differences in carbonate content (from 43.60% to 51.39%), all display a similar [C/N]atomic ratio. Lower δ13Corg values (−23.94 ± 0.02‰) were found in soils rich in plants debris (>2000 µm excluded in this analysis), while higher values (−20.52 ± 0.02‰; Table 1) were measured in the soil comprising visible microbial mat fragments (>2000 µm fraction excluded), resembling the mineralised microbial mat described in Zone III (and Zone II to a lesser degree). The opposite is observed for the δ15NTN values: the higher values (8.24 ± 0.19‰) are associated with soils rich in plant fragments and the lower values (4.41 ± 0.15‰) correspond to the soil with abundant microbial mat fragments (Table 1).
Zone III is covered by active mineralising microbial mats with scarce vegetation cover. However, despite diverse macrofabrics of the microbial mat, the internal structure appears similar [29]. A 1.0 cm thick mineralising microbial mat was sampled in the northern part of this zone. The three characteristic layers and the micritic muds immediately below the microbial mat were analysed individually. The TOC and TN values, shown in Table 1, appear low for a microbial mat, but likely reflect the balance between pervasive organomineralisation and organic matter production.
In Zone IV, the organic matter was analysed both in the water column (as suspended particulate matter, SPM; Figure 4J,K) and in the microbial slime covering the surface of the sediment (Figure 4C,E). Both slime and mineralising microbial mat of Zone III had a high carbonate content, with peak values of 88% and 82%, respectively. The average δ13Corg of the microbial slime was ca. 3‰ lower than that of the mineralising microbial mats. Its [C/N]atomic ratio value was also slightly below that of the mineralising microbial mats. The amount of SPM from the water column varied with hydrodynamics, apparently depending on the wind force. During quiescent periods, the microbial slime in the deepest part of the lagoon was visible through the water column. In contrast, the visibility was reduced to ca. 30 cm during windy episodes. SEM observations of the SPM revealed that ca. 85% consist of suspended fragments of microbial slime (Figure 4K), ca. 10% consist of diatoms and the remaining 5% of mangrove tree fragments (mostly leaves). Interestingly, framboidal pyrites (ca. 10–20 µm wide) were found associated with slime fragments in the SPM.

4.4. Sedimentary Organic Matter

In order to investigate the geochemical signals of the organic matter preserved within the lagoonal sediments, four cores were sampled along an east-west transect crossing the lagoon (Figure 2). The elemental (i.e., TOC, TN and [C/N]atomic ratios) and isotopic (δ13Corg and δ15NTN) values are shown in Table 2, and Figure 5 and Figure 6. All cores were covered by a surface microbial mat with various degrees of mineralisation (see above).
  • Core CC-1 (15 cm-long) was collected at the western border of the lagoon, in the microbial flat (Zone III). The upper part of the core consists of a 1.1 cm thick mineralising microbial mat (Figure 5). In this part, the TOC and TN contents slightly decreased from the top to the bottom of the microbial mat (Table 1). The δ13Corg remains quite stable within the mats, except for the uppermost interval (0–0.2 cm). The δ15N gradually increases downcore in the microbial mat. The [C/N]atomic ratio of this mineralising microbial mat decreased toward the base of the mat (0.9–1.1 cm). Below 1.1 cm depth, the remainder of the core was mainly composed of micritic muds including <10% content of bivalves (A. auberiana), foraminifera (Miliolina sp.), ostracods and a few gastropods (C. eburneum). The upper part of the micritic muds (interval 1.1–3.1 cm) was dark grey, contrasting the light colour observed underneath. In the 1.1–3.1 cm interval, the TOC and TN record had lower values that in the upper microbial mat. In the light-coloured micritic muds, the TOC and TN remained below 1% downcore. The [C/N]atomic ratio slightly increased downcore in the micritic muds (from the top to the bottom of the core). The δ13Corg remained high in the 1.1–3.1 cm interval, with a value close to that in the overlying mineralising microbial mat. The δ13Corg sharply decreased below, down to 10.5–12.0 cm depth, especially in the 200–2000 µm fraction. Below 12 cm, the δ13Corg displayed a slight decrease. The δ15NTN values followed an increasing trend downcore (to 11 cm), below which it decreased. The measurements of the TOC, TN and δ15NTN revealed a minor change in the trend seen above 12.0 cm. The 12.0–14.0 cm depth interval was contained a cavity covered inside by a cryptic microbial mat with TOC and TN values slightly higher with respect to the surrounding micritic muds.
  • Core CC-2 (14 cm-long) was taken about 10 m further from the shore than Core CC-1, just beyond the boundary between Zones III and IV (Figure 2). The uppermost 0.8 cm was a nonmineralised slime comprising a high content of carbonate particles (calcimetry of 94.17% and 96.06% for the 0–200 µm and 200–2000 µm fractions, respectively), either micritic or bioclastic (fragmented bivalves shells). The slime had a TOC and TN content compared to other mineralised microbial mats, the values of which were lower in the 200–2000 µm fraction than in the 0–200 µm fraction. The [C/N]atomic ratio and δ13Corg values were similar in both fractions. The δ15NTN values were slightly higher for the 0–200 µm fraction than for the 200–2000 µm one. The underlying 0.8–2.4 cm interval consisted of a micritic muds layer rich in disarticulated and fragmented valves of A. auberiana (ca. 15%). When comparing the bioclastic layer with the slime, the organic matter content was lower, the [C/N]atomic ratio was similar and the δ13Corg and δ15NTN values higher in the bioclastic interval.
  • The remaining 12.1 cm of the core mostly comprised micritic muds. However, two levels of fossil mineralising microbial mats could be identified between 5.8 cm and 7.1 cm (Figure 5). Both are discontinuous, probably cut by erosional processes. The uppermost of these mats (ca. 6 mm thick) was found between 5.8 and 6.4 cm. It was composed of five successive sequences of green and yellowish to greyish laminae. Each sequence represented a relic mat. The lower relic microbial mat, found a depth of ca. 7.0 cm, was only 1.5 mm thick, and was composed only of a green/yellowish-grey sequence. The δ13Corg of both fossil mineralising microbial mats were more positive (ca. +2–3‰) than the surrounding sediments and similar to the surficial mineralising microbial mats in CC-1. These microbial mats were surrounded by micritic muds. However, some darker-coloured parts contrasted with the usual light grey colouration of this sediment. The darker parts were discontinuous and located below the relic mineralising microbial mats. Regardless of the fraction and the sampling depth, the TOC and TN values of the darker parts were nearly two times lower than the lighter parts (all fractions considered). Pyrite was more abundant in the darker parts than in the light parts. The [C/N]atomic ratio, however, did not indicate major differences between the light and dark-coloured muds. The δ13Corg diverges, with more positive values for dark parts than for the light parts (all fractions considered). The δ15NTN values were not significantly different between the two parts, but, in both cases, tend to increase downcore.
  • Core CC-3 (14 cm-thick) was sampled in the deepest flat-bottom part of the lagoon, where the depth averaged 75 cm at dynamic equilibrium (Figure 2). A nonmineralised slime thrived at the surface of the sediment with a thickness varying between 1 and 25 cm. In Core CC-3, the slime layer was 2.1 cm and overlaid micritic muds with variable content of bioclasts (bivalves, foraminifera, ostracods and few gastropods). The dry wt. % TOC and TN content of the slime was higher for the 0–200 µm fraction than for the 200–2000 µm fraction. The carbonate content reached 48.9% for 0–200 µm fraction, and 63.23% for the 200–2000 µm fraction. The [C/N]atomic ratio, the δ13Corg and δ15NTN values of Core CC-3 slime were similar to those measured in the slime of the lagoon. The [C/N]atomic ratio of the 0–200 µm fraction was slightly higher than that of the 200–2000 µm fraction. Near the bottom of the slime, a small interval of micritic mud (2.1–2.9 cm) with a low organic matter content was observed. In this depth horizon, the TOC and TN decreased sharply. The [C/N]atomic ratio of this interval was of the same order of magnitude as the slime, with a lower value for the 200–2000 µm fraction. The δ13Corg and the δ15NTN of this horizon were similar to those of the overlying slime, with no significant change between both size fractions. Downcore, in the micritic mud interval, the TOC and the TN remained constant with a systematically higher value for the 200–2000 µm fraction. Two discontinuous intervals of bioclastic sands (9.5–11.7 cm and 14.0–14.7 cm), rich in micritic mud between grains, contained a smaller amount of organic carbon for both fractions. The nitrogen content, TN decreased in the 9.5–11.7 cm and 14.0–14.7 cm intervals, respectively. These lower TOC and TN contents suggest a lower organic matter content within the bioclastic rich intervals. The [C/N]atomic ratio slightly increased downcore, from 8.73 just below the slime to 11.76 at the bottom of the core (all fractions included). Variations in TOC content were found between different facies; however, the δ13Corg values were comparable. The δ15NTN values did not change among facies, but, as observed in Cores CC-1 and CC-2, displayed an increasing trend of this proxy downcore.
  • Core CC-4 (13 cm-thick) was collected from Zone IV at the eastern side of the lagoon (Figure 2), a few meters from the boundary with Zone III and approximately 75 m away from the mangrove and evergreen forest (Zone I). This sampling site is at a transition between zones with different potential sources of organic matter. The uppermost 2.8 cm of the core consisted of an nonmineralised slime similar to that observed in Core CC-2, i.e., depicting a very high carbonate content (either bioclasts or mud-sized grains), with a calcimetry of 89.9% for the 0–200 µm fraction, and up to 99.3% for the 200–2000 µm fraction. The TOC and TN were low, especially for the 200–2000 µm fraction. The following depth interval (between 4.5 and 8.5 cm) consisted of micritic muds with low TOC and TN values. The [C/N]atomic ratio increased downcore from 10.07 below the slime to 11.90 at the bottom (all fractions comprised). This micritic interval was underlain by bioclastic sand in which the δ13Corg remains relatively constant downcore in the 0–200 µm fraction but decreased in the 200–2000 µm fraction. The δ15NTN increased for both fractions, with the higher value measured in the deeper interval. Below 8.5 cm, the remainder of the core consisted of a bioclastic sand interval, mainly composed of disarticulated to slightly/moderately fragmented valves of A. auberiana, and had a low content of micritic mud. The dark coloration could be attributed to an abundance of organic matter. However, the TOC and TN values indicated a low organic matter content. The [C/N]atomic ratio was lower in this bioclastic interval than the upper micritic ones. This bioclastic interval had a similar δ13Corg value as the sediment above, and the highest δ15NTN value measured in this core.

5. Discussion

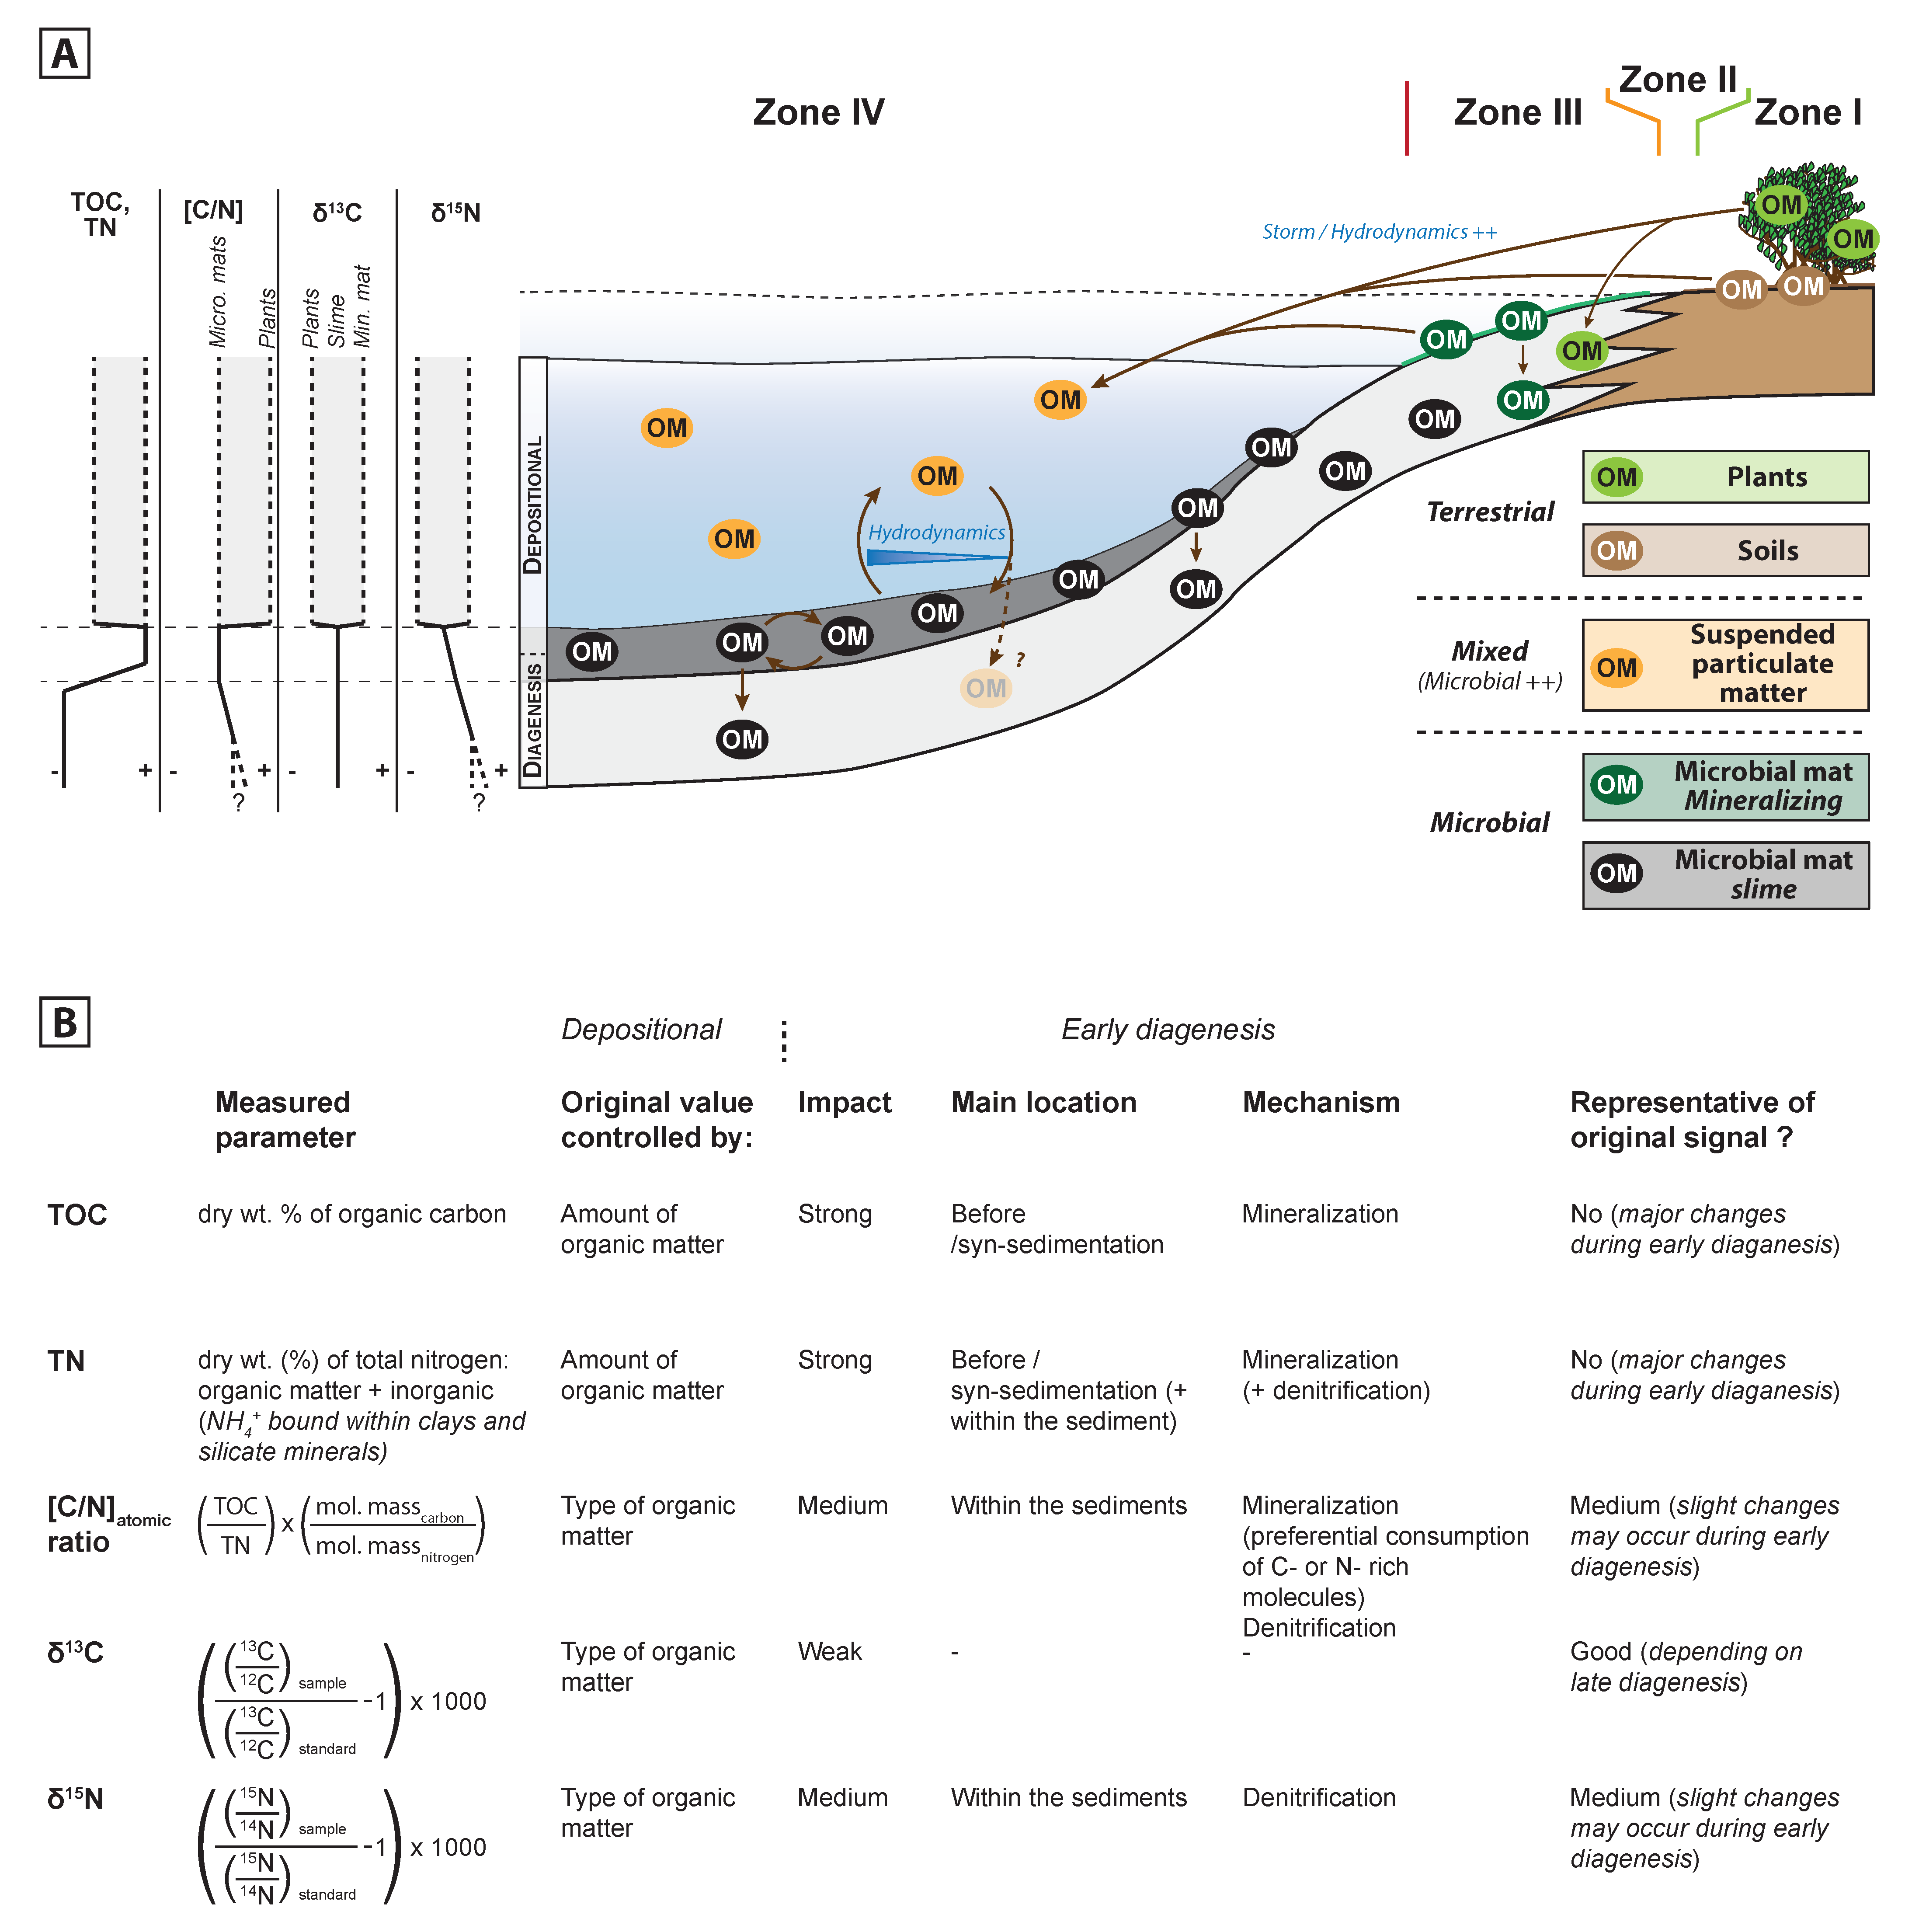
5.1. Dynamics of Organic Matter Sources

Several sources of organic matter were identified in the Cayo Coco lagoonal network and derived from (i) microbial mats (mineralising and slime), (ii) SPM from the water column and (iii) plants and soils (Figure 7).
(i) Pace et al. [30] documented the processes and products of mineralisation during the early development of these hypersaline microbial mats composed of three different laminae (green, white and red). Oxygenic photosynthesis predominates over aerobic respiration in the surface green lamina of the mat, where Mg-silicate globules precipitate in the EPS matrix, often in close association with coccoid cyanobacterial clusters. In this zone, the EPS bind calcium, thus inhibiting carbonate precipitation. Anoxygenic photosynthesis which occurs due to the presence of purple sulphur bacteria (PSB) is prevalent in the red lamina of the mat. The interface between these two major photosynthetic zones, coinciding with the daytime pH maximum, forms the locus for the precipitation of Mg- carbonate lamina (white lamina). A major decrease in cation binding capacity of EPS between the green and red laminae increases soluble Ca2+ concentration at this interface. Sulphate reduction activity peaks just below this interface and is associated with carbonate precipitation. In Cayo Coco, the precipitation of CaCO3 in mineralising mats occurred at the interface of oxygenic-anoxygenic photosynthesis and was interpreted as the initial step of stromatolite formation by Pace et al. [30]. However, microbialites (i.e., lithified microbial structures) are scarce in the lagoonal network, raising questions concerning the (long-term) fate of the microbial(ly-induced) carbonate minerals. Severe climatic episodes may affect microbial mats: (i) wind; notably, storm events cause an intense hydrodynamic regime in the shallow lagoon or (ii) sustained drought lead to evaporation and ultimately desiccation of the sediments. Such processes could be responsible for the mechanical disruption (erosion) of the microbial mat, leading to the disintegration of mineral layers. This reworking and subsequent deposition of the carbonate minerals could contribute to the micrite accumulation within the lagoons.
In spite of the presence of calcium/magnesium carbonate in the microbial mats, they do display a high organic matter content. The organic components include microbial biomass, as well as extracellular organic matter (EOM) forming an organic matrix. This matrix enables the microbial communities to thrive under a wide variety of environmental conditions [58], protecting from harmful external physical (e.g., desiccation, hydrodynamic regime), biological (e.g., grazers) and chemical (e.g., nutrient limitation and toxic elements, e.g., Ca2+) conditions. It also provides a means by which to attach to sediment surfaces, and stabilises the mats [31]. The EOM comprised both exopolymeric substances (EPS, mostly composed of polysaccharides) and low-molecular weight organic carbon (LMWOC), the production of which can be enhanced by environmental stressors [52,58]. The fluctuating environmental conditions in the Cayo Coco lagoonal network encourage the production of copious amounts of EPS, and thus, abundant organic matter [50,59].
Mineralising microbial mats form in environments with fluctuating water levels, including desiccation (i.e., Zone III). In contrast, microbial slime thrives under permanently submersed conditions (i.e., Zone IV). The presence of mineralising microbial mats at 6 to 8 cm below the surface in Core CC-2(Zone IV) suggests a change in the spatial distribution of the different depositional environments over time related to fluctuations in the the water level. During the deposition of these mineralising microbial mats, this site likely corresponded to a Zone III depositional environment experiencing emersion and submersion. Currently, the boundary between Zones III and IV is located ca. 5 m to the west of Core CC-2, indicating a retreat of this boundary.
(ii) As potential source of organic material, SPM adds to the total amount of organic matter, as it is mainly composed of microbial-rich (slime) particles, with a minor contribution of diatoms and plants, presumably transported by hydrodynamics.
(iii) The mangrove itself can also be considered a potential source of organic matter, since this surrounds a large part of the lagoonal network, especially the investigated lagoon. Plant fragments and eroded soils from neighbouring mangrove areas tend to converge at the lagoon’s depocentre, where organic matter accumulates. Since the mangrove is located eastward from the lagoon, the dominant easterly to east-north-easterly wind may favour this phenomenon. However, the flat slopes and the irregular topography forming puddles where water can accumulate inhibit the flow toward the lagoon. In addition, the vegetation at the margins can trap the detrital and organic matter particles [60]. The highly evaporative conditions also enhance this phenomenon by creating small pools.
As no major environmental changes impacted in the region since the Late Holocene [40,41], it can be assumed that organic matter sources are similar in the sedimentary record of the four cores. The quantitative and qualitative interpretation of the isotopic and atomic signals of the sedimentary organic matter will help to (i) decipher the relative contribution of the major sources of organic material, and (ii) to better constrain alteration of these signals over time during early diagenesis.

5.2. Preserved Organic Matter, Quantitative Aspect

The abundant sources in or around the lagoonal network are expected to lead to a high sedimentary content of organic material. TOC levels in coastal lagoons are typically higher than those in coastal marine environments [61]. Despite a high potential in organic matter accumulation, the TOC and TN values of the different lagoonal sediments of the Cayo Coco lagoon (i.e., micritic mud and bioclastic sands) remain very low, averaging 2.03 ± 1.52% dry wt. and 0.24 ± 0.19% dry wt. (all fractions included), respectively. These low values are consistent with those reported in marine sediments [62]. In contrast, the superficial microbial mats, whether mineralised or not, show values up to 16.06% dry wt. for the TOC and 2.34% dry wt. for the TN, respectively. In all of the cores, regardless of the fractions or the nature of the sediments, the organic matter content sharply decreased below the microbial mats and remained low throughout.
The core CC-1 was only made of micritic muds below the microbial mat, which allowed us to investigate the downcore alteration of geochemical signals. No significant change was observed in TOC and TN values below the microbial mat with depth (Figure 5). Specifically, a slight decrease of the TN compared to the TOC can be seen using the [C/N]atomic ratio (Figure 5). From accumulation rates in the literature, notably coastal lagoons from the Bahamas, a deposition of 14.3 cm thick micritic mud (CC-1) may reflect more than 1000 years (at an accumulation rate of 120 mm/1000 yr, [63]). As the deepest parts of the cores were exposed to diagenetic processes over longer periods, the absence of downcore changes implies that, from a quantitative point of view, early diagenesis does not induce major changes in organic matter concentration. Early diagenesis does not affect the quantity but the quality of organic matter through alteration by heterotrophic microorganisms [64,65]. The absence of major changes in organic matter concentration downcore suggests that remineralisation occurs above the sediments, i.e., within the water column, or more likely, in the microbial mat itself.
Although TOC and TN values remain fairly constant downcore for a given lithology, some variations reported in cores CC-2 to CC-4 can be related to the nature of the sediments: micritic mud intervals have higher TOC and TN values (ca. 2.14 ± 1.55% dry wt. and 0.25 ± 0.20% dry wt., respectively; average value, all fractions considered) than the bioclastic sands (ca. 1.07 ± 0.66% dry wt. and 0.12 ± 0.07% dry wt., respectively; average value, all fractions considered). A one-way ANOVA test confirms this observation, with a significant statistical difference between the two groups for both TOC and TN values (p-values < 0.05). In both CC-3 and CC-4 cores, the lowest TOC and TN values were associated with the bioclastic sands intervals. For the 200–2000 µm fraction, the low organic content of bioclastic sands could be due to the higher amount of carbonate minerals (calcimetry), which is statistically different between the micritic muds and the bioclastic sands (one-way ANOVA, p-value < 0.05 between the two groups). The amount of carbonate is not the only factor which explains the differences between the different sediments, since the calcimetry is not statistically different for the 0–200 µm fraction (one-way ANOVA, p-value 0.5493 between the two sediment types). The organic matter content of the bivalve and gastropod shells is usually low (smaller than 0.5%; [66]). Part of the organic matter present in the bioclastic accumulations is incorporated during the biomineralisation of the shell, and mostly composed of matrix proteins, glycoproteins, and polysaccharides [67]. The content of proteins is variable depending on the molluscan taxa, and it has been suggested that it is related to the calcifying efficiency [68]. In comparison, the micritic muds incorporate autochthonous or allochthonous particulate and dissolved organic matter [69]. Fine-grained particles often absorb a large quantity of nutrients and organic matter [70]. Coastal lagoons supporting carbonate sedimentation can be found on the coastline of Abu Dhabi [71,72]. The organic matter in the fine grained sediments of these lagoons is derived from mangroves and microbial mats and reaches a value of 4% to 7% [73]. In comparison, the Cayo Coco lagoons, with a similar setting as those in Abu Dhabi, have a TOC content up to 5.4%. Depending on the initial pool of organic matter and remineralisation by microorganisms, the amount of organic matter within the micritic muds can be significantly higher than the bioclastic sands, and are made up of greater variety of organic molecules [66]. Physical processes can possibly explain the differences between fine micritic muds and coarser bioclastic sands: wind-induced waves are the main driver in sediment transport in shallow (micro-tidal) coastal lagoons [74]. Wind leads to sediment resuspension, resulting in the transport of fine and/or high buoyancy particles (including the organic matter) from high-energy areas to deeper, lower energy environments in the lagoon [75].
All lagoonal facies considered (micritic muds and bioclastic sands), the TOC and TN values appear consistently higher for the 200–2000 µm fraction than for the 0–200 µm fraction (the two groups are statistically different; one-way ANOVA, p-value < 0.05 for the TOC and TN between the two groups, respectively). The higher values observed in the coarser fraction value may be related to the source and the type of the organic matter. Coarse organic particles (e.g., plant or microbial mat fragments) may accumulate in the 200–2000 µm fraction after mechanical dismantling. Their subsequent degradation during early diagenesis (e.g., by microbes) is less efficient than for small-sized ones. A higher degradation of smaller organic matter particles decreases TOC and TN values in the 0–200 µm fraction.
The cores sampled in different areas of the lagoon show that the organic content preserved within the sedimentary record is not randomly distributed. Core CC-1, taken in Zone III, i.e., the area experiencing fluctuating immersed and submersed conditions, has the lowest TOC and TN values (0.89 + 0.67% dry wt. and 0.12 + 0.10% dry wt., respectively). The three other cores were removed from Zone IV, but in different locations. The highest organic content was recorded in Core CC-3 (TOC and TN values of 3.04 + 2.07% dry wt. and 0.36 + 0.29% dry wt., respectively), obtained from one of the deepest parts of the lagoon. CC-2 also displayed high TOC and TN values (2.23 + 1.23% dry wt. and 0.26 + 0.14% dry wt., respectively). Core CC-4, from the eastern side of the lagoon was taken close to the boundary with Zone III. The micritic mud and bioclastic sand sediments of this core displayed lower TOC and TN values than Cores CC-2 and CC-3 (1.32 + 0.47% dry wt. and 0.14 + 0.05% dry wt., respectively), but these were still higher than those recorded for Zone III (Core CC-1). These differences emphasise that the organic matter seems to either (i) be better preserved, and/or (ii) concentrated at the centre of the lagoon:
(i) Despite the shallow water depth of the lagoon (ca. 75 cm), the bottom-waters are hypoxic as demonstrated by the presence of framboidal pyrites within the SPM. The sharp decrease in pH with depth, in the microbial slime (see [29]) can be explained by fermentation and sulphide production [53,54], supporting hypoxic/anoxic conditions [55] at the water column/sediment interface. The preservation of framboidal and cubic pyrite within the sediment underlying the slime (as well as in the SPM) also supports the occurrence of O2 depletion, and probably prevailing hypoxic to anoxic conditions. Hypoxia usually favours the preservation of organic matter, as anaerobic bacteria have a limited capacity to degrade certain complex molecules [76], resulting in a lower degree of organic matter degradation. Thus, low oxygen conditions promote the preservation of organic material [77,78]. This condition may explain the nonrandom distribution of organic compounds throughout the lagoon, where the areas subject to high hypoxia (deeper parts of the lagoon) record the higher TOC and TN content. In addition, the deeper part of the lagoon supports a thicker slime layer, and thus contains a higher amount of organic matter. However, the effect of oxygen concentration on the preservation of organic matter is still under debate. Several studies [79,80] have emphasised that the O2 concentration does not appear to be a first-order controlling factor in organic carbon and total nitrogen preservation, as these were indistinguishable between recent coastal sediments removed from oxic and anoxic bottom-waters locations.
(ii) In addition to the oxygen concentration, spatial variations in TOC and TN values could result from different initial organic matter concentration and/or preservation potential. The highest TOC and TN values were recorded in the centre of the lagoon, which suggests that this area has a higher organic matter concentration potential. The increase in TOC and TN may be related to micritic mud-associated grain size partitioning, which, in turn, can be affected by hydrodynamics [80]. Zone IV is covered by a microbial slime with a decreasing thickness toward the shore of the lagoon. A decrease was also recorded within TOC and TN values in the different cores, suggesting that the microbial slime could be the main contributor to the sedimentary organic matter. To further constraint this, it is necessary to identify the origin of the organic matter within the different cores, especially if the geochemical signature can be traced to a microbial slime origin.

5.3. Preserved Organic Matter, Qualitative Aspect

5.3.1. TOC and TN

Several factors may impact TOC and TN sedimentary content, such as the dominant primary producers [81], the degradation rate (i.e., remineralisation) [82], the sedimentation rate [83], the size and the nature of the sediments particles [84,85], the water depth (in ocean settings) [86] or the hydrodynamics [87]. Mathematical formulas, which can predict the preserved TOC depending on depositional conditions, are available in the literature (see [61]; chap. 6.6). However, the application of these in the current study appears irrelevant, since they are limited to deep-sea environments. In addition, the impact remineralisation process is often underestimated. In proximal lagoonal environments such as the Cayo Coco lagoonal network, the remineralisation is probably one of the most relevant controls on the amount of organic material that will be preserved within the sedimentary record. The amount of organic matter preserved following remineralisation in the sediments is much smaller than the organic pool size in the water column (and also in the microbial mats) suggests.

5.3.2. [C/N]atomic ratio

The [C/N]atomic ratio is commonly used to identify organic matter sources [6,88,89,90]. At the surface, the [C/N]atomic ratios of each potential organic matter source are typically specific enough to consider a distinction based on this proxy. However, a clear increase is seen with depth, especially in Cores CC-3 and CC-4. Rather than a change in organic matter sources (which would be incompatible with the fairly stable δ13Corg values), the [C/N]atomic ratio probably highlights diagenetic processes affecting the nitrogen, similar to those of the δ15NTN (as discussed below). The respective changes in TN or TOC with depth are subtle, but sufficient to modify the [C/N]atomic ratios. The change in this ratio is affected mainly by the TN content, which decreases faster than the TOC. This decrease can be the result of a preferential degradation of proteins, rich in N, during nitrification followed by denitrification [91]. The denitrification process ultimately converts fixed nitrogen to gaseous N2 or N2O, and thus depletes the sediments of nitrogen [92], especially the labile N- fractions [93,94]. Denitrification occurs in dysoxic to anoxic environments [92], i.e., in conditions present in the deepest parts of the lagoon. This could explain the sustained increase of [C/N]atomic ratios downcore in Cores CC-3 and CC-4. Core CC-1 was exposed to oxic conditions [29] that prevent denitrification, accounting for the fairly stable [C/N]atomic ratio downcore.

5.3.3. δ13Corg

The δ13Corg values measured here are specific enough to distinguish between the different types of organic matter, but also make it possible to differentiate between the different microbial mat types. The mineralising microbial mats and the slime have distinctive δ13Corg values, ca. −15.60 ± 0.27‰ and −18.47 ± 0.08‰, respectively, and the δ13Corg of the SPM was −20.20 ± 0.47‰. Considering several sources, the geochemical signal of the SPM likely is a mixture of the different end-members with the largest contribution of microbial slime. The diatoms may also contribute to the geochemical signal of the organic matter; however, we were unable to make isotopic measurements on these organisms, and the literature values have a wide range (from ca. −15.0‰ to −25.8‰; [95,96]). The δ13Corg of plant fragments showed lower values (averaging −25.81‰ ± 1.41‰) than those of the Calvin-Benson cycle of C3 plants. The values for soil samples (averaging of −22.12‰ ± 1.72‰) were in between those of SPM and C3 metabolisms. It should be noted that lower values (−23.94‰ ± 0.02‰) were found in soils with large plant-derived organic content and higher values (−20.52‰ ± 0.02‰) were present in soils composed of large amounts of microbial mats. Soil formation results from the interaction between superficial cover and the underlying substrate and tends to maintain an isotopic signature close to its contributors, i.e., the vegetation and microbial mats.
All the cores sampled in this study had surface microbial mats with different mineralising potential: a mineralising mat in Zone III (Core CC-1) and a slime in Zone IV (Cores CC-2, CC-3 and CC-4). The respective 13Corg signatures are in agreement with the potential source of organic matter, confirming that the two types of microbial mats can be distinguished by using isotopic signatures. Relics of mineralising microbial mats (characteristic of Zone III) were preserved in the micritic muds of Core CC-2. The 13Corg values of these buried mats was of the same order as the reference sample for mineralising microbial mats (Figure 5; Table 1 and Table 2). A cryptic microbial mat lining a void in Core CC-1 had a δ13Corg signature (ca. −19.64 ± 0.22‰) similar to that of the slime (Figure 5; Table 1 and Table 2).
All cores considered, the δ13Corg values recorded in sediments (micritic muds and bioclastic sands) and the various fractions are not statistically different (one-way ANOVA, p-value 0.07185 between the two groups) and average −17.86 ± 0.86‰. The δ13Corg is relatively constant in all the lagoonal sediments, suggesting no major changes in quantity and quality of the organic matter sources during their deposition. These δ13Corg values are determined by the primary source of organic matter, and are further altered by diagenetic processes, such as respiration, oxidation, reduction, fermentation and physico-chemical processes [97]. The stable TOC values downcore indicate the remineralisation process within the uppermost centimetres of the sediment column is negligible, meaning that no major changes occur in the organic matter concentration during initial burial. The δ13Corg values of the different cores also remain fairly stable downcore, which illustrates that no major C-fractionation occurred during early diagenesis [98]. As a consequence, the observed δ13Corg reflect the signature of organic matter originally present. The fractionation recorded in the upper part of Core CC-1 likely corresponds to the transition between two pools of organic matter from different origin: i.e., the mineralised microbial mat on top and the slime below.
Since early diagenesis does not significantly impact the δ13Corg values, a mixing model of the different potential organic matter sources (Table 1) makes it possible to fully interpret the carbon isotopic signals. An important contribution of plant material can be questioned, since their δ13Corg values are significantly lower than those in the lagoonal sediments. In addition, (i) microscopic investigations did not review a significant contribution of plant fragments in the micritic muds or bioclastic sands composition (regardless of the fraction considered) and (ii), Core CC-4, sampled close to the mangrove, did not display more negative δ13Corg values than the other cores, which were taken far away from any potential plant inputs. Therefore, plant material did not contribute, or, alternately could have been degraded by microorganisms, as microbes. Indeed, fragments of mangroves (e.g., senescent leaves, branches) are readily decomposed by the microbial communities [99]. The bulk of the organic matter degraded by microbes is used for respiration, and not for secondary production [100]. Heterotrophic microbial activity results in a loss of organic carbon, as well as in a fractionation of the remaining organic matter pool [101]. In the Cayo Coco lagoonal network, the δ13Corg had values between those of the two microbial mat end-members, and could result from a mixing between the two organic matter sources. The isotopic measurements are in agreement with the field observations, since the microbial mats (slime or mineralising) are the most abundant producers and/or modifiers of organic matter in the lagoonal network. A mixing equation can be formulated between the two end-members to estimate their relative contribution:
δ13CorgSed = δ13CorgSlime.x + δ13CorgMM.(1 − x)
where:
  • δ13CorgSed = −17.86‰ (average δ13Corg signature of the sediments)
  • δ13CorgSlime = −18.47‰ (average δ13Corg signature of the slime)
  • x = relative contribution of slime in organic matter content
  • δ13CorgMM = −15.60‰ (average δ13Corg signature of the mineralising microbial mat)
  • (1 − x) = relative contribution of mineralising microbial mat in sedimentary organic matter content
The calculation above yields to an average contribution of 78.8% for the slime and 21.2% for the mineralising mats, respectively. To improve the accuracy, all of the three end-members should be included in the mixing equation. However, the equation cannot be solved with only the δ13Corg as the variable, the [C/N]atomic ratio and/or δ15NTN should have been included in the calculations. These two last proxies were mostly driven by diagenetic processes (see above for [C/N]atomic ratio and below for δ15NTN); so, it would be incorrect to use these to determine the contribution of organic matter sources. From a quantitative aspect, the area covered by the slime (i.e., Zone IV) is nearly 50% wider than the one covered by the mineralising mats (i.e., Zone III). Adding to this that the microbial slime is significantly thicker (up to 25 cm) than the mineralising microbial mats (usually <3 cm), this may explain the predominance of the slime as the source of organic matter preserved within the lagoonal sediments.
If the microbial slime is the main contributor to sedimentary organic matter, local variations of the sedimentary δ13Corg signal can be explained by minor variations in the respective potential sources, including the plants. For example, Core CC-1, located in Zone III, the interval just below the mineralising surface microbial mat (1.1–3.1 cm), depicts a higher-than-average δ13Corg value (−16.09 ± 0.93‰, all fractions included). Due to the location of this site, a greater contribution of the mineralising mat is expected. A mixing equation for this interval estimates that the contribution of the mineralising mats increased to 82.93%, and that for slime decreases to 17.07%, which corroborates this assumption. Despite its location close to the mangrove, the δ13Corg values of the sediments of Core CC-4 highlight a principal contribution of slime as the organic matter source. However, the 200–2000 µm fraction at the 7.1–8.5 cm interval displayed a significantly more negative value than the remainder of the core (regardless of the fractions). Microscopic observations revealed small but sufficient amounts of mangrove branch fragments in this interval, which explains the lower δ13Corg values.

5.3.4. δ15NTN

The δ15NTN appears to discriminate less between the potential sources of organic matter than δ13Corg, making this isotopic proxy less useful for determining the origin of the sedimentary organic matter. Even though microbial mats and soils have different values (ca. 3.35 ± 0.22‰ and 6.67 ± 2.00‰, respectively) microbially-derived organic matter has lower values than soils rich in microbial mat fragments. Significant differences in a few millimetres’ depth can be observed in microbial mats, making a distinction impossible based on only this isotope. This is particularly true owing to nitrogen isotopic signal of plants, with δ15NTN values ranging from −1.13 ± 0.38‰ to 7.77 ± 0.25‰, depending on particular plant species and specific plant parts. All of the values obtained in the lagoon remained below 8‰, and thus, no anthropogenic input seems to have affected the δ15NTN. The δ15NTN values of human (and animals) excrements range from 10‰ to 20‰ [102], while the values of residential wastewater or farm runoff vary between 10‰ and 25‰ [103]. These values are higher than those of natural organic matter. As observed in the different cores, an enrichment in 15N of several per mil is typically present in the uppermost centimetres of the sediment, which is within the range of environmental δ15NTN changes [104]. However, the 15N enrichment is limited to the part of the sediment that is in diffusional contact with the overlying waterbody [105]. This active biogeochemical cycling (e.g., remineralisation or assimilation, nitrification/denitrification, anaerobic ammonium oxidation, fixation; [92]) is associated with sizeable isotopic fractionation [106,107,108]. In Cores CC-2, CC-3 and CC-4, the δ15NTN values, ca. 2–3‰ at the surface, gradually increase downcore to exceed 6‰. Previous studies in marine sediments [109,110] have shown that such downcore increases are common during early burial, likely in the first centimetres of the sediments [111]. This diagenetic alteration of N-isotope signals results from the preferential utilisation of the light isotope (14N) by bacteria during the remineralisation of organic matter [99], especially denitrification, which usually results in an increase of +3‰ in the first centimetres of the sediments [108]. In addition, NH4+, enriched in the light isotope (14N), can be adsorbed to clay minerals [112]. The low clay content in the sediments of Cayo Coco (carbonates accounting usually for more than 85% of the bulk sediment) limits the amount of NH4+ adsorbed into mineral phases, which results in a higher sedimentary δ15N value [111]. Larger variations in δ15N are observed in the top 1.1 cm of the Core CC-1, corresponding to the surface mineralising microbial mat. Below this mat, the pattern of δ15N change is similar as that of the sediments of in the other cores. The upper part of Core CC-1 is different from the three others; notably, (i) it is composed of a mineralising microbial mat instead of slime (which is found at the top of the other cores); and (ii) it was collected in an area with alternating submersion/emersion, suggesting repeated exposure to the atmosphere, as opposed to the other cores, which were always submersed. The uppermost part of Core CC-1, i.e., the active microbial mat, is likely characterised by high rates of microbial activities such as nitrogen fixation with a δ15N signature close to that of the atmosphere (i.e., 0‰). Microprobe measurements showed the presence of an oxygen peak around 2 mm depth during daytime, and anoxia below 4 mm [29]. The lack of oxygen below 4 mm implies that denitrification could occur. Therefore, the appreciable shift in δ15N (+1.82‰ to 5.14‰) recorded in the upper 1.1 cm of the microbial mat of Core CC-1 microbial mat can be explained by a mixing trend between two different biological processes (i.e., predominantly nitrogen fixation near the surface and (increasing) denitrification downcore).
As a result, the δ15NTN signal should be interpreted with caution; this proxy does not appear to be robust for deciphering the source of organic matter, but rather, demonstrates that biogeochemical processes, whether depositional or diagenetic, should be kept in mind.

6. Conclusions

The sedimentary organic matter from four short cores (<15 cm) obtained in the Cayo Coco lagoonal network (Cuba) were analysed for elemental (TOC, TN and [C/N]atomic ratio) and isotopic (δ13Corg and δ15NTN) composition, and compared with the potential local sources of organic matter (microbial mats, SPM, plants and soils). TOC and TN proxies allowed evaluating the amount of organic matter preserved within the sediments showing a decrease in organic content within the sediments (micritic muds and bioclastic sands). This decrease is indicative of intense remineralisation in the proximal lagoon sediments. The [C/N]atomic ratios, calculated from the TOC and TN values, from different potential sources of organic matter were distinctive enough to be used for identification of organic matter components preserved within the sediments. However, this ratio increased downcore as the result of diagenetic process in hypoxic environments, especially an increased denitrification process. The [C/N]atomic ratio can be indicative of the organic matter source for recent oxic sediments, but should be used with caution in the fossil record, as early diagenesis could significantly alter the original signal. The δ13Corg appeared to be less sensitive to genetic (e.g., facies, fraction) and early diagenetic processes than the other proxies, and therefore, seems to be appropriate for use in identifying the initial organic matter source. This δ13Corg proxy remains quite stable downcore; the small scale variations can be explained by local changes in the organic matter sources. In the Cayo Coco lagoonal network, the δ13Corg proxy (combined with the [C/N]atomic ratio) demonstrated that the main contributors to sedimentary organic matter are the microbial mats, especially the microbial slime. Even though very early diagenesis seems to have a limited impact on the δ13Corg, it is necessary to keep in mind that later diagenetic processes (mainly associated with fluid circulations), such as changes in the hydrological zone or burial depth, can modify the isotopic compositions. The measurements of the δ15NTN from the different potential sources of organic matter revealed that this proxy is not specific enough to identify the source of the sedimentary organic matter. In addition, the δ15NTN appears to be very sensitive to early diagenetic processes (such as denitrification), especially in anoxic environments which systematically increased δ15NTN by +3–4‰ from the top to the bottom of the four cores.
The elemental and isotopic investigations of the organic matter content from the sediments in the Cayo Coco lagoonal network have shown that the different proxies (i.e., TOC, TN, [C/N]atomic ratio, δ13Corg and δ15NTN) were controlled by both genetic and early diagenetic processes. The preservation of the δ13Corg signal in the sediment allowed us to identify the influence of the slime as a source of the organic matter. The use of these proxies for interpreting the fossil record should be carried out with consideration of alteration through the early diagenesis.

Author Contributions

Conceptualisation, A.B. and E.V.; investigation, A.B., E.V., C.T., O.M., F.G., M.J. and P.T.V.; methodology, O.M.; writing—original draft preparation, A.B. and E.V.; writing—review and editing, A.B., E.V., C.T., O.M., F.G., M.J. and P.T.V.; visualisation, A.B. and E.V.; supervision, E.V and A.B.; project administration, E.V. All authors have read and agreed to the published version of the manuscript.

Funding

This research was funded by Engie and the I-SITE, grant number UB18016-BGS-IS.

Acknowledgments

This study is a contribution from the SEDS team of Biogéosciences laboratory (Dijon, France) to the I-site project UB18016-BGS-IS. The authors express their gratitude to Raphael Bourillot and Aurélie Pace for their participation and discussion in the field and Christophe Dupraz for his help during the CryoSEM session. Authors are thanking Anne Claire Chaboureau and Jean Lévêque for their discussion and Ludovic Bruneau for his help in XRD-spectrum interpretation. The authors are grateful to the three anonymous reviewers whose constructive comments greatly improved the manuscript.

Conflicts of Interest

The authors declare no conflict of interest.

References

  1. Carreira, R.S.; Araújo, M.P.; Costa, T.L.F.; Spörl, G.; Knoppers, B.A. Lipids in the sedimentary record as markers of the sources and deposition of organic matter in a tropical Brazilian estuarine–lagoon system. Mar. Chem. 2011, 127, 1–11. [Google Scholar] [CrossRef]
  2. Adams, R.; Arafat, Y.; Eate, V.; Grace, M.R.; Saffarpour, S.; Weatherley, A.J.; Western, A.W. A catchment study of sources and sinks of nutrients and sediments in south-east Australia. J. Hydrol. 2014, 515, 166–179. [Google Scholar] [CrossRef]
  3. Keith, M.K.; Sobieszczyk, S.; Goldman, J.H.; Rounds, S.A. Investigating organic matter in Fanno Creek, Oregon, Part 2 of 3: Sources, sinks, and transport of organic matter with fine sediment. J. Hydrol. 2014, 519, 3010–3027. [Google Scholar] [CrossRef]
  4. Meyers, P.A. Organic geochemical proxies of paleoceanographic, paleolimnologic, and paleoclimatic processes. Org. Geochem. 1997, 27, 213–250. [Google Scholar] [CrossRef]
  5. Silliman, J.E.; Meyers, P.A.; Ostrom, P.H.; Ostrom, N.E.; Eadie, B.J. Insights into the origin of perylene from isotopic analyses of sediments from Saanich Inlet, British Columbia. Org. Geochem. 2000, 31, 1133–1142. [Google Scholar] [CrossRef]
  6. Gontharet, S.; Mathieu, O.; Lévêque, J.; Milloux, M.J.; Lesourd, S.; Philippe, S.; Caillaud, J.; Gardel, A.; Sarrazin, M.; Proisy, C. Distribution and sources of bulk organic matter (OM) on a tropical intertidal mud bank in French Guiana from elemental and isotopic proxies. Chem. Geol. 2014, 376, 1–10. [Google Scholar] [CrossRef]
  7. Degens, E.T.; Ittekkot, V. The carbon cycle—Tracking the path of organic particles from sea to sediment. Geol. Soc. Lond. Spec. Publ. 1987, 26, 121–135. [Google Scholar] [CrossRef]
  8. Calvert, S.E. Oceanographic controls on the accumulation of organic matter in marine sediments. Geol. Soc. Lond. Spec. Publ. 1987, 26, 137–151. [Google Scholar] [CrossRef]
  9. Morris, R.J. The formation of organic-rich deposits in two deep-water marine environments. Geol. Soc. Lond. Spec. Publ. 1987, 26, 153–166. [Google Scholar] [CrossRef]
  10. Hedges, J.I.; Keil, R.G. Sedimentary organic matter preservation: An assessment and speculative synthesis. Mar. Chem. 1995, 49, 81–115. [Google Scholar] [CrossRef]
  11. Meyers, P.A. Preservation of elemental and isotopic source identification of sedimentary organic matter. Chem. Geol. 1994, 114, 289–302. [Google Scholar] [CrossRef] [Green Version]
  12. Zhang, J.; Wu, Y.; Jennerjahn, T.C.; Ittekkot, V.; He, Q. Distribution of organic matter in the Changjiang (Yangtze River) Estuary and their stable carbon and nitrogen isotopic ratios: Implications for source discrimination and sedimentary dynamics. Mar. Chem. 2007, 106, 111–126. [Google Scholar] [CrossRef]
  13. Ruiz-Fernández, A.C.; Hillaire-Marcel, C.; Ghaleb, B.; Soto-Jiménez, M.; Páez-Osuna, F. Recent sedimentary history of anthropogenic impacts on the Culiacan River Estuary, northwestern Mexico: Geochemical evidence from organic matter and nutrients. Environ. Pollut. 2002, 118, 365–377. [Google Scholar] [CrossRef]
  14. Ruiz-Fernández, A.C.; Hillaire-Marcel, C.; Páez-Osuna, F.; Ghaleb, B.; Soto-Jiménez, M. Historical trends of metal pollution recorded in the sediments of the Culiacan River Estuary, Northwestern Mexico. Appl. Geochem. 2003, 18, 577–588. [Google Scholar] [CrossRef]
  15. Ruiz-Fernández, A.C.; Páez-Osuna, F.; Soto-Jiménez, M.; Hillaire-Marcel, C.; Ghaleb, B. The loading history of trace metals and nutrients in Altata-Ensenada del Pabellón, lagoon complex, northwestern Mexico. J. Environ. Radioact. 2003, 69, 129–143. [Google Scholar] [CrossRef]
  16. Alonso Hernandez, C.; Santanaa, S.P.; Brunorib, C.; Morabitoc, R.; Delfantid, R.; Papuccid, C. Historical trend in heavy metal pollution in the sediments of Cienfuegos Bay (Cuba), defined by 210Pb and 137Cs geochronology. Environ. Stud. 2006, 39, 424. [Google Scholar]
  17. Alonso-Hernandez, C.M.; Diaz-Asencio, M.; Munoz-Caravaca, A.; Delfanti, R.; Papucci, C.; Ferretti, O.; Crovato, C. Recent changes in sedimentation regime in Cienfuegos Bay, Cuba, as inferred from 210Pb and 137Cs vertical profiles. Cont. Shelf Res. 2006, 26, 153–167. [Google Scholar] [CrossRef]
  18. Díaz-Asencio, M.; Alonso-Hernández, C.M.; Bolanos-Álvarez, Y.; Gómez-Batista, M.; Pinto, V.; Morabito, R.; Hernández-Albernas, J.I.; Eriksson, M.; Sanchez-Cabeza, J.A. One century sedimentary record of Hg and Pb pollution in the Sagua estuary (Cuba) derived from 210Pb and 137Cs chronology. Mar. Pollut. Bull. 2009, 59, 108–115. [Google Scholar] [CrossRef]
  19. Díaz-Asencio, M.; Alvarado, J.A.C.; Alonso-Hernández, C.; Quejido-Cabezas, A.; Ruiz-Fernández, A.C.; Sanchez-Sanchez, M.; Gómez-Mancebo, M.B.; Froidevaux, P.; Sanchez-Cabeza, J.A. Reconstruction of metal pollution and recent sedimentation processes in Havana Bay (Cuba): A tool for coastal ecosystem management. J. Hazard. Mater. 2011, 196, 402–411. [Google Scholar] [CrossRef]
  20. Ruiz-Fernández, A.C.; Hillaire-Marcel, C. 210Pb-derived ages for the reconstruction of terrestrial contaminant history into the Mexican Pacific coast: Potential and limitations. Mar. Pollut. Bull. 2009, 59, 134–145. [Google Scholar] [CrossRef]
  21. Alonso-Hernández, C.M.; Garcia-Moya, A.; Tolosa, I.; Diaz-Asencio, M.; Corcho-Alvarado, J.A.; Morera-Gomez, Y.; Fanelli, E. Tracing organic matter sources in a tropical lagoon of the Caribbean Sea. Cont. Shelf Res. 2017, 148, 53–63. [Google Scholar] [CrossRef]
  22. Cifuentes, L.A.; Coffin, R.B.; Solorzano, L.; Cardenas, W.; Espinoza, J.; Twilley, R.R. Isotopic and Elemental Variations of Carbon and Nitrogen in a Mangrove Estuary. Estuar. Coast. Shelf Sci. 1996, 43, 781–800. [Google Scholar] [CrossRef] [Green Version]
  23. Kennedy, H.; Gacia, E.; Kennedy, D.P.; Papadimitriou, S.; Duarte, C.M. Organic carbon sources to SE Asian coastal sediments. Estuar. Coast. Shelf Sci. 2004, 60, 59–68. [Google Scholar] [CrossRef]
  24. Showers, W.J.; Angle, D.G. Stable isotopic characterization of organic carbon accumulation on the Amazon continental shelf. Cont. Shelf Res. 1986, 6, 227–244. [Google Scholar] [CrossRef]
  25. Aller, R.C.; Blair, N.E.; Xia, Q.; Rude, P.D. Remineralization rates, recycling, and storage of carbon in Amazon shelf sediments. Cont. Shelf Res. 1996, 16, 753–786. [Google Scholar] [CrossRef]
  26. Aller, R.C.; Heilbrun, C.; Panzeca, C.; Zhu, Z.; Baltzer, F. Coupling between sedimentary dynamics, early diagenetic processes, and biogeochemical cycling in the Amazon–Guianas mobile mud belt: Coastal French Guiana. Mar. Geol. 2004, 208, 331–360. [Google Scholar] [CrossRef]
  27. Zhu, Z.; Aller, R.C.; Mak, J. Stable carbon isotope cycling in mobile coastal muds of Amapá, Brazil. Cont. Shelf Res. 2002, 22, 2065–2079. [Google Scholar] [CrossRef]
  28. Marchand, C.; Lallier-Vergès, E.; Baltzer, F. The composition of sedimentary organic matter in relation to the dynamic features of a mangrove-fringed coast in French Guiana. Estuar. Coast. Shelf Sci. 2003, 56, 119–130. [Google Scholar] [CrossRef] [Green Version]
  29. Bouton, A.; Vennin, E.; Pace, A.; Bourillot, R.; Dupraz, C.; Thomazo, C.; Brayard, A.; Désaubliaux, G.; Visscher, P.T. External controls on the distribution, fabrics and mineralization of modern microbial mats in a coastal hypersaline lagoon, Cayo Coco (Cuba). Sedimentology 2016. n/a-n/a. [Google Scholar] [CrossRef]
  30. Pace, A.; Bourillot, R.; Bouton, A.; Vennin, E.; Braissant, O.; Dupraz, C.; Duteil, T.; Bundeleva, I.; Patrier, P.; Galaup, S.; et al. Formation of stromatolite lamina at the interface of oxygenic–anoxygenic photosynthesis. Geobiology 2018, 16, 378–398. [Google Scholar] [CrossRef]
  31. Dupraz, C.; Reid, R.P.; Braissant, O.; Decho, A.W.; Norman, R.S.; Visscher, P.T. Processes of carbonate precipitation in modern microbial mats. Earth-Sci. Rev. 2009, 96, 141–162. [Google Scholar] [CrossRef]
  32. Reid, R.P.; Visscher, P.T.; Decho, A.W.; Stolz, J.F.; Bebout, B.M.; Dupraz, C.; Macintyre, I.G.; Paerl, H.W.; Pinckney, J.L.; Prufert-Bebout, L.; et al. The role of microbes in accretion, lamination and early lithification of modern marine stromatolites. Nature 2000, 406, 989–992. [Google Scholar] [CrossRef] [PubMed]
  33. Seong-Joo, L.; Browne, K.; Golubic, S. On Stromatolite Lamination. In Microbial Sediments; Riding, R., Awramik, S., Eds.; Springer: Berlin/Heidelberg, Germany, 2000; pp. 16–24. [Google Scholar]
  34. Bowlin, E.M.; Klaus, J.S.; Foster, J.S.; Andres, M.S.; Custals, L.; Reid, R.P. Environmental controls on microbial community cycling in modern marine stromatolites. Sediment. Geol. 2012, 263–264, 45–55. [Google Scholar] [CrossRef]
  35. Dupraz, C.; Fowler, A.; Tobias, C.; Visscher, P.T. Stromatolitic knobs in Storr’s Lake (San Salvador, Bahamas): A model system for formation and alteration of laminae. Geobiology 2013, 11, 527–548. [Google Scholar] [CrossRef] [PubMed]
  36. Harwood Theisen, C.; Sumner, D.Y.; Mackey, T.J.; Lim, D.S.S.; Brady, A.L.; Slater, G.F. Carbonate fabrics in the modern microbialites of Pavilion Lake: Two suites of microfabrics that reflect variation in microbial community morphology, growth habit, and lithification. Geobiology 2015, 13, 357–372. [Google Scholar] [CrossRef]
  37. Alcolado, P.M.; Menedez, F.; Garcia-Parrado, P.; Zuniga, D.; Martinez-Darana, B.; Losa, M.; Gomez, R. Cayo Coco, Sabana-Camaguey Archipelago, Cuba. In Caribbean Coral Reef, Seagrass and Mangrove Sites, Coastal Region and Small Island Papers No. 3; Kjerfve, B., Ed.; UNESCO: Paris, France, 1998; pp. 221–228. [Google Scholar]
  38. IGEO/ICGC/IGN. Nuevo Atlas Nacional de Cuba; Instituto de Geografía de la Academia de Ciencias de Cuba, Instituto Cubano de Geodesia y Cartografía/Instituto Geográfico Nacional: La Habana, Cuba, 1989. [Google Scholar]
  39. Borhidi, A. Phytogeography and Vegetation Ecology of Cuba, 2nd ed.; Akadémiai Kiadó: Budapest, Hungary, 1996. [Google Scholar]
  40. G’meiner, A.A. Holocene Environmental Change Inferred from Fossil Pollen and Microcharcoal at Cenote Jennifer, Cayo Coco, Cuba; McGill University: Montreal, QB, Canada, 2016. [Google Scholar]
  41. Peros, M.C.; Reinhardt, E.G.; Davis, A.M. A 6000-year record of ecological and hydrological changes from Laguna de la Leche, north coastal Cuba. Quat. Res. 2007, 67, 69–82. [Google Scholar] [CrossRef]
  42. Menéndez-Perez, H.; Díaz-Martínez, R.; González-de Zayas, R.; González-Fernández, J.A. Caracterización hidroquímica del Gran Humedal del Norte, Ciego de Ávila, Cuba. Min. Y Geol. 2011, 27, 15–41. [Google Scholar]
  43. González, J.A.; Menéndez, H.; González, R.; Días, G.B.; Borroto, P. Contribución de las variaciones naturales y antrópicas a los valores de temperatura y salinidad de las aguas de la bahía de Perros. Ser. Oceanol. 2013, 12, 36–47. [Google Scholar]
  44. González-Fernández, J.A.; Menéndez-Pérez, H.; González-Santana, R.; Fonseca-Roselló, J.A.; González-Abreu Fernández, R.; Vidal-Olivera, V. Papel regulador de las zonas inundables del humedal en el intercambio salino subterráneo entre las bahías interiores-acuíferos en el gran humedal del norte de Ciego de Avila. Cienc. En Su Pc 2008, 2, 66–74. [Google Scholar]
  45. Craig, H. The geochemistry of stable carbon isotopes. Geochim. Cosmochim. Acta 1953, 3, 53–92. [Google Scholar] [CrossRef]
  46. Mariotti, A. Atmospheric nitrogen is a reliable standard for natural 15N abundance measurements. Nature 1983, 303, 685–687. [Google Scholar] [CrossRef]
  47. Hammer, Ø.; Harper, D.A.; Ryan, P.D. PAST: Paleontological statistics software package for education and data analysis. Palaeontol. Electron. 2001, 4, 9. [Google Scholar]
  48. Stal, L.J.; van Gemerden, H.; Krumbein, W.E. Structure and development of a benthic marine microbial mat. Fems Microbiol. Lett. 1985, 31, 111–125. [Google Scholar] [CrossRef]
  49. Van Gemerden, H. Microbial mats: A joint venture. Mar. Geol. 1993, 113, 3–25. [Google Scholar] [CrossRef]
  50. Decho, A. Exopolymer Microdomains as a Structuring Agent for Heterogeneity Within Microbial Biofilms. In Microbial Sediments; Riding, R., Awramik, S., Eds.; Springer: Berlin/Heidelberg, Germany, 2000; pp. 9–15. [Google Scholar]
  51. Visscher, P.T.; van Gemerden, H. Sulfur Cycling in Laminated Marine Microbial Ecosystems. In Biogeochemistry of Global Change; Oremland, R., Ed.; Springer: Boston, MA, USA, 1993; pp. 672–690. [Google Scholar]
  52. Arp, G.; Reimer, A.; Reitner, J. Microbialite Formation in Seawater of Increased Alkalinity, Satonda Crater Lake, Indonesia. J. Sediment. Res. 2003, 73, 105–127. [Google Scholar] [CrossRef]
  53. Visscher, P.T.; van Gemerden, H. Production and Consumption of Dimethylsulfoniopropionate in Marine Microbial Mats. Appl. Environ. Microbiol. 1991, 57, 3237–3242. [Google Scholar] [CrossRef] [Green Version]
  54. Visscher, P.T.; Reid, R.P.; Bebout, B.M.; Hoeft, S.E.; Macintyre, I.G.; Thompson, J.A. Formation of lithified micritic laminae in modern marine stromatolites (Bahamas); the role of sulfur cycling. Am. Mineral. 1998, 83, 1482–1493. [Google Scholar] [CrossRef]
  55. Schneider, D.; Reimer, A.; Reitner, J.; Daniel, R. Phylogenetic Analysis of a Microbialite-Forming Microbial Mat from a Hypersaline Lake of the Kiritimati Atoll, Central Pacific. PLoS ONE 2013, 8, 1–14. [Google Scholar] [CrossRef] [Green Version]
  56. Pérez-Carreras, E.; Vázquez-Montes De Oca, R.; Martín-Palacios, R. Restauración ecológica de algunos ecosistemas boscosos y arbustivos costeros de Ciego de Ávila, según mecanismos funcionales. Rev. For. Baracoa 2012, 31, 23–33. [Google Scholar]
  57. Bianchi, T.S.; Canuel, E.A. Chemical Biomarkers in Aquatic Ecosystems; Princeton University Press: Princeton, NJ, USA, 2011; p. 392. [Google Scholar]
  58. Gallagher, K.; Dupraz, C.; Braissant, O.; Norman, R.; Decho, A.; Visscher, P. Mineralization of sedimentary biofilms: Modern mechanistic insights. In Biofilm: Formation, Development and Properties; Bailey, W.C., Ed.; Nova Science Publishers: Hauppauge, NY, USA, 2000; pp. 227–258. [Google Scholar]
  59. Visscher, P.T.; Stolz, J.F. Microbial mats as bioreactors: Populations, processes, and products. Palaeogeogr. Palaeoclimatol. Palaeoecol. 2005, 219, 87–100. [Google Scholar] [CrossRef]
  60. Sand-jensen, K. Influence of submerged macrophytes on sediment composition and near-bed flow in lowland streams. Freshw. Biol. 1998, 39, 663–679. [Google Scholar] [CrossRef]
  61. Tyson, R.V. Distribution of the Amorphous Group. In Sedimentary Organic Matter: Organic facies and Palynofacies; Springer: Dordrecht, The Netherlands, 1995; pp. 249–259. [Google Scholar]
  62. Burdige, D.J. Preservation of Organic Matter in Marine Sediments:  Controls, Mechanisms, and an Imbalance in Sediment Organic Carbon Budgets? Chem. Rev. 2007, 107, 467–485. [Google Scholar] [CrossRef] [PubMed]
  63. Neumann, A.C.; Land, L.S. Lime mud deposition and calcareous algae in the Bight of Abaco, Bahamas: A budget. J. Sed. Petrol. 1975, 45, 763–786. [Google Scholar]
  64. Jørgensen, B.B. Processes at the sediment-water interface. In The Major Biochemical Cycles and Their Interactions; Bolin, B., Cook, R.B., Eds.; John Wiley: New York, NY, USA, 1983; pp. 477–515. [Google Scholar]
  65. Reeburgh, W.S. Rates of biogeochemical processes in anoxic sediments. Annu. Rev. Earth Planet. Sci. 1983, 11, 269–298. [Google Scholar] [CrossRef] [Green Version]
  66. Mitterer, R.M.; Dzou, I.P.; Miranda, R.M.; Caughey, M.E. Extractable and pyrolyzed hydrocarbons in shallow-water carbonate sediments, Florida Bay, Florida. Org. Geochem. 1988, 13, 283–294. [Google Scholar] [CrossRef]
  67. Marin, F.; Luquet, G. Molluscan shell proteins. Comptes Rendus Palevol. 2004, 3, 469–492. [Google Scholar] [CrossRef]
  68. Hare, P. Amino acid composition of some calcified proteins. Carnegie Inst. Wash. Yearbk. 1965, 64, 223–232. [Google Scholar]
  69. Winterwerp, J.C.; Van Kesteren, W.G. Introduction to the Physics of Cohesive Sediment Dynamics in the Marine Environment; Elsevier: Amsterdam, The Netherlands, 2004; Volume 56. [Google Scholar]
  70. Bauersachs, T.; Schouten, S.; Schwark, L. Characterization of the sedimentary organic matter preserved in Messel oil shale by bulk geochemistry and stable isotopes. Palaeogeogr. Palaeoclimatol. Palaeoecol. 2014, 410, 390–400. [Google Scholar] [CrossRef]
  71. Lokier, S.; Fiorini, F.; Odeh, W.A. Carbonate facies distribution within arid mangrove systems. In Proceedings of the EGU General Assembly Conference Abstracts, Vienna, Austria, 1 April 2018; p. 1414. [Google Scholar]
  72. Fiorini, F.; Lokier, S.W. Recent Miliolidae from lagoonal environments of the UAE. In Proceedings of the EGU General Assembly Conference Abstracts, Vienna, Austria, 1 April 2019. [Google Scholar]
  73. Bordenave, M.L. Applied Petroleum Geochemistry; Technip: Paris, France, 1993; p. 524. [Google Scholar]
  74. Isla, F.I. Chapter 9 Coastal Lagoons. In Geomorphology and Sedimentology of Estuaries. Developments in Sedimentology; Perillo, G.M.E., Ed.; Elsevier: Amsterdam, The Netherlands, 1995; Volume 53, pp. 241–272. [Google Scholar]
  75. De Falco, G.; Magni, P.; Teräsvuori, L.M.H.; Matteucci, G. Sediment grain size and organic carbon distribution in the Cabras lagoon (Sardinia, Western Mediterranean). Chem. Ecol. 2004, 20, 367–377. [Google Scholar] [CrossRef]
  76. Kristensen, E. Organic matter diagenesis at the oxic/anoxic interface in coastal marine sediments, with emphasis on the role of burrowing animals. Hydrobiologia 2000, 426, 1–24. [Google Scholar] [CrossRef]
  77. Arndt, S.; Jørgensen, B.B.; LaRowe, D.E.; Middelburg, J.J.; Pancost, R.D.; Regnier, P. Quantifying the degradation of organic matter in marine sediments: A review and synthesis. Earth-Sci. Rev. 2013, 123, 53–86. [Google Scholar] [CrossRef]
  78. Jessen, G.L.; Lichtschlag, A.; Ramette, A.; Pantoja, S.; Rossel, P.E.; Schubert, C.J.; Struck, U.; Boetius, A. Hypoxia causes preservation of labile organic matter and changes seafloor microbial community composition (Black Sea). Sci. Adv. 2017, 3, e1601897. [Google Scholar] [CrossRef] [PubMed] [Green Version]
  79. Calvert, S.E.; Pedersen, T.F. Geochemistry of Recent oxic and anoxic marine sediments: Implications for the geological record. Mar. Geol. 1993, 113, 67–88. [Google Scholar] [CrossRef]
  80. Cowie, G.L.; Hedges, J.I. The role of anoxia in organic matter preservation in coastal sediments: Relative stabilities of the major biochemicals under oxic and anoxic depositional conditions. Org. Geochem. 1992, 19, 229–234. [Google Scholar] [CrossRef]
  81. Tribovillard, N.; Caulet, J.; Vergnaud-Grazzini, C.; Moureau, N.; Tremblay, P. Geochemical study of a glacial–interglacial transition in the upwelling influenced Somalia margin, NW Indian Ocean: An unexpected lack of organic matter accumulation. Mar. Geol. 1996, 133, 157–182. [Google Scholar] [CrossRef]
  82. Middelburg, J.J.; Vlug, T.; Jaco, F.; van der Nat, W.A. Organic matter mineralization in marine systems. Glob. Planet. Chang. 1993, 8, 47–58. [Google Scholar] [CrossRef]
  83. Ibach, L.E.J. Relationship Between Sedimentation Rate and Total Organic Carbon Content in Ancient Marine Sediments. Aapg Bull. 1982, 66, 170–188. [Google Scholar] [CrossRef]
  84. Thamban, M.; Rao, V.P.; Raju, S.V. Controls on organic carbon distribution in sediments from the eastern Arabian Sea Margin. Geo-Mar. Lett. 1997, 17, 220–227. [Google Scholar] [CrossRef]
  85. Kennedy, M.J.; Pevear, D.R.; Hill, R.J. Mineral Surface Control of Organic Carbon in Black Shale. Science 2002, 295, 657–660. [Google Scholar] [CrossRef] [Green Version]
  86. Van Der Loeff, R.M.M.; Meadows, P.S.; Allen, J.A. Oxygen in Pore Waters of Deep-Sea Sediments [and Discussion]. Philos. Trans. R. Soc. London. Ser. Amathematical Phys. Sci. 1990, 331, 69–84. [Google Scholar]
  87. Huc, A.Y.; Le Fournier, J.; Vandenbroucke, M.; Bessereau, G.; Katz, B.J. Northern Lake Tanganyika—An Example of Organic Sedimentation in an Anoxic Rift Lake. In Lacustrine Basin Exploration: Case Studies and Modern Analogs; American Association of Petroleum Geologists: Tusla, OK, USA, 1990; Volume 50. [Google Scholar]
  88. Meyers, P.A.; Ishiwatari, R. Lacustrine organic geochemistry—an overview of indicators of organic matter sources and diagenesis in lake sediments. Org. Geochem. 1993, 20, 867–900. [Google Scholar] [CrossRef] [Green Version]
  89. Barros, G.V.; Martinelli, L.A.; Oliveira Novais, T.M.; Ometto, J.P.H.B.; Zuppi, G.M. Stable isotopes of bulk organic matter to trace carbon and nitrogen dynamics in an estuarine ecosystem in Babitonga Bay (Santa Catarina, Brazil). Sci. Total Environ. 2010, 408, 2226–2232. [Google Scholar] [CrossRef] [PubMed]
  90. Yamamuro, M.; Kamiya, H. Elemental (C, N, P) and isotopic (δ13C, δ15N) signature of primary producers and their contribution to the organic matter in coastal lagoon sediment. Landsc. Ecol. Eng. 2014, 10, 65–75. [Google Scholar] [CrossRef]
  91. Van Mooy, B.A.S.; Keil, R.G.; Devol, A.H. Impact of suboxia on sinking particulate organic carbon: Enhanced carbon flux and preferential degradation of amino acids via denitrification. Geochim. Cosmochim. Acta 2002, 66, 457–465. [Google Scholar] [CrossRef]
  92. Thomazo, C.; Ader, M.; Farquhar, J.; Philippot, P. Methanotrophs regulated atmospheric sulfur isotope anomalies during the Mesoarchean (Tumbiana Formation, Western Australia). Earth Planet. Sci. Lett. 2009, 279, 65–75. [Google Scholar] [CrossRef]
  93. Lehmann, M.F.; Bernasconi, S.M.; Barbieri, A.; McKenzie, J.A. Preservation of organic matter and alteration of its carbon and nitrogen isotope composition during simulated and in situ early sedimentary diagenesis. Geochim. Cosmochim. Acta 2002, 66, 3573–3584. [Google Scholar] [CrossRef]
  94. Gälman, V.; Rydberg, J.; de-Luna, S.S.; Bindler, R.; Renberg, I. Carbon and nitrogen loss rates during aging of lake sediment: Changes over 27 years studied in varved lake sediment. Limnol. Oceanogr. 2008, 53, 1076–1082. [Google Scholar] [CrossRef] [Green Version]
  95. Fry, B.; Wainright, S.C. Diatom sources of 13 C-rich carbon in marine food webs. Mar. Ecol. Prog. Ser. 1991, 76, 149–157. [Google Scholar] [CrossRef]
  96. Pascal, P.-Y.; Gros, O.; Boschker, H.T.S. Temporal fluctuations in the trophic role of large benthic sulfur bacteria in mangrove sediment. Food Webs 2016, 7, 20–28. [Google Scholar] [CrossRef] [Green Version]
  97. Deming, J.W.; Baross, J.A. The Early Diagenesis of Organic Matter: Bacterial Activity. In Organic Geochemistry: Principles and Applications; Engel, M.H., Macko, S.A., Eds.; Springer: Boston, MA, USA, 1993; pp. 119–144. [Google Scholar]
  98. Sansjofre, P.; Ader, M.; Trindade, R.I.F.; Elie, M.; Lyons, J.; Cartigny, P.; Nogueira, A.C.R. A carbon isotope challenge to the snowball Earth. Nature 2011, 478, 93–96. [Google Scholar] [CrossRef]
  99. Chapin, F.S., III; Matson, P.A.; Vitousek, P. Principles of Terrestrial Ecosystem Ecology; Springer Science & Business Media: New York, NY, USA, 2011; p. 447. [Google Scholar]
  100. Fasching, C.; Behounek, B.; Singer, G.A.; Battin, T.J. Microbial degradation of terrigenous dissolved organic matter and potential consequences for carbon cycling in brown-water streams. Sci. Rep. 2014, 4, 4981. [Google Scholar] [CrossRef] [PubMed]
  101. Kawasaki, N.; Komatsu, K.; Kohzu, A.; Tomioka, N.; Shinohara, R.; Satou, T.; Watanabe, F.N.; Tada, Y.; Hamasaki, K.; Kushairi, M. Bacterial contribution to dissolved organic matter in eutrophic Lake Kasumigaura, Japan. Appl. Environ. Microbiol. 2013, 79, 7160–7168. [Google Scholar] [CrossRef] [PubMed] [Green Version]
  102. Ruiz-Fernández, A.C.; Hillaire-Marcel, C.; de Vernal, A.; Machain-Castillo, M.L.; Vásquez, L.; Ghaleb, B.; Aspiazu-Fabián, J.A.; Páez-Osuna, F. Changes of coastal sedimentation in the Gulf of Tehuantepec, South Pacific Mexico, over the last 100 years from short-lived radionuclide measurements. Estuar. Coast. Shelf Sci. 2009, 82, 525–536. [Google Scholar] [CrossRef]
  103. Rumolo, P.; Barra, M.; Gherardi, S.; Marsella, E.; Sprovieri, M. Stable isotopes and C/N ratios in marine sediments as a tool for discriminating anthropogenic impact. J. Environ. Monit. 2011, 13, 3399–3408. [Google Scholar] [CrossRef]
  104. Brahney, J.; Ballantyne, A.P.; Turner, B.L.; Spaulding, S.A.; Otu, M.; Neff, J.C. Separating the influences of diagenesis, productivity and anthropogenic nitrogen deposition on sedimentary δ15N variations. Org. Geochem. 2014, 75, 140–150. [Google Scholar] [CrossRef] [Green Version]
  105. Ader, M.; Thomazo, C.; Sansjofre, P.; Busigny, V.; Papineau, D.; Laffont, R.; Cartigny, P.; Halverson, G.P. Interpretation of the nitrogen isotopic composition of Precambrian sedimentary rocks: Assumptions and perspectives. Chem. Geol. 2016, 429, 93–110. [Google Scholar] [CrossRef] [Green Version]
  106. Shen, Y.; Pinti, D.L.; Hashizume, K. Biogeochemical Cycles of Sulfur and Nitrogen in the Archean Ocean and Atmosphere. In Archean Geodynamics and Environments; Benn, K., Mareschal, J.-C., Condie, K.C., Eds.; American Geophysical Union: Washington, DC, USA, 2006; Volume 164, pp. 305–320. [Google Scholar]
  107. Casciotti, K.L. Inverse kinetic isotope fractionation during bacterial nitrite oxidation. Geochim. Cosmochim. Acta 2009, 73, 2061–2076. [Google Scholar] [CrossRef] [Green Version]
  108. Sigman, D.M.; Karsh, K.; Casciotti, K. Ocean process tracers: Nitrogen isotopes in the ocean. In Encyclopedia of Ocean Sciences; Steele, J.H., Thorpe, S.A., Turekian, K.K., Eds.; Academic Press: Oxford, UK, 2009; pp. 40–54. [Google Scholar]
  109. Freudenthal, T.; Wagner, T.; Wenzhöfer, F.; Zabel, M.; Wefer, G. Early diagenesis of organic matter from sediments of the eastern subtropical Atlantic: Evidence from stable nitrogen and carbon isotopes. Geochim. Cosmochim. Acta 2001, 65, 1795–1808. [Google Scholar] [CrossRef]
  110. Holmes, E.; Lavik, G.; Fischer, G.; Segl, M.; Ruhland, G.; Wefer, G. Seasonal variability of δ15N in sinking particles in the Benguela upwelling region. Deep Sea Res. Part I Oceanogr. Res. Pap. 2002, 49, 377–394. [Google Scholar] [CrossRef]
  111. Robinson, R.S.; Kienast, M.; Luiza Albuquerque, A.; Altabet, M.; Contreras, S.; De Pol Holz, R.; Dubois, N.; Francois, R.; Galbraith, E.; Hsu, T.-C.; et al. A review of nitrogen isotopic alteration in marine sediments. Paleoceanography 2012, 27, 1–13. [Google Scholar] [CrossRef]
  112. Kienast, M.; Higginson, M.J.; Mollenhauer, G.; Eglinton, T.I.; Chen, M.-T.; Calvert, S.E. On the sedimentological origin of down-core variations of bulk sedimentary nitrogen isotope ratios. Paleoceanography 2005, 20, 1–13. [Google Scholar] [CrossRef] [Green Version]
Figure 1. (A) Map of Cuba showing the location of Cayo Coco, in north coast of the island. (B) Satellite image of Cayo Coco and the Perros Bay coastal lagoon. The Cayo Coco lagoonal network is located in the southern side of Cayo Coco and connected to Perros Bay on its western side. (C) Satellite image on the eastern side of the Cayo Coco lagoonal network. Marine influence decreases toward the east, inversely from the confinement which gradually increases eastward. The hydrological parameters (pH and conductivity) were measured on 23 and 24 July 2014. Both Satellite images are provided by Flash Earth (with Bing maps), © Microsoft Corporation—Imagery © Harris Corp, Earthstar Geographics LLC.
Minerals 10 00143 g001
Figure 2. (A) Satellite images depicting the four depositional environments used in this study: Zone I—Mangrove; Zone II—Substratum area; Zone III—Microbial flat and Zone IV—Submersed lagoon (modified after [29]) and the location of the east-west transect and associated four cores used in this study. Satellite images are provided by Flash Earth (with Bing maps), © Microsoft Corporation—Imagery © Harris Corp, Earthstar Geographics LLC. (B) Cross section of the east-west transect.
Minerals 10 00143 g002
Figure 3. (A) Horizontal surface and (B) vertical sections of a core sampled within micritic muds, with root traces. (C) SEM image from the micritic muds depicting mud-sized carbonate grains associated with bioclasts (e.g., foraminifers). (D) View of Core CC-1 just after removal in the field. This core mainly consists of micritic muds below the surface microbial mat. (E) Bioclastic sands deposited along the lagoon shore covering the hemispheroid microbial mats. (F) Zoomed-in image of the bioclastic accumulation, mostly composed of disarticulated and fragmented bivalves (A. auberiana). (G) Bioclastic accumulation embedded in a micritic matrix on which a mineralising microbial mat has developed. (H) SEM image of framboidal pyrites observed within the micritic muds. (I and J) X-Ray diffractometric spectrums of micritic muds (I) and bioclastic sands (J).
Minerals 10 00143 g003
Figure 4. (A) The mineralising microbial mat. The active microbial mat is on the surface. Below, green layers, interpreted as fossil microbial mats are preserved within the sediments and interbedded with micritic (light grey) layers. (B) Cryo-SEM image of the mineralising microbial mat. Calcium carbonate minerals have precipitated within the EPS (black arrow) matrix surrounding filamentous cyanobacteria. (C) Slime layers collected from the bottom of the lagoon. (D) Raft of slime layers removed from the bottom of the lagoon by hydrodynamics and washed away along the shore of the lagoon. (E) SEM image of the slime. The EPS network retracted as the consequence of drying out. (F) Zoom on remnants of microbial mats embedded within the micritic muds of Core CC-2. (G) SEM image of the remnants of microbial mats. (H) Zoom on the microbial biofilm observed in a void in Core CC-1. (I) Photograph of a similar biofilm formed in a cavity. (J) Flowing fragments of slime removed from the bottom of the lagoon by wind and contributing to SPM. (K) SEM image of a SPM particle onto a GF/C filter.
Minerals 10 00143 g004
Figure 5. Graphical representation of the elemental (TOC, TN and [C/N]atomic ratio) and isotopic (δ13Corg and δ15NTN) analyses made on the four sedimentary cores (please refer to Figure 2 for location and Table 2 for numerical values).
Minerals 10 00143 g005
Figure 6. Diagrams showing the evolution of the (A) δ13Corg and (B) δ15NTN with depth in the four cores (please refer to Figure 2 for the respective locations and Table 2 for numerical values). (C) [C/N]atomic ratio vs. δ13Corg, (D) [C/N]atomic ratio vs. δ15NTN and (E) δ13Corg vs. δ15NTN, values measured in the four cores (light grey circles) compared to the identified source of organic matter in the Cayo Coco lagoonal network (microbial mats: mineralising and slime, suspended particulate matter (only on (E)), soils and plants).
Minerals 10 00143 g006
Figure 7. (A) Synthetic cartoon representing the organic matter dynamics in the easternmost lagoon of the Cayo Coco lagoonal network. The organic matter preserved within the sediments (micritic muds and bioclastic sands, in grey) only corresponds to a very small fraction of the organic matter present in the system. Most of this preserved organic matter depicts an elemental and isotopic signature close to the microbial slime, which appear to be the dominant source. Locally, other potential organic matter sources (e.g., mineralising microbial mats and plant fragments) can have a greater influence. The organic matter in the form of suspended particulate matter may originate from the remobilisation of the slime originally present at the bottom of the lagoon or the supply of organic matter outside the lagoon (e.g., plant fragments, soils) during high hydrodynamic episode (e.g., storm). (B) Synthesis of the elemental (TOC, TN and [C/N]atomic ratio) and isotopic (δ13Corg and δ15NTN) signals during deposition and early diagenesis and their ability to be used to decipher the original organic matter source(s).
Minerals 10 00143 g007
Table 1. Elemental (TOC, TN and [C/N]atomic ratio) and isotopic (δ13Corg and δ15NTN) signatures of the different potential organic matter sources that were identified in the area of the lagoon. All analyses were performed on the 0–2000 µm fraction in triplicate, except for the suspended particulate matter, where the amount of material was not sufficient.
DescriptionZoneCharacteristicsCalcimetryTOC (wt. %)TN (wt. %)[TOC/TN]atomic Ratioδ13Corg (‰, vs. VPDB)δ15NTN (‰, vs. Atmospheric N2)
Microbial matsMineralising microbial matIIIgreen layer81.84%7.13 ± 0.030.94 ± 0.008.85 ± 0.02−15.72 ± 0.032.44 ± 0.15
IIIpink layer72.77%8.73 ± 0.11.15 ± 0.028.86 ± 0.05−15.29 ± 0.012.99 ± 0.1
IIIblack layer76.58%4.78 ± 0.130.7 ± 0.017.97 ± 0.07−15.78 ± 0.024.82 ± 0.06
IIIsediment81.32%2.01 ± 0.010.31 ± 0.007.56 ± 0.02−18.62 ± 0.026.38 ± 0.16
SlimeIVTop86.27%4.49 ± 0.210.65 ± 0.048.05 ± 0.12−18.47 ± 0.093.28 ± 0.25
IVMiddle84.97%4.67 ± 0.050.68 ± 0.018.01 ± 0.01−18.39 ± 0.033.5 ± 0.07
IVBottom88.02%4.3 ± 0.080.62 ± 0.018.09 ± 0.16−18.54 ± 0.063.05 ± 0.05
SoilSoil 1I-IIPlant fragments51.39%4.72 ± 0.070.54 ± 0.0110.2 ± 0.06−23.94 ± 0.028.24 ± 0.19
Soil 2I-IIPlant fragments48.56%12.43 ± 0.051.42 ± 0.0110.21 ± 0.11−21.9 ± 0.057.35 ± 0.17
Soil 3I-IIMicrob. mat fragments43.60%20.4 ± 0.162.37 ± 0.1910.04 ± 0.82−20.52 ± 0.024.41 ± 0.15
PlantsAvicennia germinansI-II (III)Thin branches-53.49 ± 0.160.77 ± 0.0081.04 ± 0.25−24.87 ± 0.011.74 ± 0.06
I-II (III)Branches-53.12 ± 0.30.73 ± 0.0984.66 ± 9.82−24.43 ± 0.42–1.13 ± 0.38
I-II (III)Leaves-54.64 ± 0.011.25 ± 0.0051 ± 0.01−25.8 ± 0.022.1 ± 0.04
I-II (III)Buds-48.3 ± 0.051.61 ± 0.0135 ± 0.25−25.38 ± 0.050.88 ± 0.06
Sarcocornia perennisI-II (III)Brown branches-47.01 ± 1.010.57 ± 0.0396.21 ± 2.71−28.08 ± 0.014.33 ± 0.22
I-II (III)Green branches-50.26 ± 0.41.78 ± 0.132.94 ± 1.57−27.72 ± 0.067.77 ± 0.25
Batis maritimaI-II (III)Roots-50.76 ± 1.681.16 ± 0.1451.2 ± 5.12−26.44 ± 0.326.6 ± 0.24
I-II (III)Branches-50.79 ± 0.080.61 ± 0.0197.94 ± 0.98−25.71 ± 0.035.7 ± 0.13
I-II (III)Buds-21.41 ± 0.41.3 ± 0.1719.15 ± 2.11−23.85 ± 0.56.52 ± 0.27
SPM*SPM 1IV-----−20.543.54
SPM 2IV-----−20.642.72
SPM 3IV-----−19.961.98
SPM 4IV-----−19.653.58
(-) no data, (SPM*) Suspended Particulate Matter.
Table 2. Elemental (TOC, TN and [C/N]atomic ratio) and isotopic (δ13Corg and δ15NTN) measurements of the four sedimentary cores. (Please refer to Figure 2 for location and Figure 4 for diagram representation).
CoreZoneInterval (cm)FaciesCalcimetryFractionTOC (wt. %)TN (wt. %)[TOC/TN]atomic Ratioδ13Corg (‰, vs. VPDB)δ15NTN (‰, vs. Atmospheric N2)
CC-1III0–0.2Mineralising microbial mat75.79%<2000 µm8.85 ± 0.381.06 ± 0.049.74 ± 0.13−15.83 ± 0.081.82 ± 0.07
0..2–0.4Mineralising microbial mat74.34%<2000 µm8.82 ± 0.11.2 ± 0.018.60 ± 0.03−14.76 ± 0.072.66 ± 0.06
0.4–0.6Mineralising microbial mat71.78%<2000 µm7.5 ± 0.241 ± 0.038.71 ± 0.03−14.61 ± 0.033.75 ± 0.04
0.6–0.9Mineralising microbial mat82.91%<2000 µm4.53 ± 0.110.63 ± 0.018.41 ± 0.07−14.43 ± 0.064.13 ± 0.05
0.9–1.1Mineralising microbial mat85.54%<2000 µm4.1 ± 0.060.64 ± 0.017.47 ± 0.02−14.89 ± 0.065.14 ± 0.13
1.1–3.1Micritic mud92.34%0–200 µm1.21 ± 0.010.18 ± 0.007.94 ± 0.23−16.75 ± 0.056.04 ± 0.12
88.38%200–2000 µm2.9 ± 0.030.45 ± 0.017.53 ± 0.05−15.43 ± 0.075.83 ± 0.04
3.1–5.0Micritic mud91.67%0–200 µm0.7 ± 0.010.09 ± 0.008.73 ± 0.10−17.72 ± 0.016.52 ± 0.06
88.44%200–2000 µm1.87 ± 0.020.25 ± 0.008.63 ± 0.08−18.57 ± 0.086.86 ± 0.09
5.0–7.0Micritic mud90.77%0–200 µm0.54 ± 0.010.07 ± 0.008.85 ± 0.12−17.99 ± 0.067.45 ± 0.08
93.81%200–2000 µm0.79 ± 0.020.11 ± 0.008.24 ± 0.08−18.88 ± 0.148.04 ± 0.06
7.0–8.8Micritic mud87.56%0–200 µm0.61 ± 0.010.08 ± 0.008.80 ± 0.21−18.02 ± 0.077.41 ± 0.02
93.45%200–2000 µm0.56 ± 0.030.07 ± 0.008.71 ± 0.34−18.13 ± 0.447.06 ± 0.10
8.8–10.5Micritic mud89.46%0–200 µm0.46 ± 0.000.06 ± 0.009.14 ± 0.06−18.09 ± 0.107.91 ± 0.04
96.35%200–2000 µm0.33 ± 0.000.04 ± 0.008.72 ± 0.10−19.30 ± 0.078.05 ± 0.08
10.5–12.0Micritic mud89.09%0–200 µm0.42 ± 0.000.06 ± 0.008.89 ± 0.12−18.19 ± 0.047.83 ± 0.13
97.18%200–2000 µm0.39 ± 0.000.05 ± 0.008.80 ± 0.18−20.63 ± 0.208.71 ± 0.06
12.0–14.0Micritic mud85.69%0–200 µm0.62 ± 0.020.08 ± 0.008.98 ± 0.09−18.38 ± 0.106.24 ± 0.11
87.49%200–2000 µm0.83 ± 0.010.11 ± 0.008.95 ± 0.10−19.23 ± 0.086.02 ± 0.16
Cryptic microbial mat87.30%<2000 µm0.89 ± 0.090.13 ± 0.017.92 ± 0.21−19.64 ± 0.228.17 ± 0.72
14.0–15.4Micritic mud85.63%0–200 µm0.71 ± 0.020.09 ± 0.008.90 ± 0.11−18.59 ± 0.036.20 ± 0.06
83.85%200–2000 µm1.31 ± 0.020.16 ± 0.009.50 ± 0.30−19.85 ± 0.156.06 ± 0.08
CC-2IV0–0.8Microbial slime94.17%0–200 µm1.54 ± 0.000.21 ± 0.008.56 ± 0.35−19.49 ± 0.012.48 ± 0.17
96.06%200–2000 µm0.91 ± 0.620.12 ± 0.088.93 ± 0.35−19.48 ± 0.152.22 ± 0.51
0.8–2.4Bioclastic sand96.00%0–200 µm0.79 ± 0.000.1 ± 0.009.07 ± 0.09−17.58 ± 0.024.31 ± 0.14
97.53%200–2000 µm0.69 ± 0.010.09 ± 0.008.51 ± 0.26−17.69 ± 0.343.54 ± 0.05
2.4–3.5Micritic mud90.30%0–200 µm1.19 ± 0.010.15 ± 0.009.38 ± 0.09−17.95 ± 0.054.95 ± 0.16
89.21%200–2000 µm1.77 ± 0.030.22 ± 0.009.39 ± 0.14−17.92 ± 0.024.39 ± 0.04
3.5–5.0Micritic mud84.52%0–200 µm1.76 ± 0.060.22 ± 0.019.47 ± 0.20−18.23 ± 0.085.25 ± 0.16
83.57%200–2000 µm2.4 ± 0.050.29 ± 0.009.59 ± 0.10−18.29 ± 0.125.14 ± 0.15
5.0–5.8Micritic mud88.22%0–200 µm1.45 ± 0.020.18 ± 0.009.50 ± 0.15−18.32 ± 0.075.39 ± 0.14
83.38%200–2000 µm2.45 ± 0.070.3 ± 0.019.48 ± 0.20−18.74 ± 0.035.16 ± 0.04
CC-2IV5.8–6.4Micritic mud89.34%0–200 µm1.32 ± 0.040.16 ± 0.019.55 ± 0.03−18.52 ± 0.065.60 ± 0.28
88.89%200–2000 µm1.76 ± 0.030.21 ± 0.019.65 ± 0.40−19.23 ± 0.025.38 ± 0.17
Mineralising microbial mat-<2000 µm---−16.69 ± 0.035.63 ± 0.75
6.4–6.8Micritic mud91.53%0–200 µm1.02 ± 0.010.13 ± 0.009.44 ± 0.04−17.98 ± 0.025.15 ± 0.27
91.25%200–2000 µm1.58 ± 0.020.19 ± 0.009.60 ± 0.07−18.29 ± 0.105.12 ± 0.23
6.8–7.1Micritic mud89.50%0–200 µm1.19 ± 0.020.14 ± 0.009.70 ± 0.06−17.54 ± 0.034.56 ± 0.37
91.80%200–2000 µm1.36 ± 0.000.17 ± 0.009.56 ± 0.24−18.18 ± 0.004.62 ± 0.65
Mineralising microbial mat92.72%0–200 µm0.87 ± 0.010.11 ± 0.009.37 ± 0.33−16.44 ± 0.015.15 ± 0.34
90.48%200–2000 µm2.21 ± 0.010.3 ± 0.018.58 ± 0.25−15.53 ± 0.014.17 ± 0.60
7.1–7.9Micritic mud87.61%0–200 µm1.26 ± 0.020.15 ± 0.009.60 ± 0.22−17.80 ± 0.435.26 ± 0.35
85.09%200–2000 µm2.16 ± 0.020.25 ± 0.0010.25 ± 0.13−18.73 ± 0.145.36 ± 0.07
(dark)87.65%<2000 µm1.63 ± 0.020.19 ± 0.009.75 ± 0.23−16.03 ± 0.046.14 ± 0.42
7.9–9.1Micritic mud86.89%0–200 µm1.12 ± 0.000.05 ± 0.079.60 ± 0.15−17.86 ± 0.025.48 ± 0.22
86.89%200–2000 µm1.97 ± 0.050.22 ± 0.0010.25 ± 0.13−19.09 ± 0.054.90 ± 0.31
9.1–10.2Micritic mud75.98%0–200 µm3.49 ± 0.020.4 ± 0.0110.21 ± 0.22−16.82 ± 0.045.70 ± 0.39
68.28%200–2000 µm5.33 ± 0.040.6 ± 0.0410.45 ± 0.63−16.98 ± 0.016.19 ± 1.15
84.22%0–200 µm1.15 ± 0.040.14 ± 0.009.56 ± 0.27−18.00 ± 0.056.30 ± 0.21
80.71%200–2000 µm2.51 ± 0.020.26 ± 0.0011.30 ± 0.19−20.23 ± 0.075.64 ± 0.16
10.2–10.5Micritic mud71.54%0–200 µm4.44 ± 0.060.48 ± 0.0010.80 ± 0.08−16.64 ± 0.016.46 ± 0.19
85.90%200–2000 µm3.75 ± 0.000.58 ± 0.007.58 ± 0.03−16.66 ± 0.013.75 ± 0.28
(dark)82.41%0–200 µm1.46 ± 0.010.18 ± 0.009.48 ± 0.20−18.05 ± 0.066.07 ± 0.16
(dark)76.90%200–2000 µm2.54 ± 0.080.28 ± 0.0010.65 ± 0.26−18.57 ± 0.056.44 ± 0.16
(mid dark)81.15%<2000 µm2.82 ± 0.020.3 ± 0.0011.10 ± 0.16−18.11 ± 0.175.86 ± 0.04
10.5–12.3Micritic mud75.82%<2000 µm3.9 ± 0.020.44 ± 0.0110.22 ± 0.10−16.75 ± 0.045.34 ± 0.21
81.08%<2000 µm2.4 ± 0.010.29 ± 0.009.67 ± 0.03−17.63 ± 0.044.64 ± 0.16
(dark)85.25%<2000 µm2.12 ± 0.010.23 ± 0.0010.75 ± 0.05−17.60 ± 0.035.64 ± 0.37
12.3–14.5Micritic mud75.57%0–200 µm3.87 ± 0.010.44 ± 0.0010.16 ± 0.03−16.78 ± 0.025.02 ± 0.10
67.22%200–2000 µm5.38 ± 0.040.56 ± 0.0111.26 ± 0.20−16.85 ± 0.165.83 ± 0.06
(dark)77.92%<2000 µm1.91 ± 0.030.2 ± 0.0111.18 ± 0.94−17.94 ± 0.216.07 ± 0.52
CC-3IV0–2.1Slime48.89%0–200 µm16.06 ± 0.022.34 ± 0.018.00 ± 0.03−18.44 ± 0.013.69 ± 0.03
63.23%200–2000 µm11.59 ± 0.41.71 ± 0.057.89 ± 0.07−18.47 ± 0.013.59 ± 0.02
2.1–2.9Micritic mud95.96%0–200 µm1.03 ± 0.010.14 ± 0.008.56 ± 0.05−18.03 ± 0.023.91 ± 0.05
96.39%200–2000 µm1.09 ± 0.020.16 ± 0.007.79 ± 0.17−18.28 ± 0.063.75 ± 0.04
2.9–4.4Micritic mud89.87%0–200 µm2.47 ± 0.060.33 ± 0.018.80 ± 0.13−17.62 ± 0.013.87 ± 0.04
80.16%200–2000 µm5.41 ± 0.070.73 ± 0.018.65 ± 0.02−17.56 ± 0.023.56 ± 0.09
CC-3IV4.4–5.6Micritic mud89.91%0–200 µm2.4 ± 0.000.31 ± 0.009.03 ± 0.00−17.61 ± 0.034.02 ± 0.05
82.71%200–2000 µm4.93 ± 0.030.63 ± 0.018.69 ± 0.02−17.49 ± 0.043.67 ± 0.05
5.6–6.9Micritic mud91.28%0–200 µm1.78 ± 0.020.22 ± 0.009.46 ± 0.13−17.47 ± 0.024.20 ± 0.16
82.46%200–2000 µm4.16 ± 0.030.53 ± 0.009.10 ± 0.09−17.37 ± 0.033.98 ± 0.07
6.9–8.1Micritic mud90.15%0–200 µm1.76 ± 0.010.2 ± 0.0010.25 ± 0.03−17.60 ± 0.104.52 ± 0.16
83.24%200–2000 µm3.15 ± 0.010.36 ± 0.0010.12 ± 0.13−17.56 ± 0.024.68 ± 0.29
8.1–9.5Micritic mud88.25%0–200 µm2.1 ± 0.010.24 ± 0.0010.34 ± 0.28−17.84 ± 0.014.41 ± 0.14
80.20%200–2000 µm3.72 ± 0.080.41 ± 0.0110.68 ± 0.06−18.07 ± 0.034.44 ± 0.18
9.5–11.7Bioclastic sand88.82%0–200 µm1.81 ± 0.020.19 ± 0.0110.72 ± 0.25−17.43 ± 0.064.12 ± 0.35
90.47%200–2000 µm1.77 ± 0.010.19 ± 0.0010.71 ± 0.29−17.74 ± 0.044.37 ± 0.16
11.7–12.8Micritic mud82.52%0–200 µm2.59 ± 0.070.27 ± 0.0111.33 ± 0.07−16.59 ± 0.065.47 ± 0.06
76.85%200–2000 µm3.64 ± 0.050.38 ± 0.0111.28 ± 0.03−16.66 ± 0.125.69 ± 0.09
12.8–14.0Micritic mud85.86%0–200 µm2.25 ± 0.020.24 ± 0.0111.11 ± 0.22−16.96 ± 0.035.54 ± 0.20
78.00%200–2000 µm3.52 ± 0.060.36 ± 0.0111.51 ± 0.07−16.90 ± 0.085.67 ± 0.04
14.0–14.7Bioclastic sand88.96%0–200 µm1.8 ± 0.030.19 ± 0.0011.03 ± 0.15−17.06 ± 0.025.54 ± 0.14
98.56%200–2000 µm0.37 ± 0.010.04 ± 0.0012.49 ± 1.99−18.09 ± 0.496.38 ± 0.31
CC-4IV0–0.9Slime89.89%0–2000 µm0.45 ± 0.000.07 ± 0.007.95 ± 0.07−17.65 ± 0.032.90 ± 0.09
0.9–2.887.07%0–200 µm0.74 ± 0.000.1 ± 0.008.20 ± 0.06−17.58 ± 0.063.61 ± 0.06
98.64%200–2000 µm0.37 ± 0.000.06 ± 0.007.75 ± 0.28−17.59 ± 0.013.60 ± 0.13
2.8–4.5Micritic mud88.86%0–200 µm1.22 ± 0.010.14 ± 0.009.93 ± 0.12−17.28 ± 0.024.81 ± 0.07
92.76%200–2000 µm1.38 ± 0.010.16 ± 0.0010.21 ± 0.15−18.22 ± 0.044.64 ± 0.25
4.5–5.7Micritic mud88.11%0–200 µm1.28 ± 0.010.15 ± 0.009.89 ± 0.09−17.35 ± 0.034.52 ± 0.20
91.91%200–2000 µm1.77 ± 0.020.18 ± 0.0011.23 ± 0.05−18.71 ± 0.044.82 ± 0.44
5.7–7.1Micritic mud86.71%0–200 µm1.84 ± 0.010.2 ± 0.0010.51 ± 0.13−17.04 ± 0.044.97 ± 0.11
91.40%200–2000 µm1.6 ± 0.010.17 ± 0.0011.14 ± 0.26−18.05 ± 0.054.68 ± 0.19
7.1–8.5Micritic mud88.17%0–200 µm1.66 ± 0.040.18 ± 0.0110.55 ± 0.14−17.19 ± 0.055.21 ± 0.21
94.77%200–2000 µm1.15 ± 0.020.1 ± 0.0013.25 ± 0.40−19.72 ± 0.115.15 ± 0.12
8.5–13.5Bioclastic sand90.58%0–200 µm1.13 ± 0.030.12 ± 0.0010.78 ± 0.19−17.03 ± 0.086.10 ± 0.13
98.46%200–2000 µm0.21 ± 0.000.03 ± 0.009.87 ± 0.05−16.93 ± 0.066.16 ± 0.11
(-) no data.

