Article

Carbonate Precipitation in Mixed Cyanobacterial Biofilms Forming Freshwater Microbial Tufa

by
Dahédrey Payandi-Rolland
1,2,
Adeline Roche
1,
Emmanuelle Vennin
1,
Pieter T. Visscher
1,3,
Philippe Amiotte-Suchet
1,
Camille Thomas
4 and
Irina A. Bundeleva
1,*
1
Biogéosciences, UMR 6282 CNRS, Université de Bourgogne Franche-Comté (UBFC), 6 Boulevard Gabriel, 21000 Dijon, France
2
Géoscience and Environment Toulouse, UMR 5563 CNRS, Université Paul Sabatier Toulouse III, 14 Avenue Edouard Belin, 31400 Toulouse, France
3
Departments of Marine Sciences and Geoscience, University of Connecticut, Storrs, CT 06340, USA
4
Department of Earth Sciences, University of Geneva, 1205 Geneva, Switzerland
*
Author to whom correspondence should be addressed.
Minerals 2019, 9(7), 409; https://doi.org/10.3390/min9070409
Submission received: 27 May 2019 / Revised: 21 June 2019 / Accepted: 2 July 2019 / Published: 3 July 2019
(This article belongs to the Special Issue Microbialites: Preservation of Extant and Extinct Systems)

Abstract

:
Mixed cyanobacteria-dominated biofilms, enriched from a tributary of the Mérantaise (France) were used to conduct laboratory experiments in order to understand the relationship between the morphology of carbonate precipitates and the biological activity (e.g., cyanobacterial exopolymeric substances (EPS) production, photosynthetic pH increases). DNA sequencing data showed that the enriched biofilm was composed predominantly of two types of filamentous cyanobacteria that belonged to the Oscillatoriaceae and Phormidiaceae families, respectively. Microscopic analysis also indicated the presence of some coccoid cyanobacteria resembling Gloeocapsa. Analysis of carbonate precipitates in experimental biofilms showed three main morphologies: micro-peloids with different shapes of mesocrystals associated with Oscillatoriaceae filaments and theirs EPS, lamellae of carbonate formed directly on Phormidiaceae filaments, and rhombic sparite crystals wrapped in EPS. All crystals were identified by FT-IR spectroscopy as calcite. Similar structures as those that formed in laboratory conditions were observed in the microbial-tufa deposits collected in the stream. Microscopic and spectroscopic analysis of laboratory and natural samples indicated a close proximity of the cyanobacterial EPS and precipitated carbonates in both. Based on the laboratory experiments, we conclude that the microbial tufa in the stream is in an early stage of formation.

1. Introduction

Extant organosedimentary deposits, referred to as microbialites, have formed since the Archean [1]. These benthic phototrophic microbial communities trap and bind detrital sediments and/or provide an appropriate locus for mineral precipitation [2]. Extant microbialites, resulting from the lithification of microbial mats, are presently forming in many locations around the Earth [3,4,5]. Benthic microbial mats [6] are characterized by a vast species diversity [7,8], yet their biogeochemical functioning can be described by a limited number of guilds [9,10]. The combined community metabolism can inhibit or promote carbonate precipitation [11]. In this process, the mineral alteration potential of various microorganisms has been acknowledged [12,13,14]. Notably, photosynthesis and some types of sulfate reduction were identified to promote carbonate precipitation [14,15,16]. In contrast, fermentation and sulfide oxidation could potentially promote dissolution of carbonates [14]. Consequently, the organomineralization of microbial mats (i.e., precipitation and preservation of carbonates) results from the balance of metabolic activities including their spatial and temporal variations in the mat, especially as these occur during a diel cycle [13]. The combined microbial metabolisms may be key in promoting conditions that precipitate carbonates, some external physicochemical factors can change the local alkalinity as well (e.g., degassing of CO2, input of calcium or carbonate rich water [17,18]). In addition to this so-called alkalinity engine with both biotic and abiotic contributions, the role of the organic matrix was identified as the other main component of the organomineralization process [17,19]. This organic matrix can be produced by various microbes and consists mainly of exopolymeric substances (EPS) [20] that may act as a possible nucleation site for carbonate minerals [21]. The functional groups of EPS (e.g., carboxyl, sulfate, phosphoryl, amide and hydroxyl; [16]) can reduce the availability of cations, such as calcium, by binding these [19]. Consequently, this leads to a decrease in the {Ca2+} and the degree of supersaturation with respect to calcium carbonate (see (Equation (1)) below).
There are two main approaches for investigating carbonate precipitation. The first one is through studying naturally-occurring modern or ancient organomineral (e.g. [1,22,23,24,25,26,27,28,29,30]). The main difficulty of this approach is the interpretation of multiple, steep chemical and physical gradients and complex, interconnected microbial processes that vary over both space and time. The second approach, “experimental modeling”, consists of laboratory studies with pure cultures or more complex mixed microbial communities. Such studies can be conducted under controlled chemical, physical and biological conditions (e.g., [31,32,33,34,35,36]). Although deviating from natural conditions, where multiple microbial species and their metabolic products act in concert, experimental modeling can elucidate the potential role of individual metabolic processes on mineral formation. Furthermore, controlled experimental design permits for the screening of a wide range of environmental conditions, including those now absent in natural ecosystems but that possibly existed in the geologic past.
Combining natural observations and experimental approaches is critical for a better understanding of microbial carbonate precipitation. In the current laboratory investigation, we describe carbonate precipitation in biofilms with cyanobacteria obtained from a freshwater stream and compare this with microbial carbonates sampled from the same stream.

2. Material and Methods

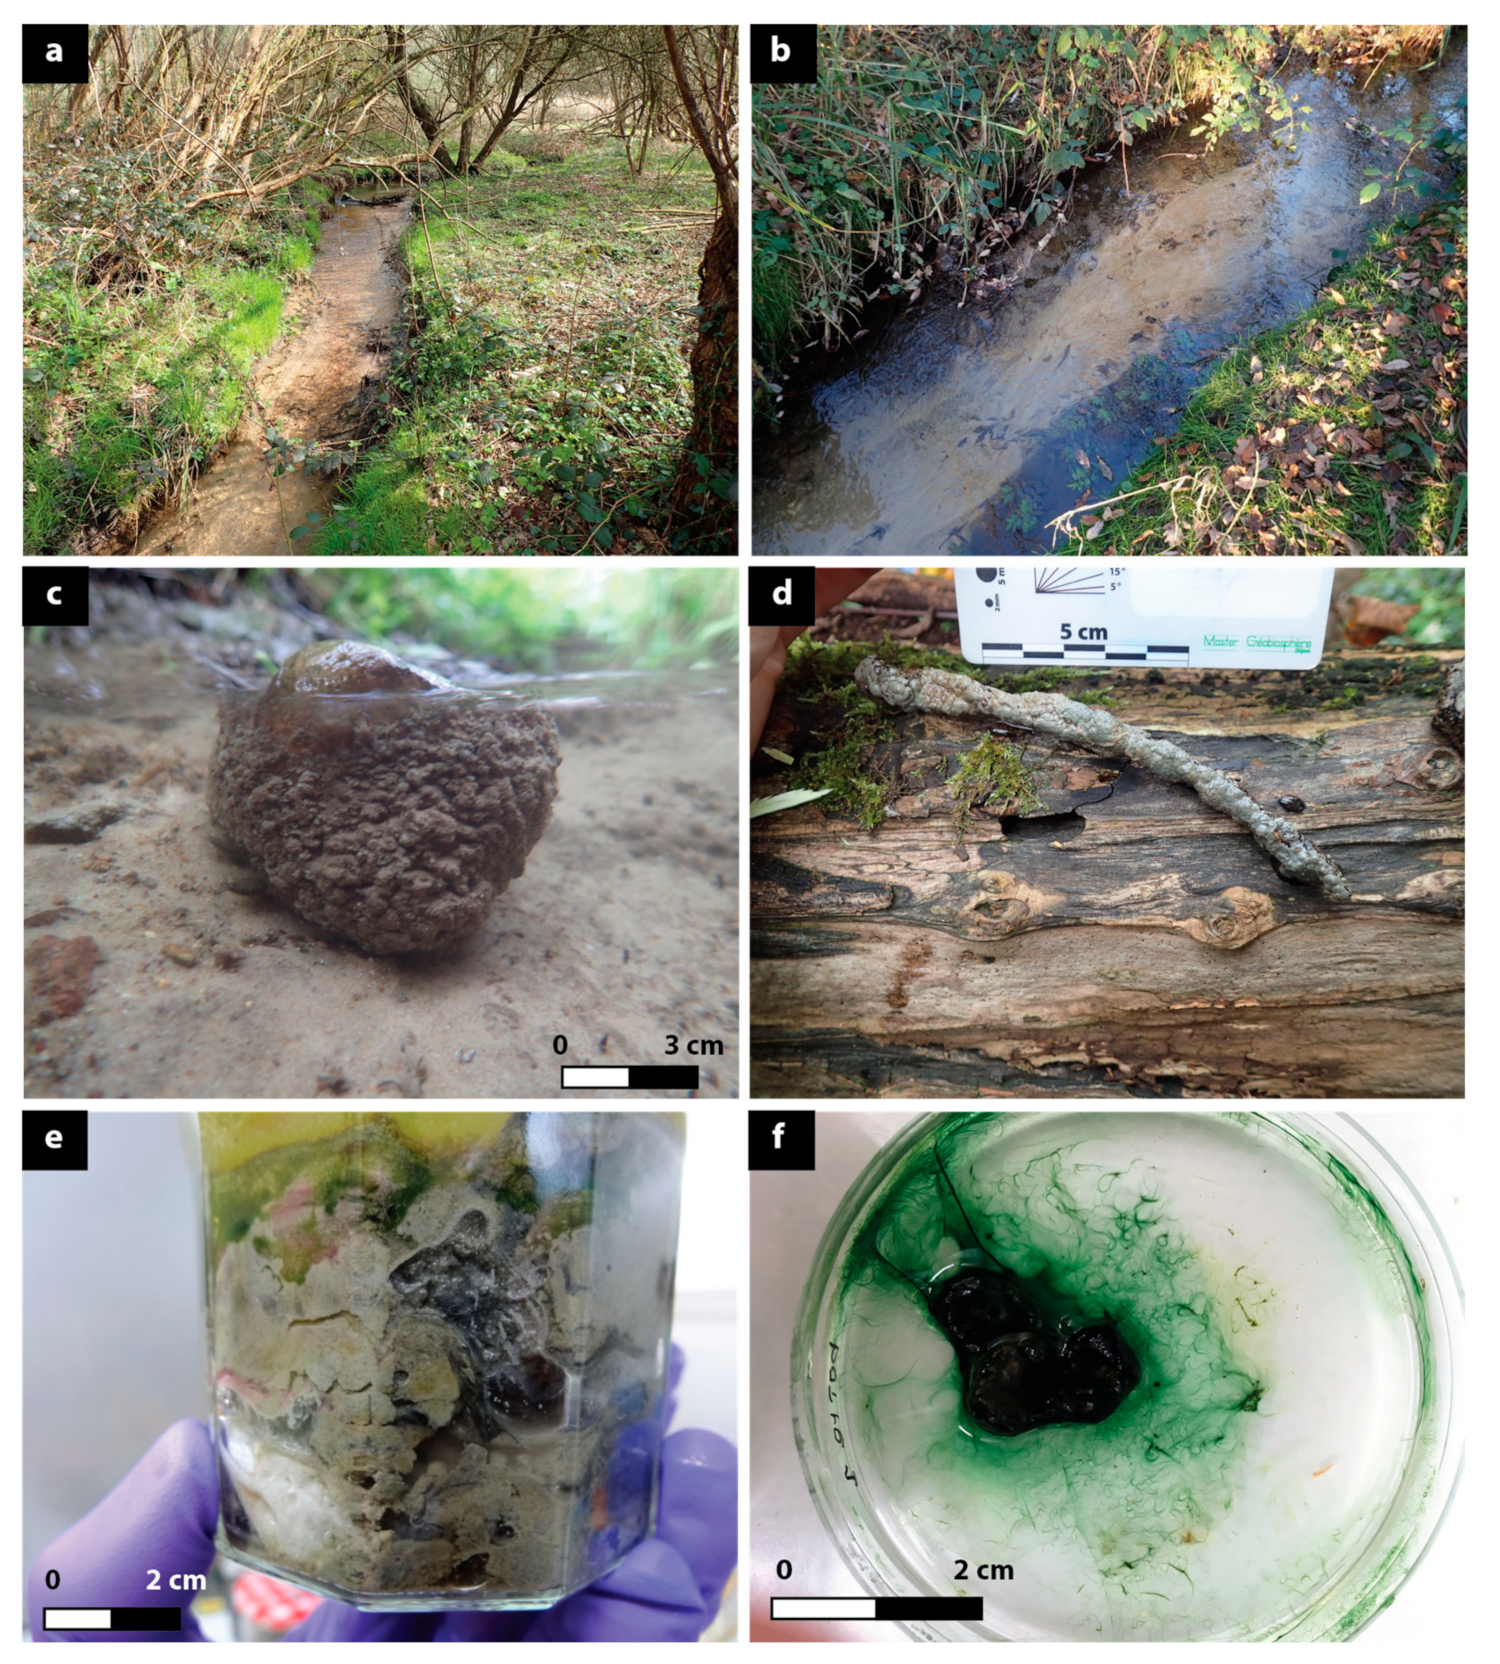
2.1. Site Description and Field Sampling

The stream investigated here is a tributary of the Mérantaise river (Figure 1a,b) (2°07’16.48”E, 48°43’06.03”N), located 20 km to the Southwest of Paris (Figure 2).
This 1.1-km long stream runs from North to South, through the Oligocene Saclay Plateau and supports development of modern microbial tufa deposits (Figure 1c,d). The microbial tufas in this stream, first erroneously identified as algal concretions [37], are described in detail by [38].
Field campaigns were carried out in October, November, and December of 2016 and in March of 2017. Physicochemical characteristics along the stream were monitored and physical substrates characterized [38].
Mineralized structures in the streambed sampled included various microbial biofilms and microbial mats. Biological samples were collected in December 2016 in order to perform microbial culture experiments in the laboratory. The physicochemical characteristics during sampling (over the four field excursions) are given in Table 1.

2.2. Enrichment using Cyanobacterial Biofilms

Sediment samples were collected from the end of the stream. This part (Zone 3 in [38]) has a high mineralization potential and microbial tufa form when a suitably hard substrate is available. The sediments were used as inoculum for Winogradsky-type ([39]) columns in order to enrich for cyanobacterial biofilms. Winogradsky columns have been used for diversity and enrichment studies, including that of cyanobacteria ([40]). The enrichments were used for carbonate precipitation experiments in laboratory. Microbial mat samples (0.5 to 2.5 cm thick) and underlying sediments (3 to 6 cm in thickness) were taken from the river bottom using a spatula and transferred into sterile glass jars containing cellulose (shredded paper) to provide an organic carbon source for heterotrophic organisms (Figure 1e). Stream water (50 mL) was added to the mixture of the microbial mat sample and paper and the contents were then homogenized. The columns were incubated for two months at 25 °C, in 12 h light at 2000 lux (or 12,680 W/m2)/12 h dark cycles and gas exchange with the atmosphere was allowed. Blue-green biofilms mostly composed of filamentous cyanobacteria based on microscopic observations that developed in the Winogradsky column were used for further enrichment. It should be noted that these cyanobacterial biofilms were complex communities dominated by cyanobacteria, but not axenic and also included some heterotrophs (See Results and Discussion below).
Subsequently, cyanobacterial biofilms for precipitation experiments were obtained in a two-step procedure:
(1)
Culturing in liquid medium: the thin blue-green biofilms (1–3 mm thick) from the superficial green part of the Winogradsky column were transferred using sterile techniques into Petri dishes containing 20 mL of liquid culture medium BG-11, commonly used for cyanobacterial cultivation [41]. The pH was adjusted to 8 using sterile 0.1 N HCl to mimic the natural pH of the stream. The closed Petri dishes were incubated at 25°C for three weeks in 12 h light/12 h dark cycles (under ~2000 lux). This step produced the necessary biomass for a second stage of biofilm preparation;
(2)
Culturing in semi-liquid (soft-agar) medium: small (1 cm2) fragments of the biofilm grown in liquid (see 1) were transferred into a Petri dishes with sterile soft agar (0.75% w/v) containing half-strength BG-11 medium (i.e., 1:1 BG-11 medium and water) with a pH of circa 8. The soft agar was used to provide a substrate for biofilm growth [38]. In total, 18 Petri dishes were prepared: 12 with biofilms for biotic experiments and 6 with soft-agar BG-11 medium only as abiotic experimental controls. Petri dishes were kept for two weeks at 25 °C, in 2000 lux under 12 h light/12 h dark cycles (Figure 1f). The soft agar was used as a surrogate for gelatinous bacterial biofilms found in situ in the order to mimic the mineral precipitation processes.

2.3. Characterization of Cyanobacterial Communities

2.3.1. Light Microscopy and Scanning Electron Microscopy (SEM)

Light and electron microscopy were used to establish the morphology and size of the cyanobacteria. Light microscopy was performed with a Nikon® Eclipse E400 microscope (Microscopy, Melville, NY, USA) equipped with transmitted light. For scanning electron microscopy (SEM), samples were dehydrated through a series of ethanol–water solutions. The samples were then critical-point dried on a Leica® EM CPD300 apparatus (Leica Microsystems, Wetzlar, Germany) before carbon sputtering. The samples were examined with Hitachi® SU8230 (Hitachi, Tokyo, Japan) and JEOL® (JSM-IT100, JEOL, Tokyo, Japan) scanning electron microscopes.

2.3.2. Isolation of Genomic DNA

A sample of the biofilm cultured in liquid medium was taken at the end of the first stage using a sterile scalpel. Nucleic acids were then extracted using the RNA PowerSoil Total RNA Kit and DNA PowerSoil DNA Elution Kit (Qiagen, Valencia, SC, USA). Amplification and sequencing were realized by Fasteris DNA sequencing service (Fasteris, Geneva, Switzerland). The DNA extracts were amplified using the universal primer 515F (5′-GTGYCAGCMGCCGCGGTA-3′) and 909R (5′-CCCCGYCAATTCMTTTRAGT-3′) for the V4-V5 hypervariable region of the 16S rRNA gene [42] using the following cycle: 1 min initial denaturation at 94 °C, 30 cycles of denaturation (1 min at 94 °C), annealing (30 s at 52 °C) and extension (30 s at 72 °C), and final extension for 3 min at 72 °C.
Sequencing was carried out on an Illumina Miseq V3 over 2 × 300 cycles (Illumina, San Diego, CA, USA). The analysis yielded 12.4 Gb of sequence fragments (415 bp) with error rate within quality specifications. Adapters were removed using the trimmomatic protocol [43], assembly of contigs was carried out using ea-utils [44] and demultiplexed using an in-house script by Fasteris (Geneva, Switzerland). The sequences that were obtained were aligned with Mothur v1.41.1 software [45]. Chimeras were checked with Uchime [46], and remaining sequences were classified against the SILVA SSU database release 123 [47]. Cyanobacterial sequences are available in the National Center for Biotechnology Information database under the accession numbers MK968453—MK968520.

2.4. Laboratory Experiments

At the end of the second enrichment stage (see Section 2.2), the soft-agar gels (both blanks and with biofilms) were transferred to 250-mL sterile jars for the precipitation experiment. This experiment was performed at 25 ± 1 °C under 2000 lux-12 h light/12 h dark cycles, without agitation and allowing for gas exchange with the atmosphere. In total, six different conditions (treatments), differed by initial calcium and bicarbonate concentrations were tested in this experiment. Initial concentrations of calcium and alkalinity ranged from 0 to 150 mg/L and 0.93 to 4.62 meq/L, respectively (Table 2).
The solutions of the treatments were composed of (i) 150 mL of five times diluted BG-11 (to approximate the nutrient conditions in the stream), and (ii) 50 mL of the various concentrations of calcium (CaCl2) and bicarbonate (NaHCO3) as outlined in Table 2. Each of these six treatments comprised two biological duplicate incubations with soft-agar biofilms and one incubation that was an abiotic control consisting of a blank agar gel. The experiment was carried out for 40 days.

2.5. Sampling and Analysis

2.5.1. Microscopic Observations and Spectroscopic Analysis of Biofilm

A small part (≈25 mm2) of biofilm was removed from the experiments after 19 and 40 days (i.e., halfway and at the end of the experiment, respectively) to visually inspect for carbonate precipitation. Following extraction, the biofilm aliquots were dehydrated successively in a water-ethanol series (30%, 50%, 70%, 90%, 99% of ethanol). The biofilm samples were immersed for three minutes in each solution prior to critical point drying (Leica® EM CPD300) in order to preserve the microstructures, specifically the spatial organization of bacteria and precipitated minerals in the biofilms. After critical point drying, the samples were sputter-coated with carbon. Although samples were processed rapidly, we cannot rule out that minor changes in mineral and EPS composition occurred during processing.
SEM was used to localize the carbonate precipitate and determine the crystal form and size. Fourier Transform InfraRed spectroscopy (FT-IR) was carried out to characterize the chemical composition of the minerals. SEM examination was performed in the ICB-DTAI Laboratory (UBFC, Dijon, France) using a Hitachi® SU8230 microscope and in the Biogéosciences Laboratory (Dijon, France) using JEOL® (JSM-IT100) microscope equipped with an Energy Dispersive X-ray Spectrometer (EDS) operating at 10 kV. FT-IR spectroscopy was performed at Pôle Chimie Moléculaire (UBFC, Dijon, France) using a LUMOS Brucker spectroscope (Brucker, Billerica, MA, USA) with a spectrum range between 7000 and 650 cm−1.

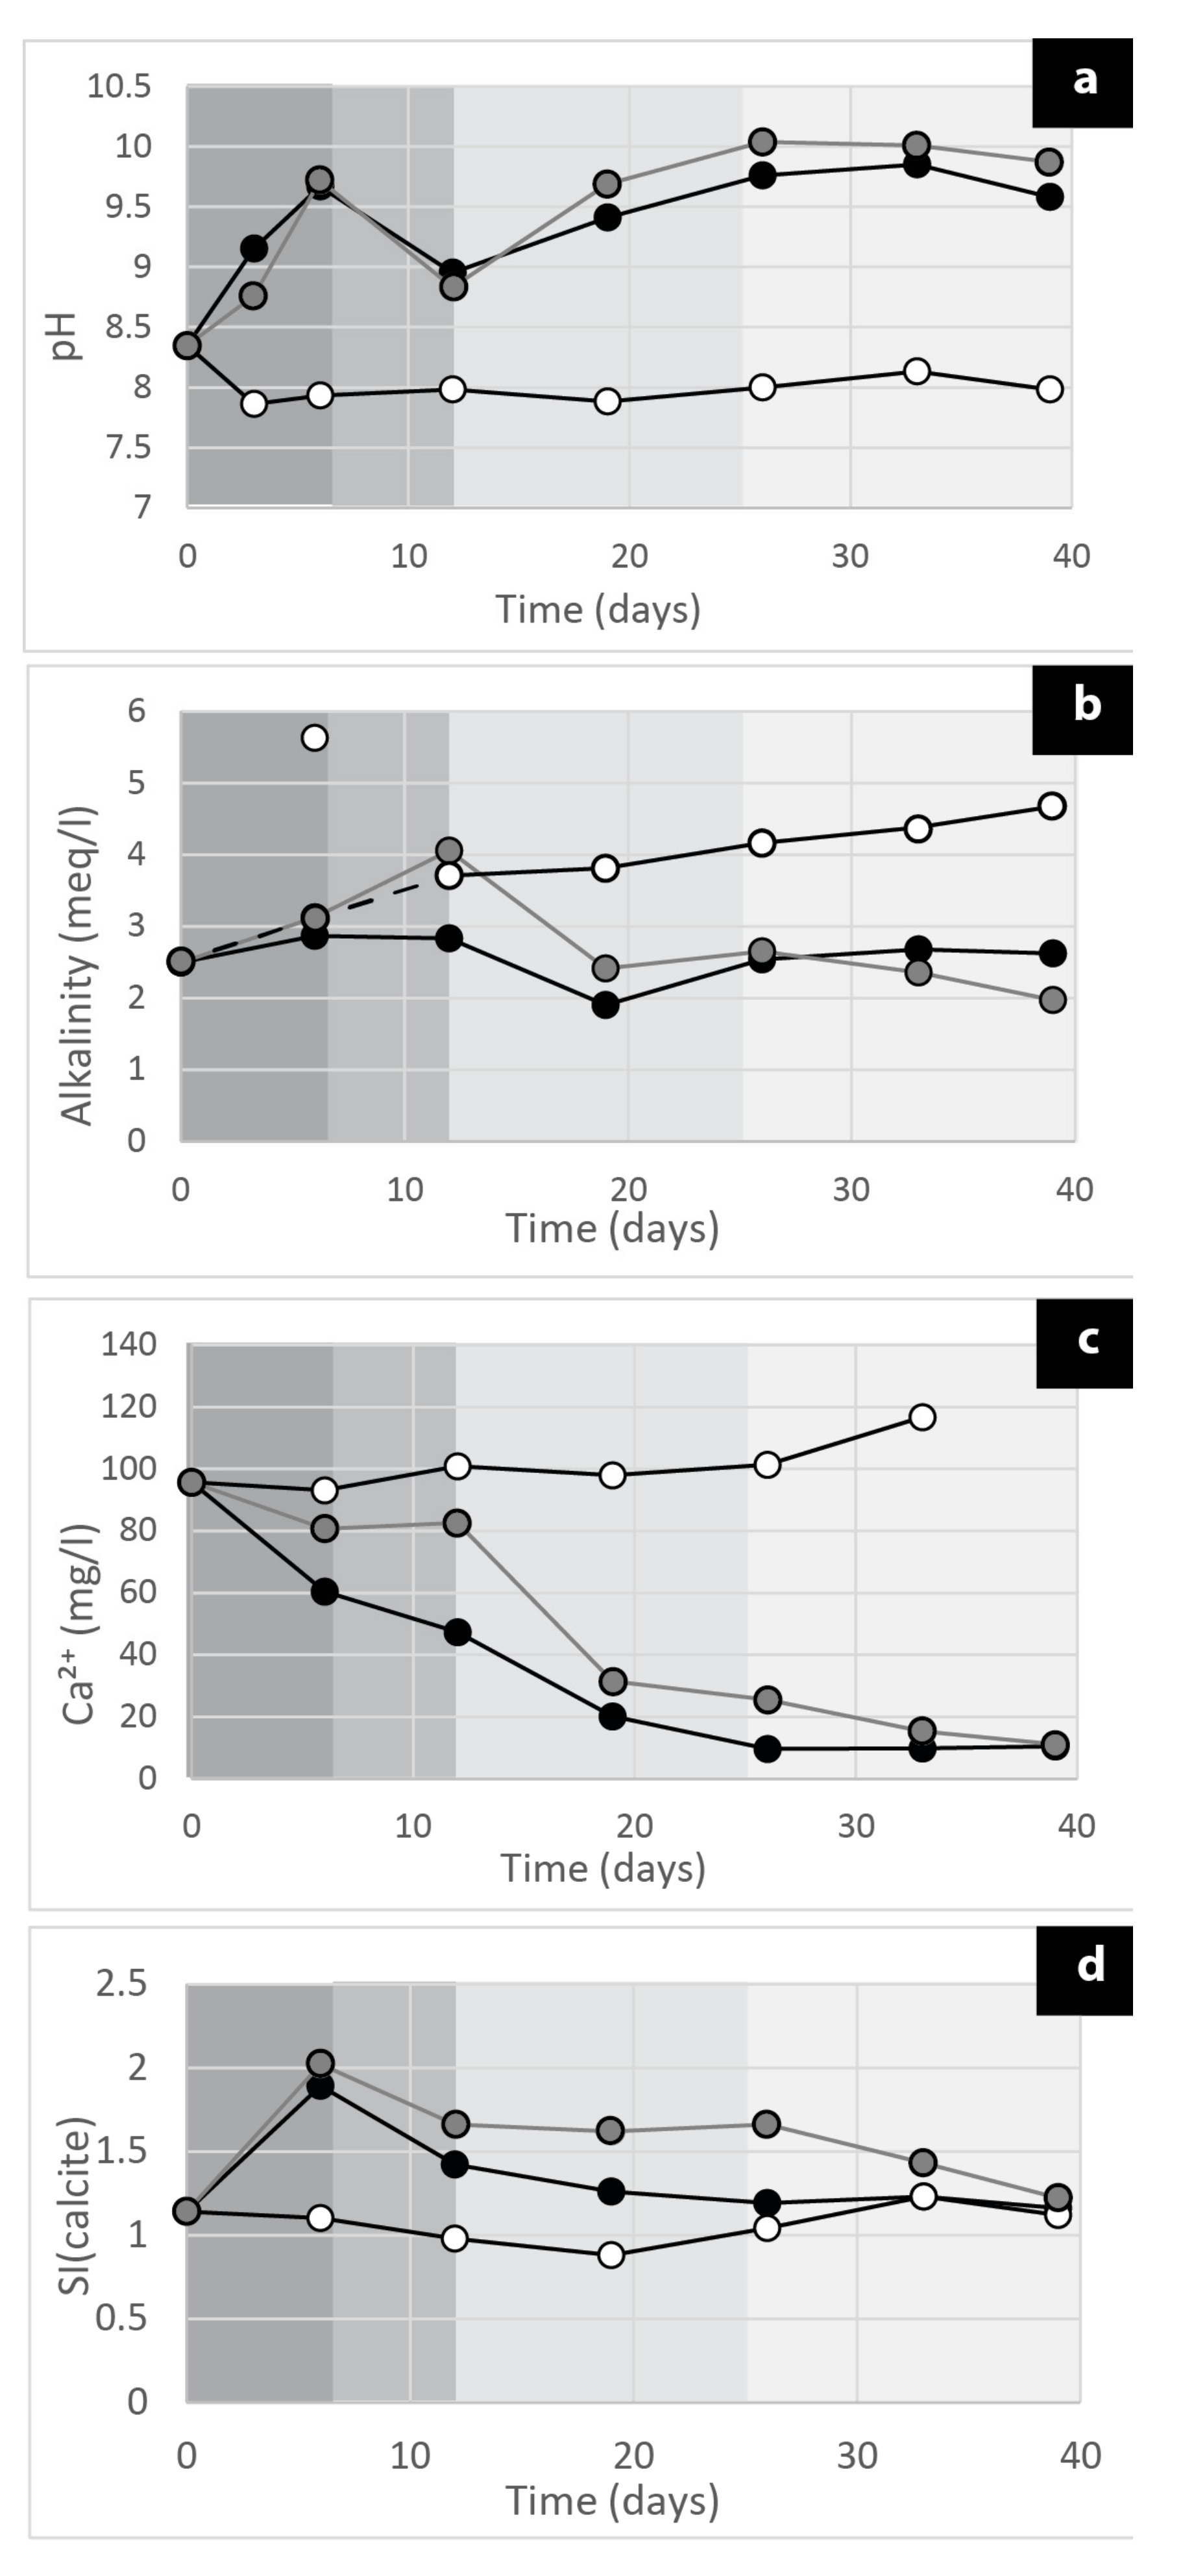
2.5.2. Geochemical Analysis

Ten-mL of experimental solutions were removed every seven days in order to monitor the changes in physicochemical conditions. The pH in the aliquot was measured using a Fisher® pH combined electrode (Hampton, NH, USA), with an accuracy of 0.01 units. Subsequently, the samples were centrifuged for 10 min at 4500 rpm (3500× g) at 15 °C and filtered through a 0.22 µm acetate cellulose membrane filter to remove bacterial cells. The filtrates were analyzed for alkalinity and calcium ion concentrations.
The total alkalinity was determined following a standard HCl Gran titration procedure [48] using an automatic titration cell (TitroLine alpha TA10 plus, Schott Instruments) with an accuracy of ±2% and a detection limit of 5 × 10⁻⁵ M. Total alkalinity is defined as the sum of all of the bases that are titratable with strong acid (HCO3; CO32−; B(OH)4; H3SiO4; HS; organic anions, e.g., low molecular weight organic acids; OH) [49,50]. It should be noted that the individual components of the total alkalinity were not measured in our experiment. Although we assume that HCO3 was the main component of the alkalinity, the contribution of other ions could change during the course of the experiment, and thus affect the alkalinity as well, particularly products of cyanobacterial photorespiration, which include organic acids [6,10,13]. The calcium concentration was determined by suppressed ion chromatography (Dionex® DX100, Thermo Fisher Scientific, Waltham, MA, USA) with a detection limit of 3 × 10⁻⁵ M.
To minimize physicochemical precipitation that can occur in the filtered supernatant between sampling and time of analysis: (i) samples were refrigerated at 4 °C, (ii) the alkalinity was measured within 48 h of sampling and (iii) the sample for calcium analysis was diluted five times and measured between one and three weeks after sampling. Only one alkalinity and one [Ca2+] measurement were carried out because of the small sample volume and statistical analysis was therefore not possible.
The calcite saturation state is given by the saturation index [51]:
SIcalcite = log (IAP/Kcalcite)
where IAP is ion activity product {Ca2+} × {CO32−} and Kcalcite is the solubility of calcite [49].
The saturation index (SI) was calculated with PHREEQC software [52]. The temperature, pH, alkalinity and calcium concentrations were the variables used for this calculation.

3. Results and Discussions

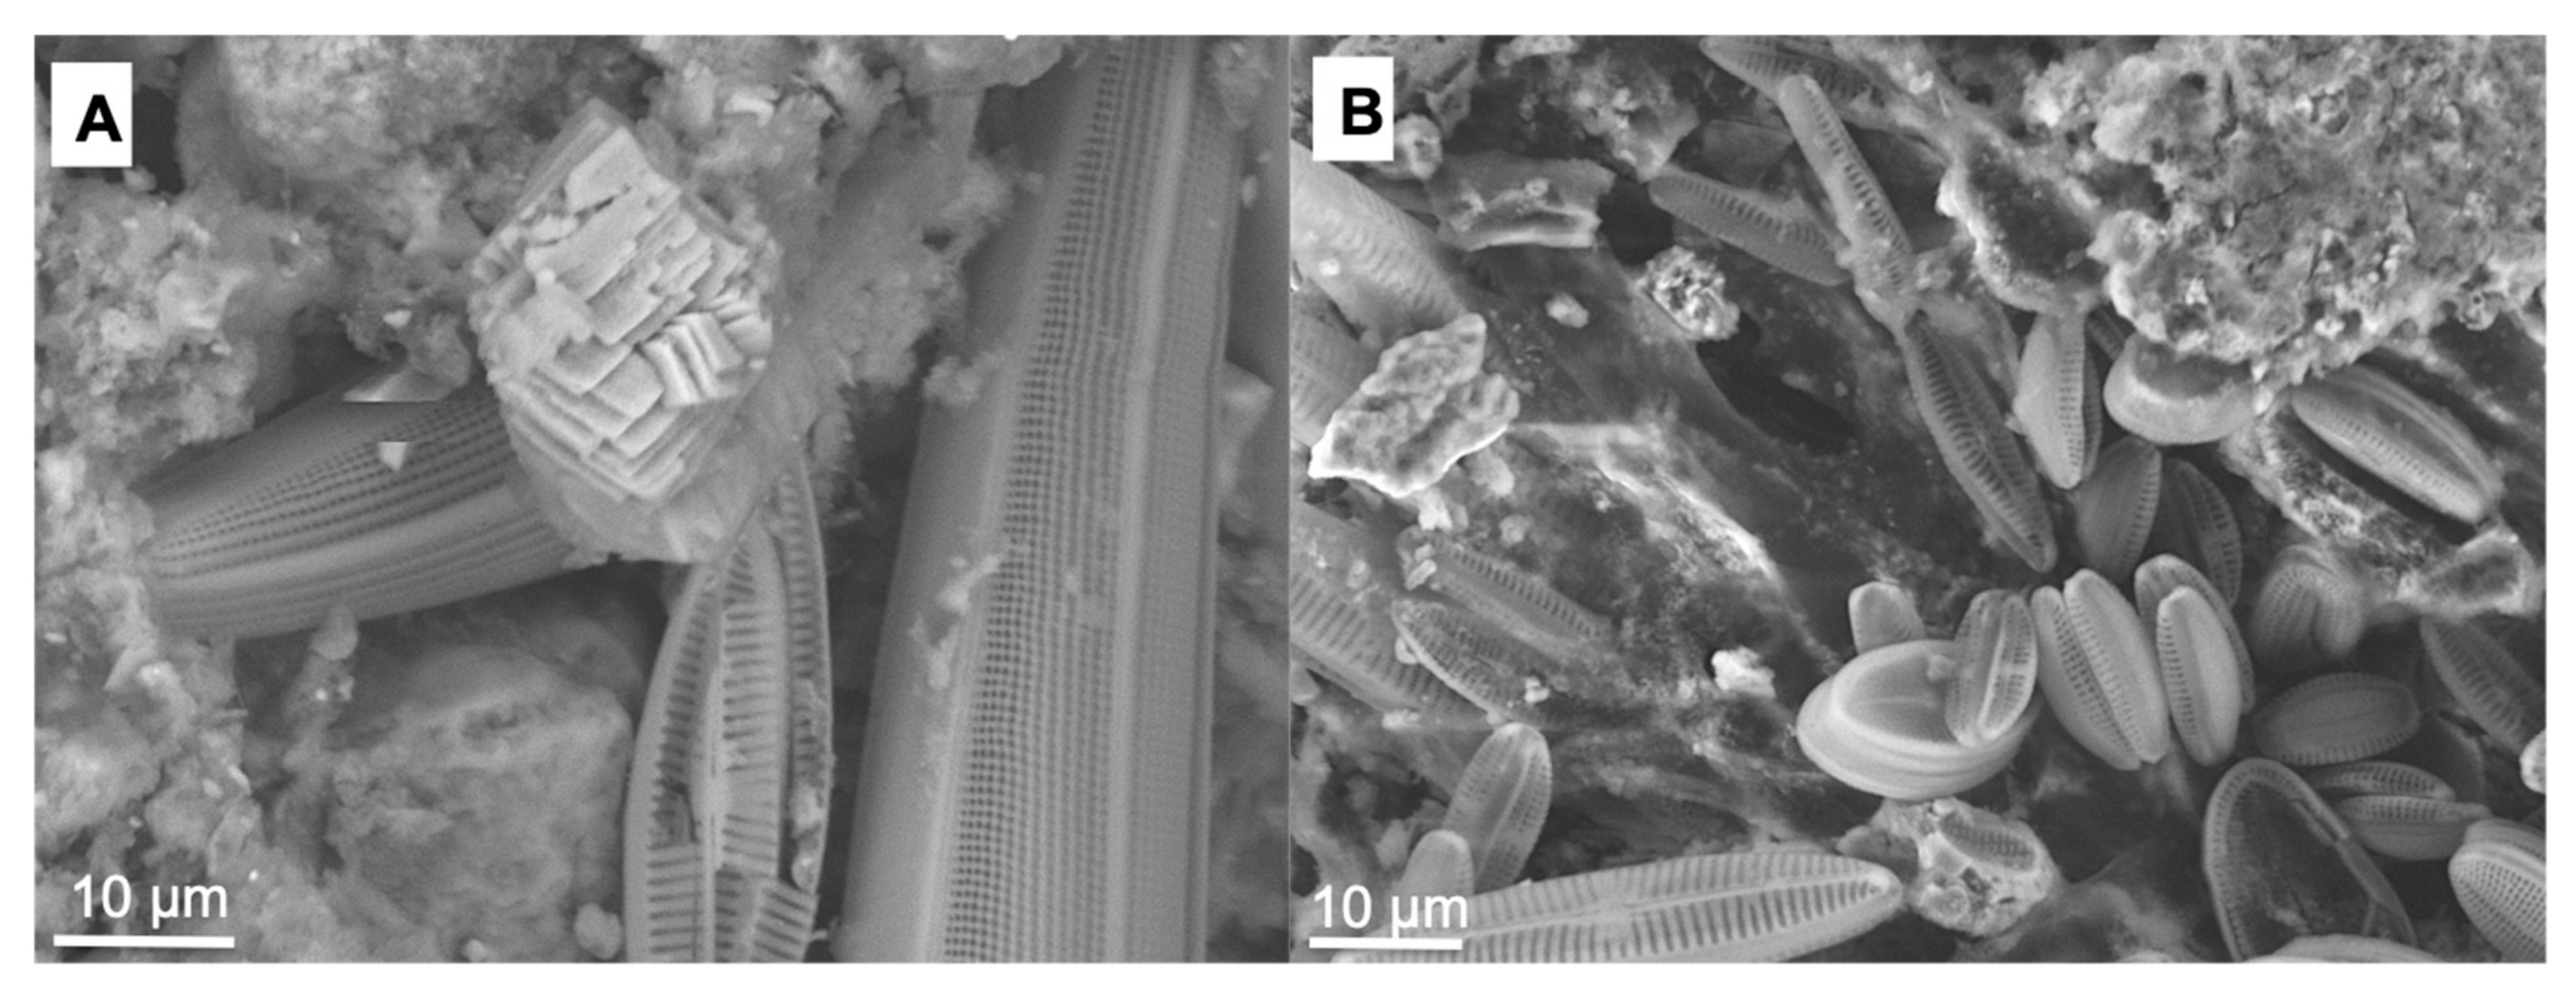
3.1. The Composition Cyanobacterial Biofilm Community

Light and electron microscopic observations revealed that based on morphology [53] the biofilm at the end of the liquid enrichment (see Section 2.2. Stage 1; i.e., used in precipitation experiment) was predominantly composed of filamentous cyanobacteria of the Oscillatoriaceae family (filamentous cyanobacteria with a diameter of 3 to 4 μm) (Figure 3A,B). Less abundant, larger filamentous cyanobacteria with a diameter of around 10 μm were identified as members of the Phormidiaceae family (Figure 3F). Coccoid cyanobacteria (3–5 μm in diameter, similar to Gloeocapsa sp.) were repeatedly observed near the Oscillatoria-type filaments (Figure 3A,C). The fraction of the sequences in molecular analyses that could be classified as Cyanobacteria confirmed that most of these phototrophs were related to the Tychonema genus (resembling Kamptonema sp.), within the Phormidiaceae family of the Oscillatoriales order, and to the Oscillatoriaceae family Microcoleaceae genus (closely related to the Arthrospira sp.) according to the latest version of the SILVA SSU database r132. A few sequences were classified within the Spirulina genus (Spirulina sp.).
Some pennate diatoms were observed in close proximity to cyanobacterial filaments (Figure 3D). Presumably heterotrophic bacteria (500 nm-long, elongated cells) were often “trapped” in the EPS matrix (Figure 3E), but their abundance was low compared to natural Mérantaise biofilms.

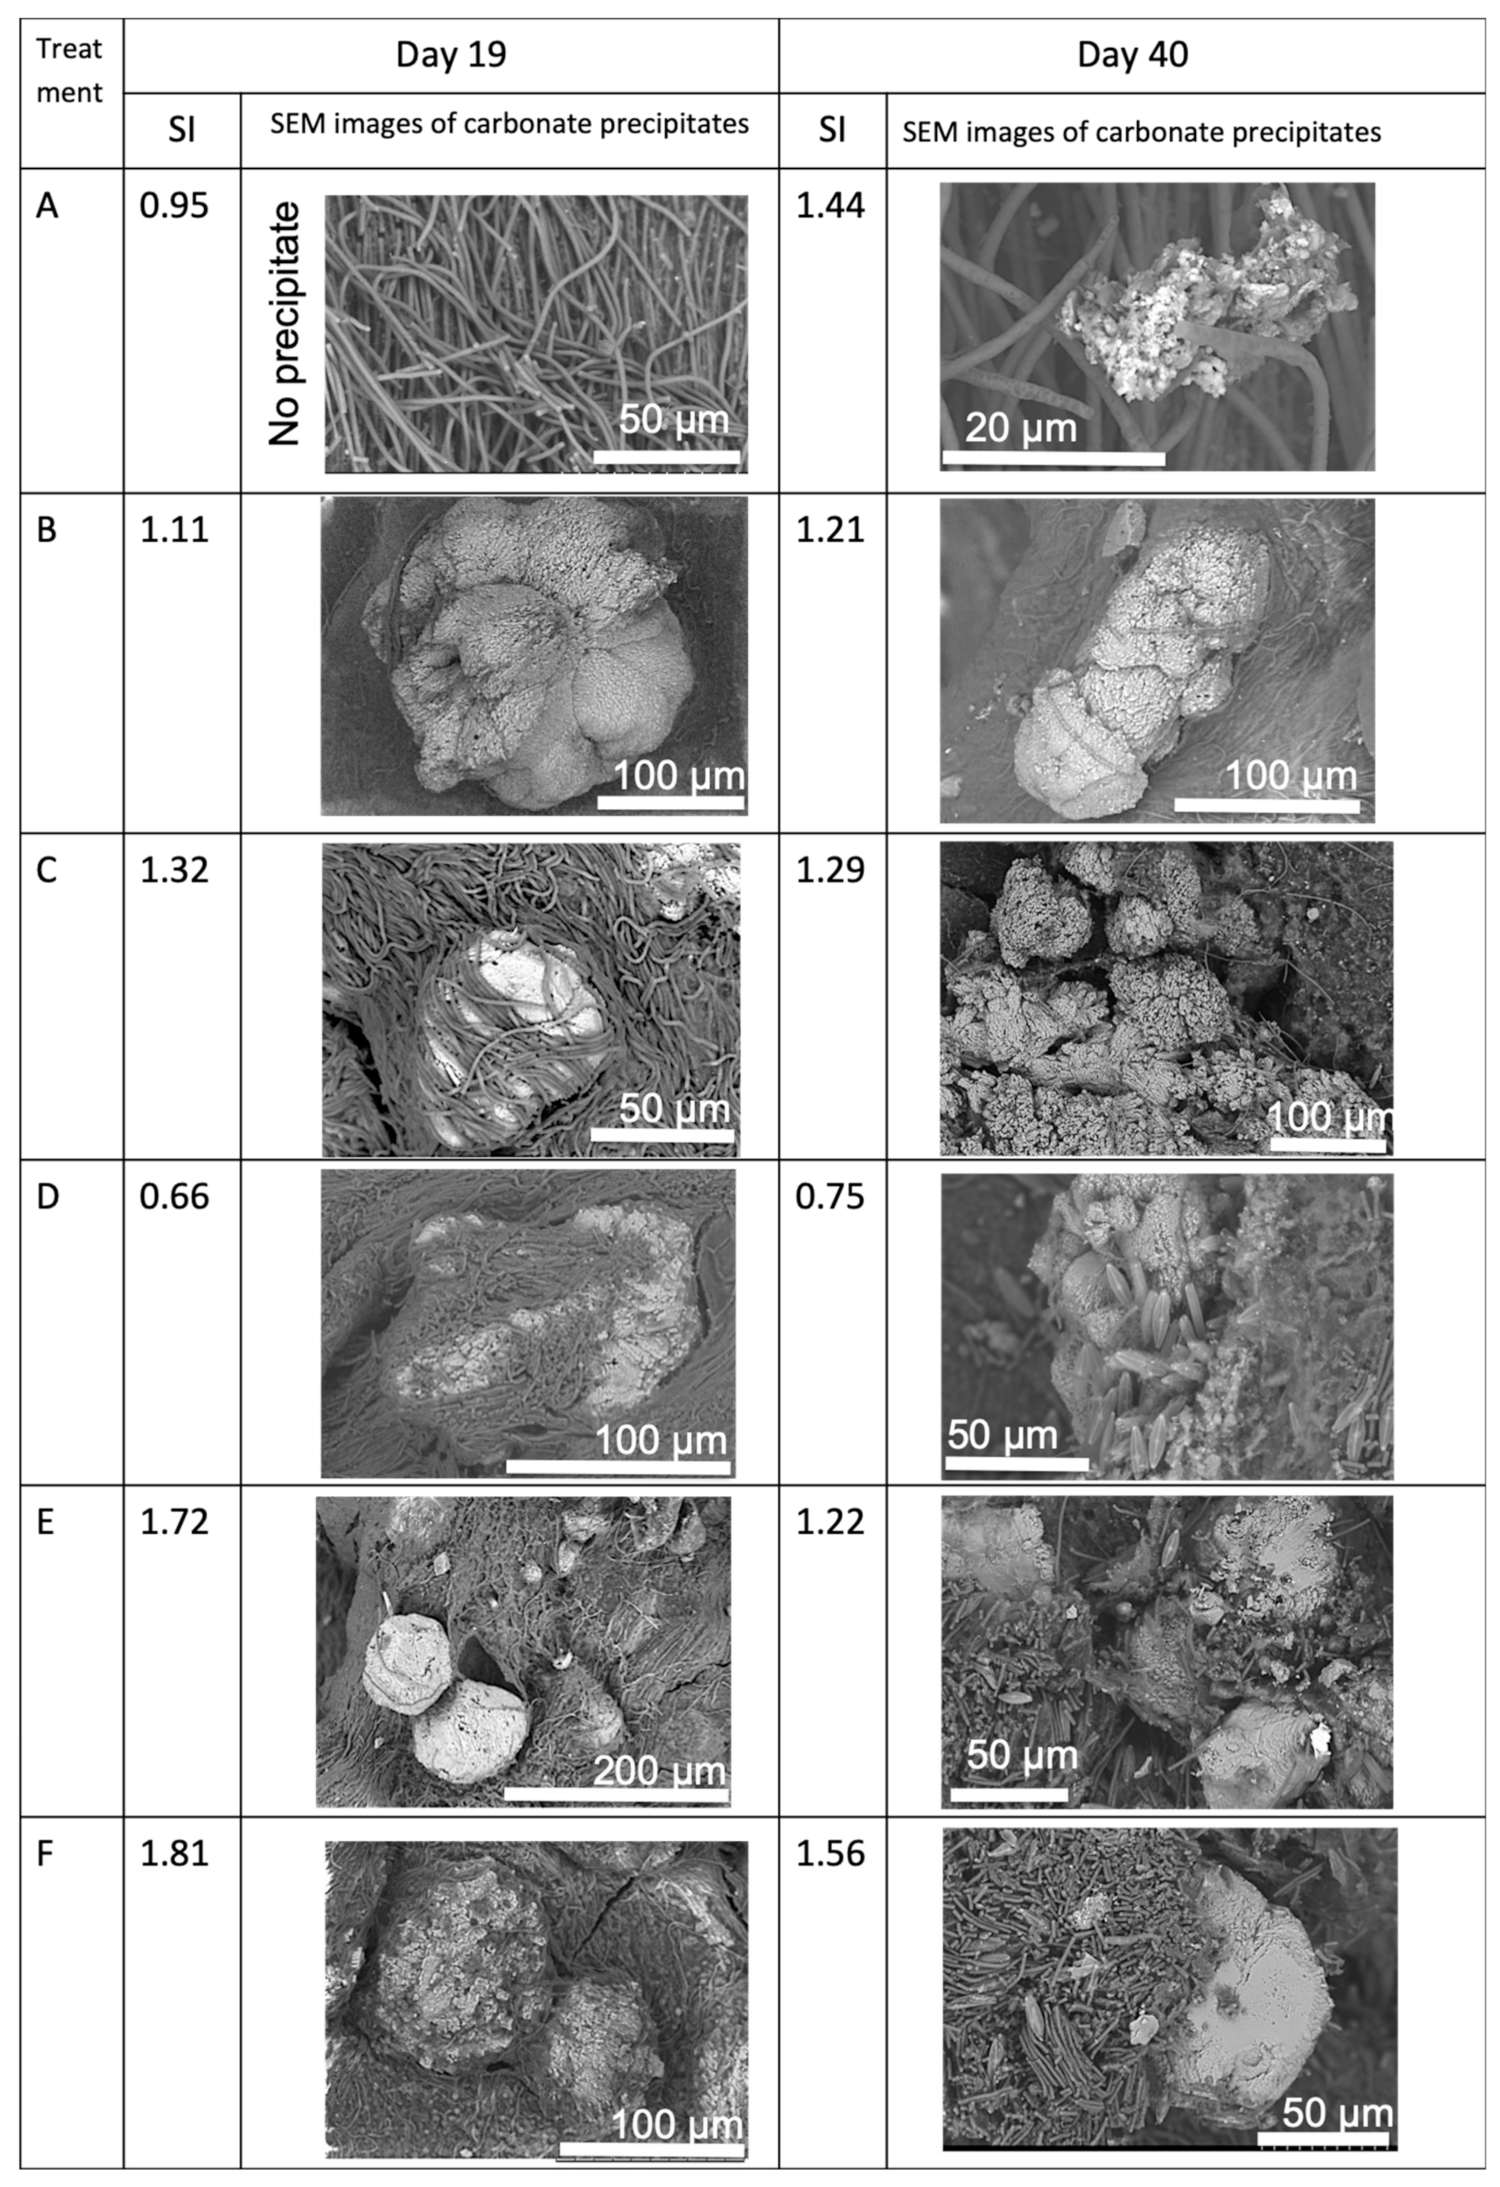
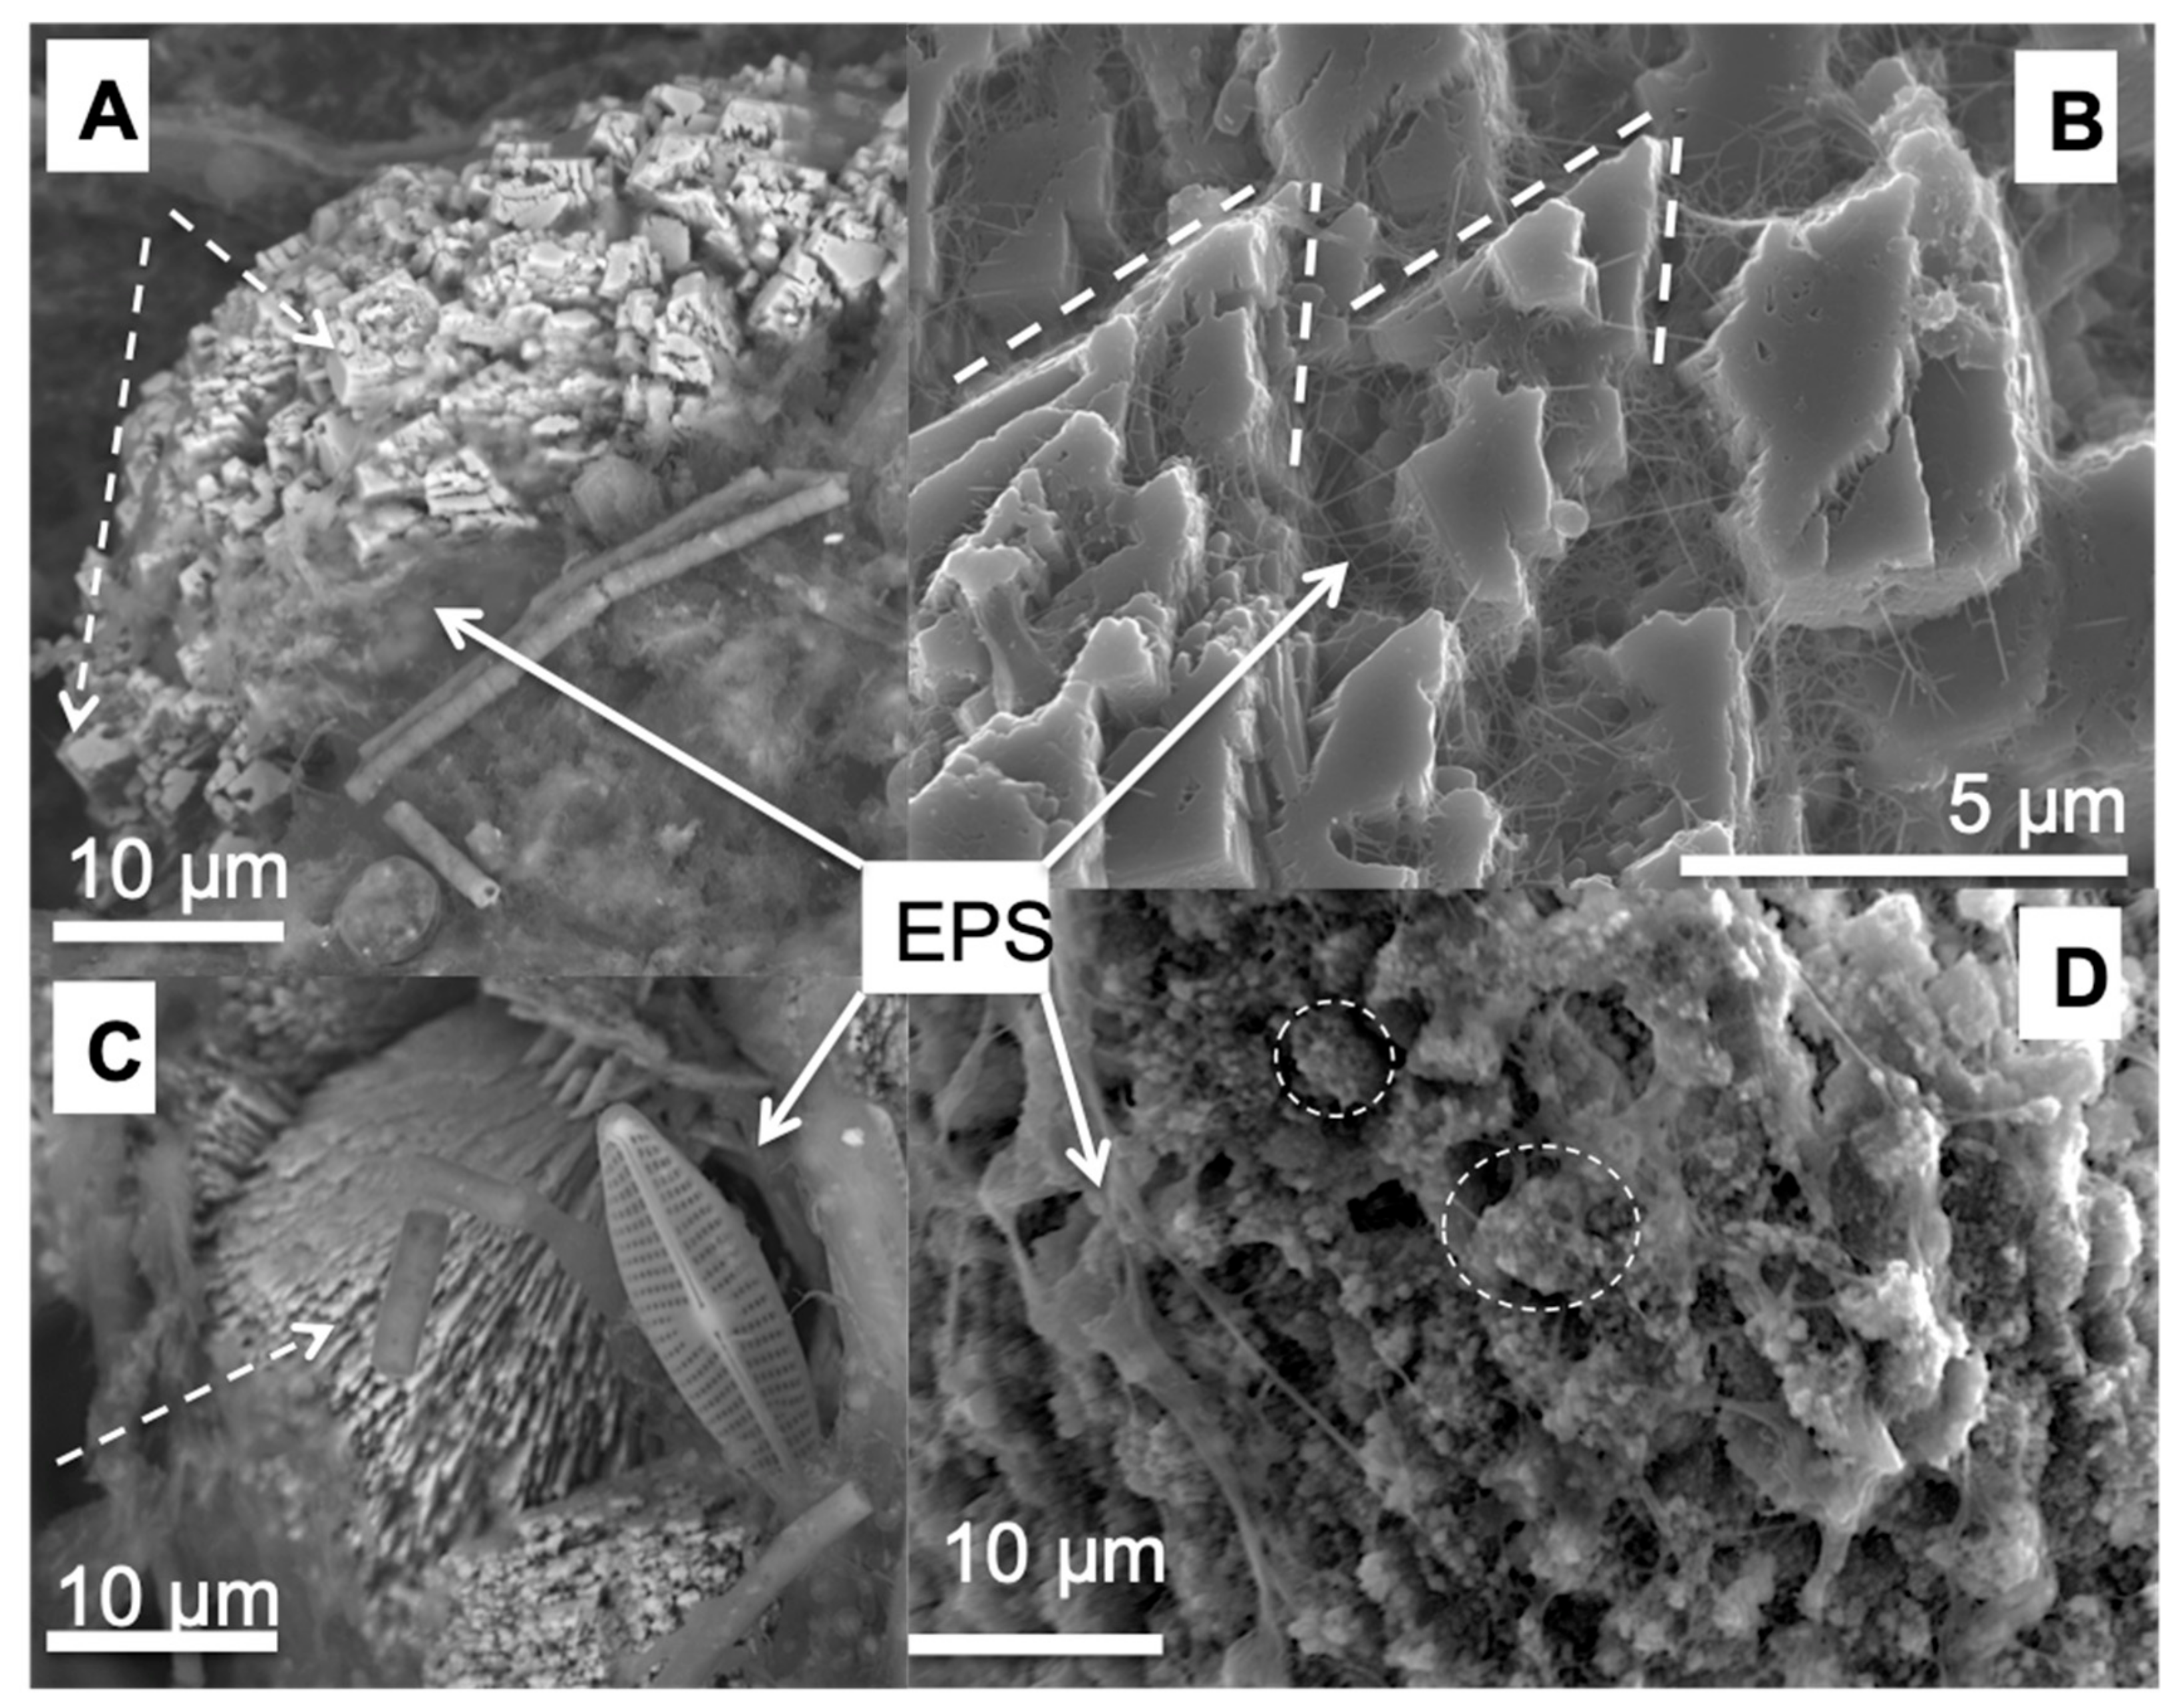
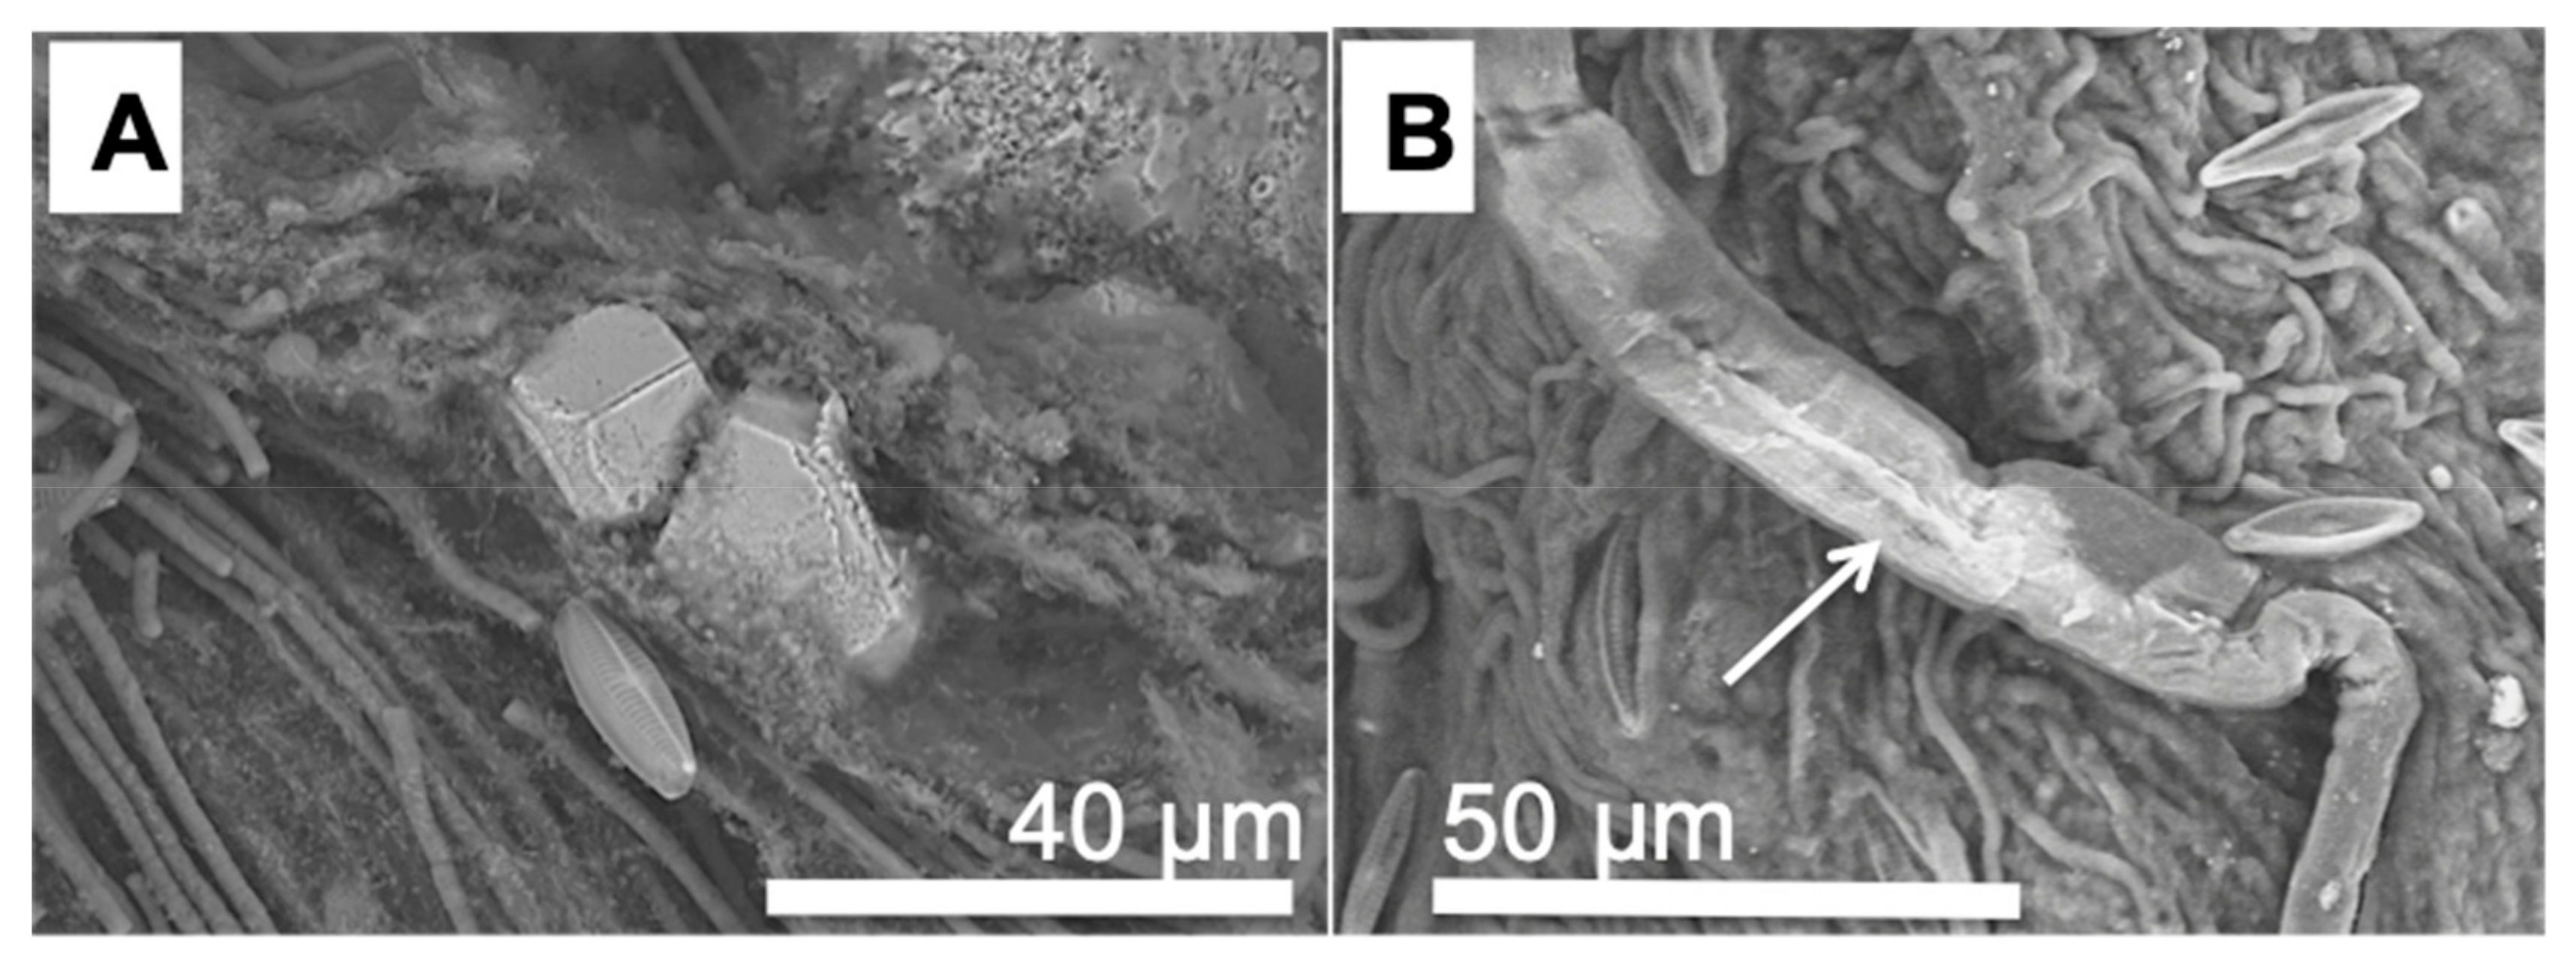
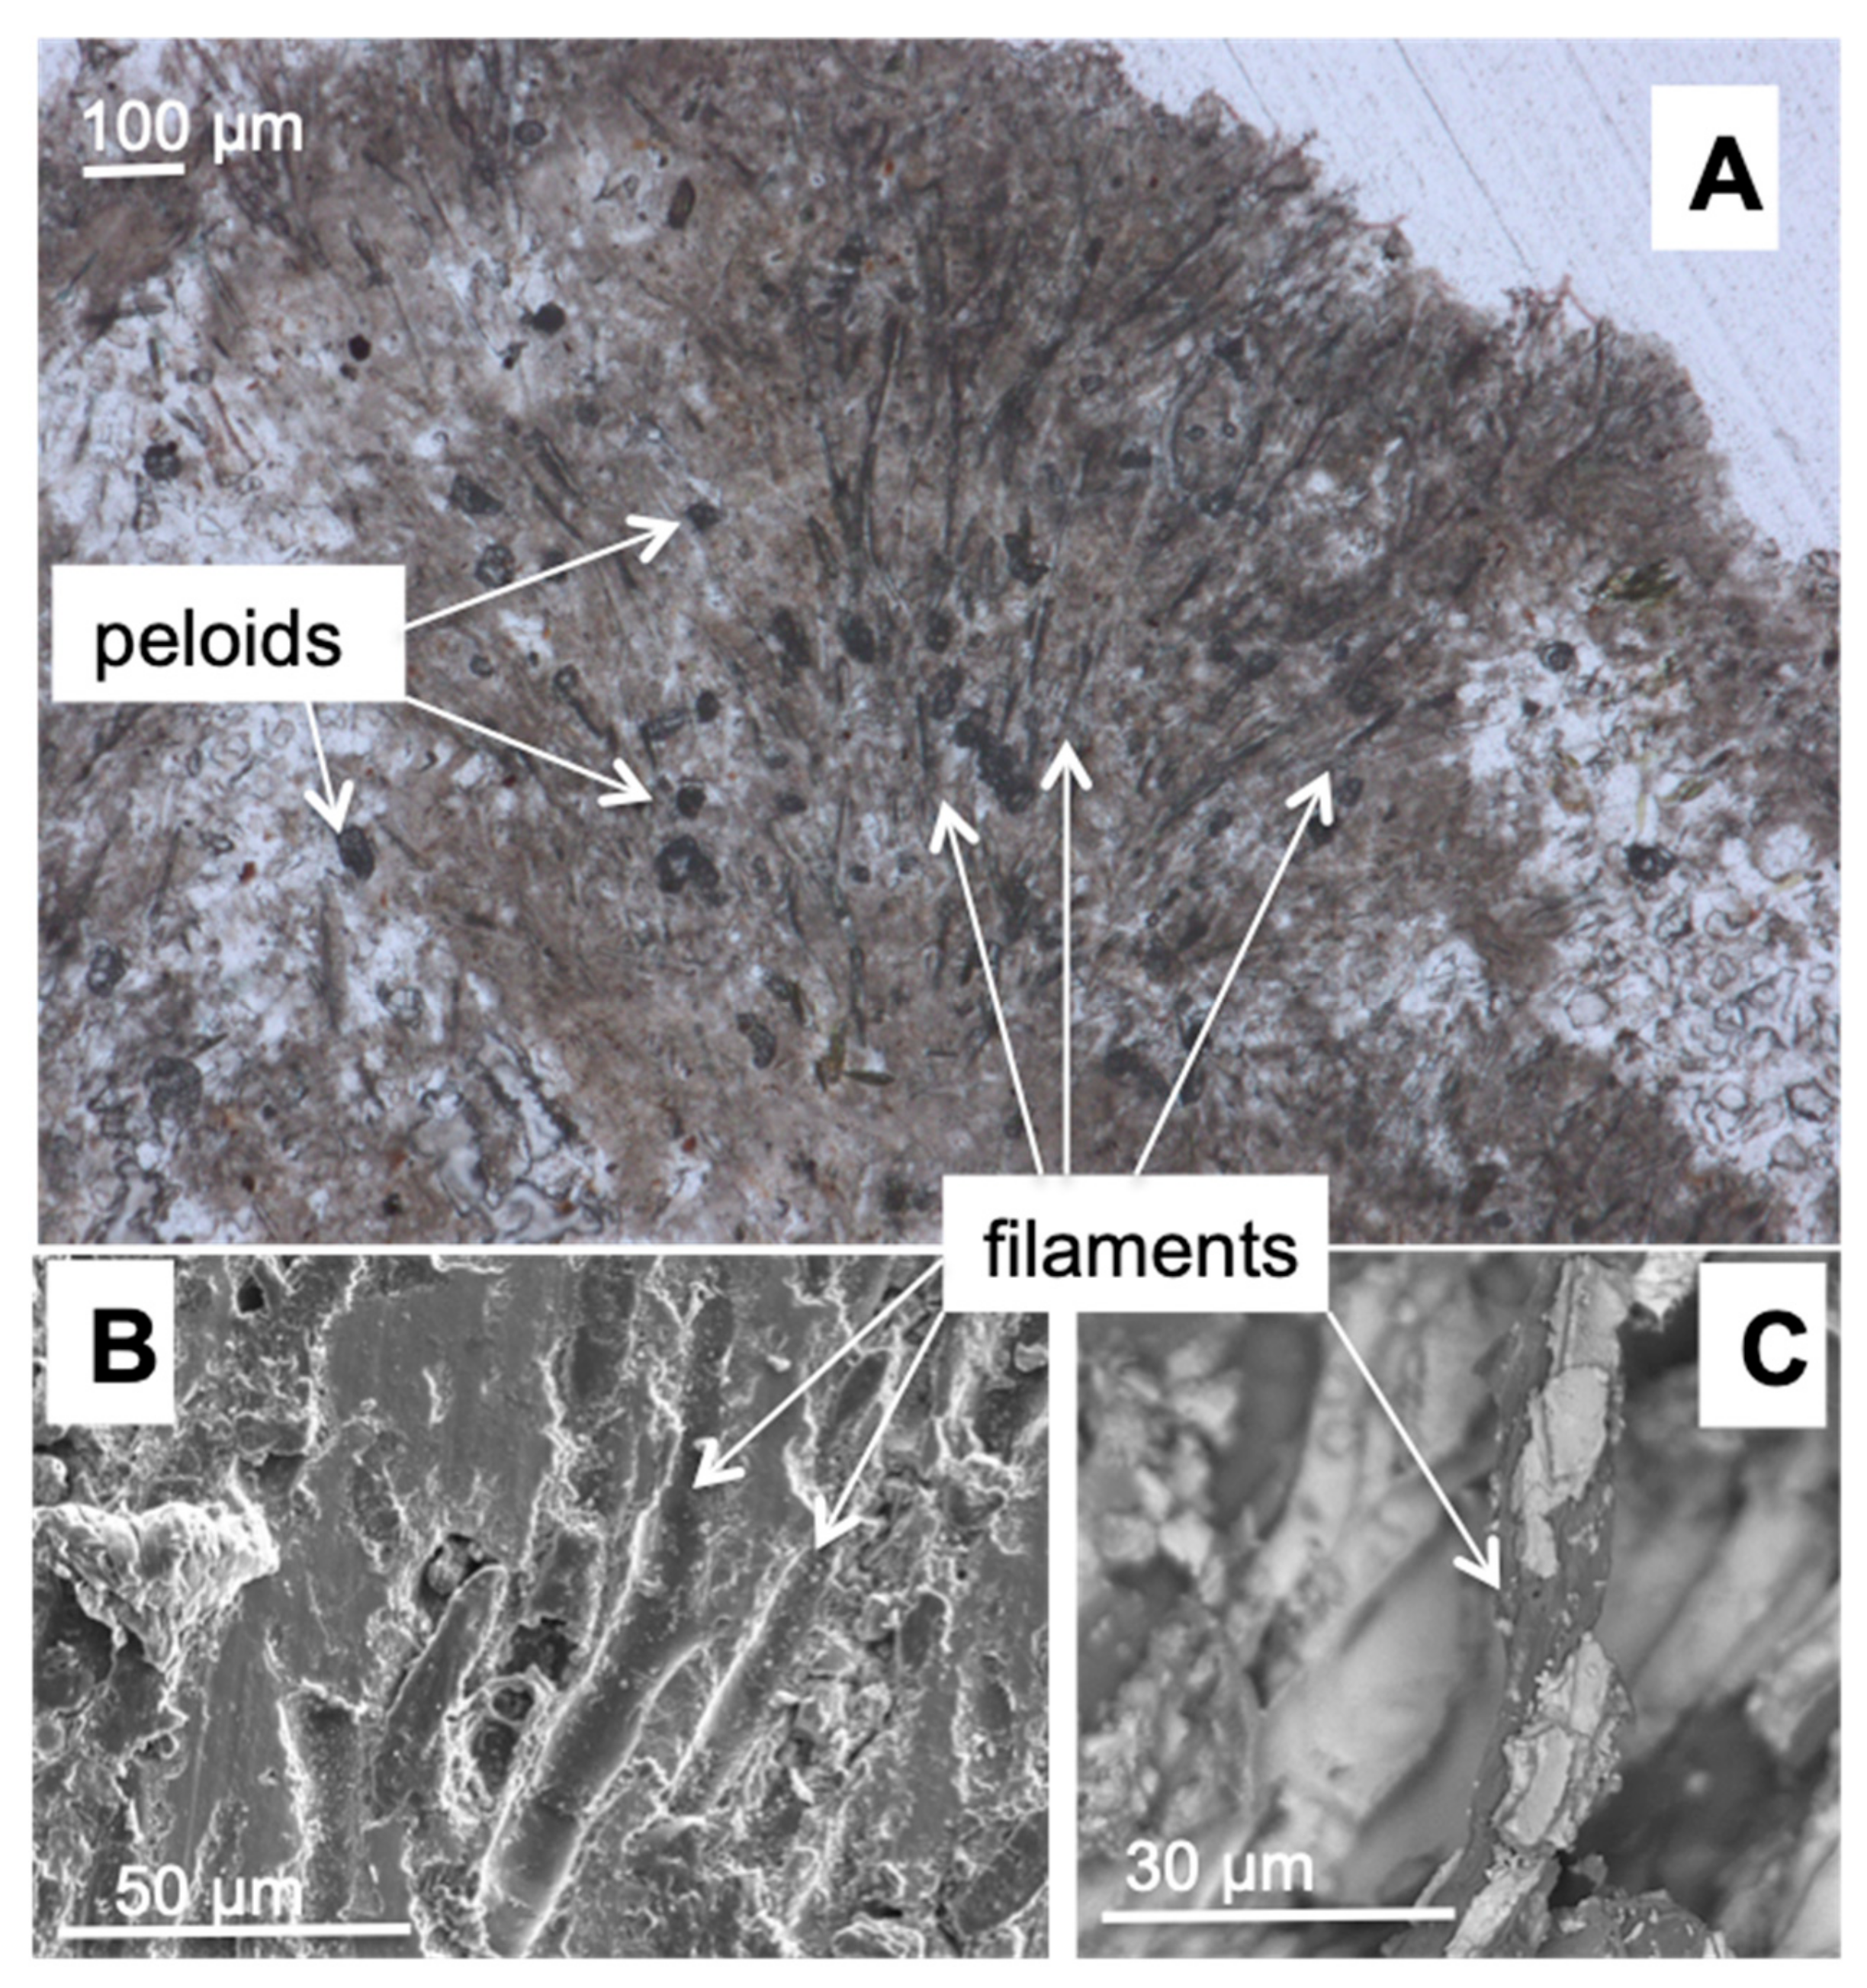
3.2. Morphology and Mineralogy of the Carbonate Precipitates

Analyses of precipitates using SEM and FT-IR spectroscopy were carried out on Day 19 and Day 40 of the experiment. Day 19 corresponded to period of extensive carbonate precipitation (see Section 3.4.) During this stage, micro-peloid precipitates were observed in all biological incubations except for Treatment A (Figure 4A, Day 19). The micro-peloids, up to 50 μm in diameter, were embedded in the bacterial biofilm or completely entrapped by filamentous cyanobacteria (Day 19, Figure 4C,D). Well-formed micro-peloids conglomerated in multi-peloidal clusters measuring several hundred micrometers. Similar mineral structures and arrangements of the biofilm and the precipitate were observed by [54] in a freshwater cyanobacterial mesocosm experiment. The quantity of minerals precipitated depended on the initial experimental conditions: highest number of micro-peloids was observed in Treatments E and F, where initial concentrations of calcium were higher (100 mg/L and 150 mg/L, respectively). Diatoms were present in large quantities in all experimental biofilms and were often observed in close proximity to the precipitate (Figure 4D, Day 40).
The SEM observation at the termination of the experiment (Figure 4, Day 40) showed a similar precipitate morphology as observed in Day 19 samples: well-developed micro-peloids covered most of the biofilm surface (Figure 4C, Day 40). Detailed analysis of micro-peloids (both after 19 and 40 days of the experiment) showed four structures of micro-peloids, differing by their mesocrystals shape: (1) rhombic/polygonal mesocrystals, with a size ranging from 3 to 5 μm, wrapped in EPS oriented in different directions (Figure 5A). The majority of these crystals had polycrystalline structures and cracks; (2) trigonal mesocrystals, 3–7 μm in size, had a common orientation and were linked by thin filaments of EPS. These mesocrystals were porous and not yet completely shaped (Figure 5B); (3) compact arrangements of needle mesocrystals radiating in the same direction, with a length of 10–15 μm and a diameter of 100–300 nm (Figure 5C); and (4) spheric mesocrystals with a diameter of 3–7 μm, composed of spherulites (size 0.5–1 μm), also often referred to in the literature as “nano-globules” (e.g., [31]). These mesocrystals were completely wrapped in EPS (Figure 5D). There was no obvious relationship between the shape of mesocrystals and the type of microorganisms these crystals precipitated in proximity to. However, all of the mesocrystal shapes were covered by EPS (Figure 5), as was also reported in natural mats [28]. Liang et al. [33] had two explanations for the coexistence of different mesocrystal morphologies in their experiment: (i) one crystal shape could transform to another. For example, needle-shaped mesocrystals could change into rhombs at a later stage of experiment; (ii) the chemical properties of EPS, critical for morphology of crystals, changed: e.g., a decrease in acidity of amino acids within the EPS modified the shape of carbonate minerals from spherical to rhombohedral [55]. Furthermore, Jones [56] indicated that morphology of carbonate (meso)crystals may depend on the degree of supersaturation of carbonates. An increase in supersaturation with respect to carbonates changed the mesocrystal morphology from polygonal to dendritic to spherulitic. Our results are similar to those found in intertidal mats, where similar micropeloids and mesocrystals were observed [28].
The composition and structure of EPS is complex and subject to continuous partial production and consumption, especially in biofilms of mixed microbial composition [20,22,57,58]. The micro-peloid distribution within the biofilm studied here was heterogeneous, displaying areas of high and low density of micro-peloid in close proximity (example: Figure 4C, day 40). Microscopic observations did not show apparent differences in cyanobacterial biofilm structure in these zones. The different mesocrystal fabrics and the irregular micro-peloid distribution can be explained by: (1) local differences in structure, composition and density of EPS, and, potentially coupled to this (2) local variations in physicochemical conditions (e.g., pH, SI, negatively charged functional group availability).
In addition to meso-peloids, two other carbonate morphologies precipitated in biological treatments were detected: (1) rhombic sparite crystals (10–20 μm) wrapped in biofilm (Figure 6A). Similar rhombic crystals precipitating in cyanobacterial biofilms were reported by [54]; and (2) a very thin sheet of carbonate (lamellae) formed directly on the surface of Phormidiaceae filaments (Figure 6B). Identical sheet-like carbonate precipitates were deposited on Phormidium incrustatum filaments in the Sarine River, Switzerland [17,59] and in Nivå Bay, Denmark, after a two-year growth period of experimental mats [30].
The chemical composition of the micro-peloid and rhombic sparite crystals was analyzed by EDS. The spectrum revealed that the crystals were composed of Ca, C and O (Figure 7a). The same crystals when examined by FT-IR spectroscopy, showed absorption peaks at 1408, 872 and 711 cm⁻¹, which corresponded to calcite (Figure 7b). The FT-IR spectrum revealed additional peaks at 3284, 2934, 1645 and 1032 cm⁻¹, which were interpreted as (oligo)sugars (Welience software platform; Figure 7c), specifically D-Raffinose pentahydrate (an oligosugar composed of galactose, glucose and fructose monomers). D-Raffinose pentahydrate most likely originated from the EPS matrix, which typically consists mostly of polysaccharides [60]. This co-occurrence of organic and inorganic carbon in the mineral sample confirmed that carbonate precipitated within the cyanobacterial EPS matrix.

3.3. Comparison Carbonate Minerals Observed in the Natural Environment and in the Laboratory Experiment

Well-mineralized field samples were collected at the same time and location as the inoculum for laboratory experiment. The field samples comprised microbial tufa consisting of a sequence of flat or slightly wavy laterally persistent laminae, 100 to 1000 μm-thick, with alternating dense and loose filament molds. Thin sections and SEM were viewed in order to compare the micro-morphology of field samples with that obtained in the laboratory experiment. Carbonate precipitates were often found in close proximity of diatoms, which were abundant in both field and laboratory biofilm samples (e.g., Figure 5C, Figure 6B, Figure 10A,B and Figure 11A,B). The role of diatoms in carbonate precipitation is not the topic of this work, but based on their vast EPS production potential [57], these organisms could be important contributors to the mineralization process.
Microscopic observations of natural samples showed an abundance of filaments with an approximate diameter of 10 μm, completely encrusted in carbonate (Figure 8A,B). According to DNA sequencing and to the morphology, we assumed that these cyanobacterial belong to the Phormidiaceae family.
Vertically-oriented, non-branching filaments were organized in fan-shaped structures near the surface of the biofilm (Figure 8A). SEM analysis of a fresh cut sample showed that the filaments were covered with calcite laminae (Figure 8C), resembling our laboratory observations (Figure 6B). Based on these observations, we suggest that this represented the initial step of carbonate precipitation. It should be noted that only a few Phormidium-like filaments were present in the laboratory experiments, in contrast to the field samples in which this cyanobacterium was abundant. This difference may be due to: (1) the laboratory incubations were too short to allow for some organisms to fully develop; (2) experimental conditions (nutriments, light, and temperature) deviated from the field conditions. Laboratory conditions could have favored or prevented the growth of specific microorganisms; (3) the Winogradsky columns were inoculated with samples taken in December. During the winter period some organisms could be less active or were absent from the biofilm; (4) laboratory samples were not subjected to seasonal variations, in contrast to microbial tufas, mats and biofilms in the field.
Additional SEM analyses of carbonate precipitates in field samples showed long-crystallite (acicular) dendrites forming around Phormidiaceae filaments (Figure 9A,B).
This dendritic carbonate morphology was not detected in laboratory incubations. [61] concluded that the formation of dendritic crystals was governed by cyanobacterial EPS. Long-crystallite dendrites were also observed around a high number of voids in SEM observations of field samples (Figure 10B). These voids (diameter 2–3 μm) (Figure 10A) could be remnants of Oscillatoriaceae filaments that were also abundant in the biofilms in laboratory experiments, which would argue for an influence of cyanobacterial bacterial EPS in the (dendritic) carbonate precipitation. Remnants of Oscillatoriaceae (i.e., circular voids) were absent in more mature natural samples, and thus long-term preservation of these traces of cyanobacterial carbonate precipitation seems unlikely.
Micro-peloids were observed in thin sections of the field (Figure 8A) and laboratory samples, with a similar amount of these crystals per surface area of biofilm in both. However, the micro-peloids in natural samples were 2–10 times smaller than those formed in the laboratory incubations (10–30 μm and 50–100 μm in diameter, respectively). According to [62], this difference in size can be related to the saturation index: in the stream SIcalcite ranged from 0.9–1.3 and in the laboratory experiment this increased from an initial SIcalcite = 0.6–1.4 to SIcalcite = 1.8–2.5 during the stage of extensive precipitation. Similar to the laboratory experiments, micro-peloids precipitated in close proximity of filamentous Oscillatoriaceae and EPS in the natural sample. Thus, the presence of micro-peloids in natural samples could be interpreted as well-preserved ‘indirect’ traces of Oscillatoriaceae community activity.
Rhombic sparite crystals with a uniform size distribution (20–30 um) were occasionally found in field and experimental samples (Figure 6A). Some polycrystalline rhombic sparite was also present in the natural sample (Figure 11A). A similar rhombic sparite shape of calcite crystals was obtained in experiments with EPS of Bacillus licheniformis S-86 by [63]. Thus, it appears that bacterial EPS can modify the crystal shape of calcite from rhombic, which is often incorrectly considered as a solely abiotic carbonate product, to polycrystalline rhombic.

3.4. The Carbonate Precipitation Process in the Cyanobacterial Biofilms

In the biological incubations, a sequence of biofilm development and mineral precipitation was observed in all treatments. The cyanobacteria showed a growth pattern presumably coinciding with EPS production and excretion of photorespiration products, similar to reports for biofilms (during a similar time frame as in our experiment; [64]) and microbial mats [6,10,29,30]. The different types of cyanobacterial metabolisms and their specific effect on the physicochemical conditions are summarized in Table 3. The key physicochemical measurements (pH, [Ca2+], alkalinity, temperature) from which the SIcalcite can be calculated and qualitative observations of O2 production and mineral precipitation support the sequence of precipitation events [65].
Initially, the cyanobacterial enrichments grew rapidly in the fresh medium, which was supported by evolution of O2 bubbles during the light period. The agar provided a (semi)solid surface critical for mat development and lithification [38,59]. During this initial phase, the high rates of CO2 fixation could increase the pH and alkalinity through the production of hydroxyl ions resulting from bicarbonate dissociation into CO2 [66] (Table 3, Figure 12a,b). The production of fresh EPS facilitates Ca binding [17,32] possibly accounting for the observed decrease (Figure 4C). The SIcalcite increased slightly (Figure 4D), suggesting a greater impact of the changes in pH and/or alkalinity than that of [Ca2+]. No precipitation was seen during this period, but the biomass increased visibly.
Following this initial rapid biofilm development, photosynthetic rates typically reach a maximum value [10]. Consequently, cyanobacteria switch from O2 production to O2 consumption later during in the light period in alkaline conditions [69]. During photorespiration, glycolate is excreted, potentially reaching millimolar concentrations [17,69]. This would decrease the pH (Figure 12a). As noted, organic acids contribute to the alkalinity, and account for a small increase in SIcalcite as was observed (Figure 12d). The [Ca2+] decrease (Figure 12c), possibly due to binding to low-molecular weight acids (e.g., extracellular organic matter (EOM); [17]). The combining of Ca and glycolate would ultimately lead to an increase in pH, as was observed in the following and last phase of mineralization (Figure 12a). No visible CaCO3 precipitation was noticed in this period.
The next step of biofilm development was characterized by carbonate precipitation, which was more pronounced in treatments with higher initial [Ca2+]. This observation coincided with decreases in the [Ca2+] and the alkalinity, with the SIcalcite remaining more or less constant. Following this phase, no changes in pH, [Ca2+], alkalinity were seen. The results for the all incubations are available in Supplementary Materials (Figure S1a,b,c,d).
Similar changes in physicochemical measurements (e.g., increases in pH, SIcalcite) were reported in laboratory experiments [32,33,34,35,36,54] and during manipulations in the field [29,30]. It should be noted that the physicochemical conditions in the biofilm, which is composed predominantly of cyanobacteria and EPS, could have been different than those of the overlying water. This was also observed by [29,30] who reported SIcalcite value approximately 50% lower in the overlying water than in the cyanobacterial layer of their experimental mats. Such differences between the overlying bulk liquid and the biofilm may explain some discrepancies in our observations. Yet, the general trend of pH, alkalinity, [Ca2+] changes in the overlying water and the corresponding degree of CaCO3 precipitation within the biofilm in our study was clear.

4. Conclusions

The observations of crystals precipitated in a biofilm of a cyanobacterial enrichment revealed three different carbonate morphologies: (i) micro-peloids, with four mesocrystal shapes: rhombic/polygonal; trigonal; needle and spheric, (ii) rhombic sparite crystals and (iii) crystals (lamellae) formed directly on the surface of the large filamentous cyanobacteria (Phormidiaceae). The microscopic observations combined with the FT-IR spectroscopy demonstrate that cyanobacterial EPS control crystal morphology of carbonates and spatial distribution of the precipitates. A similar arrangement of carbonate precipitates (i.e., on cyanobacterial sheets and/or within the EPS matrix of the biofilm, in close proximity of cyanobacteria) has been reported in hypersaline [24,26], marine [28,29,30] and freshwater [17,54] biofilms or microbial mats containing cyanobacteria. A comparison of experimental and natural samples suggested that the lamellae precipitating on the surface of Phormidiaceae filaments and the micro-peloids associated with Oscillatoriaceae were the main carbonate crystal morphologies. Elongated crystallite dendrites that formed around both Phormidiaceae and Oscillatoriaceae filaments were only observed in natural samples, supposedly requiring more time to form than the experimental conditions allowed. In sum, the precipitation observed in the laboratory experiment represented an early stage of microbial tufa formation.
The carbonate mineralization laboratory study in a cyanobacterial biofilm obtained from mineralizing freshwater sediments, revealed a trend in precipitation based on the change in pH, [Ca2+], Alkalinity, and SIcalcite that could be coupled to biofilm development and cyanobacterial growth and EPS production. The changes in pH, alkalinity and [Ca2+] in the overlying water and the degree of CaCO3 precipitation within the biofilm in our treatments showed a clear cyanobacterial metabolic role.

Supplementary Materials

The following are available online at https://www.mdpi.com/2075-163X/9/7/409/s1, Figure S1: Time-serial development in all six experimental treatments: 1 (S1.a) the pH, (S1.b) the Ca2+ concentration, (S1.c) the HCO3 concentration and (S1.d) the saturation index (SI) of calcite.

Author Contributions

Conceptualization: D.P.-R. and I.A.B.; Field sampling and measurements: D.P.-R., A.R., E.V., P.A.-S., P.V., I.A.B.; Experiment realization: D.P.-R and I.A.B.; Samples analyses: D.P.-R. and P.A.-S.; Microscopic/spectroscopic analysis: D.P.-R. and I.A.B.; Isolation of genomic DNA and analysis: C.T.; original draft preparation D.P.-R. and I.A.B.; final draft of the manuscript: P.T.V., E.V., A.R., P.A.-S., C.T.; visualization, D.P.-R., P.T.V., and I.A.B. All authors read and approved the manuscript.

Funding

This research was funded by EC2CO-2016, OSU-THETA-2019 and ISITE, grant number UB18037.BGS.IS.

Acknowledgments

We wish to acknowledge the assistance of Christine Stern (Welience, Pôle Chimie Moléculaire, UBFC) with FT-IR analyses and of Maxime Guerineau (ICB, UBFC) for his help with SEM observations. We appreciate the comments of four anonymous reviewers that helped improve the manuscript. Several research grants (EC2CO-2016, OSU-THETA-2019, ISITE UB18037.BGS.IS) funded this study.

Conflicts of Interest

The authors declare no conflict of interest

References

  1. Grotzinger, J.P.; Knoll, A.H. Stromatolites in Precambrian carbonates: Evolutionary Mileposts or Environmental Dipsticks? Annu. Rev. Earth Planet. Sci. 1999, 27, 313–358. [Google Scholar] [CrossRef] [PubMed]
  2. Burne, R.V.; Moore, L.S. Microbialites: organosedimentary deposits of benthic microbial communities. Palaios 1987, 2, 241–254. [Google Scholar] [CrossRef]
  3. Playford, P.E.; Cockbain, A.E. Chapter 8.2 Modern Algal Stromatolites at Hamelin Pool, A Hypersaline Barred Basin in Shark Bay, Western Australia. In Developments in Sedimentology; Walter, M.R., Ed.; Stromatolites; Elsevier: Canberra, Australia, 1976; Volume 20, pp. 389–411. [Google Scholar]
  4. Myshrall, K.L.; Dupraz, C.; Visscher, P.T. Patterns in Microbialites Throughout Geologic Time: Is the Present Really the Key to the Past? In Experimental Approaches to Understanding Fossil Organisms: Lessons from the Living; Hembree, D.I., Platt, B.F., Smith, J.J., Eds.; Topics in Geobiology; Springer: Dordrecht, The Netherlands, 2014; pp. 111–142. ISBN 978-94-017-8721-5. [Google Scholar]
  5. Reimer, A.; Landmann, G.; Kempe, S. Lake Van, Eastern Anatolia, Hydrochemistry and History. Aquat. Geochem. 2009, 15, 195–222. [Google Scholar] [CrossRef]
  6. Stal, L.J.; van Gemerden, H.; Krumbein, W.E. Structure and development of a benthic marine microbial mat. FEMS Microbiol. Ecol. 1985, 1, 111–125. [Google Scholar] [CrossRef]
  7. Ley, R.E.; Harris, J.K.; Wilcox, J.; Spear, J.R.; Miller, S.R.; Bebout, B.M.; Maresca, J.A.; Bryant, D.A.; Sogin, M.L.; Pace, N.R. Unexpected diversity and complexity of the Guerrero Negro hypersaline microbial mat. Appl. Environ. Microbiol. 2006, 72, 3685–3695. [Google Scholar] [CrossRef] [PubMed]
  8. Baumgartner, L.K.; Dupraz, C.; Buckley, D.H.; Spear, J.R.; Pace, N.R.; Visscher, P.T. Microbial species richness and metabolic activities in hypersaline microbial mats: insight into biosignature formation through lithification. Astrobiology 2009, 9, 861–874. [Google Scholar] [CrossRef] [PubMed]
  9. Ward, D.M. A macrobiological perspective on microbial species. Microbe Am. Soc. Microbiol. 2006, 1, 269–278. [Google Scholar] [CrossRef]
  10. Van Gemerden, H. Microbial mats: A joint venture. Mar. Geol. 1993, 113, 3–25. [Google Scholar] [CrossRef]
  11. Gallagher, K.L.; Dupraz, C.; Visscher, P.T. Two opposing effects of sulfate reduction on carbonate precipitation in normal marine, hypersaline, and alkaline environments: Comment. Geology 2014, 42, e313–e314. [Google Scholar] [CrossRef]
  12. Kempe, S.; Kazmierczak, J. The role of alkalinity in the evolution of ocean chemistry, organization of living systems, and biocalcification processes. Bull. Inst. Océan. Monaco 1994, 13, 61–117. [Google Scholar]
  13. Visscher, P.T.; Reid, R.P.; Bebout, B.M.; Hoeft, S.E.; Macintyre, I.G.; Thompson, J.A. Formation of lithified micritic laminae in modern marine stromatolites (Bahamas): The role of sulfur cycling. Am. Mineral. 1998, 83, 1482–1493. [Google Scholar] [CrossRef]
  14. Visscher, P.T.; Stolz, J.F. Microbial mats as bioreactors: Populations, processes, and products. Palaeogeogr. Palaeoclimatol. Palaeoecol. 2005, 219, 87–100. [Google Scholar] [CrossRef]
  15. Lyons, W.B.; Long, D.T.; Hines, M.E.; Gaudette, H.E.; Armstrong, P.B. Calcification of cyanobacterial mats in Solar Lake, Sinai. Geology 1984, 12, 623–626. [Google Scholar] [CrossRef]
  16. Gallagher, K.L.; Kading, T.J.; Braissant, O.; Dupraz, C.; Visscher, P.T. Inside the alkalinity engine: The role of electron donors in the organomineralization potential of sulfate-reducing bacteria. Geobiology 2012, 10, 518–530. [Google Scholar] [CrossRef] [PubMed]
  17. Dupraz, C.; Reid, R.P.; Braissant, O.; Decho, A.W.; Norman, R.S.; Visscher, P.T. Processes of carbonate precipitation in modern microbial mats. Earth Sci. Rev. 2009, 96, 141–162. [Google Scholar] [CrossRef]
  18. Reid, P.; Dupraz, C.D.; Visscher, P.T.; Sumner, D.Y. Microbial Processes Forming Marine Stromatolites. In Fossil and Recent Biofilms: A Natural History of Life on Earth; Krumbein, W.E., Paterson, D.M., Zavarzin, G.A., Eds.; Springer: Dordrecht, The Netherlands, 2003; pp. 103–118. ISBN 978-94-017-0193-8. [Google Scholar]
  19. Dupraz, C.; Visscher, P.T. Microbial lithification in marine stromatolites and hypersaline mats. Trends Microbiol. 2005, 13, 429–438. [Google Scholar] [CrossRef] [PubMed] [Green Version]
  20. Decho, A.W. Microbial exopolymer secretions in ocean environments: Their role(s) in food webs and marine processes. Oceanogr. Mar. Biol. 1990, 28, 9–16. [Google Scholar]
  21. Braissant, O.; Cailleau, G.; Dupraz, C.; Verrecchia, E.P. Bacterially induced mineralization of calcium carbonate in terrestrial environments: the role of exopolysaccharides and amino acids. J. Sediment. Res. 2003, 73, 485–490. [Google Scholar] [CrossRef]
  22. Braissant, O.; Decho, A.W.; Przekop, K.M.; Gallagher, K.L.; Glunk, C.; Dupraz, C.; Visscher, P.T. Characteristics and turnover of exopolymeric substances in a hypersaline microbial mat. FEMS Microbiol. Ecol. 2009, 67, 293–307. [Google Scholar] [CrossRef] [Green Version]
  23. Reid, R.P.; Visscher, P.T.; Decho, A.W.; Stolz, J.F.; Bebout, B.M.; Dupraz, C.; Macintyre, I.G.; Paerl, H.W.; Pinckney, J.L.; Prufert-Bebout, L.; et al. The role of microbes in accretion, lamination and early lithification of modern marine stromatolites. Nature 2000, 406, 989–992. [Google Scholar] [CrossRef]
  24. Dupraz, C.; Visscher, P.T.; Baumgartner, L.K.; Reid, R.P. Microbe–mineral interactions: Early carbonate precipitation in a hypersaline lake (Eleuthera Island, Bahamas). Sedimentology 2004, 51, 745–765. [Google Scholar] [CrossRef]
  25. Bouton, A.; Vennin, E.; Pace, A.; Bourillot, R.; Dupraz, C.; Thomazo, C.; Brayard, A.; Désaubliaux, G.; Visscher, P.T. External controls on the distribution, fabrics and mineralization of modern microbial mats in a coastal hypersaline lagoon, Cayo Coco (Cuba). Sedimentology 2016, 63, 972–1016. [Google Scholar] [CrossRef]
  26. Pace, A.; Bourillot, R.; Bouton, A.; Vennin, E.; Braissant, O.; Dupraz, C.; Duteil, T.; Bundeleva, I.; Patrier, P.; Galaup, S.; et al. Formation of stromatolite lamina at the interface of oxygenic–anoxygenic photosynthesis. Geobiology 2018, 16, 378–398. [Google Scholar] [CrossRef] [PubMed]
  27. Merz-Preiß, M.; Riding, R. Cyanobacterial tufa calcification in two freshwater streams: Ambient environment, chemical thresholds and biological processes. Sediment. Geol. 1999, 126, 103–124. [Google Scholar] [CrossRef]
  28. Kremer, B.; Kazmierczak, J.; Stal, L.J. Calcium carbonate precipitation in cyanobacterial mats from sandy tidal flats of the North Sea. Geobiology 2008, 6, 46–56. [Google Scholar] [CrossRef] [PubMed]
  29. Kaźmierczak, J.; Fenchel, T.; Kühl, M.; Kempe, S.; Kremer, B.; Łącka, B.; Małkowski, K. CaCO3 precipitation in multilayered cyanobacterial mats: clues to explain the alternation of micrite and sparite layers in calcareous stromatolites. Life 2015, 5, 744–769. [Google Scholar] [CrossRef]
  30. Kühl, M.; Fenchel, T.; Kazmierczak, J. Growth, Structure and Calcification Potential of an Artificial Cyanobacterial Mat. In Fossil and Recent Biofilms: A Natural History of Life on Earth; Krumbein, W.E., Paterson, D.M., Zavarzin, G.A., Eds.; Springer: Dordrecht, The Netherlands, 2003; pp. 77–102. ISBN 978-94-017-0193-8. [Google Scholar]
  31. Aloisi, G.; Gloter, A.; Krüger, M.; Wallmann, K.; Guyot, F.; Zuddas, P. Nucleation of calcium carbonate on bacterial nanoglobules. Geology 2006, 34, 1017–1020. [Google Scholar] [CrossRef]
  32. Bundeleva, I.A.; Shirokova, L.S.; Bénézeth, P.; Pokrovsky, O.S.; Kompantseva, E.I.; Balor, S. Calcium carbonate precipitation by anoxygenic phototrophic bacteria. Chem. Geol. 2012, 291, 116–131. [Google Scholar] [CrossRef]
  33. Liang, A.; Paulo, C.; Zhu, Y.; Dittrich, M. CaCO3 biomineralization on cyanobacterial surfaces: Insights from experiments with three Synechococcus strains. Colloids Surf. B Biointerfaces 2013, 111, 600–608. [Google Scholar] [CrossRef]
  34. Bundeleva, I.A.; Shirokova, L.S.; Pokrovsky, O.S.; Bénézeth, P.; Ménez, B.; Gérard, E.; Balor, S. Experimental modeling of calcium carbonate precipitation by cyanobacterium Gloeocapsa sp. Chem. Geol. 2014, 374–375, 44–60. [Google Scholar] [CrossRef]
  35. Balci, N.; Menekşe, M.; Karagüler, N.G.; Sönmez, M.Ş.; Meister, P. Reproducing authigenic carbonate precipitation in the hypersaline Lake Acıgöl (Turkey) with microbial cultures. Geomicrobiol. J. 2016, 33, 758–773. [Google Scholar] [CrossRef]
  36. Balci, N.; Demirel, C. Formation of carbonate nanoglobules by a mixed natural culture under hypersaline conditions. Minerals 2016, 6, 122. [Google Scholar] [CrossRef]
  37. Freytet, P. Les tufs de la vallée de la Mérantaise. Bull. Société Versaill. Sci. Nat. 1989, 16, 81–99. [Google Scholar]
  38. Roche, A.; Vennin, E.; Bundeleva, I.; Bouton, A.; Payandi-Rolland, D.; Amiotte-Suchet, P.; Gaucher, E.C.; Courvoisier, H.; Visscher, P.T. The role of the substrate on the mineralization potential of microbial mats in a modern freshwater river (Paris Basin, France). Minerals 2019, 9, 359. [Google Scholar] [CrossRef]
  39. Parks, S.T. Microbial Life in a Winogradsky Column: From Lab Course to Diverse Research Experience. J. Microbiol. Biol. Educ. 2015, 16, 82–84. [Google Scholar] [CrossRef] [PubMed] [Green Version]
  40. Esteban, D.J.; Hysa, B.; Bartow-McKenney, C. Temporal and spatial distribution of the microbial community of Winogradsky columns. PLoS ONE 2015, 10, e0134588. [Google Scholar] [CrossRef] [PubMed]
  41. Stanier, R.Y.; Kunisawa, R.; Mandel, M.; Cohen-Bazire, G. Purification and properties of unicellular blue-green algae (order Chroococcales). Bacteriol. Rev. 1971, 35, 171–205. [Google Scholar] [PubMed]
  42. Wang, Y.; Qian, P.Y. Conservative fragments in bacterial 16S rRNA genes and primer design for 16S ribosomal DNA amplicons in metagenomic studies. PLoS ONE 2009, 4, e7401. [Google Scholar] [CrossRef]
  43. Bolger, A.M.; Lohse, M.; Usadel, B. Trimmomatic: A flexible trimmer for Illumina sequence data. Bioinformatics 2014, 30, 2114–2120. [Google Scholar] [CrossRef]
  44. Aronesty, E. Ea-Utils: Command-Line Tools for Processing Biological Sequencing Data; Expression Analysis: Durham, NC, USA, 2011. [Google Scholar]
  45. Schloss, P.D.; Westcott, S.L.; Ryabin, T.; Hall, J.R.; Hartmann, M.; Hollister, E.B.; Lesniewski, R.A.; Oakley, B.B.; Parks, D.H.; Robinson, C.J.; et al. Introducing mothur: Open-source, platform-independent, community-supported software for describing and comparing microbial communities. Appl. Environ. Microbiol. 2009, 75, 7537–7541. [Google Scholar] [CrossRef]
  46. Edgar, R.C.; Haas, B.J.; Clemente, J.C.; Quince, C.; Knight, R. UCHIME improves sensitivity and speed of chimera detection. Bioinformatics 2011, 27, 2194–2200. [Google Scholar] [CrossRef] [PubMed] [Green Version]
  47. Quast, C.; Pruesse, E.; Yilmaz, P.; Gerken, J.; Schweer, T.; Yarza, P.; Peplies, J.; Glöckner, F.O. The SILVA ribosomal RNA gene database project: Improved data processing and web-based tools. Nucleic Acids Res. 2013, 41, D590–D596. [Google Scholar] [CrossRef] [PubMed]
  48. Gran, G. Equivalence volumes in potentiometric titrations. Anal. Chim. Acta 1988, 206, 111–123. [Google Scholar] [CrossRef]
  49. Stumm, W.; Morgan, J. An Introduction Emphasizing Chemical Equilibria in Natural Waters, Aquatic Chemistry; John Wiley and Sons: New York, NY, USA, 1981. [Google Scholar]
  50. Cantrell, K.J.; Serkiz, S.M.; Perdue, E.M. Evaluation of acid neutralizing capacity data for solutions containing natural organic acids. Geochim. Cosmochim. Acta 1990, 54, 1247–1254. [Google Scholar] [CrossRef]
  51. Arp, G.; Reimer, A.; Reitner, J. Photosynthesis-induced biofilm calcification and calcium concentrations in Phanerozoic Oceans. Science 2001, 292, 1701–1704. [Google Scholar] [CrossRef]
  52. Parkhurst, D.L.; Appelo, C. User’s Guide to PHREEQC (Version 2): A Computer Program for Speciation, Batch-Reaction, One-Dimensional Transport, and Inverse Geochemical Calculations; U.S. Department of the Interior: Denver, CO, USA, 1999. [Google Scholar]
  53. The Proteobacteria. In Bergey’s Manual of Systematic Bacteriology, 2nd ed.; Garrity, G. (Ed.) Springer: New York, NY, USA, 2005; Volume 2, ISBN 978-0-387-95040-2. [Google Scholar]
  54. Pedley, M.; Rogerson, M.; Middleton, R. Freshwater calcite precipitates from in vitro mesocosm flume experiments: A case for biomediation of tufas. Sedimentology 2009, 56, 511–527. [Google Scholar] [CrossRef]
  55. Braissant, O.; Cailleau, G.; Aragno, M.; Verrecchia, E.P. Biologically induced mineralization in the tree Milicia excelsa (Moraceae): Its causes and consequences to the environment. Geobiology 2004, 2, 59–66. [Google Scholar] [CrossRef]
  56. Jones, B. Review of aragonite and calcite crystal morphogenesis in thermal spring systems. Sediment. Geol. 2017, 354, 9–23. [Google Scholar] [CrossRef]
  57. Decho, A.W. Exopolymer microdomains as a structuring agent for heterogeneity within Microbial biofilms. In Microbial Sediments; Riding, R.E., Awramik, S.M., Eds.; Springer: Berlin, Germany; Heidelberg, Germany, 2000; pp. 9–15. ISBN 978-3-662-04036-2. [Google Scholar]
  58. Marvasi, M.; Visscher, P.T.; Casillas Martinez, L. Exopolymeric substances (EPS) from Bacillus subtilis: Polymers and genes encoding their synthesis. FEMS Microbiol. Lett. 2010, 313, 1–9. [Google Scholar] [CrossRef]
  59. Dupraz, C.; Reid, R.P.; Visscher, P.T. Microbialites, Modern. In Encyclopedia of Geobiology; Reitner, J., Thiel, V., Eds.; Springer: Dordrecht, The Netherlands, 2011; pp. 617–635. ISBN 978-1-4020-9211-4. [Google Scholar]
  60. Tsuneda, S.; Aikawa, H.; Hayashi, H.; Yuasa, A.; Hirata, A. Extracellular polymeric substances responsible for bacterial adhesion onto solid surface. FEMS Microbiol. Lett. 2003, 223, 287–292. [Google Scholar] [CrossRef] [Green Version]
  61. Turner, E.C.; Jones, B. Microscopic calcite dendrites in cold-water tufa: Implications for nucleation of micrite and cement. Sedimentology 2005, 52, 1043–1066. [Google Scholar] [CrossRef]
  62. Gradziński, M. Factors controlling growth of modern tufa: Results of a field experiment. Geol. Soc. Lond. Spec. Publ. 2010, 336, 143–191. [Google Scholar] [CrossRef]
  63. Tourney, J.; Ngwenya, B.T. Bacterial extracellular polymeric substances (EPS) mediate CaCO3 morphology and polymorphism. Chem. Geol. 2009, 262, 138–146. [Google Scholar] [CrossRef]
  64. Prasanna, R.; Pattnaik, S.; Sugitha, T.C.K.; Nain, L.; Saxena, A.K. Development of cyanobacterium-based biofilms and their in vitro evaluation for agriculturally useful traits. Folia Microbiol. 2011, 56, 49–58. [Google Scholar] [CrossRef] [PubMed]
  65. Fenchel, T.; Kühl, M. Artificial Cyanobacterial Mats: Growth, Structure, and Vertical Zonation Patterns. Microb. Ecol. 2000, 40, 85–93. [Google Scholar] [Green Version]
  66. Visscher, P.T.; van Gemerden, H. Production and consumption of dimethylsulfoniopropionate in marine microbial mats. Appl. Environ. Microbiol. 1991, 57, 3237–3242. [Google Scholar] [PubMed]
  67. Stal, L.J.; Moezelaar, R. Fermentation in cyanobacteria. FEMS Microbiol. Rev. 1997, 21, 179–211. [Google Scholar] [CrossRef] [Green Version]
  68. Decho, A.W.; Visscher, P.T.; Reid, R.P. Production and cycling of natural microbial exopolymers (EPS) within a marine stromatolite. In Geobiology: Objectives, Concepts, Perspectives; Noffke, N., Ed.; Elsevier: Amsterdam, The Netherlands, 2005; pp. 71–86. ISBN 978-0-444-52019-7. [Google Scholar]
  69. Bateson, M.M.; Ward, D.M. Photoexcretion and fate of glycolate in a hot spring cyanobacterial mat. Appl. Environ. Microbiol. 1988, 54, 1738–1743. [Google Scholar]
Figure 1. Images of (a) the sampling location in the stream (2°07’16.48”E and 48°43’06.03”N), located 21 km to the Southwest of Paris and (b) a close-up view of the stream showing fine-grained sediments and green biofilm to the right in the stream bed. Laminated microbial deposits encrusting (c) a pebble and (d) a wooden stick; (e) the Winogradsky column filled with shredded paper (bottom left), microbial mat and sediments; the column was deployed to enrich for a cyanobacterial biofilm used in the laboratory experiment and (f) a cyanobacterial biofilm on a soft agar surface in a Petri dish (second stage of enrichment (see Section 2.2).
Minerals 09 00409 g001
Figure 2. Location of the study site.
Minerals 09 00409 g002
Figure 3. Images of (A) Filamentous (Oscillatoriaceae) (black arrows) and coccoid Gloeocapsa-like cyanobacteria (white arrows) viewed under light microscopy; SEM observations of (B) filamentous Oscillatoriaceae-type cyanobacteria, (C) coccoid Gloeocapsa-like cyanobacteria (white arrows) (D) pennate diatoms near cyanobacterial filaments in an EPS matrix, (E) presumably heterotrophic bacteria (white arrows) covered in EPS matrix and (F) a large cyanobacterial filament, likely a Phormidium sp. (black arrows).
Minerals 09 00409 g003
Figure 4. SEM images of carbonate precipitates in the experimental biofilm of Treatments (AF) at Day 19 and Day 40. SI indicates the saturation index of calcite for each sample.
Minerals 09 00409 g004
Figure 5. SEM images of the four mesocrystal shapes that form the micro-peloids: (A) rhombic/polygonal, (B) trigonal, (C) needle and (D) spherical carbonate crystals (white circles) composed of nano-globules. All mesocrystals were covered by EPS (white arrows).
Minerals 09 00409 g005
Figure 6. SEM images of (A) rhombic sparite crystals wrapped in EPS and (B) a thin sheet (white arrow) of carbonate precipitated directly on the surface of a Phormidium-like filament.
Minerals 09 00409 g006
Figure 7. Spectra showing the chemical composition of the crystals, as analyzed by (a) EDS, (1 and 3) of micro-peloids and (2) of a rhombic crystal, (b) FT-IR, showing calcite peaks in a micro-peloid at 1408, 872, 711 cm−1 and (c) a mixed signal of calcite and D-Raffinose pentahydrate.
Minerals 09 00409 g007
Figure 8. Natural samples observed (A) in thin section, showing micro-peloids and 10-μm large, Phormidium-like filament encrusted in carbonate and (B,C) under SEM; (B) shows imprints of Phormidium-like filaments and (C) depicts the encrusting carbonate on the surface of the same filaments. Note the differences in scale.
Minerals 09 00409 g008
Figure 9. SEM images of elongated crystallite dendrites (white arrows) forming around (A) a longitudinal and (B) a transversal cut of Phormidiaceae filament voids.
Minerals 09 00409 g009
Figure 10. SEM images of (A) voids left by Oscillatoriaceae-like filaments and (B) elongated crystallite dendrites (white arrows) associated with the Oscillatoria casts.
Minerals 09 00409 g010
Figure 11. SEM images of (A) a rhombic polycrystalline sparite crystal from a natural sample and (B) diverse diatom species observed in a natural sample.
Minerals 09 00409 g011
Figure 12. Time series of key physicochemical properties during the precipitation experiment (the data shown for Treatment E as a typical example); temporal evolution of (a) the pH, (b) the alkalinity, (c) the Ca2+ concentration and (d) the calcite saturation index (SI). Closed symbols (black and grey) are replicate biological incubations, open symbols indicate the abiotic controls. The observed alkalinity increase in the abiotic control after three days is surprising and cannot be accounted for. When viewing the trend of the alkalinity in all treatments (Figure S1b), a constant value or very small increase with time can be seen. Consequently, we can assume an analytical error resulted in this outlying value. Since no precipitation was observed in any of the controls, this does not impact any of our observations nor our conceptual model.
Minerals 09 00409 g012
Table 1. Physicochemical characteristics at the biological sampling site during the four field excursions. SI = saturation index.
Physicochemical Attribute 2016 (Autumn/Winter)2017 (Spring)
OctoberNovemberDecemberMarch
Water temperature (°C)10.87.26.58.2
pH8.318.248.608.03
Alkalinity (meq/L)5.565.343.506.61
Conductivity (μS/cm)712704704667
Dissolved O2 (mg/L)10.814.2-10.2
Ca2+ (mg/L)142.2149.7104.988.1
K+ (mg/L)3.53.62.82.8
Mg2+ (mg/L)13.814.29.910.8
Na+ (mg/L)19.319.713.513.8
Cl (mg/L)36.034.024.723.4
NO3 (mg/L)90.190.912.917.3
SO42− (mg/L)22.818.368.561.4
SI calcite1.30 ± 0.331.19 ± 0.251.23 ± 0.060.90 ± 0.30
SI aragonite1.16 ± 0.301.04 ± 0.301.08 ± 0.050.75 ± 0.25
Table 2. Initial conditions for precipitation experiment, showing the different Treatments A–F.
Treatment *pHCa2+, mg/LAlkalinity, meq/LSIcalcite
A8.7600.930
B8.32501.340.63
C8.60502.871.17
D8.65504.621.38
E8.351002.491.15
F8.401502.661.36
* Each treatment consisted of three incubations: two biological (duplicates) with a soft agar biofilm and one abiotic blank with soft agar only as a control treatment.
Table 3. Key cyanobacterial metabolisms and their potential effect on the physicochemical characteristics and carbonate precipitation.
Cyanobacterial MetabolismExample Reaction Equation(s)LightpHAlkalinity[Ca2+]Precipitation Potential
1. Carbon dioxide fixationCO2 + RuBP → 2PGA (→ → glycogen)
HCO3→ CO2 + OH
-
2. PhotorespirationO2 + RuBP → PGA + glycolate↑/?
3. EPS productionCO2 + RuBP → 2PGA → →(glycogen) → → EPS-/↑-↓(fresh)/↑(degraded)
4. Fermentation Trehalose → → glucose → →acetate↑/-
Glycogen → → formate
    → → acetate ↑/-
    → → lactate
    → → ethanol ---
    → → H2
and
So → H2S --
(5. Induction of mineral precipitation)CO2 + RuBP → 2PGA
HCO3 → CO2 + OH
HCO3 + Ca2+ →CaCO3 + H+
H+ + OH → H2O
-
Green reaction equations indicate cyanobacterial metabolisms; equations in black indicate chemical reactions; RuBP = Ribulose 1,5-bisphosphate, PGA = phosphoglycerate (Calvin Cycle reactant and product, respectively); ✓/✗ indicates requirement of presence or absence of light; ? = unknown effect; ↑/↓ shows increasing/decreasing effect; - = no (pronounced) effect. A brief description of the respective metabolisms [10,14,50,53,59,67,68]: (1) cyanobacterial removal of CO2 shifts the carbonate equilibrium and results in chemical OH production; (2) glycolate (CH2(OH)COO) excreted during photorespiration can affect the alkalinity (when present as dissociated acid), but also binds Ca2+; if [glycolate] > [Ca2+], the alkalinity may increase; (3) EPS production requires light and may increase the pH if HCO3 is removed during photosynthesis (see Metabolism 1); functional groups in fresh EPS bind Ca2+; degradation of EPS releases HCO3 and Ca2+; although negatively charged functional groups exist in EPS, this complex polymer is most likely not included in Gran titrations, so the alkalinity is probably not affected by this compound; (4) fermentation of osmolytes (e.g., trehalose) and storage polymers (e.g., glycogen) yields negatively-charged products (formate, acetate, lactate), which affect the pH, alkalinity and can bind Ca2+, but also neutral compounds (ethanol, H2); in anoxic conditions (night -time), elemental sulfur (So) can be electron acceptor yielding a weak acid HS (5) carbonate precipitation is not really a specific metabolism, but can result from a combination of metabolism 1–4.

