Density of NaAlSi2O6 Melt at High Pressure and Temperature Measured by In-Situ X-ray Microtomography


1
Department of Earth, Environmental, and Planetary Sciences, Case Western Reserve University, Cleveland, OH 44106, USA
2
Department of Earth and Space Sciences, Southern University of Science and Technology, Shenzhen 518055, China
3
Center for Advanced Radiation Sources, The University of Chicago, Chicago, IL 60637, USA
*
Author to whom correspondence should be addressed.
Minerals 2020, 10(2), 161; https://doi.org/10.3390/min10020161
Submission received: 17 January 2020
/
Revised: 3 February 2020
/
Accepted: 10 February 2020
/
Published: 12 February 2020
(This article belongs to the Special Issue Properties of Melt and Minerals at High Pressures and High Temperatures)
Abstract
:In this study, the volumetric compression of jadeite (NaAlSi2O6) melt at high pressures was determined by three-dimensional volume imaging using the synchrotron-based X-ray microtomography technique in a rotation-anvil device. Combined with the sample mass, measured using a high-precision analytical balance prior to the high-pressure experiment, the density of jadeite melt was obtained at high pressures and high temperatures up to 4.8 GPa and 1955 K. The density data were fitted to a third-order Birch-Murnaghan equation of state, resulting in a best-fit isothermal bulk modulus of GPa and its pressure derivative of . Comparison with data for silicate melts of various compositions from the literature shows that alkali-rich, polymerized melts are generally more compressible than alkali-poor, depolymerized ones. The high compressibility of jadeite melt at high pressures implies that polymerized sodium aluminosilicate melts, if generated by low-degree partial melting of mantle peridotite at ~250–400 km depth in the deep upper mantle, are likely denser than surrounding mantle materials, and thus gravitationally stable.
1. Introduction
Silicate melts are major agents for transferring heat and chemical species in the interior of Earth and other terrestrial planets, playing a critical role in planetary differentiation. The density of silicate melts is a key factor controlling the direction of magma migration during the differentiation process. Depending on the density contrast between silicate melts and the ambient mantle, melts can either migrate upwards or sink into the deep interior, resulting in quite different geodynamical scenarios [1,2,3]. For magmas that erupt to the surface, knowing their density as a function of pressure is essential to model their rates of segregation from source regions and the subsequent migration to the surface [4]. For deep melts, which have been suggested by geophysical observations, for example, at the lithosphere-asthenosphere boundary [5,6], atop the 410 km [7] and 660 km [8] discontinuities, and in the ultra-low velocity zone above the core-mantle boundary [9], knowledge of the density of silicate melts at high pressures is essential to evaluate their gravitational stability in the mantle. In addition, the early history of the Earth and the Moon is believed to be characterized by at least one stage of large-scale melting of the mantle, resulting in a magma ocean, formed in the aftermath of the Moon-forming giant impact event [10,11]. In order to model the solidification of the early magma ocean, we need to know the high-pressure density of the magmas.
Alkalis (Na2O and K2O) are important components of silicate melts and their presence in mantle rocks can significantly lower the solidus of the mantle peridotite [12]. Due to their incompatible nature, alkalis are relatively concentrated in silicate melts (up to 6–13 wt. % alkalis [13,14]), when a small degree of partial melting of peridotite is produced. The jadeite composition, NaAlSi2O6 (15.3 wt. % Na2O content), is relevant to alkali-rich silicate melts in the mantle, especially low-degree partial melts [15,16,17]. Its melting behavior and transport properties (e.g., viscosity, diffusivity) have been experimentally studied up to 16.5 and 5.5 GPa, respectively [18,19,20,21]. The phase transition, structure, and compressibility of the crystalline jadeite has also been extensively studied due to its importance in high-pressure metamorphic rocks and as a major clinopyroxene group mineral in the mantle [22,23,24,25]. However, the density of jadeite melt, as well as the effect of alkali components on the density of silicate melts at high pressures more generally, is poorly determined, due to experimental difficulties. The high viscosity, high reactivity, and low density of alkali-rich melts hinder the application of some of the most widely used melt density measuring techniques, such as the sink-float [1,26,27,28,29] and shock-wave [30,31,32] techniques. Until now, the only experimental data on the density of jadeite melt at high pressures were obtained by Sakamaki [33] using the X-ray absorption method [34,35,36,37], in which the density was calculated from the X-ray absorption contrast between the sample and diamond lid using the Beer-Lambert law and the mass absorption coefficients, but his results are not in agreement with a recent first-principles molecular dynamics (FPMD) study on jadeite melt [38].
Other than the aforementioned techniques, the X-ray microtomography technique has the capability to directly measure the 3D volume of samples in any states including amorphous phases at high pressures [39,40,41,42]. However, application of this technique has so far been limited to silicate glasses [39,40,43] and low melting temperature liquids, such as gallium liquid [41,42]. Because of the relatively low X-ray absorption of silicate melts, a long duration (up to a few hours) would be required in traditional tomography setups employing a monochromatic X-ray beam and light sample capsuling materials. Such long durations thus prevent reliable measurements on the highly mobile and reactive silicate melts at very high temperatures (likely higher than 1500 K).
In this study, we have made new technical developments using a modified Paris-Edinburgh (PE) cell assembly in a tomographic apparatus to enable volume measurements on jadeite melt up to 4.8 GPa and 1955 K. We employed a pink X-ray beam [44] to image the molten sample, providing much faster data collection than previous studies [39,40] using a monochromatic beam. This is critical to reducing possible chemical reactions of silicate melts with surrounding materials at very high temperatures. In order to obtain sufficient spatial resolution given the short imaging duration, we used a relatively strongly absorbing material (molybdenum) to encapsulate the melt sample and to provide sharp X-ray absorption contrast with the low-absorbing jadeite melt. Combined with the sample mass measured at room pressure before loading to the cell, new density data of jadeite melt at high pressures and temperatures were obtained. Our results can help resolve the discrepancy in density estimates for jadeite melt, and to place constraints on the density of sodium-rich silicate melts under upper mantle conditions. Besides, the experimental technique developed in this study for melt density measurements may be readily extended to other melt compositions such as volatile-bearing melts and carbonatite melts, expanding the composition space for melt density measurements significantly, which is essential for developing a unified model for the equation of state (EOS) of mantle melts at high pressures [45].
2. Materials and Methods
2.1. Starting Materials
Reagent-grade powders of Na2CO3, Al2O3, and SiO2 were mixed in appropriate proportions according to the jadeite composition and ground in ethanol for ~2 hrs. The mixture was dried and decarbonated at 1173 K in a high-temperature box furnace for ~24 hrs using a platinum crucible. The full release of CO2 was confirmed by checking the mixture weight before and after decarbonation. The decarbonated mixture was then fused at 1873 K for ~4 hrs, and finally quenched to a glass. The fusion process was repeated twice to ensure homogeneity of the glass. The sodium loss during the fusion process was insignificant, as shown by the composition of the quenched experimental product (Supplementary Table S1). The resulting glass was transparent, bubble-free, and homogeneous. A perfect cylindrical glass disk with the desired outer diameter (1.6 mm) and thickness (1.0 mm) was machined from the quenched glass by using a computer numerical control (CNC)-milling machine and was used as the starting material for the experiment. The weight of the glass disk was measured by a high-precision analytical balance with a resolution of 0.01 mg (Scientech SM50). The weight measured was 4.385 ± 0.024 mg, arrived at by repeating the measurements five times.
2.2. High-Pressure Experiments
The high-pressure X-ray microtomography (HPXMT) experiments were carried out in a 250-ton hydraulic press with a tomography module installed at the GeoSoilEnviro-Center for Advanced Radiation Sources (GSECARS) Beamline 13-BM-D of the Advanced Photon Source at the Argonne National Laboratory (Lemont, IL, USA) [46,47]. Pressure was generated by two opposing PE anvils inserted in the HPXMT module. The HPXMT module allows for a full 360° rotation of the PE cell while under loads up to 50 tons, thanks to supports from the thrust bearings [46]. The detailed PE cell assembly is shown in Figure 1. Boron epoxy, which is nearly transparent to the X-ray employed in the experiments, was used as the pressure medium. A Lexan ring was placed outside the boron epoxy to prevent the extrusion of the cell materials under the axial load. A graphite sleeve was used as the heater, together with zirconia as the thermal insulator and tantalum for the electrodes. Molybdenum was chosen as the capsule material for the sample melt due to its low reactivity with silicate melts at high pressure (P) and temperature (T) conditions, as demonstrated by the use of molybdenum capsules in various experiments including sink-float density measurements [26], shock-wave experiments [30], and ultrasonic measurements [48]. Another advantage of using a molybdenum capsule is that it has relatively strong X-ray absorption to show clear contrast to silicate melts, which is critical for X-ray imaging of the sample, but not too strong absorption to allow sufficient X-ray photons passing through the sample to image sample details. No welding of the capsule was applied to prevent chemical reactions and mass loss of the sample at high welding temperatures. The capsule would simply be pressure-sealed upon compression and this provides sufficient confining of melt during the tomographic measurements, as confirmed by X-ray imaging and the quenched product analysis (see later in this section).
Since tomographic measurements require a 180° rotation of the cell assembly, it is not possible to insert a thermocouple in the cell to measure temperature during the experiments. Instead, the temperature of experiments was estimated based on the temperature-power relationships (Supplementary Figure S1) calibrated in a separate experimental run without rotating the sample, using exactly the same cell assembly as in the tomographic experiments but with a thermocouple placed in the middle of the sample. The uncertainties in the estimated temperatures are within ±100 K. The pressure of the experiments was obtained by energy-dispersive X-ray diffraction measurements of the cell parameters of the MgO pressure standard, either the MgO disk atop of the sample or the MgO ring outside the heater (the differences between the two are within 0.5 GPa), using the thermal equation of state of MgO [49]. The uncertainty in pressure mainly comes from the uncertainty in temperature measurements, and is estimated to be about ±0.5 GPa.
The high-pressure tomographic measurements on the jadeite melt were carried out at three different hydraulic ram loads, corresponding to pressures from ~1.3 to 4.8 GPa, depending on temperature. The pressure was first increased to the target load during the experiment. After the target load was reached, the sample was steadily heated up to a temperature above the melting temperature of jadeite [20] by ramping up the heating power output. After the experiment, the sample was quenched from high temperature by turning off the heater power. The quenched sample was analyzed using a field-emission scanning electron microscope (FE-SEM) at the Swagelok Center for Surface Analysis of Materials (SCSAM) of Case Western Reserve University (CWRU), Cleveland, OH, USA (FEI Nova 200 Nanolab SEM). The acceleration voltage and probe current were set at 10 kV and 15 nA, respectively. No sign of leakage of the molten sample under high P-T conditions was observed based on the secondary electron (SE) and backscattered electron (BSE) images of the quenched product (Supplementary Figure S2a), and no sign of molybdenum contamination of the sample was found based on the elemental mapping using the energy-dispersive spectroscopy (EDS) (Oxford EDS X-Max 50 sq. mm) with internal standards (Supplementary Figure S2b and Supplementary Table S1).
2.3. X-Ray Microtomography Measurements
We followed the experimental setup for the in-situ X-ray microtomography technique that was described in Yu et al. [47]. In this technique, the three-dimensional (3D) tomographic image of the sample can be reconstructed from a series of X-ray radiographic images taken while rotating the cell (hereafter referred to as a tomography scan). A pink beam (energy ~25–65 keV, mirror pitch angle ~1.2 mrad for imaging, with a 1 mm-thick Ti filter applied) was used for taking radiographic images of the sample, including its capsule. This enables significantly faster data collection than using a monochromatic beam [44] and helps reduce the time that the sample spends at high temperatures. The transmitted X-ray from the cell assembly was converted to visible light by a LuAG scintillator, reflected by a mirror, zoomed in by an objective lens, and finally detected by a charge-coupled device (CCD) camera and recorded as a 2-D image.
Before each tomography scan, the dark current—the image intensity signal recorded in absence of X-rays—was first measured in order to properly account for the background noise from the scintillator and the CCD detector. During each scan, the high-pressure cell inside the tomography module was rotated from 0° to 180° continuously, with the rotation axis perpendicular to the incident beam. The rotation rate was set to about 0.1 rpm (revolutions per minute), which is sufficiently slow to limit the blurring of images to less than 1 pixel for the exposure time of 0.045 s used in this study. Three flat field images of a dummy cell with an empty sample chamber were taken both before and after each tomography scan. The averaged flat field is then used as the intensity background to account for non-uniformities in the X-ray beams. Each tomography scan at one P-T condition takes approximately 20 min. The raw data collected for each scan are 360 frames of 16-bit images with 1920 × 1440 pixels for each image. The pixel length was calibrated to be 1.687 μm/pixel for both horizontal and vertical directions.
2.4. Tomographic Reconstruction and 3D Volume Rendering
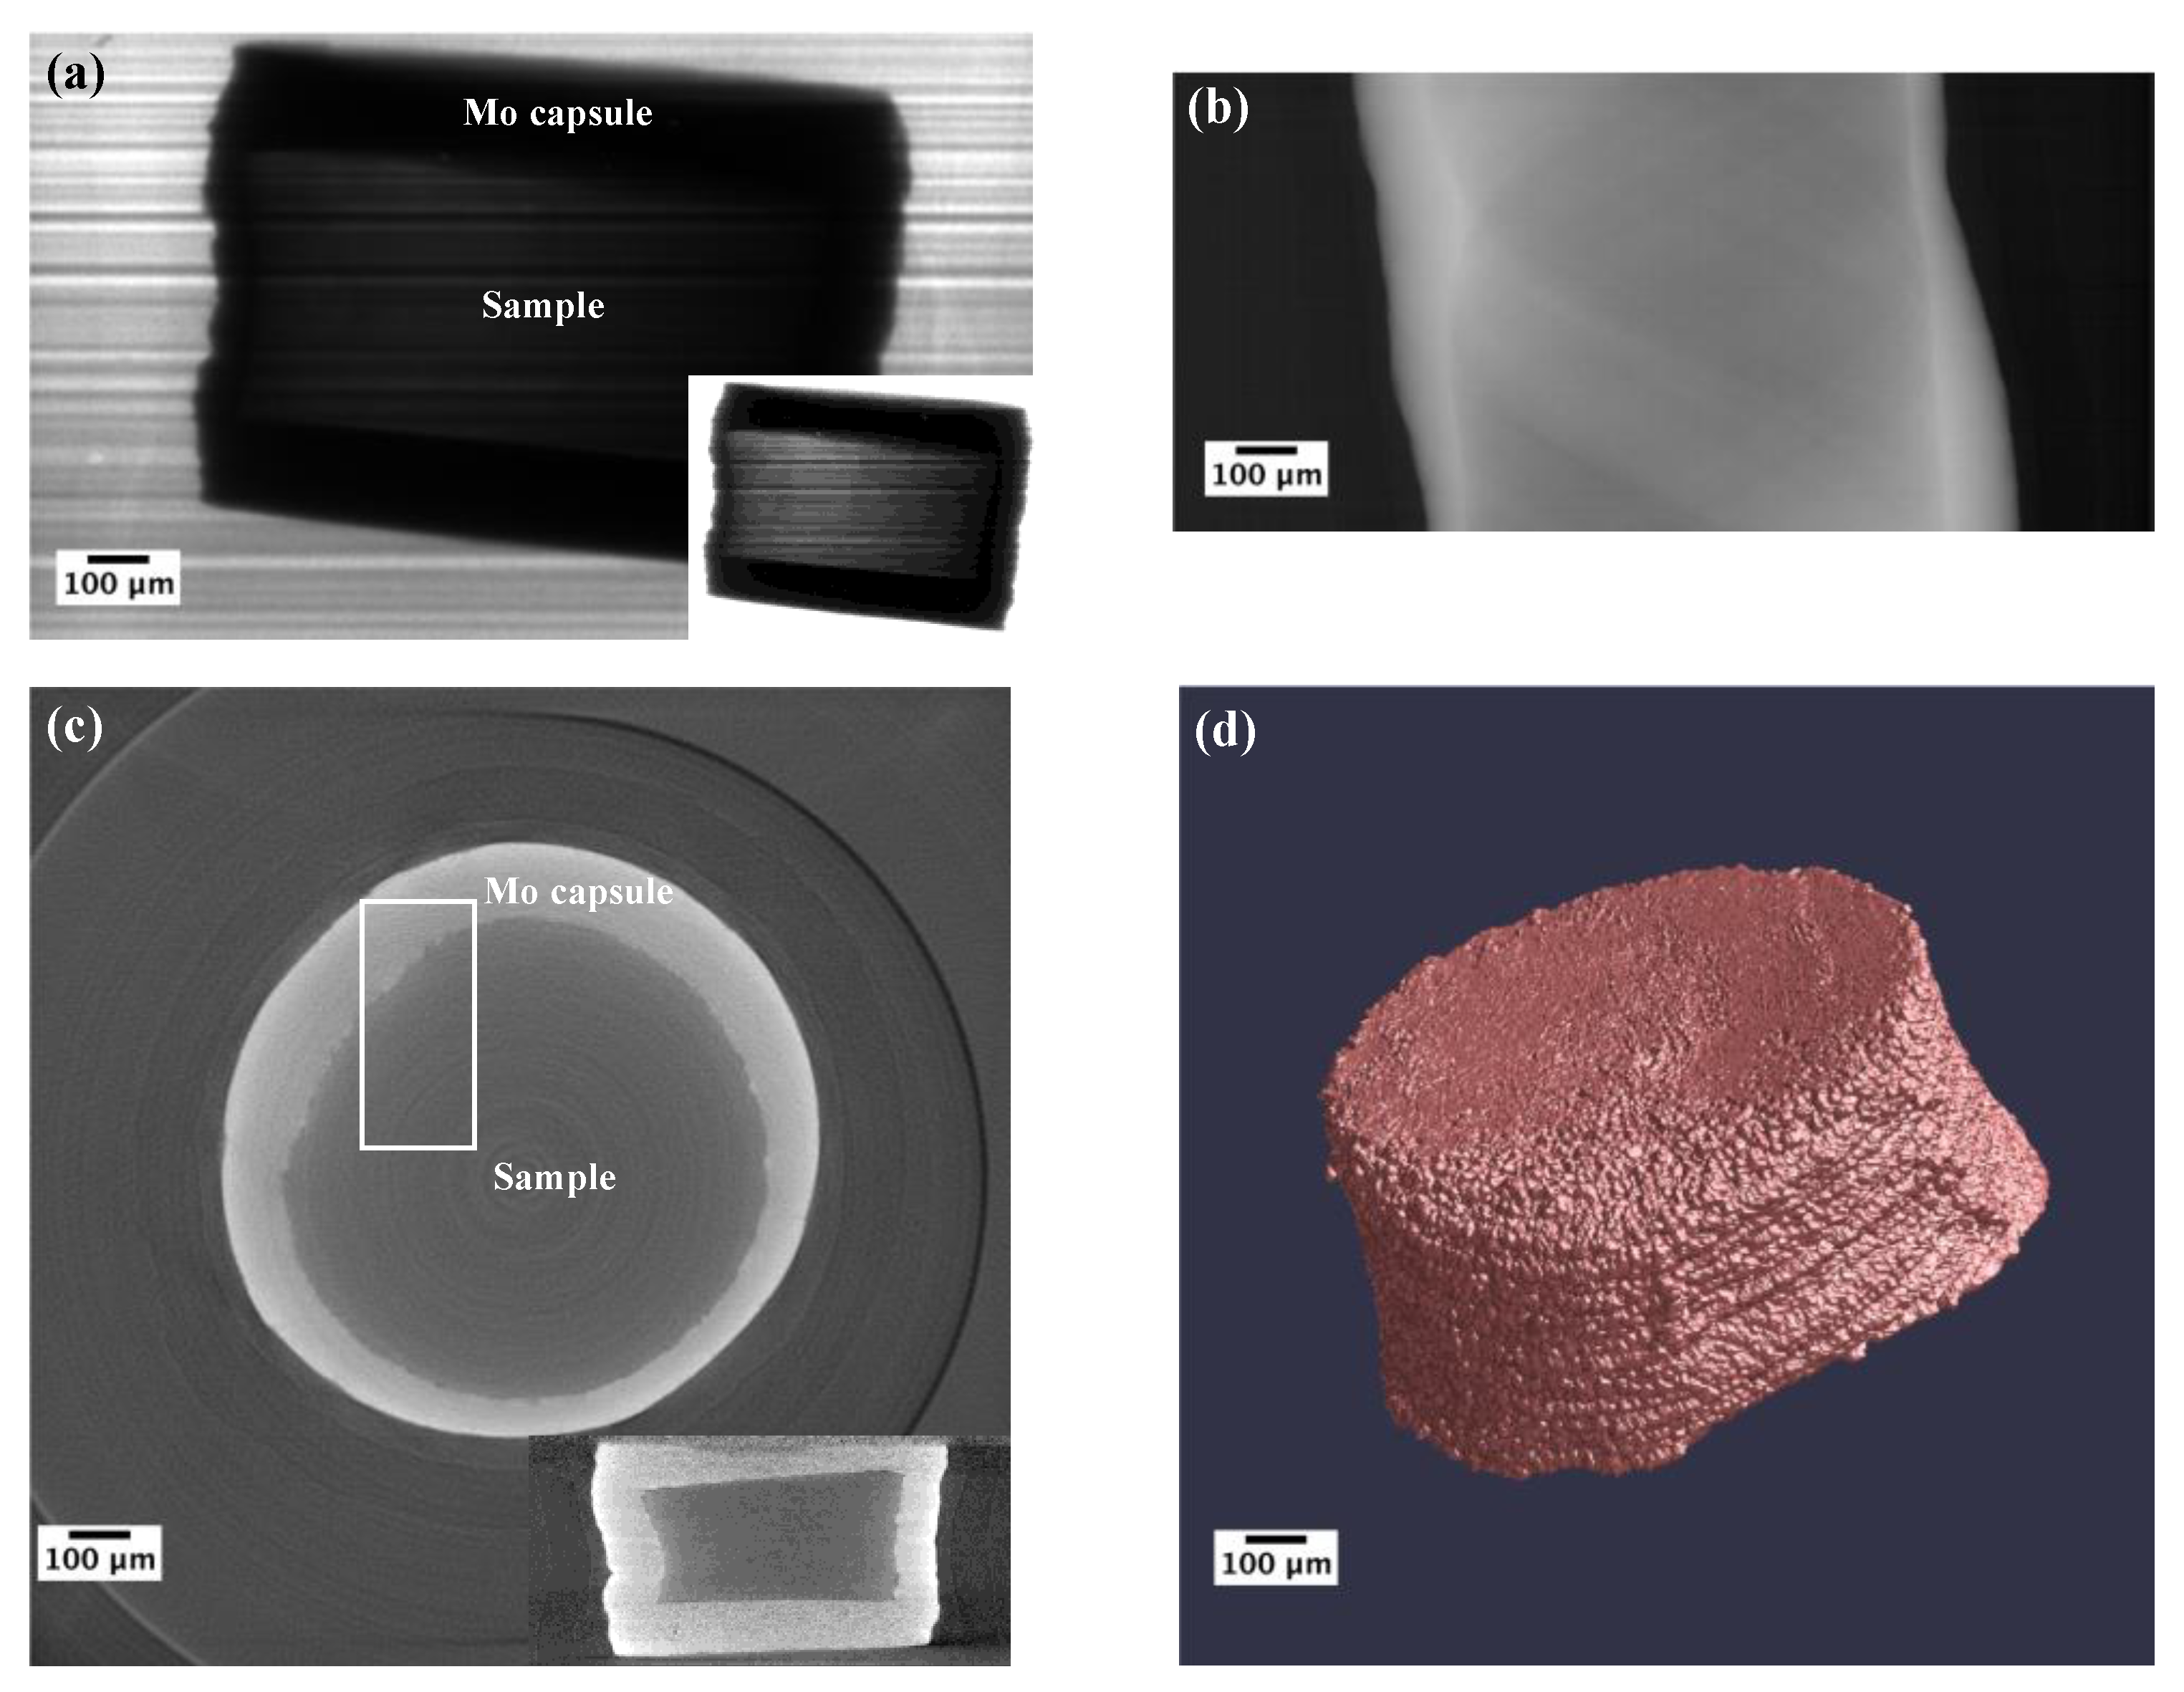
Tomography reconstruction was performed using the tomoRecon multi-threaded code available at GSECARS [50]. This code uses the high-speed Gridrec FFT algorithm and can reconstruct the slices in parallel on multiple CPU threads. Figure 2 shows the steps to transform raw images from the tomographic scans to a 3D volume rendering of the sample. First, the raw radiographic images (Figure 2a) were corrected by subtracting background dark current and flat field intensities. Then, the corrected images were combined to produce a series of sinograms for each slice of the 3D rendering, after correcting the rotation center and minimizing ring artifacts. The sinogram represents line integral of pixel intensities for a given pixel row height in each radiograph (Figure 2b). Each slice of the final 3D volume representing a 2D map of linear attenuation coefficient (Figure 2c) was then reconstructed from the sinograms using tomoRecon [50]. Figure 2c shows the reconstructed horizontal slice (viewed from the top), and the inset is a corresponding reconstructed vertical slice (viewed from the side). The sample can be clearly distinguished from the molybdenum capsule in these reconstructed slices. All these processing steps were accomplished using the IDL (Interactive Data Language) GUI (graphical user interface) program of the tomoRecon code (TOMO_DISPLAY) [51]. Finally, the reconstructed horizontal slices (Figure 2c) were imported into ImageJ (https://imagej.nih.gov/ij/) for additional filtering, and then the Blob3D software ([52]; http://www.ctlab.geo.utexas.edu/software/blob3d/) was used to separate the sample and capsule, and to get the volume rendering of the sample (Figure 2d).
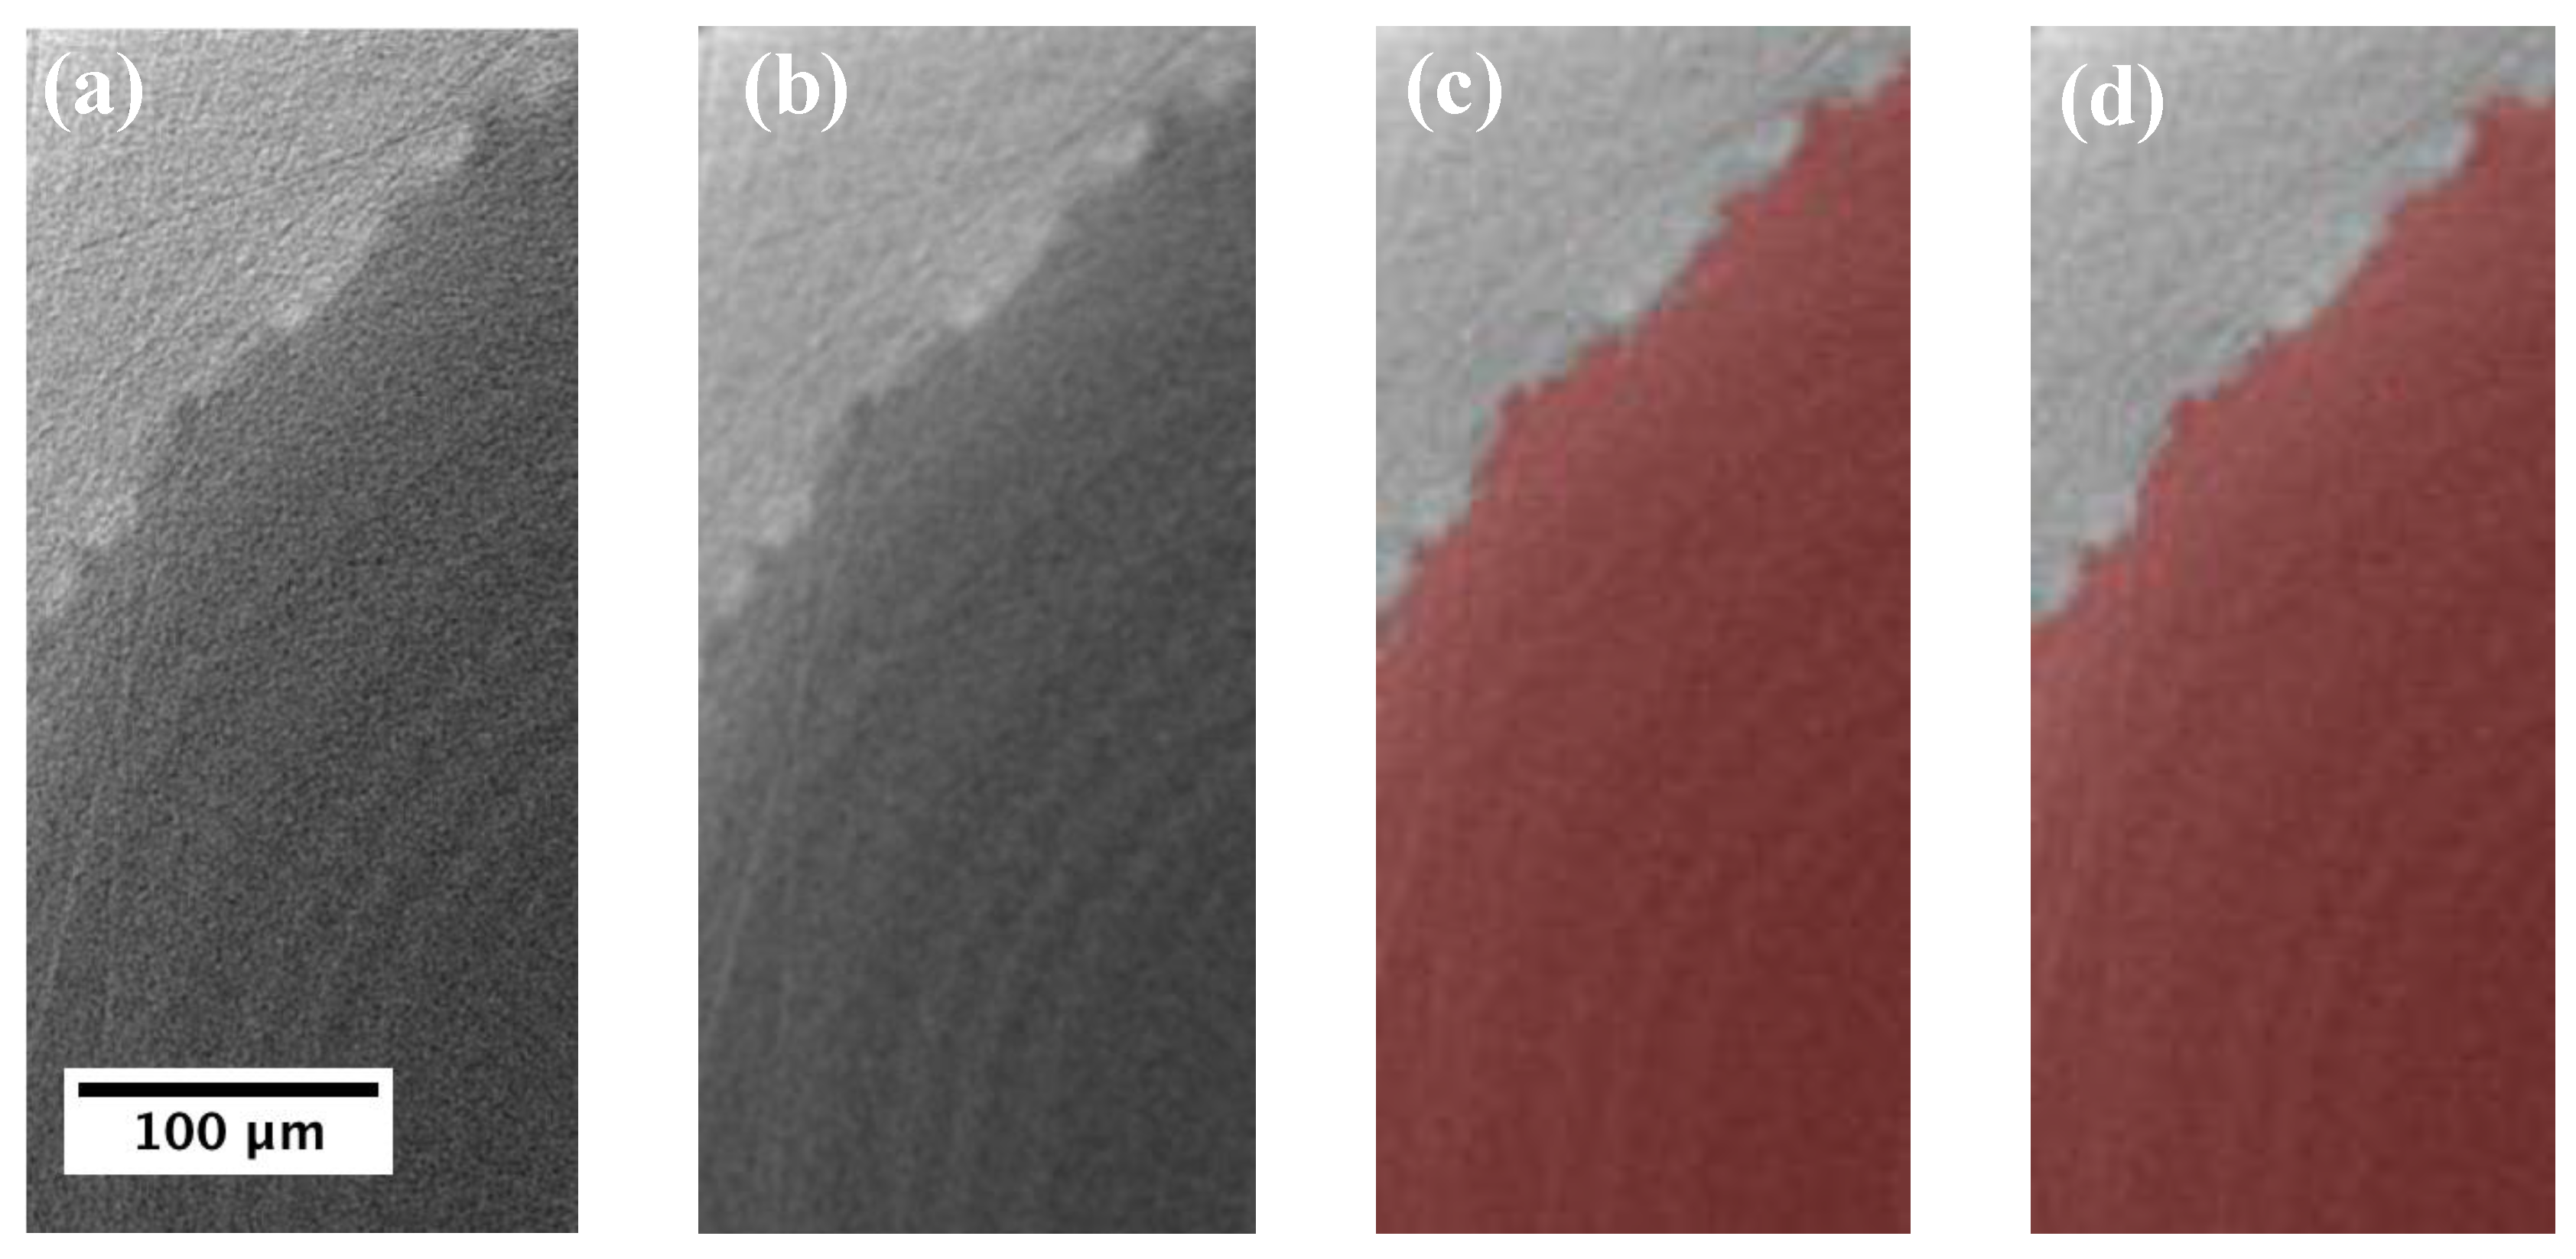
Figure 3 shows the processed images after various stages of filtering and thresholding procedures. Using ImageJ, the reconstructed horizontal slices were first cropped to reduce image size without affecting the pixels of the sample and capsule, and then were adjusted for brightness and contrast to maximize the contrast between the Mo capsule and the jadeite melt sample without saturating the image (Figure 3a). A mean filter with a radius of two pixels was applied to each slice to smooth out the noisy pixels and enhance the contrast between the sample and surrounding materials (Figure 3b). Lesher et al. [39] showed that the volume obtained by using the mean filter is within 1% of the true volume. The filtered images were then imported into Blob3D for sample segmentation, separation, and volume extraction [53]. The pixel size and slice distances were input into Blob3D, forming an effective voxel size of 4.801 μm3. The pixel intensity of each imported slice was rescaled to 0–255 in Blob3D, and the voxel intensity ranges of the sample and capsule were examined carefully. The sample volume was first segmented from the capsule using the general thresholding range (GTR) based on the voxel intensity range of the sample, and subsequently modified by the Seed Range (SR) in Blob3D. This removes the voxels selected by GTR values that are not connected to the sample volume. After these thresholding processes, the sample can be segmented from the capsule and surrounding materials (Figure 3c). Two additional filters, the Remove Islands/Holes filter (removing small areas of voxels forming as islands or holes in the sample) and the Majority filter (facilitating segmentation based on homogeneity rather than just grayscale to smooth the boundary between sample and capsule), were then applied to the segmented images to refine the segmentation (Figure 3d). After segmentation, the sample can be easily separated from the surrounding voxel volumes in Blob3D, and its real volume was then extracted from the total sample voxel volumes.
The typical sample volume in this study is on the order of ~1–2 mm3, which is more than eight orders of magnitude larger than the volume of a voxel (4.801 × 10⁻⁹ mm3). This high spatial resolution in voxels greatly helps reduce the uncertainty in the measured volumes. The tomographic technique at the same beamline has been benchmarked against a sapphire sphere with known volume embedded in FeS by Lesher et al. [39], showing that the measured volume can be accurate to within 1% of the true volume. The uncertainty in the reconstructed sample volume mainly comes from the thresholding process. By adjusting the threshold value, an optimal range of threshold values can be found in which the resulted sample volume is relatively insensitive to the threshold value [39]. The variation of the reconstructed volume in this threshold range is ~0.015 mm3, which gives a relative uncertainty of ~1%. The density of jadeite melt was then obtained by dividing the mass of the glass sample measured before the experiment by the reconstructed sample volume. Uncertainty in the mass was estimated by the deviation of repeated measurements and is estimated to be ~0.6%. Therefore, the propagated uncertainty in the density is about 1.2%.
3. Results and Discussions
3.1. Density of Jadeite Melt at High Pressures
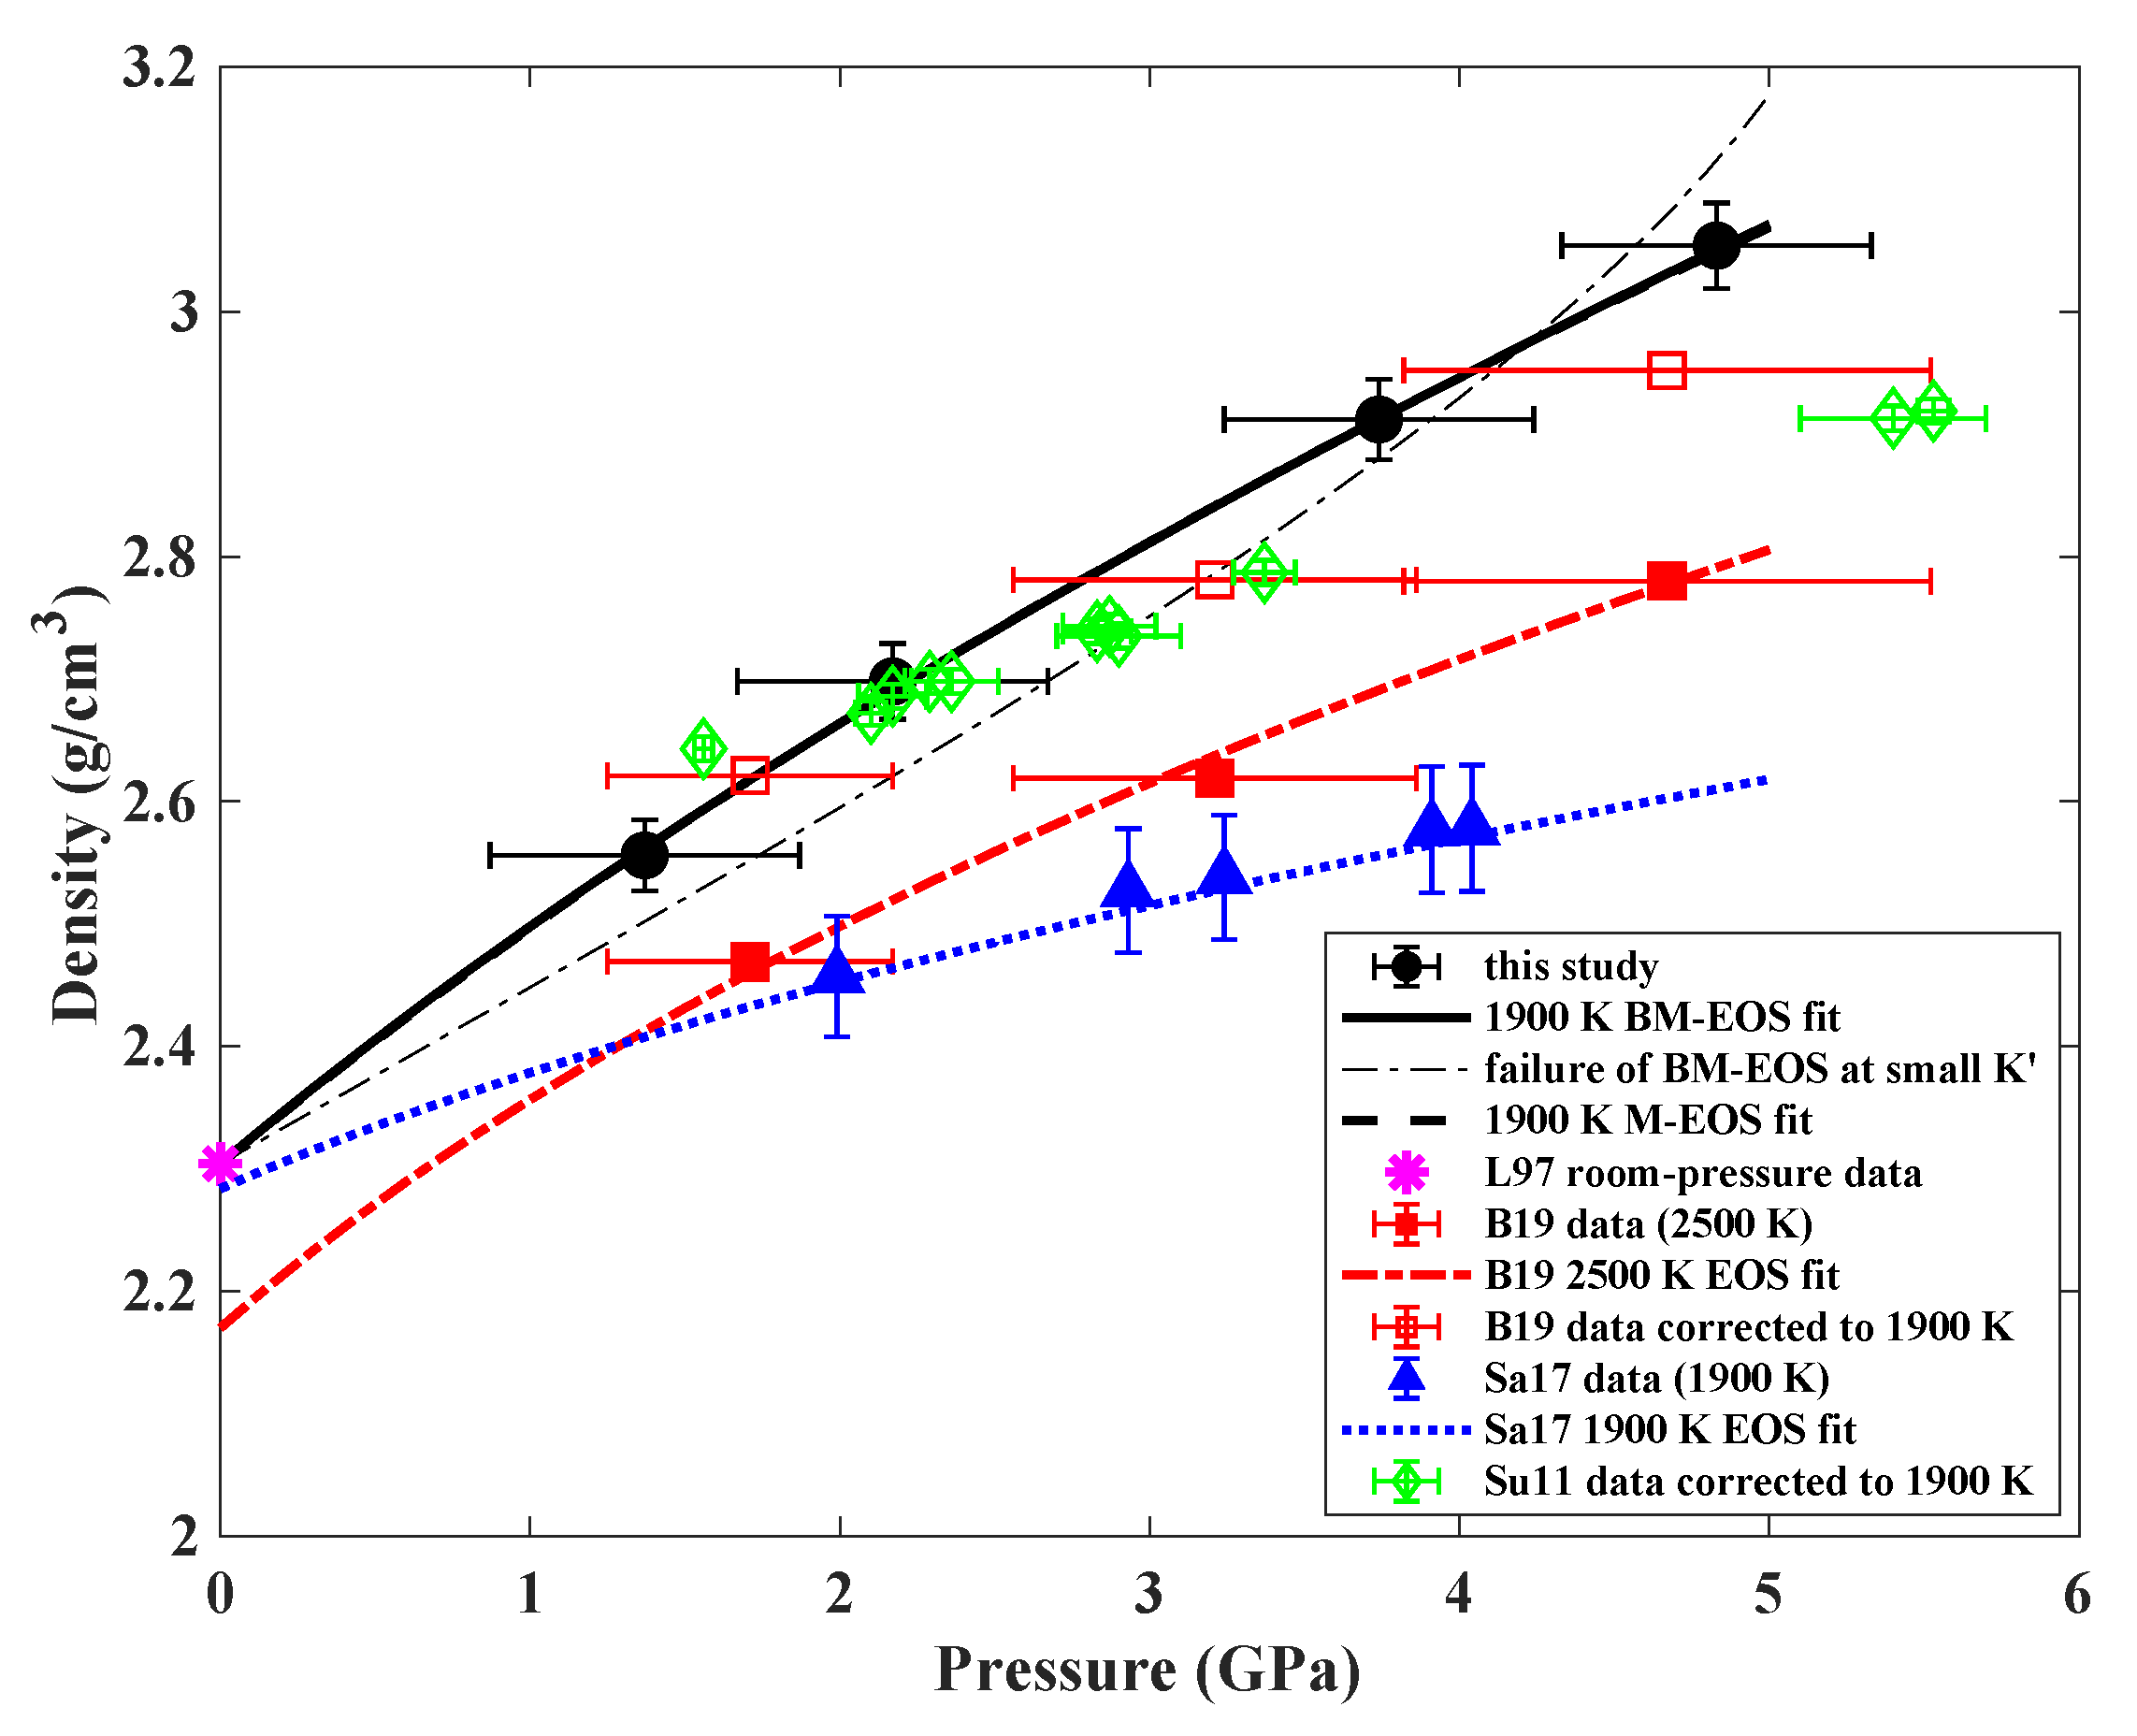
The P-T conditions, reconstructed volumes, and calculated densities for the jadeite melt are listed in Table 1. Since most of the data were measured at around 1900 K, the densities obtained at different temperatures were corrected to the 1900 K isotherm, using a fixed thermal expansion coefficient of 4.4 × 10⁻⁵ K−1 for jadeite melt calculated from the partial molar volumes and the temperature dependence of partial molar volumes of the oxide components (Na2O, Al2O3, and SiO2) given in an earlier work [54]. The density of jadeite melt increases with pressure monotonically from 2.56 g/cm3 at 1.4 GPa to 3.05 g/cm3 at 4.8 GPa. The high-pressure densities determined in this study are consistent with the room-pressure density calculated from the ideal mixing model using partial molar volumes of the oxide components [54]. Figure 4 compares our results with previous studies on jadeite melt including X-ray absorption measurements from Sakamaki [33], FPMD simulations from Bajgain et al. [38], and classical molecular dynamics (MD) simulations from Suzuki et al. [21]. After correcting for thermal effects, our data are mostly consistent with the results from the FPMD [38] over the entire pressure range of our experiments. Although our results also agree with those of classical MD simulations from Suzuki et al. [21] between ~1–3 GPa, a deviation in the pressure effects on density can be observed. Such a deviation could be partly resulted from the particular choice of the pairwise interatomic potentials used in [21]. However, because the study conducted by Suzuki et al. [21] was mainly devoted to viscosity measurements and only a small fraction of the paper describes the MD simulations of density for jadeite melt, not sufficient details are given to resolve the deviation in pressure effects. The densities measured by the X-ray absorption method in the study of [33], on the other hand, are significantly lower than our results and both simulation results. The reason for this discrepancy is not unclear. However, in the study conducted by Sakamaki [33], the sample was scanned by moving the incident slits instead of moving the sample directly as in most other X-ray absorption measurements [35,36]. This difference in scanning techniques to obtain the X-ray absorption profiles would result in an unwanted variation of the incident X-ray beam intensity due to the inhomogeneity of the defocused X-ray beam at 13-BM-D of APS. This variation in beam intensity could be as large as 5–10%, depending on the specific beam optics parameters and beam position used. In addition, the divergence of the beam (change of beam direction) caused by moving the incident slits (relative to the front slits of the hutch) would also result in an inconsistency between the slit position and the actual sample location shone by the X-ray beam. This would result in a deviation of about 4% in the estimated X-ray travel lengths in the sample and hence the absolute density at a given mass absorption coefficient.
The density data in this study were fit to the third-order Birch-Murnaghan equation of state (BM-EOS) [55] using a Monte-Carlo approach to estimate the uncertainties in the fit parameters [48]. The third-order Birch-Murnaghan EOS is given as
where is pressure, the isothermal bulk modulus at room pressure, the pressure derivative of bulk modulus, the room-pressure density, and the density at high pressures. was fixed to 2.30 g/cm3 at 1900 K, based on the ideal-mixing model of [54], during the fitting procedure. The details of the Monte-Carlo approach were described in our previous study [48]. In this approach, the best-fit values for and were searched by minimizing , which is defined as
where is the i-th density data point at high pressures, is the modeled density from BM-EOS using randomly generated values of and , and is the uncertainty in measured density including both the uncertainty from density measurements and the propagated equivalent uncertainty in density from the uncertainty in pressure measurements. We explored the parameter range of 5–25 GPa for and 3–13 for , with the lower bound on being constrained by the use of the 3rd order BM-EOS, which does not give reasonable solutions for < 3.
The best-fit values for and are GPa and , respectively. As shown by the large uncertainties associated with the fitting, there exists a strong correlation between and due to the limited pressure range in this study (Supplementary Figure S3a) and as a result, and cannot be uniquely constrained from current density data. A large number of and pairs can recover the experimental data equally well. If we fix the to 4 and fit only , the fitted in this case is GPa. It should be noted that although a very small (<3) is not compatible with the BM-EOS and gives no reasonable solutions, the compression curve calculated from the BM-EOS using a very small (e.g., 1.3) can pass through the data (the thin black dash-dotted line in Figure 4). In order to examine the possibility of a very small , we also fit the data to the Murnaghan equation of state (M-EOS) [56] in the parameter space of 5 to 25 GPa for and −1 to 15 for , respectively, using the same approach as that in fitting the BM-EOS. The M-EOS is given as
and the parameters are same as those in BM-EOS. The best-fit values using the M-EOS for and are GPa and , respectively, and their correlations are shown in Supplementary Figure S3b. The fitting results are generally consistent with those using BM-EOS, with the and in M-EOS having slightly larger and smaller values, respectively than those in BM-EOS.
The compression curve calculated using the BM-EOS and its uncertainty range, as well as the compression curve using M-EOS, are shown in Figure 4. The compression curves for jadeite melt obtained from both the EOS models nearly overlap with each other and recover the experimental densities well. Table 2 shows a comparison of the fitting results with previous studies. Kress et al. [57] measured the ultrasonic velocity in the Na2O–Al2O3–SiO2 liquid ternary at room pressure and developed a linear compressibility model for this ternary. The isothermal bulk modulus of jadeite melt calculated from their model is 19.1 GPa and significantly higher than the values determined in our study and from molecular simulations. This may be because that the model developed in Kress et al. [57] was based on melt compositions that are significantly different from the jadeite composition, which has equal molar amounts of Na2O and Al2O3. The starting compositions for which Kress et al. [57] were able to obtain relaxed sound velocities, on the contrary, all have an excess in Na2O content relative to Al2O3 content and hence are more depolymerized than the jadeite melt. As a result, without experimental constraints on the Al2O3-rich side, it may not be appropriate to directly extrapolate from the results of Kress et al. [57] to obtain the room-pressure bulk modulus for jadeite melt. The derived and in this study are also generally in agreement with the simulation results. Although the simulations in Bajgain et al. [38] were performed in a larger pressure range (up to 30 GPa) than the present study, no abrupt change or discontinuity is observed in the density data with pressure and the data can be fitted using a single 3rd-order EOS up to ~30 GPa [38], indicating that if there is any change in compression mechanisms of jadeite melt at low to moderate pressures [2], such a change does not affect the EOS behavior of jadeite melt significantly. Only at very high pressures as in the study of Ni and de Koker [58] (up to 144 GPa), the structural change can be evident from the EOS as a 4th-order formula is needed for the fitting. The X-ray absorption study by Sakamaki [33], however, shows a quite different compression curve and distinct - values from this study and the simulations.
3.2. Comparison of the Compressibility with Other Silicate Melts and Geological Implications
The relatively small and determined for jadeite melt in this study imply that it may be more compressible at high pressures than previously thought. Figure 5 compares the isothermal compressibility for silicate melts with different alkali concentration and degree of polymerization at high pressures, including the jadeite melt (~16.7 mol% alkalis, NBO/T = 0) from this study, peridotite melt (no alkalis, NBO/T = 2.45) from Sakamaki et al. [59], mid-ocean ridge basalt (MORB) melt (~3.2 mol% alkalis, NBO/T = 0.76) from Agee [1], diopside melt (no alkalis, NBO/T = 2.01) from Ai and Lange [60], rhyolitic melt (~7.9 mol% alkalis, NBO/T = 0.01) from Malfait et al. [36] and phonolitic melt (~12.7 mol% alkalis, NBO/T = 0.13) from Seifert et al. [35], where the NBO/T is the ratio of non-bridging oxygen (NBO) to tetrahedrally coordinated cations (T) [61]. It can be seen from Figure 5 that alkali-rich and polymerized melts are in general more compressible than alkali-poor and depolymerized melts under upper mantle conditions, and jadeite melt has the highest compressibility among these melts over the entire pressure range shown here. It is likely that both the alkali content and the degree of polymerization can significantly affect the compressibility of silicate melts. However, it is difficult to assess the relative roles of alkali and polymerization in affecting the melt compressibility based on currently available data, as melts containing more alkalis are often more polymerized at the same time.
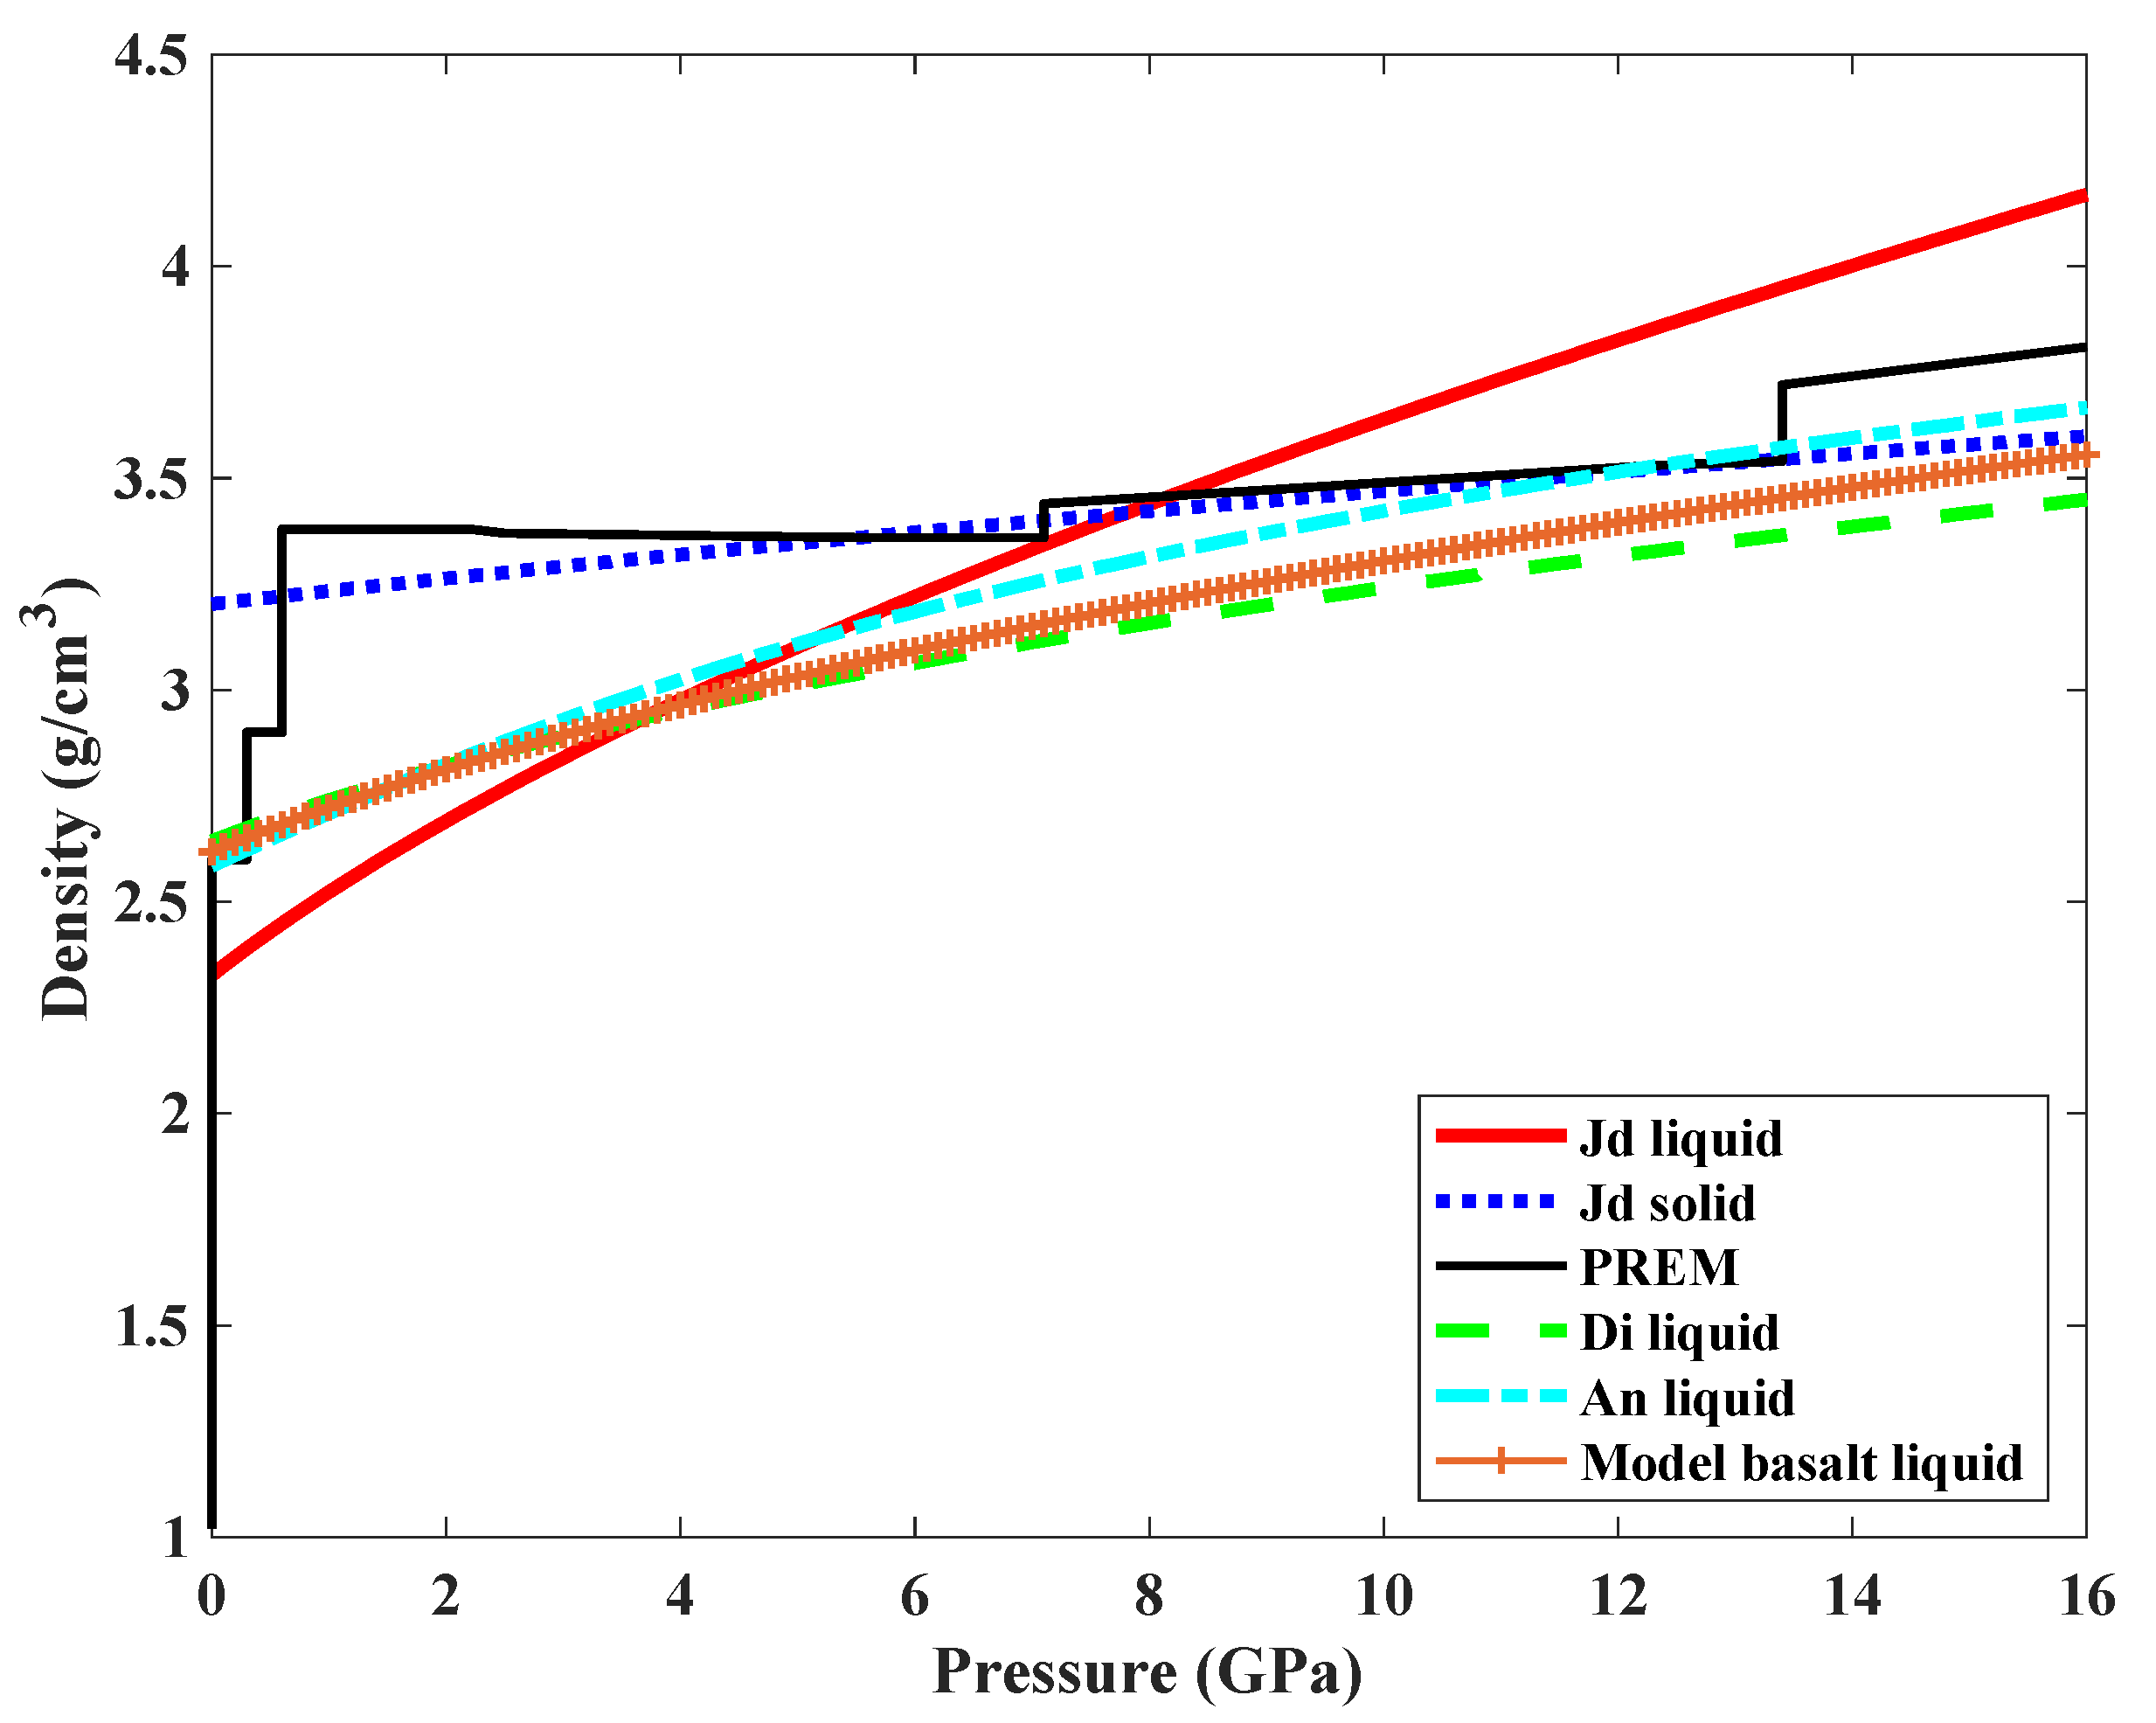
Sodium-rich melts have been observed in the experimental products of low-degree partial melting of mantle rocks [15,16,62,63]. For example, the liquid composition of low-degree partial melting of a fertile peridotite near the solidus temperature at 1.5 GPa in the experimental study of Robinson et al. [63] has Na2O content up to ~8 wt. %. The experimental results of Falloon et al. [15] show that the first melt in equilibrium with a harzburgite residue at 1493 K could contain ~12 wt. % Na2O. The melt compositions calculated for partial melting of both fertile and depleted peridotite by using the pMELTS package [64] also show high sodium content [17]. It is important to evaluate the density and gravitational stability of sodium-rich melts at upper mantle conditions, in order to understand the migration behavior of early partial melts in the mantle. Jadeite melt may be used as a representative and simplified sodium-rich melt composition in the upper mantle. Our experimental results show that jadeite melt is very compressible and that its density increases rapidly with pressure. The calculated density profile for jadeite melt was compared with the density of jadeite solid [22], the PREM (Preliminary Reference Earth Model) density model [65], and the density of diopside, anorthite, and model basalt (Di64An36) melts from shock-wave studies by Asimow and Ahrens [30], as shown in Figure 6. The density of jadeite melt is the lowest among these silicate melts at room pressure, while at around 4–6 GPa the density of jadeite melt exceeds those of Ca–Mg rich melts. At around 8–13 GPa, there could be a density crossover between the jadeite melt and mantle minerals (Figure 6) if our equation of state can be extrapolated to higher pressures. This implies that sodium-rich melts generated by low-degree partial melting of mantle peridotite may become gravitationally stable at ~250–400 km depth in the upper mantle, which could be a possible explanation for the seismically observed anomalies at around these depths in the upper mantle [7,66]. In addition to the Na2O component, FeO, the heaviest major component in silicate melts, also prefers the melt phase during partial melting [67]. Thus, the presence of iron in these early melts would make the density-crossover happen more easily [45,68].
4. Conclusions
We have successfully measured the density of a jadeite melt up to 4.8 GPa and 1955 K using the high-pressure X-ray microtomography technique in a Paris-Edinburgh cell assembly. The microtomographic technique can accurately recover the density for silicate melts with low X-ray absorption by using a pink X-ray beam and a relatively strongly absorbing material to encapsulate the liquid sample. The densities obtained are higher than previous experimental results using the X-ray absorption method, but are generally consistent with previous molecular dynamics simulation results, especially the first-principles molecular dynamics results. By comparing the compressibility of various silicate melts, we have shown that alkali-rich, polymerized melts are more compressible than alkali-poor, depolymerized melts under upper mantle conditions. The high compressibility of jadeite melt implies that low-degree sodium-rich silicate melts in the deep upper mantle may become denser than surrounding mantle materials.
Supplementary Materials
The following are available online at https://www.mdpi.com/2075-163X/10/2/161/s1, Figure S1: Temperature-power relationships calibrated at different loads for the PE cell assembly used for tomographic measurements on silicate melts, Figure S2: SEM images and EDS composition mapping of the quenched sample, Figure S3: Correlations between fitted K0 and K’, Table S1: Compositions of the quenched sample measured by EDS.
Author Contributions
Conceptualization, Z.J. and M.X.; methodology, M.X., Z.J. and T.Y.; software, Z.J., T.Y. and Y.W.; validation, M.X., Z.J. and J.A.V.O.; formal analysis, M.X.; investigation, M.X. and Z.J.; resources, Z.J., J.A.V.O. and Y.W.; data curation, M.X.; writing—original draft preparation, M.X.; writing—review and editing, all authors; visualization, M.X.; supervision, Z.J. and J.A.V.O.; project administration, Z.J., J.A.V.O. and Y.W.; funding acquisition, Z.J. and Y.W. All authors have read and agreed to the published version of the manuscript.
Funding
This research was partly supported by the National Science Foundation (EAR-1619964 and 1620548) and the National Natural Science Foundation of China (41974098). The high pressure microtomographic experiments were performed at GSECARS beamline 13-BM-D, Advanced Photon Source (APS), Argonne National Laboratory. GSECARS is supported by the National Science Foundation - Earth Sciences (EAR-1634415) and Department of Energy-GeoSciences (DE-FG02-94ER14466). This research used resources of the Advanced Photon Source, a U.S. Department of Energy (DOE) Office of Science User Facility operated for the DOE Office of Science by Argonne National Laboratory under Contract No. DE-AC02-06CH11357.
Acknowledgments
We thank Nanthawan Avishai for her assistance on the SEM analysis of the quenched sample at the Swagelok Center for Surface Analysis of Materials (SCSAM) of CWRU.
Conflicts of Interest
The authors declare no conflict of interest.
References
- Agee, C.B. Crystal-liquid density inversions in terrestrial and lunar magmas. Phys. Earth Planet. Inter. 1998, 107, 63–74. [Google Scholar] [CrossRef]
- Sanloup, C. Density of magmas at depth. Chem. Geol. 2016, 429, 51–59. [Google Scholar] [CrossRef] [Green Version]
- Stolper, E.; Walker, D.; Hager, B.H.; Hays, J.F. Melt segregation from partially molten source regions: The importance of melt density and source region size. J. Geophys. Res. 1981, 86, 6261–6271. [Google Scholar] [CrossRef] [Green Version]
- Faul, U.H. Melt retention and segregation beneath mid-ocean ridges. Nature 2001, 410, 920–923. [Google Scholar] [CrossRef] [PubMed]
- Schmerr, N. The gutenberg discontinuity: Melt at the lithosphere-asthenosphere boundary. Science 2012, 335, 1480–1483. [Google Scholar] [CrossRef] [Green Version]
- Naif, S.; Key, K.; Constable, S.; Evans, R.L. Melt-rich channel observed at the lithosphere-asthenosphere boundary. Nature 2013, 495, 356–359. [Google Scholar] [CrossRef]
- Tauzin, B.; Debayle, E.; Wittlinger, G. Seismic evidence for a global low-velocity layer within the Earth’s upper mantle. Nat. Geosci. 2010, 3, 718–721. [Google Scholar] [CrossRef]
- Schmandt, B.; Jacobsen, S.D.; Becker, T.W.; Liu, Z.; Dueker, K.G. Dehydration melting at the top of the lower mantle. Science 2014, 344, 1265–1268. [Google Scholar] [CrossRef]
- Williams, Q.; Garnero, E.J. Seismic evidence for partial melt at the base of earth’s mantle. Science 1996, 273, 1528–1530. [Google Scholar] [CrossRef] [Green Version]
- Nakajima, M.; Stevenson, D.J. Melting and mixing states of the Earth’s mantle after the Moon-forming impact. Earth Planet. Sci. Lett. 2015, 427, 286–295. [Google Scholar] [CrossRef] [Green Version]
- Hosono, N.; Karato, S.; Makino, J.; Saitoh, T.R. Terrestrial magma ocean origin of the Moon. Nat. Geosci. 2019, 12, 418–423. [Google Scholar] [CrossRef]
- Hirschmann, M.M. Mantle solidus: Experimental constraints and the effects of peridotite composition. Geochem. Geophys. Geosyst. 2000, 1, 2000GC000070. [Google Scholar] [CrossRef]
- Baker, M.B.; Hirschmann, M.M.; Ghiorso, M.S.; Stolper, E.M. Compositions of near-solidus peridotite melts from experiments and thermodynamic calculations. Nature 1995, 375, 308–311. [Google Scholar] [CrossRef]
- Schiano, P.; Clocchiatti, R. Worldwide occurrence of silica-rich melts in sub-continental and sub-oceanic mantle minerals. Nature 1994, 368, 621–624. [Google Scholar] [CrossRef]
- Falloon, T.J.; Green, D.H.; O’Neill, H.S.C.; Hibberson, W.O. Experimental tests of low degree peridotite partial melt compositions: Implications for the nature of anhydrous near-solidus peridotite melts at 1 GPa. Earth Planet. Sci. Lett. 1997, 152, 149–162. [Google Scholar] [CrossRef]
- Falloon, T.J.; Green, D.H.; Danyushevsky, L.V.; Mcneill, A.W. The composition of near-solidus partial melts of fertile peridotite at 1 and 1.5 GPa: Implications for the petrogenesis of Morb. J. Petrol. 2008, 49, 591–613. [Google Scholar] [CrossRef]
- Pommier, A.; Garnero, E.J. Petrology-based modeling of mantle melt electrical conductivity and joint interpretation of electromagnetic and seismic results. J. Geophys. Res. Solid Earth 2014, 119, 4001–4016. [Google Scholar] [CrossRef]
- Kushiro, I. Changes in viscosity and structure of melt of NaAlSi2O6 composition at high pressures. J. Geophys. Res. 1976, 81, 6347–6350. [Google Scholar] [CrossRef]
- Shimizu, N.; Kushiro, I. Diffusivity of oxygen in jadeite and diopside melts at high pressures. Geochim. Cosmochim. Acta 1984, 48, 1295–1303. [Google Scholar] [CrossRef]
- Litvin, Y.A.; Gasparik, T. Melting of jadeite to 16.5 GPa and melting relations on the enstatite-jadeite join. Geochim. Cosmochim. Acta 1993, 57, 2033–2040. [Google Scholar] [CrossRef]
- Suzuki, A.; Ohtani, E.; Terasaki, H.; Nishida, K.; Hayashi, H.; Sakamaki, T.; Shibazaki, Y.; Kikegawa, T. Pressure and temperature dependence of the viscosity of a NaAlSi2O6 melt. Phys. Chem. Miner. 2011, 38, 59–64. [Google Scholar] [CrossRef]
- Zhao, Y.; Von Dreele, R.B.; Shankland, T.J.; Weidner, D.J.; Zhang, J.; Wang, Y.; Gasparik, T. Thermoelastic equation of state of jadeite NaAlSi2O6: An energy-dispersive Reitveld refinement study of low symmetry and multiple phases diffraction. Geophys. Res. Lett. 1997, 24, 5–8. [Google Scholar] [CrossRef]
- Liu, L. High-pressure phase transformations of albite, jadeite and nepheline. Earth Planet. Sci. Lett. 1978, 37, 438–444. [Google Scholar] [CrossRef]
- Nestola, F.; Boffa-Ballaran, T.; Liebske, C.; Bruno, M.; Tribaudino, M. High-pressure behaviour along the jadeite NaAlSi2O6—Aegirine NaFeSi2O6 solid solution up to 10 GPa. Phys. Chem. Miner. 2006, 33, 417–425. [Google Scholar] [CrossRef]
- Wu, X.; Fan, X.; Qin, F.; Meng, D.; Zhang, X.; Chen, L.; Liu, W.; Zheng, J. Compressibility and structural properties of Jadeite, NaAlSi2O6 at high pressure. J. Earth Sci. 2013, 24, 57–64. [Google Scholar] [CrossRef]
- Agee, C.B.; Walker, D. Olivine flotation in mantle melt. Earth Planet. Sci. Lett. 1993, 114, 315–324. [Google Scholar] [CrossRef]
- Ghosh, S.; Ohtani, E.; Litasov, K.; Suzuki, A.; Sakamaki, T. Stability of carbonated magmas at the base of the Earth’s upper mantle. Geophys. Res. Lett. 2007, 34, L22312. [Google Scholar] [CrossRef]
- Jing, Z.; Karato, S. Effect of H2O on the density of silicate melts at high pressures: Static experiments and the application of a modified hard-sphere model of equation of state. Geochim. Cosmochim. Acta 2012, 85, 357–372. [Google Scholar] [CrossRef]
- Matsukage, K.N.; Jing, Z.; Karato, S. Density of hydrous silicate melt at the conditions of Earth’s deep upper mantle. Nature 2005, 438, 488–491. [Google Scholar] [CrossRef]
- Asimow, P.D.; Ahrens, T.J. Shock compression of liquid silicates to 125 GPa: The anorthite-diopside join. J. Geophys. Res. Solid Earth 2010, 115, B10209. [Google Scholar] [CrossRef] [Green Version]
- Rigden, S.M.; Ahrens, T.J.; Stolper, E.M. High pressure equation of state of molten Anorthite and Diopside. J. Geophys. Res. 1989, 94, 9508–9522. [Google Scholar] [CrossRef]
- Thomas, C.W.; Asimow, P.D. Preheated shock experiments in the molten CaAl2Si2O8–CaFeSi2O6–CaMgSi2O6 ternary: A test for linear mixing of liquid volumes at high pressure and temperature. J. Geophys. Res. Solid Earth 2013, 118, 3354–3365. [Google Scholar] [CrossRef] [Green Version]
- Sakamaki, T. Density of jadeite melts under high pressure and high temperature conditions. J. Mineral. Petrol. Sci. 2017, 112, 300–307. [Google Scholar] [CrossRef] [Green Version]
- Sato, T.; Funamori, N. Sixfold-coordinated amorphous Polymorph of SiO2 under high pressure. Phys. Rev. Lett. 2008, 101, 255502. [Google Scholar] [CrossRef] [PubMed]
- Seifert, R.; Malfait, W.J.; Petitgirard, S.; Sanchez-Valle, C. Density of phonolitic magmas and time scales of crystal fractionation in magma chambers. Earth Planet. Sci. Lett. 2013, 381, 12–20. [Google Scholar] [CrossRef]
- Malfait, W.J.; Seifert, R.; Petitgirard, S.; Perrillat, J.P.; Mezouar, M.; Ota, T.; Nakamura, E.; Lerch, P.; Sanchez-Valle, C. Supervolcano eruptions driven by melt buoyancy in large silicic magma chambers. Nat. Geosci. 2014, 7, 122–125. [Google Scholar] [CrossRef]
- Petitgirard, S.; Malfait, W.J.; Sinmyo, R.; Kupenko, I.; Hennet, L.; Harries, D.; Dane, T.; Burghammer, M.; Rubie, D.C. Fate of MgSiO3 melts at core—Mantle boundary conditions. Proc. Natl. Acad. Sci. USA 2015, 112, 14186–14190. [Google Scholar] [CrossRef] [Green Version]
- Bajgain, S.K.; Peng, Y.; Mookherjee, M.; Jing, Z.; Solomon, M. Properties of hydrous aluminosilicate melts at high pressures. ACS Earth Space Chem. 2019, 3, 390–402. [Google Scholar] [CrossRef]
- Lesher, C.E.; Wang, Y.; Gaudio, S.; Clark, A.; Nishiyama, N.; Rivers, M. Volumetric properties of magnesium silicate glasses and supercooled liquid at high pressure by X-ray microtomography. Phys. Earth Planet. Inter. 2009, 174, 292–301. [Google Scholar] [CrossRef]
- Clark, A.N.; Lesher, C.E.; Jacobsen, S.D.; Wang, Y. Anomalous density and elastic properties of basalt at high pressure: Reevaluating of the effect of melt fraction on seismic velocity in the Earth’s crust and upper mantle. J. Geophys. Res. Solid Earth 2016, 121, 4232–4248. [Google Scholar] [CrossRef] [Green Version]
- Li, R.; Li, L.; Yu, T.; Wang, L.; Chen, J.; Wang, Y.; Cai, Z.; Chen, J.; Rivers, M.L.; Liu, H. Study of liquid gallium as a function of pressure and temperature using synchrotron x-ray microtomography and x-ray diffraction. Appl. Phys. Lett. 2014, 105, 041906. [Google Scholar] [CrossRef]
- Li, R.; Wang, L.; Li, L.; Yu, T.; Zhao, H.; Chapman, K.W.; Wang, Y.; Rivers, M.L.; Chupas, P.J.; Mao, H.; et al. Local structure of liquid gallium under pressure. Sci. Rep. 2017, 7, 5666. [Google Scholar] [CrossRef] [PubMed] [Green Version]
- Kono, Y.; Yamada, A.; Wang, Y.; Yu, T.; Inoue, T. Combined ultrasonic elastic wave velocity and microtomography measurements at high pressures. Rev. Sci. Instrum. 2011, 82, 023906. [Google Scholar] [CrossRef] [PubMed]
- Rivers, M.L. Synchrotron “pink beam” tomography for the study of dynamic processes. SPIE Newsroom 2016. [Google Scholar] [CrossRef]
- Jing, Z.; Karato, S. A new approach to the equation of state of silicate melts: An application of the theory of hard sphere mixtures. Geochim. Cosmochim. Acta 2011, 75, 6780–6802. [Google Scholar] [CrossRef]
- Wang, Y.; Uchida, T.; Westferro, F.; Rivers, M.L.; Nishiyama, N.; Gebhardt, J.; Lesher, C.E.; Sutton, S.R. High-pressure X-ray tomography microscope: Synchrotron computed microtomography at high pressure and temperature. Rev. Sci. Instrum. 2005, 76, 073709. [Google Scholar] [CrossRef] [Green Version]
- Yu, T.; Wang, Y.; Rivers, M.L. Imaging in 3D under pressure: A decade of high-pressure X-ray microtomography development at GSECARS. Prog. Earth Planet. Sci. 2016, 3, 17. [Google Scholar] [CrossRef] [Green Version]
- Xu, M.; Jing, Z.; Chantel, J.; Jiang, P.; Yu, T.; Wang, Y. Ultrasonic velocity of diopside liquid at high pressure and temperature: Constraints on velocity reduction in the upper mantle due to partial melts. J. Geophys. Res. Solid Earth 2018, 123, 8676–8690. [Google Scholar] [CrossRef]
- Tange, Y.; Nishihara, Y.; Tsuchiya, T. Unified analyses for P-V-T equation of state of MgO: A solution for pressure-scale problems in high P-T experiments. J. Geophys. Res. 2009, 114, B03208. [Google Scholar] [CrossRef]
- Rivers, M.L. tomoRecon: High-speed tomography reconstruction on workstations using multi-threading. Proc. SPIE 2012, 8506, 85060U. [Google Scholar] [CrossRef]
- Rivers, M.L.; Wang, Y. Recent developments in microtomography at GeoSoilEnviroCARS. Proc. SPIE 2006, 6318, 63180J. [Google Scholar] [CrossRef]
- Ketcham, R.A. Computational methods for quantitative analysis of three-dimensional features in geological specimens. Geosphere 2005, 1, 32–41. [Google Scholar] [CrossRef]
- Ketcham, R.A.; Carlson, W.D. Acquisition, optimization and interpretation of X-ray computed tomographic imagery: Applications to the geosciences. Comput. Geosci. 2001, 27, 381–400. [Google Scholar] [CrossRef]
- Lange, R.A. A revised model for the density and thermal expansivity of K2O–Na2O–CaO–MgO–Al2O3–SiO2 liquids from 700 to 1900 K: Extension to crustal magmatic temperatures. Contrib. Mineral. Petrol. 1997, 130, 1–11. [Google Scholar] [CrossRef] [Green Version]
- Birch, F. Elasticity and constitution of the Earth’s interior. J. Geophys. Res. 1952, 57, 227–286. [Google Scholar] [CrossRef]
- Murnaghan, F.D. Finite Deformation of an Elastic Solid; Dover: New York, NY, USA, 1967. [Google Scholar]
- Kress, V.C.; Williams, Q.; Carmichael, I.S.E. Ultrasonic investigation of melts in the system Na2O–Al2O3–SiO2. Geochim. Cosmochim. Acta 1988, 52, 283–293. [Google Scholar] [CrossRef]
- Ni, H.; De Koker, N. Thermodynamics, diffusion and structure of NaAlSi2O6 liquid at mantle conditions: A first-principles molecular dynamics investigation. J. Geophys. Res. 2011, 116, B09202. [Google Scholar] [CrossRef]
- Sakamaki, T.; Ohtani, E.; Urakawa, S.; Suzuki, A.; Katayama, Y. Density of dry peridotite magma at high pressure using an X-ray absorption method. Am. Mineral. 2010, 95, 144–147. [Google Scholar] [CrossRef]
- Ai, Y.; Lange, R.A. New acoustic velocity measurements on CaO–MgO–Al2O3–SiO2 liquids: Reevaluation of the volume and compressibility of CaMgSi2O6-CaAl2Si2O8 liquids to 25 GPa. J. Geophys. Res. 2008, 113, B04203. [Google Scholar] [CrossRef] [Green Version]
- Mysen, B.O.; Virgo, D.; Seifert, F.A. Relationships between properties and structure of aluminosilicate melts. Am. Mineral. 1985, 70, 88–105. [Google Scholar]
- Hirose, K.; Kushiro, I. Partial melting of dry peridotites at high pressures: Determination of compositions of melts segregated from peridotite using aggregates of diamond. Earth Planet. Sci. Lett. 1993, 114, 477–489. [Google Scholar] [CrossRef]
- Robinson, J.A.C.; Wood, B.J.; Blundy, J.D. The beginning of melting of fertile and depleted peridotite at 1.5 GPa. Earth Planet. Sci. Lett. 1998, 155, 97–111. [Google Scholar] [CrossRef]
- Ghiorso, M.S.; Hirschmann, M.M.; Reiners, P.W.; Kress, V.C. The pMELTS: A revision of MELTS for improved calculation of phase relations and major element partitioning related to partial melting of the mantle to 3 GPa. Geochem. Geophys. Geosyst. 2002, 3, 1–35. [Google Scholar] [CrossRef]
- Dziewonski, A.M.; Anderson, D.L. Preliminary reference Earth model. Phys. Earth Planet. Inter. 1981, 25, 297–356. [Google Scholar] [CrossRef]
- Ritsema, J.; Van Heijst, H. New seismic model of the upper mantle beneath Africa. Geology 2000, 28, 63–66. [Google Scholar] [CrossRef]
- Mibe, K.; Fujii, T.; Yasuda, A.; Ono, S. Mg–Fe partitioning between olivine and ultramafic melts at high pressures. Geochim. Cosmochim. Acta 2006, 70, 757–766. [Google Scholar] [CrossRef]
- Jing, Z.; Karato, S. The density of volatile bearing melts in the Earth’s deep mantle: The role of chemical composition. Chem. Geol. 2009, 262, 100–107. [Google Scholar] [CrossRef]
Figure 1.
Cross section of the Paris-Edinburgh (PE) cell assembly used for X-ray microtomography experiments on silicate melts.
Figure 1.
Cross section of the Paris-Edinburgh (PE) cell assembly used for X-ray microtomography experiments on silicate melts.
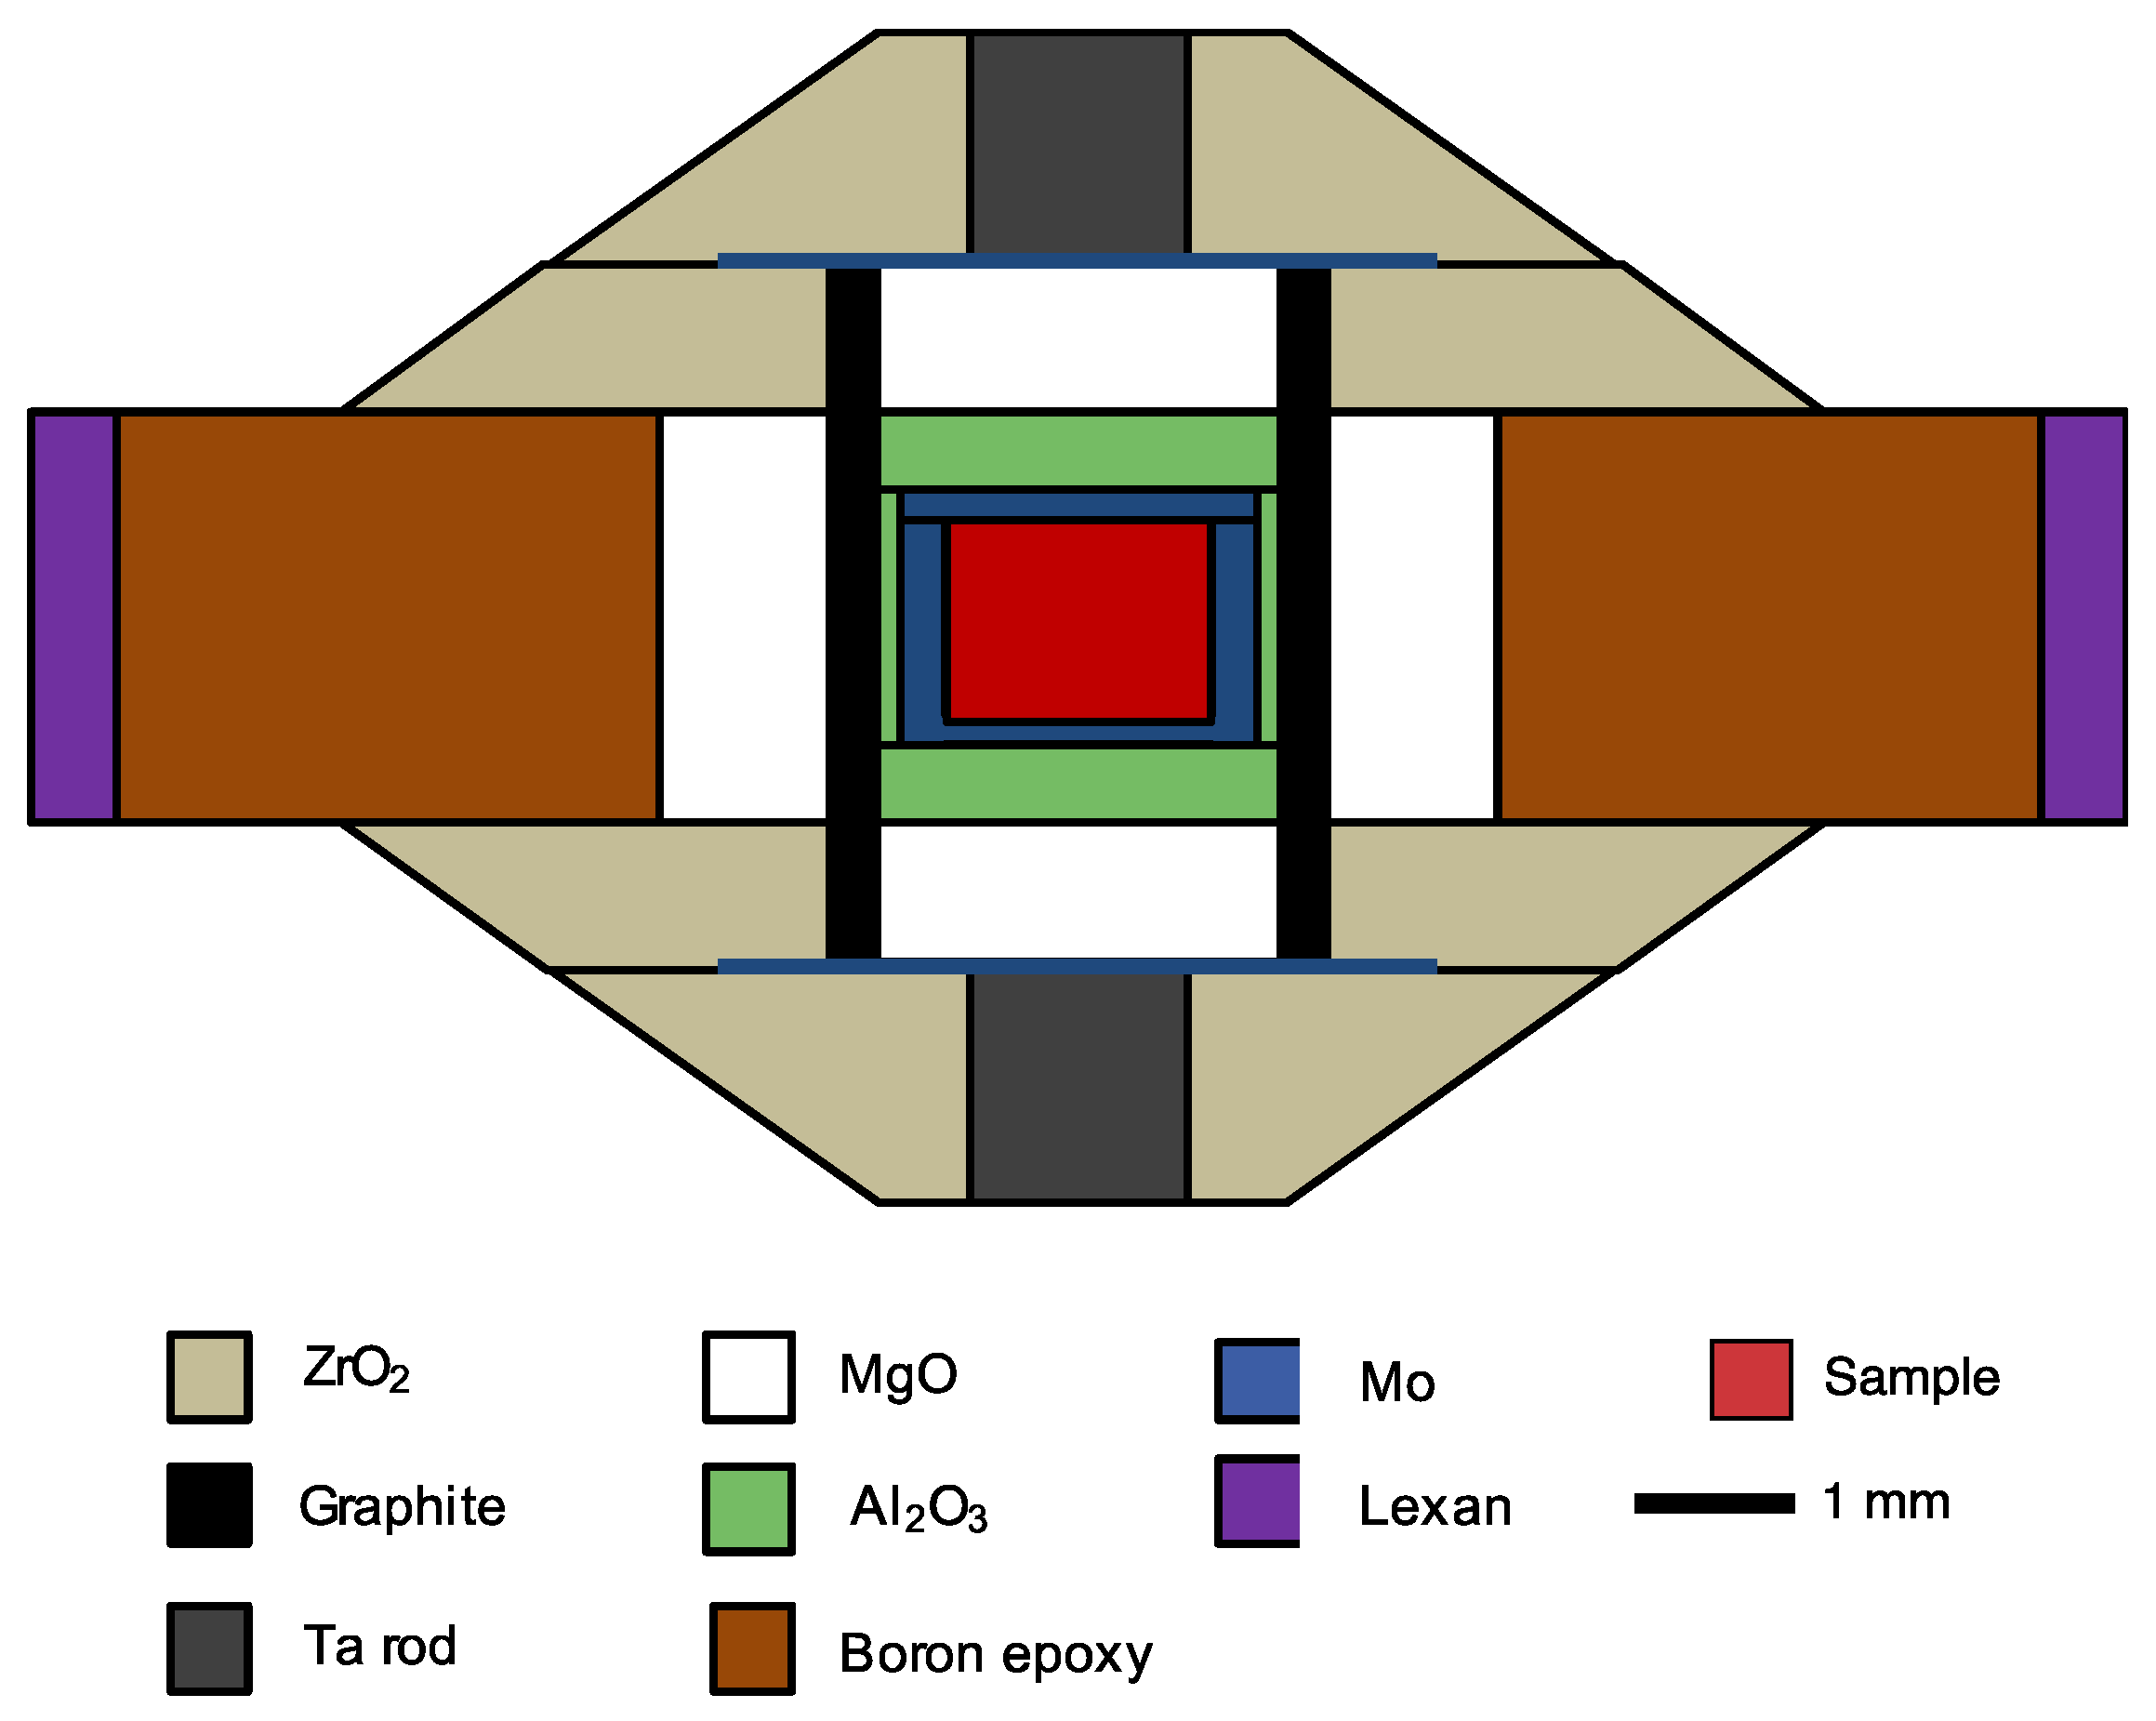
Figure 2.
Steps for tomographic reconstruction. (a) A representative raw radiographic image obtained for the sample at 3.7 GPa and 1934 K. The inset is the same image after adjusting brightness and contrast. (b) Sinogram showing the stack of line integrals of the pixel values at a given row height within the sample. (c) Reconstructed horizontal slice (viewed from the top) using the TOMO_DISPLAY program. The inset shows the reconstructed vertical slice (viewed from the side). The rectangular area is zoomed in Figure 3 showing the filtering and separation processes. (d) 3D volume rendering of the sample using Blob3D. The Mo capsule was removed for clarity in this view.
Figure 3.
Images showing the filtering and separation processes of the sample and capsule. The images are zoomed in corresponding to the rectangular area in Figure 2c to better show the effects of different processes. (a) Reconstructed slice after adjusting contrast and brightness. (b) Slice after applying the mean filter. (c) Slice showing the separated sample based on specifying the general thresholding range (GTR) and Seed Range (SR). (d) Slice showing the separated sample after applying the Remove Islands/Holes filter and the Majority filter.
Figure 4.
Density of jadeite melt as a function of pressure measured in this study and its comparison with previous studies. The shaded area is the uncertainty of the compression curve based on the Birch-Murnaghan equation of state (BM-EOS) fitting results. The solid black line for BM-EOS overlaps with the dashed black line for Murnaghan equation of state (M-EOS). L97-Lange [54], B19-Bajgain et al. [38], Sa17-Sakamaki [33] and Su11-Suzuki et al. [21].
Figure 5.
Comparison of the isothermal compressibility (at 1473 K) for various anhydrous silicate melts at high pressures. Data for mid-ocean ridge basalt (MORB), rhyolite, phonolite, diopside (Di) and peridotite melts are from Agee [1], Malfait et al. [36], Seifert et al. [35], Ai and Lange [60] and Sakamaki et al. [59], respectively. The compressibility curve for jadeite melt was calculated using the best-fit values from BM-EOS. Blue curves are for polymerized melts based on the non-bridging oxygen (NBO)/tetrahedrally coordinated cations (T) ratios, and red curves are for depolymerized melts.
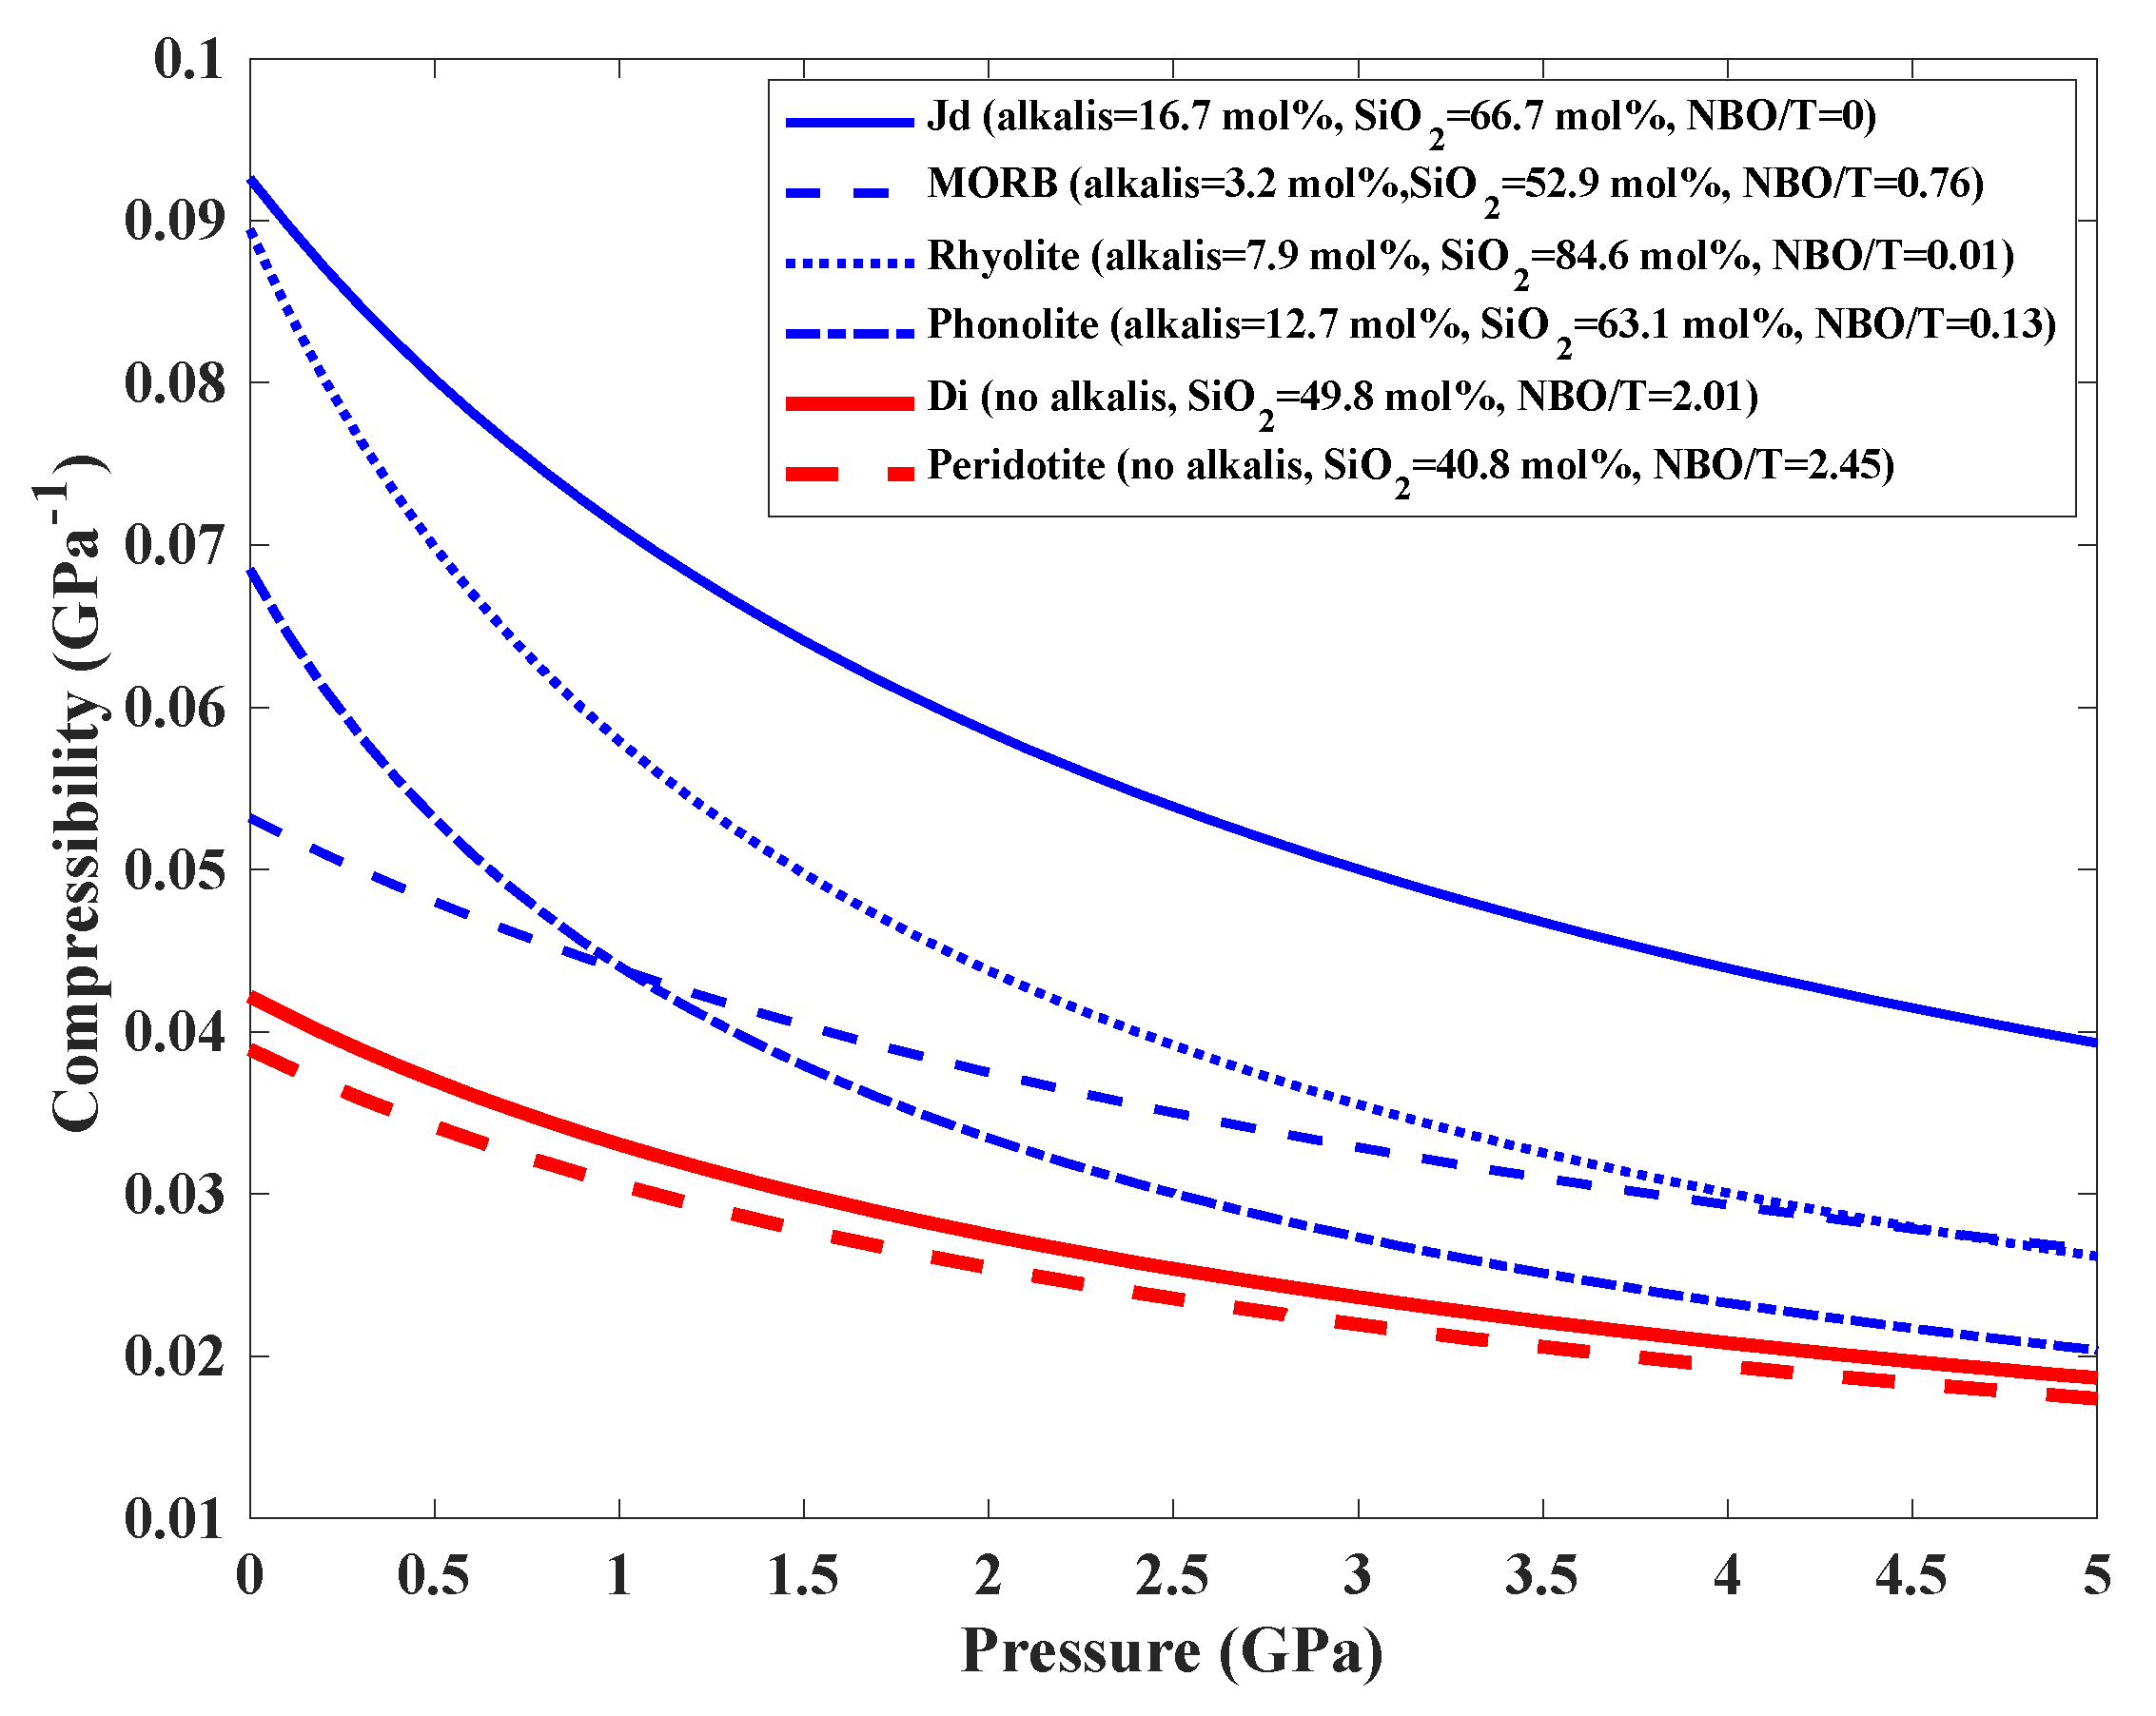
Figure 6.
Comparison of the density profile of jadeite melt obtained in this study with that of jadeite solid [22], PREM (Preliminary Reference Earth Model) model [65] and Di, An, model basalt (Di64An36) melts [30]. The Jd melt and solid are compared at 1673 K isotherm, while the Di, An and model basalt liquids from shock-wave studies are along their respective adiabats with a potential temperature of 1673 K. The shaded area represents the uncertainty in the compression curve for jadeite melt.

Table 1.
Experimental pressure-temperature conditions and measured densities for jadeite melt.
| Load (tons) | P (GPa) | T (K) | V (mm3) | V1900 K (mm3) | ρ (g/cm3) |
|---|---|---|---|---|---|
| 10 | 1.4 | 1741 | 1.704 | 1.716 | 2.556 |
| 10 | 2.2 | 1955 | 1.629 | 1.625 | 2.698 |
| 20 | 3.7 | 1934 | 1.508 | 1.506 | 2.912 |
| 30 | 4.8 | 1921 | 1.437 | 1.436 | 3.054 |
Note: Uncertainty in pressure is about 0.5 GPa, uncertainty in temperature is about 100 K and uncertainties in reconstructed volume and density are about 1% and 1.2%, respectively.
Table 2.
Fitting results on bulk modulus and its pressure derivative and comparison with previous studies.
Table 2.
Fitting results on bulk modulus and its pressure derivative and comparison with previous studies.
| References | T (K) | Method | ||
|---|---|---|---|---|
| This study (BM-EOS) | 1900 | HPXTM | ||
| 4 (fixed) | 1900 | |||
| This study (M-EOS) | 1900 | |||
| Bajgain et al. [38] | 9.70 ± 3.88 | 5.42 ± 1.35 | 2500 | FPMD |
| Ni and de Koker [58]* | 15.0 | 3.56 | 3000 | FPMD |
| Sakamaki [33] | 21.5 ± 0.8 | 8.9 ± 1.2 | 1473 | X-ray absorption |
| Kress et al. [57]# | 19.1 | 1773 | Room-pressure ultrasonics |
Note: All reported values are isothermal ones. * This study does not report density values and the fitting was performed using a fourth order finite strain expansion with a of about −0.11. # The value was calculated using the linear compressibility model developed in this study for Na2O–Al2O3–SiO2 ternary with mole fractions of Na2O > Al2O3, which may not be applicable to jadeite melt. See discussion in the text. HPXTM; high-pressure X-ray microtomography. FPMD; first-principles molecular dynamics.
© 2020 by the authors. Licensee MDPI, Basel, Switzerland. This article is an open access article distributed under the terms and conditions of the Creative Commons Attribution (CC BY) license (http://creativecommons.org/licenses/by/4.0/).
Share and Cite
MDPI and ACS Style
Xu, M.; Jing, Z.; Van Orman, J.A.; Yu, T.; Wang, Y. Density of NaAlSi2O6 Melt at High Pressure and Temperature Measured by In-Situ X-ray Microtomography. Minerals 2020, 10, 161. https://doi.org/10.3390/min10020161
AMA Style
Xu M, Jing Z, Van Orman JA, Yu T, Wang Y. Density of NaAlSi2O6 Melt at High Pressure and Temperature Measured by In-Situ X-ray Microtomography. Minerals. 2020; 10(2):161. https://doi.org/10.3390/min10020161
Chicago/Turabian StyleXu, Man, Zhicheng Jing, James A. Van Orman, Tony Yu, and Yanbin Wang. 2020. "Density of NaAlSi2O6 Melt at High Pressure and Temperature Measured by In-Situ X-ray Microtomography" Minerals 10, no. 2: 161. https://doi.org/10.3390/min10020161
Note that from the first issue of 2016, this journal uses article numbers instead of page numbers. See further details here.