Atomic Force Microscopy and Raman Microspectroscopy Investigations of the Leaching of Chalcopyrite (112) Surface


1
College of Science and Engineering, Flinders University, Bedford Park, SA 5042, Australia
2
Flinders Microscopy and Microanalysis, College of Science and Engineering, Flinders University, Bedford Park, SA 5042, Australia
3
Flinders Institute for Nanoscale Science and Technology, College of Science and Engineering, Flinders University, Bedford Park, SA 5042, Australia
*
Author to whom correspondence should be addressed.
†
These authors contributed equally.
Minerals 2020, 10(6), 485; https://doi.org/10.3390/min10060485
Submission received: 2 March 2020
/
Revised: 20 May 2020
/
Accepted: 23 May 2020
/
Published: 26 May 2020
(This article belongs to the Special Issue Advances in Application of Spectroscopic Techniques for Minerals Processing)
Abstract
:The aim of this study was to determine the reactivity of the chalcopyrite (112) surface under industrially relevant leaching conditions. Leaching of the chalcopyrite (112) surface was carried out at approximately pH 1 and in the presence of 0.01 M ferric or ferrous. The atomic force microscopy (AFM) and Raman microspectroscopy analyses suggested that the chalcopyrite (112) surface was relatively inert, with no formation of elemental sulfur observed over 42 days of leaching. In addition, it was found that the distribution of Fe-S and Cu-S bonds was always negatively correlated, as revealed by Raman analysis. This suggested that the breakage of the Fe-S and Cu-S bonds did not occur concurrently at a specific reaction site. The rate of variation of surface roughness, as reflected by AFM data, also suggested that leaching of the chalcopyrite (112) surface in the ferric or ferrous solution medium likely occurred more rapidly in the initial stage (fewer than seven days) than in the later stage (after seven days).
1. Introduction
Chalcopyrite (CuFeS2) is one of the most abundant copper-bearing minerals and the primary source of copper in the world, accounting for nearly 70% of the Earth’s copper [1,2]. Copper is largely extracted from chalcopyrite using pyrometallurgy (smelting) after concentration by mineral flotation [3], which is a high energy consuming method and associated with significant environmental concerns (e.g., release of toxic sulfur-containing gases). Hydrometallurgy is an alternative method to pyrometallurgy which has been increasingly applied to extract copper from ores, particularly, low-grade chalcopyrite ores [4]. At present, about 18% of copper production comes directly from hydrometallurgy. However, chalcopyrite is highly refractory with relatively slow leaching kinetics, which limits the application of hydrometallurgy in the mining industry [2,3]. While complete chalcopyrite leaching has been achievable [1,5], slow and incomplete leaching has often been observed under certain conditions, in particular, at relatively low temperatures. For example, a maximum of 85% of chalcopyrite has been leached at 43 °C and pH 1.0, and the remaining 15% of chalcopyrite was found to be resistant to leaching [6], which is not immediately explainable.
Many studies have been carried out, using first-principles computational modeling [7,8,9,10], to understand the stabilities and the reactivities of various chalcopyrite surfaces in the presence, for example, of H2O and O2. Among all chalcopyrite surfaces examined, the chalcopyrite (112) surface (metal- or sulfur-terminated), which gives the most intense powder X-ray diffraction (XRD) peak [9], has recently been found to be the preferential cleavage and the most thermodynamically stable surface (i.e., most unreactive) based on density functional theory (DFT) calculations (surface relaxation) [9]. However, current understanding of the reactivity of the commonly observed chalcopyrite (112) surface is, to the best of our knowledge, limited to theoretical investigations only, with no experimental studies undertaken to date, necessitating a laboratory study to examine the leaching behaviors of this important chalcopyrite (112) surface.
Chalcopyrite is tetragonal with a = 5.289 and c = 10.423 Å and has a structure based on a supercell of the zinc blende structure with Cu+ and Fe3+ being ordered over the tetrahedral sites, leading to a doubling of the c repeat. The mineral typically occurs in tetrahedral crystals bounded by {112} faces often with minor {11-2} faces. If both {112} and {11-2} faces are equally developed, then, the crystal morphology is pseudo-octahedral. In mineralogical texts, chalcopyrite’s cleavage is described as poor on {011} and {111} faces [11].
The aim of this study was to understand the reactivity of the chalcopyrite (112) surface under industrially relevant leaching conditions. To this end, leaching was carried out at room temperature and at pH 1 and in the presence of 0.01 M ferric or ferrous (both added as sulfate) using the chalcopyrite (112) surfaces prepared from a chalcopyrite single crystal. This was followed by atomic force microscopy (AFM) and Raman microspectroscopy analyses for an investigation of variations in surface topography and speciation during leaching, which, in turn, helped to understand the leaching behavior and kinetics.
2. Materials and Methods
2.1. Chalcopyrite
Chalcopyrite single crystals with (112) faces were originally sourced from Animon Mine, Huaron, Cerro de Pasco, Peru. Four slab samples (approximately 10 × 10 × 2 mm, mass ≈ 1 g) were cut parallel to one of the (112) surfaces of the chalcopyrite single crystal, and then polished. All sample preparation was performed by Adelaide Petrographic Laboratories, Adelaide, South Australia. Then, the polished slabs were sonicated in water and acid washed in 3 M HCl for approximately one minute to remove any oxidation layer possibly formed during sample preparation. They were finally rinsed with ethanol (100%) and dried in a desiccator under vacuum prior to leaching. Chalcopyrite was found by powder XRD analysis to contain only a very minor amount of quartz (SiO2) (Supplementary Information (SI) Figure S1).
2.2. Leaching of Chalcopyrite
The four chalcopyrite slabs prepared were completely immersed in leachates and subjected to leaching in 500 mL of pH 1 (H2SO4) solutions in high-density polyethylene (HDPE) bottles containing 0.01 M Fe3+ (Eh ≈ 800 mV, SHE) or 0.01 M Fe2+ (Eh ≈ 560 mV, SHE) for up to 42 days; two samples in the ferric and two in the ferrous solutions. The HDPE bottles were loosely capped to allow atmospheric contact with air to ensure enough oxygen supply for chalcopyrite leaching, particularly, for leaching with ferrous solutions. Slab samples were collected at designated time intervals, rinsed with pure ethanol, and dried with nitrogen gas (99.9%) for atomic force microscopy (AFM) and Raman spectroscopic analyses. After the AFM and Raman analyses, the chalcopyrite samples were immediately re-immersed in the relevant leaching solutions for further leaching. The leachate pH was found to remain unchanged after leaching. Variations in solution Eh were within ± 20 mV for all leaching experiments.
2.3. Analytical Methods
2.3.1. Atomic Force Microscopy
Atomic force microscopy (AFM) was performed using a Bruker Dimension FastScan AFM (Bruker Corporation, Billerica, MA, USA) with a Nanoscope V controller, operating under ambient conditions using PeakForce tapping (PFT) mode. Briefly, PFT is an imaging mode that involves intermittent sample surface contact up to a set applied force, with the sample surface oscillating relative to the AFM tip at a frequency of 0.5–8 kHz and at a user-defined amplitude. The peak repulsive interaction force is measured in real time and it is used as the feedback signal. This allows the PFT mode to reduce the effects of common image artefacts observed with other AFM techniques, such as tapping mode, which tend to be dominated by tip-sample adhesion. All AFM images were acquired using ScanAsyst-Air probes (silicon tips on silicon nitride lever, Bruker) at a scan rate of 1–3 Hz at a resolution of 512 pixels and 512 lines. The spring constant of each probe was calibrated after measurements based on the thermal noise method. The average spring constant for the cantilevers used in this study was 0.45 ± 0.06 N/m which was close to the 0.4 N/m nominal spring constant quoted by the manufacturer. The engagement settings were adjusted manually to ensure the minimal engagement force, which was achieved by adjusting the engagement setpoint and gain (starting at 0.05 V which equates to ≈ 1 nN) until an engagement was achieved. Values for feedback gain and Z-limit were adjusted manually for each image. Efforts were made to probe most of the same areas for the AFM samples (SI, Figure S2).
Only one area per sample was imaged to limit exposure to air. The time typically required from when the sample was removed from the leaching solution to the acquisition of the first AFM image at 5 × 5 µm was approximately 30 to 60 min. Control experiments were performed on a (112) chalcopyrite surface over the course of nearly 1.5 h with no obvious changes observed in surface topography and roughness. These images, and the surface roughness, for each image are displayed in SI, Figure S3, with surface roughness values given in Table S1. Although these AFM data indicated a lack of reactivity in air and no surface damage detectable during AFM analysis, it was still considered to be prudent to keep the samples exposure time to air to a minimum.
The calibration of the height sensor was verified by scanning silicon calibration grids (Bruker model numbers PG (1 μm pitch and 110 nm depth) and VGRP (10 μm pitch and 180 nm depth), as well as Mikromasch model TGZ01 (3 µm pitch and 18 nm depth)). The AFM topography images, presented in this work, were flattened and analyzed using the computer software Nanoscope Analysis (version 1.4). Rq is the root mean square average of the height deviations taken from the mean image data line, while Ra is the arithmetic average of the absolute values of the surface height deviations measured from the mean plane [12]. The Rq and Ra values, which are standard analysis methods to report surface roughness using AFM, were calculated using the same computer software.
2.3.2. Raman Microspectroscopy
Raman microspectroscopic analysis (single spectral and imaging analyses) was performed using a Witec Alpha 300R instrument at an excitation laser wavelength of 532.3 nm with a 100× objective (working distance 0.23 mm and numerical aperture 0.9). Using the 532.3 nm laser wavelength, the penetration depth is in the order of sub-µm (typically being tens to hundreds of nm), and therefore the Raman microspectroscopy is surface sensitive [13]. Typical integration times for single Raman spectral data collection were between 30–60 s. For imaging analysis, the points per line and the lines per image were chosen and adjusted, based on the image sizes, to achieve the best lateral resolution (≈360 nm). For each image collected, the scan and retrace speeds were 112 and 0.5 s/line, respectively, and the integration time was approximately 5 s. Raman analysis of each sample was completed within 5 h. Raman data were processed using the computer software ProjectFOUR (version 4.1; WITec, Ulm, Germany). Raman analysis was not carried out on the AFM chalcopyrite samples, as AFM is an extremely surface sensitive technique and the laser (from the Raman instrument) effect on the surface morphology/speciation is unknown. A relatively small laser power (approximately 0.15 mW) was used for Raman data collection to minimize any possible surface damage (SI, Figure S4). Raman analysis of each sample was completed within 3–5 h.
2.3.3. Thermodynamic Calculation
Calculations of mineral saturation indices were performed using the PHREEQC computer program [14] with the Lawrence Livermore National Laboratory database (‘llnl.dat’), Eh, pH, and the initial solution chemistry of leachates.
3. Results and Discussion
3.1. Raman Microspectroscopy
3.1.1. Fresh Chalcopyrite
The Raman spectrum of the fresh chalcopyrite (112) surface shows a predominant peak at about 294 cm−1 with additional peaks observed at 73, 90, 170, 272, 318, 355, and 372 cm−1 (Figure 1 and Table 1). The Raman peaks above 200 cm−1, which are commonly observed for chalcopyrite, are largely consistent with those reported in the literature [15,16,17,18], while those below 200 cm−1 are scarcely reported [17]. In principle, chalcopyrite has 21 optical modes (at the Г point of the Brillouin zone) [19], of which only the A2 modes are Raman inactive (Equation (1)). Nevertheless, chalcopyrite has a low scattering efficiency and some of the Raman peaks overlap, resulting in many of them not being observable. The Raman peaks at 294 (peak d in Table 1 from the A1 mode), 318 and 355 cm−1 (peaks e and f, respectively, in Table 1 from the B2/E modes) were thought to be associated with the molecular vibration of the Fe-S bond, while the peak at 272 cm−1 (peak c, in Table 1, from the B2 mode) likely results from the Cu-S bond [17,20]. It remains unknown which type of bond vibration causes the Raman scattering at 373 cm−1 (peak g in Table 1), but it is generally thought to be from the E mode [21,22,23,24,25].
Гopt = 1A1 + 2A2 + 3B1 + 3B2 + 6E
3.1.2. Raman Microspectroscopic Analysis of Leached Chalcopyrite (112) Surfaces
The presence of blue spots and colored areas (e.g., yellowish areas indicated by arrows in Figure 2d) after leaching, which were not found on the fresh chalcopyrite surface (Figure S4b), suggests that reaction (dissolution or precipitation) occurred on the chalcopyrite surface. Raman spectra were collected on both “clean” (i.e., appears to be the same as the fresh surface) and ”unclean” areas (blue spots and yellowish areas). Leaching at pH 1 with 0.01 M ferric resulted in decreases in the relative intensities of peaks c, e, f, and g at 14 days and further decreases at 42 days, again suggesting that leaching occurred on the chalcopyrite (112) surface (Figure 1a,c). Sulfur with a predominant peak at about 472 cm−1 has been previously found on chalcopyrite surfaces after leaching for a relatively short period of time (several hours to several days) under similar acidic conditions and in the presence of ferric [15,16,26], but it was not observed on the chalcopyrite (112) surface after leaching with ferric for 42 days in this study (Figure 1c). This suggests that the chalcopyrite (112) surface is relatively inert, consistent with recent DFT calculations reported in Wei et al. [9].
Leaching at pH 1 with 0.01 M ferrous did not result in observable changes at 14 days, except for the decreased relative intensities of peak g at 373 cm−1 (Figure 1b). However, after leaching for 42 days, a predominant Raman peak at approximately 976 cm−1 appeared at several leaching spots examined (spots 4,5, and 7 in Figure 1d) with other minor peaks also observed at 451, 620, and 1100 cm−1, likely arising from FeSO4·7H2O (melanterite) [27]. The PHREEQC calculation suggested that the bulk solution was undersaturated for melanterite (saturation index = −6.7). However, at the solid–fluid interface, the solution can be supersaturated with respect to melanterite, resulting in its precipitation. The difference in the saturation state between the bulk and interfacial solution conditions has also been suggested previously [28]. Raman peaks at 1039, 875, 594, and 424 cm−1 were also observed at another leaching spot (Spot 6 in Figure 1d). The nature of these peaks cannot be identified immediately but is assumed to be from other sulfate species (with strong symmetric stretching vibration in the range of 980 to 1050 cm−1), given that the solution medium was sulfate (sulfuric acid and ferrous sulfate) [29].
3.1.3. Raman Imaging Analysis of Leached Chalcopyrite (112) Surfaces
Raman imaging analysis was carried out on both ”clean” and “unclean’ areas (e.g., blue spots, Figure 2c,d), if present, to identify any possible reaction products and distribution of new surface species formed on the chalcopyrite surface after leaching. At least two areas were mapped for each sample, all showing contrasting distribution of Cu-S and Fe-S bonds (see discussion below). Therefore, only one representative Raman map was selected and presented for each sample. No imaging data were collected on the fresh chalcopyrite samples, as they were cleaned (etched) in 3 M HCl prior to leaching experiments (Section 2.1) and such imaging data cannot be used for comparison with those for samples leached in pH 1 H2SO4 solutions.
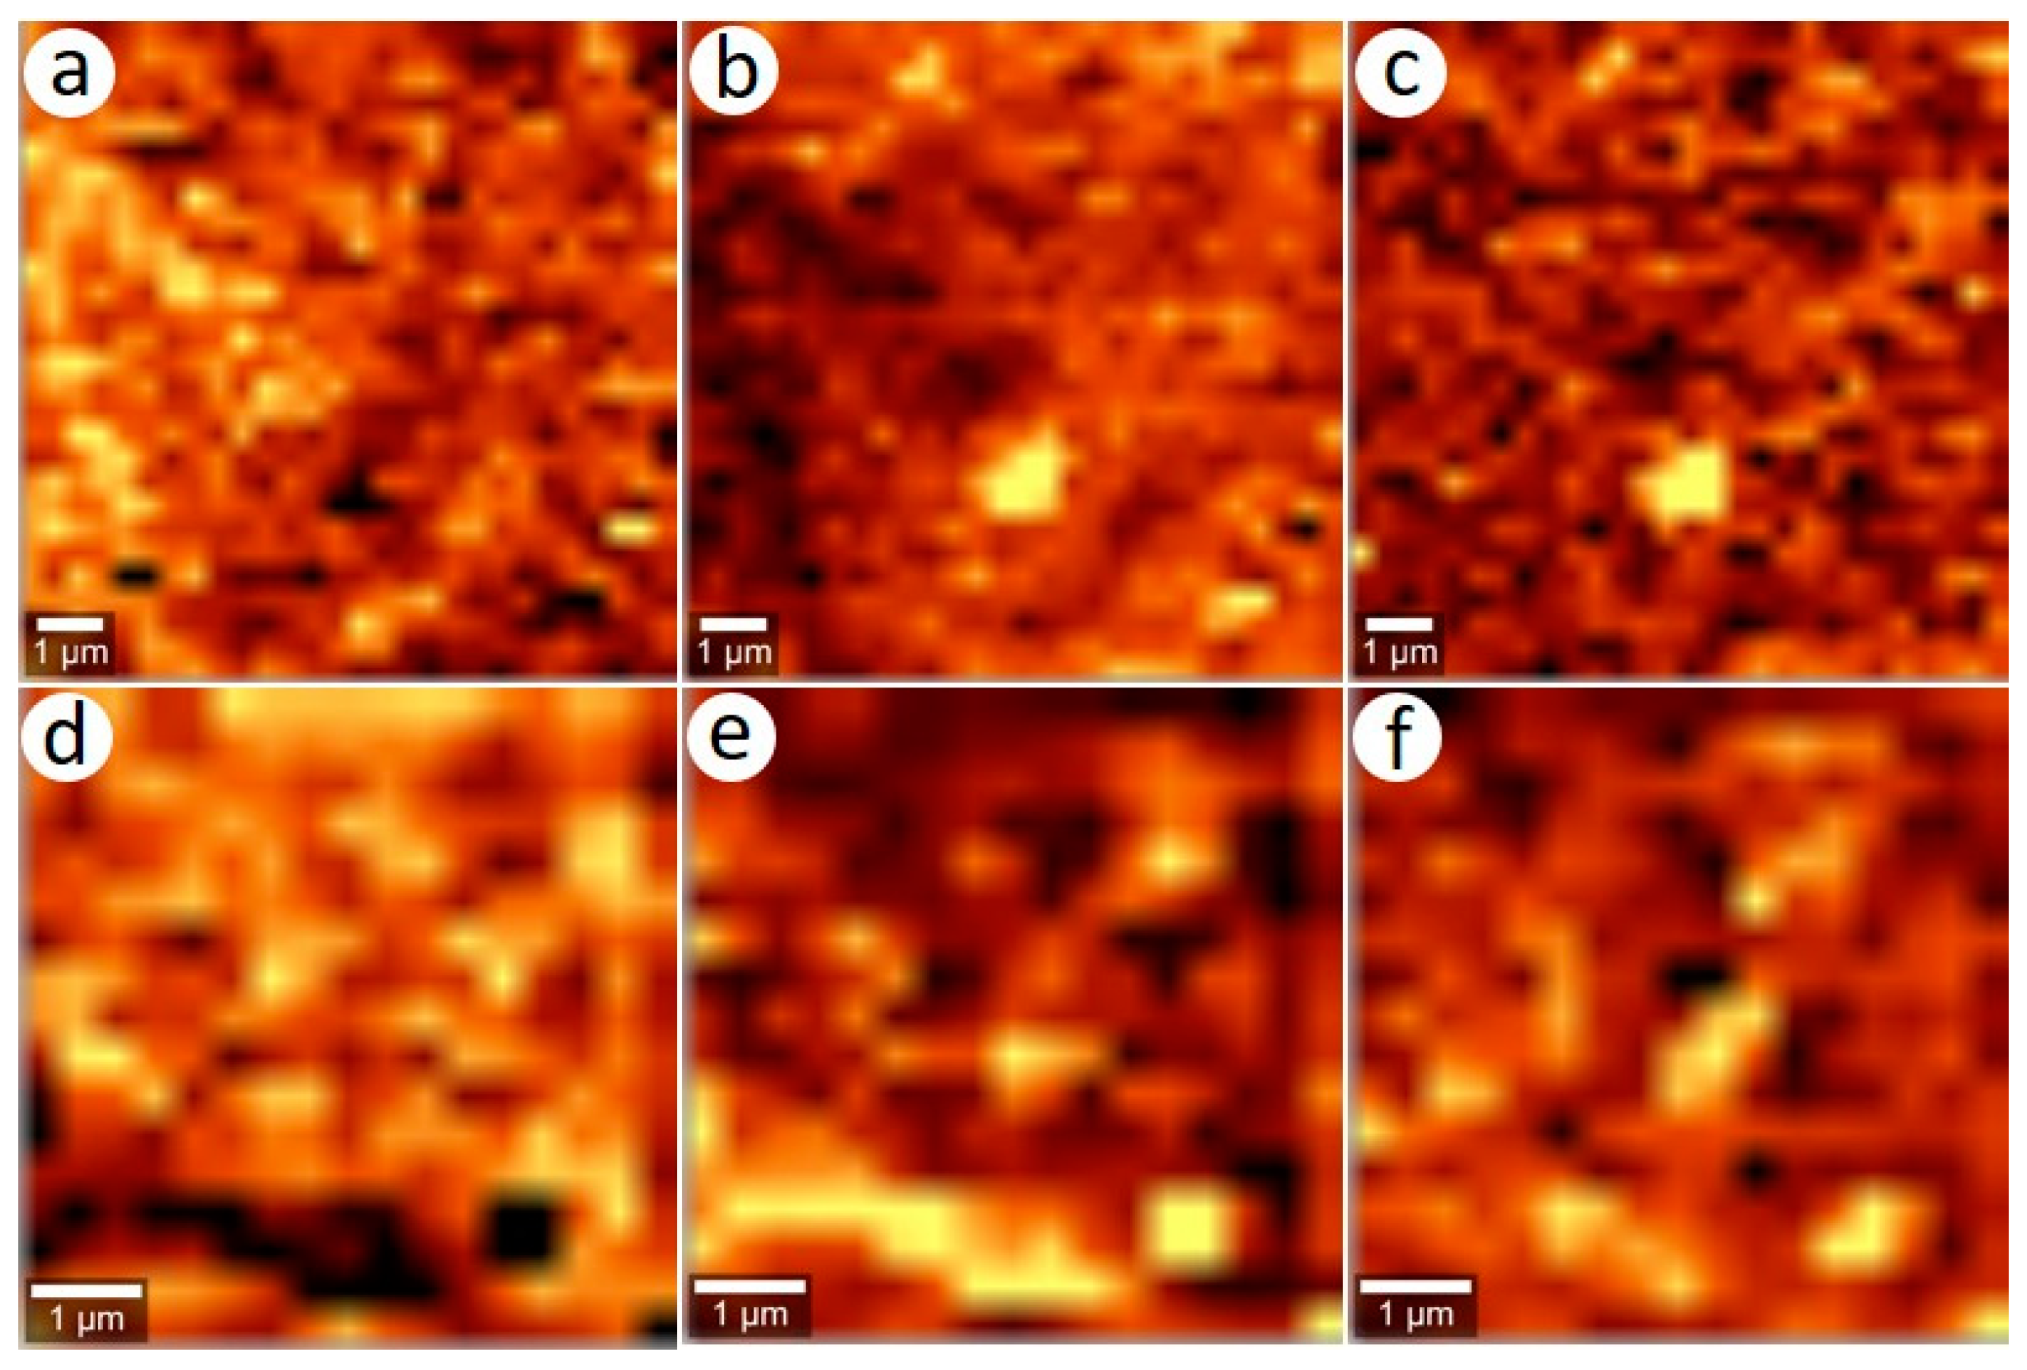
Figure 3 presents Raman maps for the sample leached in the presence of 0.01 M ferric at 14 and 42 days. Images corresponding to three wavenumbers, i.e., 272, 294, and 355 cm−1, were chosen for comparison. Our results clearly showed heterogeneous distributions of different chemical bonds on the chalcopyrite surface, suggesting that leaching of the chalcopyrite (112) surface with ferric is heterogeneous and site sensitive. This is consistent with other spectroscopic investigations of leaching of sulfide minerals (e.g., chalcopyrite and pyrite), which shows that leaching of sulfide minerals occurs heterogeneously at the submicron scale [30,31].
It was also found that the Raman maps at 272 (corresponding to Cu–S bonds) and 294 cm−1 (corresponding to Fe–S bonds) presented contrasting distributions of species at 14 and 42 days (Figure 3a vs. Figure 3b,d vs. Figure 3e). For example, region A clearly shows the presence of Cu-S bonds (272 cm−1, Figure 3a) with almost no Fe-S bonds present (294 cm−1, Figure 3b). In contrast, region B has almost no Cu–S bonds but rather has abundant Fe-S bonds present (Figure 3a,b). The negative correlation between the distributions of the Raman peaks at 272 and 294 cm−1, suggests that there can be preferential leaching of Fe or Cu at specific sites during the leaching of the chalcopyrite (112) surface. The distribution of the Raman peak at 355 cm−1 (Figure 3c,f) was found not to correlate with those at 272 and 294 cm−1.
Raman maps for the chalcopyrite (112) surface leached in the presence of 0.01 M ferrous at both 14 and 42 days showed similar negative correlations between the distributions of the Cu–S peak at 272 cm−1 (Figure 4a,d) and the Fe–S peak at 294 cm−1 (Figure 4b,e). The difference, however, was that the distribution of the Raman peak at 355 cm−1 (Figure 4c,f) was similar to that at 294 cm−1.
These Raman imaging data suggest that the Fe–S and Cu–S bonds were broken at the same time across the surface during leaching, but breakage of these bonds occurred at different locations. It was also found that the peak height ratios of Cu–S and Fe–S Raman bands, calculated from spectra averaged across the entire imaging areas (SI, Figure S5), were different for samples leached in the presence of ferric (0.23 ± 0.05 and 0.22 ± 0.05 at 14 and 42 days, respectively) or ferrous (0.31 ± 0.05 and 0.35 ± 0.05 at 14 and 42 days, respectively). These peak ratios are smaller than that for the ”fresh” chalcopyrite surface (0.52 ± 0.04), suggesting that the Cu–S bonds can be preferentially broken in the chalcopyrite surface during leaching with ferric or ferrous. Notably, these data only reflect changes in the top sub-µm surface layers (the penetration depth of the 532.3 nm Raman laser, Section 2.3.2).
3.2. AFM Analysis
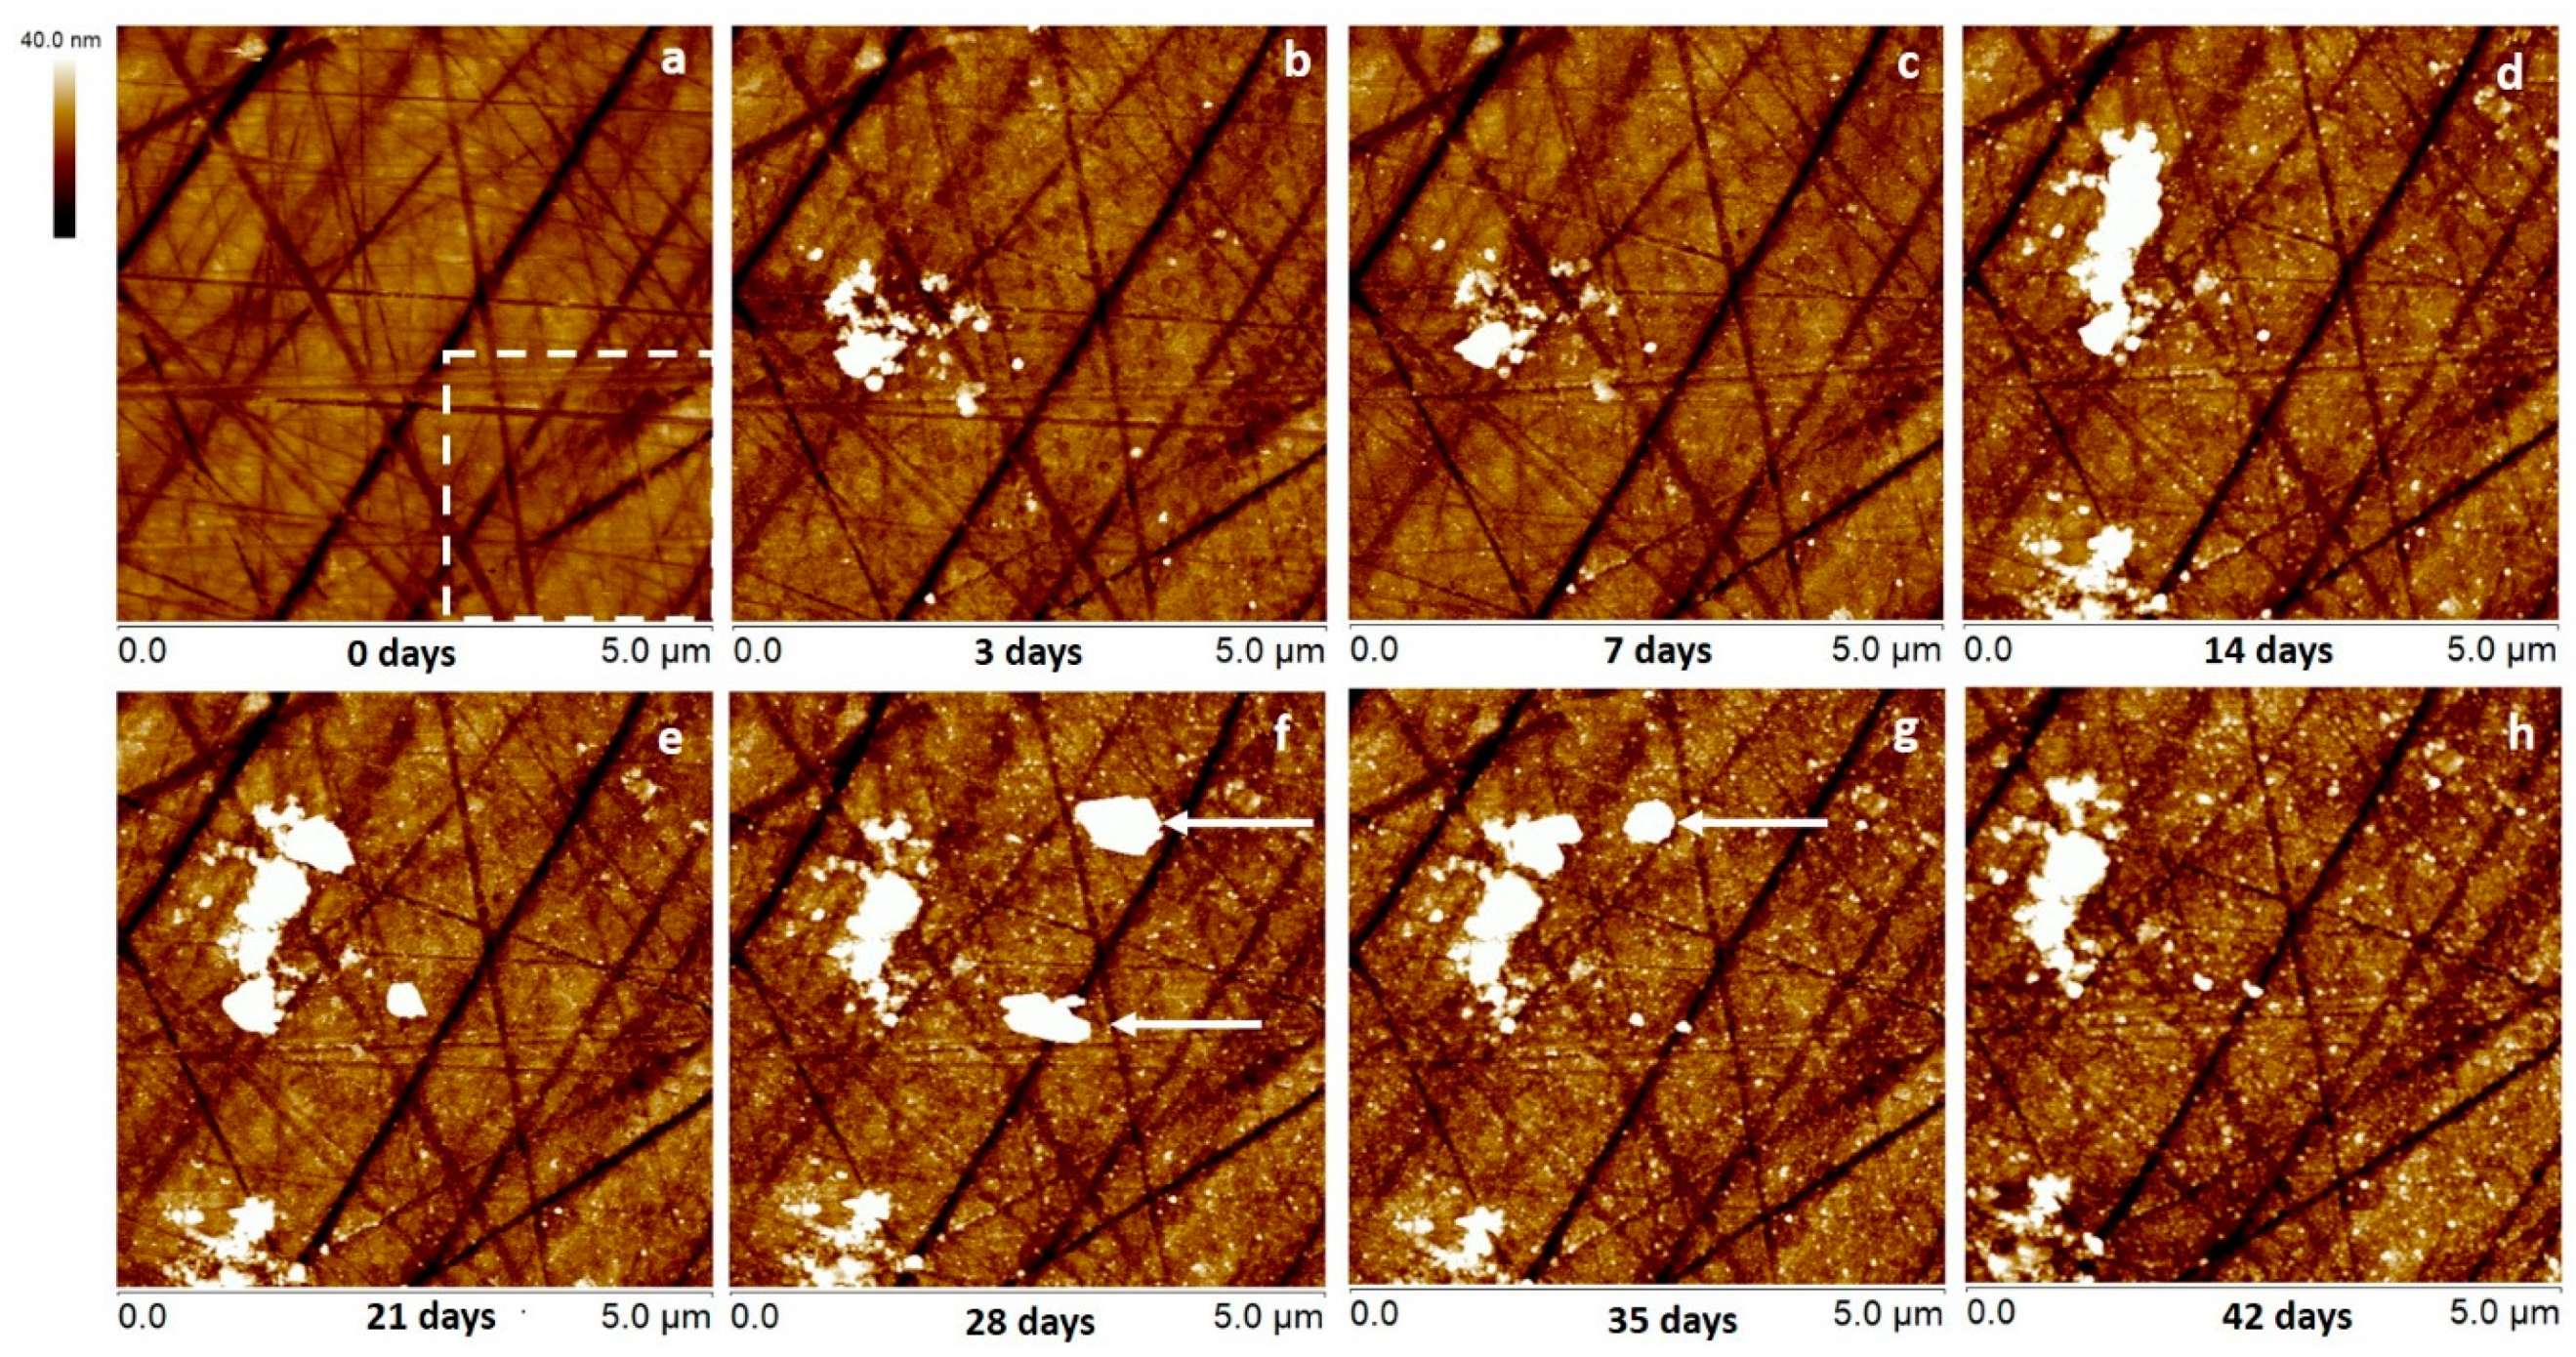
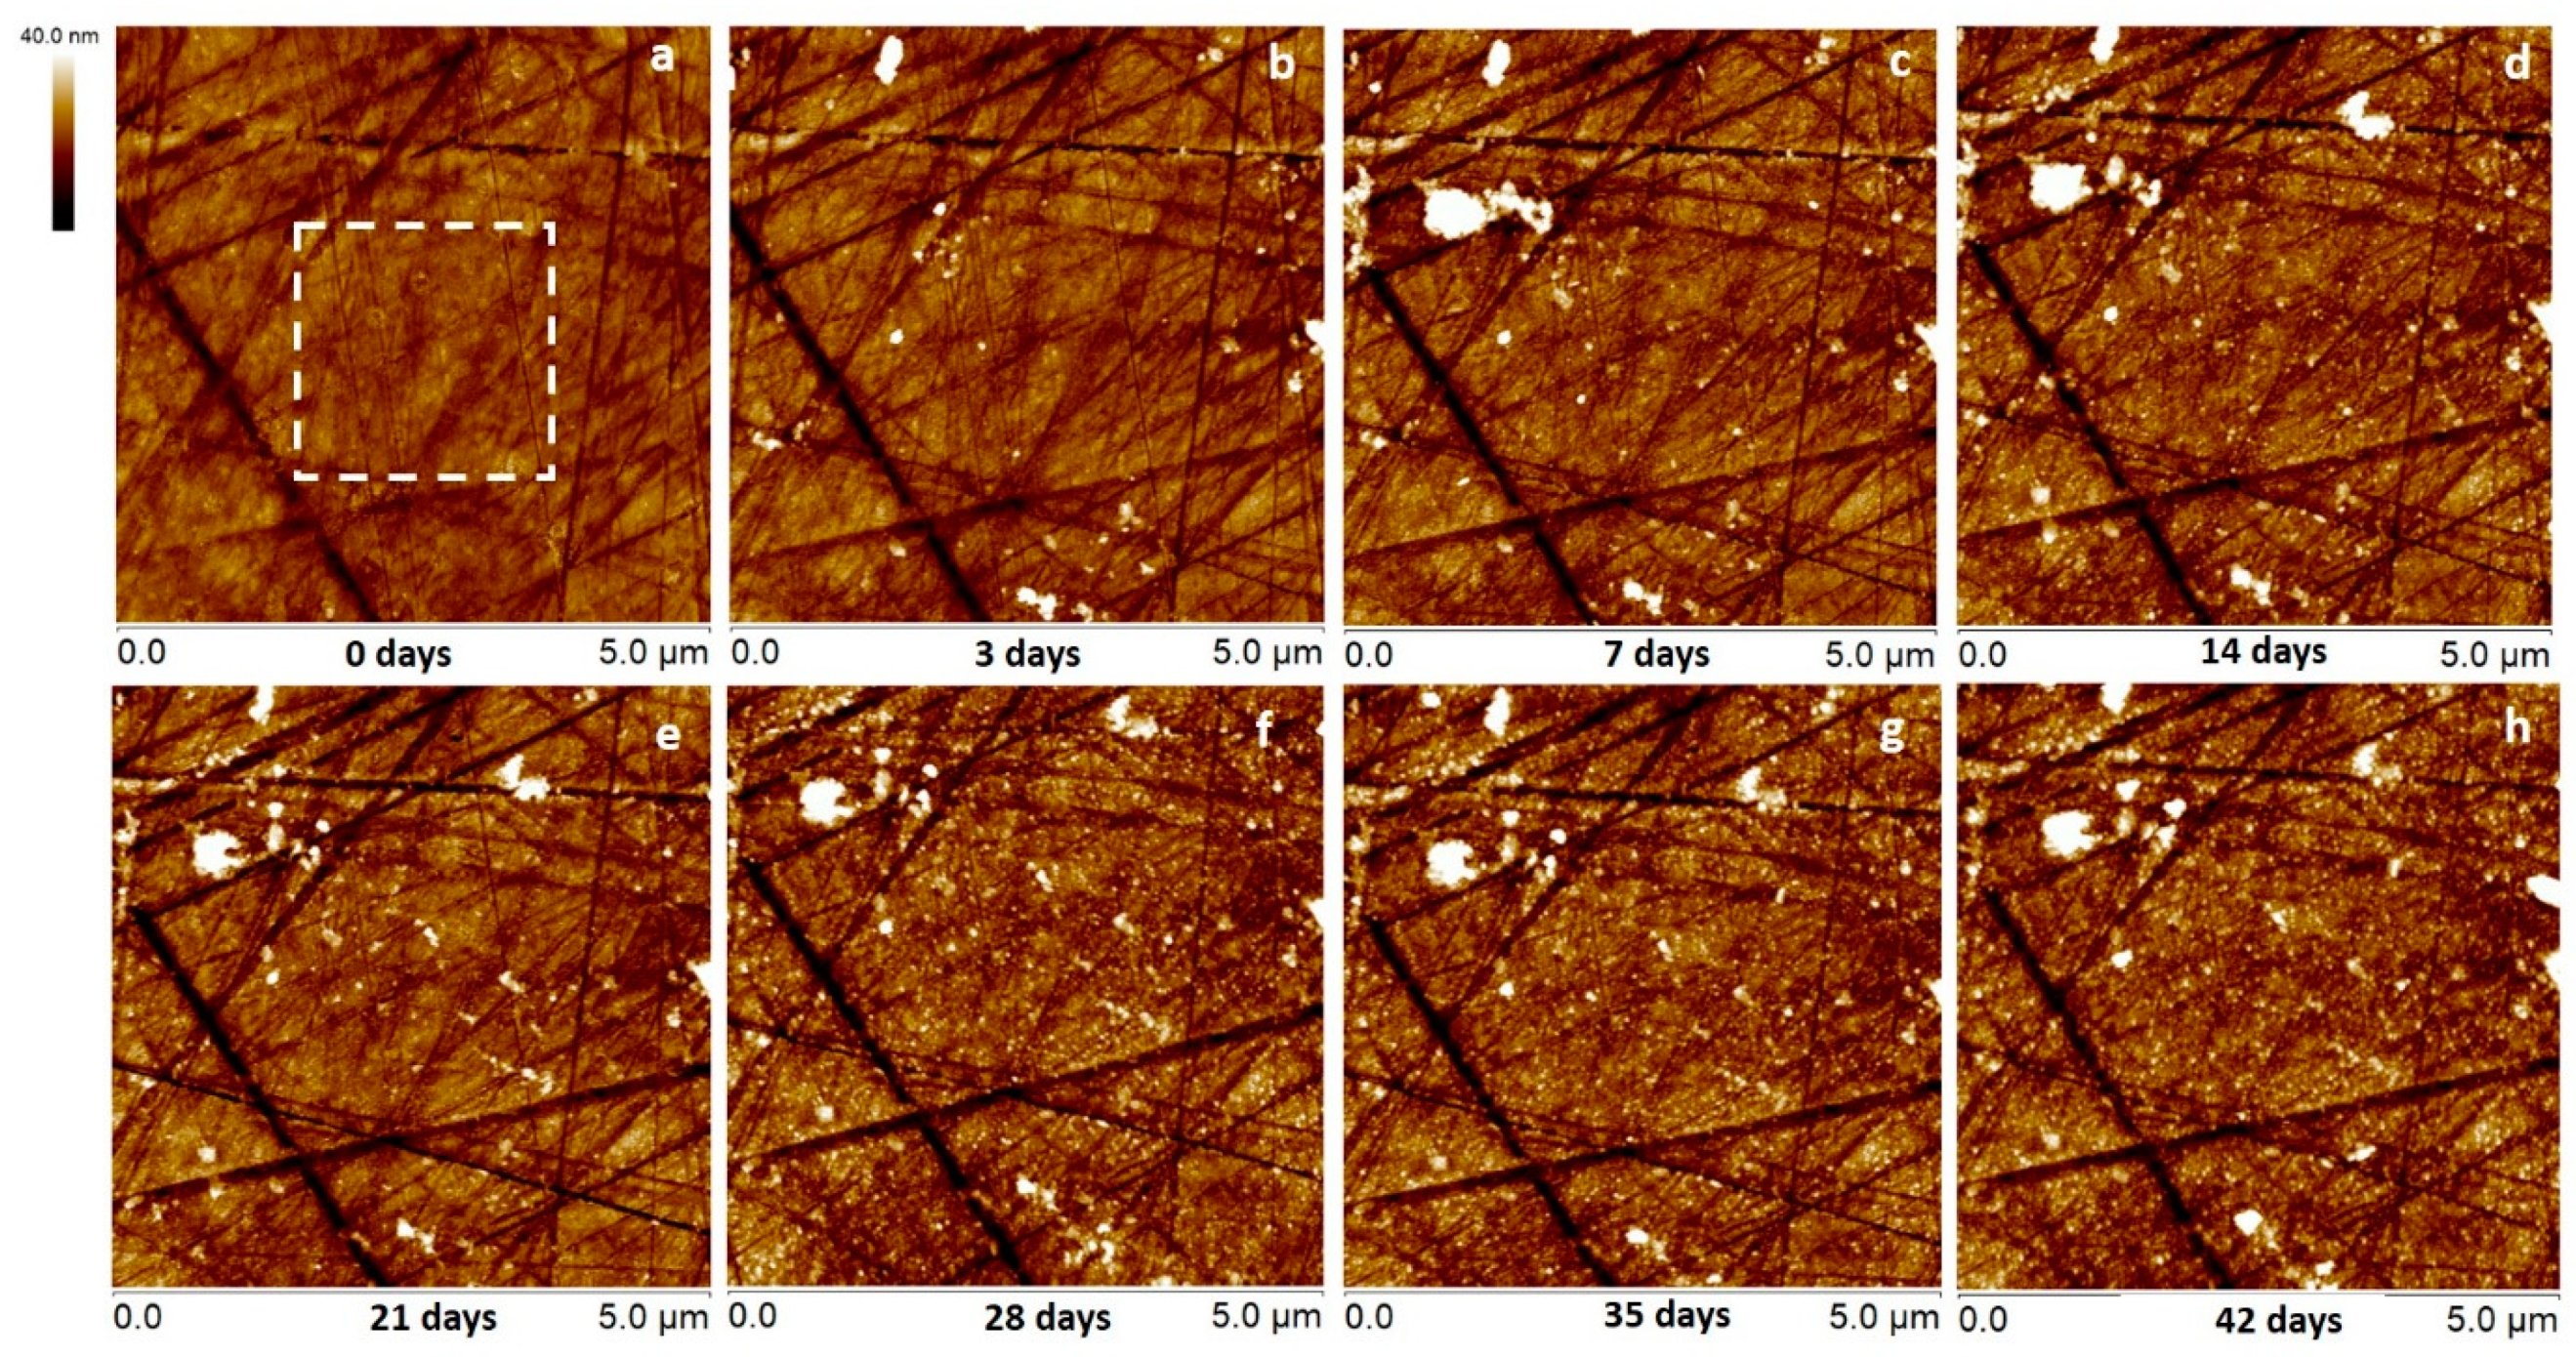
Figure 5 and Figure 6 show AFM topography images for the chalcopyrite (112) surfaces at each stage of leaching. It is obvious from the features in each image that the same region was scanned after each leaching stage. Although a small amount of misalignment can be seen between some images, this is less than 200 nm. It can be observed that there are relatively large particles (possibly melanterite found by Raman analysis or other Fe sulfates) appearing on chalcopyrite after the first three days of leaching for both samples. The chemical composition of this surface material is unknown but is assumed to be Fe sulfates, as melanterite was found by Raman analysis.
As can be seen between images (Figure 5f,g), these particles (indicated by arrows) were also mobile as they appeared, and then disappeared on the surface between leaching treatments. The movement of these large particles could be caused by the AFM tips while scanning across the surface during data collection as has been reported previously for NaCl particles [32]. The height of these particles was typically less than 100 nm, although the highest was ≈ 380 nm. Therefore, this mobile surface material can have a significant impact on the surface roughness measured. This is particularly true for the ferric sample, as the particles appearing on its surface were larger in terms of height, and more mobile than for the ferrous sample. Therefore, we examined the surface roughness by analyzing the specific area of each AFM image that was relatively clear of this material. For the ferric leached samples, a 2 × 2 µm area was selected and is highlighted by the dotted square (hereafter referred to as the boxed area or section) in Figure 5a. The same size area and region of each subsequent image (Figure 5b–h) was also analyzed for surface roughness, to be used for a direct comparison between images and leaching treatment time. For the ferrous-leached sample, the area chosen was again 2 × 2 µm and the region selected was near the centre of each image, as seen by the dotted square in Figure 6a. For each subsequent image (Figure 6b–h), the same area and region of each image was again analyzed for surface roughness.
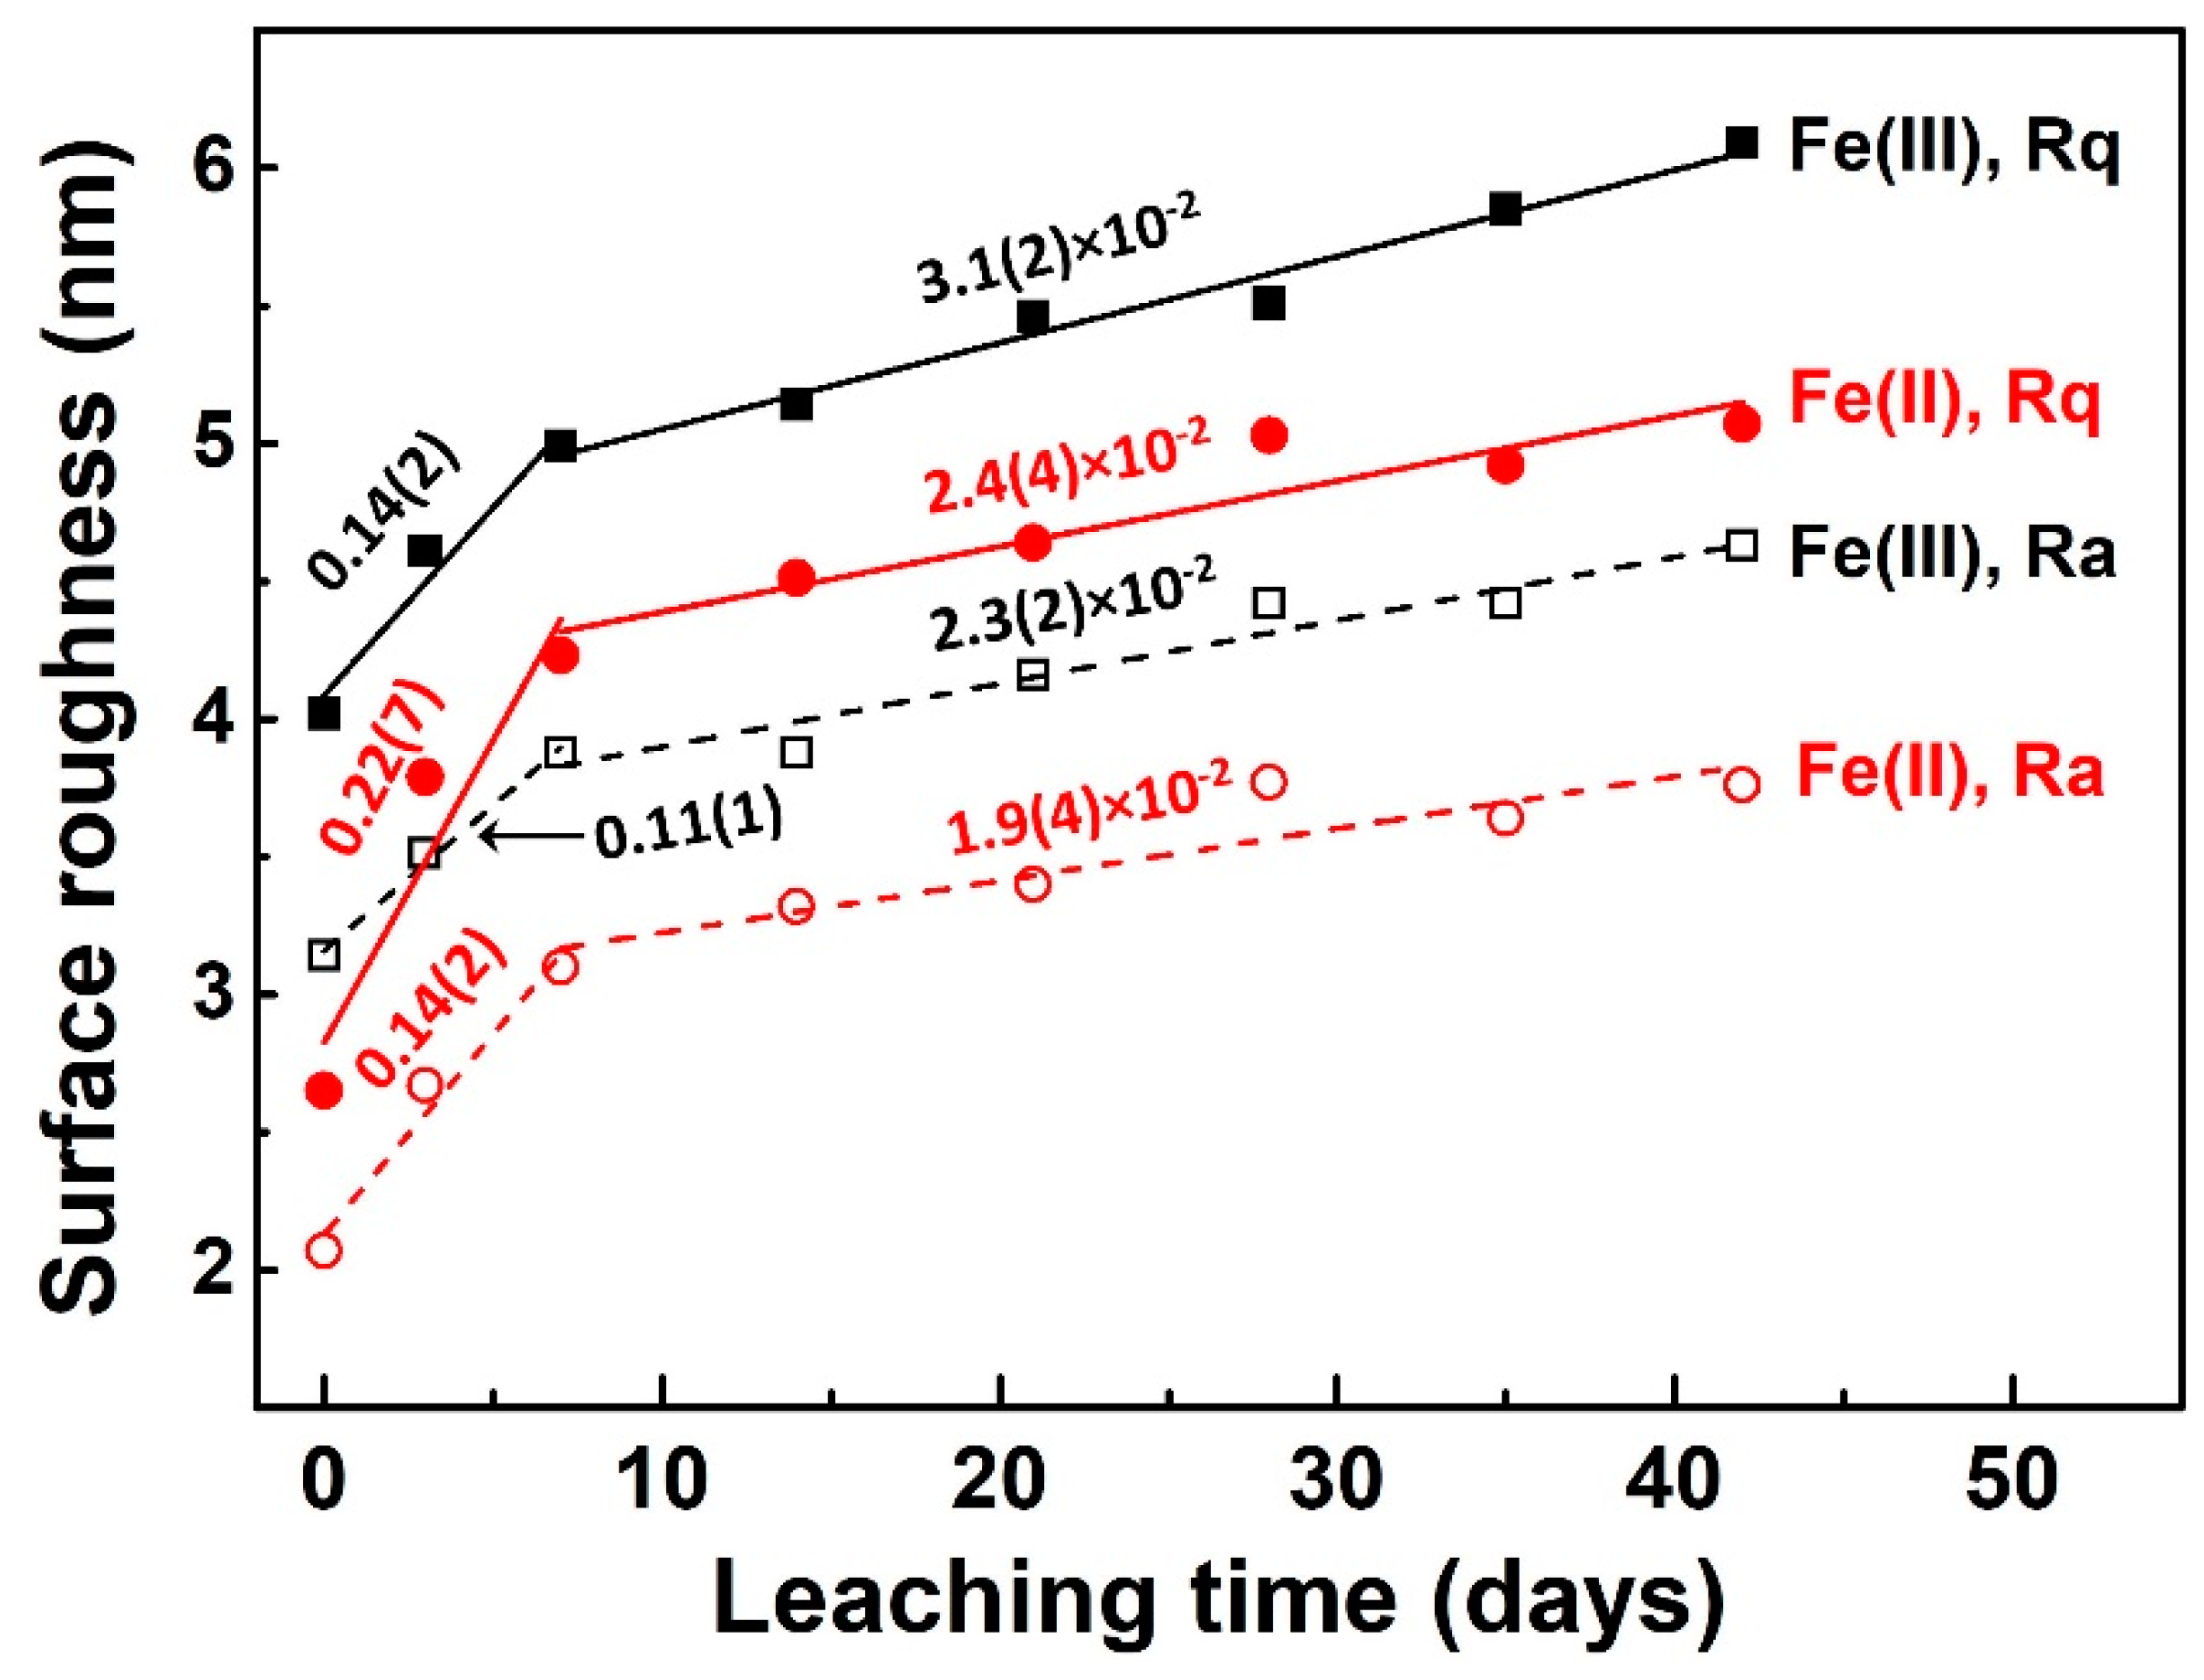
Figure 7 shows roughness comparisons (Ra and Rq) for the boxed sections for the samples leached with ferric and ferrous. It is clear that the surface roughness (both Ra or Rq) increased more rapidly (by a factor of four to ten) in the first seven days and showed a linear correlation with leaching time. Subsequent to seven days, the surface roughness still increased linearly but slower than in the first seven days, as indicated by the slopes from linear regressions (solid/dashed lines in Figure 7). Chalcopyrite has been widely reported to have nonlinear leaching rates [1,3,6,33,34,35]. It is likely that the variations in the increased rate of surface roughness observed in this study were due to the different leaching rates at different stages of leaching. It has been reported that surface passivation occurred during the leaching of chalcopyrite due to the formation of secondary surface precipitates (e.g., elemental sulfur and sulfates) [36,37], which resulted in a decrease in leaching rate. In many instances, Ra and Rq give different answers but do often follow the same trends between images as we generally observed in our cases. However, one can infer from examination of their definitions and formulas, that a single large peak or flaw within the microscopic surface texture can affect (raise) the Rq value more than the Ra value.
4. Conclusions
Leaching of the chalcopyrite (112) surface was found to be very slow, with no formation of sulfur or other reaction products (e.g., Fe oxyhydroxides) observed after 42 days of leaching. Raman spectroscopic analysis only found minimal changes with no new species observable for the chalcopyrite sample leached with ferric over 42 days and almost no changes for the sample leached with ferrous, except for the sulfate peaks (mainly melanterite, FeSO4·7H2O) observed at 42 days for the ferrous leached sample. At a specific reaction site, there existed preferential leaching of either Cu or Fe due to the preferential breakage of the Fe–S or Cu–S bonds. The observation of sulfate on the chalcopyrite surface was possibly due to precipitation of secondary sulfate (melanterite) from leachate. In comparison, AFM data showed some variations in the surface roughness for samples leached in the presence of ferric or ferrous. The rate of increase in surface roughness of both samples leached in ferric and ferrous solutions decreased after seven days (by a factor of four to 10), likely due to surface passivation as commonly found during chalcopyrite leaching. Further work, such as a combined X-ray photoelectron spectroscopy [38,39] and first-principles DFT computational modeling [9,40], is required to understand the surface reaction kinetics and mechanisms of the chalcopyrite (112) surfaces.
Supplementary Materials
The following are available online at https://www.mdpi.com/2075-163X/10/6/485/s1, Figure S1: X-ray powder diffraction analysis of the chalcopyrite, showing the presence of very minor quartz impurity, Figure S2: A typical optical microscope image of a polished chalcopyrite sample surface, Figure S3: Time-resolved AFM images of a chalcopyrite (112) surface, showing no visible changes in topography within approximately 1.5 h, Figure S4: Raman spectra of fresh chalcopyrite collected using different laser powers, Figure S5: Overall Raman spectra corresponding to Raman mapping data, Table S1: Surface roughness, Ra and Rq, derived from time-resolved AFM measurements.
Author Contributions
Conceptualization, G.Q. and A.P.; Methodology, G.Q. and C.T.G.; Data collection and analysis, G.Q. and C.T.G.; Writing—original draft preparation, G.Q. and C.G.; Writing—review & editing, A.P. and S.H.-B.; Supervision, A.P.; Project administration, A.P. and S.H.-B. All authors have read and agreed to the published version of the manuscript.
Funding
This research was funded by the Australian Research Council (ARC) and the BHP Olympic Dam through an ARC Linkage project (LP160101497).
Conflicts of Interest
The authors declare no conflict of interest.
References
- Qian, G.; Li, J.; Li, Y.; Gerson, A.R. Probing the effect of aqueous impurities on the leaching of chalcopyrite under controlled conditions. Hydrometallurgy 2014, 149, 195–209. [Google Scholar] [CrossRef]
- Li, Y.; Kawashima, N.; Li, J.; Chandra, A.P.; Gerson, A.R. A review of the structure, and fundamental mechanisms and kinetics of the leaching of chalcopyrite. Adv. Colloid Interface Sci. 2013, 197–198, 1–32. [Google Scholar] [CrossRef]
- Córdoba, E.M.; Muñoz, J.A.; Blázquez, M.L.; González, F.; Ballester, A. Leaching of chalcopyrite with ferric ion. Part I: General aspects. Hydrometallurgy 2008, 93, 81–87. [Google Scholar]
- Li, Y.; Yao, Y.; Wang, B.; Qian, G.; Li, Z.; Zhu, Y. New insights into chalcopyrite leaching enhanced by mechanical activation. Hydrometallurgy 2019, 189, 105131. [Google Scholar] [CrossRef]
- Li, J.; Kawashima, N.; Kaplun, K.; Absolon, V.J.; Gerson, A.R. Chalcopyrite leaching: The rate controlling factors. Geochim. Cosmochim. Acta 2010, 74, 2881–2893. [Google Scholar] [CrossRef]
- Li, Y.; Wei, Z.; Qian, G.; Li, J.; Gerson, A.R. Kinetics and mechanisms of chalcopyrite dissolution at controlled redox potential of 750 mV in sulfuric acid solution. Minerals 2016, 6, 83. [Google Scholar] [CrossRef]
- de Oliveira, C.; de Lima, G.F.; de Abreu, H.A.; Duarte, H.A. Reconstruction of the Chalcopyrite Surfaces—A DFT Study. J. Phys. Chem. C 2012, 116, 6357–6366. [Google Scholar] [CrossRef]
- de Oliveira, C.; Duarte, H.A. Disulphide and metal sulphide formation on the reconstructed surface of chalcopyrite: A DFT study. Appl. Surf. Sci. 2010, 257, 1319–1324. [Google Scholar] [CrossRef]
- Wei, Z.; Li, Y.; Gao, H.; Zhu, Y.; Qian, G.; Yao, J. New insights into the surface relaxation and oxidation of chalcopyrite exposed to O2 and H2O: A first-principles DFT study. Appl. Surf. Sci. 2019, 492, 89–98. [Google Scholar] [CrossRef]
- Thinius, S.; Islam, M.M.; Bredow, T. The structure of reconstructed chalcopyrite surfaces. Surf. Sci. 2018, 669, 1–9. [Google Scholar] [CrossRef]
- Anthony, J.W.; Bideaux, R.A.; Bladh, K.W.; Nichols, M.C. Handbook of Mineralogy: Elements, Sulfides, Sulfosalts; Mineralogical Society of America: Chantilly, VA, USA, 1990; Volume I, p. 588. [Google Scholar]
- Oliveira, R.R.L.; Albuquerque, D.A.C.; Cruz, T.; Yamaji, F.; Leite, F. Measurement of the Nanoscale Roughness by Atomic Force Microscopy: Basic Principles and Applications, in Atomic Force Microscopy—Imaging, Measuring and Manipulating Surfaces at the Atomic Scale; Bellitto, V., Ed.; Intech: Rijeka, Croatia, 2012; pp. 147–174. [Google Scholar]
- Xu, Z.; He, Z.; Song, Y.; Fu, X.; Rommel, M.; Luo, X.; Hartmaier, A.; Zhang, J.; Fang, F. Topic review: Application of Raman spectroscopy characterization in micro/nano-machining. Micromachines 2018, 9, 361. [Google Scholar] [CrossRef] [PubMed] [Green Version]
- Parkhurst, D.L.; Appelo, C.A.J. Users’s Guide to PHREEQC (Version 2)—A Computer Program for Speciation, Batch-Reaction, One-Dimensional Transport, and Inverse Geochemical Calculations; US Geological Society: Denver, CO, USA, 1999; pp. 1–326. [Google Scholar]
- Yang, Y.; Liu, W.; Chen, M. XANES and XRD study of the effect of ferrous and ferric ions on chalcopyrite bioleaching at 30 °C and 48 °C. Miner. Eng. 2015, 70, 99–108. [Google Scholar] [CrossRef]
- Majuste, D.; Ciminelli, V.S.T.; Osseo-Asare, K.; Dantas, M.S.S.; Magalhães-Paniago, R. Electrochemical dissolution of chalcopyrite: Detection of bornite by synchrotron small angle X-ray diffraction and its correlation with the hindered dissolution process. Hydrometallurgy 2012, 111–112, 114–123. [Google Scholar] [CrossRef]
- das Chagas Almeida, T.; Garcia, E.M.; da Silva, H.W.; Matencio, T.; Lins, V.D. Electrochemical study of chalcopyrite dissolution in sulfuric, nitric and hydrochloric acid solutions. Int. J. Miner. Process. 2016, 149, 25–33. [Google Scholar] [CrossRef]
- Parker, G.K.; Woods, R.; Hope, G.A. Raman investigation of chalcopyrite oxidation. Colloids Surf. Physicochem. Eng. Aspects 2008, 318, 160–168. [Google Scholar] [CrossRef]
- Izquierdo-Roca, V.; Fontané, X.; Saucedo, E.; Jaime-Ferrer, J.S.; Álvarez-García, J.; Pérez-Rodríguez, A.; Bermudez, V.; Morante, J.R. Process monitoring of chalcopyrite photovoltaic technologies by Raman spectroscopy: An application to low cost electrodeposition based processes. New J. Chem. 2011, 35, 453–460. [Google Scholar] [CrossRef]
- White, S.N. Laser Raman spectroscopy as a technique for identification of seafloor hydrothermal and cold seep minerals. Chem. Geol. 2009, 259, 240–252. [Google Scholar] [CrossRef]
- Łażewski, J.; Neumann, H.; Parlinski, K. Ab initio characterization of magnetic CuFeS2. Phys. Rev. B 2004, 70, 195206. [Google Scholar] [CrossRef]
- Koschel, W.H.; Bettini, M. Zone-centered phonons in AIBIIIS2 chalcopyrites. Phys. Status Solidi 1975, 72, 729–737. [Google Scholar] [CrossRef]
- Hope, G.A.; Parker, G.; Woods, R. Gold enhanced observation of surface products in chalcopyrite dissolution. ECS Trans. 2006, 2, 177–188. [Google Scholar]
- Mernagh, T.P.; Trudu, A.G. A laser Raman microprobe study of some geologically important sulphide minerals. Chem. Geol. 1993, 103, 113–127. [Google Scholar] [CrossRef]
- Ohrendorf, F.W.; Haeuseler, H. Lattice dynamics of chalcopyrite type compounds. Part I. vibrational frequencies. Cryst. Res. Technol. 1999, 34, 339–349. [Google Scholar] [CrossRef]
- Yang, Y.; Harmer, S.; Chen, M. Synchrotron-based XPS and NEXAFS study of surface chemical species during electrochemical oxidation of chalcopyrite. Hydrometallurgy 2015, 156, 89–98. [Google Scholar] [CrossRef]
- Sharma, S.K.; Chio, C.H.; Muenow, D.W. Raman spectroscopic investigation of ferrous sulfate hydrates. In Proceedings of the 37th Annual Lunar and Planetary Science Conference, League City, TX, USA, 13–17 March 2006; pp. 1–2. [Google Scholar]
- Ruiz-Agudo, E.; Putnis, C.V.; Putnis, A. Coupled dissolution and precipitation at mineral–fluid interfaces. Chem. Geol. 2014, 383, 132–146. [Google Scholar] [CrossRef]
- Buzgar, N.; Buzatu, A.; Sanislav, I.V. The Raman Study on Certain Sulfates. 2009. Available online: http://geology.uaic.ro/auig/articole/2009%20no1/1_L01-Buzgar%20-%20pag%205-23.pdf (accessed on 19 May 2020).
- Li, Y.; Qian, G.; Brown, P.L.; Gerson, A.R. Chalcopyrite dissolution: Scanning photoelectron microscopy examination of the evolution of sulfur species with and without added iron or pyrite. Geochim. Cosmochim. Acta 2017, 212, 33–47. [Google Scholar] [CrossRef]
- Chandra, A.P.; Gerson, A.R. The mechanisms of pyrite oxidation and leaching: A fundamental perspective. Surf. Sci. Rep. 2010, 65, 293–315. [Google Scholar] [CrossRef]
- Hartmuth, F.; Dietzel, D.; de Wijn, A.S.; Schirmeisen, A. Friction vs. area scaling of superlubric NaCl-particles on graphite. Lubricants 2019, 7, 66. [Google Scholar] [CrossRef] [Green Version]
- Li, Y.; Qian, G.; Li, J.; Gerson, A. Chalcopyrite dissolution at 650 mV and 750 mV in the presence of pyrite. Metals 2015, 5, 1566. [Google Scholar] [CrossRef] [Green Version]
- Dutrizac, J.E. Ferric ion leaching of chalcopyrites from different localities. J. Electron. Mater. 1991, 20, 303–309. [Google Scholar] [CrossRef]
- Qian, G.; Li, Y.; Li, J.; Gerson, A.R. Consideration of enthalpic and entropic energy contributions to the relative rates of chalcopyrite dissolution in the presence of aqueous cationic impurities. Int. J. Miner. Process. 2017, 159, 42–50. [Google Scholar] [CrossRef]
- Córdoba, E.M.; Muñoz, J.A.; Blázquez, M.L.; González, F.; Ballester, A. Passivation of chalcopyrite during its chemical leaching with ferric ion at 68 °C. Miner. Eng. 2009, 22, 229–235. [Google Scholar] [CrossRef]
- Klauber, C. A critical review of the surface chemistry of acidic ferric sulphate dissolution of chalcopyrite with regards to hindered dissolution. Int. J. Miner. Process. 2008, 86, 1–17. [Google Scholar] [CrossRef]
- Acero, P.; Cama, J.; Ayora, C. Kinetics of chalcopyrite dissolution at pH 3. Eur. J. Mineral. 2007, 19, 173–182. [Google Scholar] [CrossRef]
- Harmer, S.L.; Thomas, J.E.; Fornasiero, D.; Gerson, A.R. The evolution of surface layers formed during chalcopyrite leaching. Geochim. Cosmochim. Acta 2006, 70, 4392–4402. [Google Scholar] [CrossRef]
- Zhu, J.; Xian, H.; Lin, X.; Tang, H.; Du, R.; Yang, Y.; Zhu, R.; Liang, X.; Wei, J.; Teng, H.H.; et al. Surface structure-dependent pyrite oxidation in relatively dry and moist air: Implications for the reaction mechanism and sulfur evolution. Geochim. Cosmochim. Acta 2018, 228, 259–274. [Google Scholar] [CrossRef]
Figure 1.
Raman spectra of chalcopyrite before and after leaching for 14 (a,b) and 42 days (c,d) at pH 1 in the presence of ferrous and ferric. ⓪, fresh chalcopyrite. ➀ to ➈ in (a) to (d) correspond to Raman spots shown in Figure 2.
Figure 1.
Raman spectra of chalcopyrite before and after leaching for 14 (a,b) and 42 days (c,d) at pH 1 in the presence of ferrous and ferric. ⓪, fresh chalcopyrite. ➀ to ➈ in (a) to (d) correspond to Raman spots shown in Figure 2.


Figure 2.
Optical images showing the positions of Raman spot analyses for chalcopyrite samples leached with ferric and ferrous for 14 (a–d) and 42 days (e–h). Rectangular areas indicate imaging areas.
Figure 2.
Optical images showing the positions of Raman spot analyses for chalcopyrite samples leached with ferric and ferrous for 14 (a–d) and 42 days (e–h). Rectangular areas indicate imaging areas.

Figure 3.
Raman maps for chalcopyrite samples leached in the presence of ferric at 14 (a–c) and 42 days (d–f). (a) and (d) 272 cm−1; (b) and (e) 294 cm−1; (c) and (f) 355 cm−1.
Figure 3.
Raman maps for chalcopyrite samples leached in the presence of ferric at 14 (a–c) and 42 days (d–f). (a) and (d) 272 cm−1; (b) and (e) 294 cm−1; (c) and (f) 355 cm−1.

Figure 4.
Raman maps for chalcopyrite samples leached in the presence of ferrous at 14 (a–c) and 42 days (d–f). (a) and (d) 272 cm−1; (b) and (e) 294 cm−1; (c) and (e) 355 cm−1.
Figure 4.
Raman maps for chalcopyrite samples leached in the presence of ferrous at 14 (a–c) and 42 days (d–f). (a) and (d) 272 cm−1; (b) and (e) 294 cm−1; (c) and (e) 355 cm−1.

Figure 5.
Atomic force microscopy (AFM) images of a chalcopyrite (112) surface leached at pH 1 and in the presence of ferric: 0 (a), 3 (b), 7 (c), 14 (d), 21 (e), 28 (f), 35 (g) and 42 (h) days.
Figure 5.
Atomic force microscopy (AFM) images of a chalcopyrite (112) surface leached at pH 1 and in the presence of ferric: 0 (a), 3 (b), 7 (c), 14 (d), 21 (e), 28 (f), 35 (g) and 42 (h) days.

Figure 6.
AFM images of a chalcopyrite (112) surface leached at pH 1 and in the presence of ferrous: 0 (a), 3 (b), 7 (c), 14 (d), 21 (e), 28 (f), 35 (g) and 42 (h) days.
Figure 6.
AFM images of a chalcopyrite (112) surface leached at pH 1 and in the presence of ferrous: 0 (a), 3 (b), 7 (c), 14 (d), 21 (e), 28 (f), 35 (g) and 42 (h) days.

Figure 7.
The surface roughness, Rq and Ra, of the boxed areas for the chalcopyrite (112) surfaces leached at pH 1 and in the presence of ferric and ferrous. Slopes correspond to rates (nm/day) of increase in AFM surface roughness, with errors from linear regression given in parentheses.
Figure 7.
The surface roughness, Rq and Ra, of the boxed areas for the chalcopyrite (112) surfaces leached at pH 1 and in the presence of ferric and ferrous. Slopes correspond to rates (nm/day) of increase in AFM surface roughness, with errors from linear regression given in parentheses.


Table 1.
Raman peaks observed for chalcopyrite before and after leaching at pH 1 in ferric and ferrous solutions.
Table 1.
Raman peaks observed for chalcopyrite before and after leaching at pH 1 in ferric and ferrous solutions.
| Raman Peak | a | b | c | d | e | f | g | h |
| Position (cm−1) | 90 | 170 | 272 | 294 | 318 | 355 | 373 | 424 |
| Raman Peak | i | j | k | l | m | n | o | |
| Position (cm−1) | 451 | 594 | 620 | 875 | 976 | 1039 | 1100 |
© 2020 by the authors. Licensee MDPI, Basel, Switzerland. This article is an open access article distributed under the terms and conditions of the Creative Commons Attribution (CC BY) license (http://creativecommons.org/licenses/by/4.0/).
Share and Cite
MDPI and ACS Style
Qian, G.; Gibson, C.T.; Harmer-Bassell, S.; Pring, A. Atomic Force Microscopy and Raman Microspectroscopy Investigations of the Leaching of Chalcopyrite (112) Surface. Minerals 2020, 10, 485. https://doi.org/10.3390/min10060485
AMA Style
Qian G, Gibson CT, Harmer-Bassell S, Pring A. Atomic Force Microscopy and Raman Microspectroscopy Investigations of the Leaching of Chalcopyrite (112) Surface. Minerals. 2020; 10(6):485. https://doi.org/10.3390/min10060485
Chicago/Turabian StyleQian, Gujie, Christopher T. Gibson, Sarah Harmer-Bassell, and Allan Pring. 2020. "Atomic Force Microscopy and Raman Microspectroscopy Investigations of the Leaching of Chalcopyrite (112) Surface" Minerals 10, no. 6: 485. https://doi.org/10.3390/min10060485
Note that from the first issue of 2016, this journal uses article numbers instead of page numbers. See further details here.