Raman Spectroscopy Study of Phosphorites Combined with PCA-HCA and OPLS-DA Models


1
School of Science and Hubei Key Laboratory of Optical Information and Pattern Recognition, Wuhan Institute of Technology, Wuhan 430205, China
2
School of Xingfa Mining Engineering, Wuhan Institute of Technology, Wuhan 430205, China
*
Authors to whom correspondence should be addressed.
Minerals 2019, 9(10), 578; https://doi.org/10.3390/min9100578
Submission received: 26 August 2019
/
Revised: 11 September 2019
/
Accepted: 21 September 2019
/
Published: 24 September 2019
(This article belongs to the Special Issue Advances in Application of Spectroscopic Techniques for Minerals Processing)
Abstract
:Phosphorite is a nonrenewable strategic resource, a convenient and rapid method of phosphorite grade identification and classification is important to improve phosphate utilization. In this study, Raman spectroscopy has been combined with principal component analysis and hierarchical clustering analysis (PCA-HCA) and orthogonal partial least squares-discriminant analysis (OPLS-DA) models for an investigation of different grade phosphorite samples. Both the PCA-HCA and OPLS-DA models showed that different grade phosphorite samples can be clearly distinguished by statistically analyzing the Raman spectra after smoothing, baseline correction, and first derivation. In addition, the S-line study on the OPLS-DA model clearly demonstrated that the symmetrical stretching vibrational mode of phosphate near 960 cm−1 had a much more significant contribution than other vibrational modes for the differentiation of different grade phosphorite samples.
1. Introduction
Phosphorite is a nonmetallic mineral, which is an important raw material for many kinds of phosphorus products [1,2,3,4,5]. The main types of phosphorite are magmatic apatite, sedimentary metamorphic apatite, and sedimentary rock-type apatite. These phosphorites constitute essentially the apatite group with a wide range of accessory minerals of quartz, calcite, dolomite, and silicates, etc. Because of the diverse compositions, most phosphorites must be pretreated to reach a qualified phosphate concentrate. Thus, the classification of phosphorite grade is an important issue in the study of various types of phosphorites. The common methods for determining phosphorite grade include conventional chemical analyses, infrared spectroscopy, nuclear magnetic resonance, X-ray spectroscopy, and plasma mass spectrometry, etc. [5,6,7,8,9,10], however, most of these methods require complex sample preparation and are difficult to perform on site for underground measurements. Therefore, it is of great interest to study a powerful method to meet these difficulties.
Raman spectroscopy is a powerful, fast, and nondestructive experimental technique, which has been extensively applied not only in basic scientific researches, but also for practical applications. It can provide physical, chemical, and structural characteristics of investigated samples [11,12,13,14,15,16,17,18,19,20,21,22,23,24]. In the past decade, Raman spectroscopy has been applied for quantitative and qualitative studies of various types of minerals. Frost et al. [15] suggested that Raman technology is a powerful and underutilized technique in terms of mineralogy for the study of closely related minerals. Dörfer et al. [16] proposed four different ways to generate quantitative and qualitative mineral information based on a Raman mapping experiment. Bartholomew et al. [17] showed that Raman spectroscopy is effective for mineral identification through spectral pattern matching and it offers a number of practical advantages over established mineral-identification technologies. Lopez-Reyes et al. [18] used Raman Laser Spectrometer technology to quantify and determine the mineral concentration of rock powder in Mars exploration. Sharma et al. [19] developed a scanning standoff Raman spectroscopy system for mapping out the spatial distributions of selected minerals at long distances (10–100 m). Raman spectroscopy also has been applied to study various types of phosphorites. Antonakos et al. [20] studied the differences between biological apatite and different types of natural apatite and synthetic apatite. Elgharbi et al. [21] found the structure and composition of the Tunisian phosphorite after calcination at different temperatures. Wang et al. [22] analyzed the structural changes of synthetic carbonate apatite and natural bone minerals. These studies suggested that Raman spectroscopy is a promising method for the tremendous research efforts of phosphorite. Nevertheless, the related research is still short in the aspect of rapid identification and classification of phosphorite grade by Raman spectroscopy, and therefore further research and exploration would be meaningful and necessary.
In this study, Raman spectroscopy has been combined with chemometrics methods of principal component analysis and hierarchical clustering analysis (PCA-HCA) and orthogonal partial least squares-discriminant analysis (OPLS-DA) for an investigation of different grade phosphorite samples. Combining the advantages of Raman spectroscopy and chemometrics analyses, our results show that different grade phosphorite samples can be clearly distinguished. This provides a promising method for future practical applications of quick on site classification of different grade phosphorite samples.
2. Materials and Methods
2.1. Samples
The following six phosphorite power samples with different grade values were studied: high grade samples A and B, medium grade samples C and D, and low grade samples E and F. Apatite Ca5(PO4)3(F,Cl,OH) was the main mineral containing phosphorus in these phosphorite samples, and the phosphorite grade was calculated by the P2O5 content. The grade values of samples A–E were 31.25%, 29.06%, 25.26%, 22.08%, 12.12%, and 3.29%, respectively; which were estimated with the same procedure as “Determination of Phosphorus Pentoxide Content in phosphorite by Quinoline Phosphomolybdate Volumetric Method” (GB/T 1871.1-1995). Sample A was from Weng’an, Guizhou, China. Samples B, C, D, E, and F were from Jinning, Yunnan, China. The colors of these powder samples were light greyish or light yellowish.
2.2. Raman Scattering
Before the Raman scattering measurements, all the samples were filtered by sieve with 60 meshes for making pellet samples. For each grade sample, ten pellets were prepared with an initial amount of sample (250 mg) and same hand press pressure. The Raman spectra of the pellet samples were obtained in backscattering configuration with an XperRam200 spectrometer (Nanobase, Seoul, Korea) connected to an Olympus BX41M-LED microscope with a 50X, NA = 0.55 objective lens. The excitation laser had a wavelength of 532 nm. The collected Raman signal was dispersed with 1800 lines mm−1 grating and focused on an air-cooled CCD detector. The final spectrum for each sample was recorded in the spectral window of 100–1950 cm−1 with 20 s acquisition time. All the spectra were corrected in wavenumber by using the 521 cm−1 phonon mode of a Si substrate. For each pellet sample, five random points were measured, and the average spectrum of these five random points were used to characterize the pellet. A total of 60 Raman spectra of the pellet samples were obtained for the PCA-HCA and OPLS-DA analyses.
2.3. PCA-HCA and OPLS-DA
Before PCA-HCA and OPLS-DA analyses, the 60 Raman spectra of the pellet samples were smoothed, and baseline corrected. Savitzky–Golay (SG) convolution method was used for smoothing with 8-point polynomial of order 2. The adaptive iteratively reweighted Penalized Least Squares (airPLS) algorithm was used for baseline correction. In addition, first-order and second-order derivatives were performed on the smoothed and baseline corrected spectra to further eliminate baseline and fluorescence contributions using Origin 2017 (OriginLab, Northampton, USA).
The PCA-HCA study was performed with SIMCA software v.14.1 (Umetrics, Umea, Sweden). PCA is an unsupervised model which simplifies the interpretation of variables between samples by dimensionality reduction [25,26,27,28,29,30]. The dimensionality reduction of spectral data by unsupervised PCA not only reflects most of the original spectral information, but also reflects the difference between the sample points [25,26,27,28]. HCA is a grouping structure method which defines sample data by dendrogram [25,26,29]. HCA analysis using reduced spectral data can effectively compress the number of variables participating in a Euclidean distance calculation [30]. Through the combination of PCA and HCA, the natural grouping property of phosphorite samples can be confirmed.
The OPLS-DA study was performed with SIMCA software v.14.1 (Umetrics, Umea, Sweden). The OPLS method is an extension of PLS and it is very helpful to find relevant information associated with particular samples and variables of a dataset [31,32,33,34,35]. R2X, R2Y, and Q2 are the quality evaluation indexes of the models established in OPLS-DA analysis. R2X (cum) and R2Y (cum) are the cumulative sum of squares of all x-variables and y-variables explained by all extracted components. The cumulative prediction degree of the model described by parameter Q2 is also called prediction superiority. Classification of different grade phosphorite samples was directly reflected by the principal component scores of the OPLS-DA model. In addition, the S-line study of the OPLS-DA model demonstrated which vibrational mode had significantly contributed to the differentiation of different grade phosphorite samples.
3. Results and Discussion
3.1. Raman Spectra
Figure 1a shows the Raman spectra of the six different grade phosphorite samples. Five characteristic spectra for each sample were presented, and these spectra were SG smoothed and airPLS baseline corrected. Apatite Ca5(PO4)3(F, Cl, and OH) is the main mineral containing phosphorus in phosphorite [23]. PO43− is a tetrahedral pentaatomic group with four vibrational modes, namely, symmetrical stretching vibration (V1), double degenerate bending vibration (V2), triple nonsymmetrical stretching vibration (V3), and triple degenerate bending vibration (V4) [20,21,23]. In Figure 1a, the strong peak near 960 cm−1 belongs to the V1 mode; the weak peak near 430 cm−1 can be assigned to the V2 mode; the weak peaks near 1035 cm−1 and 1050 cm−1 correspond to the V3 modes; and the weak peak near 585 cm−1 is correlated with the V4 mode [20,21,22,23].
In addition to the characteristic peaks of phosphate, Raman peaks of quartz, calcite, and dolomite, etc. were also observed. The peak near 465 cm−1 is correlated with the stretching vibration of Si–O in quartz [23]. The two peaks near 1085 cm−1 and 280 cm−1 are Raman modes of calcite CaCO3 [24], in which the 1085 cm−1 mode is correlated with the symmetrical stretching vibration of C–O in CO32−, and the 282 cm−1 mode is the external vibrational mode of CO32−. The peak near 1100 cm−1 corresponds to the C–O vibration of dolomite CaMg(CO3)2 [23]. The two peaks near 1340 cm−1 and 1445 cm−1 are disordered carbon D bands, and the peak near 1580 cm−1 corresponds to disordered carbon G bands [21,23]. The peak near 300 cm−1 belongs to hematite [28].
In Figure 1a, the Raman spectra of the six different grade phosphorite samples have complex and different features. For a clearer observation of the major difference between different grade phosphorite samples, first and second derivatives of the Raman spectra in Figure 1a were performed, and the results are presented in Figure 1b,c, respectively. As shown in Figure 1a–c, the strong peak near 960 cm−1 of the V1 (PO43−) mode had a major contribution for the differences of the six different grade phosphorite samples. In previous studies, it was also shown that this peak should be used to distinguish different types of phosphorite samples, since the V1 (PO43−) mode has a much stronger intensity than that of V2, V3, and V4 modes [22,23].
For a clear observation of the phosphorite grade dependence on the strong V1 (PO43−) mode, in Figure 1d, the averaged Raman spectra of the six different grade phosphorite samples were compared in the zoomed spectral range of 950–980 cm−1. For each sample, the averaged spectrum was obtained by averaging all the spectra of the 10 pellets. Figure 1d shows that for the phosphorite samples obtained from Jinning, the intensity of the V1 (PO43−) mode increases systematically with increasing phosphorite grade. However, if the sample from Weng’an is included, or the peak position of the V1 (PO43−) mode is included, there is no systematic change of Raman spectra when the phosphorite grade varies. Thus, simple average analysis of the Raman spectra of different phosphorite grade samples is not helpful for the identification of phosphorite grade, which would be correlated with the significant inhomogeneity property of phosphorite samples. Therefore, in the following, we apply statistical chemometrics methods for the identification of different phosphorite grade samples.
3.2. PCA-HCA Study
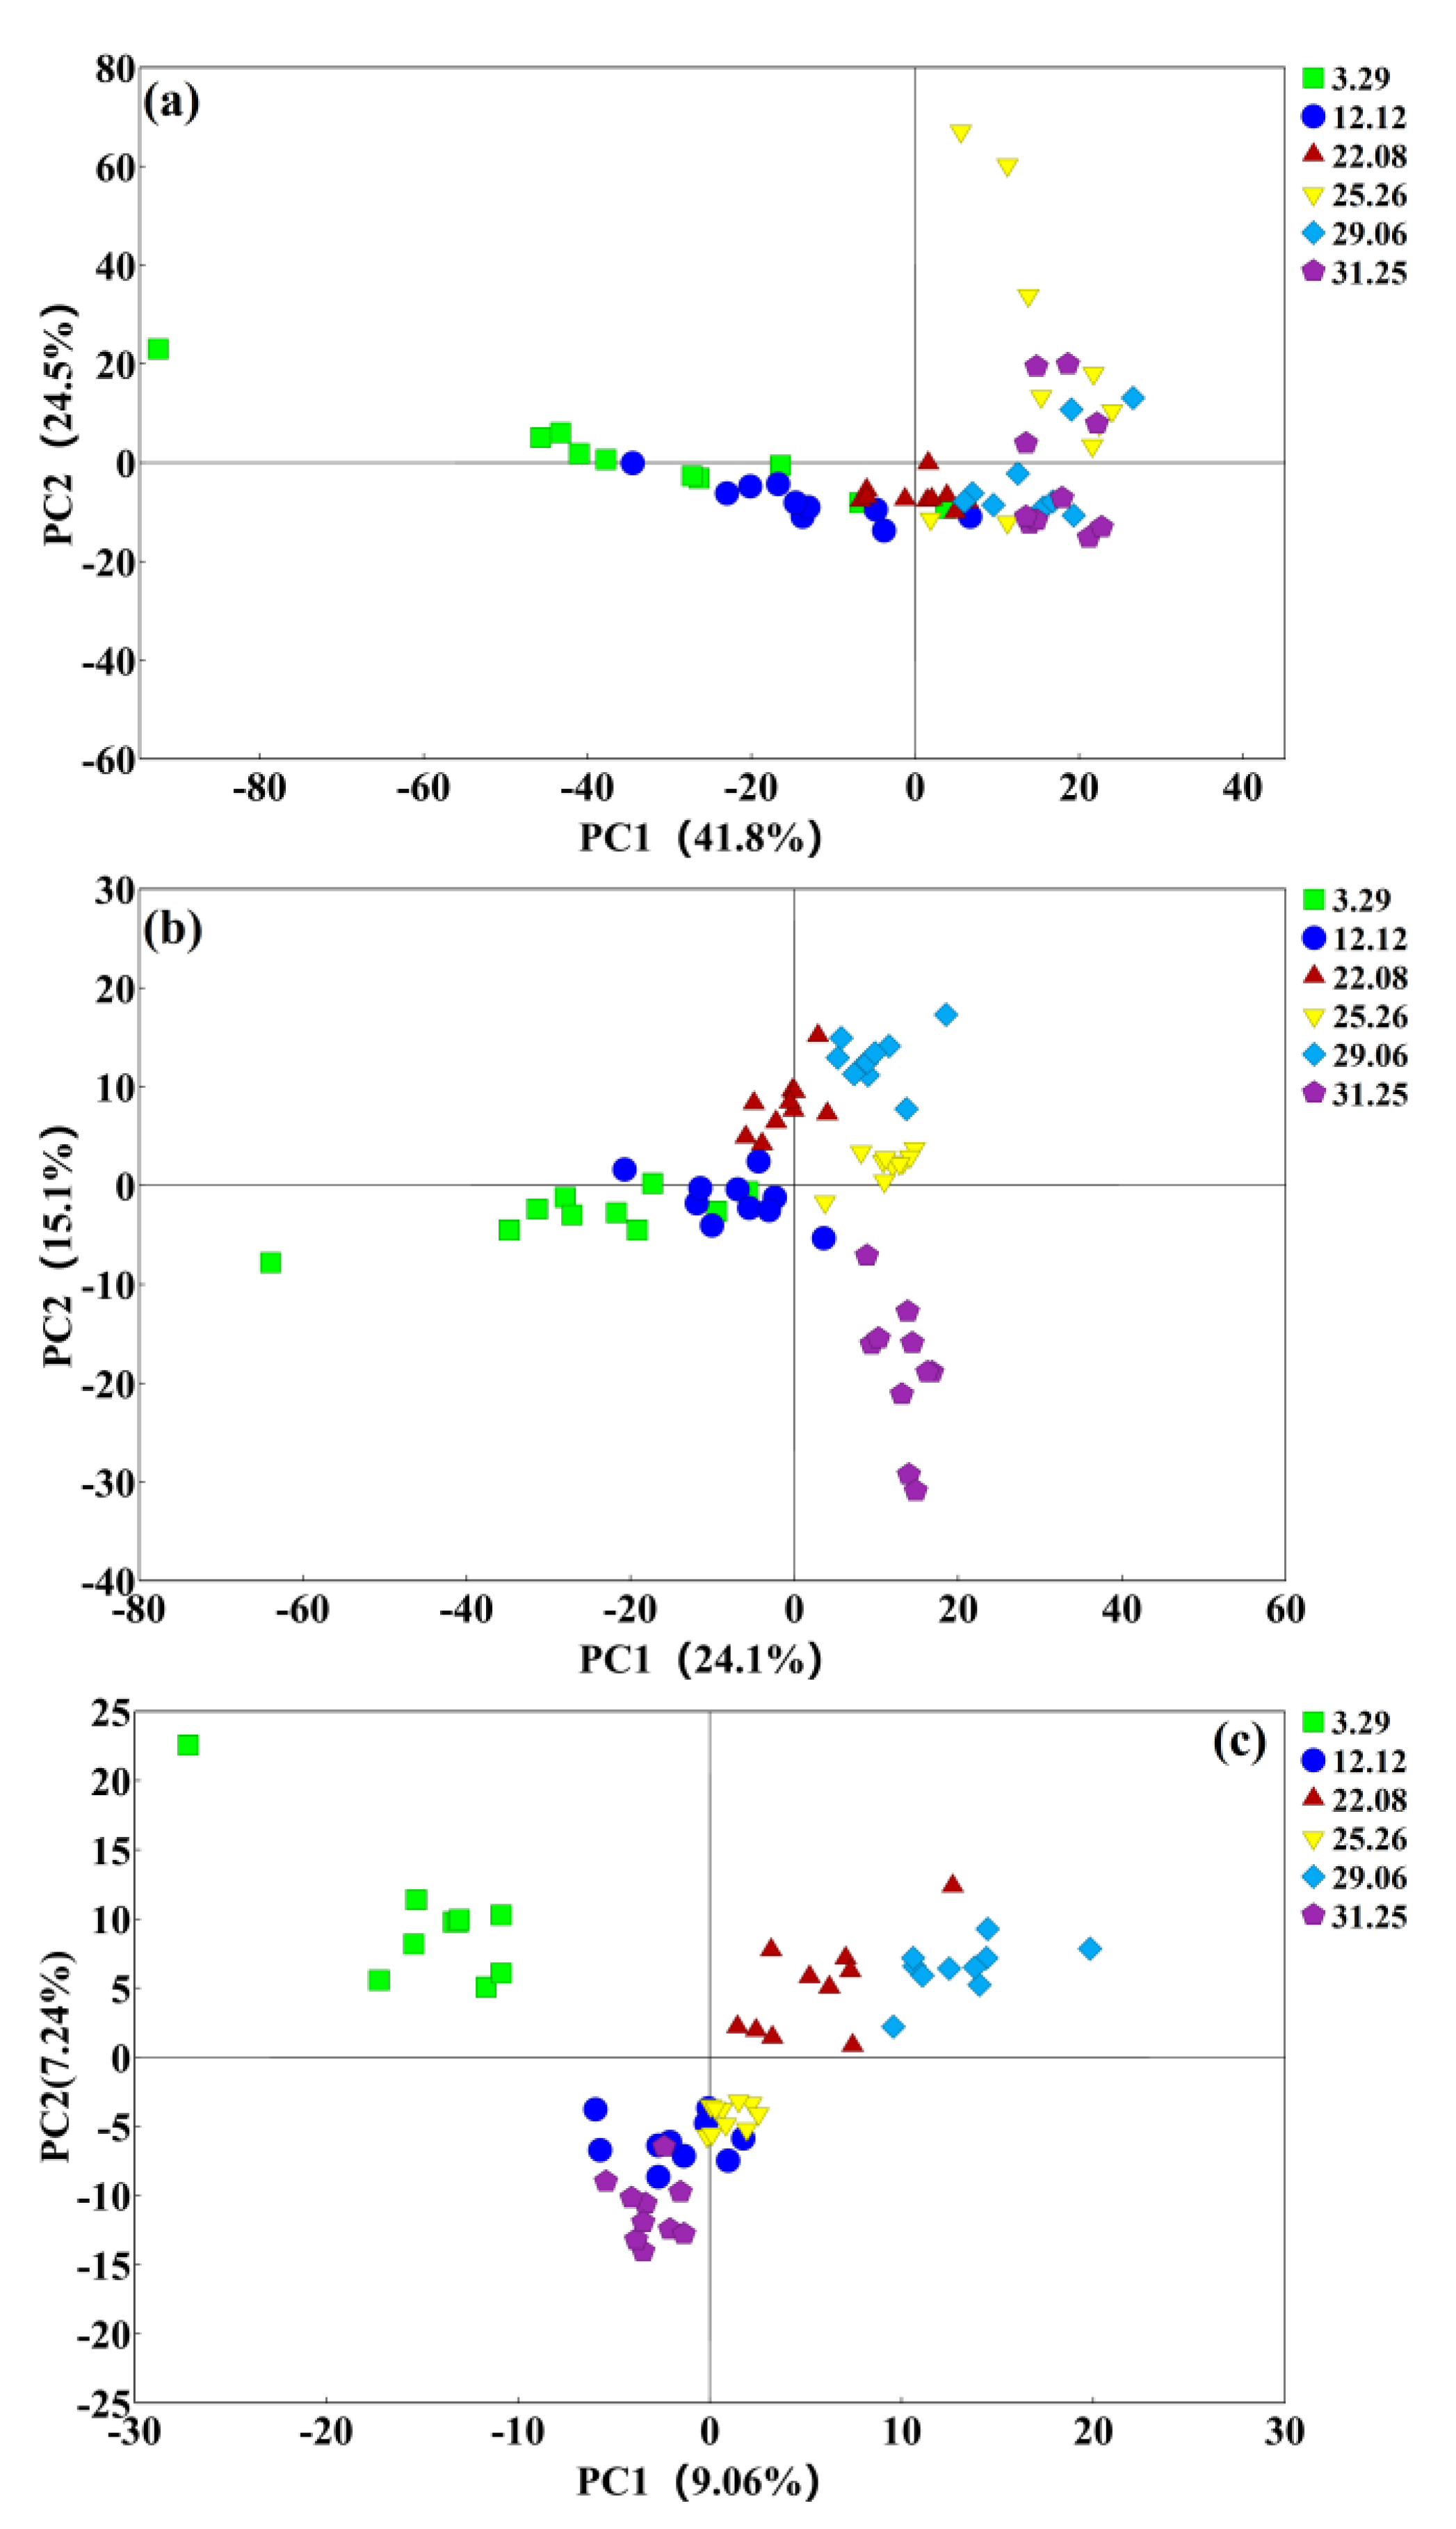
Figure 2a–c show the PCA dimensionality reduction projection plots of the spectra presented in Figure 1a–c, respectively. Figure 2a shows that the PCA study of the smoothed and baseline corrected spectra can only barely distinguish different grade phosphorite samples. In Figure 1a, the total variance contributions of PC1 and PC2 were 39% and 24.5%, respectively. With the process of first derivative, although the total variance contributions of PC1 and PC2 were decreased to 24.1% and 15.3%, respectively; the six different grade phosphorite samples can be much more clearly distinguished than only smooth and baseline process. As can be seen in Figure 2b, the data points of 3.29% and 12.12% grade phosphorite samples were separately clustered on the right side of the graph; the data points of 22.08% grade phosphorite sample were clustered between two quadrants in the middle of the graph; and the data points of 25.26%, 29.06%, and 31.25% were separately clustered on the left side of the graph. With the process of second derivative, the clustering effect for distinguishing different grade phosphorite samples is further improved, however, the total variance contributions of PC1 and PC2 were significantly decreased to only 9.06% and 7.24%, respectively. Therefore, the process of Raman spectra with smoothing, baseline correction, and first derivative would be the best choice for distinguishing different grade phosphorite samples and still retaining good original information of the Raman spectra.
To further confirm that the PCA result in Figure 2b is valid for distinguishing different grade phosphorite samples, the HCA study is performed using the first six principal components in the PCA study. These components have 53.7% cumulative interpretation of the original Raman spectra. The Ward’s method of square deviation was applied to cluster the similarity of the score data matrix to generate the dendrogram [25,26] and the result is shown in Figure 3. In the HCA study, the 60 data points of the six different grade phosphorite samples were named as follows: 1–10 as sample F (3.29%), 11–20 as sample E (12.12%), 21–30 as sample D (22.08%), 31–40 as sample C (25.26%), 41–50 as sample B (29.06%) and 51–60 as sample A (31.25%), The longitudinal coordinates represent the weight distance of variance between clustering centers and the abscissa indicates the number of the samples. As can be seen in Figure 3, the 60 data points of the six different grade phosphorite samples are divided into seven groups. The seven hierarchy clustering groups are presented in Table 1. Figure 3 and Table 1 show that only 3 data points were misclassified. Data point 8 was misclassified into one group by itself, and data points 39 (25.26%) and 59 (31.25%) were misclassified into group 4 (12.12%). The classification accuracy of all the data points is about 95%, indicating that the PCA–HCA study of the Raman spectra can be applied for distinguishing different grade phosphorite samples.
3.3. OPLS-DA Study
Figure 4a–c presents two-dimensional OPLS-DA scoring maps of the spectra presented in Figure 1a–c, respectively. For the OPLS-DA analysis, X is the spectral data matrix and Y is the matrix of the category of phosphorites. Cross-validation is a useful tool for internal model validation. It can remove sample subsets from the training set before building the model with the goal of performing sub-validation experiments, in which the samples used for validation were not used to construct the model. In this work, seven-fold cross-validation was used to evaluate the classification performance of the model, in which the datasets are divided into seven parts, six parts for training in turn, and the remaining part for testing.
The parameters of R2X(cum), R2Y(cum), and Q2(cum) correlated with Figure 4a are 0.961, 0.668, and 0.540, respectively. The parameters of R2X(cum), R2Y(cum), and Q2(cum) correlated with Figure 4b are 0.584, 0.878, and 0.726, respectively. The parameters of R2X(cum), R2Y(cum), and Q2(cum) correlated with Figure 4c are 0.254, 0.740, and 0.604, respectively. These values indicate that the process of Raman spectra with smoothing, baseline correction, and first derivative would also be the best choice in the OPLS-DA study for distinguishing different grade phosphorite samples, consistent with the PCA–HCA study.
To further validate and evaluate the performance of the OPLS-DA model, the permutation tests (number of permutations was 200) were performed for the process of Raman spectra with smoothing, baseline correction, and first derivative and the result is presented in Figure 5a. The R2Y(cum) and Q2(cum) values of the original OPLS-DA model are greater than all the R2Y and Q2 values of the permutated models, indicating that the original model has high predictive ability. The intercepts of R2Y and Q2 are 0.381 and 0.351 and both are smaller than 0.4, indicating the model is not overfitted. The values of valuable importance for the projection (VIP) obtained from the model are plotted in Figure 5b. The VIP value of a vibrational mode indicates how important this mode is for classification of the samples. The vibrational mode near 960 cm−1 has the greatest VIP value, thus it would have the greatest contribution for the classification of different grade phosphorite samples.
In order to further confirm that the vibrational mode of phosphate V1 near 960 cm−1 has the greatest contribution to the differentiation of different types of phosphorite samples, the S-line diagrams were used to analyze the data. Figure 6a shows the S-line result between 3.29% sample F and 29.06% sample B, both of them from Jinning. Figure 6b shows the S-line results between 29.06% sample B from Jinning and 31.25% sample A from Weng’an. In both Figure 6a,b, the contribution (covariance) and correlation values of the vibrational mode near 960 cm−1 are significantly larger than those of other vibrational modes. Therefore, we conclude that the vibrational mode of phosphate V1 near 960 cm−1 has the greatest contribution for the differentiation of different grade phosphorite samples.
4. Conclusions
Raman spectroscopy combined with PCA-HCA and OPLS-DA models were applied to analyze different grade phosphorite samples. Both the PCA-HCA and OPLS-DA models showed that different grade phosphorite samples can be clearly distinguished by statistically analyzing the Raman spectra after smoothing, baseline correction, and first derivation. The OPLS-DA model has better classification effect than the PCA-HCA model. In addition, the S-line study in the OPLS-DA model clearly demonstrated that the symmetrical stretching vibrational mode of phosphate near 960 cm−1 has a much more significant contribution than other vibrational modes for the differentiation of different grade phosphorite samples. Compared with the current method, the Raman method has the potential advantages of high precision and convenient experimental procedure, which provides a promising method for future practical applications of quick on site classification of different grade phosphorite samples combined with chemometrics methods.
Author Contributions
Writing—original draft preparation, X.Y.; writing—review and revise, H.H. and X.C.; performing the experiments, chemical analysis, X.Y. and H.H.; collecting the phosphorite samples, H.L. and K.C.
Funding
The investigations were partly supported by the National Natural Science Foundation of China (Grant No. 11574241).
Conflicts of Interest
The authors declare no conflict of interest.
References
- Zhang, P. Comprehensive Recovery and Sustainable Development of Phosphate Resources. Procedia Eng. 2014, 83, 37–51. [Google Scholar] [CrossRef] [Green Version]
- Li, S.; Zhang, J.; Wang, H.; Wang, C. Geochemical Characteristics of Dolomitic Phosphorite Containing Rare Earth Elements and Its Weathered Ore. Minerals 2019, 9, 416. [Google Scholar] [CrossRef]
- Geissler, B.; Mew, M.C.; Weber, O.; Steiner, G. Efficiency performance of the world’s leading corporations in phosphate rock mining. Resour. Conserv. Recycl. 2015, 105, 246–258. [Google Scholar] [CrossRef]
- Ruan, Y.; He, D.; Chi, R. Review on Beneficiation Techniques and Reagents Used for Phosphate Ores. Minerals 2019, 9, 253. [Google Scholar] [CrossRef]
- Wang, Y.; Deng, S.; Wang, Y.; Xu, J.; Qu, W. Review on analytical methods of phosphate ores. Metall. Anal. 2013, 33, 26–34. (In Chinese) [Google Scholar]
- Fajber, R.; Simandl, G.J. Evaluation of rare Earth Element-Enriched Sedimentary Phosphate Deposits Using Portable X-ray Fluorescence (XRF) Instruments; British Columbia Geological Survey: Victoria, BC, Canada, 2011. [Google Scholar]
- Koleva, V.; Petkova, V. IR spectroscopic study of high energy activated Tunisian phosphorite. Vib. Spectrosc. 2012, 58, 125–132. [Google Scholar] [CrossRef]
- Al-Eshaikh, M.A.; Kadachi, A.N.; Sarfraz, M.M. Determination of uranium content in phosphate ores using different measurement techniques. J. King Saud Univ. Eng. Sci. 2016, 28, 41–46. [Google Scholar] [CrossRef] [Green Version]
- She, Z.; Strother, P.; McMahon, G.; Nittler, L.; Wang, J.; Zhang, J.; Sang, L.; Ma, C.; Papineau, D. Terminal Proterozoic cyanobacterial blooms and phosphogenesis documented by the Doushantuo granular phosphorites I: In situ micro-analysis of textures and composition. Precambrian Res. 2013, 235, 20–35. [Google Scholar] [CrossRef]
- Curtis, N.J.; Gascooke, J.R.; Johnston, M.R.; Pring, A. A Review of the Classification of Opal with Reference to Recent New Localities. Minerals 2019, 9, 299. [Google Scholar] [CrossRef]
- Redhammer, G.J.; Weber, J.; Tippelt, G.; Zickler, G.A.; Reyer, A. Low Temperature Synthesis of Aegirine NaFeSi2O6: Spectroscopy (57Fe Mössbauer, Raman) and Size/Strain Analysis from X-ray Powder Diffraction. Minerals 2019, 9, 444. [Google Scholar] [CrossRef]
- Zhang, L.; Cao, L.; Zhao, L.; Algeo, T.; Chen, Z.; Li, Z.; Lv, Z.; Wang, X. Raman spectral, elemental, crystallinity, and oxygen-isotope variations in conodont apatite during diagenesis. Geochim. Cosmochim. Acta 2017, 210, 184–207. [Google Scholar] [CrossRef]
- Vandenabeele, P.; Moens, L.; Edwards, H.G.M.; Dams, R. Raman spectroscopic database of azo pigments and application to modern art studies. J. Raman Spectrosc. 2000, 31, 509–517. [Google Scholar] [CrossRef]
- Nemtsov, I.; Aviv, H.; Mastai, Y.; Tischler, Y.R. Polarization Dependence of Low-Frequency Vibrations from Multiple Faces in an Organic Single Crystal. Crystals 2019, 9, 425. [Google Scholar] [CrossRef]
- Frost, R.L. Raman microscopy of selected chromate minerals. J. Raman Spectrosc. 2004, 35, 153–158. [Google Scholar] [CrossRef] [Green Version]
- Dörfer, T.; Schumacher, W.; Tarcea, N.; Schmitt, M.; Popp, J. Quantitative mineral analysis using Raman spectroscopy and chemometric techniques. J. Raman Spectrosc. 2010, 41, 684–689. [Google Scholar] [CrossRef]
- Bartholomew, P.R.; Dyar, M.D.; Brady, J.B. The role of intensity and instrument sensitivity in Raman mineral identification. J. Raman Spectrosc. 2015, 46, 889–893. [Google Scholar] [CrossRef]
- Lopez-Reyes, G.; Rull, F.; Venegas, G.; Westall, F.; Foucher, F.; Bost, N.; Sanz, A.; Catalá-Espí, A.; Vegas, A.; Hermosilla, I.; et al. Analysis of the scientific capabilities of the ExoMars Raman Laser Spectrometer instrument. Eur. J. Mineral. 2013, 25, 721–733. [Google Scholar] [CrossRef]
- Sharma, S.K.; Porter, J.N.; Misra, A.K.; Helsley, C.E.; Bates, D.E. Scanning time-resolved standoff Raman instrument for large-area mineral detection on planetary surfaces. Eur. J. Mineral. 2013, 25, 715–720. [Google Scholar] [CrossRef]
- Antonakos, A.; Liarokapis, E.; Leventouri, T. Micro-Raman and FTIR studies of synthetic and natural apatites. Biomaterials 2007, 28, 3043–3054. [Google Scholar] [CrossRef]
- Elgharbi, S.; Horchani-Naifer, K.; Férid, M. Investigation of the structural and mineralogical changes of Tunisian phosphorite during calcinations. J. Therm. Anal. Calorim. 2015, 119, 265–271. [Google Scholar] [CrossRef]
- Wang, M.; Qian, R.; Bao, M.; Gu, C.; Zhu, P. Raman, FT-IR and XRD study of bovine bone mineral and carbonated apatites with different carbonate levels. Mater. Lett. 2018, 210, 203–206. [Google Scholar] [CrossRef]
- Ciobotă, V.; Salama, W.; Jentzsch, P.V.; Tarcea, N.; Rösch, P.; El Kammar, A.; Morsy, R.S.; Popp, J. Raman investigations of Upper Cretaceous phosphorite and black shale from Safaga District, Red Sea, Egypt. Spectrochim. Acta Part A Mol. Biomol. Spectrosc. 2014, 118, 42–47. [Google Scholar] [CrossRef] [PubMed]
- Rubio-Ordóñez, A.; García-Moreno, O.; Rodríguez Terente, L.M.; García-Guinea, J.; Tormo, L. Chondrite Shock Metamorphism History Assessed by Non-Destructive Analyses on Ca-Phosphates and Feldspars in the Cangas de Onís Regolith Breccia. Minerals 2019, 9, 417. [Google Scholar] [CrossRef]
- Cebi, N.; Dogan, C.E.; Develioglu, A.; Yayla, M.E.A.; Sagdic, O. Detection of L-Cysteine in wheat flour by Raman microspectroscopy combined chemometrics of HCA and PCA. Food Chem. 2017, 228, 116–124. [Google Scholar] [CrossRef] [PubMed]
- Borba, F.S.L.; Honorato, R.S.; de Juan, A. Use of Raman spectroscopy and chemometrics to distinguish blue ballpoint pen inks. Forensic Sci. Int. 2015, 249, 73–82. [Google Scholar] [CrossRef] [PubMed]
- Cao, X.; You, G.; Li, H.; Li, D.; Wang, M.; Ren, X. Comparative Investigation for Rotten Xylem (kuqin) and Strip Types (tiaoqin) of Scutellaria baicalensis Georgi Based on Fingerprinting and Chemical Pattern Recognition. Molecules 2019, 24, 2431. [Google Scholar] [CrossRef] [PubMed]
- Su, L.; Zhang, P.; Zheng, D.; Zhong, R. Rapid detection of Escherichia coli and Salmonella typhimurium by surface-enhanced Raman scattering. Optoelectron. Lett. 2015, 11, 157–160. [Google Scholar] [CrossRef]
- Granato, D.; Santos, J.S.; Escher, G.B.; Ferreira, B.L.; Maggio, R.M. Use of principal component analysis (PCA) and hierarchical cluster analysis (HCA) for multivariate association between bioactive compounds and functional properties in foods: A critical perspective. Trends Food Sci. Technol. 2018, 72, 83–90. [Google Scholar] [CrossRef]
- Zheng, X.; Liao, X.; Xu, Y.; Hong, M. PCA-LDA Analysis of Human and Canine Blood Based on Non-contact Raman Spectroscopy. Chem. J. Chin. Univ. 2017, 38, 575–582. (In Chinese) [Google Scholar]
- Zhang, J.; Yang, R.; Chen, R.; Li, Y.C.; Peng, Y.; Liu, C. Multielemental analysis associated with chemometric techniques for geographical origin discrimination of tea leaves (Camelia sinensis) in Guizhou province, SW China. Molecules 2018, 23, 3013. [Google Scholar] [CrossRef]
- Silva, A.F.T.; Sarraguça, M.C.; Ribeiro, P.R.; Santos, A.O.; De Beer, T.; Lopes, J.A. Statistical process control of cocrystallization processes: A comparison between OPLS and PLS. Int. J. Pharm. 2017, 520, 29–38. [Google Scholar] [CrossRef] [PubMed]
- Bylesjö, M.; Rantalainen, M.; Cloarec, O.; Nicholson, J.; Holmes, E.; Trygg, J. OPLS discriminant analysis: Combining the strengths of PLS-DA and SIMCA classification. J. Chemom. 2006, 20, 341–351. [Google Scholar] [CrossRef]
- Zhang, X.-J.; Qiu, J.-F.; Guo, L.-P.; Wang, Y.; Li, P.; Yang, F.-Q.; Su, H.; Wan, J.-B. Discrimination of Multi-Origin Chinese Herbal Medicines Using Gas Chromatography-Mass Spectrometry-Based Fatty Acid Profiling. Molecules 2013, 18, 15329–15343. [Google Scholar] [CrossRef] [PubMed]
- Shen, T.; Yu, H.; Wang, Y.Z. Assessing Geographical Origin of Gentiana Rigescens Using Untargeted Chromatographic Fingerprint, Data Fusion and Chemometrics. Molecules 2019, 24, 2562. [Google Scholar] [CrossRef] [PubMed]
Figure 1.
(a) Raman spectra of the six phosphorite samples after Savitzky–Golay (SG) smoothing and adaptive iteratively reweighted penalized least squares (airPLS) baseline correction. (b) First derivatives of the Raman spectra in (a). (c) Second derivatives of the Raman spectra in (a). (d) Averaged Raman spectra of the six phosphorite samples in the zoomed spectral range of 950–980 cm−1. For each sample, the averaged spectrum was obtained by averaging the spectra of the 10 pellets.

Figure 2.
Principal component analysis (PCA) dimensionality reduction projection plots of the smoothed and baseline corrected spectra (a), first derivative treated spectra (b), and second derivative treated spectra (c).
Figure 2.
Principal component analysis (PCA) dimensionality reduction projection plots of the smoothed and baseline corrected spectra (a), first derivative treated spectra (b), and second derivative treated spectra (c).

Figure 3.
Hierarchical cluster dendrogram of the 60 data points of the six different grade phosphorite samples.
Figure 3.
Hierarchical cluster dendrogram of the 60 data points of the six different grade phosphorite samples.

Figure 4.
Orthogonal partial least squares-discriminant analysis (OPLS-DA) score plots of the smoothed and baseline corrected spectra (a), first derivative treated spectra (b), and second derivative treated spectra (c).
Figure 4.
Orthogonal partial least squares-discriminant analysis (OPLS-DA) score plots of the smoothed and baseline corrected spectra (a), first derivative treated spectra (b), and second derivative treated spectra (c).

Figure 5.
(a) Permutation test analysis of the OPLS-DA model, the green dots represent R2 and the blue dots represent Q2. (b) Valuable importance for the projection (VIP) plot of classification.
Figure 5.
(a) Permutation test analysis of the OPLS-DA model, the green dots represent R2 and the blue dots represent Q2. (b) Valuable importance for the projection (VIP) plot of classification.

Figure 6.
S-line plots between sample A and B (a), and between sample B and F (b).


Table 1.
Hierarchy clustering groups of the 60 data points of the six different grade phosphorite samples.
Table 1.
Hierarchy clustering groups of the 60 data points of the six different grade phosphorite samples.
| Group | Details of Group | Category |
|---|---|---|
| Group1 | (8) | F(3.29%) |
| Group2 | (9,7,3,10,4,6,5,1,2) | F(3.29%) |
| Group3 | (53,54,55,52,58,57,56,51,60) | A(31.25%) |
| Group4 | (15,59,18,39,11,17,16,19,12,14,13,20) | E(12.12%) |
| Group5 | (31,32,33,35,40,38,37,34,36) | C(25.26%) |
| Group6 | (28,21,25,24,22,23,27,26,29,30) | D(22.08%) |
| Group7 | (46,42,47,48,41,43,45,44,49,50) | B(29.06%) |
© 2019 by the authors. Licensee MDPI, Basel, Switzerland. This article is an open access article distributed under the terms and conditions of the Creative Commons Attribution (CC BY) license (http://creativecommons.org/licenses/by/4.0/).
Share and Cite
MDPI and ACS Style
Yao, X.; Hou, H.; Liang, H.; Chen, K.; Chen, X. Raman Spectroscopy Study of Phosphorites Combined with PCA-HCA and OPLS-DA Models. Minerals 2019, 9, 578. https://doi.org/10.3390/min9100578
AMA Style
Yao X, Hou H, Liang H, Chen K, Chen X. Raman Spectroscopy Study of Phosphorites Combined with PCA-HCA and OPLS-DA Models. Minerals. 2019; 9(10):578. https://doi.org/10.3390/min9100578
Chicago/Turabian StyleYao, Xiyu, Huayi Hou, Huan Liang, Kai Chen, and Xiangbai Chen. 2019. "Raman Spectroscopy Study of Phosphorites Combined with PCA-HCA and OPLS-DA Models" Minerals 9, no. 10: 578. https://doi.org/10.3390/min9100578
Note that from the first issue of 2016, this journal uses article numbers instead of page numbers. See further details here.