Characterisation and Modelling of Gravity Pre-Concentration Amenability Using LST Fluidisation in a REFLUXTM Classifier


1
Centre for Advanced Particle Processing and Transport, Newcastle Institute for Energy and Resources, University of Newcastle, Callaghan, NSW 2308, Australia
2
Western Australian School of Mines: Minerals, Energy and Chemical Engineering, Curtin University, Perth, WA 6845, Australia
*
Author to whom correspondence should be addressed.
Minerals 2020, 10(6), 545; https://doi.org/10.3390/min10060545
Submission received: 20 May 2020
/
Revised: 12 June 2020
/
Accepted: 14 June 2020
/
Published: 16 June 2020
(This article belongs to the Special Issue Gravity Concentration)
Abstract
:Samples of the feed, underflow and overflow from water-based separations conducted using a continuous REFLUXTM Classifier involving inclined channels with a 3 mm spacing have been fractionated. Another REFLUXTM Classifier operating in a semi-batch configuration using a dense fluidising medium of lithium heteropolytungstates (LST) was used to determine the density distributions of the three streams. The partition surface of the separator was quantified, and the technique was validated against sink/float data for a −300 + 38 µm chromite ore separation. It was found that the LST flow fractionation determined the D50 with remarkable accuracy across the entire size range, with the Ep values also very good above 75 µm. For water-based continuous separations involving a gold ore covering the size range −1.0 + 0.090 mm, the D50 varied with particle size to the power −0.22 and the Ep remained relatively constant at approximately 170 kg/m3 for each of the narrow particle size ranges. These results were consistent with the partition surface validated based on the much finer size range of the higher density chromite ore. The performance of the continuous system was then modelled, with the results shown to agree well with separations conducted on the feed. This approach has been developed as an alternative to using the sink/float test, thus offering a new option with both a lower cost and minimal health and environmental risk. The findings from this study can in turn be used to assess the amenability of a given ore to gravity pre-concentration.
1. Introduction
Successful recovery and concentration of valuable minerals from gangue requires adequate liberation of the minerals for separation. To achieve this, the run-of-mine ore often undergoes several orders of magnitude size reduction through crushing and grinding before the valuable mineral is recovered and concentrated, typically at a P80 of around 75 µm. The energy required for comminution increases significantly as the P80 decreases. Rather than accepting the reality of higher operating costs due to increasingly lower grade ores and finer liberation sizes, one option is to implement pre-concentration strategies which target the removal of liberated gangue at the coarsest size possible, a concept referred to as coarse particle or early gangue rejection. The aim is to selectively reject gangue prior to fine grinding and downstream concentration without compromising the recovery of the valuable metal. Success here can significantly improve the economic and environmental sustainability of an operation [1,2,3,4], though the response to separation varies so not all ores are amenable to pre-concentration [2].
To assess amenability, one option is to perform a campaign of laboratory-scale separations with a given technology at a range of operating conditions, typically varying the yield to examine the grade and recovery achievable. However, as this can be time-consuming and resource-intensive, a far more rapid approach is to perform the necessary feed characterisation and process modelling to predict performance and make quick decisions with respect to feasibility and process selection. For gravity separation, the density distribution of the feed is critical to understanding the potential for pre-concentration, through process modelling via the partition surface. The partition curve varies directly with the separation cut point, D50, and Ecart Probable, Ep, for each particle size [5]. Ultimately, once the partition surface of the separator is known, the density distributions of the output streams can be predicted using the density distribution of the feed being separated [5,6].
Irrespective of the technique applied, the density distribution is obtained by fractionating a sample, the assumption being that grade is intrinsically linked with density. The sink/float test is a very reliable and well-established method, based on performing discrete separations in heavy liquids prepared to specific densities. However, many of the liquids involved are toxic and carcinogenic, particularly where high-density separations of minerals require the use of Clerici solution at elevated temperature [7,8]. Although inorganic lithium tungstate solutions provide a safe alternative, for densities up to 2950 kg/m3 at room temperature [9], costs are significant, meaning consistent analysis is rarely economic, and in many cases, it may be necessary to analyse densities higher than this. Thus, as the undesirable properties of sink/float testing have become widely recognised, so has the need for alternative fractionation techniques.
A hydrodynamic fractionation technique has been developed based on the density-based separation, which can be promoted in a system of inclined channels [10,11]. A separator consisting of a vertical section below a set of inclined channels, known as a REFLUXTM Classifier, is operated in a semi-batch mode by applying varying degrees of fluidisation to the system. Galvin and Liu [11] provide an in-depth description of the hydrodynamics of particle transport in this system. Particles are conveyed into the system of inclined channels where they experience strong velocity gradients and high shear rates near the channel wall, in turn generating a hydrodynamic lift force [12]. A particle experiences physical lift once the magnitude of the lift force exceeds the net weight force acting on the particle in the normal direction. At low flow rate, lower density (and also finer) particles experience lift as they migrate away from the channel wall and convey with the higher velocity fluid. Conversely, higher density particles settle onto the inclined surface and slide back into the vertical section. Increasing the fluidisation velocity then increases the shear rate, allowing larger and denser particles to lift and convey to the overflow. The overflow samples are collected independently at each flow rate to form a series of flow fractions.
The technique was initially validated for low-density coal, with excellent agreement with sink/float data obtained for particles up to 16 mm in diameter using water and aqueous glycerol as the fluidising medium [13,14,15]. Following this, Iveson et al. [16] established accurate yield-ash and density-based partition curves for coal separations over the size range −2.0 + 0.125 mm using a 70 wt.% glycerol solution as the fluidising medium. More recently, Galvin et al. [17] reported the first study examining the partitioning of dense minerals in a REFLUXTM Classifier with 3 mm inclined channel spacing, involving separation of a chromite ore over the size range −300 + 38 µm and sink/float analysis to quantify the partition surface of the separator. Further, their work established that a recently developed interpolation and mass balancing algorithm [18] produced accurate partition parameters (D50, Ep) when applied to good-quality fractionation data. Galvin et al. [19] then examined the efficacy of the water-based batch fractionation technique in producing partition curves, comparing the results obtained using a system with z = 1.77 mm spaced channels with the sink/float data. A viscous glycerol medium was not used due to the high shear rates required to convey the dense particles. Although they found that the D50 values were determined relatively accurately by applying the algorithm to the raw data, there was significant error in the Ep values. Thus, an alternative approach based on higher quality fractionation data is needed.
A recent study by Lowes et al. [20] demonstrated the powerful separation which can be produced in a system of inclined channels using dense liquids to amplify the dependence of segregation on the basis of density. Using a REFLUXTM Classifier with z = 6 mm channels and a fluidising medium of aqueous lithium heteropolytungstates (LST), excellent agreement with sink/float data was achieved on a mineral ore over the size range −2.0 + 0.090 mm. Conversely, using water and a 70 wt.% glycerol solution, effectively no separation was produced, and the results were poor, as expected.
This new study examines the application of the LST flow fractionation technique to produce the partition surface of the REFLUXTM Classifier, based on the fractionation of steady-state samples of the feed, underflow and overflow from gravity separations. This paper extends the initial findings presented at a recent conference [21], by introducing a comprehensive dataset in order to expand the particle size range, and in turn produce a robust partition surface. First, samples from the −300 + 38 µm chromite separation were subjected to LST flow fractionation, comparing the partition parameters produced with the sink/float data [17] to validate the method. The validated partition surface was then compared to the result obtained based on applying equivalent analysis to samples from a −1.0 + 0.090 mm gold-bearing ore separation, aiming to develop a deeper understanding of the separations by considering a range of feed conditions. The performance of the continuous system was then assessed through modelling, based on the partition surface, and validated against a set of separations conducted on the feed [22]. Thus, the approach outlined in this study provides a way forward for routinely assessing the benefits of varying levels of liberation on so-called early gangue rejection through gravity separation.
2. Experimental
2.1. REFLUXTM Classifier Fractionation
The laboratory-scale REFLUXTM Classifier, shown in Figure 1, had a horizontal cross-section of 0.10 × 0.08 m. The upper section, which was 1 m long, was inclined at an angle of 70° to the horizontal and interchangeable to adjust the inclined channel spacing depending on the top size of the material. Typically, a 3:1 channel spacing to top size ratio would be employed in recognition of previous work examining the influence of channel spacing on fractionation performance [13,14]. The fluidising medium was an aqueous solution of lithium heteropolytungstates (LST) which had been diluted using a 25 wt.% glycerol solution. The density of the LST solution was measured as 2442.5 kg/m3 at 26.8 °C using water pycnometry. Lowes et al. [20] provided a more detailed analysis of the solution properties and a theoretical background of the effect of applying the dense liquid as the fluidising medium.
The experiments were initiated by partially filling the vertical section of the REFLUXTM Classifier with the LST fluidising medium. A quantity of sample, typically 1.0–2.5 kg depending on the size range, was then added and fluidised at a low rate to ensure full wetting of the particles. The fluidisation rate was then increased to convey particles into the inclined channels, the finest and least dense of which were elutriated. At this point, the rate was maintained constant and the overflowing solids were collected in a filter bag. The aperture size of the filter bag was always considerably finer than the lower size limit of the material, typically 20–50 µm. The filtrate was returned to a 60 L stock solution tank, allowing recycling of the fluidising liquid in a closed-circuit configuration to ensure the overall loss of liquid throughout experiments was negligible. Once the overflow of particles subsided, the particles in the filter bag were collected, dried and denoted “Flow 1”. As this procedure was repeated with an incremental increase in the rate of fluidisation, subsequent flow fractions were produced containing larger and denser particles. The particles which remained in the unit at the completion of the experiment also formed a final flow fraction referred to as the remains. It was important to ensure the initial (Flow 1) and final (remains) fractions contained a small mass relative to the overall sample mass to properly describe the limits of the density distribution.
Samples from two continuous separations were analysed in this work. The first was a chromite ore of nominal top size 350 µm which had been subjected to sink/float analysis [17]. A system with a z = 1.77 mm channel spacing was used for the fractionation experiments conducted on these samples. The second ore, which was the primary focus of the modelling, was a porphyry copper-gold ore of nominal top size 1.0 mm and head grade of the order 1.3 g/t Au. This feed had previously been subject to continuous steady-state separation in a laboratory-scale REFLUXTM Classifier with a 3 mm inclined channel spacing [22]. For the fractionation experiments on the gold ore sample, a marginally wider z = 3.0 mm channel spacing was used to accommodate the coarser top size. The channel spacing arrangements used for the continuous gravity separations (indicated as RC separation) and semi-batch flow fractionations (indicated as RC flow fractionation) are provided in the relevant figure captions for clarity. Samples of the feed, underflow and overflow from these separations were subjected to semi-batch fractionation, following de-sliming, to varying degrees. Water pycnometry was conducted on the flow fractions to measure their average density, followed by sieving using a series. For the chromite ore, this involved 0.30, 0.212, 0.150, 0.106, 0.075, 0.063, 0.053 and 0.038 mm sieves. For the gold-bearing ore, the sieve series consisted of 1.0, 0.71, 0.50, 0.355, 0.25, 0.18, 0.125 and 0.090 mm sieves. Further pycnometry measurements on these size fractions produced the density distributions for narrow size intervals. The mass and average density data for the sized fractionation samples of the chromite and gold ore separations are shown in Appendix A. Note that the difference in the number of flow fractions in these respective experiments is arbitrary.
2.2. Extraction of Partition Data
Having established the density distributions of the three streams, the interpolation and mass balancing algorithm recently presented by Galvin et al. [18], here referred to simply as ”the algorithm”, was applied to extract the partition curves from the steady-state separations. A comprehensive description and analysis of the algorithm was provided by Galvin et al. [18,19], while only a relatively brief overview is provided here.
The interpolation rule was applied to the raw fractionation data to discretise the mass in each sample into a consistent set of density intervals using a resolution of Δ50 kg/m3. The major assumption is that the mass in each flow fraction is distributed evenly either side of the average density of the flow fraction. The interpolated density distributions for the three streams were then established on a cumulative yield versus incremental density basis.
Initial guess conditions for the partition parameters (D50, Ep) were used in Equation (1) [23] to generate partition numbers as a function of density. It has become well established that the partitioning of the REFLUXTM Classifier is well described by this functional form which observes symmetry about the cut point [17,24,25]. A symmetrical partition function is reasonable for the REFLUXTM Classifier, where the output streams exist far apart from the feed, thus there is an absence of short-circuiting or bypass flow and the tails of the partition curve asymptote to 0 and 100 wt.%. Note that the algorithm actually uses a mathematically equivalent form of Equation (1), shown in Equation (2), based on the definitions D50 = (D75 + D25)/2 and Ep = (D75 − D25)/2. Here, D75 and D25 are the density of particles with a 75% and 25% probability of reporting to the underflow, respectively. That is,
where P is the partition number, D50 is the density of a particle with equal probability of reporting to the underflow or overflow, D is the average density, Ep is the Ecart Probable, and the subscript i denotes a given density interval.
These partition numbers were applied to the feed density distribution to produce a pair of overflow and underflow density distributions, termed the reconciled dataset, which would typically differ significantly from the interpolated data. An objective function was formed based on the squared relative error between the interpolated and reconciled cumulative yield values, with additional terms included to preserve the overall stream average density and provide smoothing of the final distributions. By varying the partition parameters and the feed density distribution, the algorithm seeks to converge on a final solution subject to minimisation of the objective function. As often the final solution of a numerical search routine is dependent on the initial conditions, a total of 66 trials covering 6 initial D50 and 11 initial Ep values were conducted, with the final solution being based on the average of the trials which converged. The uncertainty in these values was then taken as the 95% confidence interval on the mean values. It is noted that these uncertainties do not give an indication of how accurate the algorithm solution is in relation to the true values. However, Galvin et al. [17] have demonstrated high accuracy in the algorithm solutions when applied to good-quality fractionation data.
3. Results and Discussion
3.1. Partition Surface of the REFLUXTM Classifier
3.1.1. Sink/Float versus LST Flow Fractionation
The algorithm outlined in Section 2.2 was applied to the sized density distributions generated by the sink/float test and LST flow fractionation, extracting the partition curves for narrow size intervals summarised in Table 1. Note that the sink/float data were taken from Galvin et al. [17]. The sink/float dataset represents the true partition parameters, from which the performance of the flow fractionation technique can be assessed. In a flow fractionation, particle size influences the elutriation of particles. Thus, the goal is to promote hydrodynamic conditions for minimising the effect of particle size, in turn promoting segregation on the basis of density to produce close agreement with the true partition data. Therefore, it is worth considering the applicable flow regime, as laminar flow is beneficial in promoting the strong velocity gradients and inertial lift forces necessary for achieving density-based separation [11]. For a system of channels in which the width is far greater than the channel spacing, and the hydraulic diameter is given by 2z, the flow Reynolds number is Ref = (2ρfUz)/µ. The superficial fluid velocity, U, was estimated based on the flow rate measured using a beaker and stopwatch at each fluidisation rate. Using ρf = 2443 kg/m3 and µ = 0.005 Pa s after Lowes et al. [20], the maximum flow Reynolds number in the chromite fractionation experiments was 51.4. For the gold ore fractionation experiments outlined in Section 3.1.2, the maximum flow Reynolds number was estimated as 57.2, both safely in the laminar regime.
The D50 and Ep values in Table 1 are plotted as a function of particle size in Figure 2 and Figure 3, respectively. Note that particle size, S, refers to the geometric average size of a given size interval. As the algorithm uncertainties were so small for these datasets, they were not included in these figures. The power law dependency of cut point on particle size varied to the power −0.22 according to the sink/float data. It is evident that the LST flow fractionation has determined the D50 values with remarkable accuracy across the entire size range, with a power law exponent of −0.21 in excellent agreement with the sink/float result. The largest deviation in cut point between the sink/float and LST results is just 2%.
In Figure 3, the variation in Ep as a function of particle size comparing the data produced by both fractionation techniques is shown. The sink/float data points observe no clear trend, rather some scatter with an average value of around 325 kg/m3. Typically, it would be expected that the Ep follows a similar power law trend to the D50, with the Ep scaling directly with cut point [23,26,27]. However, this constant variation for minerals appears to be specific to the 3 mm channel spacing REFLUXTM Classifier system [19]. This phenomenon, along with less drift in the cut point with particle size, was the reason why the continuous system with 3 mm channels outperformed the 6 mm system in the work of Galvin et al. [17]. The Ep values determined based on the LST flow fractionation agree very well with the sink/float data down to 106 µm, and reasonably well down to 75 µm. Below this, the Ep values tend to be under-predicted more significantly as particle size decreases. This decline in performance is not surprising given that size becomes more dominant in particle settling as size decreases (i.e., Stokes settling, where terminal velocity scales with the square of diameter). In the context of the present work, however, analysis down to a particle size of 100 µm, and even 75 µm, is sufficient for assessing early gangue rejection. Thus, there is confidence in the Ep values determined based on the LST flow fractionation above approximately 75 µm.
As a further level of analysis, the density distributions based on the sink/float and LST flow fractionation on the +106 µm material were combined and ordered as a function of increasing density. This produced a set of feed, underflow and overflow density distributions for the −300 + 106 µm size range, allowing the composite partition curves to be determined by applying the algorithm to the raw data. The interpolated and reconciled density distributions as well as the partition curves generated by both fractionation techniques are shown on the same plot in Figure 4. The true partition curve based on the sink/float data is described by D50 = 3544 kg/m3 and Ep = 364 kg/m3, while the LST partition curve is governed by D50 = 3550 kg/m3 and Ep = 318 kg/m3. The separation cut point has been determined with high accuracy, differing by only 0.2%. The Ep values are also in very close agreement, deviating by only 13% between the two techniques. Given there was an absence of an autogenous dense medium and strong hindered settling effects which contribute to the separation mechanism of the continuous system, this further highlights the powerful fractionation produced in the inclined channels using LST. It is the strong buoyancy force provided by the LST which reduces the net weight force and terminal settling velocity of the dense particles, promoting a mechanism for achieving inertial lift and density-based separation, which is not possible under the more turbulent conditions in a water-based experiment.
Although the accuracy of the D50 values has been found to be relatively insensitive to the quality of the fractionation [19], a clear benefit of the LST approach is the accuracy of the Ep. The Ep values were excellent above 106 µm, and reasonable down to 75 µm, certainly within a degree of accuracy suitable for modelling the performance of the continuous system. Previously, data of this quality was only available by performing costly and hazardous sink/float testing, so this new option offers a valuable alternative. As it is thought that the average Ep value as a function of particle size likely varies with the separation cut point, it should now be possible to examine this relationship more rapidly and cost effectively using additional datasets to produce a holistic model of the REFLUXTM Classifier.
3.1.2. Partition Surface for Gold-Bearing Ore based on LST Flow Fractionation
The work in this section is based on water-based separations conducted using the REFLUXTM Classifier under continuous conditions. The partition curves governing the separations can be characterised based on a composite overall size range or on the basis of narrow size intervals. For the work in this section, where the ratio of the upper to lower particle size limits is roughly 11:1, the applicability of a composite Ep describing the overall separation is questionable due to the breadth of the size range. Thus, a better approach is to quantify the partition curves for narrow size intervals. Figure 5 shows the variation in D50 as a function of the particle size based on LST flow fractionation data. The D50 is shown to vary as a function of decreasing particle size to the power of −0.22 when the outlier in the coarsest size fraction was omitted (open triangle in Figure 5). Given that the −1000 + 710 µm size interval for the overflow stream contained only 2.5 wt.% of the overall sample mass, some uncertainty in obtaining a cut point value is not surprising. The settling of finer particles is much more heavily influenced by the particle size; thus, the general trend is that the cut point increases sharply at fine sizes. This is why gravity separators are less effective processing over broad size ranges, as the significant increase in cut point leads to the misplacement of fine particles, even when operated at relatively high yield.
The generalised scaling law describing the variation in D50 with particle size can be expressed in a dimensionless form by introducing the parameters D0 and S0, as shown in Equation (3). Note that the n value in Equation (3) is not equivalent to the exponent shown in the equations in Figure 2 or Figure 5, a direct result of introducing the (D0 − 1000) term. This equation then describes the variation in (D50 − 1000) with particle size and is useful for process modelling, because by eliminating the constant of the generalised scaling law, changes in the REFLUXTM Classifier set point can be reflected by simply varying the parameter D0, shifting the partition surface up and down.
Based on the sink/float data in Figure 2, Galvin et al. [17] found that for the system with 3 mm inclined channel spacing, the (D50 − 1000) varied to the power −0.28 over the size range −300 + 38 µm. Figure 6 shows the variation in D50 with particle size comparing the results of the present study with those of Galvin et al. [17], represented by the discrete data points. The solid curves represent Equation (3), with n = 0.28 and S0 = 300 µm. A simple least squares curve fit was used to find D0 for both datasets, determined as 3148 and 3204 kg/m3 for the data of Galvin et al. [17] and this study, respectively. Note the particle size axis on Figure 6 was limited to 500 µm to highlight the region of the plot most important for comparison between the two datasets. The strong agreement between the model and experimental values, despite differences in the ore type and size range, is promising from the perspective of creating a robust model, given that a model which features consistent parameters for a range of feed conditions is desirable over one which is subjective.
Figure 7 shows the algorithm results for the variation in Ep as a function of particle size. Again, there is no visible trend in the data, rather some scatter with an average Ep of approximately 170 kg/m3. The higher average value in the previous section likely reflects the finer particle sizes and higher particle densities. This result is further evidence of the REFLUXTM Classifier with 3 mm channel spacing operating with an almost fixed Ep as a function of particle size, rather than the power law dependency which may be expected.
Inertial lift forces develop using more closely spaced inclined channels, which in turn improves the tendency for lower density coarse particles to re-suspend and convey to the overflow. In the coarsest size fractions where the cut points are typically lowest, inertial lift shifts more of the low-density particles, though not necessarily all, to the overflow, increasing the Ep, in turn reducing both the variation of the D50 and Ep with particle size. Given that these lower density particles which now report to the overflow contain little value, the performance on a grade/recovery basis is actually improved despite the increase in Ep.
3.2. Process Modelling
This section outlines an approach to modelling the performance of the continuous REFLUXTM Classifier based on the partition surface. As application of the partition surface to the feed density distribution generates a set of underflow and overflow density distributions—Figure 8 was used to infer the grade based on density. This relationship was established using density data from samples of the continuous separations which were sent for assay determination. Similar approaches have been implemented by other authors to relate grade and density for modelling purposes [1,28]. In practice, these data would be generated by sending the sized feed fractionation samples for assay, also allowing the washability of the feed to be established, providing a useful benchmark based on the optimum theoretical performance. To reconcile the scatter in the data above roughly 3000 kg/m3, the modelled grade was based on the average of the values calculated using the linear regression and two 95% confidence intervals either side of the slope of the trend line (broken lines in Figure 8), a total of five values. These inconsistencies at high density are a reality of gold ores where there is often a heterogeneous distribution of gold particles within a sample. However, it is noted that the material with a density above 3000 kg/m3 contributes only 2.5 wt.% of the feed, as can be seen in Table A2. Therefore, the contribution of the data which is based on the high-scatter region of Figure 8 to the modelling is likely to be minimal, though in the case of gold, not always.
A feed basis of F = 1000 kg was assumed and applied to the particle size distribution to distribute the mass into narrow size intervals. The grade distribution of the feed was then inferred based on the density distributions for narrow size intervals and Figure 8. Applying a D0 value in Equation (3) produced a set of D50 values which, along with a constant Ep of 170 kg/m3 as a function of size based on the previous section, were used to generate partition numbers using Equation (1). The partition numbers were applied to the feed density distribution, simulating the partitioning of the solids and a separation at a given cut point with a product grade and recovery.
Figure 9 shows the experimental data of Lowes et al. [22], where a gold-bearing ore with a nominal top size of 1.0 mm was pre-concentrated. Here, the solids throughput was 13 t/m2/h at a feed solids concentration of 40 wt.% and the controller density set point was varied to examine the influence of mass rejection on gold recovery. To quantify the uncertainty in the recovery values, a Monte Carlo simulation technique was applied to examine the standard deviation in the grade based on the linear regression in Figure 8. By performing 5000 iterations, the average values returned the experimental data. The uncertainties in Figure 9 represent the 95% confidence interval of the mean values. This is an alternative to sending multiple samples for assay, which would be a very costly process, particularly when the overall recoveries are derived based on the sized sample assay data, as was the case in the work of Lowes et al. [22]. The obvious trend is that the recovery of gold is compromised as more mass is rejected, a relationship which summarises the trade-off which exists when assessing amenability, as clearly there exists a point where the reduction in operating costs is outweighed by losses in valuable minerals to tailings. Evaluation of the various scenarios and the impact of a pre-concentration stage on economic parameters such as Net Present Value (NPV) and Net Smelter Return (NSR) are important factors which can be considered based on process modelling.
Also shown in Figure 9 are the model predictions based on applying the partition surface described by Equation (3), with n = 0.28, S0 = 300 µm and Ep = 170 kg/m3, to the feed density distribution. The parameter D0 was varied to simulate changes in the set point, allowing the recovery to be modelled as a function of mass rejection. The model predictions agree very well with the experimental separations. The recovery tends to be under predicted at low mass rejection, though the most significant deviation between the model and experimental data is only ~10 wt.% Au Recovery. This deviation is likely due to some unavoidable variation in the density distribution between samples or feed grade between experiments. It is noted that the analysis was based on the samples from the highest mass rejection separation, a result where there is excellent agreement between the model and experimental data. This result supports the validity of performing process modelling based on data derived directly from the LST flow fractionation, an approach which has significant benefits over the conventional approach utilising sink/float analysis. This approach is also very rapid, requiring only characterisation of the feed being separated, rather than the extensive campaign of separations which were conducted to produce the experimental data.
3.3. Sensitivity Analysis on Ep and n
To examine the sensitivity in the model, the partition surface described by Equation (3) was applied to the feed density distribution using varying Ep and n values, as shown in Figure 10 and Figure 11. These figures have been adapted from Lowes et al. [21]. Higher Ep values result in more misplaced material either side of the cut point, while higher n values correspond to more drift in the cut point as a function of particle size. Shown in both figures is the model prediction for Ep = 0 kg/m3 and n = 0, corresponding to a perfect separation with no variation in the D50 with particle size, fundamentally the concept of density-based fractionation as would be produced using the sink/float test. These data suggest that a maximum gold recovery of 90 wt.% Au could be achieved by roughly halving the initial feed mass, a promising result given the comparatively low cost of gravity separation in relation to grinding. However, Figure 10 also shows the results based on various Ep values and n = 0.28, showing a significant deviation from the washability, even for Ep values as low as 100 kg/m3, which would be considered sharp in dense mineral separations. This significant deviation reflects the poor liberation of the feed and impact of the relatively coarse gangue which makes it difficult to recover fine liberated mineral particles. The modelling is then valuable because it reflects the effect of particle size, liberation and separator efficiency, rather than being based on a perfect separation independent of particle size (i.e., sink/float), which is extremely unlikely to occur in reality.
Figure 10 also shows the model predictions for Ep values of 100, 170, 325 and 500 kg/m3, with n = 0.28. Unsurprisingly, as Ep increases, the recovery for a given mass rejection decreases as more material is misplaced. The model results are relatively insensitive to minor variations in Ep, as the predictions based on Ep values of 100 and 170 kg/m3 are very close, of the order of only a few wt.% Au recovery. This supports the validity of modelling based on partition parameters derived from LST flow fractionation data, as very close agreement with the true values has been demonstrated for particle sizes relevant to this work in Section 3.1.1. Figure 11 shows results for different n values with an Ep value of 170 kg/m3, covering separations based on different levels of variation in the D50 with particle size. For higher n values, there is more misplacement of fine particles and hence a lower recovery. Interestingly, the model predictions converge as the wt.% mass rejection approaches zero. This convergence reflects the formation of an underflow dominated by almost pure gangue, with the majority of the feed reporting to the underflow. Here, there is little selectivity in the separation and the variation in D50 with particle size has little influence on the separation. This is also why there is less sensitivity to even a five-fold increase in Ep at the low mass rejection in Figure 10.
3.4. Final Discussion
Partition curves are generated by analysing samples of the feed, underflow and overflow from a steady-state separation. The standard method involves application of the sink/float technique, and then mass balance reconciliation. The limitations of the sink/float technique have previously been mentioned. Clearly, alternative approaches are needed from both an economic and safety perspective. One such method has been presented here, based on LST flow fractionation and application of the mass balancing algorithm of Galvin et al. [18] to the raw data. The technique was shown to produce high-quality data above 75 µm, suitable for directly modelling the performance of the continuous REFLUXTM Classifier. Thus, the applicability of this new approach to particle sizes relevant to gravity separation is a firm conclusion of this paper.
There are several benefits to applying this method as an alternative to the sink/float technique. Firstly, the method is desirable because fractionation at higher densities is achieved by increasing the flow rate, with no need for preparation, handling and recycling of corrosive organic liquids. The number of separations is very flexible, requiring only adjustment of the fluidisation rate. Further, although not really necessary in characterising the ores in this work, in principle, it is possible to achieve separations in excess of the 4400 kg/m3 limit performed at most commercial laboratories. Although there is initially a significant cost associated with obtaining a sizable quantity of LST, the loss of fluidising liquid across experiments is negligible.
There was strong consistency between the partition surface validated by Galvin et al. [17] and this work on a much coarser and lower density mineral ore. Process modelling based on applying the partition surface to the feed density distribution was found to agree well with experimental separations conducted on the feed. In the future, fractionation and additional sizing conducted on any de-slimed feed could produce the necessary model inputs. Those inputs include the particle size distribution, density distributions for narrow size intervals and grade distribution following pycnometry measurements and assay analysis. Applying the modelling approach outlined here then predicts the expected separation performance, allowing the response to pre-concentration to be assessed without having to perform a campaign of material separations. As the variation in D50 and Ep with particle size is characteristic of a given separator, in principle, this general approach should be suitable for modelling the performance of other gravity separators, for example spirals [16]. However, it is noted that alternate functional forms to Equation (1) may be required to describe other technologies. For example, it might be appropriate to include additional parameters to account for short-circuiting or bypass flow, as can be the case in dense medium cyclones [5].
4. Conclusions
This study has validated the LST flow fractionation technique for quantifying the partition curves for a gravity separation. The technique was first validated against sink/float data for a −300 + 38 µm chromite ore separation, conducted in a REFLUXTM Classifier with 3 mm inclined channels [17]. Accurate D50 and Ep values were obtained for particle sizes above 106 µm, though the agreement remained satisfactory down to 75 µm. For a −1.0 + 0.090 mm gold ore separation, the D50 varied with particle size to the power −0.22, while the Ep was relatively constant at around 170 kg/m3. Model predictions based on the partition surface were then shown to agree well with the results of experimental separations conducted on the feed. Thus, this new approach provides a valuable alternative to the sink/float test method which is suitable for assessing gravity pre-concentration amenability.
5. Patents
The University of Newcastle holds international patents on the REFLUXTM Classifier and has a Research and Development Agreement with FLSmidth Pty Ltd. (Copenhagen, Denmark). The inventor of the REFLUXTM Classifier, and the fifth author of this paper, K. Galvin, is a beneficiary of the University’s intellectual property policy.
Author Contributions
Conceptualisation, C.L., J.Z. and K.G.; methodology, C.L., J.Z. and K.G.; validation, C.L.; formal analysis, C.L.; investigation, C.L.; resources, K.G., T.M. and J.E.; writing—original draft preparation, C.L.; writing—review and editing, C.L., J.Z., T.M., J.E. and K.G.; visualisation, C.L.; supervision, J.Z. and K.G.; funding acquisition, T.M., J.E. and K.G. All authors have read and agreed to the published version of the manuscript.
Funding
This research was funded by the Curtin University Gold Technology Group [grant number P420F] and the sponsors of the AMIRAP420F Gold Processing Technology project (AngloGold Ashanti, Australian Gold Reagents, Barrick Gold, CRCORE, Evolution, FLSmidth, Gekko Systems, Gold Fields, Kemix, Lhoist, Newcrest Mining, Newmont Goldcorp, Northern Star Resources, Orica, Pioneera, and Vega Industries). The authors wish to thank them for their financial and technical support.
Acknowledgments
The authors wish to acknowledge the support of CRC ORE in this research collaboration. CRC ORE is part of the Australian Government’s CRC Program, which is made possible through the investment and ongoing support of the Australian Government. The CRC Program supports industry-led collaborations between industry, researchers and the community.
Conflicts of Interest
The authors declare no conflict of interest.
Appendix A

Table A1.
Raw-sized pycnometry data for chromite ore LST flow fractionation of samples of the feed, underflow and overflow.
Table A1.
Raw-sized pycnometry data for chromite ore LST flow fractionation of samples of the feed, underflow and overflow.
| Feed | Underflow | Overflow | |||||
|---|---|---|---|---|---|---|---|
| Flow Fraction | Size Interval | Mass | Average Density | Mass | Average Density | Mass | Average Density |
| (-) | (µm) | (g) | (kg/m3) | (g) | (kg/m3) | (g) | (kg/m3) |
| 1 | −300 + 212 | 11.0 | 2753.0 | 10.0 | 2837.8 | 5.7 | 2706.8 |
| −212 + 150 | 19.8 | 2751.3 | 6.4 | 2951.0 | 10.5 | 2700.2 | |
| −150 + 106 | 28.4 | 2750.6 | 4.0 | 3124.3 | 13.7 | 2692.6 | |
| −106 + 75 | 30.7 | 2762.9 | 4.1 | 3277.0 | 23.7 | 2698.6 | |
| −75 + 53 | 35.1 | 2794.7 | 3.8 | 3403.2 | 18.6 | 2702.3 | |
| −53 + 38 | 29.0 | 2851.5 | 3.0 | 3840.5 | 14.3 | 2712.6 | |
| 2 | −300 + 212 | 11.7 | 2945.1 | 24.4 | 3233.8 | 10.7 | 2748.9 |
| −212 + 150 | 20.6 | 2993.6 | 28.3 | 3295.9 | 26.4 | 2756.3 | |
| −150 + 106 | 27.3 | 3067.2 | 18.0 | 3332.1 | 33.0 | 2756.7 | |
| −106 + 75 | 50.0 | 3220.7 | 5.0 | 3393.4 | 42.3 | 2787.8 | |
| −75 + 53 | 42.0 | 3285.9 | 6.3 | 4302.7 | 29.5 | 2688.2 | |
| −53 + 38 | 31.1 | 3316.2 | 15.9 | 4472.5 | 25.1 | 2979.6 | |
| 3 | −300 + 212 | 16.1 | 3231.8 | 41.0 | 3368.6 | 18.9 | 2968.5 |
| −212 + 150 | 28.8 | 3274.8 | 38.0 | 3387.5 | 46.3 | 3017.2 | |
| −150 + 106 | 33.2 | 3301.7 | 17.8 | 3442.8 | 57.9 | 3075.0 | |
| −106 + 75 | 44.4 | 3349.8 | 10.3 | 4199.9 | 51.0 | 3159.2 | |
| −75 + 53 | 27.6 | 3430.9 | 46.0 | 4504.9 | 43.1 | 3237.4 | |
| −53 + 38 | 18.4 | 3692.5 | 18.5 | 4517.8 | 29.4 | 3303.6 | |
| 4 | −300 + 212 | 25.0 | 3358.6 | 7.3 | 3643.4 | 20.7 | 3295.6 |
| −212 + 150 | 43.6 | 3366.8 | 8.8 | 3912.6 | 53.6 | 3314.5 | |
| −150 + 106 | 46.3 | 3376.3 | 17.9 | 4337.2 | 69.4 | 3327.3 | |
| −106 + 75 | 36.5 | 3486.2 | 62.2 | 4497.0 | 67.3 | 3343.8 | |
| −75 + 53 | 30.4 | 3985.5 | 58.2 | 4520.5 | 45.5 | 3365.9 | |
| −53 + 38 | 25.0 | 4245.9 | 12.6 | 4516.5 | 17.3 | 3427.0 | |
| 5 | −300 + 212 | 22.2 | 3621.5 | 32.0 | 4457.2 | 24.0 | 3383.9 |
| −212 + 150 | 27.7 | 3753.5 | 72.9 | 4494.0 | 75.4 | 3389.4 | |
| −150 + 106 | 33.1 | 4028.7 | 125.7 | 4507.5 | 72.7 | 3409.9 | |
| −106 + 75 | 68.4 | 4373.0 | 86.4 | 4519.2 | 78.8 | 3547.8 | |
| −75 + 53 | 45.9 | 4449.1 | 26.0 | 4529.3 | 52.9 | 3793.1 | |
| −53 + 38 | 20.2 | 4434.4 | 5.4 | 4491.7 | 33.6 | 4088.5 | |
| 6 | −300 + 212 | 18.3 | 4437.8 | 58.3 | 4514.8 | 4.1 | 3467.4 |
| −212 + 150 | 52.8 | 4495.1 | 93.0 | 4514.1 | 10.7 | 3654.7 | |
| −150 + 106 | 76.1 | 4508.8 | 76.1 | 4518.0 | 19.7 | 3909.8 | |
| −106 + 75 | 46.8 | 4515.2 | 24.2 | 4520.1 | 33.9 | 4277.9 | |
| −75 + 53 | 21.1 | 4509.0 | 6.0 | 4494.8 | 30.0 | 4426.2 | |
| −53 + 38 | 6.6 | 4461.4 | 1.0 | 4487.4 | 16.2 | 4475.2 | |
| 7 | −300 + 212 | 38.8 | 4518.9 | 18.1 | 4515.6 | 1.0 | 2804.1 |
| −212 + 150 | 42.9 | 4515.7 | 26.1 | 4524.9 | 3.1 | 4108.7 | |
| −150 + 106 | 34.7 | 4514.4 | 23.8 | 4534.8 | 8.4 | 4344.1 | |
| −106 + 75 | 13.3 | 4518.9 | 7.8 | 4572.8 | 12.2 | 4407.2 | |
| −75 + 53 | 6.0 | 4462.5 | 2.8 | 4394.0 | 13.1 | 4453.5 | |
| −53 + 38 | 1.9 | 4315.0 | 0.8 | 10.4 | 4446.7 | ||
Table A2.
Raw sample mass and pycnometry data for the gold-bearing ore feed, underflow and overflow sized LST flow fractionation samples.
Table A2.
Raw sample mass and pycnometry data for the gold-bearing ore feed, underflow and overflow sized LST flow fractionation samples.
| Feed | Underflow | Overflow | |||||
|---|---|---|---|---|---|---|---|
| Flow Fraction | Size Interval | Mass | Average Density | Mass | Average Density | Mass | Average Density |
| (-) | (µm) | (g) | (kg/m3) | (g) | (kg/m3) | (g) | (kg/m3) |
| 1 | −1000 + 710 | 0.1 | 5.6 | 2611.1 | 0.2 | ||
| −710 + 500 | 0.6 | 2583.2 | 23.1 | 2625.1 | 0.8 | 2514.9 | |
| −500 + 355 | 1.1 | 2546.7 | 25.2 | 2639.9 | 1.8 | 2668.3 | |
| −355 + 250 | 3.0 | 2562.5 | 24.4 | 2656.8 | 4.2 | 2586.3 | |
| −250 + 180 | 7.5 | 2582.9 | 10.1 | 2677.2 | 9.5 | 2603.8 | |
| −180 + 125 | 22.1 | 2603.5 | 2.6 | 2693.7 | 27.3 | 2614.7 | |
| −125 + 90 | 35.5 | 2606.3 | 0.6 | 2724.7 | 55.5 | 2623.2 | |
| 2 | −1000 + 710 | 0.1 | 8.0 | 2624.6 | 0.3 | ||
| −710 + 500 | 0.8 | 2610.1 | 35.4 | 2643.5 | 3.8 | 2612.6 | |
| −500 + 355 | 3.6 | 2631.6 | 30.7 | 2659.3 | 12.0 | 2633.1 | |
| −355 + 250 | 13.4 | 2629.2 | 15.6 | 2685.3 | 23.2 | 2639.9 | |
| −250 + 180 | 22.6 | 2631.4 | 3.3 | 2723.4 | 36.0 | 2641.6 | |
| −180 + 125 | 37.2 | 2639.8 | 0.6 | 2820.4 | 65.7 | 2647.6 | |
| −125 + 90 | 41.6 | 2650.5 | 0.1 | 80.2 | 2662.1 | ||
| 3 | −1000 + 710 | 0.3 | 20.7 | 2643.6 | 0.1 | ||
| −710 + 500 | 3.0 | 2625.8 | 79.0 | 2659.9 | 1.7 | 2623.9 | |
| −500 + 355 | 11.6 | 2628.7 | 47.4 | 2674.5 | 5.9 | 2631.5 | |
| −355 + 250 | 25.7 | 2637.9 | 17.4 | 2708.6 | 16.2 | 2633.3 | |
| −250 + 180 | 30.6 | 2646.8 | 3.4 | 2807.5 | 26.8 | 2639.5 | |
| −180 + 125 | 35.2 | 2652.4 | 1.0 | 3072.2 | 40.3 | 2651.0 | |
| −125 + 90 | 25.6 | 2668.5 | 0.5 | 2991.7 | 35.0 | 2670.2 | |
| 4 | −1000 + 710 | 1.3 | 2640.7 | 40.4 | 2592.2 | 0.1 | |
| −710 + 500 | 17.1 | 2634.1 | 100.1 | 2672.6 | 1.0 | 2616.6 | |
| −500 + 355 | 47.8 | 2644.2 | 39.2 | 2694.6 | 4.0 | 2619.2 | |
| −355 + 250 | 64.6 | 2650.9 | 9.5 | 2748.4 | 12.0 | 2622.2 | |
| −250 + 180 | 50.0 | 2657.2 | 1.5 | 2867.9 | 15.4 | 2625.4 | |
| −180 + 125 | 48.1 | 2665.2 | 0.6 | 3118.6 | 16.6 | 2644.4 | |
| −125 + 90 | 30.7 | 2686.5 | 0.2 | 3482.7 | 12.3 | 2666.3 | |
| 5 | −1000 + 710 | 1.1 | 2617.3 | 89.6 | 2671.8 | 0.2 | |
| −710 + 500 | 13.4 | 2641.1 | 154.0 | 2685.5 | 3.8 | 2631.5 | |
| −500 + 355 | 31.5 | 2654.3 | 45.0 | 2721.4 | 14.6 | 2626.0 | |
| −355 + 250 | 33.3 | 2664.2 | 10.0 | 2797.7 | 30.5 | 2640. | |
| −250 + 180 | 24.9 | 2669.2 | 2.1 | 3060.6 | 32.9 | 2647.4 | |
| −180 + 125 | 25.5 | 2681.1 | 1.1 | 3032.9 | 31.7 | 2657.3 | |
| −125 + 90 | 13.4 | 2710.8 | 0.5 | 2804.9 | 18.0 | 2677.3 | |
| 6 | −1000 + 710 | 3.5 | 2638.3 | 115.4 | 2677.7 | 3.4 | 2639.1 |
| −710 + 500 | 33.1 | 2649.4 | 146.9 | 2700.0 | 37.5 | 2648.8 | |
| −500 + 355 | 52.1 | 2659.8 | 33.9 | 2745.3 | 70.5 | 2654.4 | |
| −355 + 250 | 42.0 | 2670.3 | 7.5 | 2822.6 | 73.1 | 2662.1 | |
| −250 + 180 | 31.4 | 2677.8 | 2.2 | 2895.7 | 49.9 | 2655.9 | |
| −180 + 125 | 29.9 | 2692.1 | 1.2 | 3199.3 | 35.3 | 2671.9 | |
| −125 + 90 | 13.3 | 2730.6 | 0.8 | 3136.3 | 14.5 | 2699.7 | |
| 7 | −1000 + 710 | 16.6 | 2640.6 | 164.6 | 2706.5 | 2.6 | 2655.3 |
| −710 + 500 | 72.2 | 2657.6 | 148.4 | 2748.0 | 32.2 | 2654.6 | |
| −500 + 355 | 59.6 | 2673.3 | 32.8 | 2809.5 | 61.0 | 2662.0 | |
| −355 + 250 | 44.8 | 2687.6 | 8.4 | 2916.7 | 64.4 | 2667.1 | |
| −250 + 180 | 31.9 | 2696.1 | 3.4 | 3055.9 | 42.3 | 2671.4 | |
| −180 + 125 | 23.5 | 2718.1 | 1.7 | 3213.4 | 31.0 | 2681.6 | |
| −125 + 90 | 11.6 | 2764.7 | 0.7 | 3209.6 | 12.8 | 2714.5 | |
| 8 | −1000 + 710 | 21.7 | 2657.9 | 75.3 | 2731.4 | 2.7 | 2650.6 |
| −710 + 500 | 83.9 | 2674.9 | 80.4 | 2798.3 | 31.7 | 2662.0 | |
| −500 + 355 | 65.2 | 2693.4 | 20.5 | 2892.1 | 56.6 | 2669.2 | |
| −355 + 250 | 56.0 | 2715.4 | 6.8 | 3018.0 | 51.6 | 2675.9 | |
| −250 + 180 | 43.5 | 2733.1 | 3.1 | 3178.6 | 34.1 | 2680.1 | |
| −180 + 125 | 27.3 | 2766.0 | 1.5 | 3464.4 | 27.8 | 2689.3 | |
| −125 + 90 | 7.6 | 2849.3 | 0.9 | 3901.3 | 11.8 | 2729.3 | |
| 9 | −1000 + 710 | 25.4 | 2673.1 | 46.0 | 2756.7 | 16.5 | 2663.8 |
| −710 + 500 | 91.1 | 2702.0 | 37.0 | 2838.4 | 102.8 | 2675.1 | |
| −500 + 355 | 62.4 | 2733.1 | 9.1 | 2965.0 | 92.3 | 2686.6 | |
| −355 + 250 | 39.6 | 2772.0 | 3.9 | 3131.8 | 62.6 | 2700.3 | |
| −250 + 180 | 22.2 | 2813.9 | 1.8 | 3305.2 | 39.7 | 2704.8 | |
| −180 + 125 | 13.6 | 2862.0 | 1.1 | 3548.6 | 26.9 | 2715.6 | |
| −125 + 90 | 4.6 | 2949.6 | 0.8 | 4077.6 | 11.0 | 2757.1 | |
| 10 | −1000 + 710 | 24.4 | 2690.9 | 32.8 | 2790.6 | 17.4 | 2681.8 |
| −710 + 500 | 74.9 | 2732.6 | 24.0 | 2925.1 | 100.6 | 2700.9 | |
| -500 + 355 | 34.6 | 2791.9 | 9.4 | 3055.3 | 96.3 | 2685.6 | |
| −355 + 250 | 15.2 | 2867.2 | 5.8 | 3193.1 | 87.4 | 2732.9 | |
| −250 + 180 | 7.2 | 2927.6 | 2.9 | 3413.7 | 67.9 | 2742.7 | |
| −180 + 125 | 4.8 | 3012.4 | 2.9 | 3870.2 | 50.2 | 2758.8 | |
| −125 + 90 | 2.7 | 3157.2 | 3.1 | 4333.0 | 16.1 | 2820.1 | |
| 11 | −1000 + 710 | 45.2 | 2703.3 | 24.3 | 2851.0 | 10.0 | 2701.3 |
| −710 + 500 | 41.6 | 2787.3 | 14.3 | 3049.9 | 51.5 | 2743.8 | |
| −500 + 355 | 13.0 | 2900.5 | 7.2 | 3214.7 | 47.7 | 2783.3 | |
| −355 + 250 | 6.4 | 2996.8 | 5.0 | 3372.7 | 36.4 | 2814.0 | |
| −250 + 180 | 3.2 | 3141.6 | 2.8 | 3761.9 | 27.6 | 2836.7 | |
| −180 + 125 | 2.7 | 3376.3 | 3.9 | 4231.7 | 25.4 | 2858.2 | |
| −125 + 90 | 2.2 | 3651.7 | 3.4 | 4635.9 | 11.7 | 2923.5 | |
| 12 | −1000 + 710 | 32.1 | 2743.7 | 11.0 | 2946.1 | 5.0 | 2736.6 |
| −710 + 500 | 11.3 | 2869.8 | 8.3 | 3177.2 | 18.8 | 2785.5 | |
| −500 + 355 | 2.5 | 3018.1 | 4.4 | 3400.7 | 14.4 | 2843.3 | |
| −355 + 250 | 2.0 | 3104.7 | 4.5 | 3759.6 | 10.1 | 2911.5 | |
| −250 + 180 | 1.0 | 3181.9 | 5.7 | 4255.3 | 6.6 | 2979.3 | |
| −180 + 125 | 1.5 | 3399.1 | 9.1 | 4594.3 | 5.4 | 3042.3 | |
| −125 + 90 | 1.5 | 3512.4 | 5.1 | 4717.4 | 3.4 | 3165.2 | |
| 13 | −1000 + 710 | 16.2 | 2905.4 | 7.5 | 3282.4 | 5.2 | 2770.5 |
| −710 + 500 | 9.6 | 3233.5 | 9.3 | 3786.9 | 10.8 | 2819.0 | |
| −500 + 355 | 4.5 | 3708.1 | 8.1 | 4234.0 | 8.0 | 2891.2 | |
| −355 + 250 | 5.1 | 4033.6 | 12.3 | 4453.3 | 5.7 | 2978.1 | |
| −250 + 180 | 4.0 | 4279.1 | 11.6 | 4670.2 | 3.5 | 3087.4 | |
| −180 + 125 | 3.8 | 4447.7 | 10.6 | 4758.6 | 3.4 | 3193.9 | |
| −125 + 90 | 2.1 | 4333.0 | 3.9 | 4793.4 | 2.8 | 3374.5 | |
References
- Franks, G.V.; Forbes, E.; Oshitani, J.; Batterham, R.J. Economic, water and energy evaluation of early rejection of gangue from copper ores using a dry sand fluidised bed separator. Int. J. Miner. Process. 2015, 137, 43–51. [Google Scholar] [CrossRef]
- McGrath, T.D.; Eksteen, J.J.; Bode, P. Assessing the amenability of a free milling gold ore to coarse particle gangue rejection. Miner. Eng. 2018, 120, 110–117. [Google Scholar] [CrossRef]
- Bergerman, M.G.; Jose Neto, D.; Mano, E.S.; Chaves, A.P. Impacts on Energy Consumption and Wear in Grinding Circuits With a Pre-Concentration Stage. In Proceedings of the XXIX International Mineral Processing Congress, Moscow, Russia, 15–21 September 2018; pp. 92–102. [Google Scholar]
- de Kretser, R.G.; Powell, M.; Scales, P.J.; Lim, J. The Water Efficient Plant of the Future—Towards a Holistic Process Chain Approach. In Proceedings of the Water in Mining, Perth, Australia, 15–17 September 2009; pp. 65–70. [Google Scholar]
- Napier-Munn, T.J. Modelling and simulating dense medium separation processes—A progress report. Miner. Eng. 1991, 4, 329–346. [Google Scholar] [CrossRef]
- Rong, R.X.; Lyman, J. Computational Techniques for Coal Washery Optimization—Parallel Gravity and Flotation Separation. Coal Prep. 1985, 2, 51–67. [Google Scholar] [CrossRef]
- Rosenblum, S. A mineral separation procedure using hot Clerici solution. J. Res. US Geol. Surv. 1974, 2, 479–481. [Google Scholar]
- Jahns, R.H. Clerici solution for the specific gravity determination of small mineral grains. Am. Mineral. 1939, 24, 116–122. [Google Scholar]
- Central Chemical Consulting. Available online: https://www.chem.com.au/comparison.html (accessed on 9 April 2020).
- Galvin, K.P.; Walton, K.; Zhou, J. How to elutriate particles according to their density. Chem. Eng. Sci. 2009, 64, 2003–2010. [Google Scholar] [CrossRef]
- Galvin, K.P.; Liu, H. Role of inertial lift in elutriating particles according to their density. Chem. Eng. Sci. 2011, 66, 3687–3691. [Google Scholar] [CrossRef]
- King, M.R.; Leighton, D.T. Measurement of the inertial lift on a moving sphere in contact with a plane wall in a shear flow. Phys. Fluids 1997, 9, 1248–1255. [Google Scholar] [CrossRef]
- Walton, K.; Zhou, J.; Galvin, K.P. Processing of fine particles using closely spaced inclined channels. Adv. Powder Technol. 2010, 21, 386–391. [Google Scholar] [CrossRef]
- Hunter, D.M.; Iveson, S.M.; Galvin, K.P. The role of viscosity in the density fractionation of particles in a laboratory-scale Reflux Classifier. Fuel 2014, 129, 188–196. [Google Scholar] [CrossRef]
- Campbell, Q.P.; le Roux, M.; Smith, I.G. Water-only laboratory coal fractionation using the reflux classifier. Miner. Eng. 2015, 83, 59–63. [Google Scholar] [CrossRef]
- Iveson, S.M.; Hunter, D.M.; Galvin, K.P. A water-based method for measuring density-based partition curves of separators used in coal and mineral processing. Miner. Eng. 2015, 79, 196–211. [Google Scholar] [CrossRef]
- Galvin, K.P.; Iveson, S.M.; Zhou, J.; Lowes, C.P. Influence of Inclined Channel Spacing on Dense Mineral Partition in a REFLUX™ Classifier. Part 1: Continuous Steady State. Miner. Eng. 2020, 146, 106112. [Google Scholar] [CrossRef]
- Galvin, K.P.; Iveson, S.M.; Hunter, D.M. Deconvolution of fractionation data to deduce consistent washability and partition curves for a mineral separator. Miner. Eng. 2018, 125, 94–110. [Google Scholar] [CrossRef]
- Galvin, K.P.; Iveson, S.M.; Zhou, J.; Lowes, C.P. Influence of Inclined Channel Spacing on Dense Mineral Partition in a REFLUX™ Classifier. Part 2: Water Based Fractionation. Miner. Eng. 2020, 155, 106442. [Google Scholar] [CrossRef]
- Lowes, C.P.; Zhou, J.; Galvin, K.P. Improved Density Fractionation of Minerals in the REFLUX™ Classifier Using LST as a Novel Fluidising Medium. Miner. Eng. 2020, 146, 106145. [Google Scholar] [CrossRef]
- Lowes, C.P.; Zhou, J.; McGrath, T.D.; Eksteen, J.J.; Galvin, K.P. Characterising the amenability of gold ore for gravity pre-concentration using LST fluidization in the REFLUX™ Classifier. In Proceedings of the MineXchange 2020 SME Annual Conference & Expo, Phoenix, AZ, USA, 23–26 February 2020. [Google Scholar]
- Lowes, C.P.; Zhou, J.; Galvin, K.P. Gravity Separation of Gold Ore Using the REFLUX™ Classifier to Achieve Coarse Particle Gangue Rejection. In Proceedings of the Chemeca, Queenstown, New Zealand, 30 September–3 October 2018. [Google Scholar]
- Scott, I.A.; Napier-Munn, T.J. A dense medium cyclone model based on the pivot phenomenon. Trans. Inst. Min. Metall. 1992, 101, C61–C76. [Google Scholar]
- Mitchell, K.; Hoffman, D.; Hartmann, T. Full scale plant operation of reflux classifier circuits. In Proceedings of the 15th Australian Coal Preparation Conference and Exhibition, Broadbeach, Australia, 14–18 September 2014. [Google Scholar]
- Galvin, K.P.; Zhou, J.; Walton, K. Application of closely spaced inclined channels in gravity separation of fine particles. Miner. Eng. 2010, 23, 326–338. [Google Scholar] [CrossRef]
- Rao, V.B.; Kapur, P.C.; Konnur, R. Modeling the size-density partition surface of dense medium separators. Int. J. Miner. Process. 2003, 72, 443–453. [Google Scholar] [CrossRef]
- Jowett, A. An appraisal of partition curves for coal-cleaning processes. Int. J. Miner. Process. 1986, 16, 75–95. [Google Scholar] [CrossRef]
- Couto, H.J.; Braga, P.F.; França, S.C. Use of gas pycnometry for estimating the iron content in mineral samples. Miner. Eng. 2012, 39, 45–47. [Google Scholar] [CrossRef]
Figure 1.
(a) Photograph of the RC80 REFLUXTM Classifier used for particle fractionation experiments and (b) schematic diagram of a semi-batch REFLUXTM Classifier with fluidisation supplied through the underflow value.
Figure 1.
(a) Photograph of the RC80 REFLUXTM Classifier used for particle fractionation experiments and (b) schematic diagram of a semi-batch REFLUXTM Classifier with fluidisation supplied through the underflow value.

Figure 2.
Variation in separation cut point, D50, as a function of particle size. The algorithm was applied to raw data based on the sink/float test and LST flow fractionation data. The LST method has determined the cut point values with remarkable accuracy across the entire size range. RC separation z = 3 mm; RC flow fractionation z = 1.77 mm.

Figure 3.
Ecart Probable, Ep, values as a function of particle size generated by applying the algorithm to the raw data from both fractionation techniques. The Ep values based on the LST flow fractionation are in close agreement with the sink/float data above 75 µm, and excellent above 106 µm. RC separation z = 3 mm; RC flow fractionation z = 1.77 mm.
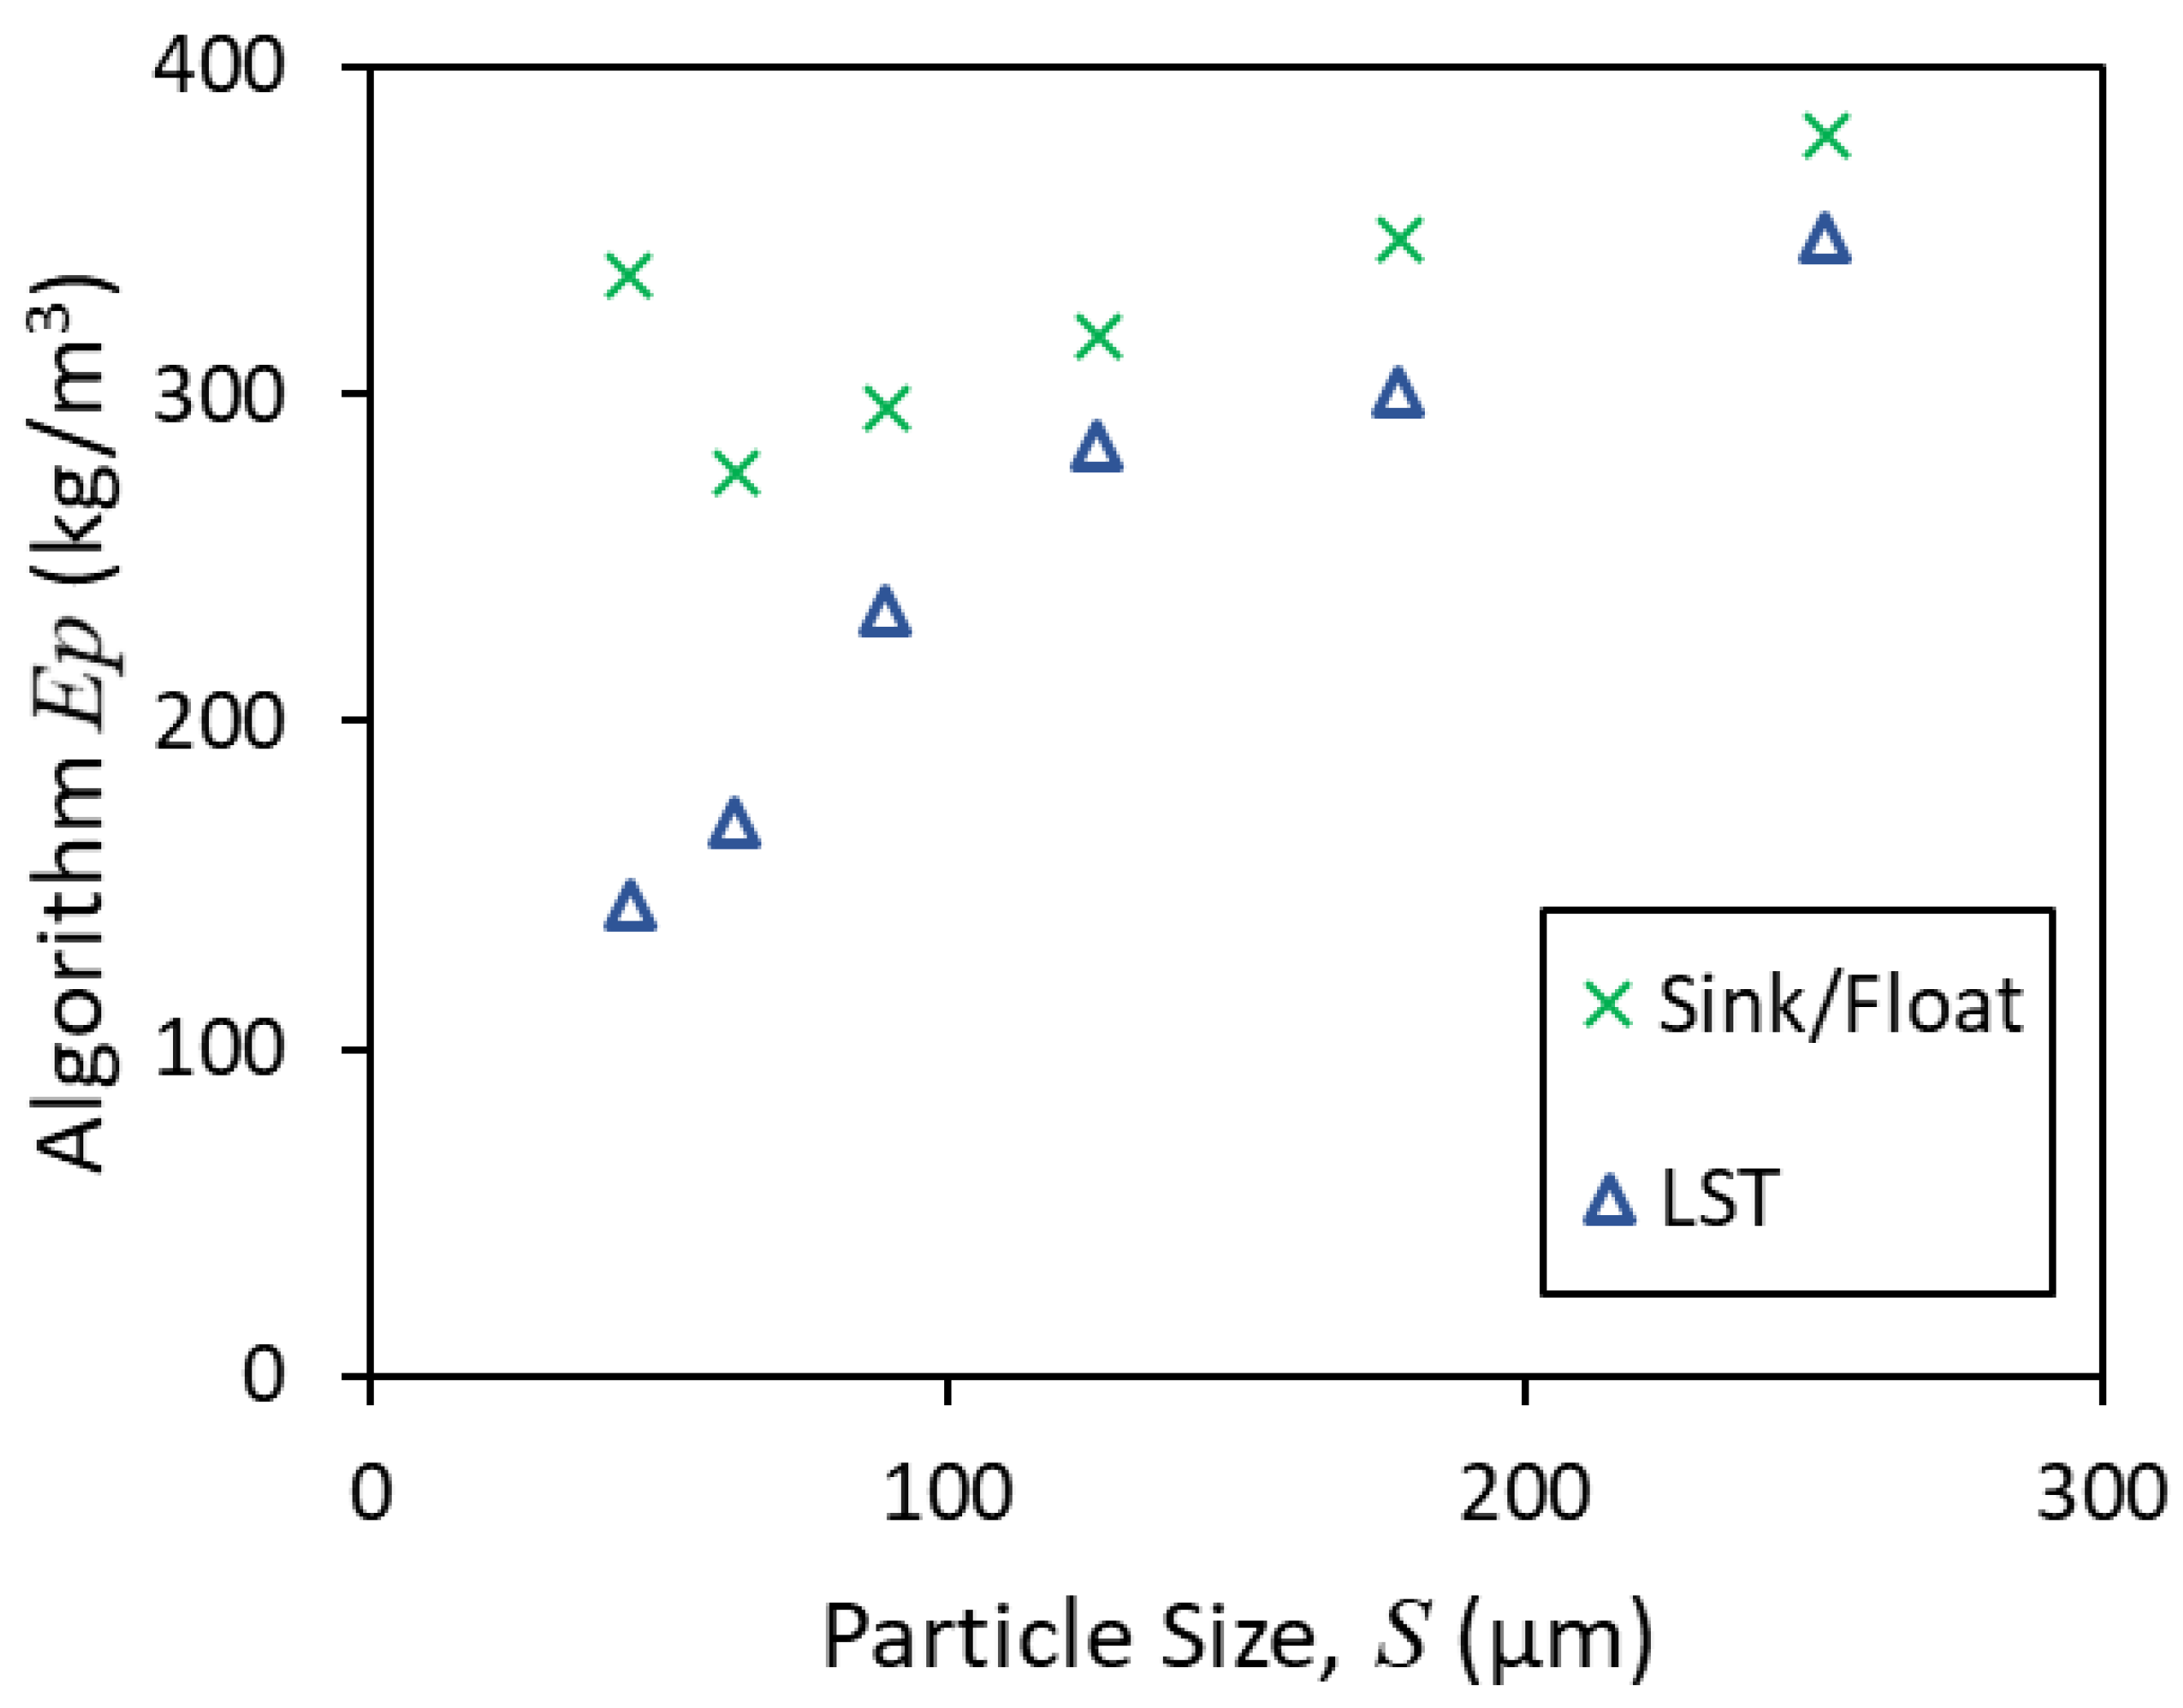
Figure 4.
Cumulative yield as a function of incremental density for the –300 + 106 µm portion of the feed, product and reject. The algorithm was applied to the sink/float (S/F) and LST flow fractionation (LST) interpolated datasets to generate reconciled cumulative yield versus density datasets for each stream which are linked by underlying partition curves. The sink/float partition curve is described by D50 = 3544 kg/m3 and Ep = 364 kg/m3, while the LST partition curve is governed by D50 = 3550 kg/m3 and Ep = 318 kg/m3. The partition curves produced by the two methods are in excellent agreement. RC separation z = 3 mm; RC flow fractionation z = 1.77 mm.

Figure 5.
Variation in D50 as a function of particle size based on applying the algorithm to the LST flow fractionation data. The D50 varied with particle size to the power −0.22 when the clear outlier (open triangle) was omitted. RC separation z = 3 mm; RC flow fractionation z = 3 mm.
Figure 5.
Variation in D50 as a function of particle size based on applying the algorithm to the LST flow fractionation data. The D50 varied with particle size to the power −0.22 when the clear outlier (open triangle) was omitted. RC separation z = 3 mm; RC flow fractionation z = 3 mm.
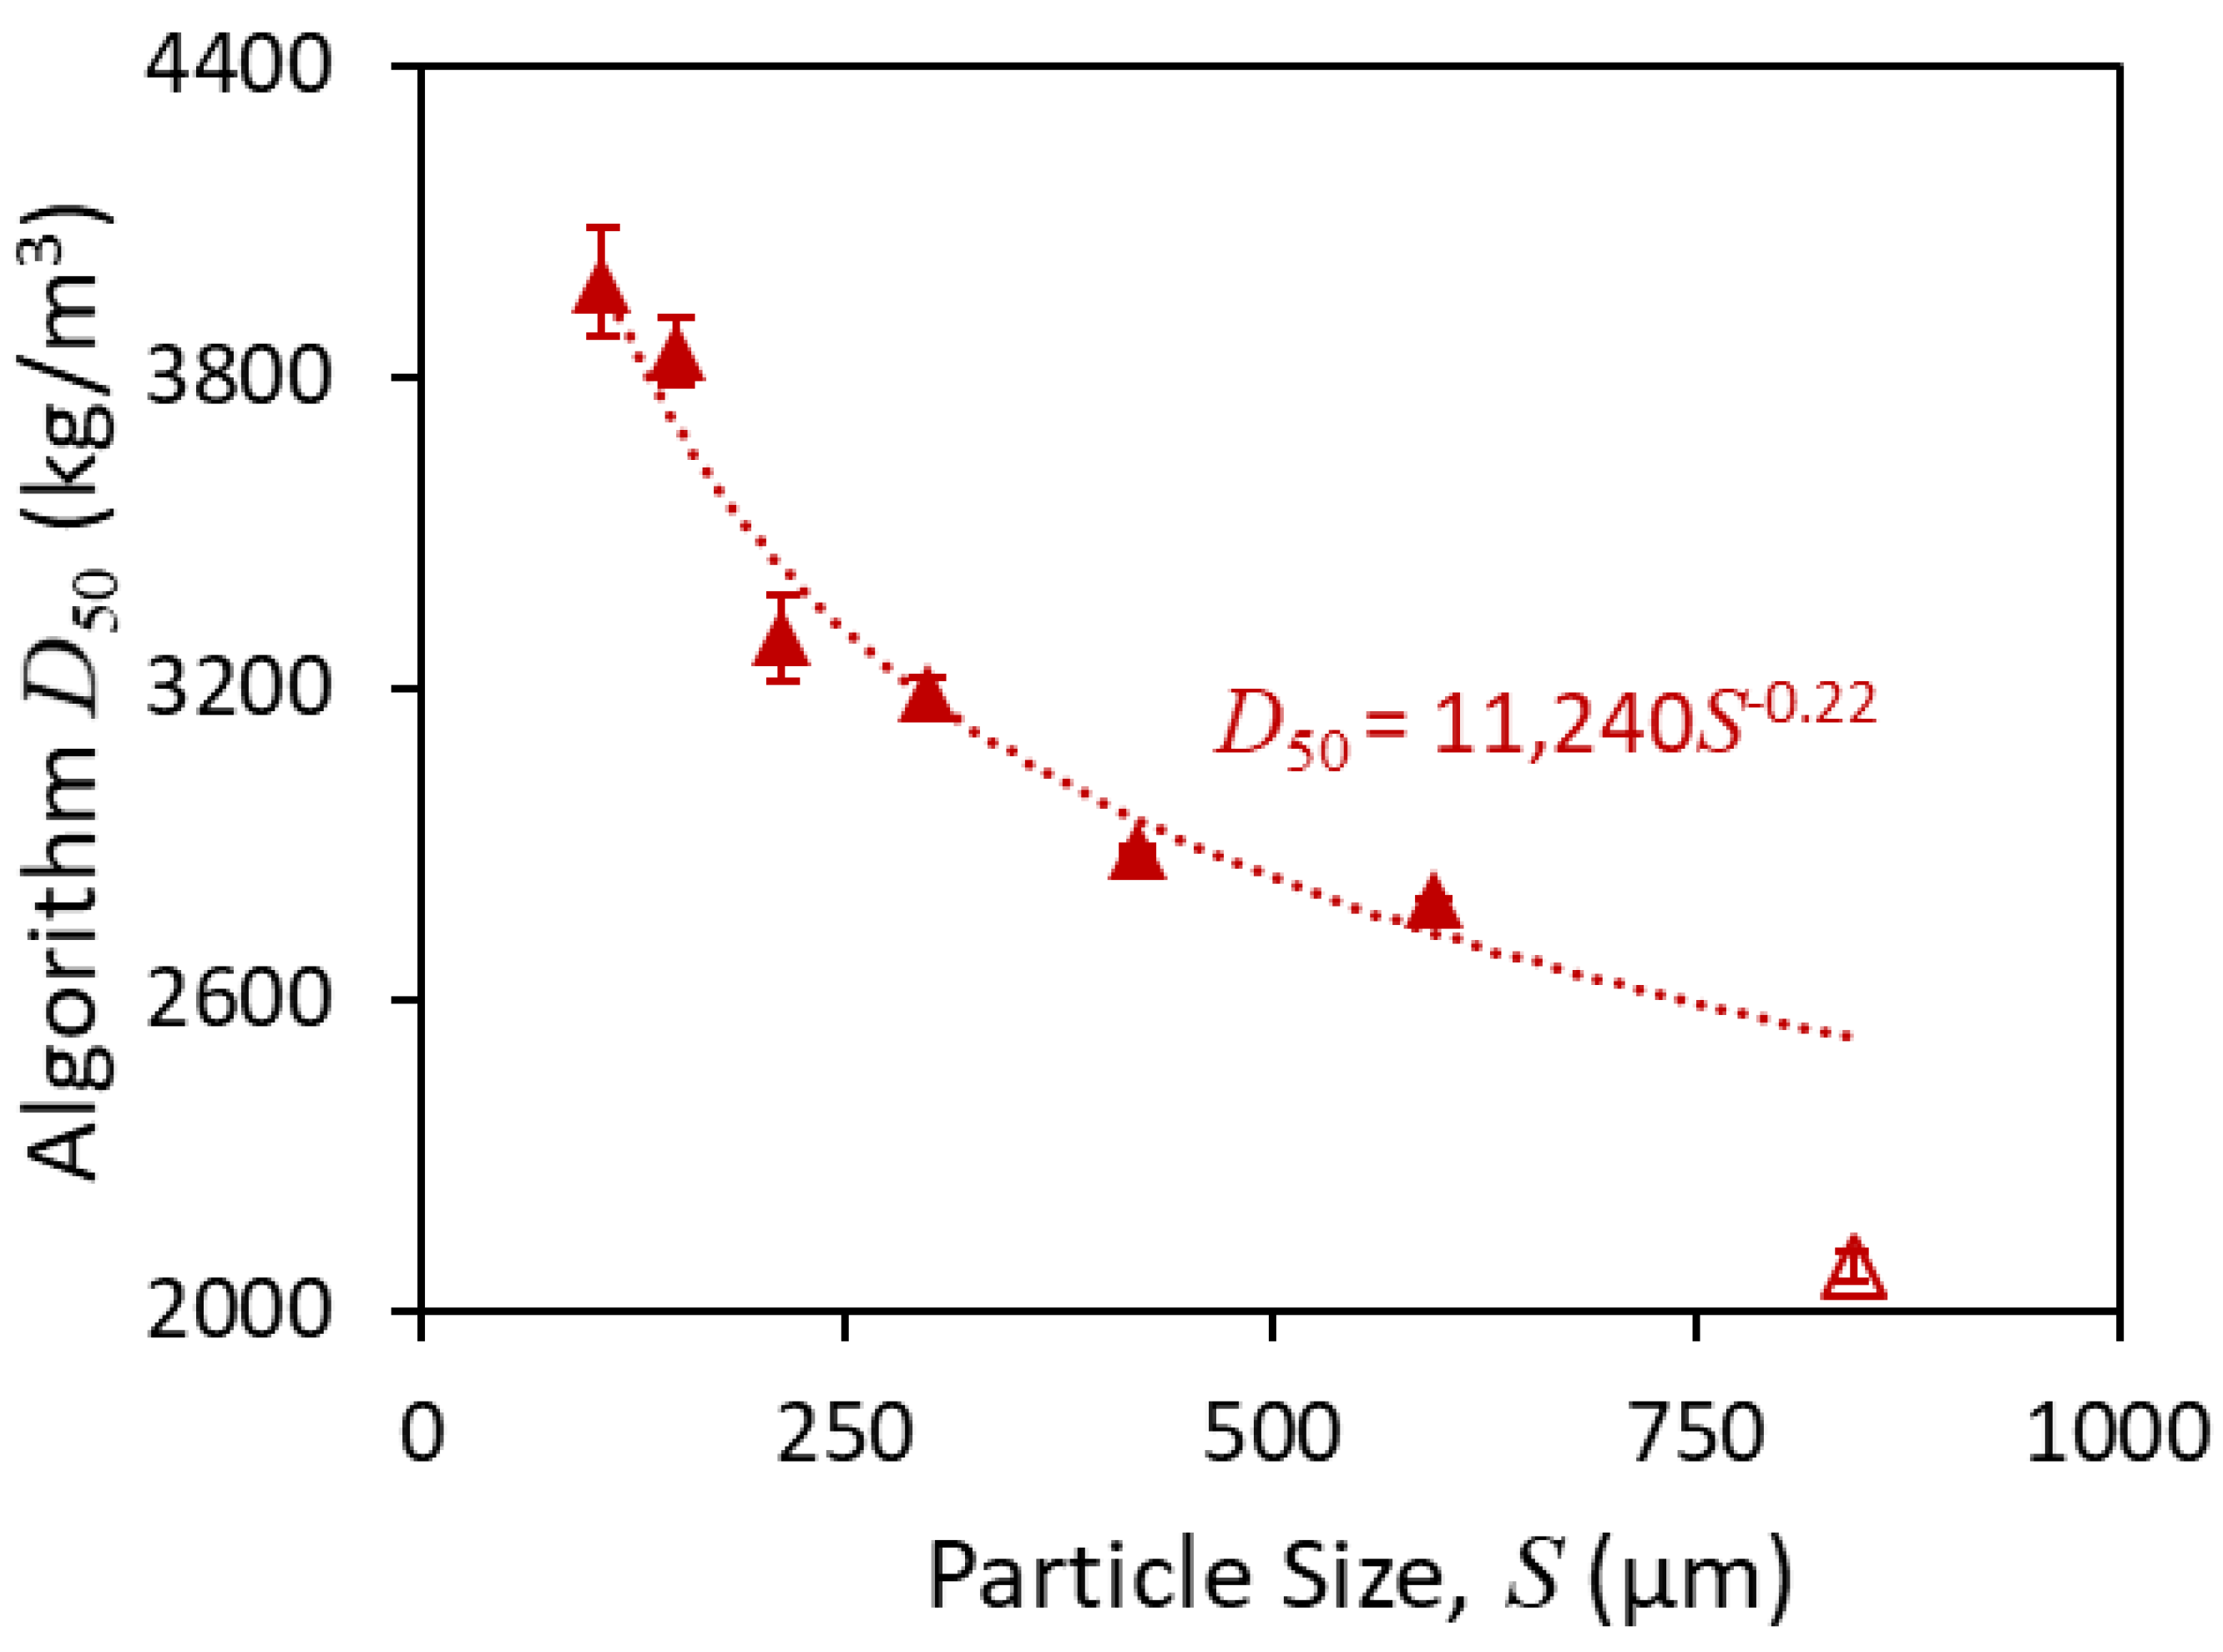
Figure 6.
D50 as a function of particle size comparing the experimental values from this study as well as those of Galvin et al. [17] with the model shown in Equation (3). Here, n = 0.28 and S0 = 300 µm. A least squares curve fit was used to find D0 for each dataset. There is strong consistency between the model and experimental values. RC separation z = 3 mm.

Figure 7.
Variation in Ep as a function of particle size based on applying the algorithm to the LST flow fractionation data. There is some scatter with no observable trend, but the Ep is on average 170 kg/m3. RC separation z = 3 mm; RC flow fractionation z = 3 mm.
Figure 7.
Variation in Ep as a function of particle size based on applying the algorithm to the LST flow fractionation data. There is some scatter with no observable trend, but the Ep is on average 170 kg/m3. RC separation z = 3 mm; RC flow fractionation z = 3 mm.
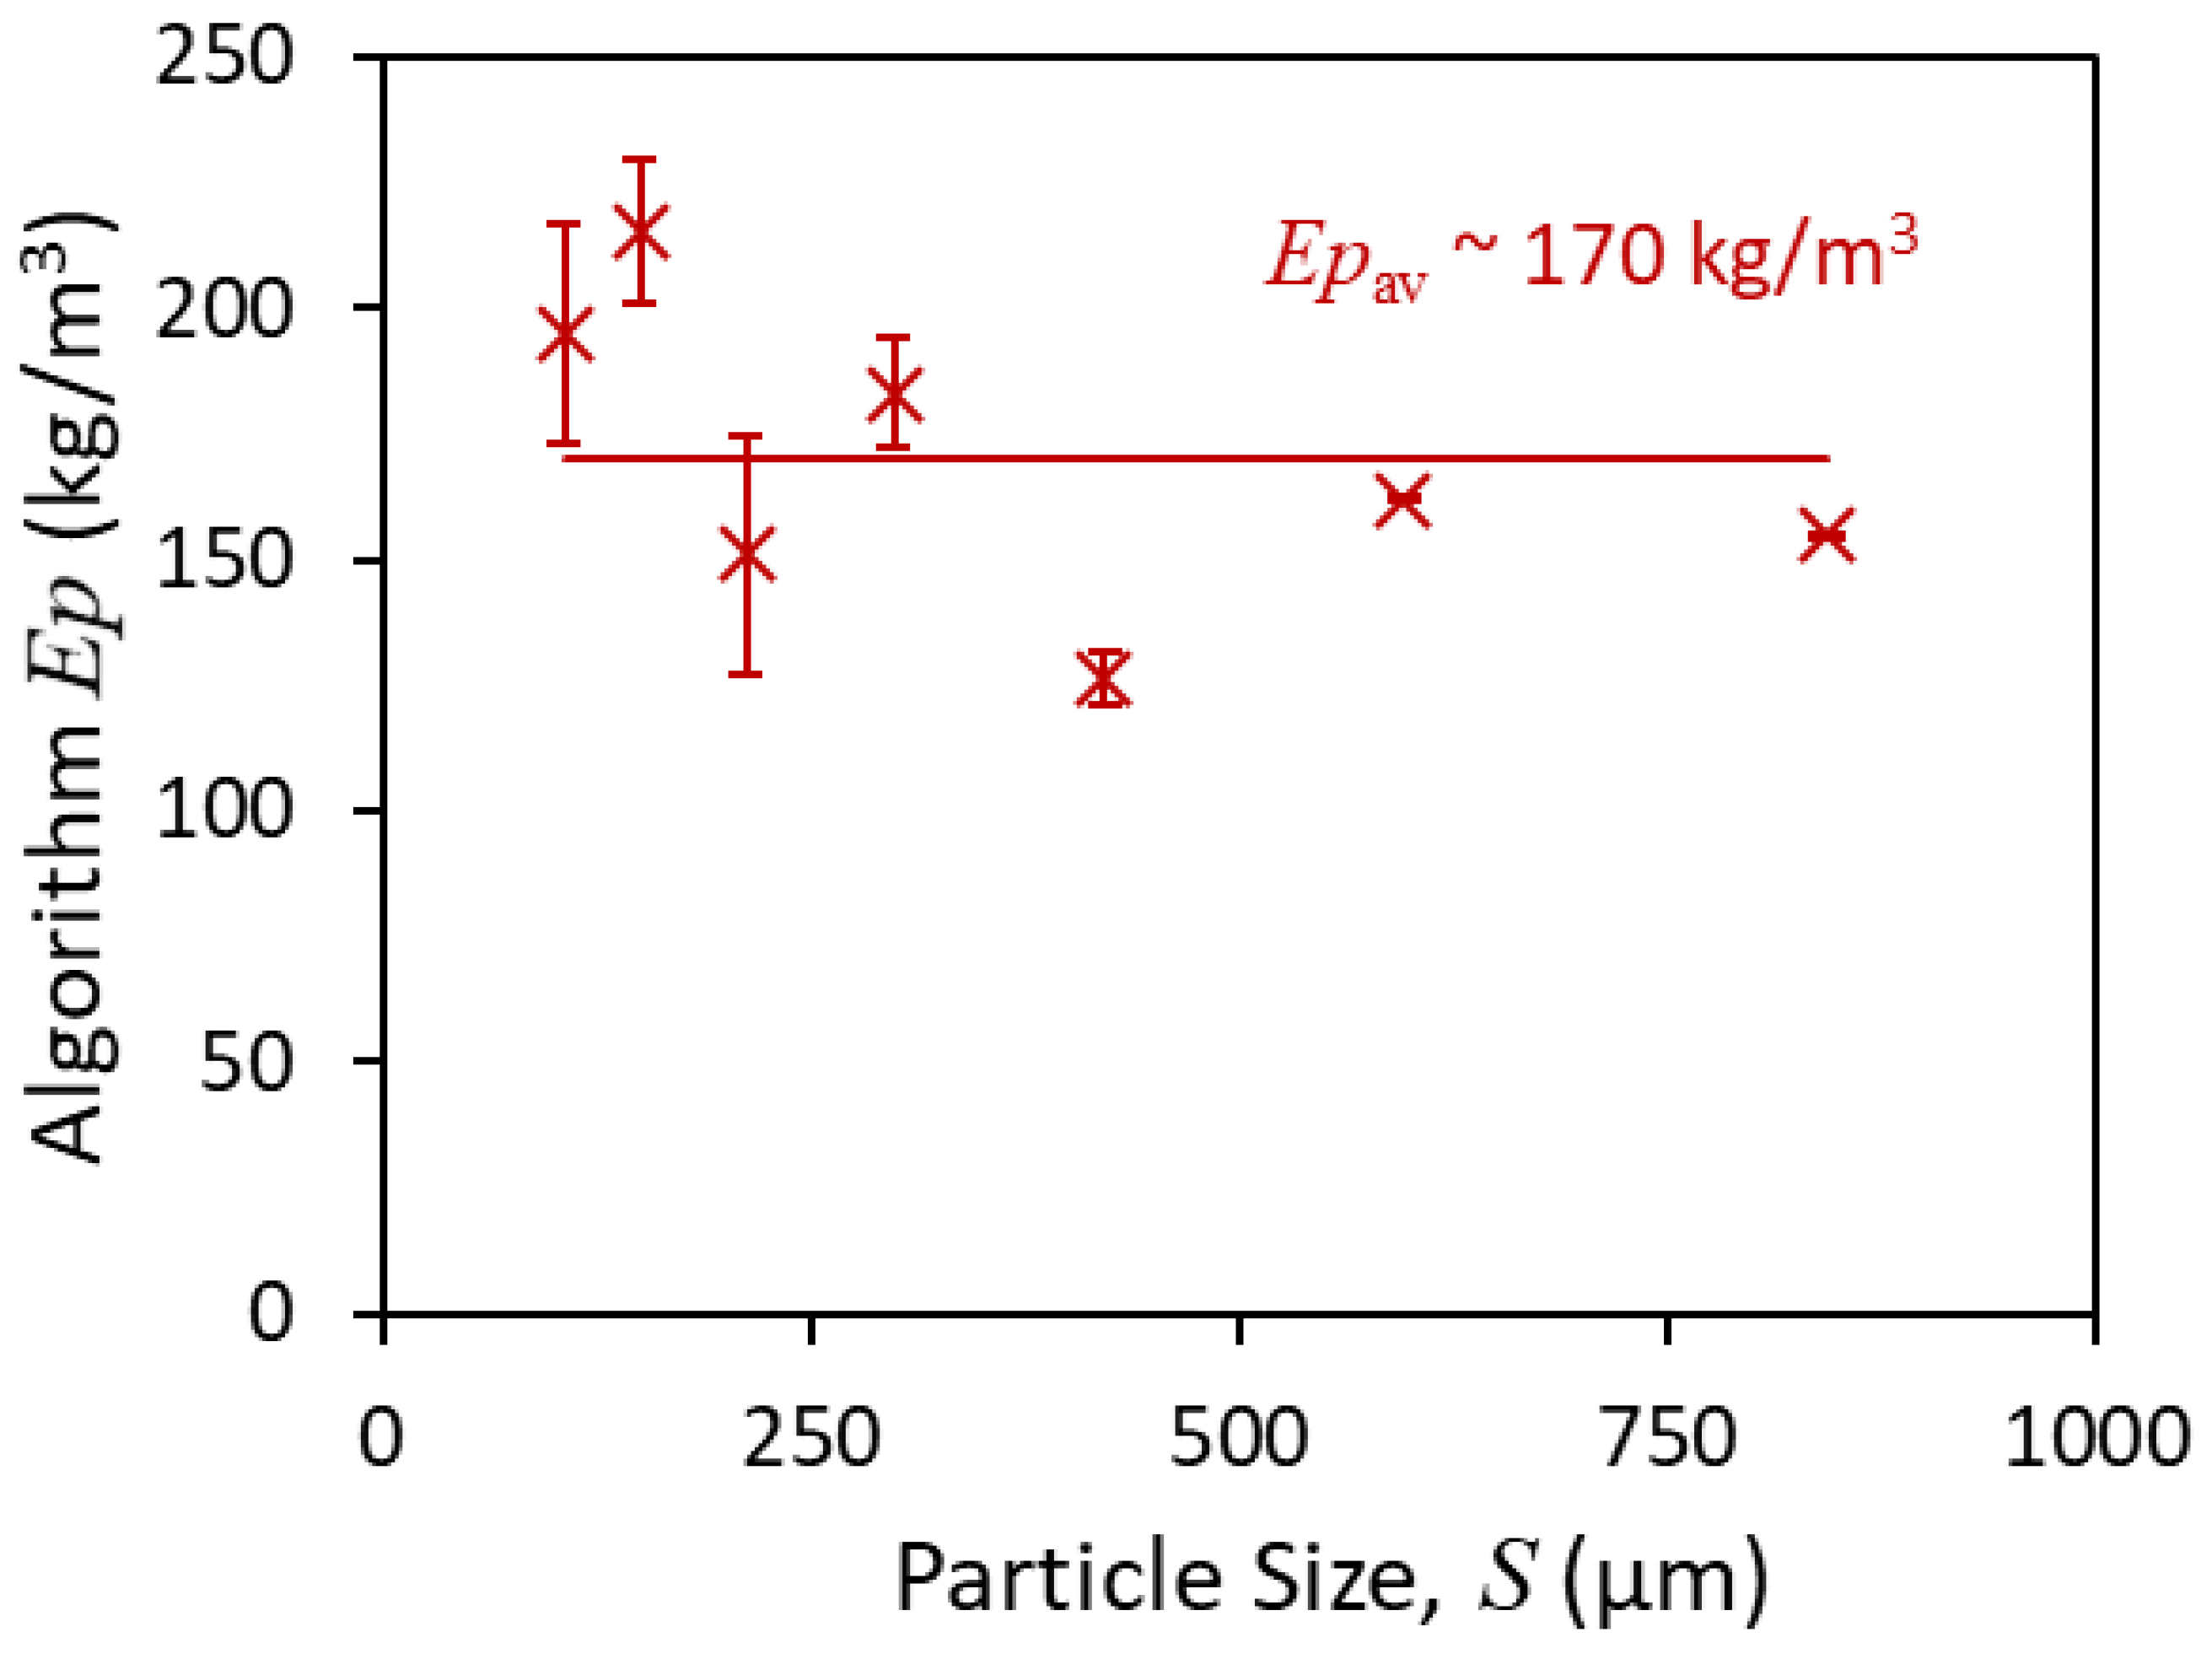
Figure 8.
Correlation established between gold assay and average density established based on assay data for samples which has been measured for their average density using water pycnometry [21]. The broken lines represent two 95% confidence intervals either side of the slope of the trend line.
Figure 8.
Correlation established between gold assay and average density established based on assay data for samples which has been measured for their average density using water pycnometry [21]. The broken lines represent two 95% confidence intervals either side of the slope of the trend line.
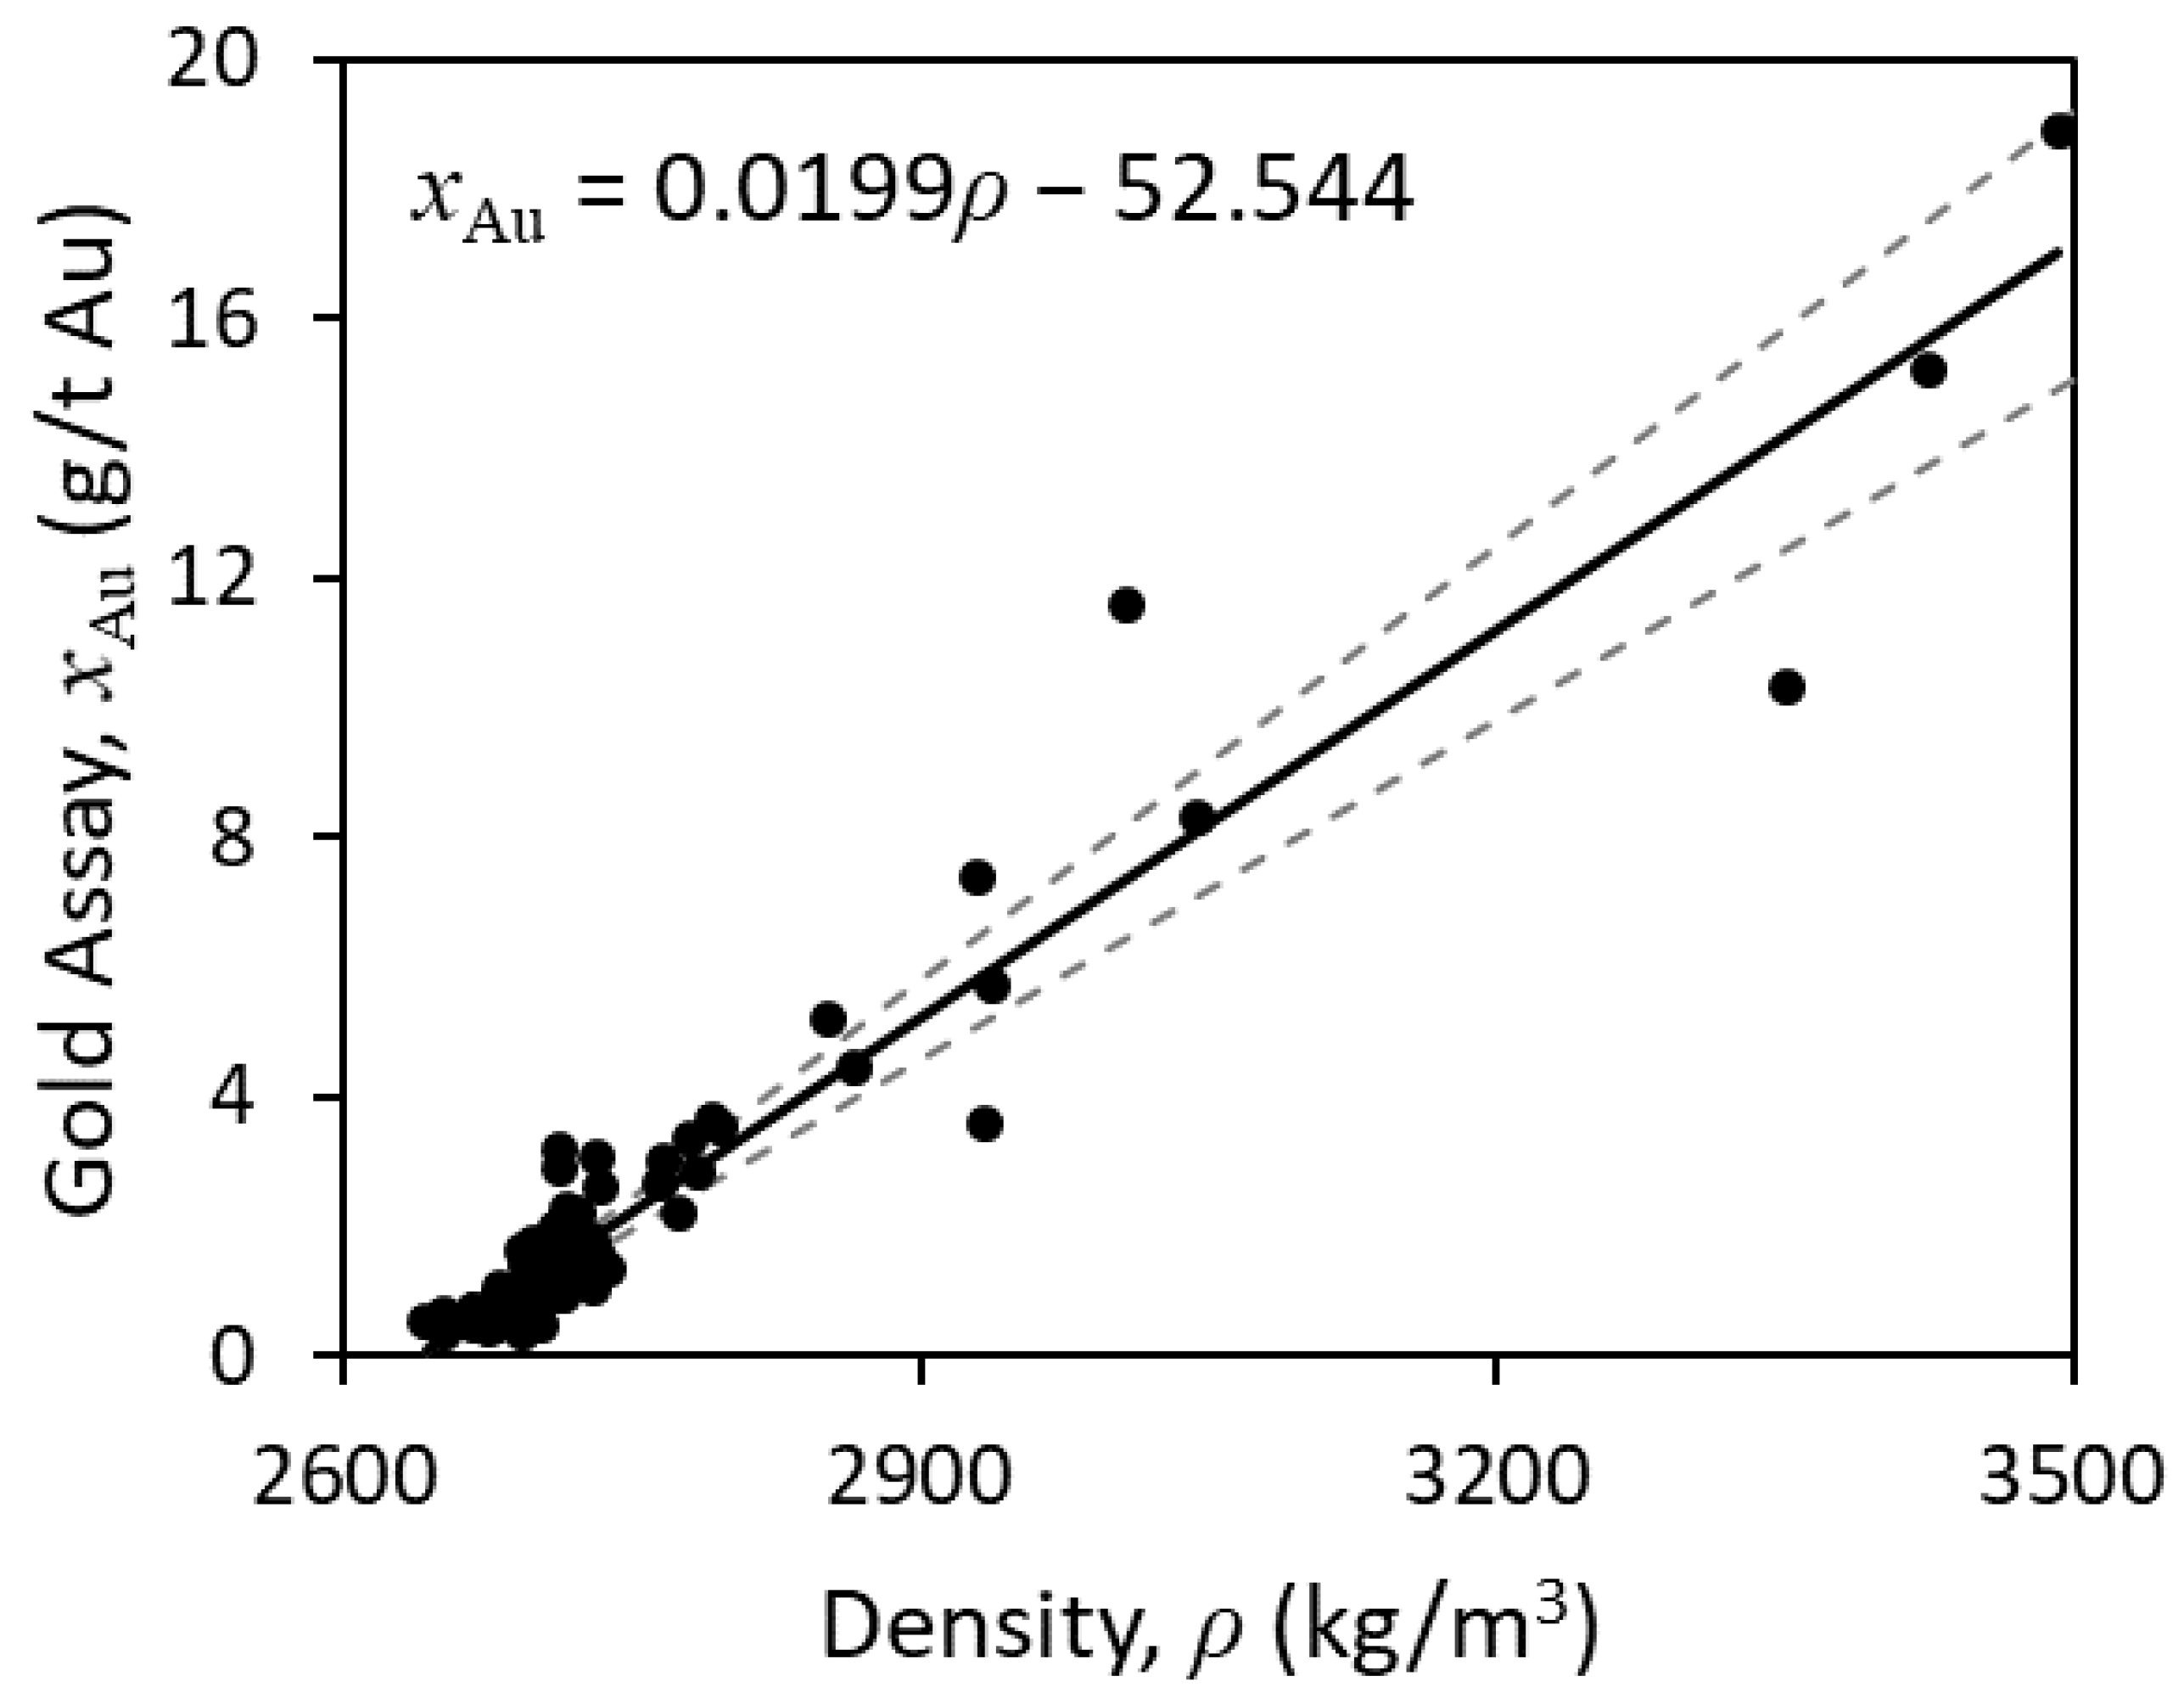
Figure 9.
Gold recovery as a function of mass rejection comparing the experimental data [22] with model predictions based on applying the partition surface to the feed density distribution. The partition surface was described by Equation (3), with n = 0.28, S0 = 300 µm and Ep = 170 kg/m3, with the parameter D0 varied to simulate changes in the controller density set point of the REFLUXTM Classifier.
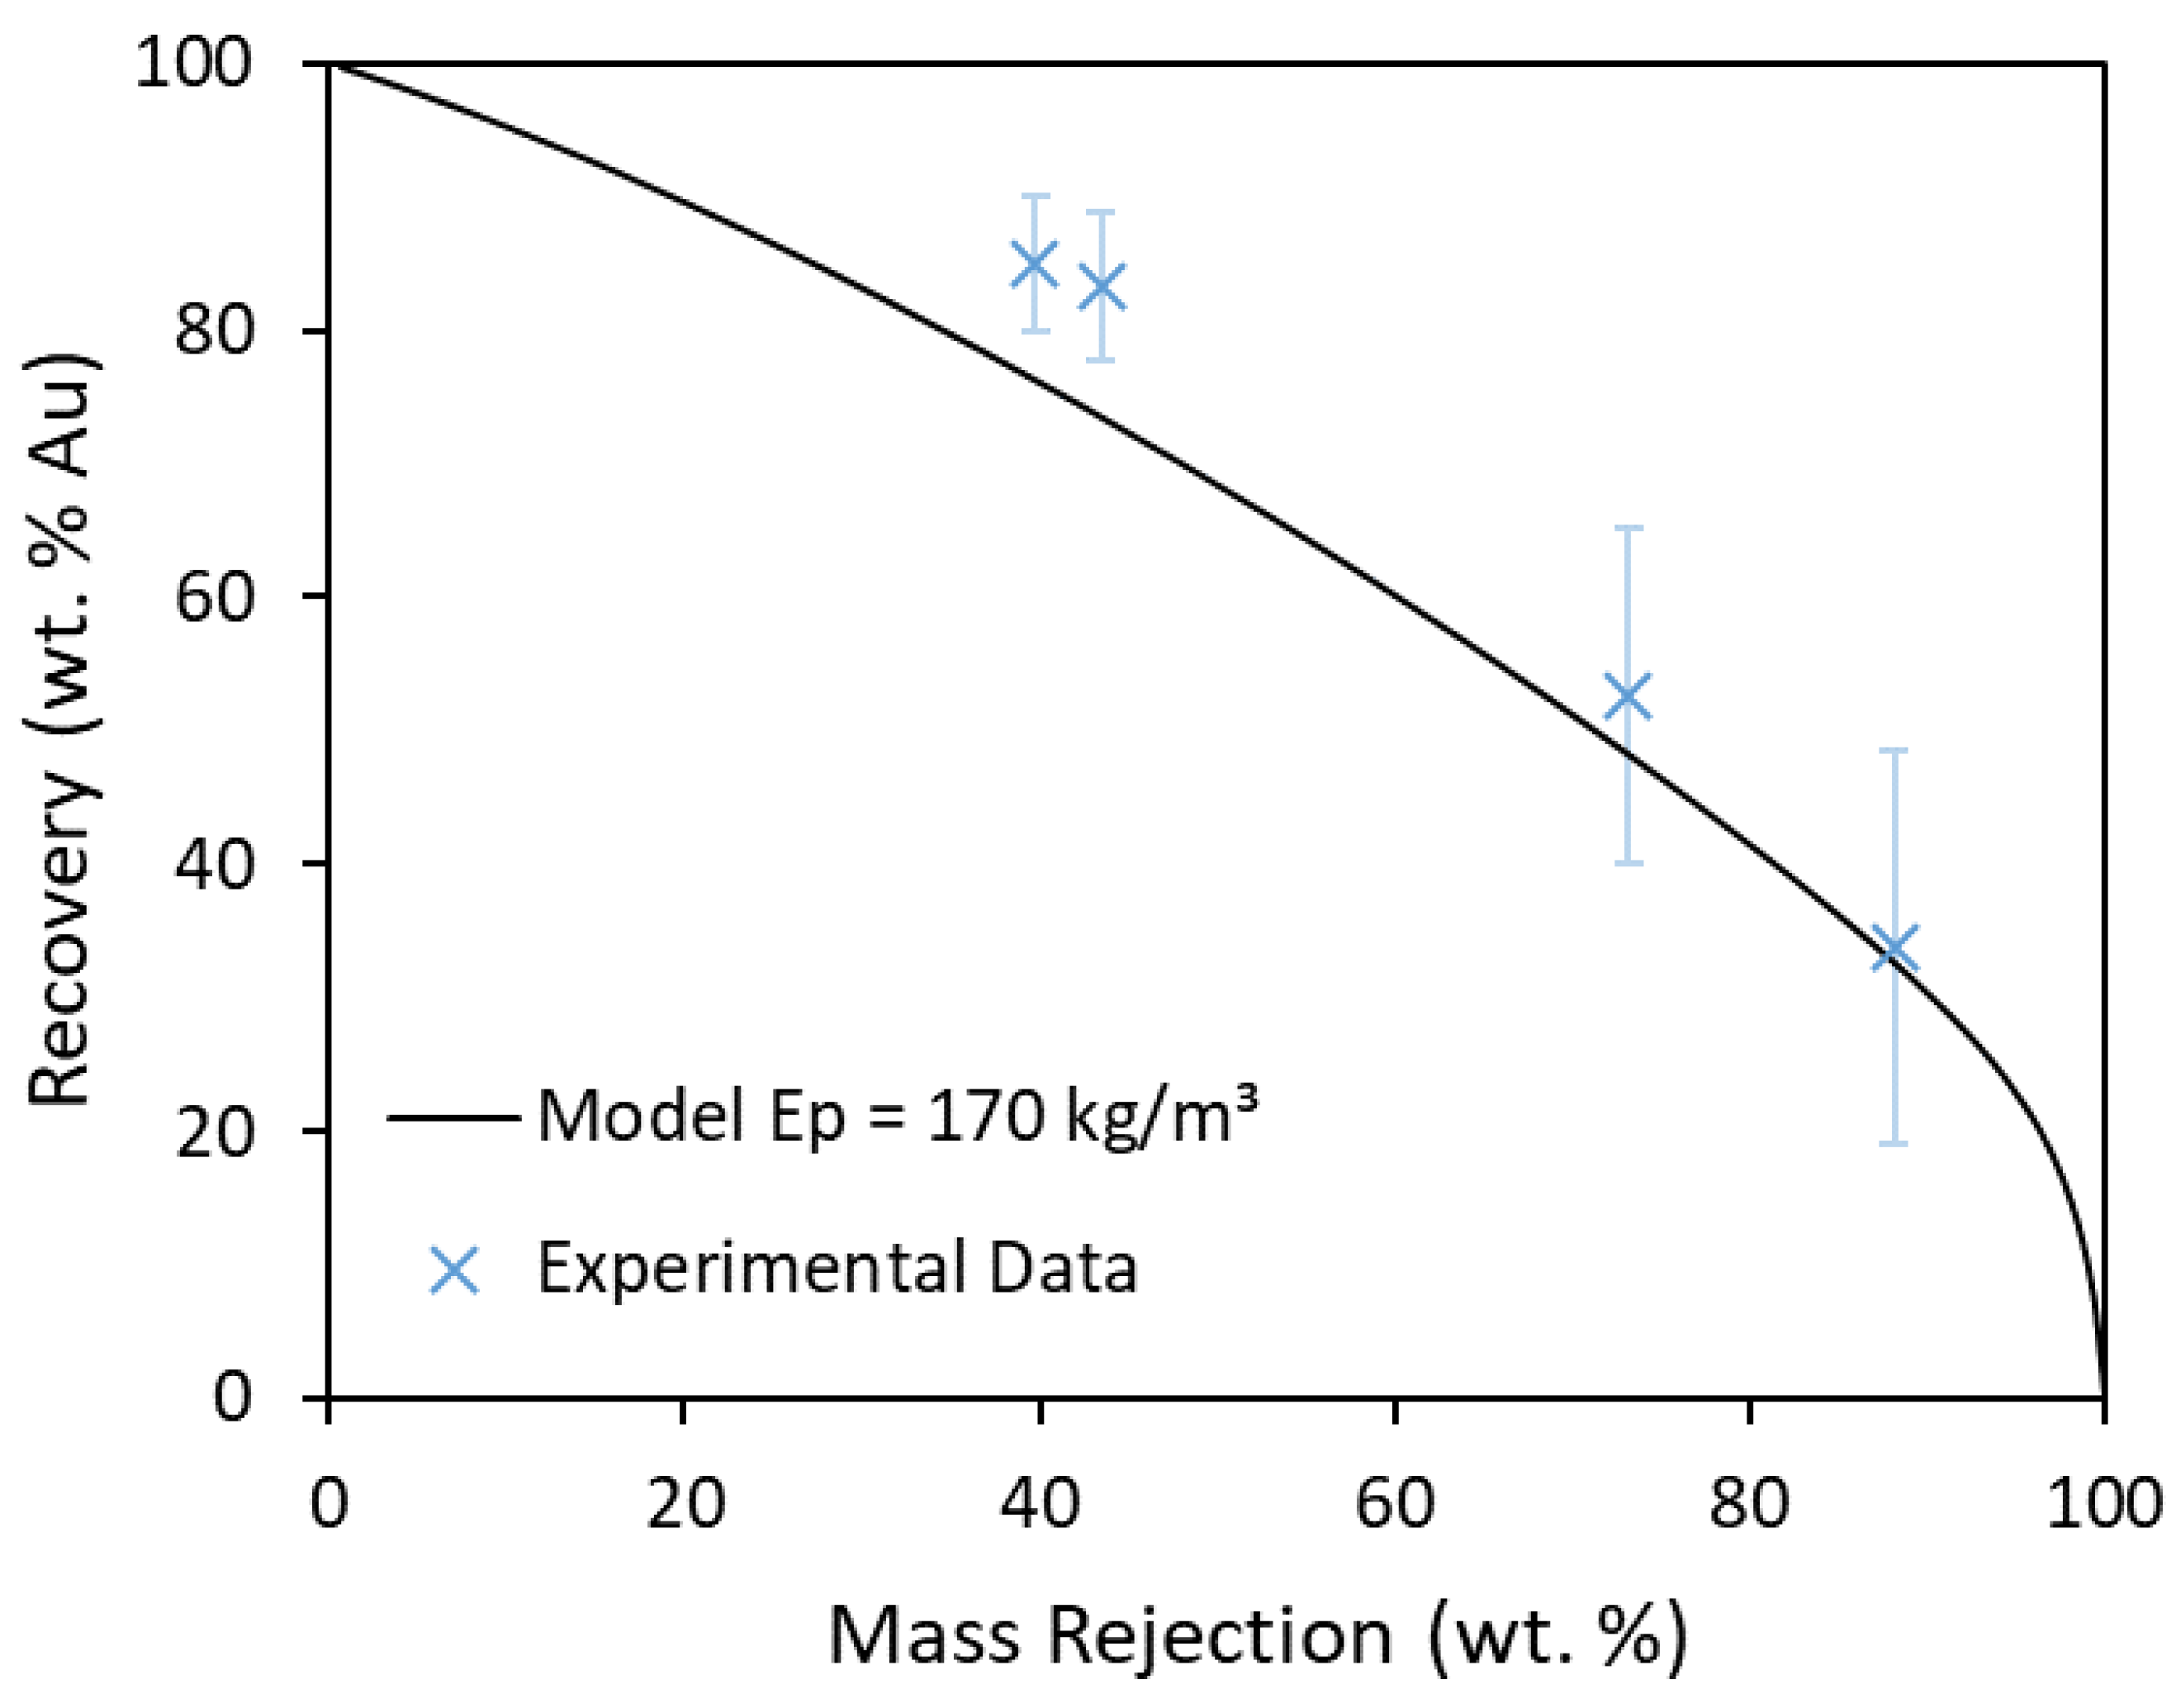
Figure 10.
Recovery as a function of mass rejection comparing a set of model predictions with the experimental data [22]. The model results are based on a perfect separation with Ep = 0 kg/m3 and n = 0, as well as Ep values of 100, 170, 325 and 500 kg/m3, where the (D50 – 1000) varied with particle size to the power –0.28.
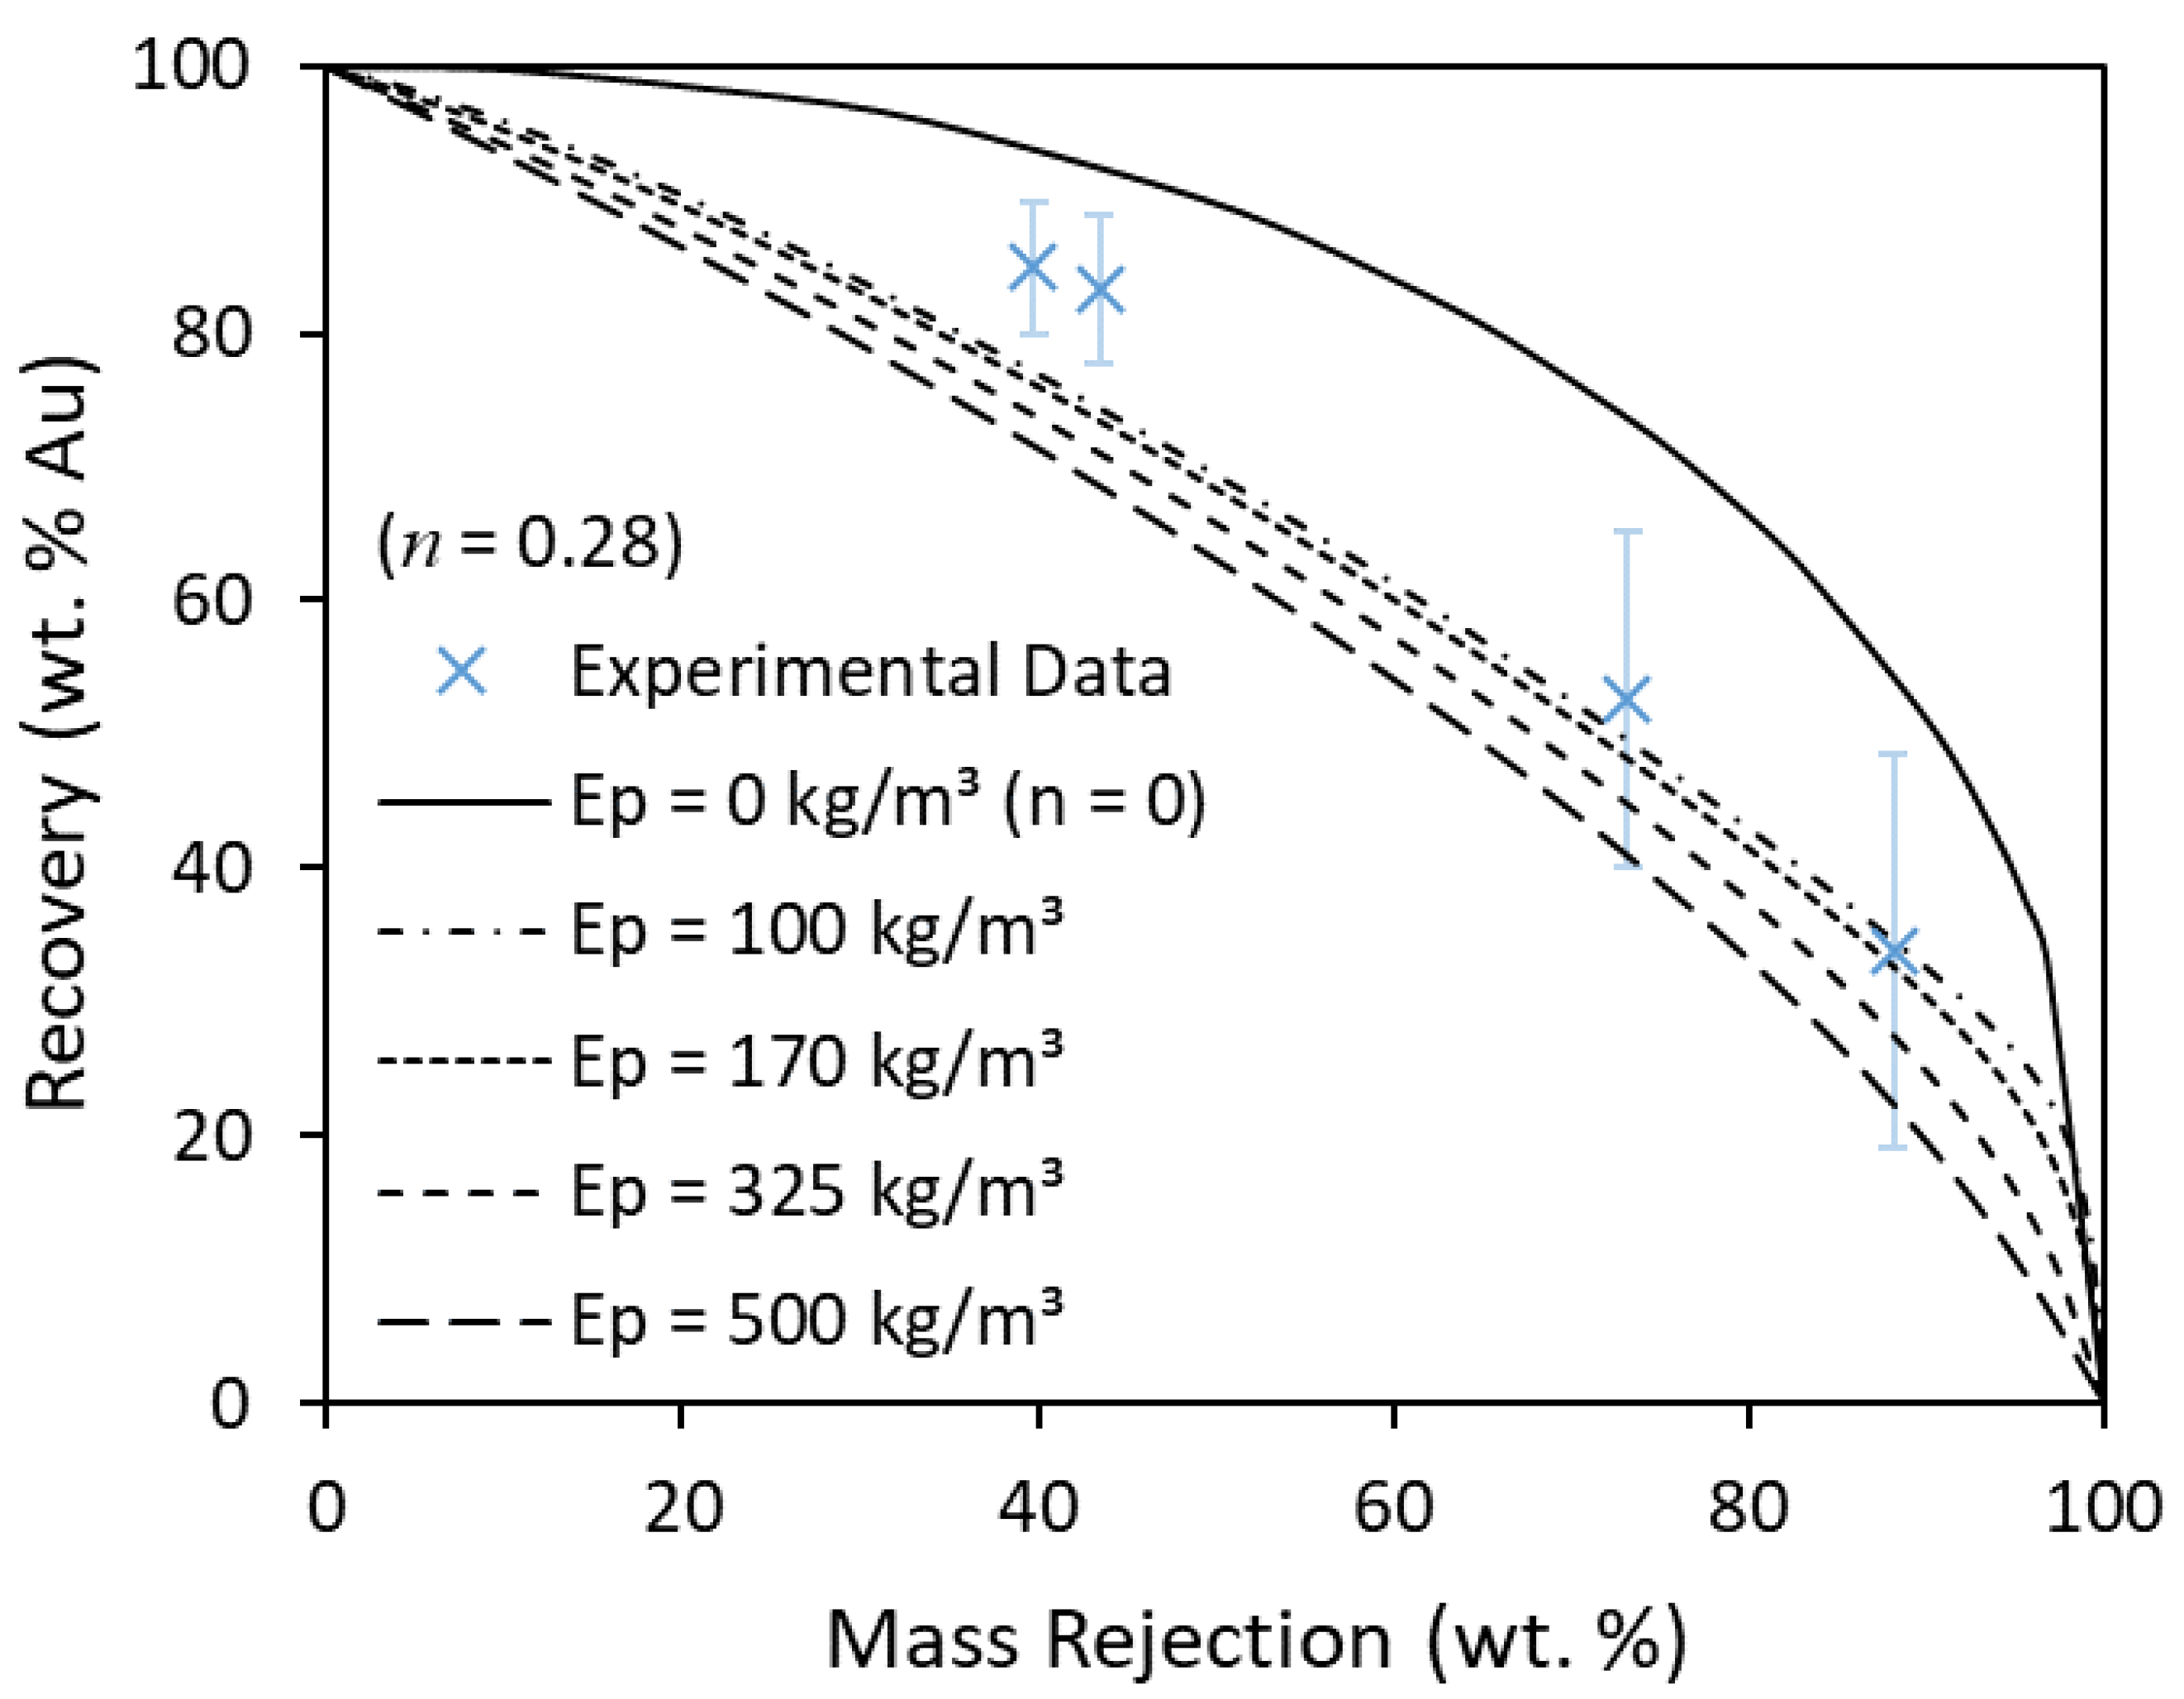
Figure 11.
Recovery modelled as a function of mass rejection for varying n values using Ep = 170 kg/m3. The model predictions are compared to the experimental data [22].
Figure 11.
Recovery modelled as a function of mass rejection for varying n values using Ep = 170 kg/m3. The model predictions are compared to the experimental data [22].
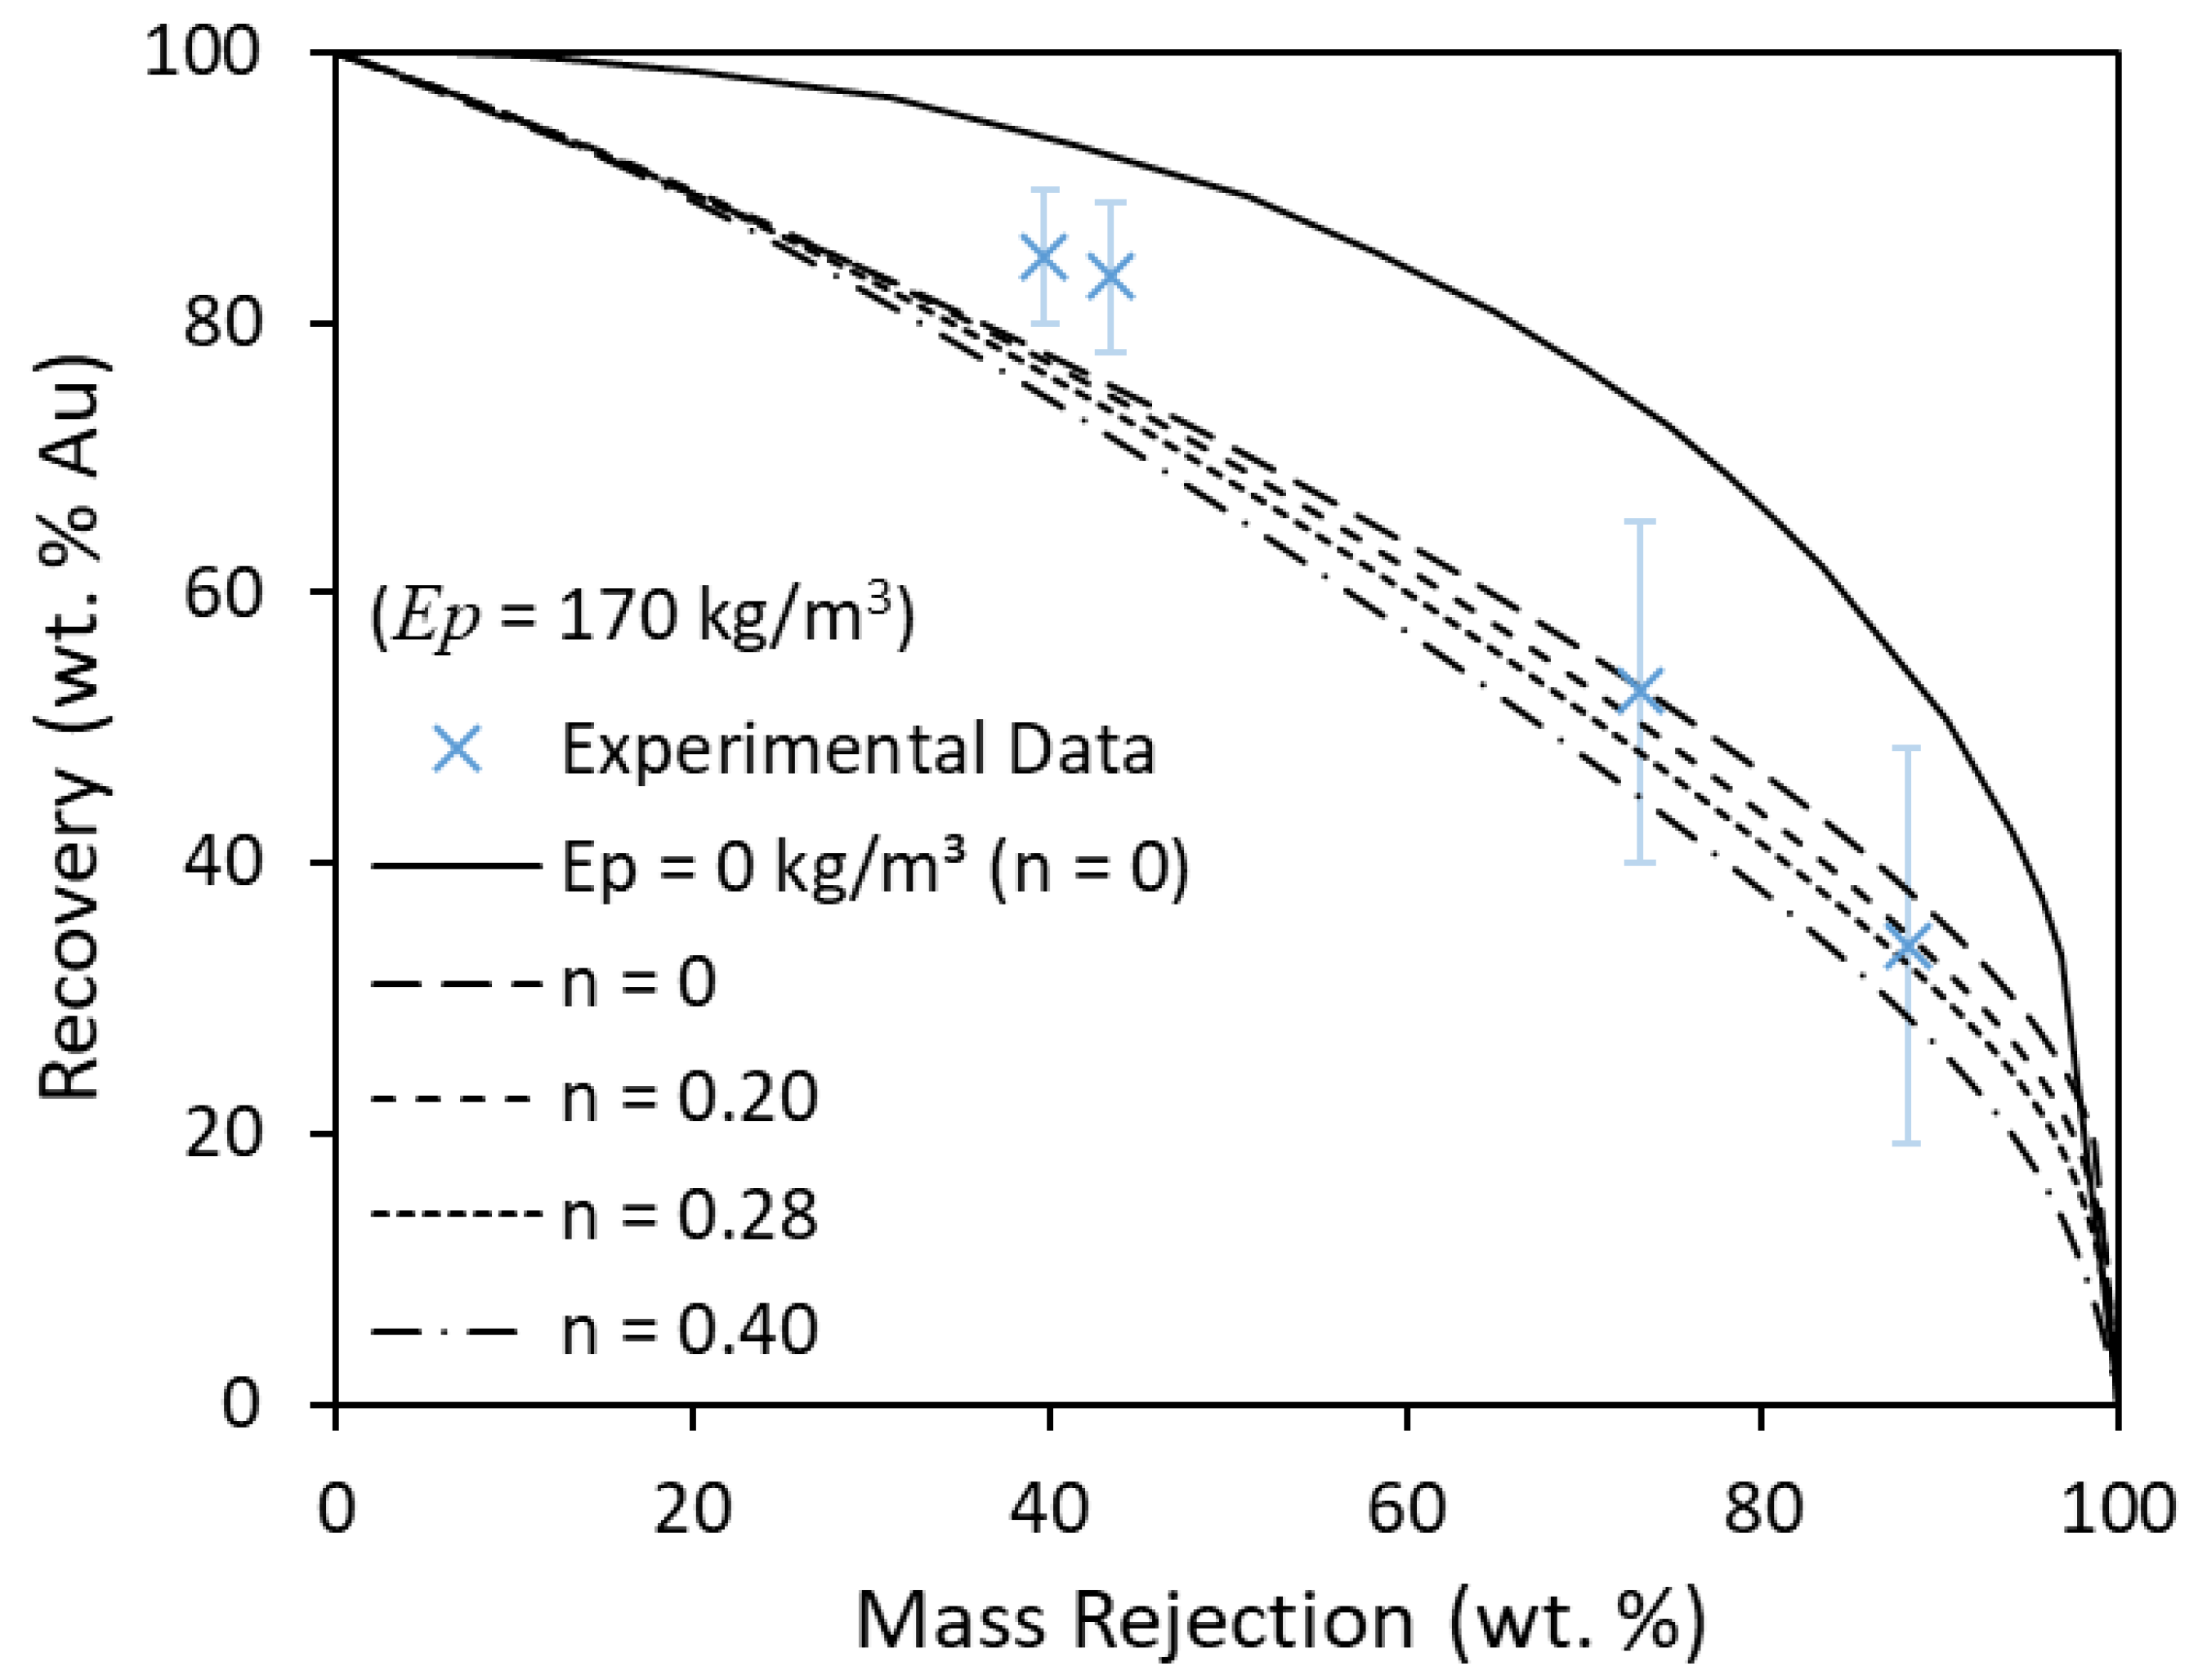
Table 1.
Algorithm solutions comparing the results based on the sink/float and lithium heteropolytungstates (LST) flow fractionation data. The partition parameters (D50, Ep) are shown for the narrow particle size ranges.
Table 1.
Algorithm solutions comparing the results based on the sink/float and lithium heteropolytungstates (LST) flow fractionation data. The partition parameters (D50, Ep) are shown for the narrow particle size ranges.
| Sink/Float | LST Flow Fractionation | |||
|---|---|---|---|---|
| Size Range | D50 | Ep | D50 | Ep |
| (µm) | (kg/m3) | (kg/m3) | (kg/m3) | (kg/m3) |
| −300 + 212 | 3090 | 379 | 3151 | 348 |
| −212 + 150 | 3477 | 347 | 3518 | 301 |
| −150 + 106 | 3828 | 318 | 3821 | 284 |
| −106 + 75 | 4096 | 296 | 4128 | 234 |
| −75 + 53 | 4389 | 276 | 4352 | 169 |
| −53 + 38 | 4573 | 336 | 4539 | 145 |
© 2020 by the authors. Licensee MDPI, Basel, Switzerland. This article is an open access article distributed under the terms and conditions of the Creative Commons Attribution (CC BY) license (http://creativecommons.org/licenses/by/4.0/).
Share and Cite
MDPI and ACS Style
Lowes, C.; Zhou, J.; McGrath, T.; Eksteen, J.; Galvin, K. Characterisation and Modelling of Gravity Pre-Concentration Amenability Using LST Fluidisation in a REFLUXTM Classifier. Minerals 2020, 10, 545. https://doi.org/10.3390/min10060545
AMA Style
Lowes C, Zhou J, McGrath T, Eksteen J, Galvin K. Characterisation and Modelling of Gravity Pre-Concentration Amenability Using LST Fluidisation in a REFLUXTM Classifier. Minerals. 2020; 10(6):545. https://doi.org/10.3390/min10060545
Chicago/Turabian StyleLowes, Callan, James Zhou, Teresa McGrath, Jacques Eksteen, and Kevin Galvin. 2020. "Characterisation and Modelling of Gravity Pre-Concentration Amenability Using LST Fluidisation in a REFLUXTM Classifier" Minerals 10, no. 6: 545. https://doi.org/10.3390/min10060545
Note that from the first issue of 2016, this journal uses article numbers instead of page numbers. See further details here.