
Analyzing Stability Conditions and Ore Dilution in Open Stope Mining


School of Mining & Metallurgical Engineering, NTUA, GR15780 Athens, Greece
*
Author to whom correspondence should be addressed.
Minerals 2021, 11(12), 1404; https://doi.org/10.3390/min11121404
Submission received: 27 October 2021
/
Revised: 26 November 2021
/
Accepted: 8 December 2021
/
Published: 11 December 2021
(This article belongs to the Special Issue Minerals Study, Applications and Processing: Building the Foundations of a Green Future)
Abstract
:Ore dilution is a fundamental problem for the production process in underground mining operations. Especially in open stoping methods of underground mining, the continuous estimation, monitoring and treatment of instability issues is considered necessary in order to maintain the consistency of the production process. This paper aims to combine empirical nomograms of stability estimation and numerical approaches and thus link the extensive experiences of the empirical design and the quantitative data derived by numerical analyses. To facilitate this, a large number of different geomechanical conditions were modeled and analyzed in the pursuit of obtaining valid and applicable relationships between the empirical stability graphs’ approaches and the numerical simulation models. The parametric analysis was made to express the stability conditions and the dilution with specific design characteristics, using prevalent stability-graph approaches while the numerical models were tested using the RS2 software package. The obtained results include direct and easy-to-use mathematical expressions that can be applied during the initial design of the stoping process, especially for the case of sidewalls (hanging walls and foot walls). Furthermore, through the research, an initial proposal is made for a dilution-based stability graph that could be utilized for the early identification of dilution.
1. Introduction
In recent decades, open stoping methods of underground mining have become widespread and are used in a variety of mining operations. Nevertheless, besides their ease of use and efficiency in operation, external dilution is a major issue to consider. In this manner, the estimations of the stability conditions, overbreaks and spalling failures that could inflict potential external dilution are required to ensure the optimal design of the exploitation. Efforts were made using empirical models and nomograms and relevant methodologies were proposed, so as to provide principal design guidelines, which were mainly qualitative. On the other hand, numerical models, although complicated and time-consuming, can be used to depict failure conditions and yielding areas.
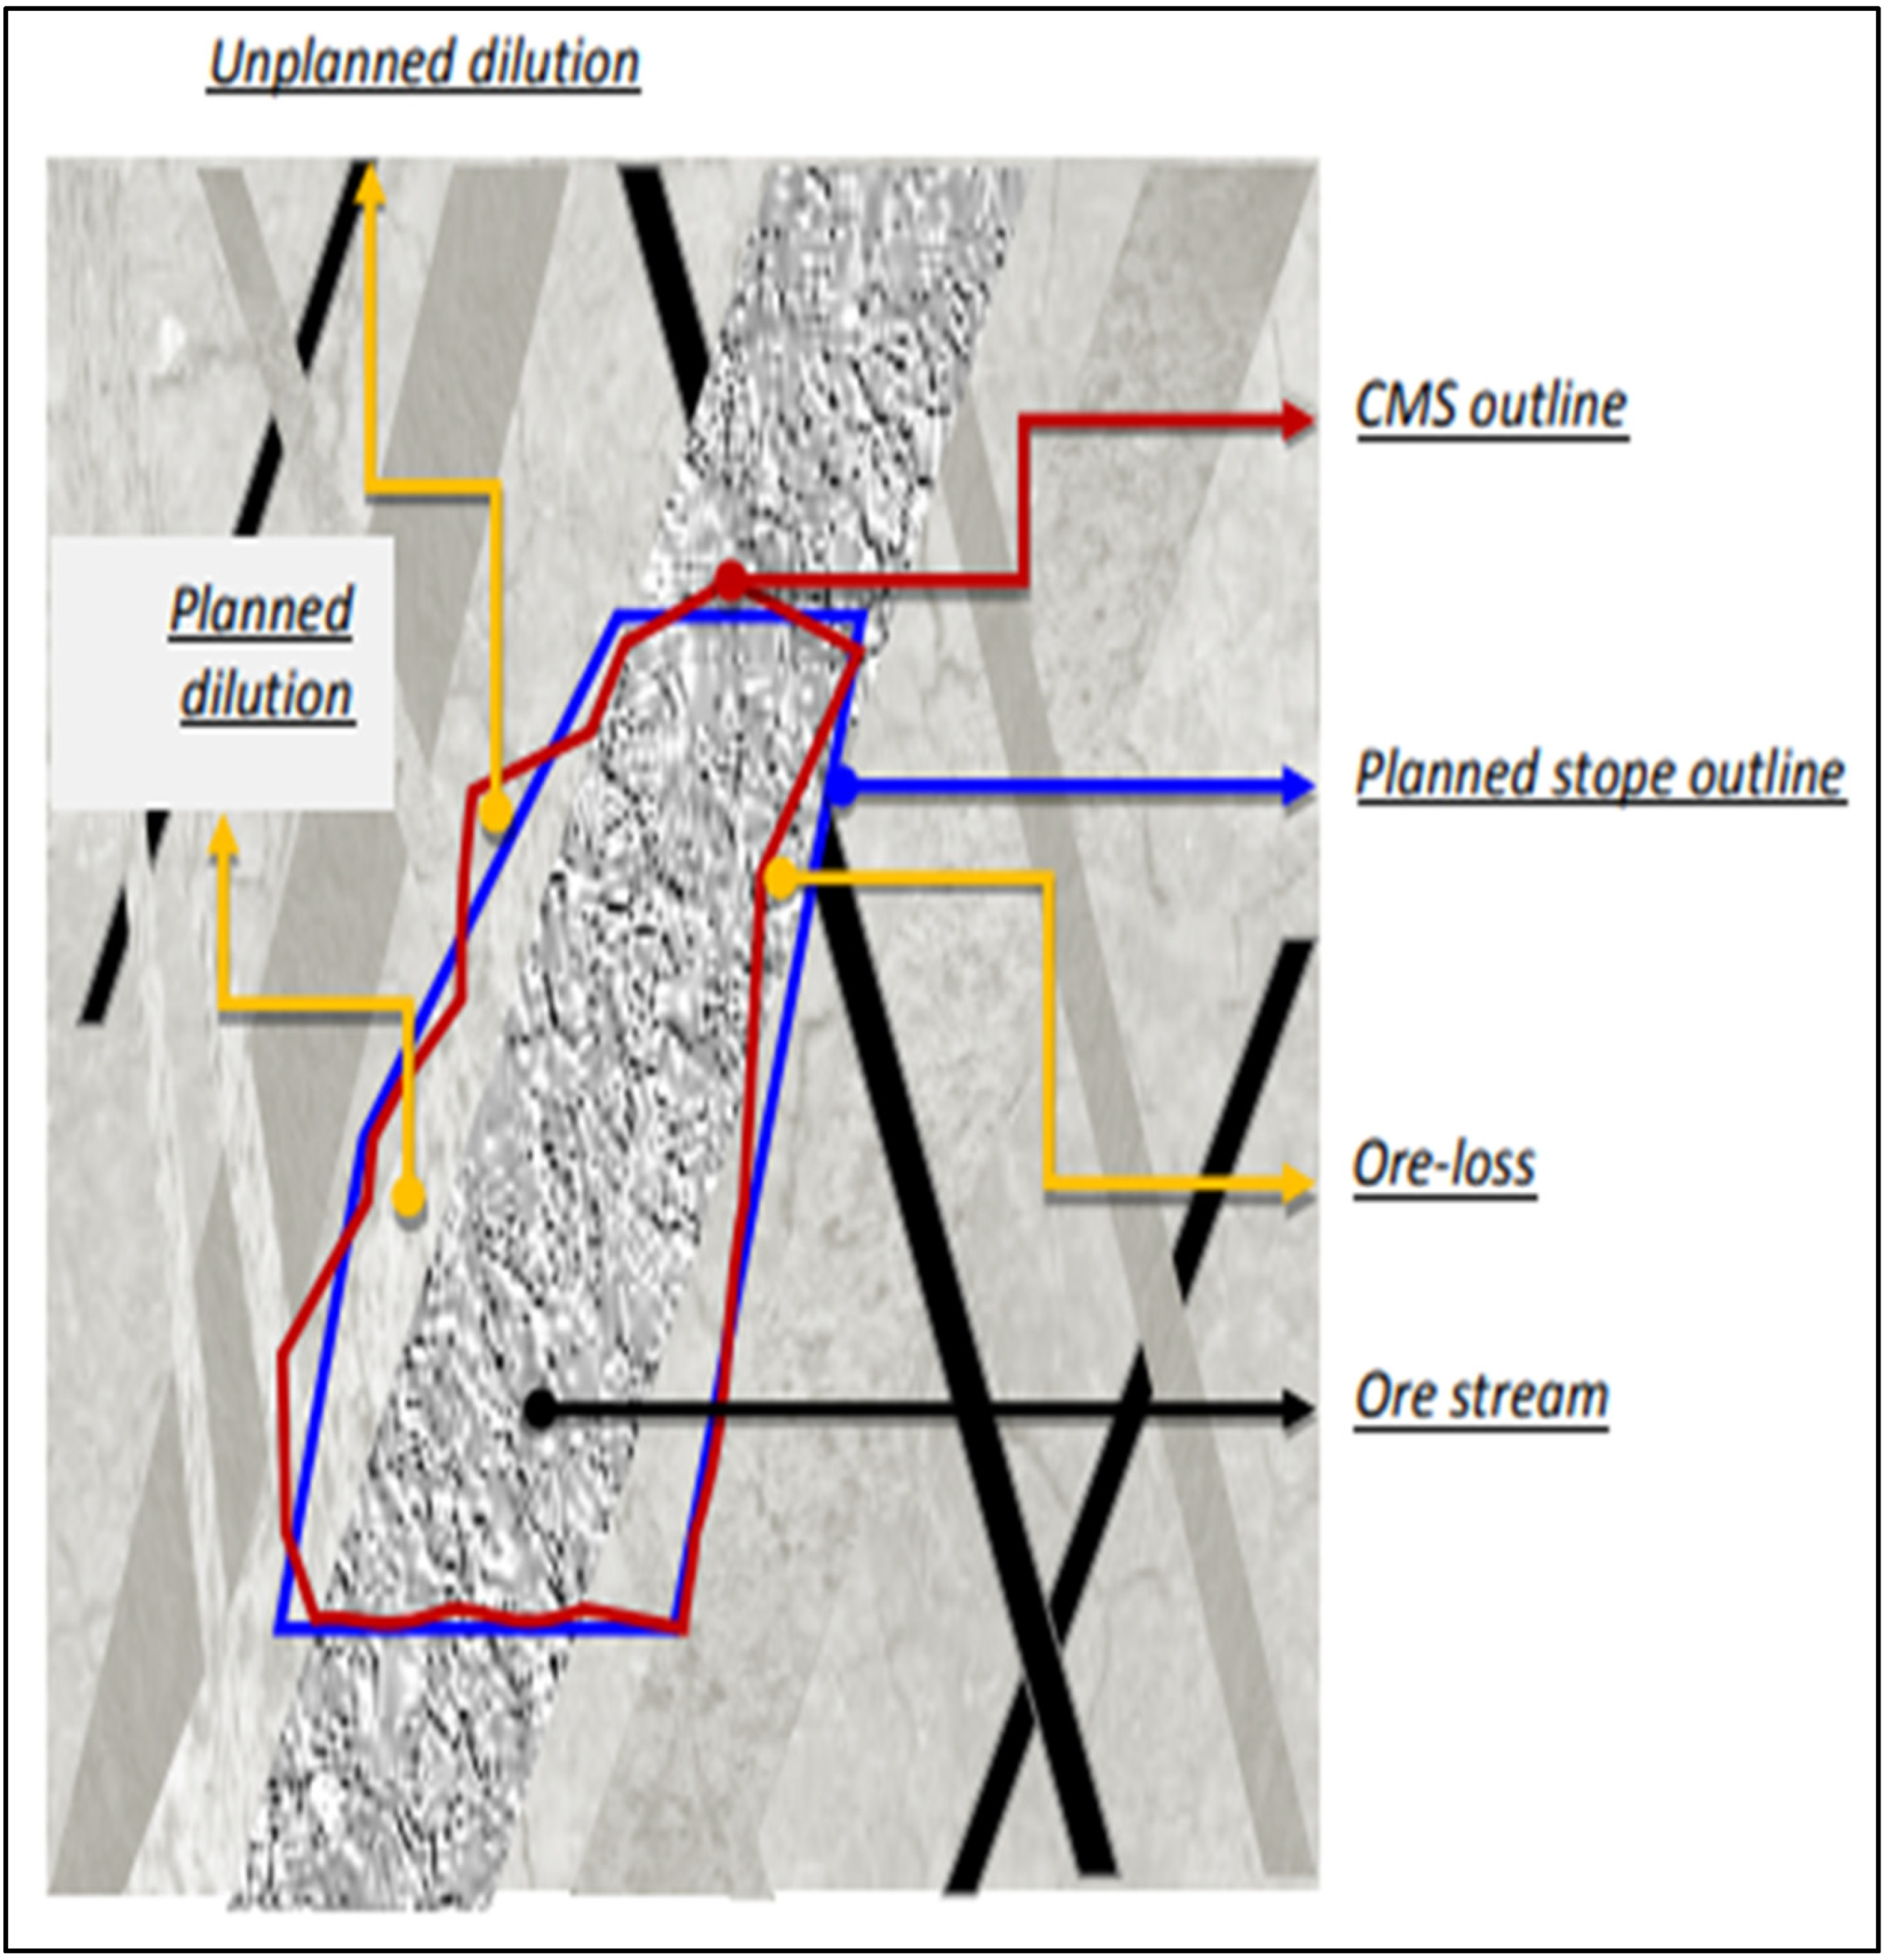
Ore dilution refers to the waste material (sterile material or material with small amounts of useful content) that is not separated from the ore [1]. Hence, it mixes and interferes with the ore, increasing the mined tonnage that requires handling while decreasing its grade. Ore dilution can be divided into internal dilution, external dilution and ore loss (Figure 1). External dilution in underground open-stoping exploitations is a matter of paramount importance for the proper operation and cost-effectiveness of the mining process.
Dilution can be defined as the ratio of the tonnage of waste mined and sent to the mill to the total tonnage. Several mathematical definitions have been formulated over time to define and to explicitly calculate the dilution rate, as given by Pakalnis [2]:
Dilution (%) = (Extracted tons of sterile material) × 100/(Extracted tons of ore)
Dilution (%) = (Extracted tons of sterile material) × 100/[(Extracted tons of sterile material) + (Extracted tons of ore)]
Figure 1.
Ore dilution categorization by Jang [3].
Figure 1.
Ore dilution categorization by Jang [3].
Various factors contribute to the occurrence of external (or secondary) dilution and ore loss. A general basic categorization of these factors, according to Jang [3], is given below:
- Drilling and blasting characteristics;
- Stope design factors;
- Geological—Geotechnical factors;
- Human error and others.
According to Planeta and Bourgoin [4], increasing the dilution rate by about 13% could reduce the total revenue by 15% and could even reduce the total gross profit by 60%, as well. Furthermore, the effect of the same amount of sterile intermediate material on the final cost of the extraction process decreases as the width of the ore increases, as pointed out by Stewart and Trueman [5] through their analysis.
One of the issues to consider for the management and control of external dilution is the proper design of the exploitation in terms of stability. The failures and overbreaks associated with poor stability conditions not only pose a threat to the overall safety of the workers and the mine but contribute, to a great extent, to the presence of waste inclusions within the mined ore.
One of the traditional tools that has been developed to control such issues is the empirical stability graph, as introduced by various researchers (e.g., Suorineni [6]). Empirical stability graphs have proved to be very useful for the early assessment of an open stope’s stability condition. The determination of the ore’s external dilution rates is made possible through modifications that were made by focusing on the phenomenon. Such estimates regarding the theoretical quantification of an overbreak are an important step to the optimal design of an ore exploitation that can be readily available from the initial design stages of a project.
The present research has two basic aims. The first purpose is obtaining the correlation between the empirical theoretical methods for the estimation of an open stope’s stability performance with the dilution characteristics arising from the finite element analysis models. The second scope of the research is the creation of easy-to-use mathematical tools for the preliminary calculation of an open stope’s dilution rate. These approaches are exported through the research data processing and are empirical. Empirical tools provide the opportunity to receive an immediate and reliable performance assessment of stopes’ different design parameter sets. Every empirical formula or chart is validated for a specific range of parameter values.
Typical stability graphs consist of two coefficients, related to the overall rock mass conditions and the extent of the mine opening. These factors are the stability number, N (or its modified type N′), and the hydraulic radius, HR. The stability number is calculated by:
where A, B and C are defined as the stress factor, the adjustment orientation factor and the gravity factor, respectively, while Q′ is the modified rock mass quality index by Barton et al. [7] in which Jw and SRF are both equal to 1. The difference between the N and the N′ coefficients lies in the choice of the set of the empirical nomograms for the determination of the values of the parameters A, B and C.
N (or N′) = A × B × C × Q′
A number of researchers have contributed to the development of the stability graph nomograms that assess whether the selected mining stope will remain stable or if it will experience failures. Starting from Mathews et al. [8], who first introduced them and Nickson [9], one of the most notable and widely used stability graph nomograms was developed by Potvin [10] (Figure 2a). Such developments were continued by various other researchers, enriched by new datasets such as the datasets by Mawdesley et al. [11] (Figure 2b) and Papaioanou and Suorineni [12] (Figure 2c), that used the nomograms to further investigate other properties in the open stope exploitation.
Each newly modified form of the original idea of the diagram was intended to address some of the weaknesses of this basic approach. Table 1 presents the most prevalent stability graph modifications that were observed in recent decades, according to Suorineni [13]. Special mention should be made of the works of Le Roux and Stacey [14] and Papaioannou and Suorineni [12]. More specifically, by following similar methodologies, they provided mathematical equations for the estimation of the ore’s external dilution rate, which focus on each of the examined open stopes’ surfaces, creating a very promising dilution-based stability graph approach.
Besides the above empirical design approaches, lately, the use of numerical codes has made possible the quick and reliable assessment of the stability conditions in underground excavations. As such, the estimation of an overbreak located in a stope’s hanging wall (HW), foot wall (FW) or crown area can be estimated. Consequently, the external dilution rate can be estimated, to an extent, as well.
In this paper, the latter approach was employed to assess the extent of the failure around the stope and to correlate the findings with the ones derived from the stability graphs. Several analyses were conducted with the use of the Rocscience RS2 finite elements code (Rocscience [30]) to produce a representative number of cases from the worst to best geotechnical conditions and from small to extensive mining stopes. With these parametric analyses, firstly, the stability condition, and secondly, the open stopes’ walls’ overbreak rates were evaluated and linked to the expected external dilution rates. It is noted that this research focused on external dilution analysis while internal dilution and ore loss were considered negligible during the numerical analysis process.
2. Materials and Methods
2.1. Introduction
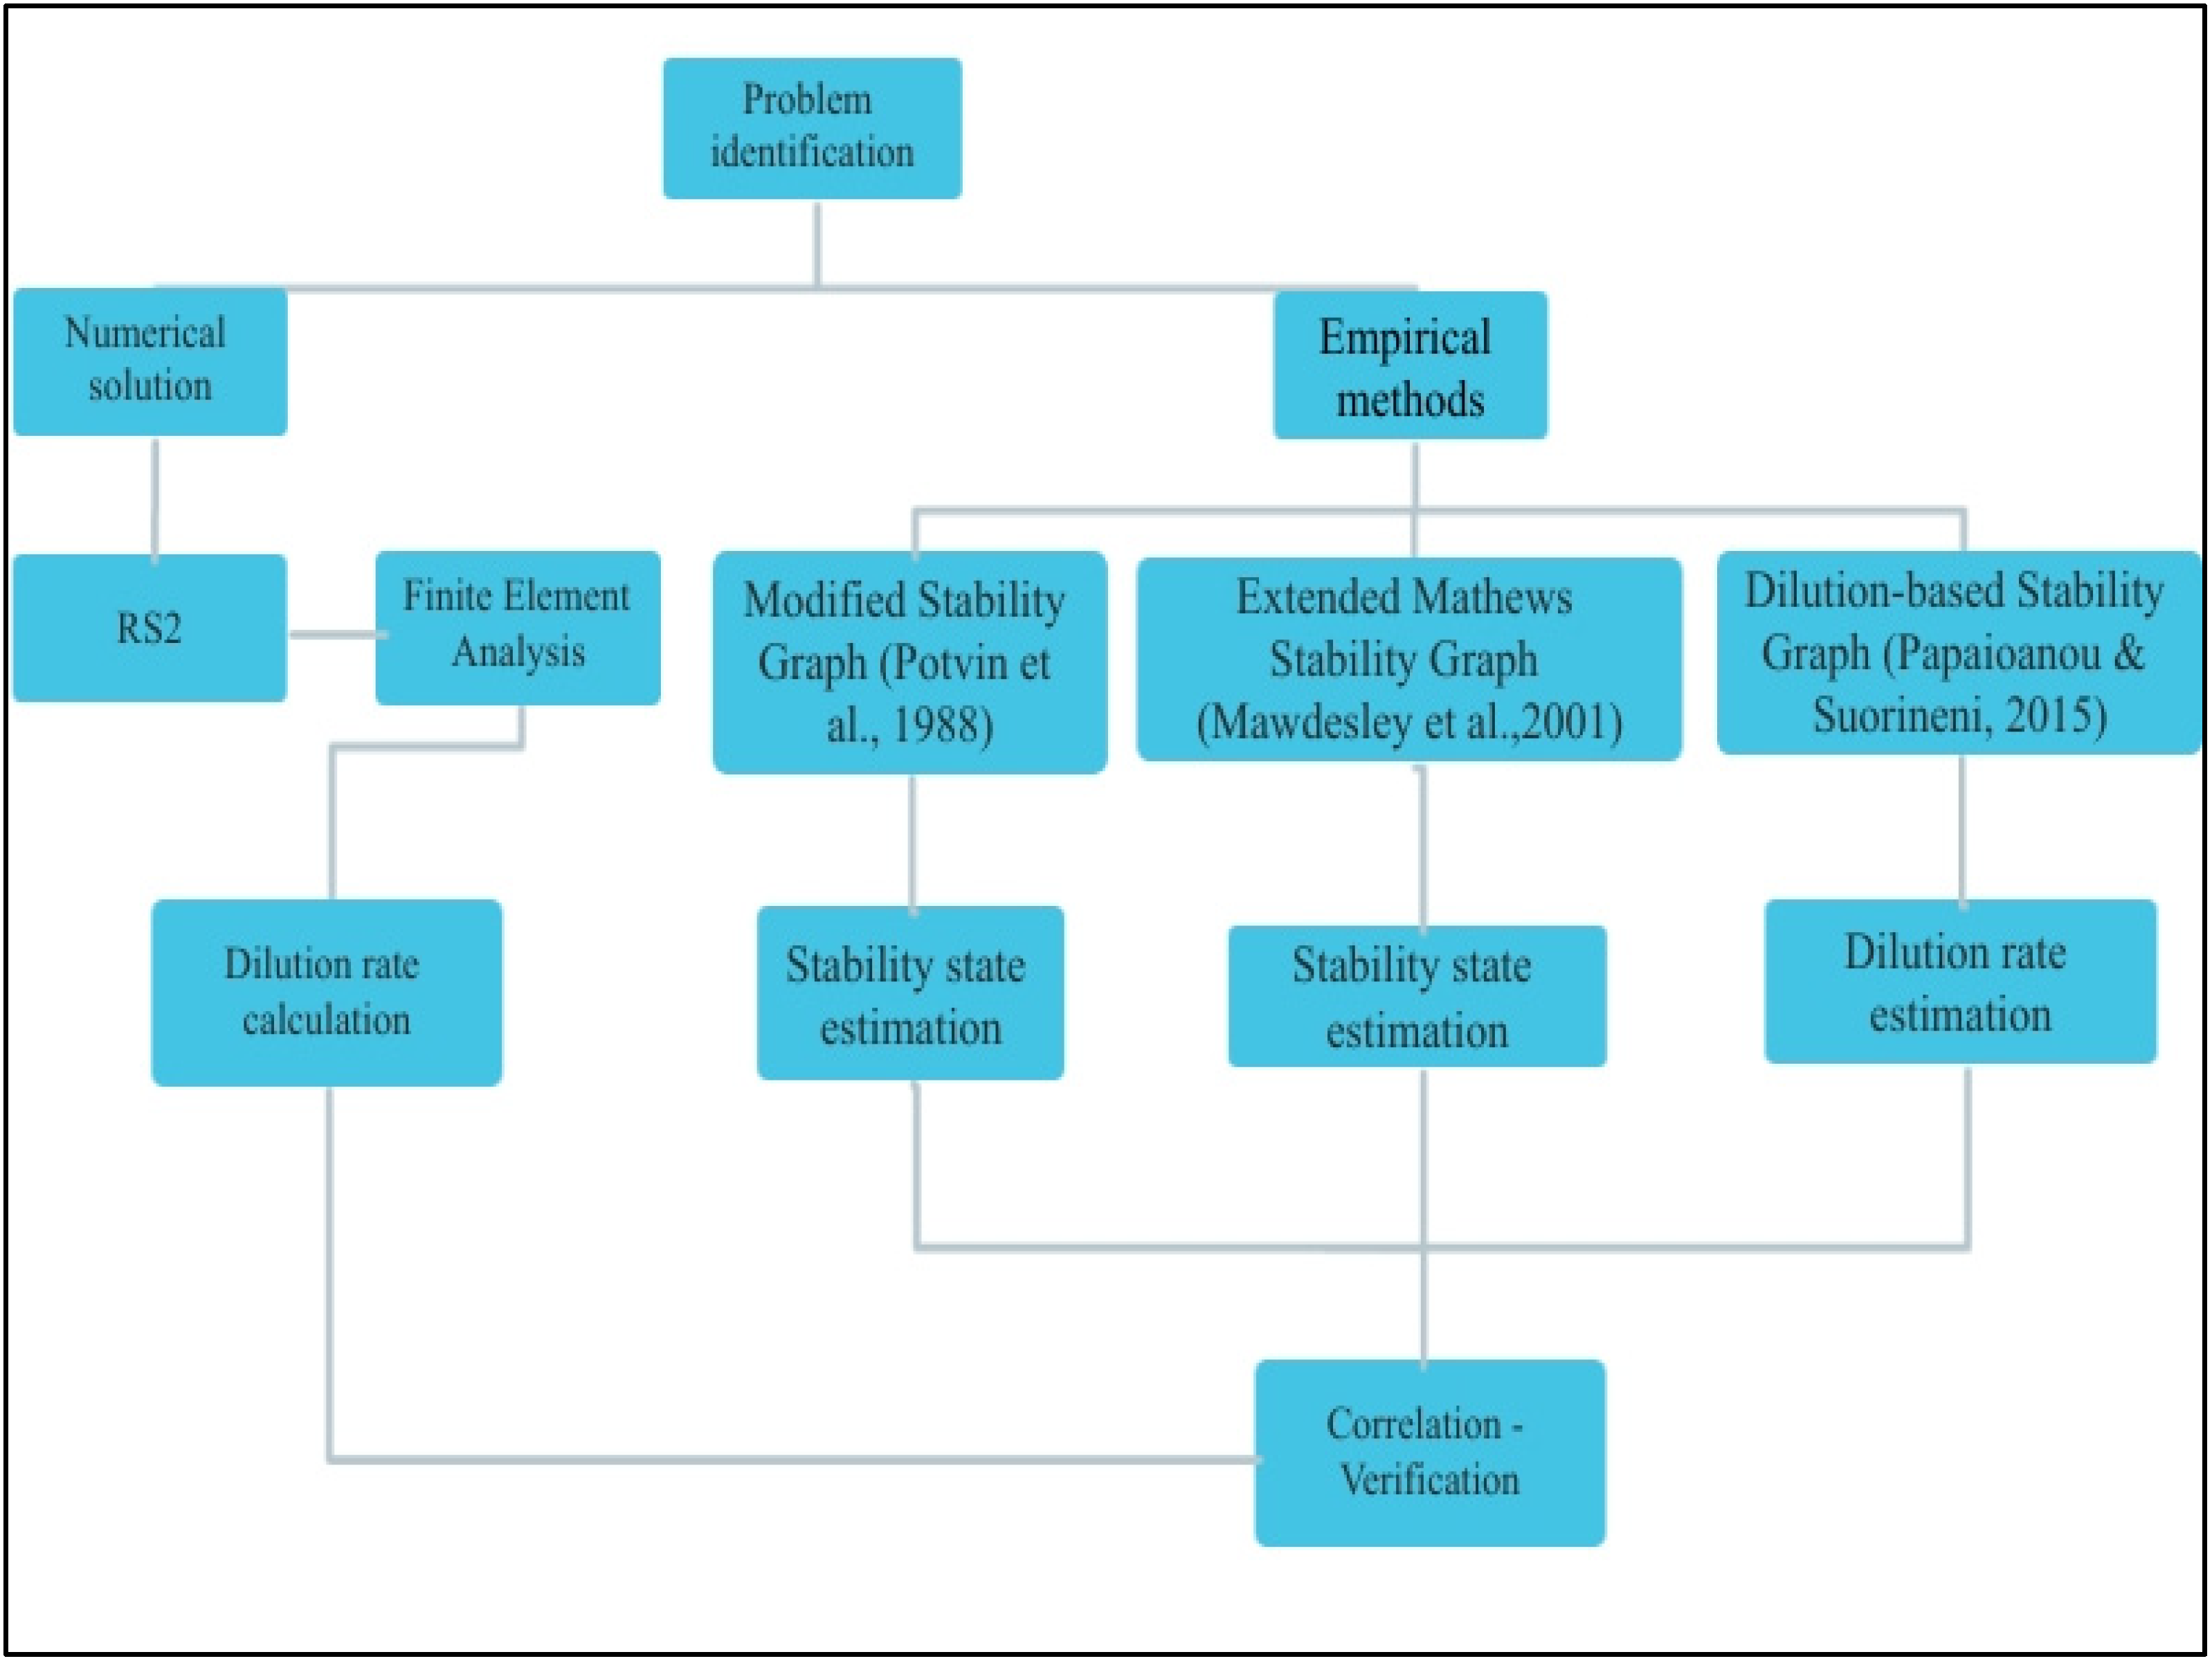
The purpose of the parametric analysis that was employed was to “decode” the mechanism of the phenomenon across a variety of modeled conditions. In this sense, the sensitivity of the stope stability and failure extent could be assessed as a response to the changes in the values of key parameters. Furthermore, a direct comparison between the stability graph’s estimation and the results obtained by the numerical models could also be performed for a wide range of opening dimensions and geotechnical conditions that are encountered in practice, in order to correlate their results and develop a critical linkage between them. With this in mind, this analysis provided the opportunity to transition from the results of the empirical approaches to the results of the numerical modeling (Figure 3).
RS2 is a Finite Elements Analysis software that provides the ability to perform 2D analyses in a short computation time. It is commonly used in geotechnical practice for the assessment of the mechanical behavior and stability conditions of mining and civil underground structures. Further, it allows the use of different types of design parameters by following the developments in the field of rock mechanics. Thus, in the context of the present paper, it was selected to be utilized, considering that the potential of this software could overcome the initial difficulties by making appropriate assumptions.
2.2. Parameters: Values and Assumptions
The open stopes’ stability conditions were simulated, and the ore’s external dilution was estimated in several cases where changes and differentiations in the values of key parameters were chosen. These parameters were the following, while the various changes analyzed are summarized in Table 2:
- Material properties of the surrounding rock;
- Stopes’ geometrical characteristics;
- Infill material between joints surfaces;
- Number of joint sets;
- Inclination of joint sets.
Based on all of the characteristics examined, 6 different properties’ categories (Table 3) and 18 models in total (one model for each of the examined joint inclinations), were developed and assessed in terms of stability performance and dilution characteristics.
It was very important to analyze the selection criteria and some basic properties for the above parameters. First of all, two different material types were examined, as the differentiation of the geomechanical characteristics greatly affects an open stope’s stability performance. The first material was gneiss, a very compact and competent formation with good geomechanical characteristics, while the second was marble formation with weaker properties and potentially greater instability problems. The rock mass properties included in the analysis were selected using a plethora of relevant empirical equations, reputable databases (e.g., RocProp) and logical assumptions. Thus, the basic material properties that were assigned to the rock mass of each material type are given in Table 4.
Regarding the geometrical characteristics of the stope, namely two main geometries were examined, as shown in Table 5. Their difference lays in the overall size of the opening, inflicting different stress conditions in terms of stress magnitude and distribution to the surrounding rock mass. Further, given the 2D character of the finite elements analysis, an assumption was made that the strike length of the openings was much larger than its height and width (e.g., of the order of 1000 m), reflecting the infinite nature of the plane strain analysis. This may be considered as the worst-case scenario for the examined surfaces’ hydraulic radius values. However, it is a necessary condition for a successful correlation between the two types of analysis.
In addition, the number of the joint sets of the rock mass has a large effect on the open stope’s stability condition. The distribution of discontinuities on the field and the interaction of the different joint sets can significantly affect the examined field’s stress distribution, leading to potential large-scale instability problems. The second examined category of this parameter included one basic joint set and several shorter discontinuities with a random layout. The way this network was approached was considered to be highly innovative. More specifically, the random position and direction joints were approached through the application of a low-density Voronoi joint network. The formation of the combination of this system with the basic joint set visually presented the morphology of the desired random joints (Figure 4). Regarding the distance between adjacent joints, a typical value of 1.5 m was assigned.
Finally, the presence of an infill material between the discontinuities’ surfaces, as well as the infill material’s properties, greatly affected the overall stability and failure mode of the open stope. As such it was investigated using models that included such infillings, contrary to plain models that lacked any such features.
2.3. Methodology of Overbreak Estimation
The overbreak estimation, a calculation of an open stope’s surface overbreak and, concurrently, the ore’s external dilution rate, was accomplished with the RS2 software output data. The software allowed for the prediction of the zones of the rock mass outside the stope’s boundaries that could potentially fail in tension and/or in shear (i.e., “Yielded Elements” distribution). The overbroken areas outside the stope’s boundaries were estimated considering the “Yielded Elements” representation with the rock mass’s relaxation zones (i.e., the zones with negative minor principal stress distributions, where σ3 ≤ 0) and the principal examined surface’s failure mechanism (gravity fall, sliding or slabbing). Furthermore, due to the 2D nature of the analysis, it was considered that the measured responses remained constant along the third dimension. Supposing that ore and barren material had the same specific weight, the ore’s external dilution rate of an examined open stope’s surface was calculated through the equation:
Overbreak rate = Dilution rate = [100 × (Area of the overbroken zone)]/(Area of the stope’s front surface)
The rock mass areas that were expected to fail outside of the planned open stopes’ boundaries were calculated through the use of the SketchUp software, considering the above-mentioned criteria. The use of SketchUp software is supplementary and it is made in order to quantifiably measure the overbroken zones using images from the output data of the finite element analysis. This quantification is performed through area measurement. It is noted that, for this purpose, any other design software could be used, e.g., AutoCAD. An example of this area measurement process is presented in Figure 5, where yielded regions have been combined with “σ3 ≤ 0” regions to mark the overbroken areas around the stope.
3. Results
In the context of this original research report, it is not possible to exhibit the full list of the final results. Thus, some important approaches which arose through the processing of the output data are presented in this section.
The survey data of case study #12 were selected to be presented below. In Figure 6, the “Yielded Elements” distribution is displayed for this simulation model. Furthermore, the basic stability parameters and the results of the two types of analyses are summarized in Table 6.
In Figure 7, the results of the analysis through the examined empirical stability graphs (Figure 7a,b) are shown for the selected case study (#12).
Using the output data and following a similar methodology as Le Roux and Stacey [14], a chart that correlates the evaluated ore’s external dilution rates and the HR/N′ ratio was created for each of the examined open stope’s surfaces (crown, left sidewall, right sidewall). These charts (Figure 8) include only the examined cases on which the calculated dilution rates were greater than zero. Three equations for the estimation of the ore’s external dilution rates were formulated by a linear regression of the datasets of each chart, as given below:
Crown: (%) Ore Dilution = 0.6 × (HR/N′) + 1.1127
Left Sidewall: (%) Ore Dilution = 10.339 × (HR/N′) − 0.9381
Right Sidewall: (%) Ore Dilution = 8.5819 × (HR/N′) − 0.2891
The model’s performance was validated against the findings and empirical proposals of Le Roux and Stacey [14] and the results are presented for the values of the HR/N′ ratio between 0 and 3, in Figure 9. As can be seen, there was a good correlation between the cumulative dilution line and the Le Roux and Stacey line, especially for larger values of the HR/N′ ratio, with an upper limit HR/N′ value, for the current analysis, equal to 3. Provided that the crown’s dilution issues that were experienced in the analysis are resolved, the correlation of these two approaches (Le Roux and Stacey line and cumulative dilution line) could be further improved.
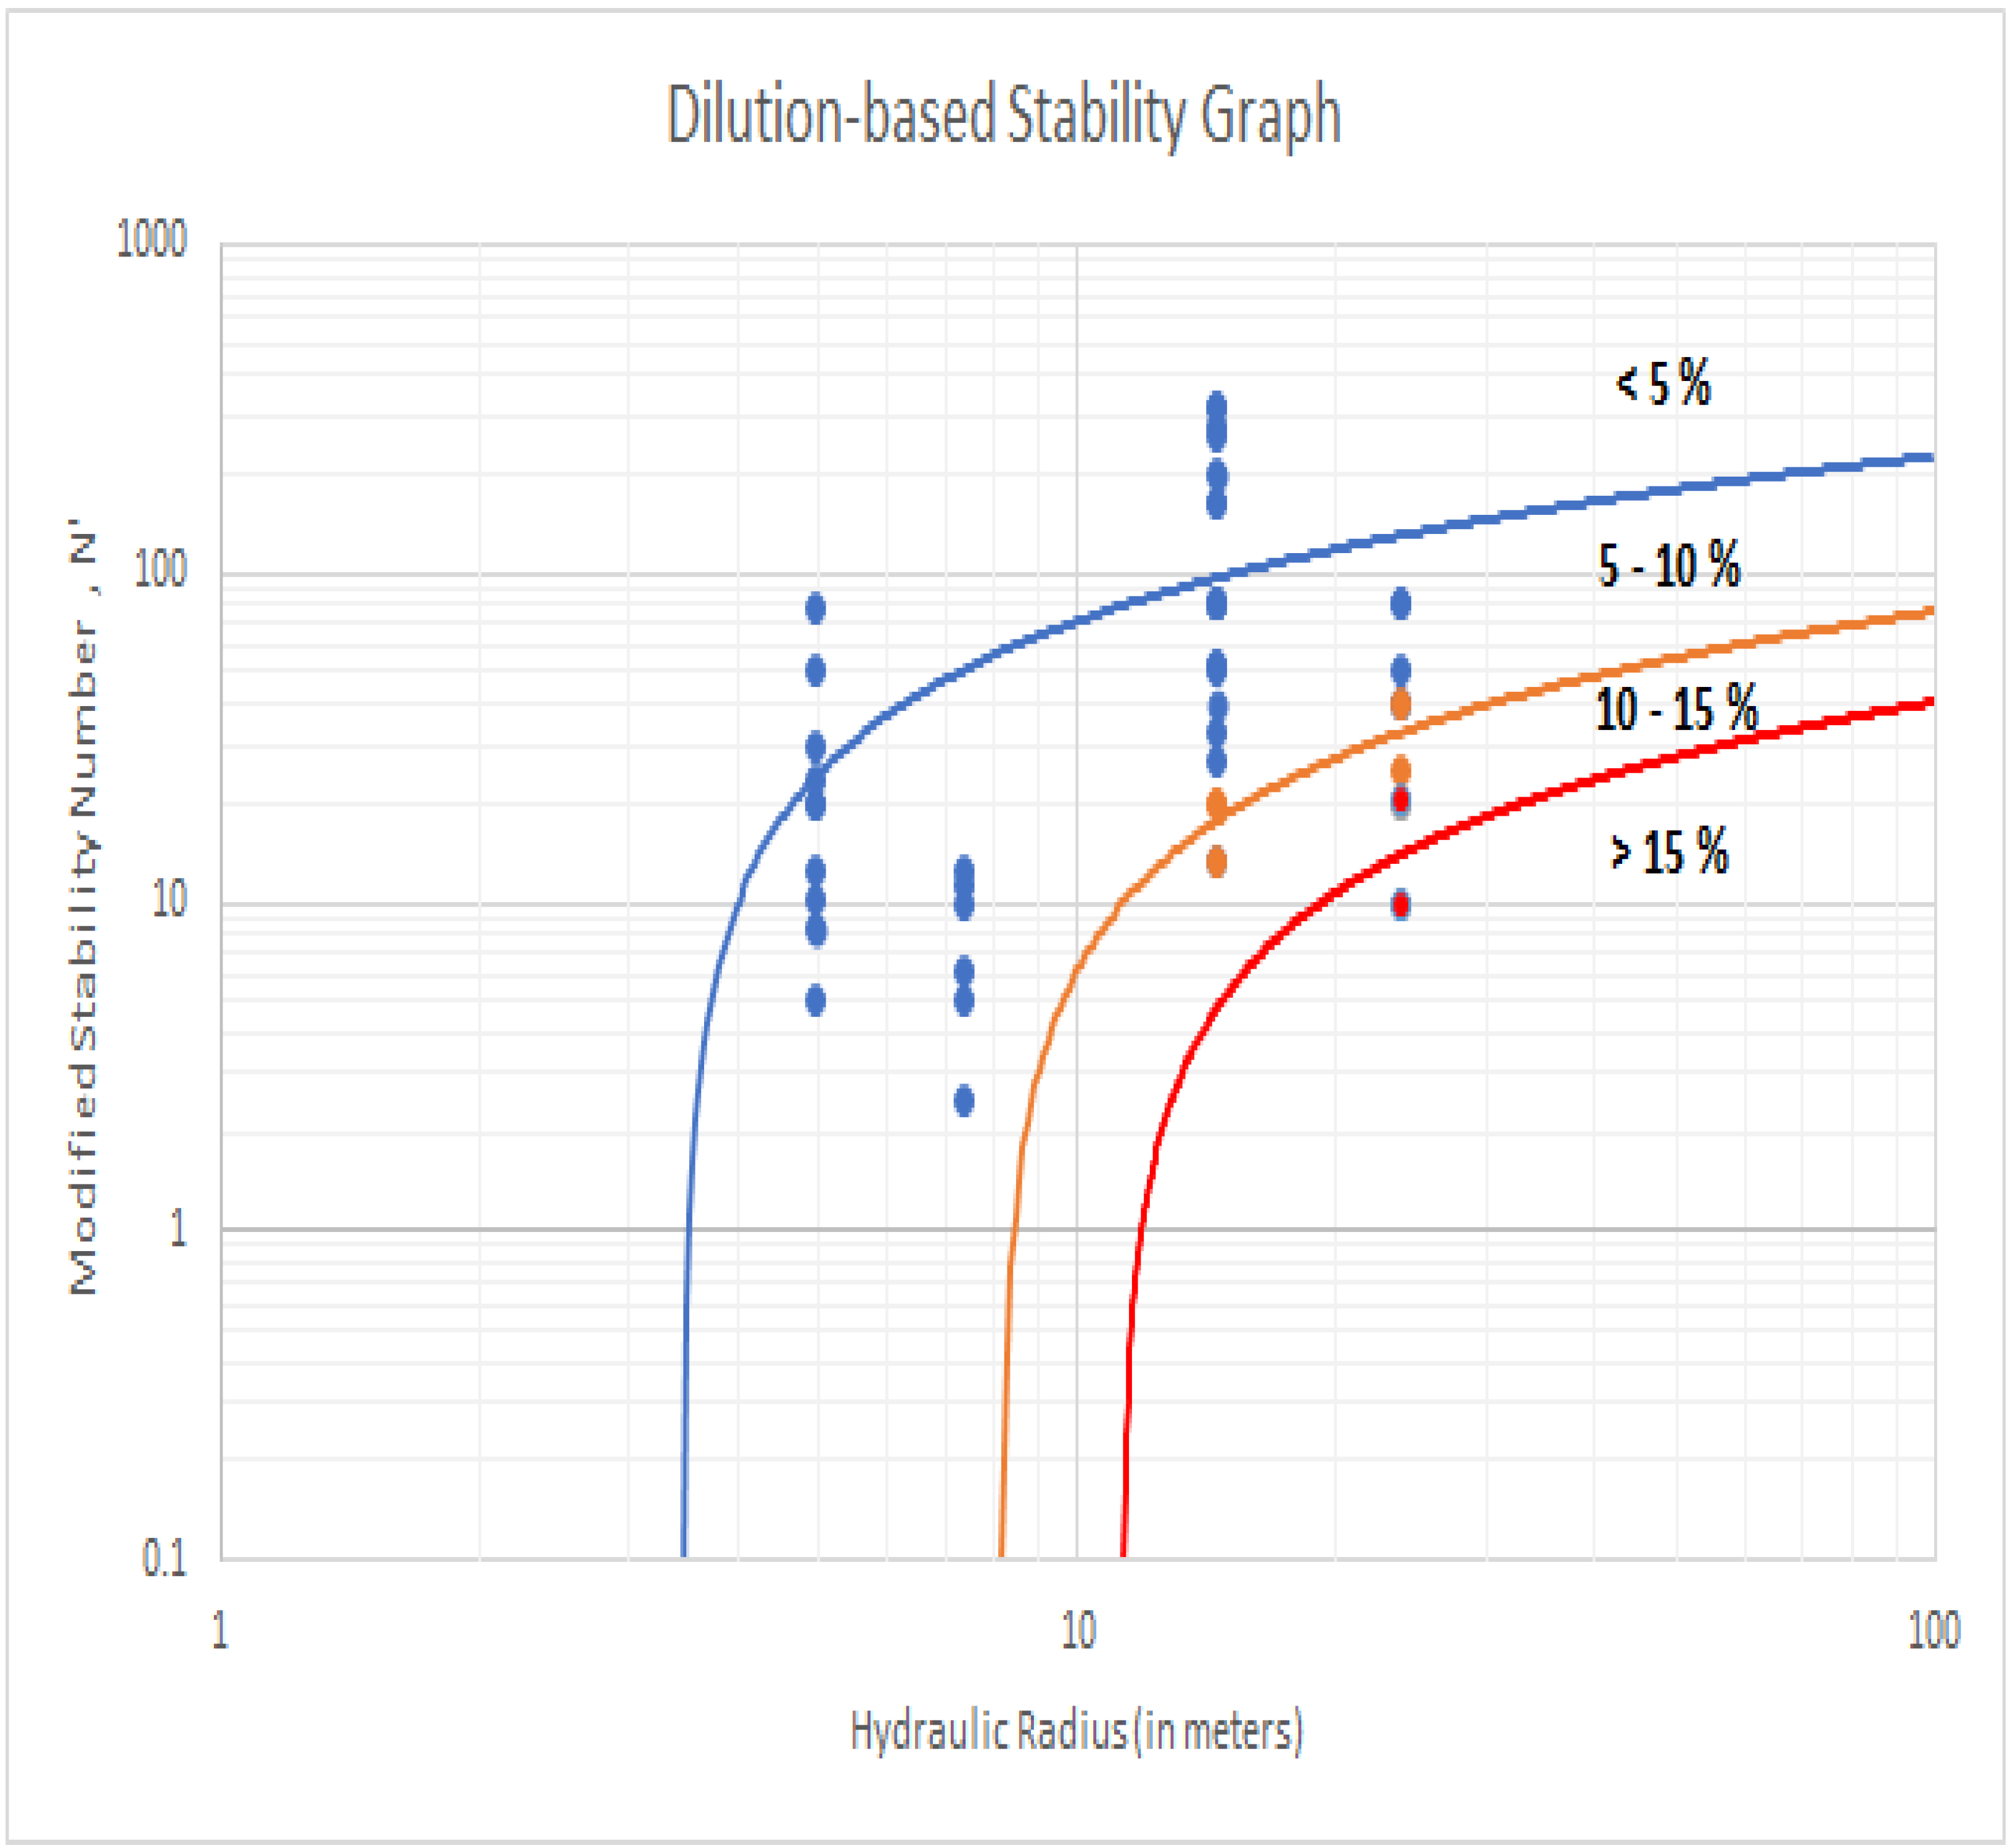
Furthermore, using the output data from the numerical analysis and following a similar methodology as Papaioanou and Suorineni [12], a dilution-based stability graph approach was formed (Figure 10) for the examined cases. This special SG form makes it possible to estimate a potential ore’s external dilution rate caused by an open stope’s surface overbreak by using basic stability parameters (N′ and HR). The trend lines on the chart were chosen to be logarithmic, providing a better fit with the scatter of the examined points of the chart. The provided diagram was divided into four dilution-percentage zones. This segregation was achieved through the use of three boundary lines. The first (Line 1 shown in blue in Figure 10) separates the points of the database belonging to the group with a dilution rate <5%, the second (Line 2 shown in orange in Figure 10) corresponds to a 10% dilution rate and the third (Line 3 shown in red in Figure 10) corresponds to a dilution rate of 15%. The equations of the logarithmic boundary lines are:
Line 1 (5%): N′ = 67.58 × ln(HR) − 83.87
Line 2 (10%): N′ = 30.58 × ln(HR) − 64.12
Line 3 (15%): N′ = 18.6 × ln(HR) − 45
As may easily be understood, this stability graph was created from a limited number of cases. Therefore, the database of the present research should be enlarged with additional case studies in order to make this approach universally applicable.
4. Discussion
During the performance of the parametric analysis, a variety of empirical property calculation equations were used, as well as data from valid and reliable databases. In addition, it was necessary to obtain assumptions for the completion of the simulation models. Basic assumptions were found during the quantification of the geomechanical characteristics of the geological formations and also in the definition of the design parameters of the excavation. Finally, the processing of the output data yielded important conclusions about the degree of correlation between the empirical and numerical analyses, while some empirical approaches were constructed to evaluate the expected dilution rate.
One of the most important virtues of the empirical formulas and diagrams arising from the mentioned research is their ability to have an almost instant and reliable result. This is a preliminary assessment of the examined stope’s performance. The combined use of these formulas and diagrams could contribute to the optimization of the design parameters of the excavation area, always taking into account the characteristics of the mineral deposit and its cut-off grade.
Optimizing the design features of the open stope leads to significant benefits for the entire mining process. First, reducing the dilution rate of the ore has as a direct benefit the increase of the economic value of the produced material, with a simultaneous reduction of the production process cost. In addition, it reduces the cost for the removal of sterile material from the useful material. This procedure includes tasks such as the secondary crushing and milling, as well as the commitment of mechanical equipment to convey the material. Finally, the reduction of the ore impurities indirectly alleviates the operating costs of the production process, due to the limitation of the required support measures for the containment of failure.
It has been found that the presented analysis yielded very satisfactory results for the two lateral surfaces of the open stoping area. Furthermore, their equations for the preliminary estimation of the ore’s external dilution showed a good fit and correlation with the scatter of the examined points of the charts. On the other hand, the results of the crown’s analysis presented a low correlation with respect to the values estimated from the empirical approaches. However, this could be justified to some extent, due to the principal failure mechanism of this surface (mostly gravity fall) and the continuum nature of the numerical analysis, as well. In terms of the overall instability and dilution potential, the obtained results are directly comparable with the ones proposed by other researchers, especially for the upper values of the HR/N′ ratio.
Additionally, using 2D continuous-media analysis software to simulate a discontinuous-medium problem was risky but was considered to be quite a successful approach. However, the use of 3D discrete-element analysis software is very likely to lead to an equally satisfactory simulation.
5. Conclusions
Empirical models incorporate the lessons learned from a number of past cases and historic records. The stability graph models that have been presented by various researchers are broadly considered to have fairly accurate estimations for stability conditions of open stope mining. Nevertheless, the use of numerical modelling can be further used to depict the stability conditions with great accuracy. This could allow for quantified assessments in cases beyond the exact past examples and could be beneficial in challenging conditions, further extending the applicability of such approaches. This is the very aim of the paper. In addition, the selection of the optimal rock mass failure criterion is critical. In the context of the present research, it was decided that the representation of the points that appear to fail on tension or shear around the planned excavation boundaries would be used. According to the RS2 software’s analysis, this representation is given through the “Yielded Elements” contour. However, several possible failure criteria were examined in the early stages of the investigation.
The simulation of different geomechanical conditions in the examined area caused different stability conditions in the excavation surfaces. This pluralized the output data and eventually led to a wider range of stability-parameter values.
The final approaches for estimating the dilution rates of the ore are considered to be particularly important. These were created through the careful statistical processing of the output data and could prove to be useful tools for the optimization of an open stope’s design parameters, based on the instability-reduction issues.
Nevertheless, it is necessary to carry out a broader verification analysis with the utilization of 3D numerical codes while also having more direct and explicit in situ field data. This could further calibrate and fine tune the proposed models and come up with a more accurate assessment of the ore’s expected external dilution rates.
Author Contributions
Conceptualization, A.D. and A.B.; software, A.D.; validation, A.D., A.B. and P.N.; writing—original draft preparation, A.D., A.B. and P.N.; writing—review and editing, A.D., A.B. and P.N. All authors have read and agreed to the published version of the manuscript.
Funding
This research received no external funding.
Conflicts of Interest
The authors declare no conflict of interest.
References
- Villaescusa, E. Geotechnical Design for Dilution Control in Underground Mining. at R. K. Singhal, Mine Planning and Equipment Selection Rotterdam: Balkema. 1998, p. 141. Available online: https://www.researchgate.net/profile/Ernesto-Villaescusa-2/publication/237618005_Geotechnical_design_for_dilution_control_in_underground_mining/links/549ca1440cf2d6581ab4869c/Geotechnical-design-for-dilution-control-in-underground-mining.pdf (accessed on 23 June 2021).
- Pakalnis, R. Empirical Stope Design at Runan Mine. Ph.D. Thesis, University of British Columbia, Vancouver, BC, Canada, 1986. [Google Scholar]
- Jang, H.D. Unplanned Dilution and Ore-Loss Optimisation in Underground Mines via Cooperative Neuro-Fuzzy Network. Ph.D. Thesis, Western Australia School of Mines, Perth, Australia, 2014. [Google Scholar]
- Planeta, S.; Bourgoin, C. The impact of rock dilution on underground mining. In Proceedings of the 92nd Canadian Institute of Mining Anual General Meeting, Ottawa, ON, Canada, 6–10 May 1990. [Google Scholar]
- Stewart, P.; Trueman, R. Strategies for Minimising and Predicting Dilution in Narrow Vein Mines—The Narrow Vein Dilution Method. In Proceedings of the Narrow Vein Mining Conference, Ballarat, VIC, Canada, 14–15 October 2008. [Google Scholar]
- Suorineni, T. A Critical Review of the Stability Graph Method for Open Stope Design, Conference Paper; MIRARCO/Geomechanics Research Centre (GRC), Laurentian University: Sudbury, ON, Canada, 2012; Available online: https://www.researchgate.net/profile/Fidelis-Suorineni/publication/271191453_A_Critical_Review_of_the_Stability_Graph_Method_for_Open_Stope_Design/links/54bf84ce0cf2f6bf4e04f678/A-Critical-Review-of-the-Stability-Graph-Method-for-Open-Stope-Design.pdf (accessed on 23 June 2021).
- Barton, N.; Lien, R.; Lunde, J. Engineering classification of rock masses for the design of tunnel support. Rock Mech. 1974, 6, 189–236. [Google Scholar] [CrossRef]
- Mathews, K.E.; Hoek, E.; Wylle, D.C.; Stewart, S.B.V. Prediction of Stable Excavation Spans for Mining at Depths below 1000 meters in Hard Rock; Golder Associates: Vancouver, BC, Canada, 1981; pp. 36–110. [Google Scholar]
- Nickson, S.D. Cable Support Guidelines for Underground Hard Rock Mine Operations. Master’s Thesis, University of British Columbia, Vancouver, BC, Canada, 1992. Unpublished work. [Google Scholar]
- Potvin, Y.; Hudyma, M.; Miller, H. The Stability Graph Method for Open Stope Design; University of British Columbia: Vancouver, BC, Canada, 1988. [Google Scholar]
- Mawdesley, C.; Trueman, R.; Whiten, W. Extending the Mathews Stability Graph for Open-Stope Design; EBSCO Publishing: Ipswich, MA, USA, 2001. [Google Scholar]
- Papaioanou, A.; Suorineni, F. Dilution-Based Stability Graph for Open Stope Design; Research Gate: Berlin, Germany, 2015. [Google Scholar]
- Suorineni, F.T. The stability graph after three decades in use:experiences and the way forward. Int. J. Min. Reclam. Environ. 2010, 24, 307–339. [Google Scholar] [CrossRef]
- Le Roux, P.; Stacey, T. Value creation in a mine operating with open stoping mining methods. J. South Afr. Inst. Min. Metall. 2017, 117, 133–142. [Google Scholar] [CrossRef] [Green Version]
- Potvin, Y.; Milne, D. Empirical cable bolt support design. In Proceedings of the International Symposium on Rock Mechanics, Sudbury, ON, Canada, 16–19 June 1992. [Google Scholar]
- Scoble, M.J.; Moss, A. Dilution in underground bulk mining: Implications for production management, mineral resource evaluation, II. Geol. Soc. Sp. Publ. 1994, 79, 95–108. [Google Scholar] [CrossRef]
- Stewart, S.B.V.; Forsyth, W.W. The Mathews method for open stope design. CIM Bull. 1995, 88, 45–53. [Google Scholar]
- Hadjigeorgiou, J.; Leclaire, J.; Potvin, Y.Y. An update of the stability graph method of open stope design. In Proceedings of the 97th Annual General Meeting; Canadian Institute of Mining, Metallurgy and Petroleum: Halifax, NS, Canada, 1995; pp. 154–161. [Google Scholar]
- Milne, D.M.; Pakalnis, R.C.; Lunder, P.J. Approach to the quantification of hanging-wall behaviour. Trans. Inst. Min. Metall. 1996, 105, A69–A74. [Google Scholar]
- Clark, L.M.; Pakalnis, R.C. An empirical approach for estimating unplanned dilutionfrom open stope hangingwalls and footwalls. In Proceedings of the 99th Annual General Meeting; [CD-ROM]; Canadian Institute of Mining, Metallurgy and Petroleum: Vancouver, BC, Canada, 1997. [Google Scholar]
- Germain, P.; Hadjigeorgiou, J. Influence of stope geometry on mining performance. In Proceedings of the 100th Annual General Meeting; [CD-ROM]; Canadian Institute of Mining, Metallurgy and Petroleum: Vancouver, BC, Canada, 1998. [Google Scholar]
- Suorineni, F.T. Effects of Faults and Stress on Open Stope Design. Ph.D. Thesis, University of Waterloo, Waterloo, ON, Canada, 1998. [Google Scholar]
- Suorineni, F.T.; Tannant, D.D.; Kaiser, P.K. Fault factor for the stability graph method of open-stope design. Trans. Inst. Min. Metall. Sect. A. Mining Ind. 1999, 108, A92–A104. [Google Scholar]
- Diederichs, M.S.; Kaiser, P.K. Tensile strength and abutment relaxation as failure control mechanisms in underground excavations. Int. J. Rock Mech. Min. Sci. 1999, 36, 69–96. [Google Scholar] [CrossRef]
- Trueman, R.; Mikula, P.; Mawdesley, C.; Haries, N. Experience in Australiawith the application of the Mathews method of open stope design. CIM Bull. 2000, 93, 162–167. [Google Scholar]
- Trueman, R.; Mawdesley, C. Predicting cave initiation and propagation. CIM Bull. 2003, 96, 54–59. [Google Scholar]
- Suorineni, F.T.; Henning, J.G.; Kaiser, P.K. Narrow-vein mining experiences at Ashanti: Case study. In Proceedings of the International National Symposium, Mining Techniques of Narrow-Vein Deposits; Canadian Institute of Mining, Metallurgy and Petroleum: Val’Dor, QC, Canada, 2001. [Google Scholar]
- Bewick, R.; Kaiser, P.K. Numerical assessment of factor B in Mathews’ method for open stope design. In Proceedings of the 3rd CAN-US Rock Mechanics Symposium; [CD-ROM]; Canadian Rock Mechanics Association: Toronto, ON, Canada, 2009. [Google Scholar]
- Mitri, H.S.; Hughes, R.; Zhang, Y. New Rock Stress Factor for the Stability Graph Method. Int. J. Rock Mech. Min. Sci. 2011, 48, 141–145. [Google Scholar] [CrossRef]
- Rocscience RS2-2D Geotechnical Finite Element Analysis. Toronto, ON, Canada. 2020. Available online: https://www.rocscience.com/software/rs2 (accessed on 23 June 2021).
Figure 2.
(a) Modified stability graph by Potvin [10]. (b) Extended Mathews’ stability graph by Mawdesley et al. [11]. (c) Dilution-based stability graph by Papaioannou and Suorineni [12].
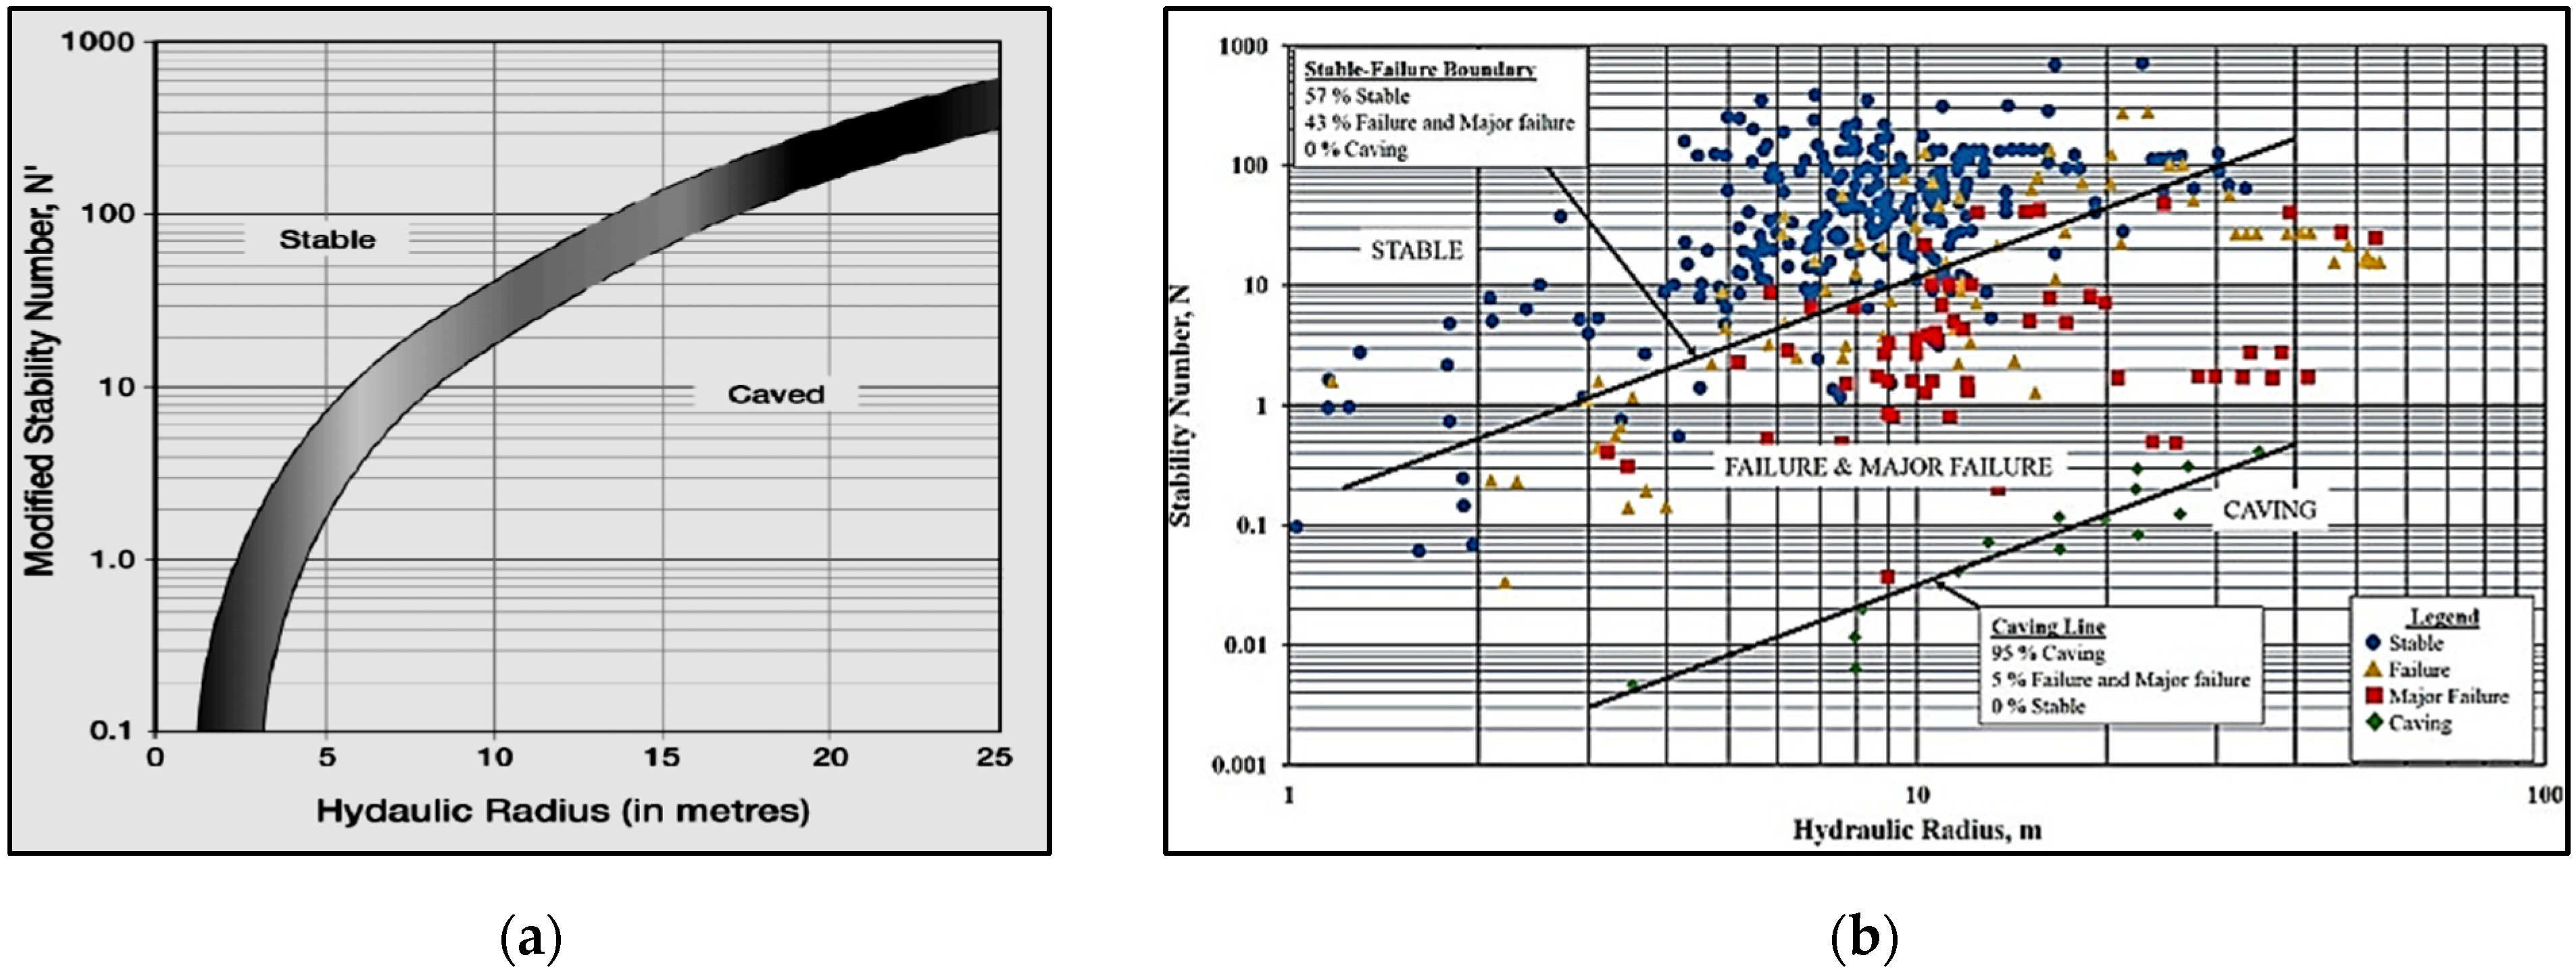

Figure 3.
Flow chart of the parametric analysis.

Figure 4.
Portion of the numerical model in RS2, illustrating the second examined case of the “joint set number” parameter.
Figure 4.
Portion of the numerical model in RS2, illustrating the second examined case of the “joint set number” parameter.
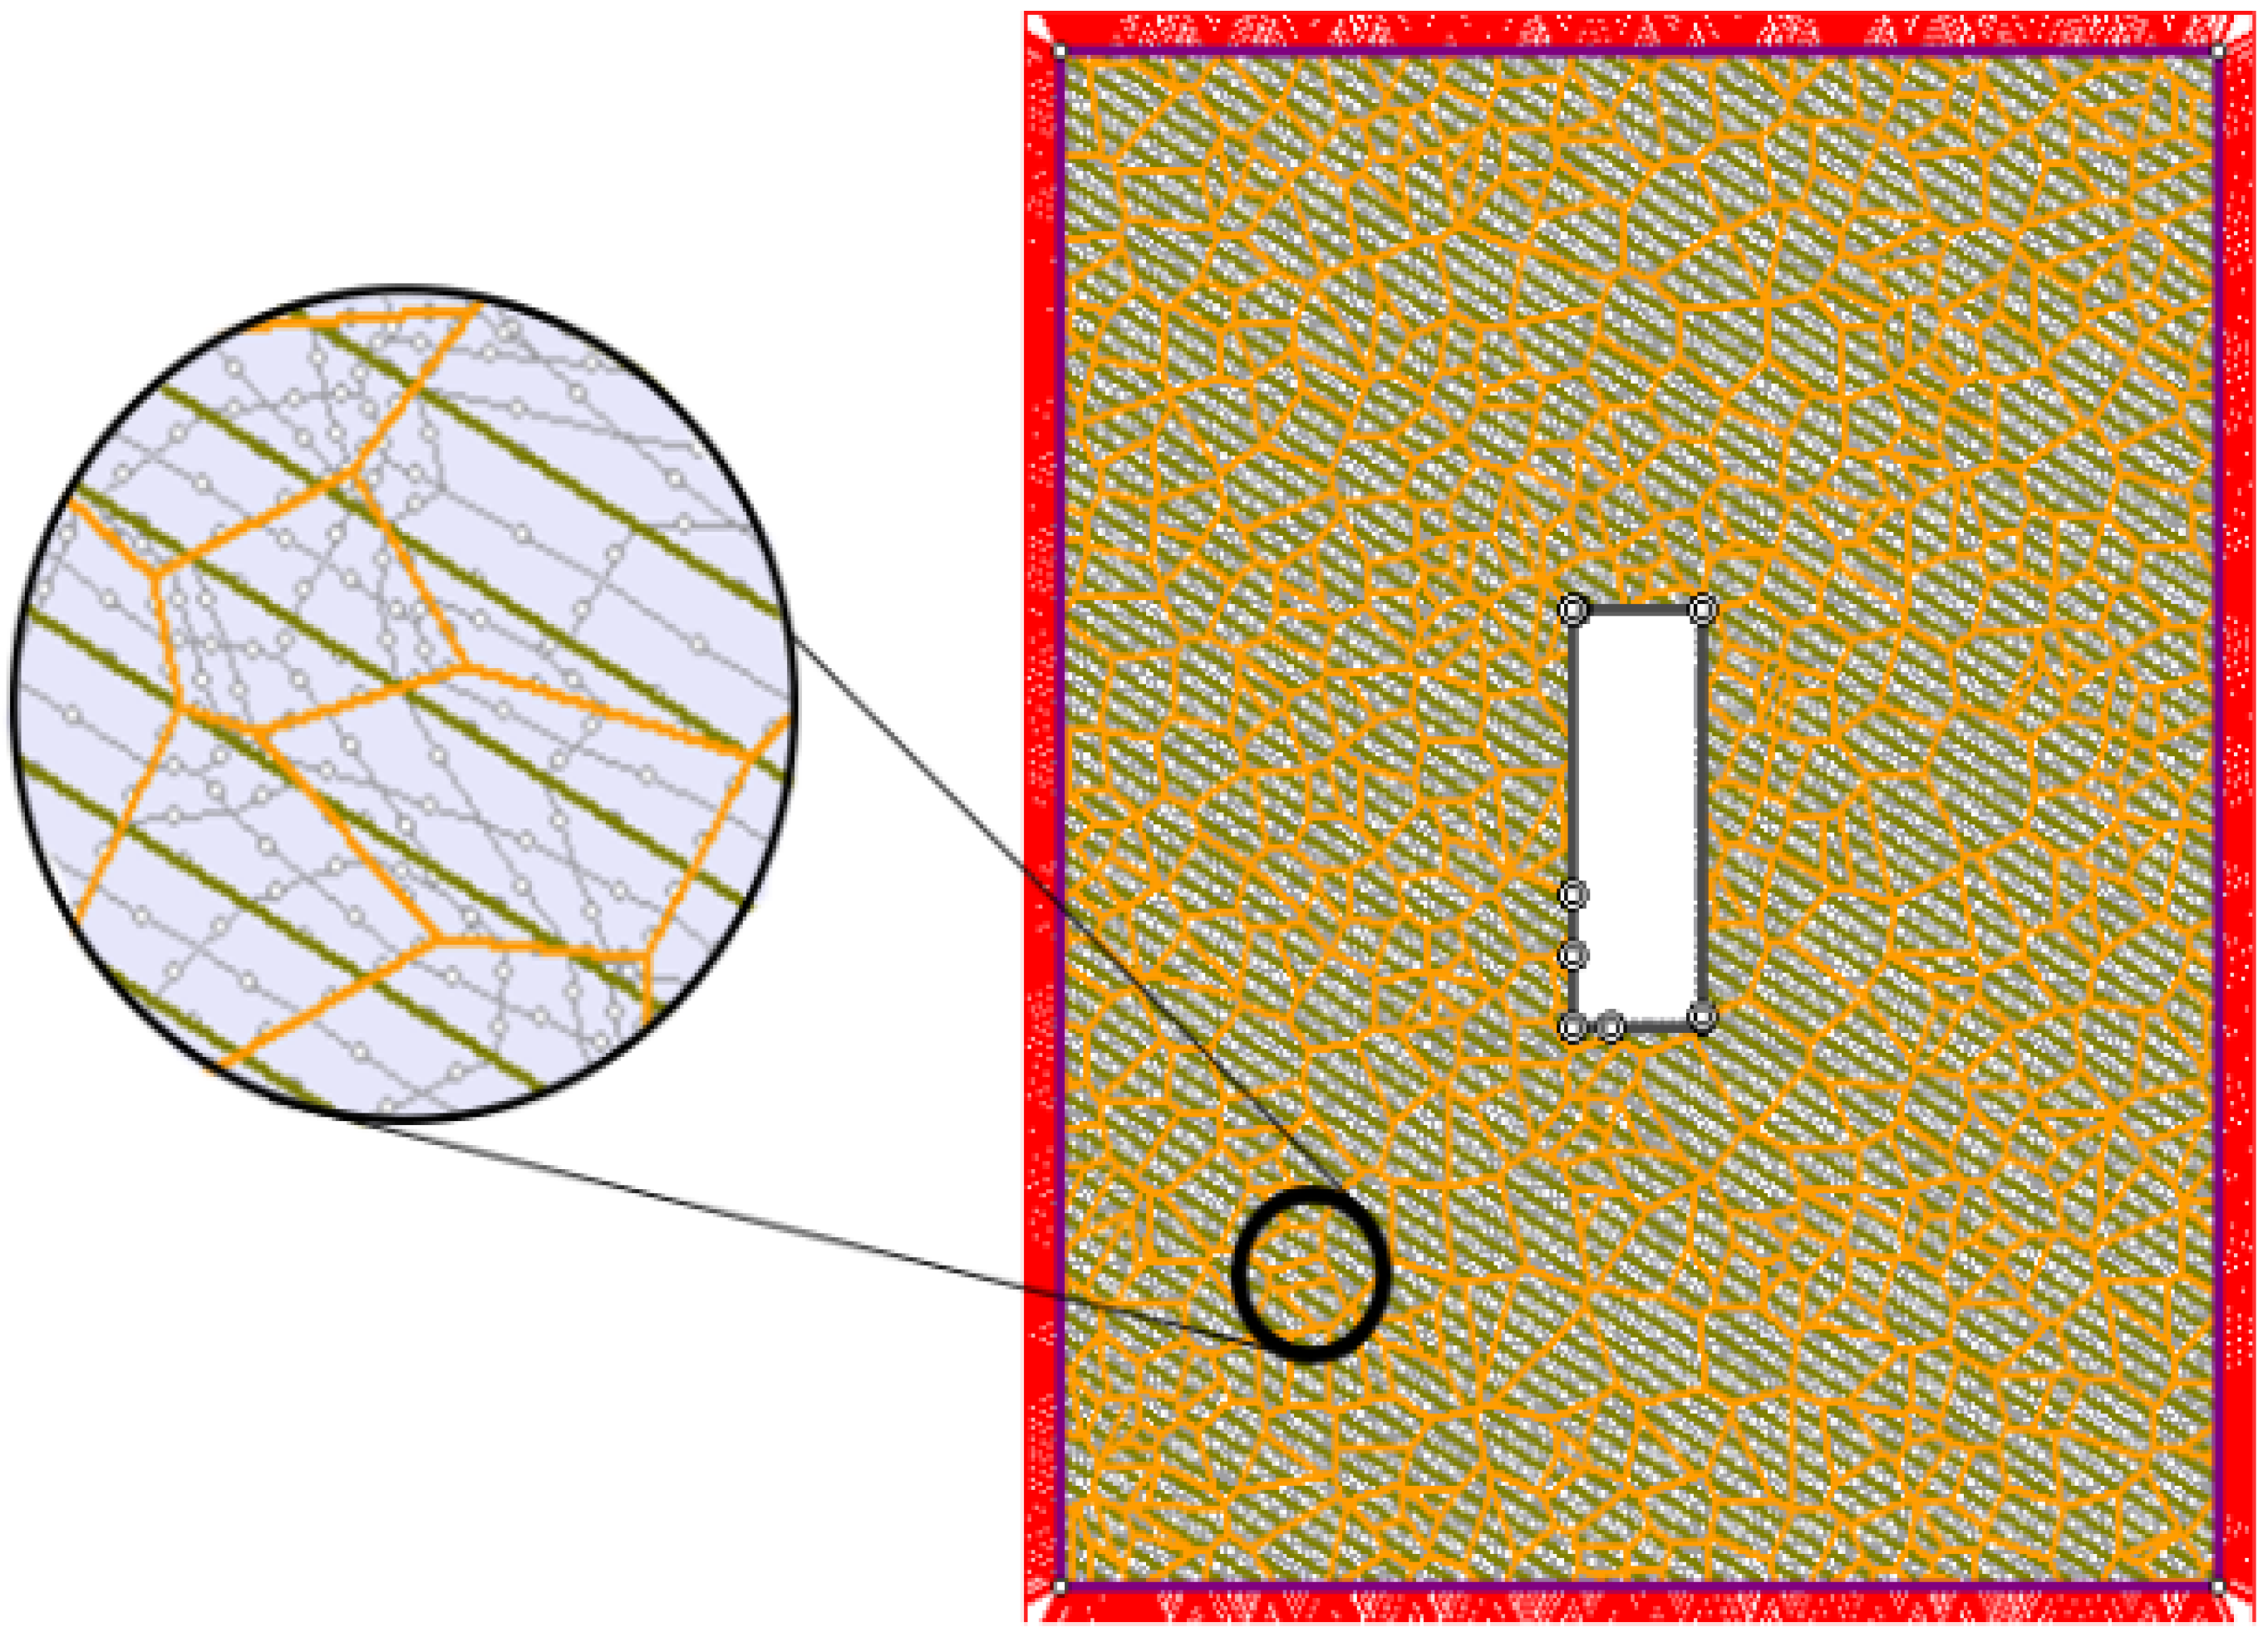
Figure 5.
Overbroken zone measurement using the SketchUp software.

Figure 6.
Case study #12: “Yielded Elements” distribution.
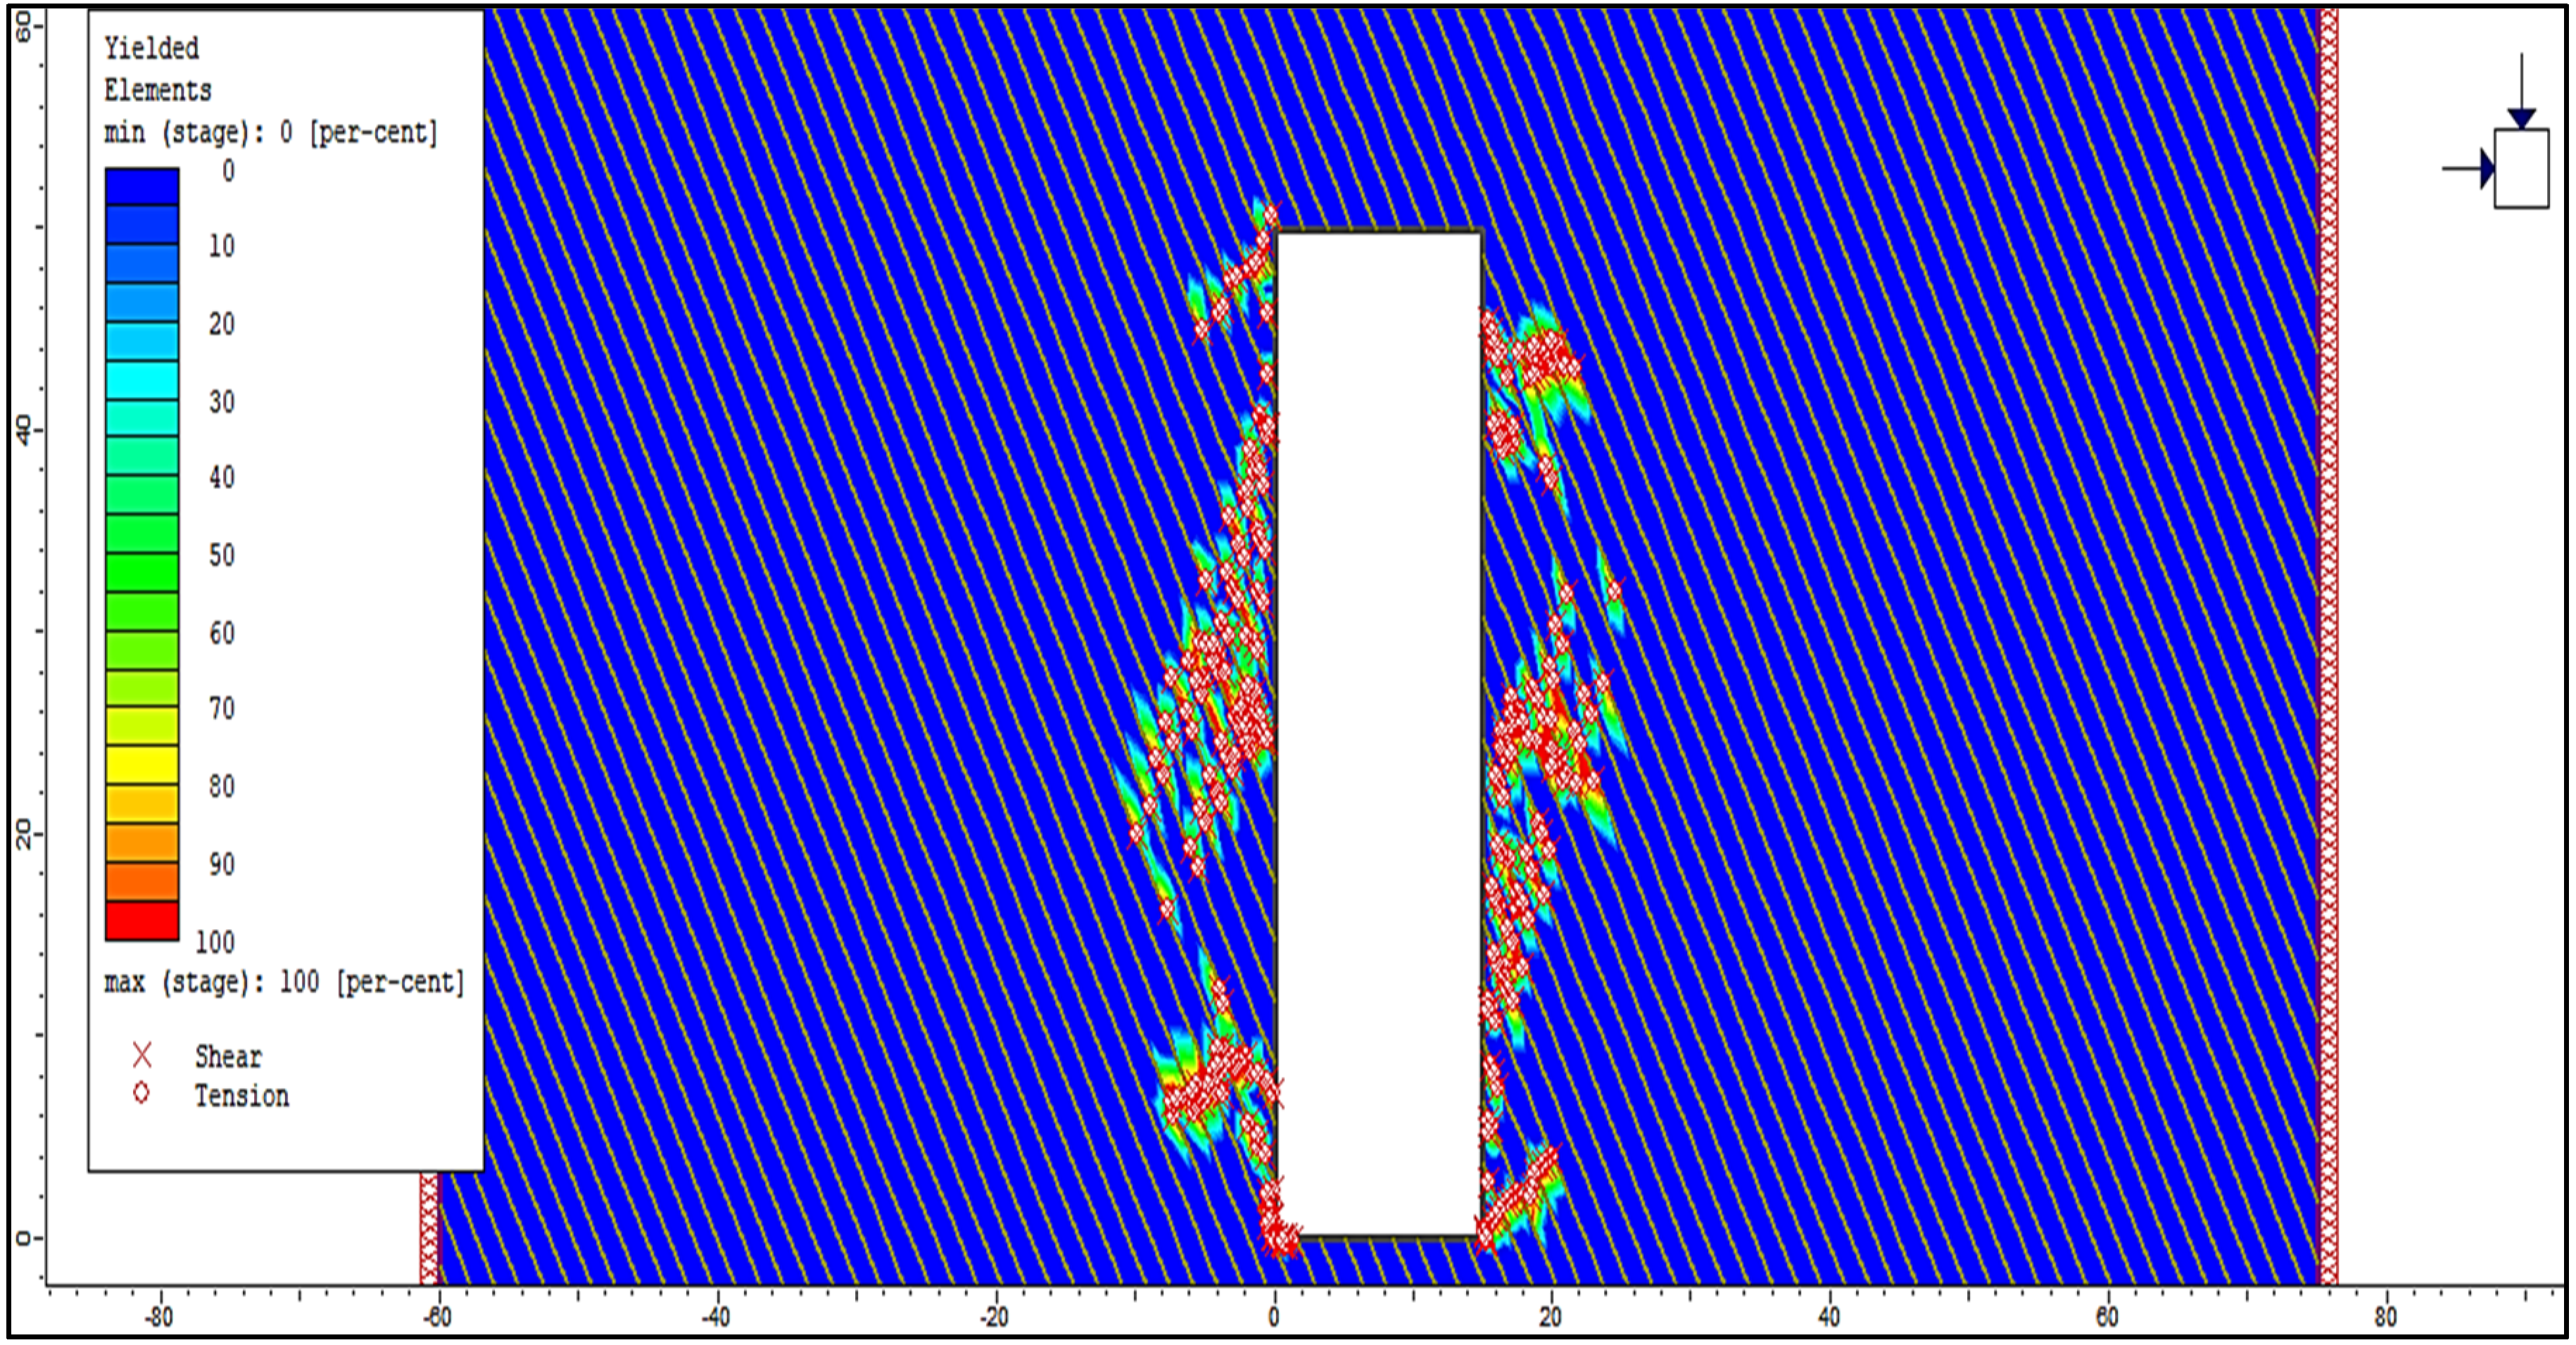
Figure 7.
Case study #12: (a) Modified stability graph [10] (b) Dilution-based stability graph [12].
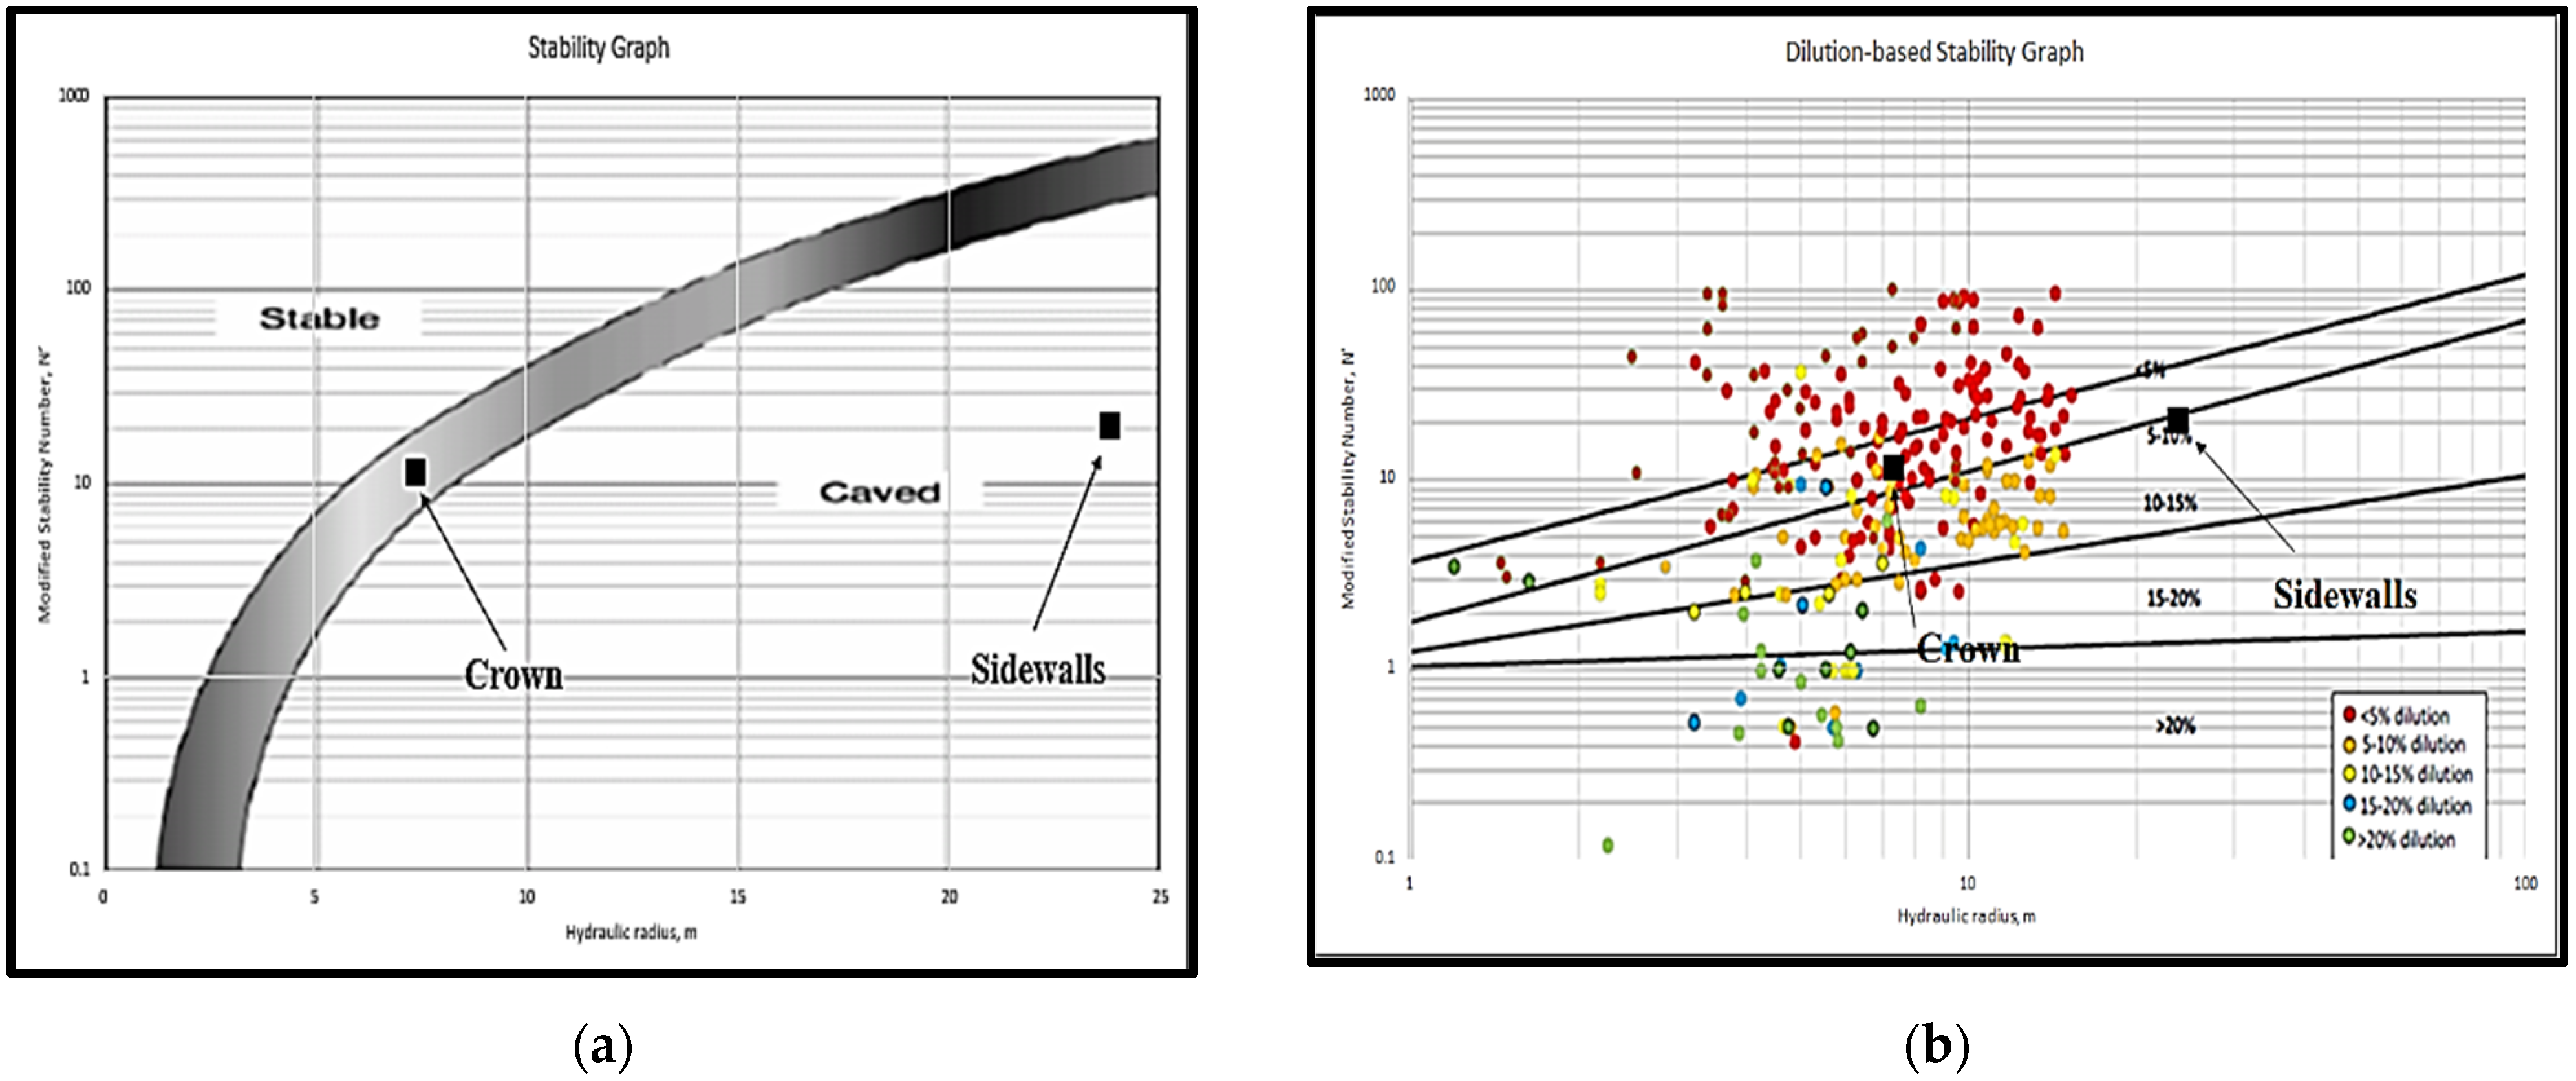
Figure 8.
Diagrams of the ore’s external dilution rate vs. HR/N′: (a) Right Sidewall (HW) (b) Left Sidewall (FW) (c) Crown.
Figure 8.
Diagrams of the ore’s external dilution rate vs. HR/N′: (a) Right Sidewall (HW) (b) Left Sidewall (FW) (c) Crown.
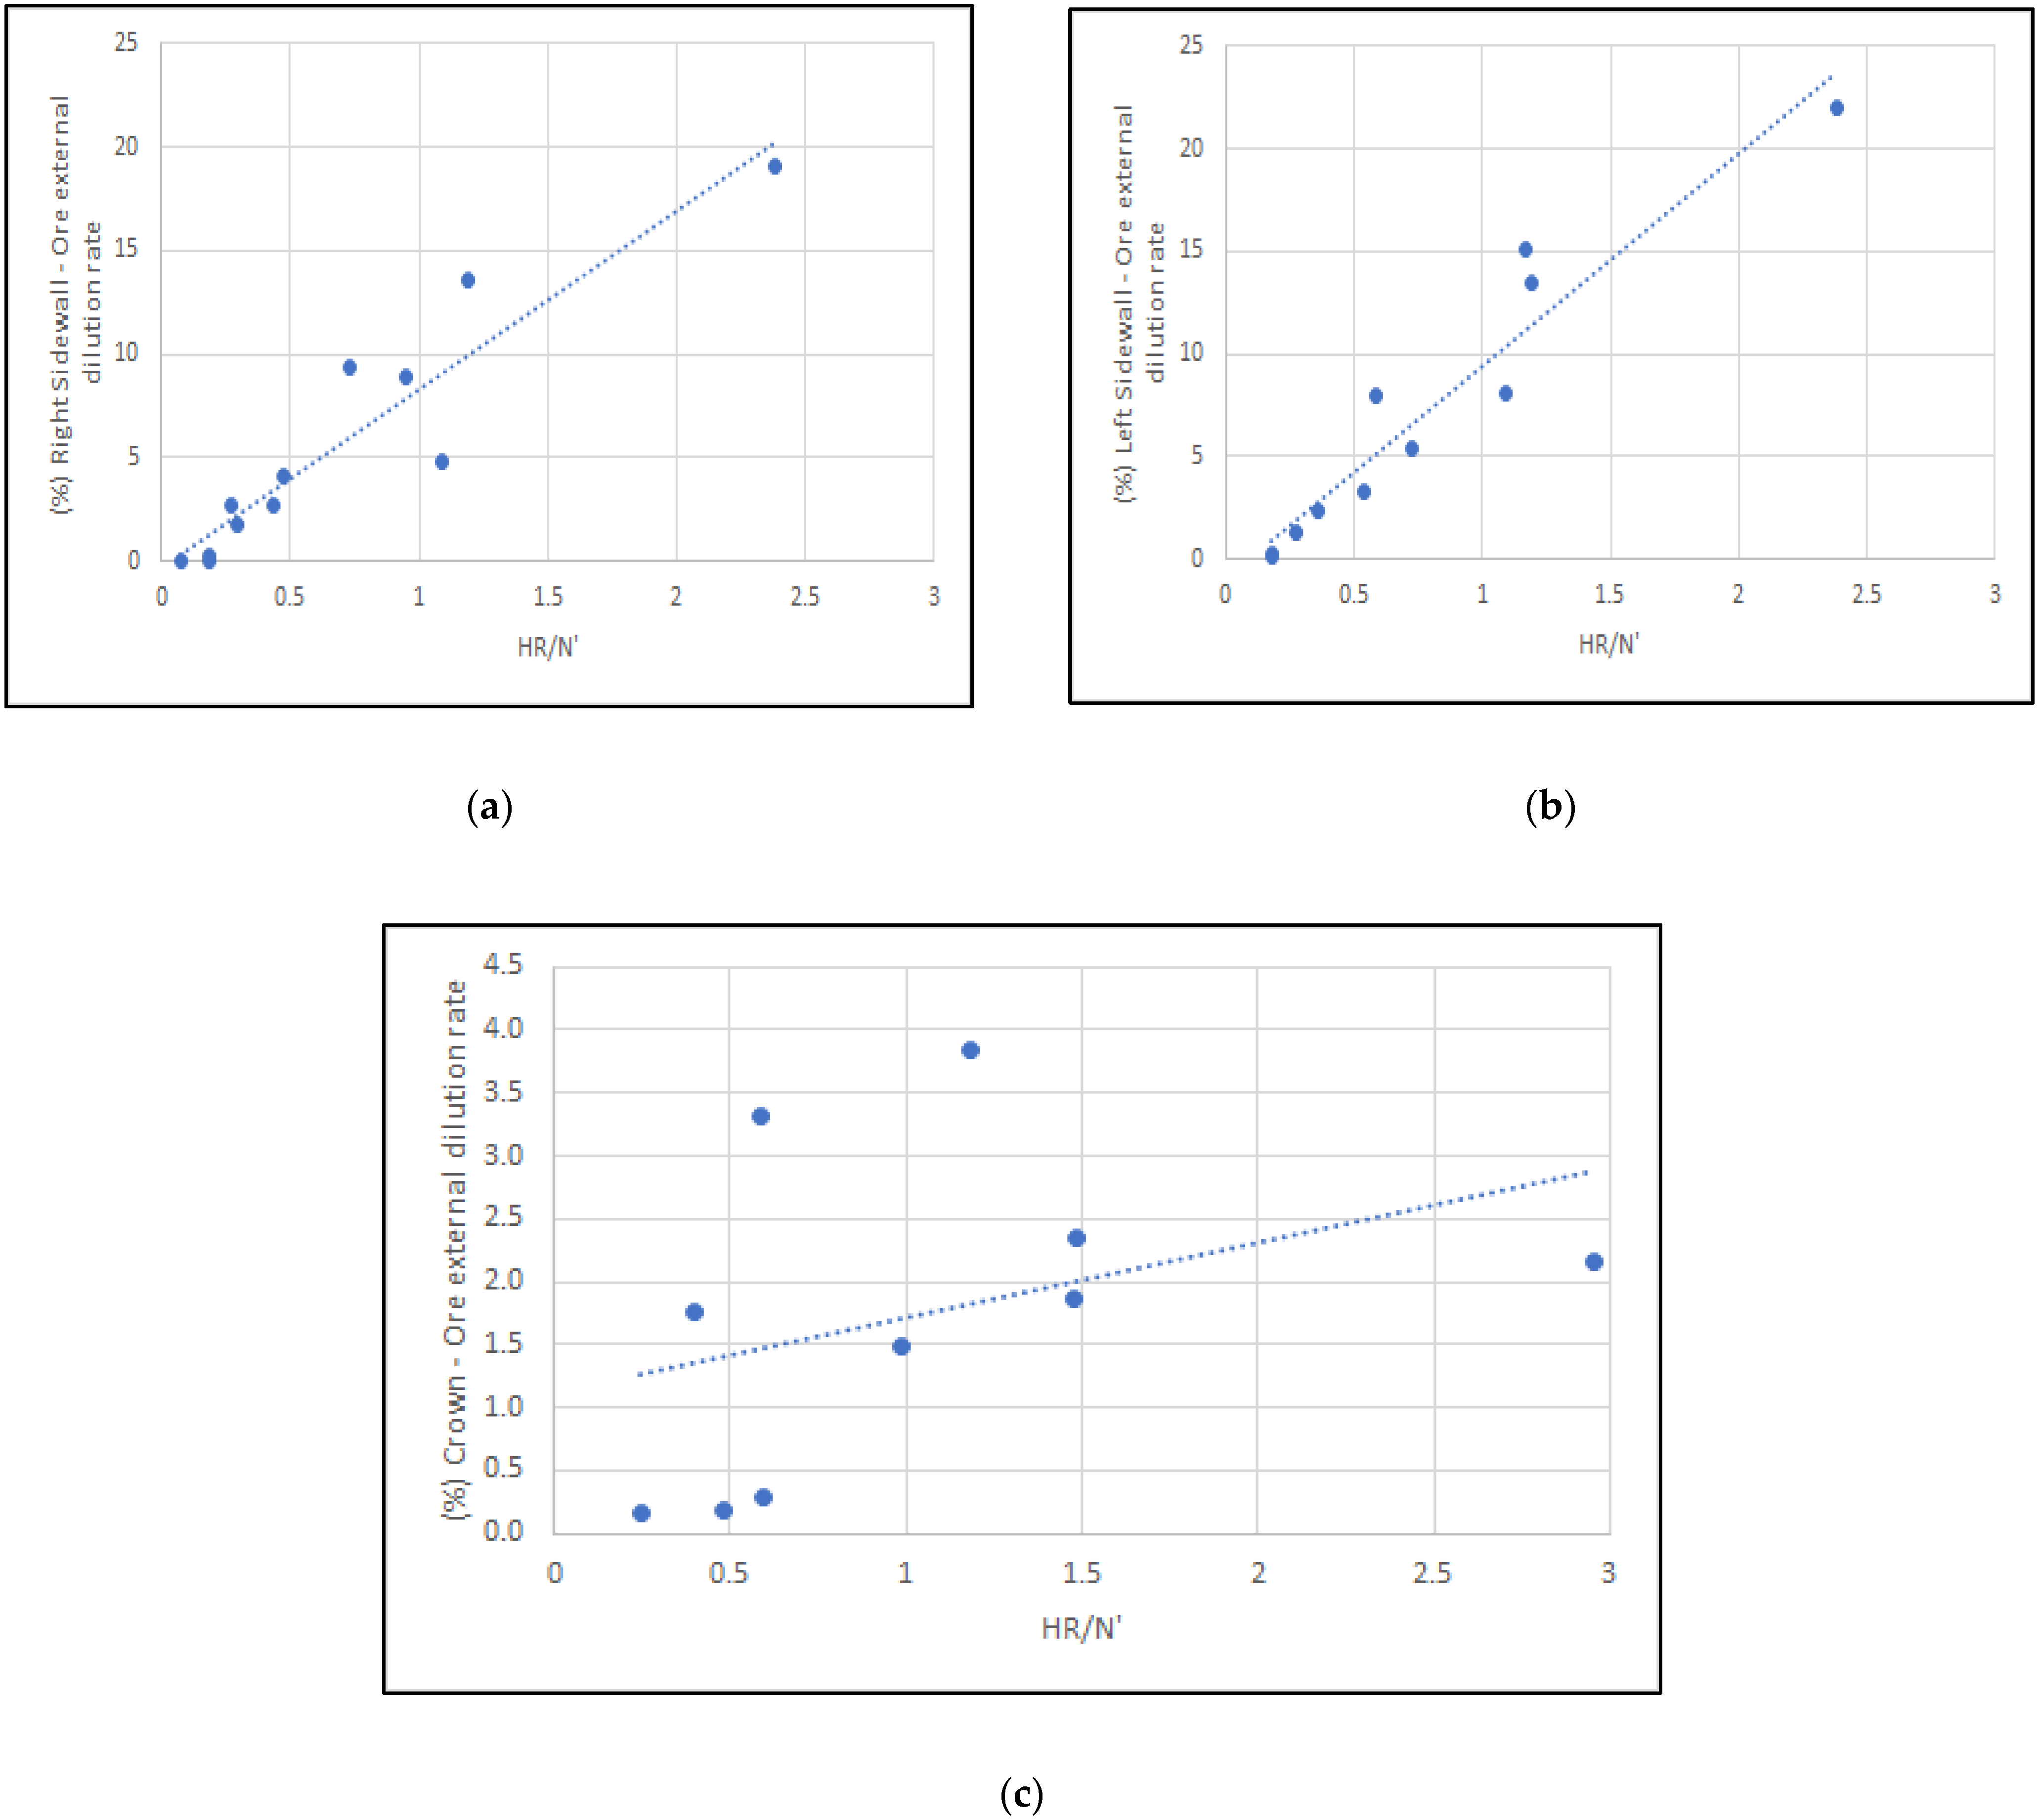
Figure 9.
Summary and comparative diagram of the ore’s external dilution rate vs. HR/N′.
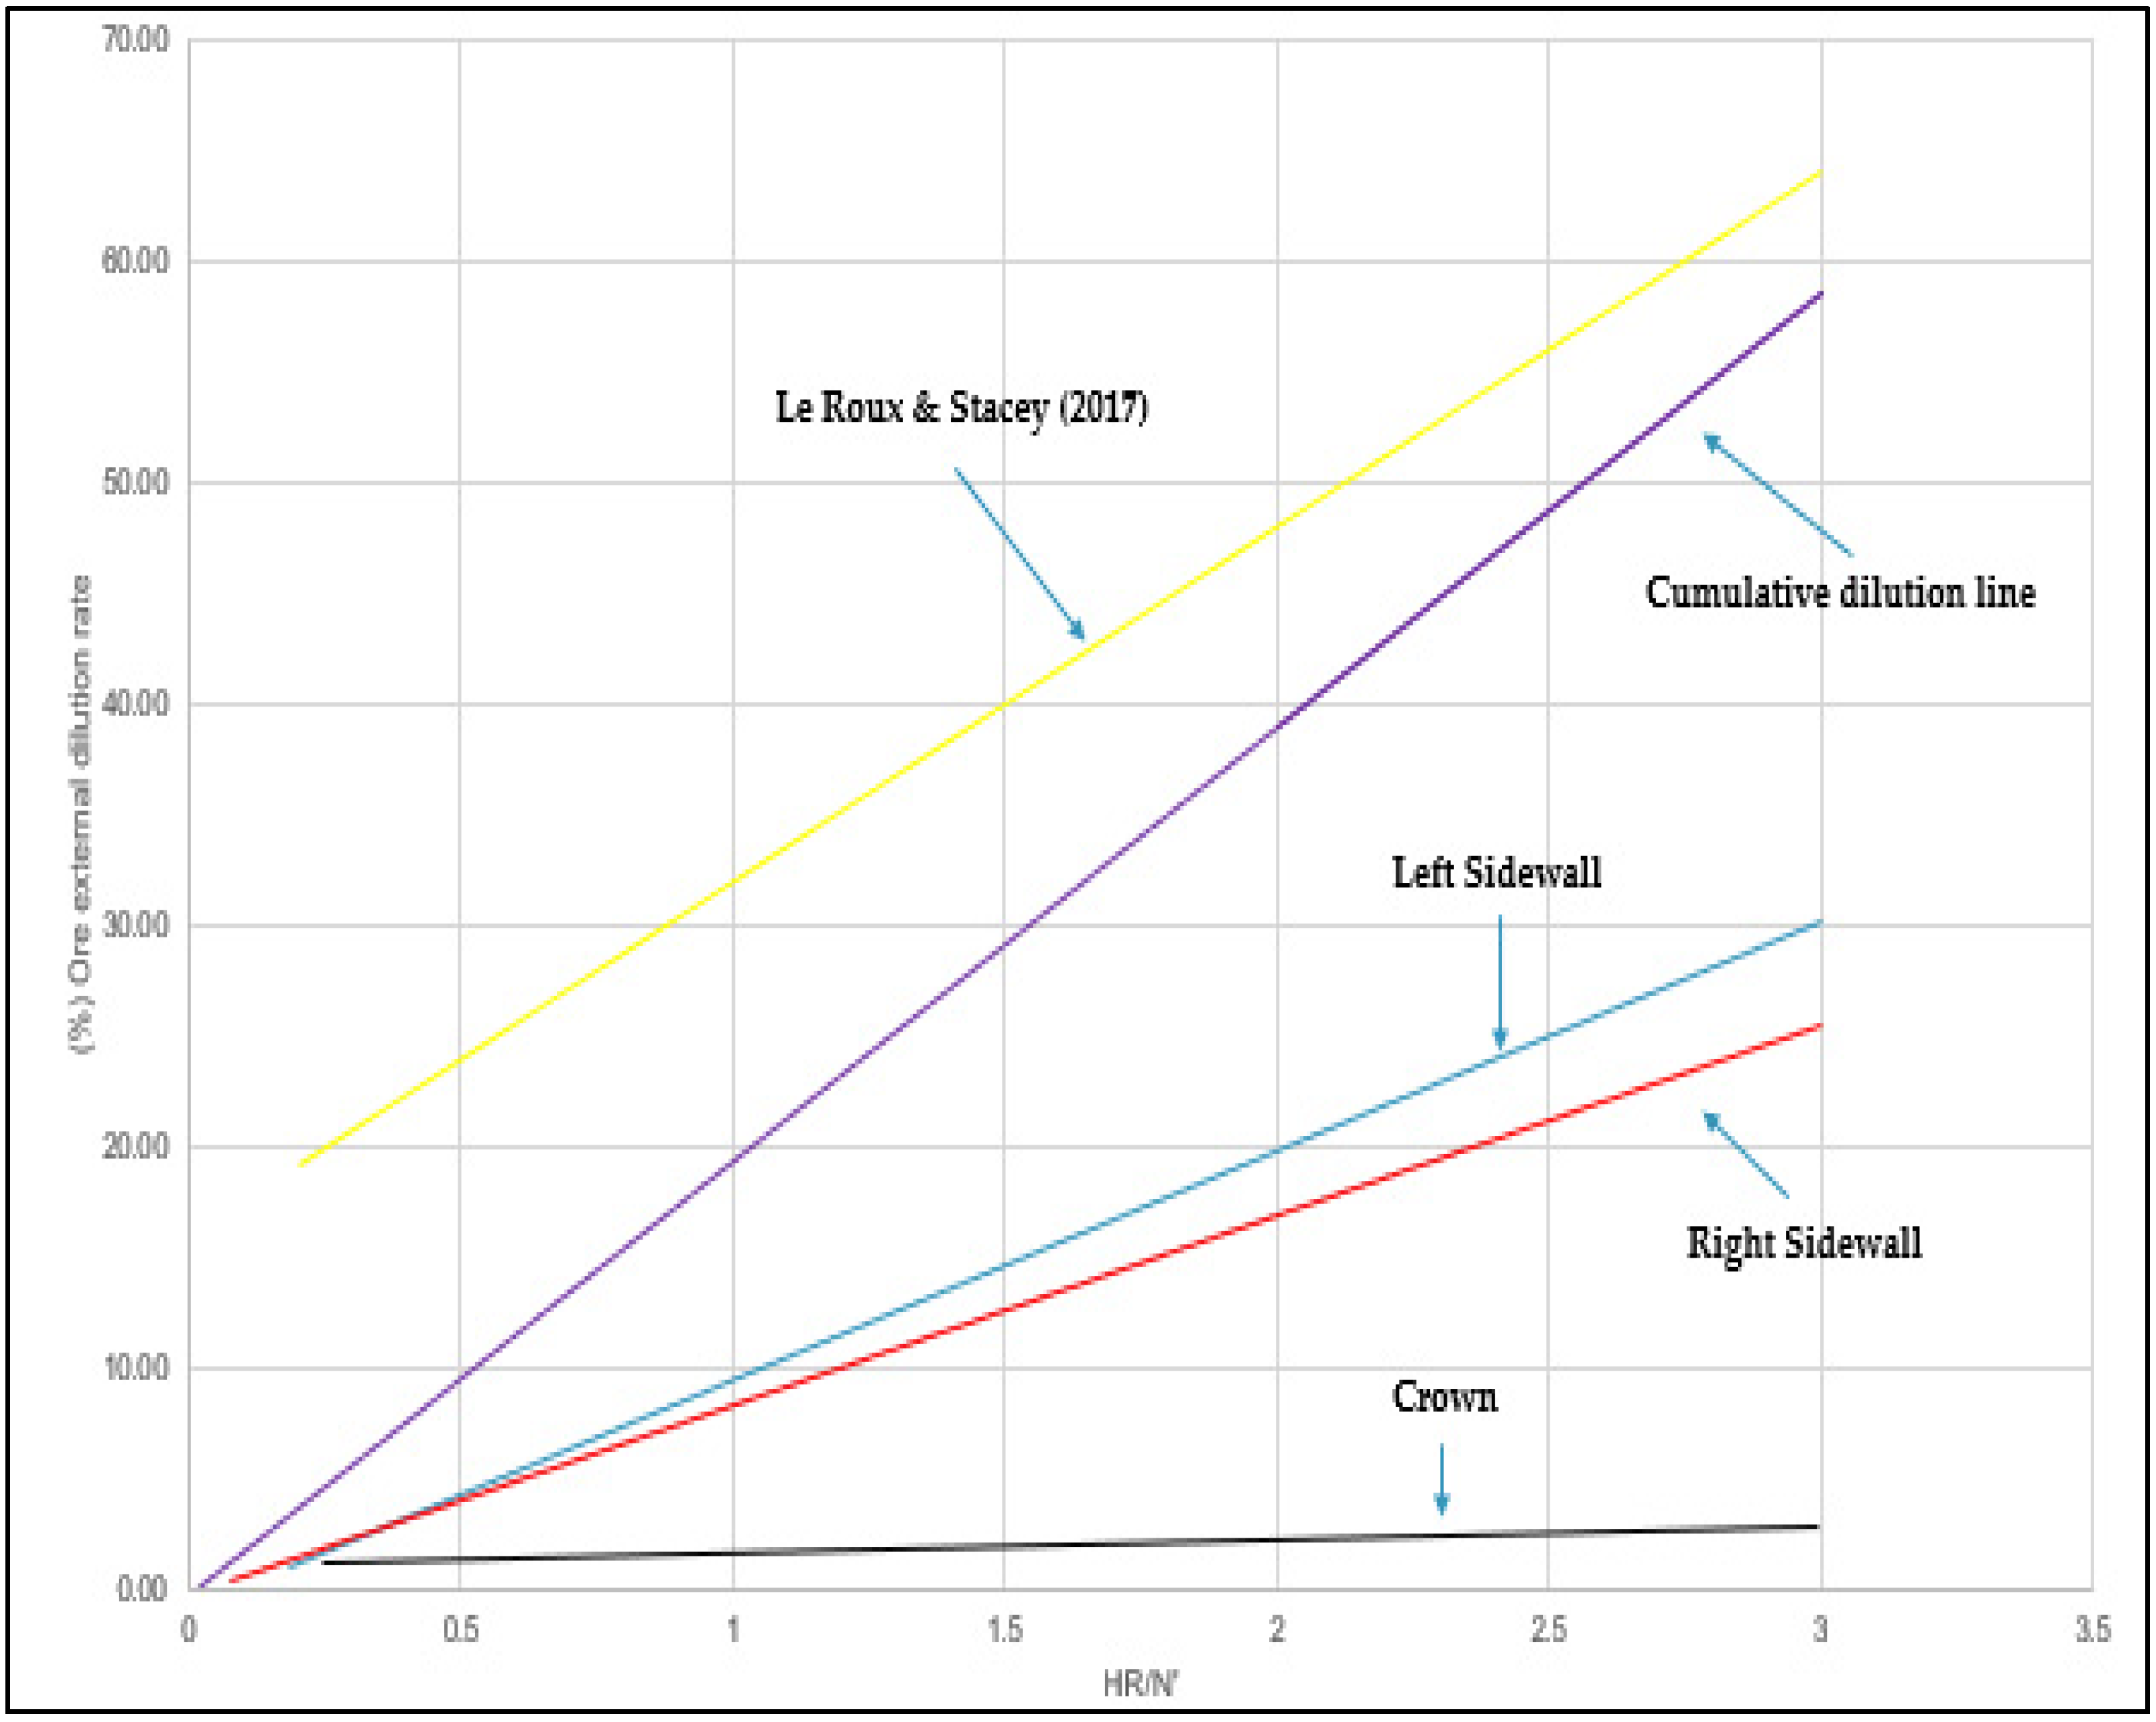
Figure 10.
Proposed dilution-based stability graph approach.

Table 1.
Historic overview of the basic stability graph modifications according to Suorineni [13].
Table 1.
Historic overview of the basic stability graph modifications according to Suorineni [13].
| Period | Developments |
|---|---|
| 1980–1985 |
|
| 1985–1990 |
|
| 1990–1995 |
|
| 1995–2000 |
|
| 2000–2005 | |
| 2005–2010 |
|
| 2010–to date |
|
Table 2.
The list of examined parameters’ values.
| Material | Stope’s Geometry | Infill Material | Joint Sets | Joint Inclination |
|---|---|---|---|---|
| Gneiss | Geometry 1 | Calcite-based | One joint set | 30° |
| Marble | Geometry 2 | Clay-based | One joint set + random | 45° |
| - | - | Without infill material | - | 60° |
Table 3.
Categories of simulation models.
| Category | Rock Material | Geometry Type | Infill Material | Joint Set Numbers |
|---|---|---|---|---|
| Category 1 | Gneiss | Geometry 1 | Without infill material | One set |
| Category 2 | Marble | Geometry 1 | Without infill material | One set |
| Category 3 | Marble | Geometry 1 | Calcite-based infill material | One set |
| Category 4 | Marble | Geometry 2 | Calcite-based infill material | One set |
| Category 5 | Marble | Geometry 2 | Clay-based infill material | One set |
| Category 6 | Marble | Geometry 1 | Calcite-based infill material | One set + random |
Table 4.
The list of examined materials and some of their main properties.
| Material | σci (MPa) | σt (MPa) | E (MPa) | Cohesion (MPa) | Friction Angle (°) |
|---|---|---|---|---|---|
| Gneiss | 175 | 10 | 70,000 | 36.24 | 45 |
| Marble | 63.8 | 4.4 | 54,230 | 13.21 | 45 |
Table 5.
The list of the examined sets of the open stope’s geometrical parameters.
| Geometry Type | Height (m) | Width (m) |
|---|---|---|
| Geometry 1 | 30 | 10 |
| Geometry 2 | 50 | 15 |
Table 6.
Case study #12: Stability parameters and final results.
| Examined Surface | A | B | C | Q | N | N′ | HR (m) | Expected Dilution (%) [12] | Expected Stability State [10] | Calculated Dilution (%)—FEA |
|---|---|---|---|---|---|---|---|---|---|---|
| Crown | 0.58 | 0.8 | 1 | 12.5 | 5.8 | 11.2 | 7.39 | 5–10 | Caved | 0.00 |
| Left Sidewall | 1 | 0.34 | 8 | 12.5 | 34 | 20 | 23.81 | 10–15 | Caved | 13.46 |
| Right Sidewall | 1 | 0.34 | 8 | 12.5 | 34 | 20 | 23.81 | 10–15 | Transitional | 13.57 |
Publisher’s Note: MDPI stays neutral with regard to jurisdictional claims in published maps and institutional affiliations. |
© 2021 by the authors. Licensee MDPI, Basel, Switzerland. This article is an open access article distributed under the terms and conditions of the Creative Commons Attribution (CC BY) license (https://creativecommons.org/licenses/by/4.0/).
Share and Cite
MDPI and ACS Style
Delentas, A.; Benardos, A.; Nomikos, P. Analyzing Stability Conditions and Ore Dilution in Open Stope Mining. Minerals 2021, 11, 1404. https://doi.org/10.3390/min11121404
AMA Style
Delentas A, Benardos A, Nomikos P. Analyzing Stability Conditions and Ore Dilution in Open Stope Mining. Minerals. 2021; 11(12):1404. https://doi.org/10.3390/min11121404
Chicago/Turabian StyleDelentas, Andreas, Andreas Benardos, and Pavlos Nomikos. 2021. "Analyzing Stability Conditions and Ore Dilution in Open Stope Mining" Minerals 11, no. 12: 1404. https://doi.org/10.3390/min11121404
Note that from the first issue of 2016, this journal uses article numbers instead of page numbers. See further details here.