Article

Mining Waste as a Potential Additional Source of HREE and U for the European Green Deal: A Case Study of Bangka Island (Indonesia)

by
Karol Zglinicki
1,*,
Rafał Małek
1,
Krzysztof Szamałek
1,2 and
Stanisław Wołkowicz
1
1
Polish Geological Institute-National Research Institute, 00-975 Warsaw, Poland
2
Faculty of Geology, University of Warsaw, Żwirki i Wigury 93, 02-089 Warsaw, Poland
*
Author to whom correspondence should be addressed.
Minerals 2022, 12(1), 44; https://doi.org/10.3390/min12010044
Submission received: 26 October 2021 / Revised: 13 December 2021 / Accepted: 26 December 2021 / Published: 28 December 2021

Abstract

:
The European Commission has adopted the European Green Deal strategy, which aims to achieve climate neutrality in the EU by 2050. To achieve this goal, it is necessary to shift the economy toward the use of green and renewable energy. Critical raw materials (CRMs), Li, Co, REE, Te, Sc and others, are used in renewable energy sources (RES) production. The EU lacks its own CRM deposits, and additionally, the access to already identified deposits is limited, which is making the EU countries search for alternative CRM sources. One such source of CRMs may be mining waste generated on the Indonesian island of Bangka as a result of processing cassiterite-bearing sands. Studies of the mineral composition of the waste using the XRD method reveal rich contents of xenotime (0.79–17.55 wt%), monazite (1.55–21.23 wt%), zircon (1.87–64.35 wt%) and other minerals, carriers of valuable metals, such as Sn, Ti, Nb, Ta. The point mineral chemistry analyses were performed using EPMA. Xenotime is the main carrier of heavy rare earth elements (HREE), especially the “most critical” HREEs: Gd2O3 (1.42–7.16 wt%), Dy2O3 (2.28–11.21 wt%), Er2O3 (2.44–7.85 wt%), and Yb2O3 (1.71–7.10 wt%). Xenotime is characterized by a complex internal structure resulting from metasomatic processes occurring during their formation. In SEM-BSE imaging, they show zonation of internal structure, which is the effect of an HREE, Y, Si and U substitution in the crystal structure. On the other hand, thorite ThSiO4 and uranothorite (Th,U)SiO4 inclusions are present in xenotimes. The ICP-MS/ES studies of tailings reveal very high contents of HREE + Y (up to 7.58 wt%), U (up to 0.11), Th (up to 0.75 wt%) and Sc (132 ppm). A CRM source diversification is part of the strategy to ensure the security of raw materials for countries of the European Union and the green transformation of the continent. Bilateral EU–Indonesia cooperation in the geological exploration and development of primary and secondary sources may contribute to an increase in the supply of HREEs to the global market.

1. Introduction

Climate change caused by excessive greenhouse gas emissions (CO2, CH4, N2O, CFCs—chlorofluorocarbons, and others) and environmental degradation are the greatest contemporary threats to Europe and the world [1,2]. The mining and mineral processing sector has a particularly negative impact on the ecosystem and the loss of biodiversity. It is estimated that they are responsible for half of all global greenhouse gas (GHG) emissions [3]. Within the European Union (EU, 27 countries) the greatest greenhouse gas emissions are connected to burning fossil fuels and the power industry. Despite significant decreases in GHG emissions (change of −22.04% since 1990), ca. 4 Mt CO2 eq is being released into the atmosphere [4].
Economic growth, especially in emerging and developing countries (China, Indonesia, Brazil, Central and Eastern European countries) increases the demand for mineral resources and energy. According to forecasts, the global consumption of mineral resources by 2060 will increase to 167 Gt from the current 79 Gt [5,6]. As a result of increased exploitation and processing of mineral raw materials, the volume of anthropogenic waste (mine waste-rock, tailing, and slags), GHG emission, leaching of acid mine waters (AMD), pollution of soil and surface and underground waters, among other things, through the failure of tailing ponds [7], will increase. However, anthropogenic waste can be a valuable source of many metals, including rare earth elements (REEs); Nb, Ta, Co and non-metallic minerals.
Increasing threats from ongoing climate change require action to reduce their future negative impacts on the biosphere. In 2019, the European Commission adopted a set of initiatives with the overarching goal of achieving climate neutrality by 2050. The European Green Deal [2] and related strategies (A New Industrial Strategy for Europe [8,9], the Digital Transition [10]) indicate the need for the efficient use of renewable resources, the reduction in pollution levels, fostering innovation and increased participation in a closed-loop economy.
The sustainable economic development of the European Union requires permanent and secure access to a mineral supply chain. “Critical metals” are of particular importance for the development of European strategies, including the European Green Deal [11]. The critical raw materials (CRMs) group consists of metals with unique chemical and physical properties used in technologies necessary for the development of a low-carbon economy. The supply of these metals shows a high risk of limitations; at the same time, these metals are characterized by a low degree of substitution. The European Commission updates the list of CRMs every 3 years [11,12,13,14]. The current 2020 list includes 30 raw materials [11].
Rare earth elements (REEs) are important for the development of a modern, low-carbon economy. The REE group consists of 17 elements belonging to the lanthanide group, plus scandium (Sc) and yttrium (Y), as defined by the International Union of Pure and Applied Chemistry (IUPAC). Traditionally, REEs are divided into light rare earth elements (LREE, La-Eu) and heavy rare earth elements (HREE, Gd-Lu and Y). The unique properties (magnetic and electrochemical) of REEs make them useful in many manufacturing technologies of, for example, wind turbines (Nd, Sm, and Tb), solar panels (Yb), and electric cars (Nd and Dy). Currently, China supplies 99% of LREE and 98% of HREE to the European Union [11]. China’s monopoly is connected with the extraction and processing of rare earth elements at every stage of the production chain. The reduction in export quotas introduced by the Chinese government on REEs at the beginning of the 21st century has led to drastic price increases and reduced their supply on the global market [15]. Additionally, the COVID-19 pandemic has caused significant supply chain disruptions for many raw materials, including the REEs. The consequence of a limited supply of REEs will be a steady increase in the number of new raw material projects in Southeast Asia and offshore areas, among others [16].
Like REEs, a regular and uninterrupted supply of natural uranium, needed for the production of nuclear fuel, medical radioisotopes and to power research reactors, is important to the European Union’s energy security. Most uranium for the production of nuclear fuel is imported from Russia (19.8%), Kazakhstan (19.6%), Niger (15.3%), Australia (14.4%) and Canada (11.6%). These countries supply almost 90% of all natural uranium to the European Union, and three of them can be classified as politically unstable countries [17].
Ensuring raw material and energy security for the European Union requires measures aimed at permanent access to raw materials through the diversification of their sources. Limited internal sources of metals indicate the need to search for and obtain them outside of Europe. In the countries of South East Asia, such as Indonesia, which is characterized by a high raw material potential, primary and secondary metal deposits may be of particular importance [18,19,20]. Mining wastes represent a significant raw material potential. It is estimated that about 8–10 billion tons of tailings are generated annually in the world as a result of the mining and processing of, among others, copper, cassiterite, zinc and lead ores and other minerals [21].
In the framework of the project “New Potential sources of Rare Earth Elements”, the potential of tailings generated from the processing of cassiterite-bearing sands on the Indonesian island of Bangka was evaluated [19,22]. Until now, the waste generated on Bangka Island was stored in dumps. This material was considered useless. Until 2013, there was no comprehensive study of the generated waste. Prospecting work was carried out on this island, during which 35 samples of tailings were collected [22]. During the investigations [19,22], it was found that the resulting waste is characterized by high concentrations of many valuable metals, including REEs, U, Th, Sn, Ti, Nb, and Ta. So far, there is no information in the literature about such rich metal contents in waste.
In particular, we investigated the source of rare earth elements and uranium. On the basis of the studies obtained, the usefulness and direction of the use of the waste was determined. The high contents of these metals may be important for obtaining a new supply source for the European Union. Ensuring sustainable development of Europe through the diversification of CRM sources and supplies is becoming a new challenge of the 21st century.

2. Geological Setting

A detailed description of the geological structure of Bangka Island (Figure 1) was presented by [23,24,25,26,27]. The weathering of granitoid rocks from the late Miocene to Holocene led to the formation of numerous on-shore and off-shore placer deposits [28,29,30]. The genesis of these deposits is linked to the region’s strong tectonic activity, the erosion and subsidence of the Sundland area, and eustatic changes of the world ocean in the Cenozoic [23]. The sediments of the Ranngam Group (Paleogene-Neogene), which includes sediments of the Ranngam Formation and Residual Gravel [23,26], are of greatest economic importance in the recovery of heavy minerals, mainly cassiterite. The placer deposits are subject to intensive mining by state-owned companies: PT Timah, PT Koba Tin, and by artisanal mining (Figure 2A,B).
The mining activity conducted on the Bangka Island generates huge amounts of tailings. The tailings generated by state-owned companies are collected in closed landfills (Figure 3A), while the material from artisanal mining is used to infill illegal mining sites (Figure 3B,C). In the case of middlemen/sellers of the mineral (compradores), the mixed tailings are deposited in domestic landfills (Figure 3D).

3. Materials and Methods

3.1. Sampling

The sampling method was presented by [22]. Thirty-five crumb samples resulting from the processing of cassiterite-bearing sands [19] were collected from mineral processors/vendors (compradores) from domestic dumpsites located in the vicinity of the towns (numbered on the map, Figure 1): 1—Belinyu, 2—Puput (West Bangka Regency); 3—Jurung, 4—Sungai Liat, 5—Pemali, 6—Matras (Bangka Regency), 7—Lubuk, (Central Bangka); 8—Nyelanding, and 9—Toboali (South Bangka Regency). The most prospective crumb samples with high content of REE-carrier minerals were selected for study.

3.2. Analytical Methods

3.2.1. Grain Size

Granulometric analysis of the selected samples was performed on a nylon sieve column with diameters (MESH) ranging from 2 mm to 0.063 mm, according to Wentworth classification [31]. Statistical description was performed with the open-source software GRADISTAT v.5.11 [32], using the logarithmic method. The analysis was carried out at the Laboratory of Clay Raw Materials Technology (Department of Geology, University of Warsaw, Warsaw, Poland).

3.2.2. X-ray Diffraction

The mineral composition of the samples was investigated on an X’Pert PRO MPD powder X-ray diffractometer (PANalytical B.V., Almelo, The Netherlands), in the Bragg–Brentano system. Pressed powder preparations were recorded in the angular range 4–90° 2θ, with a step of 0.026° 2θ, with a sample rotation of 1 rpm/2 s, in filtered CoKα radiation (Fe filter) with current parameters of 30 mA and 40 kV. A PIXcel fast linear detector was used for radiation detection. The analysis of the results was performed in X’Pert HighScore Plus software (ver.2.2e) [33]. Quantitative phase analysis of the samples was performed using the Retvield method. For the identification of mineral phases, ICDD PDF-2 v.2007 and PDF-4 + v.2011 databases were used.

3.2.3. SEM-Scanning Electron Microscope Observation

Mineral grain observations were performed using a Fe-SIGMA VP scanning microscope (Carl Zeiss Microscopy Ltd., Cambridge, U.K.) equipped with two EDS detectors (SDD XFlash| 10) (Brucker, Bremen, Germany). Analyses were performed in high vacuum at an accelerating voltage of 15 kV. Observations were performed in the Environmental Laboratory of Low Temperature Scanning Electron Microscopy Cryo-SEM (Department of Geology, University of Warsaw, Warsaw, Poland).

3.2.4. EPMA-Electron Probe Microanalysis

Mineral chemistry studies were conducted using a CAMECA SXFiveFe electron microprobe (Cameca, Cedex, France) equipped with wave dispersive spectrometers (WDS). Analyses were performed at an accelerating voltage of 15 kV, beam current of 47 nA (with a deviation up to 2 nA), beam diameter around 1 μm, peak count time of 20 s, and background time of 10 s. Spectra were analyzed on TAP (thallium acid phthalate), LPET (large pentaerythritol), and LLIF (large lithium fluoride) spectrometers. Table 1 presents the standards, analytical lines, diffracting crystals, detection limits, and standard deviation for the analyzed elements. Samples for analysis were sputtered with a thin layer of carbon. Results were corrected based on the CAMECA PAP algorithm by Pouchou and Pichoir [34]. Analytical work was carried out in the Inter-Institutional Laboratory of Microanalysis of Minerals and Synthetic Substances of the Faculty of Geology of the University of Warsaw, Poland.

3.2.5. Chemical Analyses (ICP-MS/ES Method)

Chemical composition testing of the samples was performed at a certified laboratory (ISO 9001:2008) ACME Labs in Vancouver, BC, Canada. Analytical software LF202 (www.acmelab.com, accessed on 10 October 2021) was used for analysis. A tailings sample of approximately 10 g was grated and then mixed and fused with sodium lithoborate (Na2B4O7/Li2B4O), followed by dissolution in a mixture of aggressive acids. Due to the presence of minerals resistant to the digestion process (e.g., cassiterite), analytical results were not close to 100%. The content of metals in the analytical programs was determined using the ICP-MS/ES method. Loss on ignition (LOI) was calculated by weight difference after ignition at 1000°.
The level of accuracy and analytical precision can be found at (www.acmelab.com, accessed on 10 October 2021). In order to guarantee the highest standards of analysis (ICP-MS) to validate the proposed methodology, a Certified Reference Material (CRM) of NCS DC 73,301 is granite. The laboratory (ACME Labs) carried out quality control by performing duplicates analyses, analytical blank and using reference materials STD DS11, STD OREAS45EA, STD OREAS45EA-Excepted.

4. Results

4.1. Tailings

Macroscopic studies of the tailings indicate that they are similar to previously analyzed samples [19,22]. Depending on the separation technique used, the tailing forms fine to medium-grained sediments (Figure 4). In the fine-grained samples, the dominant grain fraction is in the range of 0.10–0.25 mm (Bngk 1, 3, 15) (Figure 4A,B). Medium-grained samples are rarely dominated by grain sizes of 0.50 mm or more (Bngk 19) (Figure 4C,D). Two groups of grains can be distinguished in the tailings: (1) very well-rounded spherical and ellipsoidal grains; (2) very poorly rounded spindle and ellipsoidal grains. The specific density of the tailings ranges from 2.82 g/cm3 to 3.88 g/cm3. The tailings are generally medium sorted with varying statistical coefficients.
Microscopic observations and XRD analyses reveal significant mineralogical variation in the tailings (Table 2). The main REE-carrier phases are present in the samples: monazite [Ce(PO4)] (1.55–9.30 wt%) and xenotime [Y(PO4)] (0.79–2.89 wt%). Other minerals consist of zircon [Zr(SiO4)], ilmenite [Fe2+TiO3], rutile [TiO2], anatase [TiO2], pseudorutile [Fe2Ti3O9], cassiterite [SnO2], quartz [SiO2], and others. Anomalously high concentrations in samples show zircon up to 64.35 wt% (Bngk 30). The current results are for samples mentioned in Table 2. Samples from columns Szamałek et al., 2013 [19] and Zglinicki et al., 2020 [35] were taken from these cited publications for comparison with the current analyses.
The mineralogical characterization of the samples by XRD identified a major presence of REE-bearing minerals. Xenotime (0.79–17.55 wt%) and monazite (1.55–21.23 wt%) are present in almost all of the analyzed samples, making the mining waste on the whole of Bangka Island economically important. The presence of titanium, tin, and zirconium phases increases the economic value of the mining waste as a secondary resource. Tailings from Bangka Island should be considered multi-component raw material, a source of many valuable metals. In addition, variable contents of quartz (2.20–40.28 wt%), tourmaline (1.96–4.65 wt%) and topaz (3.58–6.53 wt%) were found in all samples. The presence of marcasite (up to 11.15 wt%) and pyrite (up to 9.95 wt%) is also particularly important. Undergoing weathering, these minerals are destroyed, which leads to the formation of acid drainage, thereby posing a threat to the local community.

4.2. Xenotime-Y(PO4)

Xenotime contents in tailings from Bangka Island are variable and depend on the sampling location and processing technology of the cassiterite-bearing sands. Anomalously high amounts of xenotime, up to 17.55 wt% in tailings, were described by [19]. However, mostly, the amounts reach up to 2.89 wt% (Table 2). Xenotime grains are usually found in coarser fractions above 100 µm. The samples are dominated by poorly coated and sharp-edged grains. Xenotime occurs in association with monazite (Figure 5A) and cassiterite (Figure 5B). Twinned xenotime crystals appear in the samples (Figure 5C).
Xenotime forms euhedral and anhedral crystals ranging in size from 50 to 350 μm. Grains are characterized by numerous internal cracks (Figure 5D), usually along the schistosity surface. Xenotime exhibits a varied internal structure from heterogeneous (Figure 5E) to zonal (Figure 5F), defined by concentric bands characteristic of magmatic-derived xenotime. Zoning in BSE imaging reveals variations in chemical composition (HREE, Y, Si, and U), across xenotime sectors [36,37]. Xenotime with relatively homogeneous internal structure is very rare.
In zonal xenotimes, a characteristic feature is the change in chemical composition occurring from outside to inside the grain (Table 3). The outer sectors contain an increased proportion of Y2O3 (52.52 wt%), P2O5 (35.29 wt%) and lower contents of HREE (10.84 wt%), UO2 (0.21 wt%). In contrast, inner zones are enriched in HREE (22.73 wt%), UO2 (2.43 wt%) and ThO2 (1.40 wt%).
The dominant group of grains shows a complex internal structure (Figure 6B) resulting from resorption (solid–fluid interaction) during metasomatic processes. The change in chemical composition results from the scale of substitution of HREE, U, and Th by Y [36,37]. The results of the samples obtained with EPMA are presented in Table 4. In the studied xenotime, the P2O5 content is in the range of 30.50–37.10 wt%, mean 34.78 wt%, and minor admixtures are SiO2 (up to 2.45 wt%), CaO (up to 0.20 wt%), and PbO (up to 0.03 wt%). In many samples, light rare earths (LREE) occur below the EPMA detection limit (Table 4). Depending on the EPMA analysis site, the HREE content is variable (Table 4). The analyzed xenotime is characterized by relatively constant YPO4 molar fraction values ranging from 0.72 to 0.81, with HREEs making up the remainder (Figure 6A,B). High contents are indicated for Dy, Er and Yb, the most critical metals of the HREE group. The Th/U ratio is high, indicating Th incorporation, mainly due to substitution in the crystallographic lattice of the mineral, according to the mechanism: (Th,U)4+ + Si4+ ⇄ (REE,Y)3+ + P5+ [37].
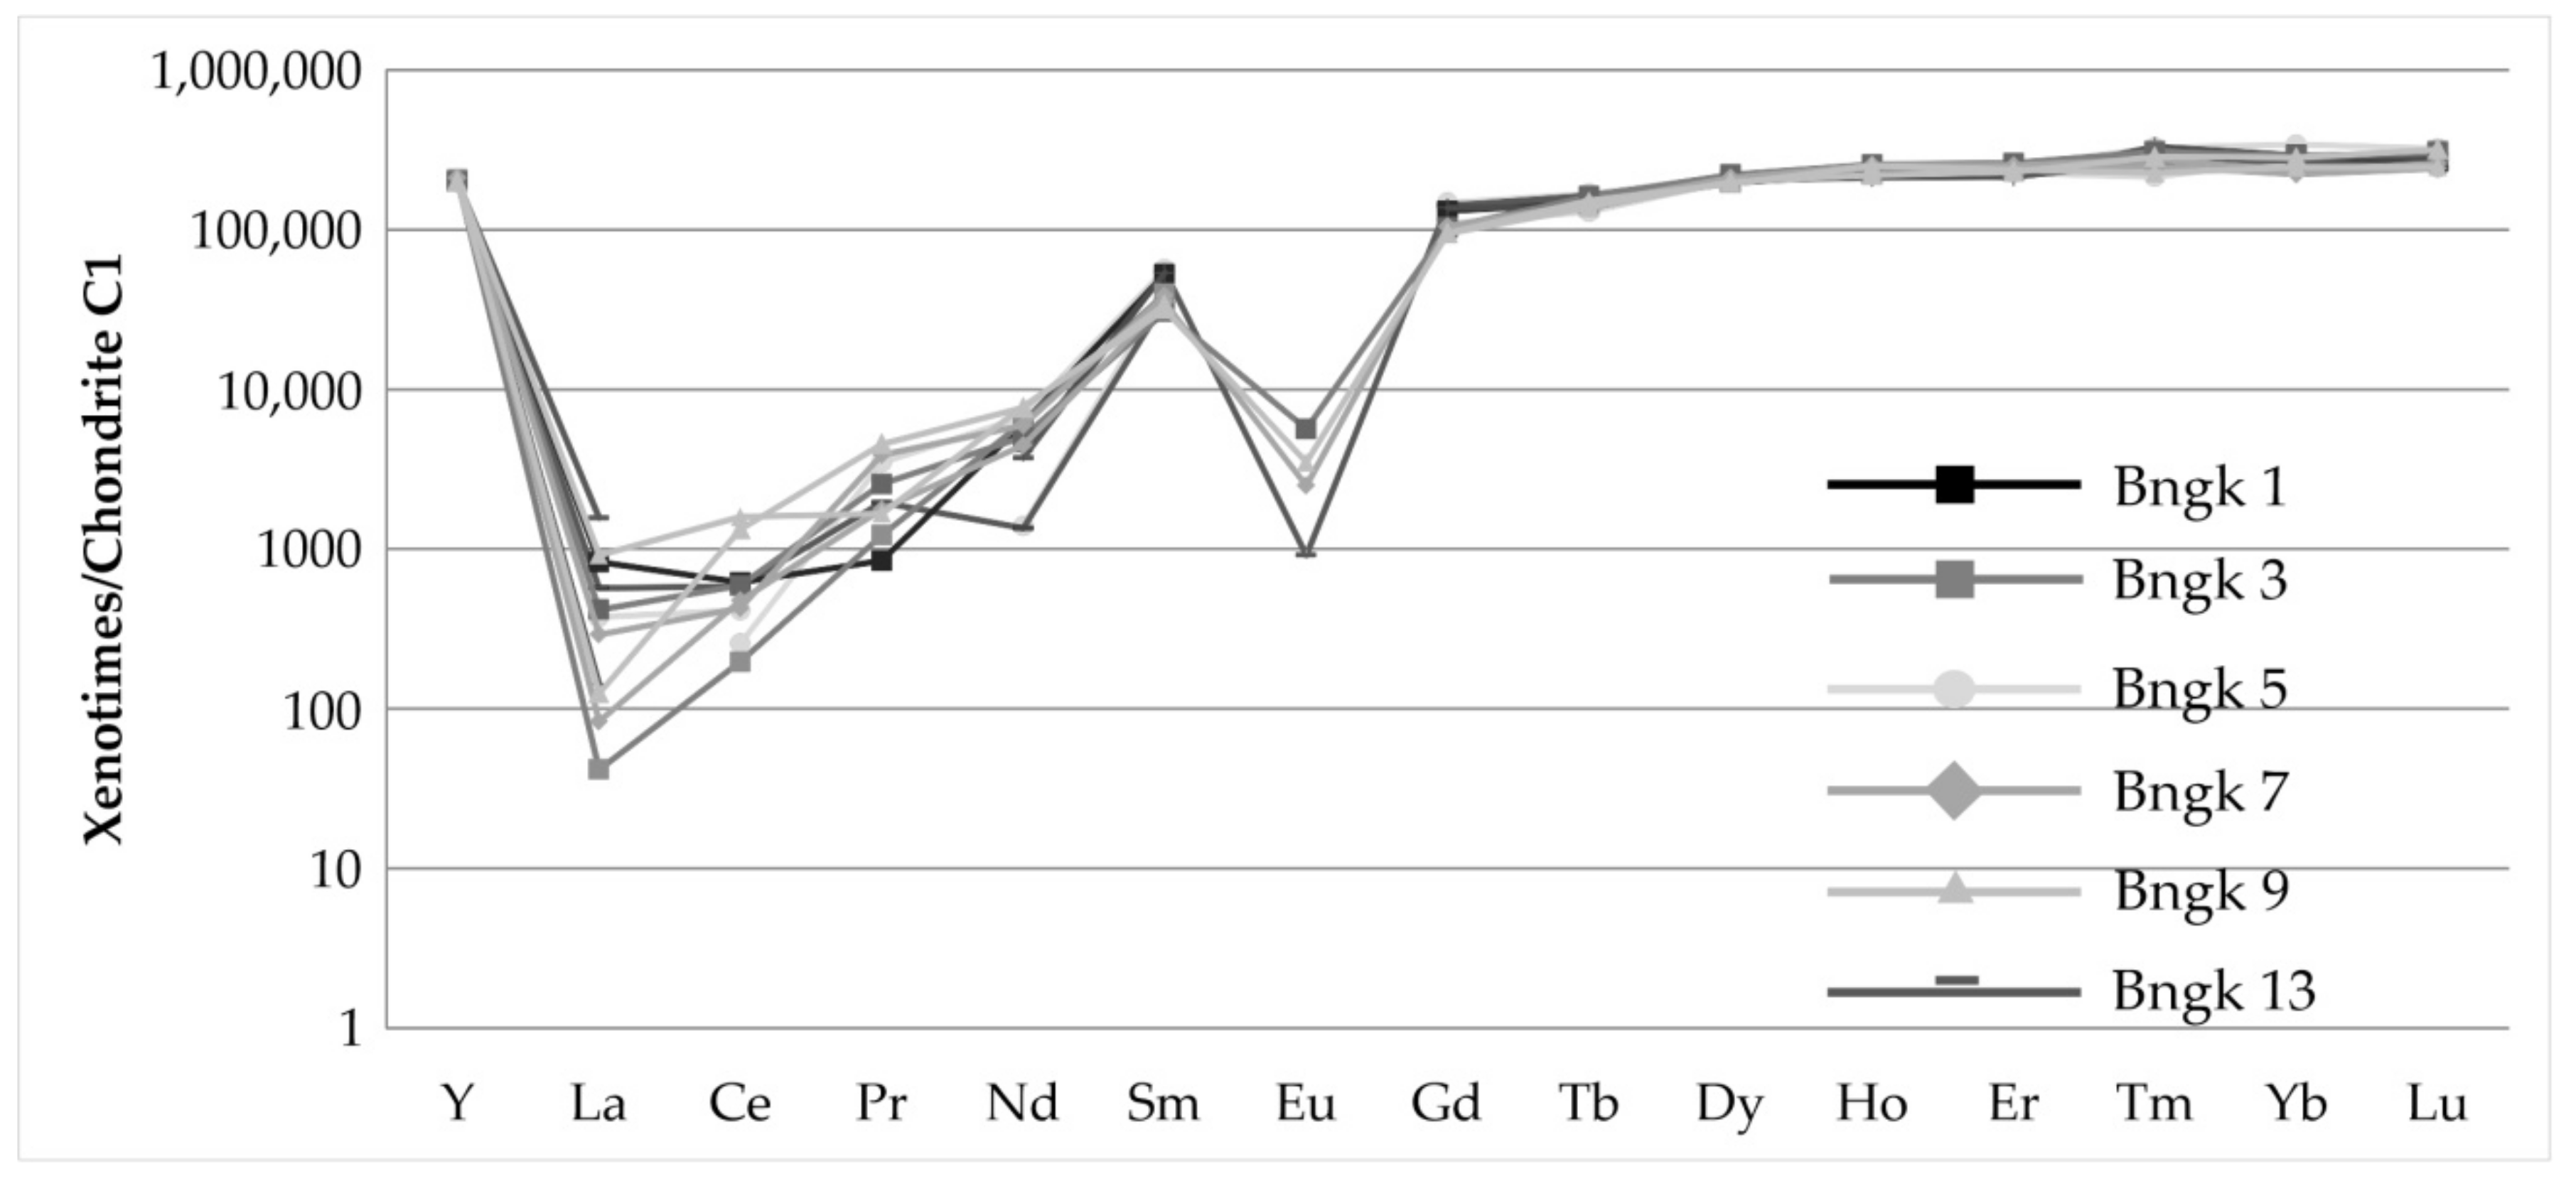
The diagram normalized to the chondrite (Figure 7) shows a depletion in LREE (Ce, Nd) relative to HREE. Clear negative anomalies for Eu, Ho and positive anomalies for Sm, Dy, Er are seen in all patterns. Variable values, positive and negative are shown by Lu.
A significant proportion of the xenotimes with heterogeneous internal structure are characterized by high porosity (Figure 8A–D) in which inclusions (up to 25 μm) of Th(SiO4)-uranothorite (Th,U)SiO4 are present. The size and distribution of the inclusions vary, with no preferential alignment to the crystallographic axis of the xenotime. Larger inclusions form subhedral and anhedral forms, internally heterogeneous and porous (Figure 8C,D). Around the larger inclusions, cracks and fissures are filled with material enriched in U and Th. Inclusions typically occur in the inner xenotime altered zones. Around the inclusions, alteration halos are formed that are visible during BSE imaging. Chemical composition studies show that the inclusions contain SiO2 ranging from 7.08 to 17.02 wt%, ThO2 34.68 to 71.04 wt%, and UO2 2.68 to 39.63 wt% (Table 5). The LREE content is low or below the detection limit, while there is an enrichment in Y and HREE.

4.3. Geochemical Analysis

A geochemical investigation of the samples (Table 6) revealed variable amounts of oxides and some correlations in the case of REE concentrations. The highest values were obtained for SiO2 in the range 2.81–55.65 wt% (mean 22.75 wt%, median 25.19 wt%), TiO2 3.74–48.51 wt% (mean 21.00 wt%, median 20.89 wt%) and Fe2O3 0.85–22.51 wt% (mean 13.20 wt%, median 14.93). These oxides are characterized by the greatest variation between the lowest and highest values. Among oxides with significantly lower contents, one should point out Al2O3 occurring in the content range between 0.32 and 10.14 wt% (mean 2.63 wt%, median 1.64 wt%) and P2O5 with measured content between 0.20 and 17.23 wt% (mean 2.91 wt%, median 1.4 wt%). The results of the content of other oxides are in the range < 0.01–2.06 wt%. The variation in the content of particular oxides in the samples results from differences in the amounts of the main tailings minerals, i.e., monazite, xenotime, rutile, ilmenite, zircon and others. Loss on ignition (LOI) is relatively high and reaches up to 11.10 wt%.
Chemical analyses (Table 6) showed high contents of radioactive elements: U and Th. Uranium in the samples ranges from 0.01 to 0.16 wt% (mean 0.06 wt%, median 0.04 wt%), and thorium 0.04–1.0 wt% (mean 0.32 wt%, median 0.17 wt%).
Tailing due to its mineral composition (presence of REE-bearing minerals) contains high concentrations of REE: Ce (up to 3.51 wt%, mean 0.94 wt%), La (up to 2.6 wt%, 0.60 wt%), Gd (up to 0.75 wt%, mean 0.16 wt%), Dy (up to 0.74 wt%, mean 0.17 wt%), Pr (up to 0.64 wt%, mean 0.14 wt%), Nd (up to 0.58 wt%, mean 0.28 wt%), Eu (up to 61.8 ppm, mean 10.12 ppm), Er (up to 0.52 wt%, mean 0.11 wt%), and Yb (up to 0.52 wt%, mean 0.11 wt%). Concentrations of other REEs did not exceed 0.25 wt%. High contents were also found for Sc 132 ppm (mean 71.40 ppm) and Y maximum at 4.83 wt% (mean 0.99 wt%). Significant concentrations of rare earth elements form the most “critical” elements in the REE group (Gd, Dy, Eu, Er and Yb).
Several samples analyzed (Table 6) showed higher total LREE content (LREE/HREE + Y ratio value above 1), while two (Bngk 1 and Bngk 3) samples showed higher HREE content (LREE/HREE + Y below 1). This indicates a dominant LREE-bearing mineral in most samples and an increased HREE concentration in single samples (Bngk 1 and Bngk 3). The sum of all REE + Y ranges from 0.96 wt% in the samples examined to as high as > 16.89 wt% in sample Bngk 22.
The correlation matrix of the elements and oxides content results is presented in Table 7. In the correlation, the absolute values of the correlation coefficient ≥ 0.3 were considered relevant. Missing data were removed by accident. The values of the analyses below the detection limit of the method were changed to half the value of the detection limit for statistical purposes. The results were interpreted on the basis of the linear correlation coefficient value. The absolute values of the correlation coefficient above 0.3 are highlighted in red in the table. In the oxides group, there are clearly visible positive correlations between SiO2, Al2O3, K2O and MgO, indicating the presence of certain amounts of rock-forming minerals, such as silicates, in the tested samples. In turn, a strong correlation of iron and titanium oxides results from the presence of ilmenite and rutile. P2O5 and CaO show not only a high correlation with each other, but also with the group of REE elements (Table 7). This relationship was confirmed mineralogically by the presence of REE carrier minerals: xenotime, monazite and fluorocarbonates. In addition, P2O5 shows a clearly negative correlation with SiO2, Fe2O3 and TiO2. Radioactive minerals U and Th show a strong positive correlation with CaO, P2O5 and the entire REE group, which was confirmed in the EMPA mineralogical studies. Elements within the REE group show strong correlation with each other, which indicates the obvious fact of their presence in the same minerals. Moreover, these elements (along with U and Th) show a clearly negative correlation with SiO2, Al2O3, MgO or TiO2 (Figure 9). These results clearly confirm that the rock-forming and heavy minerals present in the tested samples do not contain rare earth elements. Scandium, despite belonging to the REE group, shows no correlation with any of these elements, probably due to its low concentration in the tested samples.

5. Discussion

5.1. HREE and U Potential

Both the cassiterite-bearing placer deposits of the Indonesian islands and the tailings obtained from their processing have received interest as raw materials. Hamzah et al. (2018) [40] in an XRD with SEM/EDS study of samples of tin tailing sands of a post-tin mining area in Kuala Raya Singkep Island (Indonesia) indicated an average content of La at 0.2%, Ce at 7.8%, and Th at 2.0%, while identifying monazite and xenotime as the main REE carriers. SEM/EDS analyses provided by [40] simultaneously indicate very low lanthanum and cerium contents in the monazite studied. On the other hand, [41] indicated that tailings after tin mining collected from several sites in Singkep Island contain 123–368 ppm REEs. Setijadji et al. (2009) [42] in collaboration with PT Timah analyzed a series of samples from the Bangka and Belitung islands to identify REE content. The samples came from both active placer deposits in the southern part of Bangka Island, from the processing and enrichment plant (after concentration by physical methods), and from tailing sands. The results showed elevated Sn and Y concentrations for the placer deposit samples and LREE and Th for the concentrate samples. The study also revealed increasing HREE contents in the samples as the enrichment and separation process progressed (including magnetic susceptibility and electrical conductivity methods). Estimated REE contents of about 1% and U and Th contents above 1000 ppm in highly enriched and sub-concentrated samples from PT Timah plants. On the other hand, [28] presented the results of a study on untreated cassiterite-bearing sands of Bangka Island, indicating the presence of monazite and xenotime (with sample contents of 1.31 and 0.23 wt%, respectively) as the main REE carriers. The results [28] of EDX analyses indicate that the studied monazites are mainly carriers of Ce, La, and Nd and xenotime of Y, Dy, and Gd.
Investigations and observations of both the morphology of the xenotime grains and the thorite and uranothorite inclusions present in them indicate their complex history, and thus, the history of the source area from which they originate. The differentiated structure of individual xenotime grains with a porous and homogeneous central part of the grain with an oscillatory zoning boundary (e.g., 7A) and chemical differences of the two zones indicate their formation during different hydrothermal–metasomatic episodes, probably separated by a time gap. According to [43], thorite and uranothorite inclusions in xenotime and the porous texture of the grains may testify to the intense impact of fluid–mineral metasomatic processes in a closed chemical system. These processes must have occurred in source rocks containing xenotime, and thus may provide evidence in the discussion of the history and development of Bangka Island granitoids.
Quite significant content of radioactive elements in the examined tailings should lead to their recovery, not only for economic, but also for environmental reasons. Tailings, as waste after the processing of cassiterite-bearing sands, can be used as a valuable by-product: a source of both REEs and U and Th. Several methods are known for the recovery of uranium and thorium from concentrates of REE-bearing minerals, such as leaching, precipitation, solvent extraction, and ion chromatography [44]. The results of this study indicate the technical feasibility of recovering 55% to even 99% of U and Th from REE concentrate.
Chemical analysis results (Table 6) indicate positive anomalies of the most critical HREE, such as Tb, Dy and Y. These results warrant further detailed tailings studies to determine more accurate metal resource estimates. Despite the opening of new mines and refining facilities, the growing demand for rare earth elements will ensure that they remain in short supply and with hefty price tags attached. The exploration of new, readily available alternative sources can play a significant role in building a secure supply chain. The waste generated on Bangka Island can play that role.
The raw material potential of the island for CRMs and, in particular, HREE is very poorly explored. Szamałek et al. (2013) [19] estimated that up to 29,760 t of xenotime can be recovered annually from mining waste. Assessing the raw material potential for the whole island is difficult due to the considerable fragmentation of production (artisanal mining) and the diversity of material recovery technologies. This is shown in the results of the study (Table 6), where the regional variation in HREE + Y concentration is very high, from 0.24 to 7.58 wt%. Due to the impossibility of estimating the raw material potential of the mining waste, it is necessary to compare the obtained test results to the average elemental content of the bulk continental crust [45]. The tailing from Bangka Island has REE contents higher than the average crustal abundance (Table 8). The geochemical dataset indicates that the resulting waste has significant raw material potential throughout the island.
The Bangka Island is a major producer of tin in Indonesia. According to Mordor Intelligence forecasts [46], the tin market is expected to register a growth (CAGR) of over 2% during the 2021–2026 period. As a result of the global demand for tin, the mining of Bangka Island will continue. The production of tailings arising from the processing of cassiterite-bearing sediments will be an ongoing phenomenon. Long-term production of tailings with high CRM content is to be expected. Resources from Bangka Island are therefore becoming very prospective for obtaining CRM by the European Union. Production and supply in Indonesia’s mineral sector is characterized by stability and predictability, which should translate into an uninterrupted supply of CRM to the EU.

5.2. Recovery of Critical Raw Materials

REE recovery from the secondary sources, such as tailing or mining waste, has been studied for some time, and the results seem to be cost effective. For example, REE-bearing tailings from the Luossavaara–Kiirunavaara Aktiebolag mine in Kiruna (Sweden) contain about 6% of REE minerals (mostly apatite and monazite). With multiple stages of REEs separation, it is able to achieve extraction at the level of 70%–100% for heavy REE (Y, Dy, and Er) [47]. Another example is the presence of REEs in tailings of iron ore [48] with average REO content of 14.7%. The floating method gives results of 70% recovery of the REE-bearing phosphates from the tailing.
In order to reprocess the tailings, a number of geometallurgical domains were identified that may enable the design of a conceptual framework for appropriate CRM recovery techniques. Differences in mineral composition and particle size for historical and currently generated waste are related solely to the artisanal processing method. As a result, it is practically impossible to obtain tailings from local producers, which possess suitable qualitative and quantitative parameters. The starting point for the development of an appropriate technological processes for obtaining REE is the source material with a diversified mineral composition (Table 2), containing xenotime (average 2.44 wt%) and monazite (average 8.78 wt%). A characteristic feature of the tailings is the occurrence of grains with different specific densities: quartz 2.65 g/cm3; rutile 4.25 g/cm3; xenotime 4.4–5.1 g/cm3; and cassiterite 6.98–7.10 g/cm3. The presence of mineral phases of different densities allows the use of the simplest gravitational separation methods, such as using spiral concentrators and shaking tables. The use of separation techniques will make it possible to obtain suitable mineral fractions differing in specific density. The present mineral composition will yield mixtures of (1) monazite–xenotime; (2) zirconium; (3) rutile–pseudorutile–anatase; (4) cassiterite; and a light tailings fraction. An important feature of the REE phases is the limited amount of overgrowth with cassiterite and rutile, which can reduce the costs associated with feed grinding. Each subsequent stage of the technological process, including magnetic separation (e.g., for ilmenite), flotation (for monazite and xenotime) will make it possible to obtain high quality concentrates. Adequate material recovery will enable the mine to meet the high requirements set by mining regulations in Indonesia for the production of monomineral concentrates. Thus, extracted xenotime and monazite concentrates, among others, can be the starting point for advanced techniques of rare earth metals, and uranium and thorium recovery. In order to properly evaluate the project, a process sustainability assessment, as well as the economic and environmental cost analyses must be carried out.

5.3. The European Transformation

The reconstruction of the European economy due to the COVID-19 pandemic, in the context of climate-related hazards (reducing CO2 emissions by 2050), has required a transition to clean, low-carbon and sustainable energy sources, such as wind, solar, tidal and geothermal energy [49]. Climate neutrality is a challenge for European countries, especially those whose national power industry is based on old coal-fired power plants, e.g., Poland, Hungary, Czech Republic. In Central and Eastern Europe, work is underway to increase the share of renewable energy sources in the energy mix, e.g., building wind farms in the Polish Exclusive Economic Zone (EEZ) of the Baltic Sea. However, the energy transition requires constant and safe access to raw materials and technology based on critical metals, e.g., Nd, and Y (for production of permanent magnets for wind turbines); Li, and Co (for the production of lithium-ion batteries); Te, and In (for the production of photovoltaic panels); and Hf (for the production of fuel rods in nuclear power plants).
The distribution of mineral deposits is uneven, with some deposits of critical metals concentrated in several regions of the world (China—REEs, Congo—Co, and Bolivia—Li). The European Union, despite being self-sufficient in construction minerals and a few industrial minerals, is highly dependent on the import of critical metals (CRMs), including 99% LREEs (dominant supplier—China), 98% HREEs (China), 66% Sc (China), 45% Ti (China), 85% Nb (Brazil), and 78% Li (Chile) [50]. Despite medium and long-term raw material strategies at a national, as well as at a European level [51], access to new deposits is limited. This is mainly due to the need of permits, concessions, social acceptance, environmental requirements and also the time-consuming process of prospecting, identification, documentation of deposits and the construction and development of a mining plant [50]. According to the Advanced Rare-Earths Project Index, the success rate of rare earth mining projects in the world that have gone into production within the last decade is 1.5% [52]. Currently, there is no REE mining in Europe. However, resource projects are underway to discover new deposits of critical metals, including REEs and U. So far, the EURARE program has evaluated the REE resource potential of Europe [53].
The limitation of the supply of metals in the global market through, among others, an increase in export quotas, restriction of access to raw materials (China) [54,55,56], political instability in the exporting country (Democratic Republic of the Congo) and the rapid growth in consumption is becoming a driving force for conflict and geopolitical tensions [56]. Additionally, the outbreak of the global COVID-19 pandemic has contributed to a significant disruption in the value of the mineral supply chain. There are also a number of other factors determining the limitation of the supply of raw materials on the global market, such as cyber-attacks on refining plants, and disruptions to shipping. The search for new and alternative sources of metals is becoming a challenge for the EU. Due to global uncertainties about the supply chain of raw materials, many countries (including Australia, and U.S.A.) have intensified their efforts in the search for metals critical to their economies. Additionally, this has contributed to the increased integration of the U.S., Canada, Australia, EU, and Japan to deepen relationships in ensuring an uninterrupted and secure CRM supply chain.
The lack of own sources of critical metals in the European Union creates the need to seek their substitutes, increasing the recycling of scrap and waste, as well as looking for new alternative sources (programs): SCREEN, ERMA, EIT, and SPIRE [57]. The import and diversification of global suppliers is important in obtaining CRMs, as indicated by the European Commission in the Raw Materials Initiative of 2008 [58] and the 2020 Communication Critical Raw Materials Resilience: charting a path towards greater security and sustainability [11].
The lack of domestic sources of critical metals creates the need for cooperation with countries outside of Europe who possess a high potential for deposits, e.g., Indonesia. As part of the geological works in the Malay Archipelago, a group of Polish geologists made an assessment of the deposit potential of the Bangka Island (Indonesia). It was found that the material coming from mining and processing of cassiterite-bearing sands on Bangka Island is a source of many valuable metals, such as base metals (Sn, W, Sb, and Ti), radioactive elements (U and Th), critical elements (Ga, Hf, and Ta) and REEs (mainly La, Ce, Pr, Nd, Gd, Dy, Eu, Er, Yb, Sc and Y) [22]. The present study of tailings formed after the processing of cassiterite-bearing sediments revealed the presence of anomalous contents of HREE above 2 wt%, U 0.16 wt% and Th 0.94 wt%. In the tailings, the main carrier of these metals is xenotime, which can reach up to 17.55 wt%.

5.4. A Circular Economy

China has a globally dominant rare earth processing capacity. Trade tensions between China and the United States may contribute to a deficit or temporary oversupply of rare earth metals to limit global competition. Uncertainty in the critical metals market creates a need to verify the potential of Bangka Island, where rich anthropogenic accumulations of HREEs, U and Th were found. The global race for critical metals, including the HREEs is the “new economic war” of the 21st century.
The Bangka and Belitung Islands are the main tin producers in Indonesia. They owe their mineralogical wealth to the collision of the Sibamasu and Indochina blocks, which resulted in the formation of S-type tin-bearing granitoids by crustal melting [59,60]. The Bangka Island granitoid formations are characterized by the presence of mineralized Sn-W-REE zones [60], which subsequently underwent severe chemical weathering (from the Neogene to the present day), leading to the formation of secondary concentrations of heavy minerals (including REE-bearing minerals) in the form of onshore and offshore scatter deposits [28,29,30]. The result of sediment processing is the formation of mineral-rich critical metal bearing tailings. Mining activities carried out by state-owned companies are focused exclusively on the mining and processing of cassiterite. According to the International Tin Association [61], tin mining in Indonesia in 2019 was at 77.5 kt. However, no selective separation of heavy minerals has been conducted on the island. There is no information about the resulting mining waste.
The fragmented structure of artisanal mining, a lack of mining efficiency and skilled manpower means that the island’s raw material potential is irretrievably lost. The rapidly increasing number of illegal pits further contributes to the devastation of the local ecosystem. As indicated by Syarbaini’s research [62], the increase in illegal mining and tin processing contributes to an increase in the risk of radioactive substance contamination.
Leaving radioactive elements in tailings can cause significant environmental and waste management problems. Additionally, it can be a potential source of radiation exposure for workers and the population living near the landfills [49]. Although methods exist to store this type of radioactive waste, they are not used on a large scale for Bangka Island tailings, especially those generated from artisanal mining and processing. The local practice is to leave the processed waste in an open environment near the tailings facility. Waste stored in this manner and unprotected can generate both airborne dust and, through rainfall, particles of radioactive minerals can be washed away and contaminate the waters of surrounding reservoirs and rivers. In both cases, internal radiation exposure of local residents may occur [49]. It seems reasonable that the waste accumulated in this way would be deprived of radioactive elements. The implementation of appropriate practices and standards in accordance with the values adhered to by the European Union may improve the effectiveness of exploitation and processing of mineral resources on the tin islands of Bangka and Belitung. The sustainable development and implementation of a circular economy strategy will allow a complete utilization of the tailings. The development of knowledge-based processing technology will ensure the production of high quality HREEs, U, and Th concentrates.

6. Conclusions

Sustainable development in the European Union requires constant access to mineral resources, especially those used for modern, low-carbon technologies. The limited number of CRM deposits forces the European Union to take action to ensure raw material security through diversification of metal supply sources. China’s monopoly on rare earth elements and the unstable economic situation due to COVID-19 require a search for the best and least expensive solutions. Tailings may be of particular importance for obtaining metals. Each year, about 8–10 billion tons of tailings are produced, which can be a source of many metals.
The Indonesian island of Bangka is one of the world’s major suppliers of tin to the global market. The production of cassiterite concentrates leads to the formation of a polymineral tailings containing monazite (1.55–21.23 wt%), xenotime (1.55–21.23 wt%), zircon (1.87–64.35 wt%), rhytulite (1.82–19.97 wt%), ilmenite (1.88–22.20 wt%) and others. Research conducted by Polish geologists revealed high contents of metals, including the most critical HREEs, Gd2O3 (1.42–7.16 wt%), Dy2O3 (2.28–11.21 wt%), Er2O3 (2.44–7.85 wt%), and Yb2O3 (1.71–7.10 wt%), as well as U (up to 0.11 wt%), Th (0.75 wt%), and Sc (132 ppm). Despite the high deposit potential of the tailings, this material is irretrievably lost. It should be noted that tin production on many other Indonesian islands (e.g, Belitung, and Singkep) indicates that post-cassiterite tailings could be a significant source of HREE.
A preliminary conceptual framework was developed for Bangka Island mine tailings, taking into account geometallurgical domains (e.g., density and mineralogical and chemical variability, presence of inclusions and overgrowths and others). The results obtained may be helpful for the systematic development of a technological, economic and environmental model for CRM acquisition. The new data fill another gap for the recovery of metals and critical minerals from tailings as a source of secondary raw materials.
This requires further detailed research. The example of the Bankga Island tailings highlights the extent and significance of such a potential REE resource base. The development of a technology based on a circular economy and zero-waste principle can contribute to the acquisition of rich mineral concentrates. Improving the efficiency of the technological process will improve environmental safety by reducing emissions of radioactive substances and will reduce the poverty level of the local mining community. The diversification of critical metals sources is one of the goals of the Green Deal and of the energy transition of Europe. EU–Indonesian bilateral cooperation can bring mutual benefits by ensuring the security of raw materials, increasing awareness among local communities of radiogenic risks and environmental protection, increasing the supply of metals on the world market and boosting Bangka’s GDP.

Author Contributions

K.Z. conducted field work on Bangka Island; K.Z., K.S., S.W. and R.M. conceived the structure of manuscript. K.Z. designed all the figures and wrote the manuscript. K.Z., K.S., S.W. and R.M. reviewed and edited the article. All authors have read and agreed to the published version of the manuscript.

Funding

This research was supported by funds from Polish Geological Institute-National Research Institute. No. 62.9012.2111.00.0.

Data Availability Statement

Not availability.

Acknowledgments

Authors would like to express their gratitude towards the reviewers for their useful remarks and comments which allowed the authors to improve this paper.

Conflicts of Interest

The authors declare no conflict of interest.

References

  1. Anderson, T.R.; Hawkins, E.; Jones, P.D. CO2, the greenhouse effect and global warming: From the pioneering work of Arrhenius and Callendar to today’s Earth System Models. Endeavour 2016, 40, 178–187. [Google Scholar] [CrossRef] [PubMed] [Green Version]
  2. European Commission. Communication from the Commission to the European Parliament, the Council, the European Economic and Social Committee and the Committee of the Regions: The European Green Deal; COM/2019/640 final; European Commission: Brussels, Belgium, 2019. [Google Scholar]
  3. International Resource Panel; Oberle, B.; Bringezu, S.; Hatfield-Dodds, S.; Hellweg, S.; Schandl, H.; Clement, J.; Cabernard, L.; Che, N.; Chen, D.; et al. Global Resources Outlook 2019: Natural Resources for the Future We Want; United Nations Environment Programme: Nairobi, Kenya, 2019; ISBN 978-92-807-3741-7. [Google Scholar]
  4. European Environmental Agency. EEA Greenhouse Gas—Data Viewer. Available online: https://www.eea.europa.eu/data-and-maps/data/data-viewers/greenhouse-gases-viewer (accessed on 7 May 2021).
  5. Organisation for Economic Co-operation and Development (OECD). 2019 Global Material Resources Outlook to 2060: Economic Drivers and Environmental Consequences; OECD Publishing: Paris, France, 2019. [Google Scholar] [CrossRef]
  6. European Strategy and Policy Analysis System. Global Trends to 2030: Can the EU Meet the Challenges Ahead? European Commission: Brussels, Belgium, 2015. [Google Scholar] [CrossRef]
  7. Owen, J.R.; Kemp, D.; Lèbre, É.; Svobodova, K.; Murillo, G.P. Catastrophic tailings dam failures and disaster risk disclosure. Int. J. Disaster Risk Reduct. 2020, 42, 101361. [Google Scholar] [CrossRef]
  8. European Commission. Communication from the Commission to the European Parliament, the Council, the European Economic and Social Committee and the Committee of the Regions: A New Industrial Strategy for Europe; COM (2020) 102 final; European Commission: Brussels, Belgium, 2020. [Google Scholar]
  9. European Commission. Communication from the Commission to the European Parliament, the Council, the European Economic and Social Committee and the Committee of the Regions: Updating the 2020 New Industrial Strategy: Building a Stronger Single Market for Europe’s Recovery; COM(2021) 350 final; European Commission: Brussels, Belgium, 2021. [Google Scholar]
  10. European Commission. Shaping Europe’s Digital Future; European Commission: Brussels, Belgium, 2020; ISBN 978-92-76-16362-6. [Google Scholar] [CrossRef]
  11. European Commission. Communication from the Commission to the European Parliament, the Council, the European Economic and Social Committee and the Committee of the Regions: Critical Raw Materials Resilience: Charting a Path towards Greater Security and Sustainability; COM (2020) 474 final; European Commission: Brussels, Belgium, 2020. [Google Scholar]
  12. European Commission. Communication from the Commission to the European Parliament, the Council, the European Economic and Social Committee and the Committee of the Regions: Tackling the Challenges in Commodity Markets and on Raw Materials; COM (2011) 25 final; European Commission: Brussels, Belgium, 2011. [Google Scholar]
  13. European Commission. Communication from the Commission to the European Parliament, the Council, the European Economic and Social Committee and the Committee of the Regions: On the Review of the List of Critical Raw Materials for the EU and the Implementation of the Raw Materials Initiative; COM (2014) 297 final; European Commission: Brussels, Belgium, 2014. [Google Scholar]
  14. European Commission. Communication from the Commission to the European Parliament, the Council, the European Economic and Social Committee and the Committee of the Regions: On the 2017 List of Critical Raw Materials for the EU; COM (2017) 490 final; European Commission: Brussels, Belgium, 2017. [Google Scholar]
  15. Stegen, K.S. Heavy rare earths, permanent magnets, and renewable energies: An imminent crisis. Energy Policy 2015, 79, 1–8. [Google Scholar] [CrossRef]
  16. Yasukawa, K.; Nakamura, K.; Fujinaga, K.; Machida, S.; Ohta, J.; Takaya, Y.; Kato, Y. Rare-earth, major, and trace element geochemistry of deep-sea sedimentsin the Indian Ocean: Implications for the potential distributionof REY-rich mud in the Indian Ocean. Geochem. J. 2015, 49, 621–635. [Google Scholar] [CrossRef]
  17. Euratom Supply Agency. Annual Report 2019; Euratom Supply Agency: Luxembourg, 2020. [Google Scholar] [CrossRef]
  18. Suryantoro, S.; Manaf, M.H. The Indonesian Energy and Mineral Resources Development and Its Environmental Management to Support Sutainable National Economic Development. CCNM Global Forum on International Investment. In Proceedings of the Conference on Foreign Direct Investment and the Environment, Paris, France, 7–8 February 2002. [Google Scholar]
  19. Szamałek, K.; Konopka, G.; Zglinicki, K.; Marciniak-Maliszewska, B. New potential source of rare earth elements. Miner. Resour. Manag. 2013, 29, 59–76. [Google Scholar] [CrossRef]
  20. Rybak, J.; Adigamov, A.; Kongar-Syuryun, C.; Khayrutdinov, M.; Tyulyaeva, Y. Renewable Resource Technologies in Mining and Metallurgical Enterprises Providing Environmental Safety. Minerals 2021, 11, 1145. [Google Scholar] [CrossRef]
  21. Cuesta-Lopez, S.; Barros, R.; Ulla-Maija, M.; Willersinn, S.; Xiao Sheng, Y. Mapping the Secondary Resources in the EU (Mine Tailings, Industrial Waste); Horizon 2020 Programme, EC; MSP-REFRAM: Brussels, Belgium, 2016; p. 35. [Google Scholar]
  22. Zglinicki, K.; Szamałek, K.; Wolkowicz, S. Critical Minerals from Post-Processing Tailing. A Case Study from Bangka Island, Indonesia. Minerals 2021, 11, 352. [Google Scholar] [CrossRef]
  23. Schwartz, M.O.; Rajah, S.S.; Askury, S.K.; Putthapiban, P.; Djaswadi, S. The Southeast Asian Tin Belt. Earth Sci. Rev. 1995, 38, 95–293. [Google Scholar] [CrossRef]
  24. Cobbing, E.J.; Pitfield, P.E.J.; Darbyshire, D.P.F.; Mallick, D.I.J. The Granites of the South-East Asian Tin Belt. J. Geol. Soc. 1986, 143, 537–550. [Google Scholar] [CrossRef]
  25. Wai-Pan Ng, S.; Whitehouse, M.J.; Roselee, M.H.; Teschner, C.; Murtadha, S.; Oliver, G.J.H.; Ghani, A.A.; Chang, S. Late Triassic granites from Bangka, Indonesia: A continuation of the Main Range granite province of the South-East Asian Tin Belt. J. Asian Earth Sci. 2017, 138, 548–561. [Google Scholar]
  26. Ko, U. KPreliminary synthesis of the geology of Bangka Island, Indonesia. Bull. Geol. Soc. Malays. 1986, 20, 81–96. [Google Scholar]
  27. Aleva, G.J.J. The plutonic igneous rocks from Billiton. Indonesia. Geol. Mijnb. 1960, 39, 427–436. [Google Scholar]
  28. Harjanto, S.; Virdhian, S.; Afrilinda, E. Characterization of Indonesia Rare Earth Minerals and Their Potential Processing Techniques. J. Rare Earth 2013, 52, 99–108. [Google Scholar]
  29. Aryanto, N.C.D.; Kamiludin, U. The Content of Placer Heavy Mineral and Characteristics of REE at Toboali Coast and Its Surrounding Area. Bangka Belitung Province. Bull. Mar. Geol. 2016, 31, 45–54. [Google Scholar] [CrossRef] [Green Version]
  30. Rohendi, E.; Aryanto, N.C.D. Seafloor Sediment Characteristics and Heavy Mineral Occurences at Betumpak Cape and Adjacent Area, Bangka Strait, Bangka Belitung Province. Bull. Mar. Geol. 2012, 27, 7–18. [Google Scholar] [CrossRef]
  31. Wentworth, C.K. A scale of grade and class terms for clastic sediments. J. Geol. 1922, 30, 377–392. [Google Scholar] [CrossRef]
  32. Blott, S.J.; Pye, K. GRADISTAT: A grain size distribution and statistics package for the analysis of unconsolidated sediments. Earth Surf. Process. Landf. 2001, 26, 1237–1248. [Google Scholar] [CrossRef]
  33. Degen, T.; Sadki, M.; Bron, E.; König, U.; Nénert, G. The HighScore suite. Powder Diffr. 2014, 29, 13–18. [Google Scholar] [CrossRef] [Green Version]
  34. Pouchou, J.L.; Pichoir, F. “PAP” (phi-rho-z) procedure for improved quantitative microanalysis. In Microbeam Analysis; Armstrong IT, Ed.; San Francisco Press: San Francisco, CA, USA, 1985; pp. 104–106. [Google Scholar]
  35. Zglinicki, K.; Szamałek, K. Monazite-bearing post processing wastes and their potential economic significance. Miner. Resour. Manag. 2020, 36, 37–58. [Google Scholar] [CrossRef]
  36. Förster, H.-J. The chemical composition of REE-Y-Th-U-rich accessory minerals in peraluminous granites of the Erzgebirge-Fichtelgebirge region, Germany. Part II: Xenotime. Am. Mineral. 1998, 83, 1302–1315. [Google Scholar] [CrossRef]
  37. Kosticin, N.; McNaughton, N.J.; Griffin, B.J.; Fletcher, I.R.; Groves, D.I.; Rasmussen, B. Textural and geochemical discrimination between xenotime of different origins in the Archaean Witwatersrand Basin, South Africa. Geochim. Cosmochim. Acta 2003, 67, 709–731. [Google Scholar] [CrossRef]
  38. Pyle, J.M.; Spear, F.S.; Rudnick, R.L.; McDonough, W.F. Monazite-xenotime-garnet equilibrium in metapelites and a new monazite-garnet thermometer. J. Petrol. 2001, 42, 2083–2107. [Google Scholar] [CrossRef]
  39. McDonough, W.F.; Sun, S.S. The composition of the Earth. Chem. Geol. 1995, 67, 1050–1056. [Google Scholar] [CrossRef]
  40. Hamzah, Y.; Mardhiansyah, M.; Firdaus, L.N. Characterization of Rare Earth Elements in Tailing of Ex-Tin Mining Sands from Singkep Island, Indonesia. Aceh Int. J. Sci. Technol. 2018, 7, 131–137. [Google Scholar] [CrossRef]
  41. Irzon, R.; Sendjadja, P.; Kurnia, K.; Imtihanah, I.; Soebandrio, J. Kandungan rare earth elements dalam tailing tambang timah di pulau Singkep. J. Geol. Sumberd. Miner. 2014, 15, 143–151. [Google Scholar]
  42. Setijadji, L.D.; Warmada, I.W.; Imae, A.; Sanematsu, K. Investigation on Rare Earth Elements Mineralization in Indonesia. In Proceedings of the 2nd Regional Conference Interdisciplinary Research on Natural Resources and Materials Engineering, Yogyakarta, Indonesia, 6–7 August 2009; pp. 53–58. [Google Scholar]
  43. Hetherington, C.J.; Harlov, D.E. Metasomatic thorite and uraninite inclusions in xenotime and monazite from granitic pegmatites, Hidra anorthosite massif, southwestern Norway: Mechanics and fluid chemistry. Am. Mineral. 2008, 93, 806–820. [Google Scholar] [CrossRef]
  44. García, A.C.; Latifi, M.; Amini, A.; Chaouki, J. Separation of Radioactive Elements from Rare Earth Element-Bearing Minerals. Metals. 2020, 10, 1524. [Google Scholar] [CrossRef]
  45. Rudnick, R.L.; Gao, S. Composition of the continental crust. In Treatise on Geochemistry; Rudnick, R.L., Holland, H.D., Turekian, K.K., Eds.; Elsevier: Amsterdam, The Netherlands, 2003; pp. 1–64. [Google Scholar] [CrossRef]
  46. Tin Market—Growth, Trends, COVID-19 Impact, and Forecasts (2021–2026); Report; Mordor Intelligence: Telangana, India, 2021.
  47. Peelman, S.; Kooijman, D.; Sietsma, J.; Yang, Y. Hydrometallurgical Recovery of Rare Earth Elements from Mine Tailings and WEEE. J. Sustain. Metall. 2018, 4, 367–377. [Google Scholar] [CrossRef] [Green Version]
  48. Peiravi, M.; Dehghani, F.; Ackah, L.; Baharlouei, A.; Godbold, J.; Liu, J.; Mohanty, M.; Ghosh, T. A Review of Rare-Earth Elements Extraction with Emphasis on Non-convencional Sources: Coal and Coal Byproducts, Iron Ore, Tailings, Apatite, and Phosphate Byproducts. Min. Metall. Explor. 2020, 38, 1–26. [Google Scholar] [CrossRef]
  49. World Wide Fund for Nature (WWF). 2014 Critical Materials for the Transition to a Sustainable Energy Future; WWF International: Gland, Switzerland, 2014; ISBN 978-2-940443-74-1. [Google Scholar]
  50. European Commission. EIP on Raw Materials: Raw Materials Scoreboard 2021; European Commission: Brussels, Belgium, 2021. [Google Scholar] [CrossRef]
  51. EuroGeoSurveys. Strategic Research & Innovation Agenda; EuroGeoSurveys: Brussels, Belgium, 2021. [Google Scholar]
  52. The White House. Building Resilient Supply Chains, Revitalizing American Manufacturing, and Fostering Broad-Based Growth: 100-Day Reviews under Executive Order 14017; The White House: Washington, DC, USA, 2021. [Google Scholar]
  53. Goodenough, K.M.; Wall, F.; Merriman, D. The rare earth elements: Demand, global resources, and challenges for resourcing future generations. Nat. Resour. Res. 2018, 27, 201–216. [Google Scholar] [CrossRef] [Green Version]
  54. Wübbeke, J. Rare earth elements in China: Policies and narratives of reinventing an industry. Resour. Policy 2013, 38, 384–394. [Google Scholar] [CrossRef]
  55. He, Y. Reregulation of China’s rare earth production and export. Int. J. Emerg. Mark. 2014, 9, 236–256. [Google Scholar] [CrossRef]
  56. Mancheri, N. World trade in rare earths, Chinese export restrictions, and implications. Resour. Policy 2015, 46, 262–271. [Google Scholar] [CrossRef]
  57. Girtan, M.; Wittenberg, A.; Grilli, M.L.; de Oliveira, D.P.S.; Giosuè, C.; Ruello, M.L. The Critical Raw Materials Issue between Scarcity, Supply Risk, and Unique Properties. Materials 2021, 14, 1826. [Google Scholar] [CrossRef]
  58. European Commission. Communication from the Commission to the European Parliament and the Council: The Raw Materials Initiative—Meeting Our Critical Needs for Growth and Jobs in Europe; COM (2018) 699 Final; European Commission: Brussels, Belgium, 2008. [Google Scholar]
  59. Jones, M.T.; Reed, B.L.; Doe, B.R.; Lanphyre, N.A. Age of tin mineralization and plumbotectonics, Belitung, Indonesia. Econ. Geol. 1977, 72, 745–752. [Google Scholar] [CrossRef]
  60. Searle, M.P.; Whitehouse, M.J.; Robb, L.J.; Ghani, A.A.; Hutchison, C.S.; Sone, M.; Wai-Pan Ng, S.; Roselee, M.H.; Chung, S.-L.; Oliver, G.J.H. Tectonic evolution of the Sibumasu-Indochina terrane collision zone in Thailand and Malaysia: Constraints from new U-Pb zircon chronology of SE Asian tin granitoids. J. Geol. Soc. Lond. 2012, 169, 489–500. [Google Scholar] [CrossRef]
  61. International Tin Association. Global Resources & Reserves: Security of Long-Term Tin Supply 2020 Update; International Tin Association: Hertfordshire, UK, 2020. [Google Scholar]
  62. Syarbaini Warsona, A.; Iskandar, D. Natural Radioactivity in Some Food Crops from Bangka-Belitung Islands, Indonesia. Atom Indones. 2014, 40, 27–32. [Google Scholar] [CrossRef]
Figure 1. Geological map of Bangka Island (modified from [23,24,25,26,27]).
Minerals 12 00044 g001
Figure 2. Mining on Bangka Island: (A) open-pit cassiterite mining; (B) marine cassiterite extraction using primitive mining platforms.
Minerals 12 00044 g002
Figure 3. Tailings on Bangka Island; (A) state-owned tailings dump with warnings indicating radiation hazard; (B) illegal mining pit with pumps and tubs for washing cassiterite-enriched clastic sediments; (C) tailing resulting from processing and washing of cassiterite sands. By-product used to fill the pit; (D) jute bags of tailing in a domestic dump at a mineral broker/seller (compradores).
Minerals 12 00044 g003
Figure 4. Grain size distribution in tailings samples; (A) fine-grained, moderately sorted tailings from Belinyu; (B) fine-grained, moderately sorted tailings from Jurung; (C) medium-grained, poorly sorted tailings from Lubuk; (D) medium-grained, moderately sorted tailings from Nyelanding.
Minerals 12 00044 g004
Figure 5. Backscattered electron images of xenotime grains. (A) Anhedral xenotime with monazite and a few thorite inclusions visible; (B) xenotime with cassiterite; (C) twin xenotime, containing several inclusions of thorite and uranothorite; (D) subhedral xenotime with cleavage directions visible and some fractures, without U and Th inclusions; (E) anhedral xenotime with irregular composition, containing cleavage directions visible and some fractures; (F) xenotime with oscillatory zoning.
Minerals 12 00044 g005
Figure 6. Ternary plots of analyses. (A) LREE-HREE-Y; (B) LREE-Th + U-HREE + Y in xenotime.
Minerals 12 00044 g006
Figure 7. Chondrite-normalized REE patterns for selected xenotime from samples. Chondrite data are from [39].
Minerals 12 00044 g007
Figure 8. Backscattered electron images of xenotime and thorite-uranothorite grains. (A) xenotime with oscillatory zoning boundary with a thorite inclusion in the center. The core has an irregular composition; (B) xenotime with a zoning rim; (C) euhedral xenotime with a thorite inclusion. The high porosity of the grain; (D) subhedral xenotime with a large inclusion of thorite-uranothorite; (E) inclusion of a thorite grain with high porosity; (F) irregular composition of a thorite inclusion.
Minerals 12 00044 g008
Figure 9. Correlation graphs: positive correlation U vs. La (a) and negative correlation SiO2 vs. La (b) (n = 15).
Minerals 12 00044 g009
Table 1. Conditions EMP analyses.
ElementStandardAnalytical LineCrystalDetection Limit in wt%Standard Deviation σ in wt%
SiWollastoniteTAP0.010.01
YY glassLPET0.03–0.040.25–0.29
LuLu glassLLIF0.120.11
HoHoPO4LLIF0.120.09–0.10
YbYbPO4LLIF0.060.07–0.09
TmTm glassLLIF0.040.05
ErErPO4LLIF0.04–0.050.07–0.09
DyDyPO4LLIF0.04–0.050.08–0.11
TbTbPO4LLIF0.05–0.070.04
PApatiteLPET0.020.20–0.22
ThTh glassLPET0.04–0.050.04–0.07
UU glassLPET0.04–0.060.05–0.07
CaWollastoniteLPET0.010.01
GdGdPO4LLIF0.030.04–0.07
NdNdPO4LLIF0.05–0.060.05–0.06
EuEuPO4LLIF0.03–0.060.03
SmSmPO4LLIF0.070.06–0.09
PbPyromorphiteLPET0.03–0.040.04
Table 2. Mineral composition of selected tailings samples from Bangka Island. X-ray diffraction analyses. In brackets, the expanded uncertainty.
MineralSample in wt%
Bngk 1Bngk 3Bngk 5Bngk 7Bngk 9Bngk 13Bngk 27Bngk 30Bngk 31Bngk 32Bngk 33Average n = 35Szamałek et al., 2013 [19]Zglinicki et al., 2020 [35]
Zircon20.65 (25)20.49 (26)7.32 (17)12.57 (18)30.48 (24)1.87 (43)59.01 (29)64.35 (28)22.69 (22)21.06 (42)22.98 (37)24.0416.92 (21)5.38 (94)
Xenotime 2.89 (11)2.59 (11)1.78 (47)1.62 (11)1.59 (51)0.79 (30)1.59 (46)1.91 (54)1.34 (18)2.11 (31)2.03 (13)2.4417.55 (26)4.38 (91)
Monazite2.31 (14)2.09 (80)5.22 (17)5.33 (12)1.55 (13)4.27 (99)n.d.4.19 (27)9.32 (23)9.30 (87)9.07 (50)8.7821.23 (24)4.71 (87)
Rutile5.41 (18)4.78 (17)19.97 (45)6.02 (15)5.87 (16)1.82 (27)8.51 (21)6.50 (20)6.95 (41)7.37 (21)6.73 (63)5.083.77 (20)2.70 (75)
Anatase0.58 (30)0.45 (29)1.92 (52)1.46 (15)1.32 (13)0.55 (94)n.d.n.d.0.62 (13)1.11 (75)0.66 (23)1.240.92 (50)1.54 (29)
Pseudorutile26.32 (73)27.66 (78)41.7 (11)29.48 (33)n.d.64.46 (74)n.d.n.d.10.17 (72)9.61 (53)9.52 (99)25.297.19 (73)24.61 (56)
Ilmenite9.61 (26)9.01 (27)2.35 (27)7.34 (28)10.81 (27)22.20 (10)1.88 (96)2.59 (12)16.94 (23)15.44 (37)16.02 (10)10.1716.90 (30)5.26 (19)
Cassiterite3.73 (63)3.89 (60)1.90 (53)1.48 (36)10.66 (11)0.61 (34)10.56 (94)16.41 (11)15.46 (34)9.57 (13)9.83 (30)5.988.46 (10)2.18 (34)
Quartz23.84 (30)24.57 (32)17.80 (37)15.55 (23)24.75 (34)3.46 (16)2.20 (22)n.d.9.91 (94)17.59 (74)15.88 (50)22.71n.d.40.28 (34)
Pyriten.d.n.d.n.d.9.94 (16)9.95 (21)n.d.5.10 (19)2.08 (12)1.33 (91)1.60 (14)1.75 (42)3.614.68 (14)n.d.
Marcasiten.d.n.d.n.d.1.53 (72)n.d.n.d.11.15 (23)n.d.1.44 (87)1.55 (15)1.49 (13)4.142.39 (15)n.d.
Tourmaline4.65 (24)4.48 (25)n.d.4.10 (21)3.02 (13)n.d.n.d.1.96 (13)3.83 (29)3.69 (23)4.05 (11)8.33n.d.2.74 (12)
Topazn.d.n.d.n.d.3.58 (43)n.d.n.d.n.d.n.d.n.d.n.d.n.d.6.53n.d.6.18 (18)
n.d.—not detected.
Table 3. Variability of zonal xenotime chemistry along the study profile. EMP analysis.
Sample.A-z16
Analysis No.19/1. Border19/2.19/3.19/4.19/5.19/6.19/7.19/8.19/9.19/10. 19/11. Core
Y2O3 (wt%)52.5244.4840.9341.3341.1539.9041.0038.6439.2240.5939.07
SiO2 0.160.310.420.470.610.490.500.340.430.760.91
P2O525.2934.1133.5533.6433.2733.7033.7633.5733.0232.7132.03
CaO0.000.040.080.080.080.090.080.060.020.070.06
PbO0.000.000.010.000.070.040.010.000.020.040.05
Pr2O30.050.120.000.030.000.070.040.100.000.060.10
La2O30.000.000.000.060.000.060.000.000.000.020.00
Nd2O30.000.180.160.230.110.240.210.260.210.220.25
Ce2O30.060.000.030.080.090.050.030.130.000.040.01
Sm2O30.030.900.850.820.770.890.810.940.980.810.81
Eu2O30.000.000.000.000.000.000.000.000.000.000.00
Gd2O31.435.085.265.004.735.295.406.045.695.145.07
Tb2O30.000.000.000.000.000.000.000.000.000.000.00
Dy2O32.285.716.946.656.267.086.318.017.496.476.67
Ho2O30.530.851.171.051.051.201.011.261.161.191.18
Er2O32.483.083.913.703.683.983.584.494.263.714.14
Yb2O33.212.974.303.943.934.274.044.484.344.034.45
Lu2O30.910.881.301.381.101.191.101.351.171.021.22
Tm2O30.000.000.000.000.000.000.000.000.000.000.00
UO20.210.361.681.902.281.861.641.141.462.692.43
ThO20.000.140.410.560.800.590.490.370,511.061.40
Total99.0699.13101.04100.9399.98101.02100.05101.2299.91100.6799.86
Atoms per Formula Unit (apfu). Based on 4 Oxygens
Y0.9150.8000.7440.7500.7520.7250.7450.7070.7250.7460.729
Si0.0050.0100.0140.0160.0210.0170.0170.0120.0150.0260.032
P0.9780.9780.9710.9710.9680.9750.9760.9770.9720.9560.951
Ca0.0000.0010.0030.0030.0030.0030.0030.0020.0010.0030.002
Pb0.0000.0000.0000.0000.0010.0000.0000.0000.0000.0000.000
Pr0.0010.0010.0000.0000.0000.0010.0000.0010.0000.0010.001
La 0.0000.0000.0000.0010.0000.0010.0000.0000.0000.0000.000
Nd0.0000.0020.0020.0030.0010.0030.0030.0030.0030.0030.003
Ce0.0010.0000.0000.0010.0010.0010.0000.0020.0000.0010.000
Sm0.0000.0110.0100.0100.0090.0100.0100.0110.0120.0100.010
Eu0.0000.0000.0000.0000.0000.0000.0000.0000.0000.0000.000
Gd0.0160.0570.0600.0560.0540.0600.0610.0690.0660.0590.059
Tb0.0000.0000.0000.0000.0000.0000.0000.0000.0000.0000.000
Dy0.0240.0620.0760.0730.0690.0780.0690.0890.0840.0720.075
Ho0.0060.0090.0130.0110.0110.0130.0110.0140.0130.0130.013
Er0.0260.0330.0420.0400.0400.0430.0380.0480.0470.0400.046
Yb0.0320.0310.0440.0410.0410.0440.0420.0470.0460.0420.048
Lu0.0090.0090.0130.0140.0110.0120.0110.0140.0120.0110.013
Tm0.0000.0000.0000.0000.0000.0000.0000.0000.0000.0000.000
U0.0020.0030.0130.0140.0170.0140.0120.0090.0110.0210.019
Th0.0000.0010.0030.0040.0060.0050.0040.0030.0040.0080.011
Total2.0032.0011.9971.9941.9961.9941.9941.9941.9972.0012.000
P + Si0.9830.9890.9850.9870.9890.9910.9930.9880.9870.9820.983
XYPO40.900.790.740.740.750.720.750.700.720.730.72
Xbrb0.000.000.010.010.010.010.010.000.000.010.00
Y + REE1.031.011.011.000.990.990.991.001.011.001.00
Th/U0.000.400.250.300.360.320.310.330.360.400.59
U/Th0.002.514.013.322.793.083.273.012.802.481.70
Y/Ho165.8287.3758.5465.8765.5855.6467.9351.3256.5857.0855.40
XYPO4—Mole fraction YPO4 = Y/D. Xbrb—Mole fraction brabantite = (2Ca)/D; Where D = [La + Ce + Sm + Pr + Nd + Gd + Dy + Yb + Er + Ho + Y + (2Ca) + (Th + U + Pb-Ca)] [38].
Table 4. Chemical composition of xenotime with heterogeneous internal structure. EMP analysis.
Sample A-z1A-z7Z-16Z-27Z-30Z-42Z-45Z-65Z-83Min Max Mean
Analysis No.1/1.1/2.15/1.16/1.20/7.20/8.40/1.41/1.3/1.9/1.20/2.20/3.21/1.22/1.33/1.34/1.40/1.41/1.(n = 118)(n = 118)(n = 118)
Y2O3 (wt%)41.3340.5943.7544.1639.9639.6940.8742.8041.9941.8738.6639.0641.9138.9541.8643.0640.8742.8030.8352.5241.16
SiO2 0.320.420.110.110.540.500.570.060.170.490.960.890.402.450.380.070.570.060.002.450.34
P2O535.7435.3836.5736.5233.0432.9233.4134.4034.2433.8132.4132.0433.9130.9734.1134.3233.4134.4030.5037.1034.78
CaO0.020.020.010.010.060.020.070.040.030.020.030.040.070.000.050.030.070.040.000.200.03
PbO0.000.020.000.000.040.000.010.000.030.010.020.040.010.020.060.000.010.000.000.190.02
Pr2O30.000.000.000.000.020.000.000.040.040.040.060.000.000.000.060.160.000.040.000.160.02
La2O30.000.000.000.000.030.000.040.030.010.010.000.000.040.000.020.000.040.030.000.170.01
Nd2O30.360.360.050.110.200.260.360.200.320.350.240.200.340.360.300.350.360.200.001.210.28
Ce2O30.000.000.000.000.090.000.130.050.030.090.060.020.150.090.050.000.130.050.000.400.06
Sm2O30.690.640.420.590.860.830.610.540.670.420.750.800.540.700.700.680.610.540.032.180.63
Eu2O30.000.000.000.000.000.000.000.000.000.000.000.000.000.000.000.000.000.000.000.190.00
Gd2O32.442.562.152.615.305.323.884.152.431.765.075.254.214.764.404.493.884.151.427.163.19
Tb2O30.620.640.500.590.000.000.000.000.680.510.000.000.000.000.000.000.000.000.001.240.46
Dy2O35.425.644.815.106.927.146.146.026.084.396.676.485.925.536.095.936.146.022.2811.215.93
Ho2O30.900.970.720.781.101.191.071.071.451.331.171.061.211.021.201.181.071.070.532.291.10
Er2O34.094.073.923.673.933.984.024.274.634.643.963.884.073.674.114.264.024.272.447.854.31
Yb2O34.604.234.333.824.084.125.394.844.295.454.164.034.622.704.254.395.394.841.717.104.36
Lu2O31.221.131.090.891.321.361.401.660.590.861.291.281.321.071.191.141.401.660.152.111.11
Tm2O30.720.730.660.620.000.000.000.000.630.680.000.000.000.000.000.000.000.000.001.210.50
UO20.781.670.370.061.731.741.790.441.080.602.692.701.114.161.040.131.790.440.004.160.95
ThO20.831.100.650.180.830.640.700.000.461.131.521.280.654.010.610.160.700.000.004.010.63
Total100.12100.24100.1199.82100.0899.76100.47100.5999.8698.4599.7199.01100.45100.34100.5100.36100.47100.59---
Atoms per Formula Unit (apfu). Based on 4 Oxygens
Y0.7320.7230.7640.7720.7360.7340.7450.7700.7610.7650.7180.7320.7580.7220.7550.7760.7450.770---
Si0.0110.0140.0040.0040.0190.0170.0200.0020.0060.0170.0340.0310.0140.0850.0130.0020.0200.002---
P1.0081.0031.0161.0150.9680.9690.9690.9850.9870.9830.9580.9550.9760.9140.9790.9840.9690.985---
Ca0.0010.0010.0000.0000.0020.0010.0030.0010.0010.0010.0010.0020.0030.0000.0020.0010.0030.001---
Pb0.0000.0000.0000.0000.0000.0000.0000.0000.0000.0000.0000.0000.0000.0000.0010.0000.0000.000---
Pr0.0000.0000.0000.0000.0000.0000.0000.0000.0010.0010.0010.0000.0000.0000.0010.0020.0000.000---
La 0.0000.0000.0000.0000.0000.0000.0010.0000.0000.0000.0000.0000.0010.0000.0000.0000.0010.000---
Nd0.0040.0040.0010.0010.0020.0030.0040.0020.0040.0040.0030.0030.0040.0040.0040.0040.0040.002---
Ce0.0000.0000.0000.0000.0010.0000.0020.0010.0000.0010.0010.0000.0020.0010.0010.0000.0020.001---
Sm0.0080.0070.0050.0070.0100.0100.0070.0060.0080.0050.000.0100.0060.0080.0080.0080.0070.006---
Eu0.0000.0000.0000.0000.0000.0000.0000.0000.0000.0000.0000.0000.0000.0000.0000.0000.0000.000---
Gd0.0270.0280.0230.0280.0610.0610.0440.0470.0270.0200.0590.0610.0470.0550.0490.0500.0440.047---
Tb0.0070.0070.0050.0060.0000.0000.0000.0000.0080.0060.0000.0000.0000.0000.0000.0000.0000.000---
Dy0.0580.0610.0510.0540.0770.0800.0680.0660.0670.0490.0750.0730.0650.0620.0670.0650.0680.066---
Ho0.0100.0100.0080.0080.0120.0130.0120.0120.0160.0150.0130.0120.0130.0110.0130.0130.0120.012---
Er0.0430.0430.0400.0380.0430.0430.0430.0450.0500.0500.0430.0430.0430.0400.0440.0450.0430.045---
Yb0.0470.0430.0430.0380.0430.0440.0560.0500.0450.0570.0440.0430.0480.0290.0440.0450.0560.050---
Lu0.0120.0110.0110.0090.0140.0140.0140.0170.0060.0090.0140.0140.0140.0110.0120.0120.0170.017---
Tm0.0070.0080.0070.0060.0000.0000.0000.0000.0070.0070.0000.0000.00000.000.0000.0000.0000.000---
U0.0060.0120.0030.0000.0130.0130.0140.0030.0080.0050.0210.0210.0080.0320.0080.0010.0050.000---
Th0.0060.0080.0050.0010.0070.0050.0050.0000.0040.0090.0120.0100.0050.0320.0050.0010.0050.000---
Total1.9751.9751.9751.9791.9951.9941.9941.9911.9971.9931.9921.9961.9941.9961.9931.9981.9941.991---
P + Si1.0181.0171.0201.0190.9860.9860.9890.9870.9930.9990.9920.9860.9900.9990.9920.9860.9890.987---
XYPO40.780.770.810.810.730.730.740.770.770.780.720.720.760.730.760.770.740.77---
Xbrb0.000.000.000.000.000.000.010.000.000.000.000.000.000.000.000.000.010.00---
Y + REE0.960.950.960.971.001.001.001.021.000.990.980.991.000.941.001.021.001.02---
Th/U1.090.671.803.070.490.380.400.000.441.930.580.480.600.990.601.260.400.00---
U/Th0.921.480.560.332.042.662.500.002.280.521.732.061.671.011.670.792.500.00---
Y/Ho76.8470.02101.6894.7460.7955.8163.9266.9348.3652.6855.2961.6657.9663.9058.3761.0663.9266.93---
Table 5. Chemical composition of thorite-uranothorite. EMP analysis.
SampleA-z1A-z3A-z8D-z10A-z34Z-2Z-16Z-23Z-28Z-31Z-34Z-45
Analysis No.5/1.7/1.8/1.9/1.10/1.13/1.1/1.7/1.3/1.9/1.13/1.7/1.
SiO2 (wt%)17.0211.7016.9712.2117.3910.6911.887.0811.048.009.307.59
P2O54.034.554.746.021.4510.704.242.225.357.429.217.14
Al2O30.000.680.000.000.000.000.000.000.000.000.000.00
CaO0.000.270.000.000.000.310.210.160.150.710.280.68
FeO0.220.130.150.100.050.000.000.000.000.000.001.09
MgO0.000.000.000.000.000.000.000.000.000.000.000.00
MnO0.040.050.020.000.000.020.000.000.000.000.000.00
ThO243.6671.0455.5850.1954.1136.7037.5834.6838.8658.3755.4956.81
UO222.237.3110.5911.3417.2311.5033.2939.6328.802.684.882.47
PbO0.450.010.790.660.710.360.990.990.710.090.000.00
Y2O36.150.965.897.552.4213.534.552.706.081.726.591.92
La2O30.010.000.000.000.000.010.000.000.000.000.000.00
Ce2O30.000.150.000.000.090.010.000.000.000.000.000.00
Pr2O30.000.020.010.000.000.000.000.000.000.000.000.00
Nd2O30.080.190.000.100.470.340.200.200.240.060.320.12
Sm2O30.350.390.190.420.200.520.170.090.090.000.110.12
Eu2O30.000.000.070.000.080.000.000.030.010.000.020.01
Gd2O30.810.400.590.510.491.160.300.230.340.190.370.23
Dy2O31.080.621.451.250.722.340.970.701.010.070.000.06
Ho2O30.290.130.450.300.160.480.150.000.100.100.210.04
Er2O30.760.531.100.710.411.340.620.440.740.400.740.43
Yb2O30.680.300.940.850.211.640.640.510.690.590.900.56
Tb2O30.140.110.190.200.120.240.040.030.080.050.040.04
Lu2O30.500.370.420.410.460.420.260.140.180.070.210.10
Tm2O30.010.020.200.110.180.380.070.050.090.020.020.03
Total98.5199.93100.3492.9396.9592.6995.5889.8894.5680.5488.6980.45
Atoms per Formula Unit (apfu). Based on 4 Oxygens
Si0.8530.6450.8310.6630.9390.5260.6770.5050.6240.5130.5130.489
P0.1710.2120.1960.2770.0660.4450.2050.1340.2560.4030.4300.390
Al0.0000.0440.0000.0000.0000.0000.0000.0000.0000.0000.0000.000
Ca0.0000.0160.0000.0000.0000.0160.0130.0120.0090.0490.0170.047
Fe0.0090.0060.0060.0050.0020.0000.0000.0000.0000.0000.0000.000
Mg0.0000.0000.0000.0000.0000.0000.0000.0000.0000.0000.0000.000
Mn0.0020.0020.0010.0000.0000.0010.0000.0000.0000.0000.0000.000
Th0.4980.8910.6190.6200.6650.4110.4880.5630.4990.8520.6970.833
U0.2480.0900.1150.1370.2070.1260.4220.6290.3620.0380.0600.035
Pb0.0060.0000.0100.0100.0100.0050.0150.0190.0110.0020.0000.000
Y0.1640.0280.1530.2180.0700.3540.1380.1030.1830.0590.1940.101
La0.0000.0000.0000.0000.0000.0000.0000.0000.0000.0000.0000.000
Ce0.0000.0030.0000.0000.0020.0000.0000.0000.0000.0000.0000.000
Pr0.0000.0000.0000.0000.0000.0000.0000.0000.0000.0000.0000.000
Nd0.0010.0040.0000.0020.0090.0060.0040.0050.0050.0010.0060.003
Sm0.0060.0070.0030.0080.0040.0090.0030.0020.0020.0000.0020.003
Eu0.0000.0000.0010.0000.0010.0000.0000.0010.0000.0000.0000.000
Gd0.0130.0070.0100.0090.0090.0190.0060.0050.0060.0040.0070.005
Dy0.0170.0110.0230.0220.0130.0370.0180.0160.0180.0010.0000.001
Ho0.0050.0020.0070.0050.0030.0080.0030.0000.0020.0020.0040.001
Er0.0120.0090.0170.0120.0070.0210.0110.0100.0130.0080.0130.009
Yb0.0100.0050.0140.0140.0030.0250.0010.0110.0120.0120.0150.011
Tb0.0020.0020.0030.0040.0020.0040.0010.0010.0010.0010.0010.001
Lu0.0080.0060.0060.0070.0080.0060.0040.0030.0030.0010.0030.002
Tm0.0000.0000.0030.0020.0030.0060.0010.0010.0020.0000.0000.001
Total2.0181.9862.0142.0072.0152.0172.0062.0192.0051.9461.9591.988
Table 6. Chemical compositions of tailings from Bangka Island. ICP-MS/ES analysis.
SampleBngk1Bngk3Bngk5Bngk8Bngk9Bngk10Bngk15Bngk17Bngk19Bngk20Bngk22Bngk28Zglinicki et al., 2021 [22]Zglinicki et al., 2021 [22]Zglinicki et al., 2021 [22](CRM) of NCS DC 73301
Oxidein wt%
SiO225.1925.6610.2814.3924.6840.7155.6527.075.2933.506.8727.3814.232.8127.4872.27
Al2O31.921.951.510.320.883.705.183.840.851.020.394.941.641.1610.1413.54
Fe2O316.1915.9222.515.8718.1813.849.1218.240.8512.0114.9313.4016.275.2015.412.10
MgO0.220.180.04<0.010.240.060.190.100.190.12<0.011.550.03<0.010.320.41
CaO0.060.070.040.070.060.040.060.03<0.010.050.100.050.020.280.111.58
Na2O0.080.080.05<0.010.030.110.300.120.010.04<0.010.060.010.020.663.07
K2O0.030.02<0.01<0.010.020.010.080.020.02<0.010.040.09<0.01<0.010.105.08
TiO225.1825.8643.316.8013.7723.279.7035.190.6518.8816.6222.5648.513.7420.890.29
P2O51.141.741.051.860.743.180.840.970.201.118.421.401.9117.231.910.09
MnO1.251.272.060.450.381.320.471.400.020.941.420.891.350.151.000.06
Cr2O30.230.250.020.180.440.050.160.0780.400.190.201.680.070.430.12<0.002
LOI1.801.701.101.7011.101.902.605.300.303.102.300.302.183.701.80-
Total73.2574.7482.0031.5970.5988.1584.3892.378.74 *71.0166.9292.5886.2134.7787.7698.53
Elementin wt%ppm
Th0.170.160.220.750.080.290.120.130.040.140.940.080.421.000.3055.0
U0.070.060.080.110.040.040.030.020.010.030.160.020.040.130.0618.7
Sc (ppm)70.068.0132.070.077.048.055.093.025.054.063.073.0110.055.078.06.0
Y1.401.170.421.100.281.490.240.420.180.264.830.360.491.101.0662.70
La0.270.240.271.660.150.670.240.200.090.362.600.210.66>5.000.7153.60
Ce0.570.510.583.510.311.510.520.410.210.77>5.000.421.35>5.001.61104.90
Pr0.070.060.070.380.040.160.060.050.030.080.640.050.14>1.000.1611.96
Nd0.240.210.24>1.000.130.540.200.170.100.28>1.000.170.47>1.000.5843.4
Sm0.070.060.050.250.030.110.040.040.030.050.060.040.08>1.000.129.08
Eu (ppm)9.638.891.709.736.406.092.533.391.204.9019.962.944.6061.808.000.76
Gd0.130.110.050.200.030.140.040.050.030.040.550.040.070.750.138.76
Tb0.030.020.010.030.010.030.010.010.010.010.110.010.010.080.031.48
Dy0.210.180.070.200.050.220.040.070.040.040.740.060.080.340.189.44
Ho0.050.040.020.040.010.050.010.020.010.010.170.010.020.040.041.98
Er0.160.140.050.140.040.170.030.050.030.030.520.050.060.100.136.49
Tm0.030.020.010.020.010.030.000.010.000.010.080.010.010.010.021.02
Yb0.170.140.060.140.040.170.030.050.020.040.520.050.060.070.147.00
Lu0.030.020.010.020.010.030.000.010.000.010.080.010.010.010.021.08
∑REE + Y3.412.921.91>8.691.115.321.471.530.961.98>16.891.483.50>15.514.93323.65
LREE1.221.071.21>6.790.663.001.060.860.451.54>9.300.882.70>13.003.18222.94
HREE + Y2.201.850.701.900.462.320.310.670.240.447.580.600.802.511.74100.71
LREE:HREE0.560.581.73>3.581.431.292.581.281.883.52>1.231.463.39>5.171.832.21
n.a.—not available. LREE: La, Ce, Pr, Nd, Sm. HREE + Y: Eu, Gd, Tb, Dy, Ho, Er, Tm, Yb, Lu + Y. * >50 Sn wt%.
Table 7. Correlation matrix of oxides and elements in studied samples (n = 15).
SiO2Al2O3Fe2O3MgOCaONa2OK2OTiO2P2O5MnOCr2O3ThUScYLaCePrNdSmEuGdTbDyHoErTmYbLu
SiO21.00
Al2O30.511.00
Fe2O30.170.171.00
MgO0.200.380.031.00
CaO−0.310.01−0.27−0.131.00
Na2O0.450.920.120.090.091.00
K2O0.420.810.030.630.010.721.00
TiO20.040.110.81−0.01−0.40−0.01−0.141.00
P2O5−0.45−0.20−0.30−0.220.91−0.17−0.17−0.321.00
MnO0.040.090.83−0.09−0.320.02−0.090.86−0.221.00
Cr2O3−0.030.11−0.160.930.06−0.160.45−0.210.03−0.291.00
Th−0.54−0.30−0.27−0.370.70−0.19−0.23−0.240.82−0.09−0.161.00
U−0.53−0.33−0.04−0.370.65−0.16−0.18−0.180.700.10−0.200.901.00
Sc−0.160.060.77−0.03−0.170.02−0.110.83−0.190.69−0.17−0.040.071.00
Y−0.29−0.180.08−0.230.27−0.090.03−0.090.450.27−0.160.650.76−0.131.00
La−0.51−0.27−0.30−0.320.72−0.17−0.16−0.330.84−0.14−0.100.990.89−0.150.711.00
Ce−0.37−0.16−0.33−0.340.53−0.05−0.17−0.280.58−0.13−0.200.900.78−0.080.540.871.00
Pr−0.29−0.21−0.03−0.250.10−0.100.00−0.120.260.18−0.190.690.72−0.040.870.720.721.00
Nd0.090.280.18−0.22−0.160.350.110.24−0.110.38−0.380.320.280.140.470.290.560.661.00
Sm−0.060.03−0.21−0.220.040.12−0.11−0.12−0.04−0.05−0.240.420.350.030.160.340.750.480.671.00
Eu−0.45−0.21−0.34−0.220.96−0.15−0.20−0.380.97−0.330.030.760.66−0.210.310.770.540.12−0.21−0.011.00
Gd−0.50−0.24−0.29−0.280.87−0.17−0.15−0.360.96−0.17−0.040.900.84−0.210.630.930.690.470.030.090.921.00
Tb−0.45−0.21−0.16−0.270.67−0.11−0.03−0.310.81−0.01−0.080.860.88−0.230.870.920.670.710.230.100.720.921.00
Dy−0.39−0.20−0.03−0.260.48−0.11−0.02−0.190.640.15−0.130.790.85−0.170.970.840.630.820.380.160.530.800.961.00
Ho−0.31−0.180.09−0.260.27−0.080.02−0.080.450.29−0.190.660.77−0.111.000.710.540.870.470.150.310.640.870.971.00
Er−0.27−0.160.09−0.220.22−0.070.05−0.080.390.28−0.160.620.74−0.131.000.680.530.880.500.190.260.590.840.961.001.00
Tm−0.22−0.160.22−0.180.14−0.090.020.010.310.38−0.150.550.69−0.060.980.600.470.850.530.180.180.510.780.910.970.981.00
Yb−0.24−0.140.14−0.210.17−0.050.07−0.040.330.33−0.170.580.72−0.090.990.640.510.880.540.200.200.530.810.930.991.000.991.00
Lu−0.22−0.160.22−0.180.14−0.090.020.010.310.38−0.150.550.69−0.060.980.600.470.850.530.180.180.510.780.910.970.981.000.991.00
Table 8. A comparison of average REE content in tailing from Bangka Island to average REE in the bulk continental crust [45].
ElementsComposition of the Continental Crust in ppmThis Study (Average in ppm)
Y19.07836.72
La20.05025.09
Ce43.09117.20
Pr4.91178.31
Nd20.03069.61
Sm3.9701.14
Eu1.19.77
Gd3.71145.22
Tb0.6206.44
Dy3.61316.80
Ho0.77289.22
Er2.1923.07
Tm0.28145.37
Yb1.9939.76
Lu0.30148.08
Publisher’s Note: MDPI stays neutral with regard to jurisdictional claims in published maps and institutional affiliations.

