
A Methodology to Assess the Historical Environmental Footprint of In-Situ Recovery (ISR) of Uranium: A Demonstration in the Goliad Sand in the Texas Coastal Plain, USA


Abstract
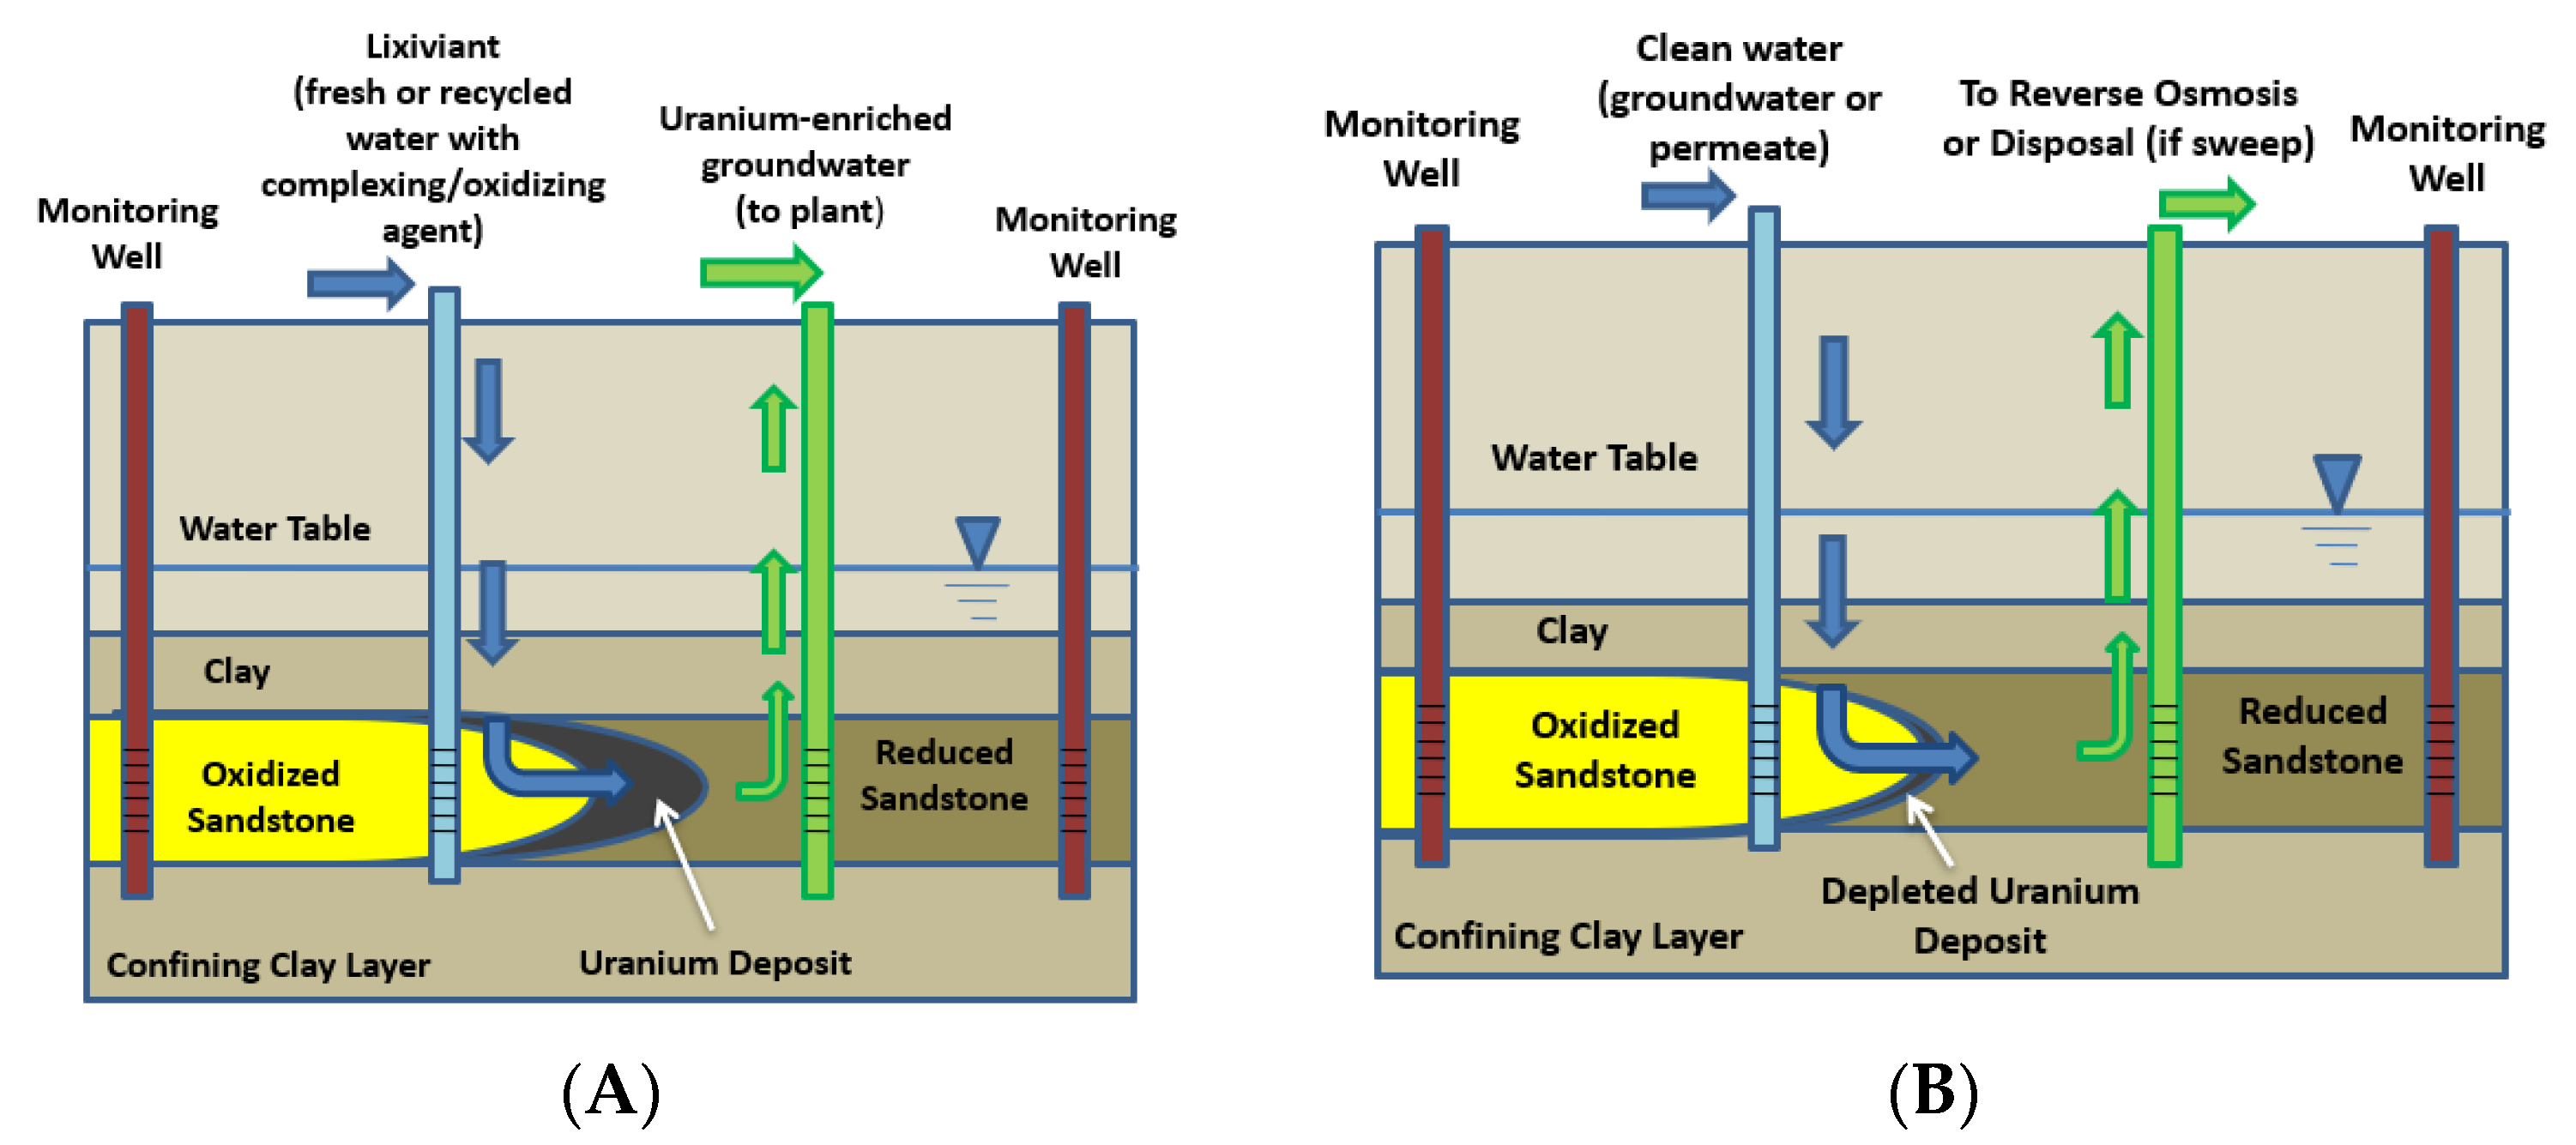
:1. Introduction
2. Materials and Methods
- The EPA, online database on aquifer exemptions.
- IAEA: Various documents on Uranium Resource Production from ISR,
- Various documents submitted to and obtained from the TCEQ and predecessors including: Class III injection Permits, Class I Disposal Well Injection Permits, Class I Disposal Well Operating Reports, Mine Permit Applications, area permits to construct and operate Class III underground injection wells for ISR of uranium and aquifer restoration under Chapter 27 Texas Water Code, production area authorizations (PAAs) to operate Class III underground injection wells for in-situ recovery of uranium and groundwater Restoration Table Amendment Requests.
- Form 10-K, Annual Report Pursuant to Section 13 or 15(d) of the Securities Exchange Act of 1934 filed with the U.S. Securities and Exchange Commission (SEC) also contain information about uranium production and, in some cases, water use.
2.1. Surface Area Disturbance
2.2. Subsurface Aquifer Disturbance
2.3. Normalizing Footprints to Uranium Production
2.4. Total Water Consumption
2.5. Volumes Extracted for Restoration
2.6. Volumes Used during Uranium Production
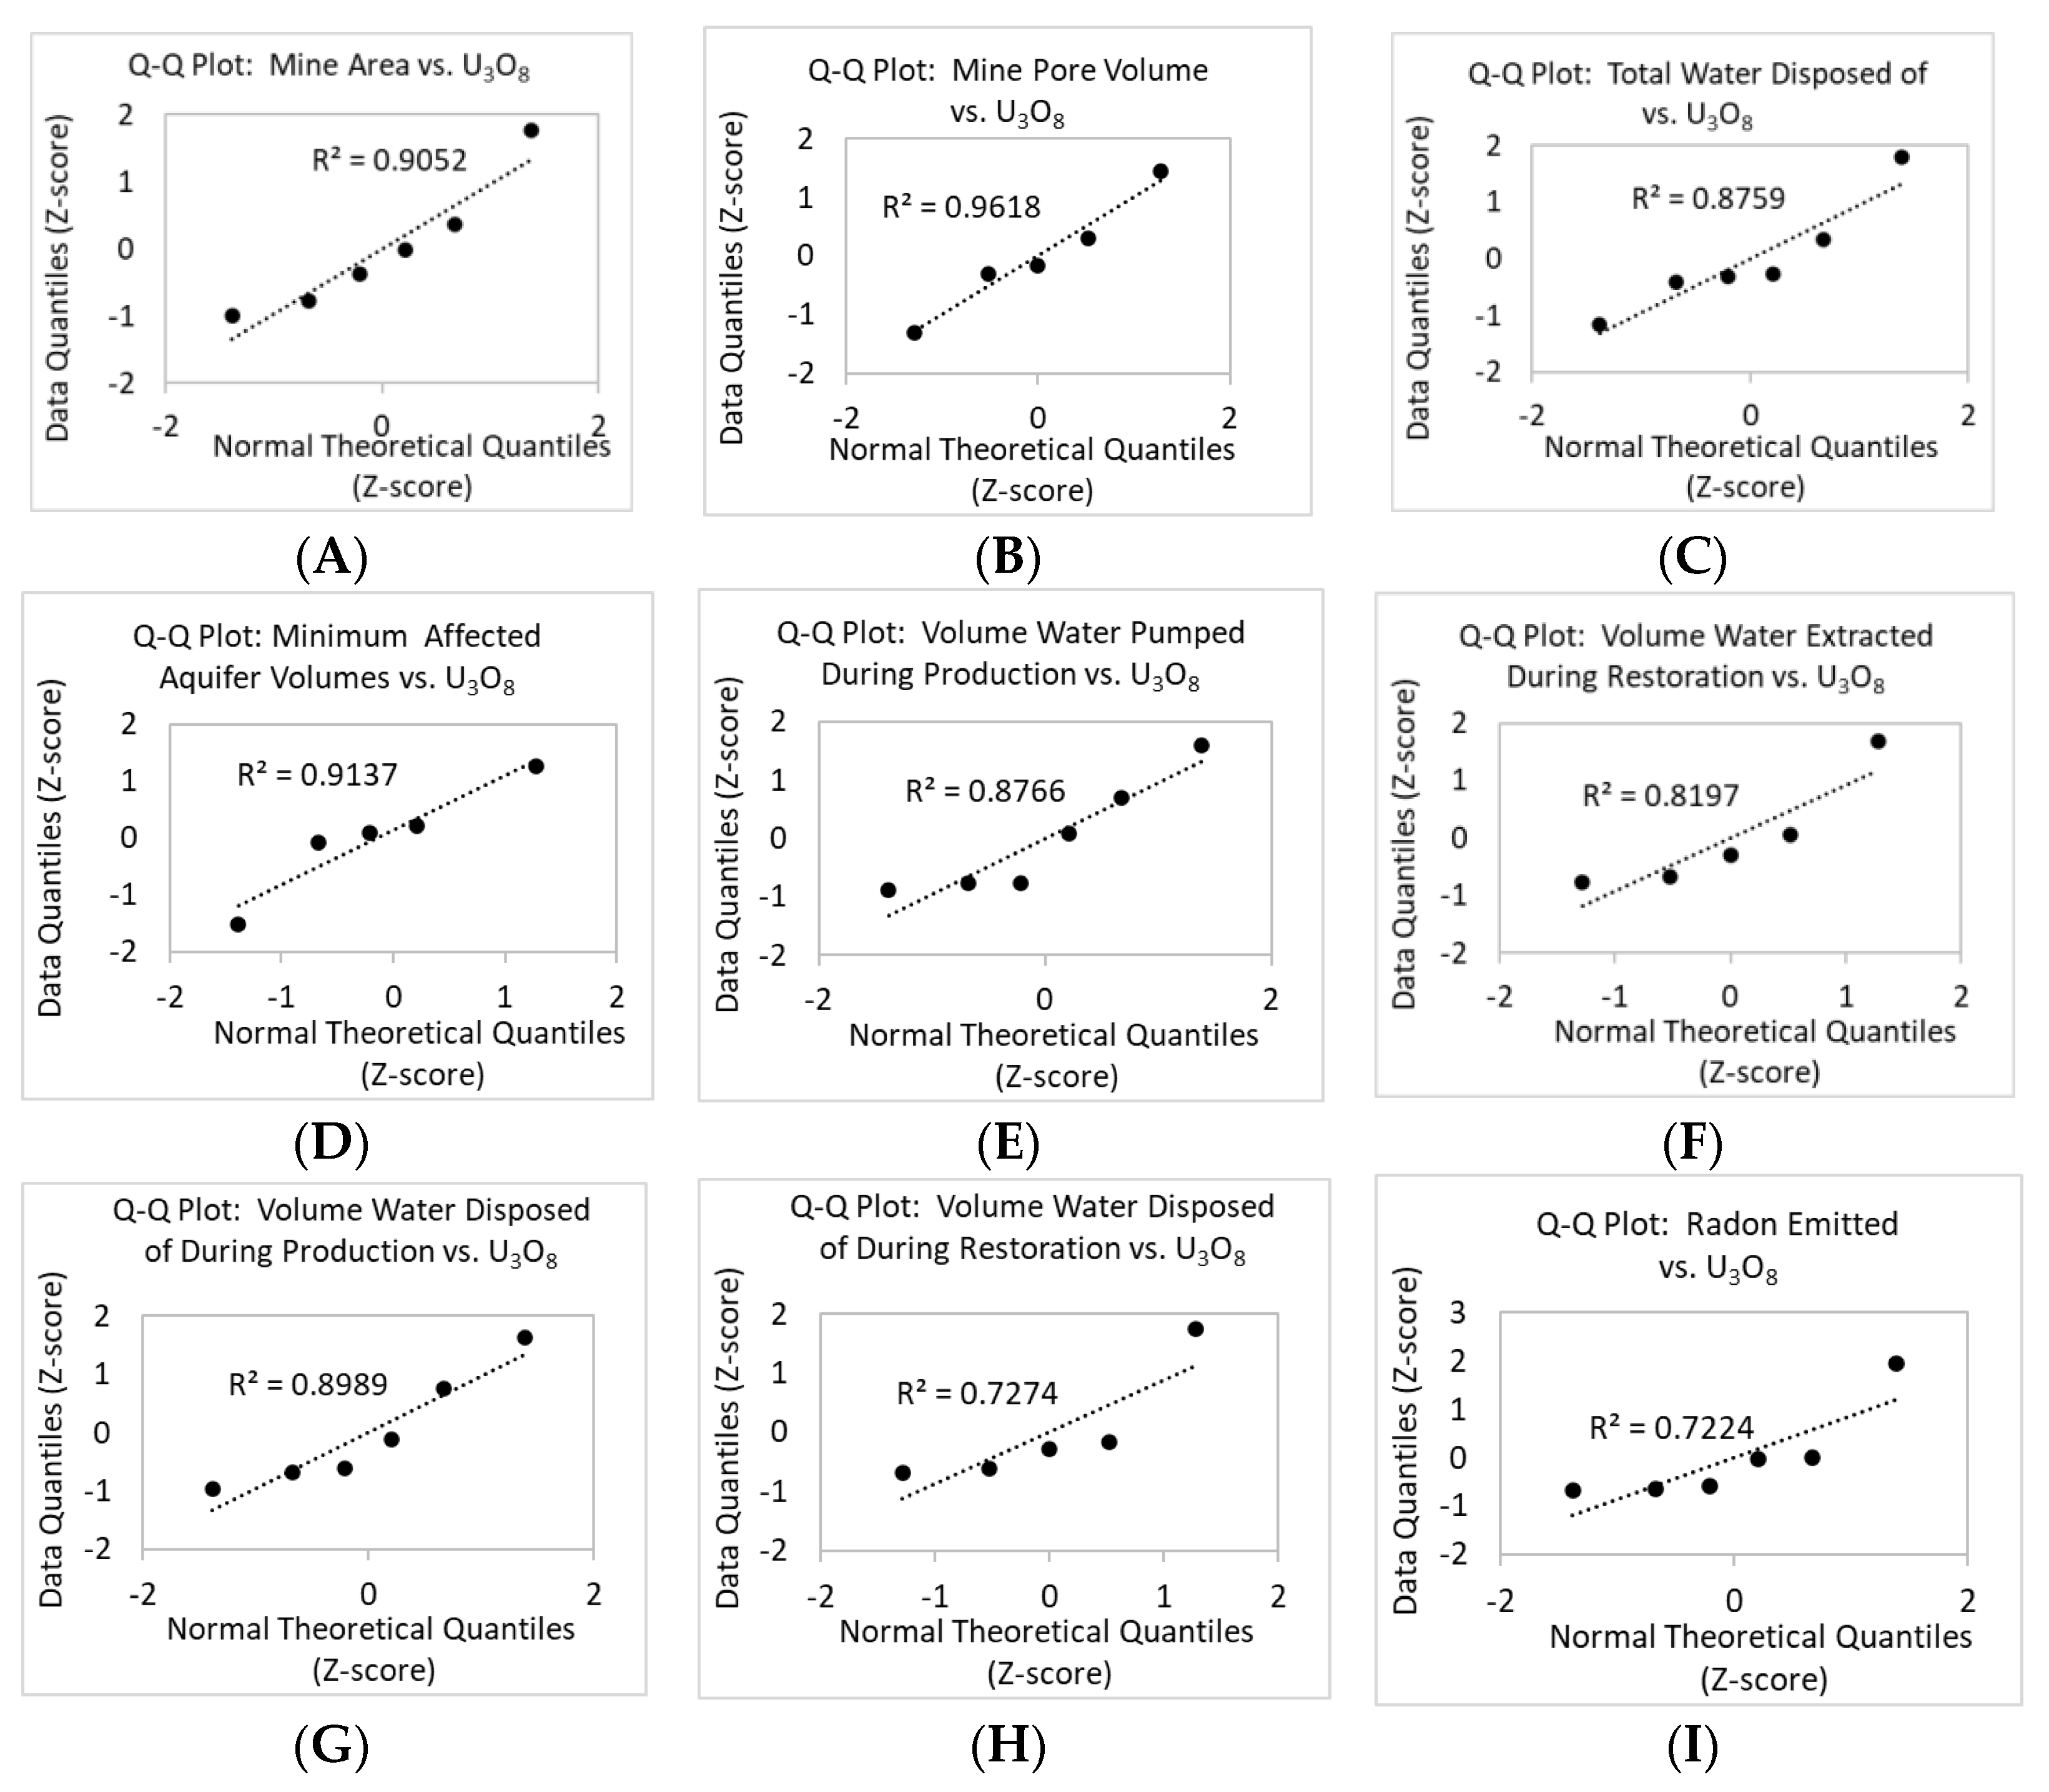
2.7. Linear Regressions
2.8. Hydrogeologic Setting
3. Results
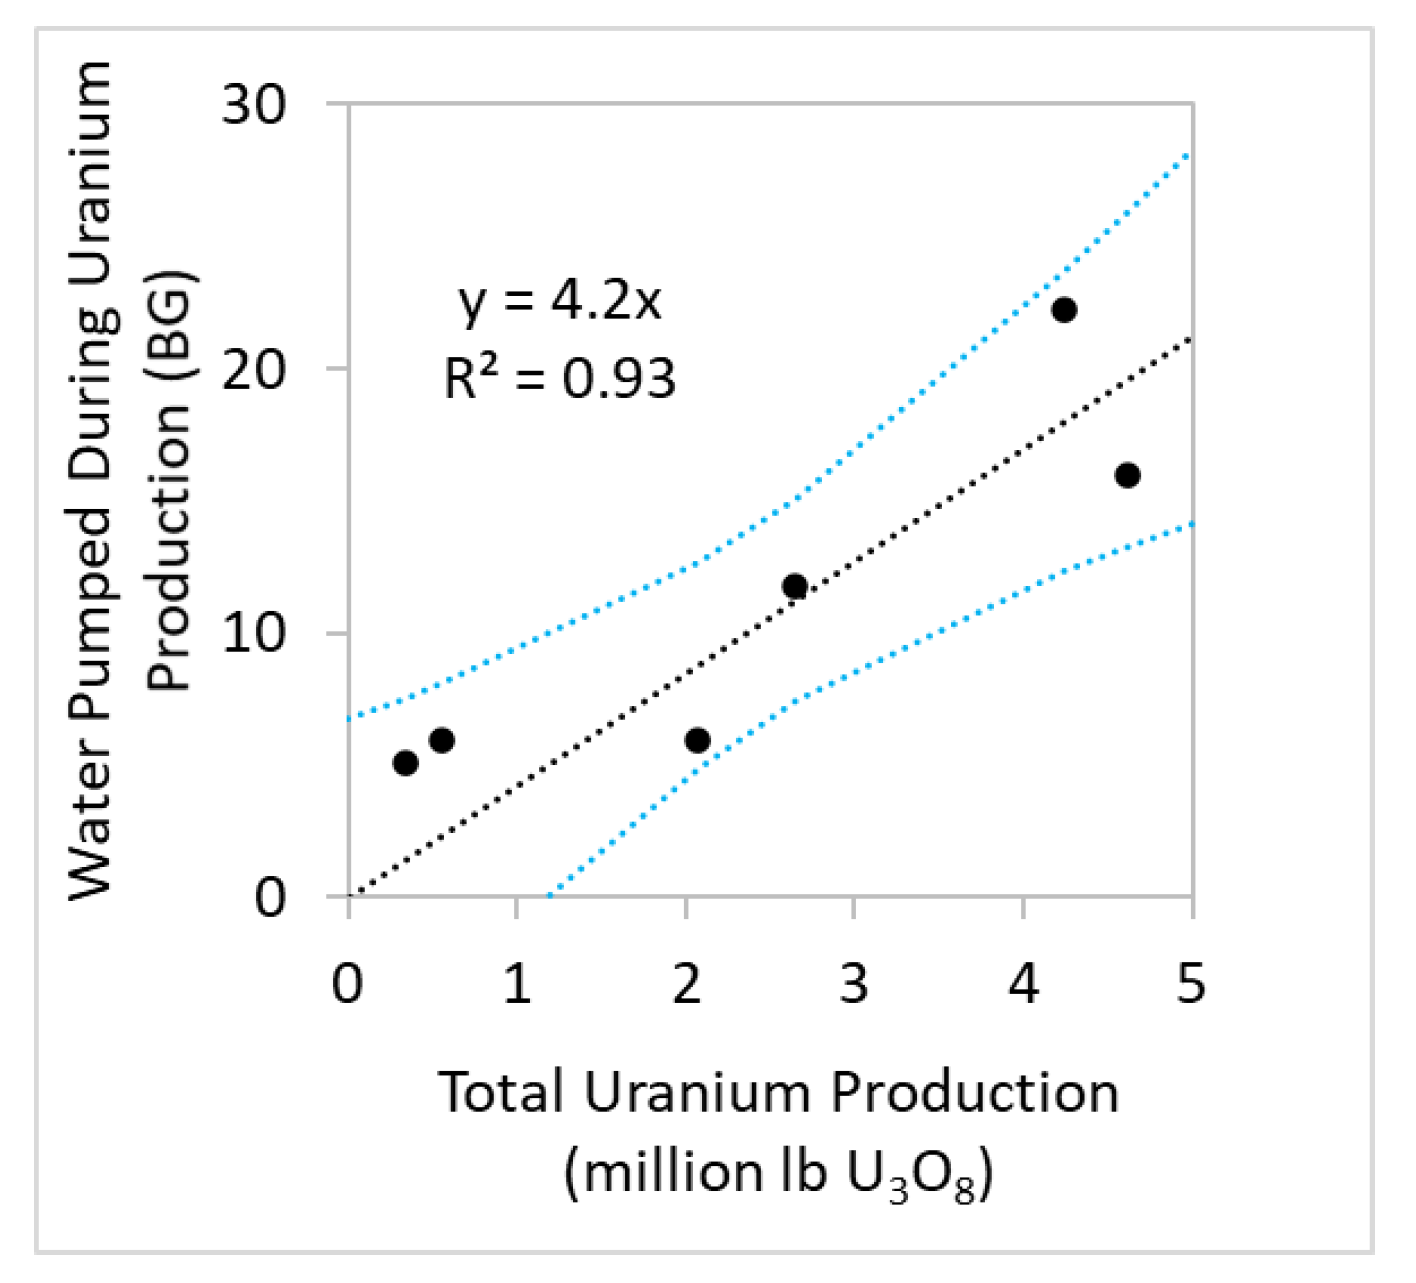
3.1. Water Pumped during Uranium Production
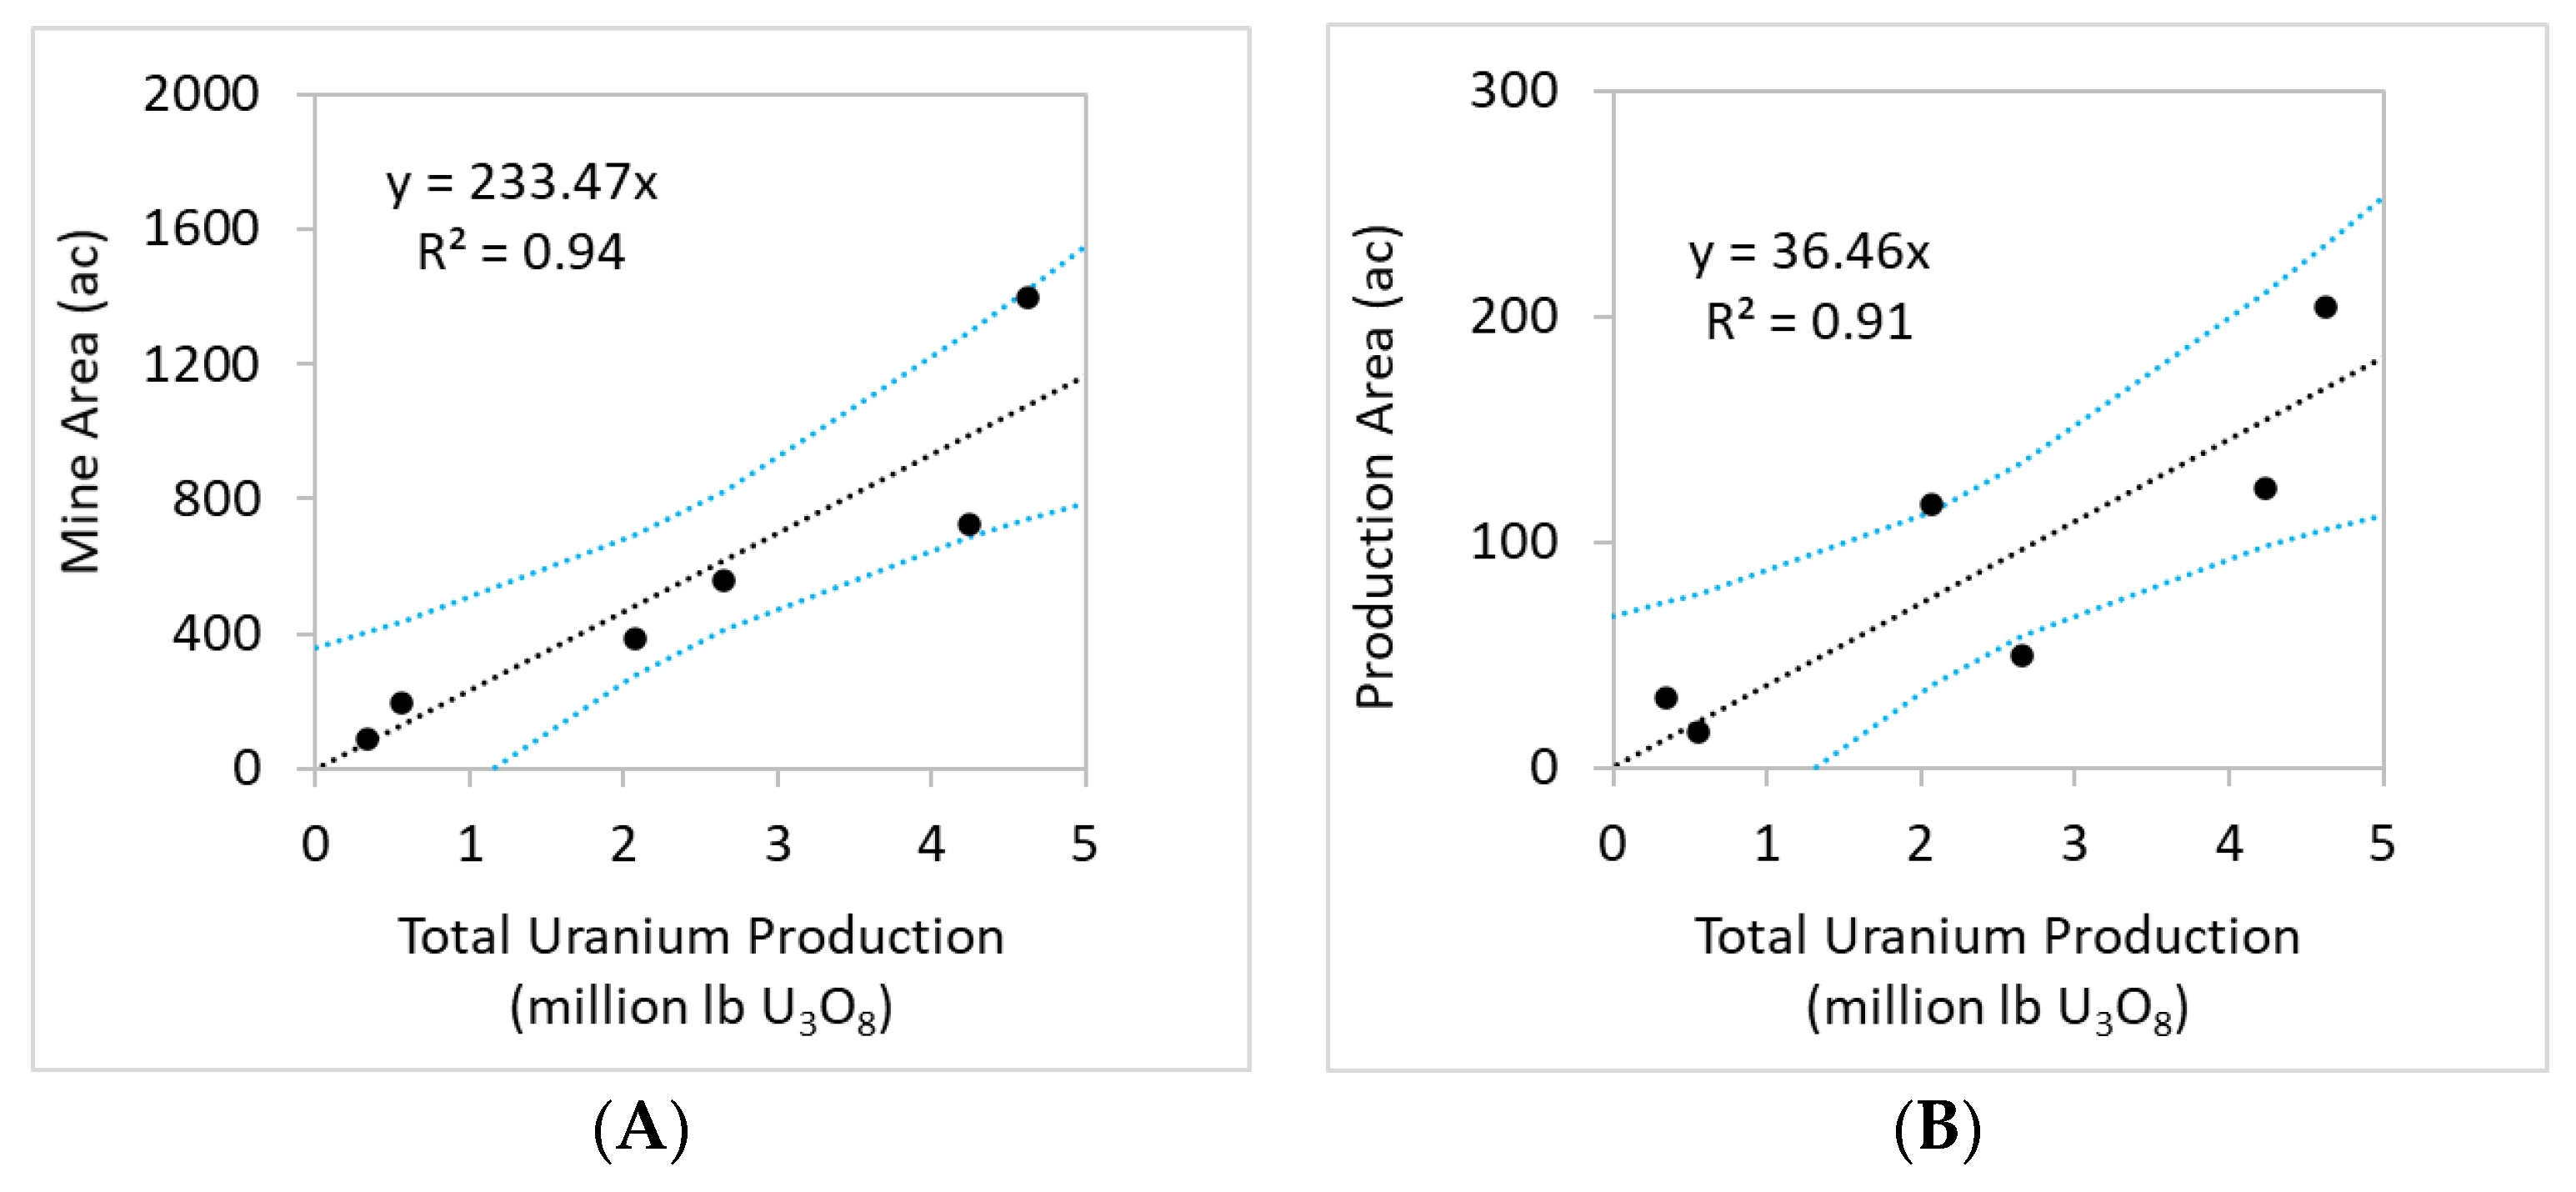
3.2. Mine Area
3.3. Aquifer Exemptions
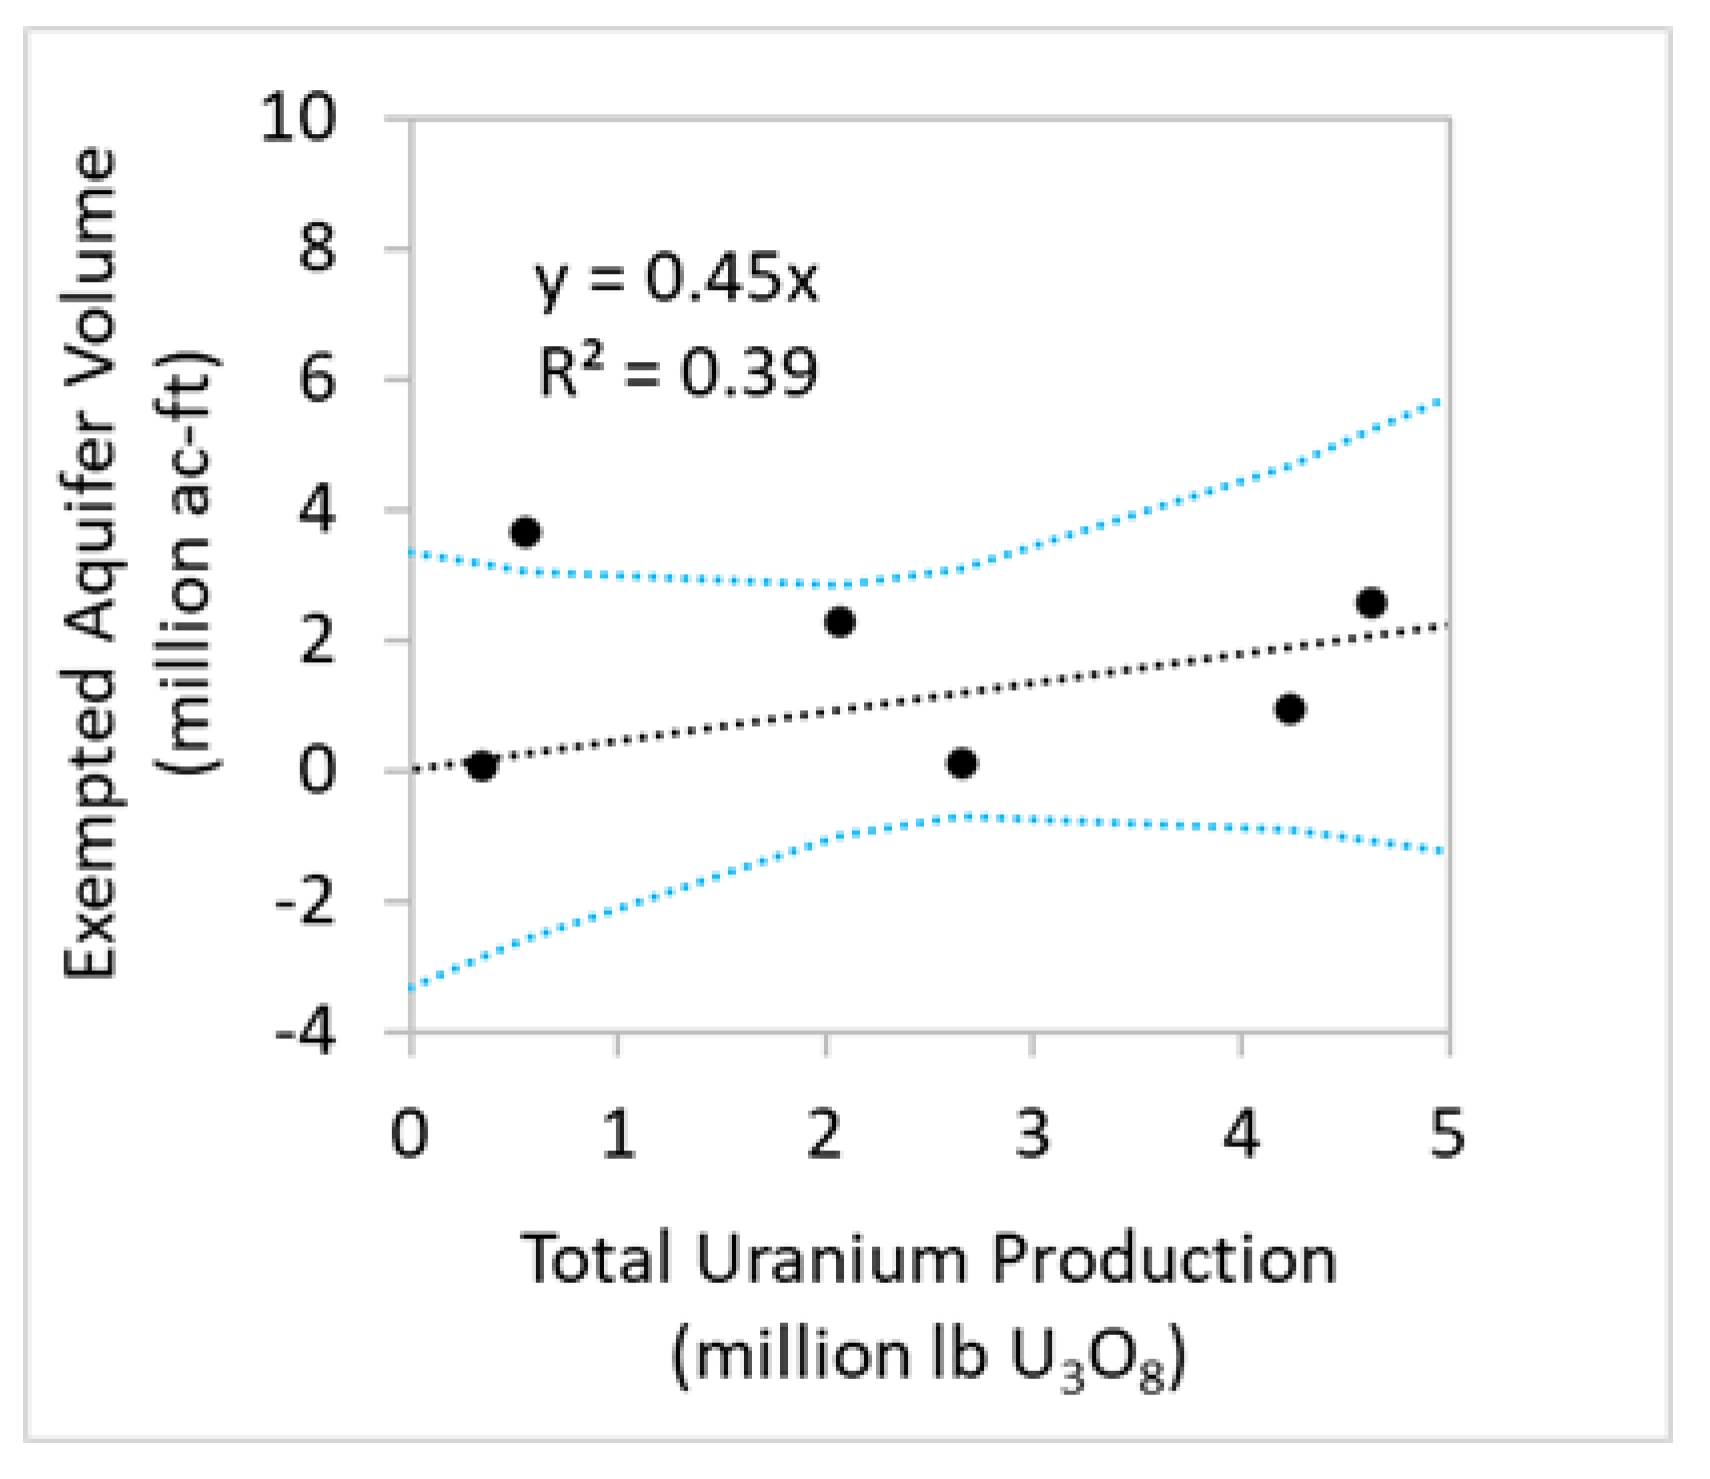
3.4. Minimum Affected Aquifer Volume
pore volume/porosity
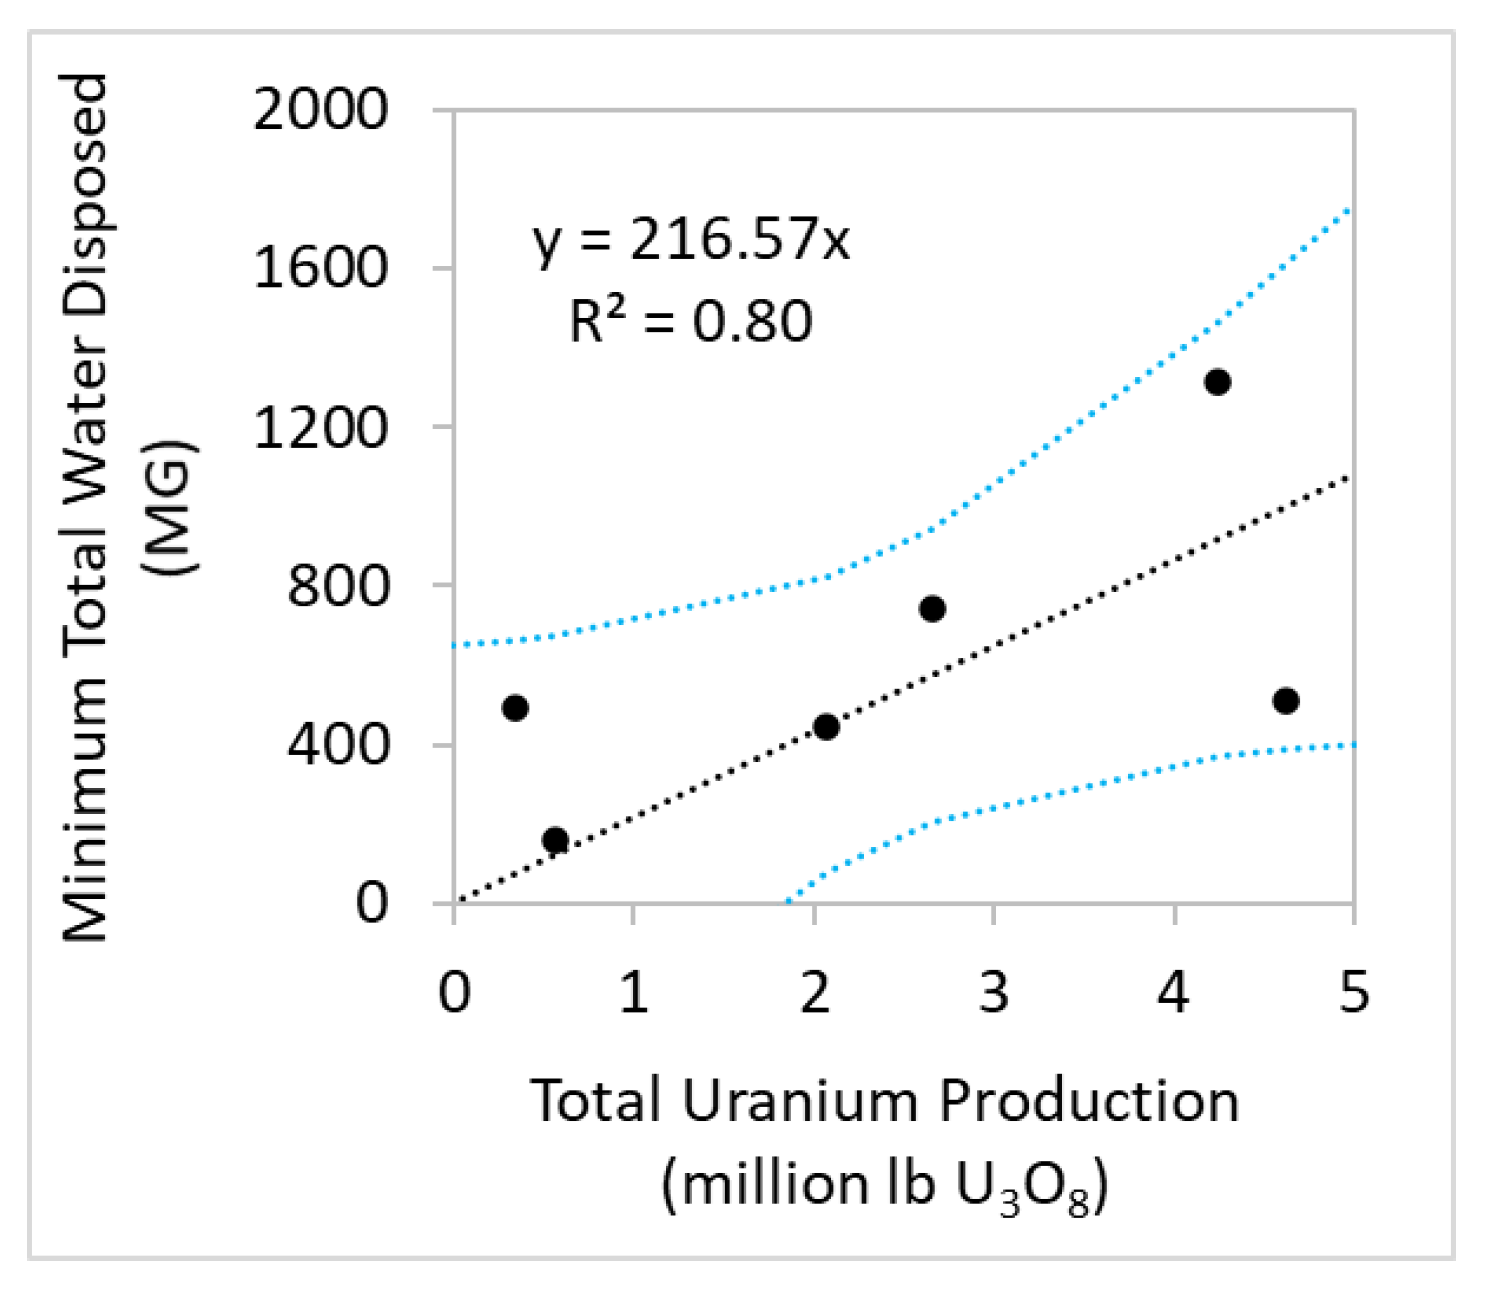
3.5. Water Disposal into Deep Disposal Wells
3.5.1. Water Pumped and Disposed during Restoration
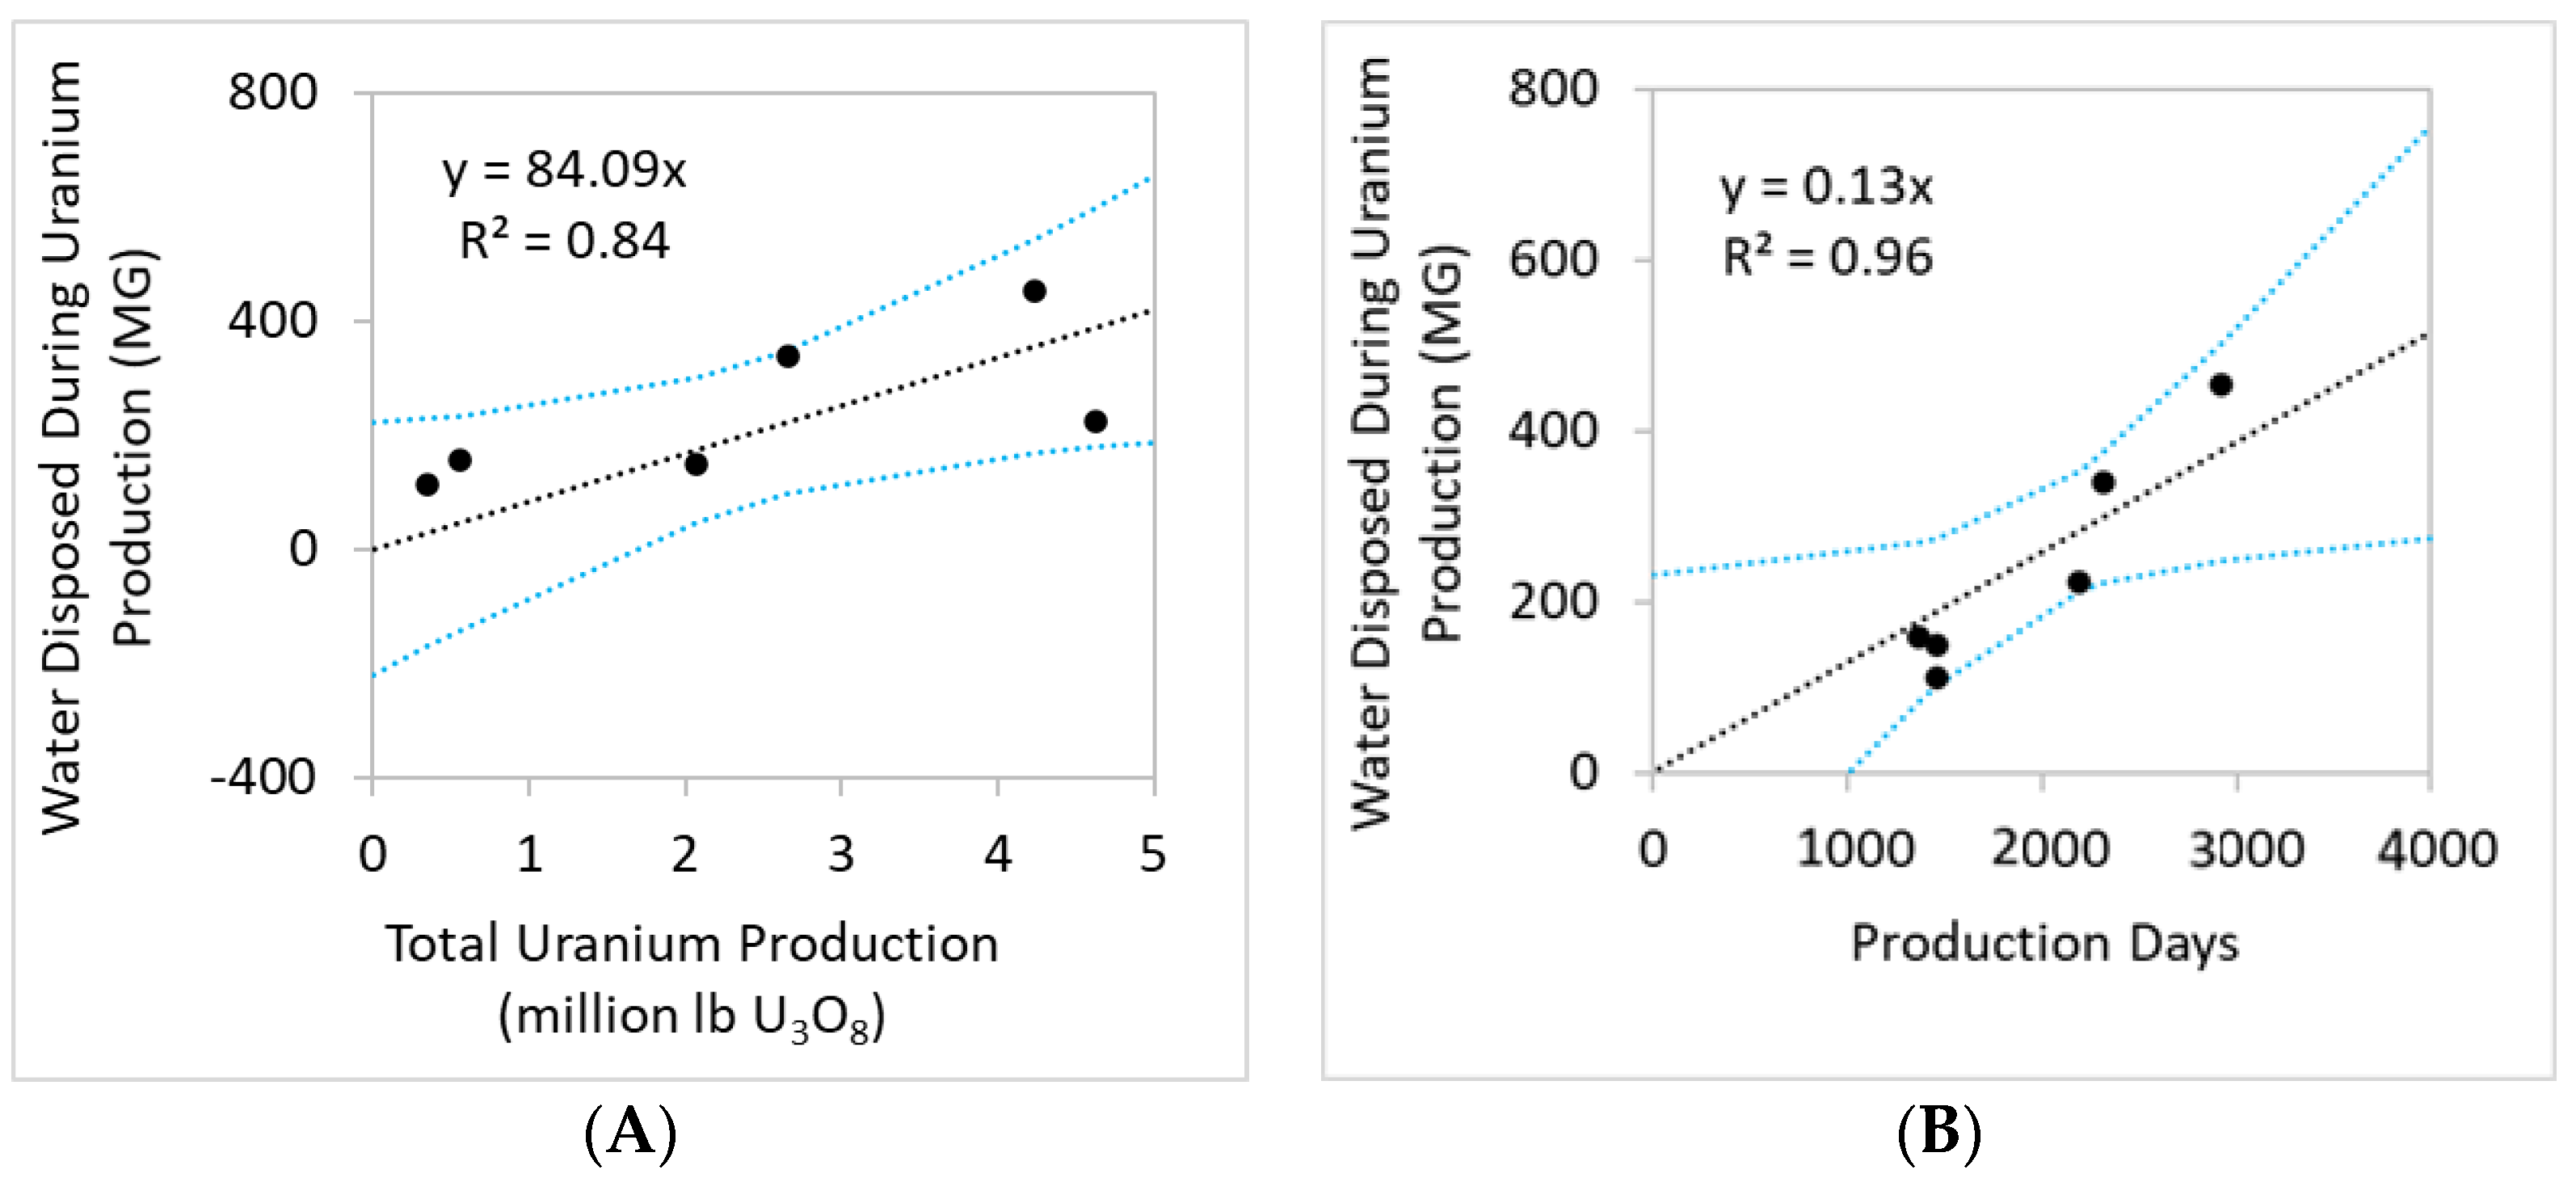
3.5.2. Water Disposed during Uranium Production
3.6. Radon
- Leaching of uranium in the ore zone mobilizes all the radon gas present with the dissolved uranium.
- All the radon gas dissolved in the pregnant solution will be released to the atmosphere.
- Radon-222 and its daughters are in secular equilibrium with uranium-238.
- The major source of radon-222 emissions in a uranium solution mining project is the wellfield surge tanks. Conservatively, it is assumed that only one covered surge tank with a pipe type vent will be located at the processing facility.
4. Discussion
5. Conclusions
- in general, quantities of water use, disturbed surface area, water treated, disturbed subsurface volume and radon emissions may not be systematically reported or if they are, may not be reported for all phases throughout the life of the operation, that is, production and groundwater restoration;
- if reported, these parameters are not reported in conjunction with uranium production values;
- each operation implements a different water balance with differing pumping rates, injection rates, treatments and recycling rates and many times, production water use co-occurs with restoration at a given mine with several production fields operating concurrently or at different stages of the life cycle;
- oftentimes, water pumping, if reported, is typically reported per wellfield, but uranium production rates are not provided per wellfield;
- each operation uses different reporting formats and/or calculations;
- different water balances are employed in each operation, that is, with different levels of disposal and recycling, depending on pumping and disposal rates and technologies used for wastewater treatment;
- radon emissions could be influenced by the process facility design;
- each ISR operation is implemented within a “mine permit” but for different production areas within a site, and it is not unusual for the production phase to be implemented at one production area under a mine permit, while another production area under the same permit is undergoing groundwater restoration;
- comprehensive lists of water disposal records and mine production are not readily available;
- water disposal records are reported per permitted waste disposal well and attributed to a company name, and not necessarily to a ISR operation name;
- water disposal is often reported in restoration reports as “pore volumes” and not in volumetric units such as gallons;
- historically, ISR operations in Texas have not consistently computed the pore volume;
- the number of pore volumes stipulated in the surety bond agreement to restore the aquifer after the uranium production phase may differ for each ISR operation;
- in some cases, there are more than one waste disposal well listed per mine name;
- a mine name could be associated with different owners;
- records are piecemeal and parameters may change over time as the operations grow or cease such that data in any given report may not reflect the actual final parameters that define a site or a complete set of data.
Author Contributions
Funding
Data Availability Statement
Acknowledgments
Conflicts of Interest
Appendix A

| ISR Operation Name | Production Period(s) | Approx. Production Time (d) | Production U3O8 (lb) | Average Recovery Factor | Flow Rate of Leaching Solution (gal/Day) [22] | Water Pumped during Production (BG) 6 | Water Pumped Normalized to Production (gal/lb U3O8) |
|---|---|---|---|---|---|---|---|
| Alta Mesa 1 | 2006 to 2012 | 2190 | 4,621,600 | 81% | 7,291,149 | 16 | 3455 |
| PAA-1 | 1,610,000 | 84% | |||||
| PAA-2 | 1,498,200 | 74% | |||||
| PAA-3 | 290,400 | 111% | |||||
| PAA-4 | 850,000 | 87% | |||||
| PAA-5 | 35,000 | 58% | |||||
| PAA-6 | 338,000 | NA | |||||
| PAA-7 | |||||||
| Kingsville Dome 2 | 1988 to 1990, 1996 to 1999, 2006 to 2009 | 2920 | 4,240,200 | 7,608,155 | 22 | 5239 | |
| Mt. Lucas | 1983 to 1987 | 1460 | 2,069,425 | 4,057,683 | 5.9 | 2863 | |
| Palangana | November 2010 to July 2014 | 1369 | 560,000 | 43% | 3,487,071 | 4.8 | 8525 |
| Palangana Dome 3 | 1977 to 1980, 1985 to 1986 | 1460 | 340,000 | 33% | 4,311,288 | 6.2 | 18,513 |
| Rosita 4,5 | 1990 to 1992, 1995 to 1999, 2009 | 2312 | 2,650,200 | 44% | 5,072,103 | 12 | 4425 |
| Mine/Production Area Authorization | Production Area (ac) | Wellfield Area or Area Under Pattern (ac) | Mine Area (ac) | Permit Area (ac) | Lease Area (ac) | Mine Area (ac/lb U3O8) |
|---|---|---|---|---|---|---|
| Alta Mesa | 204 | 1394 | 2312 | 0.00023 | ||
| PAA-1 | 244 | |||||
| PAA-2 | 40 | 188 | ||||
| PAA-3 | 18 | 91 | ||||
| PAA-4 | 15 | 133 | ||||
| PAA-5 | 40 | 230 | ||||
| PAA-6 | 91 | 259 | ||||
| PAA-7 | 91 | 250 | ||||
| Kingsville Dome | 124 | 513 | 2135 | 2857 | 0.00012 | |
| PAA-1 | 70 | 155 | ||||
| PAA-2 | 39 | 208 | ||||
| PAA-3 | 20 | 157 | ||||
| Mt. Lucas | 117 | 27 | 382 | 6023 | 4360 | 0.00018 |
| PAA-1 East | 15 | 2.7 | 24 | |||
| PAA-2 (EA) East | 10 | 2.8 | 28 | |||
| PAA-3 (H) East | 22 | 2.4 | 72 | |||
| PAA-4 (HM) East | 11 | 4.6 | 30 | |||
| PAA-5 (Lillian) East | 10 | 1.5 | 30 | |||
| PAA-6 (“M”) West | 6 | 3.8 | 39 | |||
| PAA-7 (“J”) West | 32 | 5.3 | 121 | |||
| PAA-8 (“South J”) | 6 | 2.1 | 38 | |||
| PAA-9 (“J1”) West | 5 | 1.8 | ||||
| Palangana | 16 | 195 | 6151 | 8791 | 0.00035 | |
| PAA-1 | 11 | 85 | ||||
| PAA-2 | 5 | 55 | ||||
| PAA-3 | 55 | |||||
| PAA-4 | 13 | 95 * | ||||
| Palangana Dome | 31 | 86 | 162 | 6272 | 0.00025 | |
| PAA-1 | 86 | |||||
| Rosita | 50 | 555 | 2278 | 0.00021 | ||
| PAA-1 | 24 | 173 | ||||
| PAA-2 | 26 | 382 |
| Injection Well ID | Approx. Ore Porosity (%) | Aquifer Exempted Area (ac) | Exempted Thickness (ft) | Average Dissolved Solids of Groundwater in Mine Area (mg/L) | Exempted Volume 3,4 (ac-ft) | Exempted Pore Water Volume 5 (gal) | Exempted Aquifer Volume per Production (ac-ft/lb U3O8) 6 | Exempted Aquifer Water Volume per Production (gal/lb U3O8) |
|---|---|---|---|---|---|---|---|---|
| Alta Mesa, original 1 | 1840 | 400 | 870, 1000 | 736,000 | 81,541,054,336 | 0.55 | 61,483 | |
| Alta Mesa, revised 1 | 28–40 | 5457 | 470 | 2,564,790 | 284,151,740,150 | |||
| Kingsville Dome (original) 1 | 547 | 200 | 900 to 1300 | 109,400 | 11,050,924,380 | 0.22 | 22,442 | |
| Kingsville Dome Ext 2 | 30, 32 | 2135 | 390 | 832,650 | 84,109,252,145 | |||
| Mt Lucas | 28, 27, 23 | 6023 | 375 | 850 | 2,258,625 | 191,353,790,765 | 1.09 | 92,467 |
| Palangana 2 | 25 | 6272 | 585 | 1000 to 1100 | 3,669,120 | 298,896,972,192 | 6.55 | 533,745 |
| Palangana Dome 2 | 10–30, 23 | 200 | 326 | 878 | 65,200 | 4,567,784,925 | 0.19 | 13,435 |
| Rosita 1,3 | 200 | 170 | 1800 | 34,000 | 3,323,684,280 | 0.04 | 3762 | |
| Rosita 1,3 | 30 | 1000 | 40 | 40,000 | 3,910,216,800 | |||
| Rosita Ext 1,3 | 70 | 400 | 28,000 | 2,737,151,760 |
| Minimum 1 Estimated Pore Volume 2 (MG) | Porosity Values Reported 2 | Minimum Associated Aquifer Volume 3 (Million cu ft) | Normalized Minimum Associated Subsurface Aquifer Volume 4 (cu ft/lb U3O8) | |
|---|---|---|---|---|
| Alta Mesa | Unknown | 28%–40% | Unknown | Unknown |
| Kingsville Dome | 93 | 30%, 32% | 40 | 0.43 |
| Mt. Lucas | 51 | 28%, 27%, 23% | 26 | 0.51 |
| Palangana | 21 | 25% | 11 | 0.53 |
| Palangana Dome | 47 | 10%–30%, 23% | 29 | 0.62 |
| Rosita | 63 | 30% | 28 | 0.45 |
| Mine Name | Disposal Well | Start Date | End Date | Minimum 1 Water Volume Disposed (MG) | Disposal Depth (ft) | Disposal Formation |
|---|---|---|---|---|---|---|
| Alta Mesa | WDW-365 | 31 January 2004 | 30 September 2017 | 279 | 4381–5381 | Frio |
| Alta Mesa | WDW-366 | 30 April 2007 | 30 September 2017 | 229 | Permit not found | Permit not found |
| Kingsville Dome | WDW-248 | 24 June 1988 | 31 December 2015 | 1312 | 4200–5300 | Upper Frio |
| Kingsville Dome | WDW-247 | No records found | No records found | No records found | Permit not found | Permit not found |
| Mt. Lucas | WDW-194 | No records found | No records found | No records found | 5200–5900 | Yegua |
| Palangana | WDW-418 | No records found | No records found | No records found | Permit not found | Permit not found |
| Palangana | WDW-419 | 31 December 2010 | 30 June 2017 | 158 | 5470–6900 | Jackson, Yegua |
| Palangana Dome | WDW-134 | July 1978 | March 1991 | 491 | 5968–6597 | Yegua |
| Rosita | WDW-250 | October 1990 | December 2015 | 743 | 4100–5400 | Yegua |
| Name | Wellfield, Zone, or Production Area | Gallons per Pore Volume of the Mine Area | Restoration | |||||
|---|---|---|---|---|---|---|---|---|
| Cumulative Water Extracted (gal) | Cumulative Water Injected (gal) | Disposal Method | Water Disposed (MG) | % of Treated Water Disposed | Pore Volumes Consumed | |||
| Alta Mesa | PAA-1 | Not available | 912,909,140 | 735,467,720 | Deep Well Disposal (Extract-Injected) | 284 | 31% | NA |
| Mt. Lucas (Estimated) 1 | PAA-1 (East E) | 5,451,494 | Information not found, possibly because restoration amendment not requested | |||||
| Mt. Lucas 1,2 | PAA-2 (East EA) | 8,310,000 | 85,000,000 | 30,996,300 | Sweep, RO + Reinject + Land Application | 54 | 64% | 6.5 |
| Mt Lucas (Estimated) 1,2 | PAA-3 (East H) | 5,093,058 | Information not found | |||||
| Mt. Lucas 1,2 | PAA-4 (East HM) | 8,574,491 | 80,000,000 | 42,700,965 | Sweep, Remove and Replace with Overlying Aquifer Groundwater | 37 | 47% | 4.4 |
| Mt. Lucas 1,2 | PAA-5 (East Lillian) | 2,333,333 | 14,000,000 | 5,623,333 | Sweep, RO + Reinject + Land Application | 8 | 60% | 3.6 |
| Mt. Lucas 1,2 | PAA-6 (West M) | 7,142,857 | 64,000,000 | 31,571,429 | Sweep, Remove and Replace with Overlying Aquifer Groundwater | 32 | 51% | 4.5 |
| Mt. Lucas 1,2 | PAA-7 (West J) | 7,109,557 | 183,000,000 | 50,975,524 | Sweep, RO + Reinject + Land Application | 132 | 72% | 18.6 |
| Mt. Lucas 1,2 | PAA-8 (West South J) | 3,398,471 | 80,000,000 | 45,267,630 | Sweep, RO + Reinject + Land Application | 35 | 43% | 10.2 |
| Mt. Lucas (Estimated) 1 | PAA-9 (West J-1) | 3,144,466 | Information not found | |||||
| Kingsville Dome 3 | PAA 1 (total) | 27,279,412 | 742,000,000 | Not reported | WDW248 (1/3 of Extracted vol) | 245 | 33% | 9.0 |
| Kingsville Dome 3 | PPA 2 (total) | 31,566,456 | 997,500,000 | Not reported | WDW248 (1/3 of Extracted vol) | 329 | 33% | 10.4 |
| Kingsville Dome 3,4 | PAA 3 | 33,923,975 | 860,500,000 | Not reported | Information not found | 284 | 33% | 8.4 |
| Palangana 5 | PAA03070-004 | 20,755,295 | Restoration has not yet begun | WDW418 WDW419 | NA—Restoration has not yet begun | |||
| Palangana Dome | PAA-1 | 46,800,000 | 584,540,091 | 205,548,913 | WDW-134 (79,495,750 gal) and via irrigation or DDW (300,605,409 gal) | 379 | 65% | 8.1 |
| Rosita 3 | PAA-1 (total) | 35,766,423 | 490,000,000 | Not reported | WDW250 (1/3 of Extracted vol) | 162 | 33% | 4.5 |
| Rosita 3 | PAA-2 (total) | 26,911,765 | 732,000,000 | Not reported | WDW250 (1/3 of Extracted vol) | 242 | 33% | 9.0 |
| Operation | Production Years | Documented Maximum Release (Ci/y) 1 | Documented Average Annual Release (Ci/y) 1 | U3O8 Production (lb) | Normalized Rn Release (Ci/lb U3O8) 2,3 | Total Rn Release (Ci) |
|---|---|---|---|---|---|---|
| Alta Mesa | 6 | 740 | 472 | 4,621,600 | 0.00061 | 2832 |
| Kingsville Dome | 8 | 6958 | 1291 | 4,240,200 | 0.0024 | 10,328 |
| Mt. Lucas | 4 | 2,069,425 | 0.00013 | 551 | ||
| Palangana Dome | 4 | 340,000 | 0.00106 | 650 | ||
| Palangana | 4 | 560,000 | 0.00106 | 1070 | ||
| Rosita | 6 | 2,650,200 | 0.00106 | 5065 |
Appendix B
References
- Young, S.C.; Knox, P.R.; Kelley, V.; Budge, T.; Deeds, N.; Galloway, W.E.; Baker, E.T. Stratigraphy, Lithology, and Hydraulic Properties of the Chicot and Evangeline Aquifers in the LSWP Study Area, Central Texas Coast. In Aquifers of the Gulf Coast of Texas; Report, 365; Mace, R.E., Davidson, S.C., Angle, E.S., Mullican, W.F.I., Eds.; Texas Water Development Board: Austin, TX, USA, 2006; pp. 129–138. Available online: https://www.twdb.texas.gov/publications/reports/numbered_reports/doc/R365/Report365.asp (accessed on 9 March 2022).
- Buma, G.; Johnson, P.H.; Bienek, G.K.; Watson, C.G.; Noyes, H.; Capuano, R. Analysis of Groundwater Criteria and Recent Restoration Attempts after In Situ Uranium Leaching; Resource Engineering and Development, Inc.: Midvale, UT, USA, 1981; p. 302. [Google Scholar]
- IAEA. Significance of Mineralogy in the Development of Flowsheets for Processing Uranium Ores; STI/DOC/10/196; International Atomic Energy Association: Vienna, Austria, 1980. [Google Scholar]
- Knape, B.K. Underground Injection Operations in Texas: A Classification and Assessment of Underground Injection Activities; Report 291; Texas Department of Water Resources: Austin, TX, USA, 1984; p. 252.
- DOE/EIA. Decommissioning of U.S. Uranium Production Facilities; U.S. Department of Energy: Washington, DC, USA, 1995.
- Mackin, P.C.; Daruwalla, D.; Winterle, J.; Smith, M.; Pickett, D.A. A Baseline Risk-Informed Performance-Based Approach for In Situ Leach Uranium Extraction Licensees; Center for Nuclear Waste Regulatory Analyses: San Antonio, TX, USA, 2001; 197p. [Google Scholar]
- Davis, J.A.; Curtis, G.P. Consideration of Geochemical Issues in Groundwater Restoration at Uranium In-Situ Leach Mining Facilities; NUREG/CR-6870; U.S. Nuclear Regulatory Commission, Division of Fuel, Engineering, and Radiological Research & U.S. Geological Survey: Washington, DC, USA, 2007.
- U.S. Nuclear Regulatory Commission. Generic Environmental Impact Statement for In-Situ Leach Uranium Milling Facilities; Final Report; U.S. Nuclear Regulatory Commission: Rockville, MD, USA, 2009; Volume 1–2, p. 1295.
- National Academy of Science. Evolutionary and Revolutionary Technologies for Mining; National Academy Press: Washington, DC, USA, 2002; p. 102. [Google Scholar]
- Nicot, J.-P.; Hebel, A.K.; Ritter, S.M.; Walden, S.; Baier, R.; Galusky, P.; Beach, J.; Kyle, R.; Symank, L.; Breton, C. Current and Projected Water Use in the Texas Mining and Oil and Gas Industry; Bureau of Economic Geology: Austin, TX, USA, 2011; p. 381. [Google Scholar]
- Marlowe, J.I. Environmental Overview of Unconventional Extraction of Uranium; Final Report Nov 80–Feb 81; PB-84-141167 United StatesWed Feb 06 18:37:12 EST 2008NTIS, PC A07/MF A01.EDB-84-048949English; Wapora, Inc.: Chevy Chase, MD, USA, 1984; 132p. [Google Scholar]
- Younger, P.L. The water footprint of mining operations in space and time—A new paradigm for sustainability assessments? In Proceedings of the Australasian Institute of Mining and Metallurgy Publication Series, Brisbane, Australia, 14–16 November; pp. 13–21.
- Kasper, D.R.; Hartin, H.W.; Munsey, L.D.; Bhappu, R.B.; Chase, C.K. Environmental Assessment of In Situ Mining; Open File Report 101-80; U.S. Bureau of Mines: Washington, DC, USA, 1979; p. 292.
- Henry, C.D.; Galloway, W.E.; Smith, G.E. Considerations in the Extraction of Uranium from a Fresh-Water Aquifer Miocene Oakville Sandstone, South Texas; Report of Investigations No. 126; Bureau of Economic Geology: Austin, TX, USA, 1982. [Google Scholar]
- Biwer, B.M.; LePoire, D.J.; Kamboj, S.; Chang, Y.-S. Technical Manual and User’s Guide for MILDOS-AREA Version 4; U.S. Nuclear Regulatory Commission: Argonne, IL, USA, 2016; p. 198.
- Mudd, G.M. Radon releases from Australian uranium mining and milling projects: Assessing the UNSCEAR approach. J. Environ. Radioact. 2008, 99, 288–315. [Google Scholar] [CrossRef] [PubMed]
- Brown, S.H.; Smith, R.C. A model for determining the overall radon release rate and annual source term for a commercial in-situ leach uranium facility. In Proceedings of the International Conference on Radiation Hazards in Mining: Control, Measurement and Medical Aspects, Colorado School of Mines, Golden, CO, USA, 4–9 October 1981; pp. 794–800. [Google Scholar]
- Gallegos, T.J.; Stengel, V.G.; Scott, A.; Qi, S.L. Data Compiled on historical water use, spatial land disturbance, aquifer disturbance and uranium produced by In Situ Recovery of Uranium from Sandstone Hosted Uranium Deposits in the South Texas Coastal Plain, USA; U.S. Geological Survey Data Release. 2022. Available online: https://doi.org/10.5066/P9U7QKC1 (accessed on 9 March 2022).
- Texas Commission on Environmental Quality. Permit to Conduct Underground Injection under Provisions of Chapter 26, Texas Water Code; Permit No. 02381 for Everest Minerals Corporation Mt. Lucas Mining Project; Texas Commission on Environmental Quality: Austin, TX, USA, 12 January 1981; p. 19.
- U.S. Environmental Protection Agency. Underground Injection Control (UIC) Aquifer Exemption Data. Available online: https://www.epa.gov/uic/aquifer-exemption-data (accessed on 5 March 2019).
- U.S. Environmental Protection Agency. Aquifer Exemptions in the Underground Injection Control Program. Available online: https://www.epa.gov/uic/aquifer-exemptions-underground-injection-control-program (accessed on 15 November 2021).
- IAEA. An Overview of Operations-Annexes Companion CD: IAEA Nuclear Energy Series: In Situ Leach Uranium Mining; International Atomic Energy Agency: Vienna, Austria, 2016; p. 153. [Google Scholar]
- Heitzenrater, R. Texas Commission on Environmental Quality Class III Injection Volumes. 2017. Available online: https://www.tceq.texas.gov/assets/public/permitting/waste/ihw/FY2017%20RCRA%20UIC%20QAPP%20Final.pdf (accessed on 9 March 2022).
- Texas Commission on Environmental Quality. Permit to conduct Class I Underground Injection under Provisions of Chapters 26 & 27 Texas Water Code; Permit WDW-248 Issued to URI, Inc.; Texas Commission on Environmental Quality: Austin, TX, USA, 4 May 2006; p. 8.
- Uranium Producers of America. Comments on Docket ID Number EPAHQ-OAR-2012-0788; FRL-9909-20-OAR RIN 2060-AP43 Health and Environmental Protection Standards for Uranium and Thorium Mill Tailings Proposed Rule; Federal Register; Volume 80, Number 16, Monday, 26 January 2015/Proposed Rule. 27 May 2015; Environmental Protection Agency: Washington, DC, USA, 2015.
- Walton-Day, K.; Blake, J.M.; Seal, R.R.; Gallegos, T.J.; Dupre, J.; Becher, K. Geo-enviromental Model for Roll-type Uranium Deposits in the Texas Gulf Coast. Minerals, 2022; in review. [Google Scholar]
- Hall, S. Groundwater Restoration at Uranium In-Situ Recovery Mines, South Texas Coastal Plain; U.S. Geological Survey Open File Report 2009-1143; U.S. Geological Survey: Reston, VI, USA, 2009; p. 31.
- Pelizza, M. Personal Communication Regarding Water Use During In Situ Recovery of Uranium in Texas; Uranium Resources, Inc.: Centennial, CO, USA, 2016. [Google Scholar]
- Pelizza, M.S.; McCarn, D.W. Licensing of in situ leach recovery operations for the Crownpoint and Church Rock uranium deposits, New Mexico: A case study, Recent developments in uranium resources and production with emphasis on in situ leach mining. In IAEA-TECDOC-1396; IAEA: Vienna, Austria, 2004; pp. 153–173. [Google Scholar]
- IAEA. IAEA Nuclear Energy Series: In Situ Leach Uranium Mining: An Overview of Operations; International Atomic Energy Agency: Vienna, Austria, 2016; p. 76. [Google Scholar]
- Everest Minerals Corporation. Environmental Assessment Related to Mt. Lucas Project Live Oak County, Texas; Division of Environmental Programs, Bureau of Radiation Control, Texas Department of Health: Arlington, TX, USA, 1981.
- Dahlkamp, F.J. Uranium Deposits of the World: USA and Latin America; Springer: Berlin/Heidelberg, Germany, 2010. [Google Scholar]
- U.S. Geological Survey. Geologic Database of Texas. Available online: https://databasin.org/datasets/83f6b3c68aaa4fdb8f2f22e7aeb7818f/ (accessed on 18 February 2022).
- Young, S.C.; Ewing, T.; Hamlin, S.; Baker, E.; Lupton, D. Updating the Hydrogeologic Framework of the Northern Portion of the Gulf Coast Aquifer; Texas Water Development Board. 2012; p. 285. Available online: https://www.twdb.texas.gov/publications/reports/contracted_reports/doc/1004831113_GulfCoast.pdf (accessed on 12 October 2021).
- Young, S.C.; Knox, P.R.; Baker, E.; Budge, T.; Hamlin, S.; Galloway, B.; Kalbouss, R.; Deeds, N. Hydrostratigraphy of the Gulf Coast Aquifer from the Brazos River to the Rio Grande; Texas Water Development Board. 2010; p. 203. Available online: https://www.twdb.texas.gov/publications/reports/contracted_reports/doc/0804830795_Gulf_coast_hydrostrati.graphy_wcover.pdf (accessed on 12 October 2021).
- Morton, R.A.; Jirik, L.A.; Galloway, W.E. Middle-Upper Miocene Depositional Sequences of the Texas Coastal Plain and Continental Shelf; Bureau of Economic Geology Report of Investigations No. 174; The University of Texas at Austin: Austin, TX, USA, 1988; p. 40. [Google Scholar]
- Hall, S.M.; Mihalasky, M.J.; Tureck, K.R.; Hammarstrom, J.M.; Hannon, M.T. Genetic and grade and tonnage models for sandstone-hosted roll-type uranium deposits, Texas Coastal Plain, USA. Ore Geol. Rev. 2017, 80, 716–753. [Google Scholar] [CrossRef]
- Baker, E.T., Jr. Stratigraphic and Hydrogeologic Framework of Part of the Coastal Plain of Texas; Texas Department of Water Resources Report 236; Texas Department of Water Resources: Austin, TX, USA, 1979; p. 43.
- Eargle, D.H. Nomenclature of Formations of Claiborne Group, Middle Eocene, Coastal Plain of Texas; Contributions to General Geology, 1967; U.S. Geological Survey Bulletin 1251-D; United States Government Printing Office: Washington, DC, USA, 1968; pp. D1–D25. [Google Scholar] [CrossRef]
- George, P.G.; Mace, R.E.; Petrossian, R. Aquifers of Texas; Report 380; Texas Water Development Board: Austin, TX, USA, 2011; p. 182. [Google Scholar]
- Ryder, P.D. Ground water atlas of the United States: Segment 4, Oklahoma, Texas, U.S. Geological Survey Hydrologic Atlas 730–E; U.S. Geological Survey: Reston, VI, USA, 1996; p. 30. Available online: https://pubs.er.usgs.gov/publication/ha730E (accessed on 9 March 2022).
- Uranium Resources Inc. Environmental Assessment: Rogers In Situ Uranium Leach Project; IAEA: Vienna, Austria, 1986. [Google Scholar]
- Dean, J.; U.S. Environmental Protection Agency. Personal Communication Regarding the Aquifer Exemption Data in Texas; EPA: Washington, DC, USA, 2018.
- Grene, C.J. Underground Injection Control Technical Assistance Manual: Subsurface Disposal and Solution Mining; Report 274; Texas Department of Water Resources: Austin, TX, USA, 1983.
- Everest Minerals Corporation; Mt. Lucas/Mt. Lucas West of Everest Minerals Corporation. Application for Amendement to the Texas Department of Water Resources; Permit No. 02381 Production Area No. 8; Division of Environmental Programs, Bureau of Radiation Control, Texas Department of Health: Corpus Christi, TX, USA, 1983; p. 113. [Google Scholar]
- Everest Exploration, Inc. Application for Production Area Authorization In Situ Uranium Mining Class III Injection Wells; UR02318-081; Texas Department of Water Resources: Corpus Christi, TX, USA, 1986; p. 117. [Google Scholar]
- Clay, J. Personal Communication Regarding Water Use During In Situ Recovery of Uranium in Wyoming; Cameco, Inc.: Saskatoon, SK, Canada, 2014. [Google Scholar]
- SC&A, Inc. Technical and Regulatory Support to Develop a Rulemaking to Potentially Modify the NESHAP Subpart W Standard for Radon Emissions from Operating Mill Tailings (40 CFR 61.250); Report prepared for EPA, Contract Number EP-D-10-042, Work Assignments No. 1-09 & 2-03, Support to Develop a Background Information Document (BID); SC&A, Inc.: Vienna, VA, USA, 2016; p. 142. [Google Scholar]
- Mihalasky, M.J.; Hall, S.M.; Hammarstrom, J.M.; Tureck, K.R.; Hannon, M.T.; Breit, G.N.; Zielinski, R.A.; Elliott, B. Assessment of undiscovered sandstone-hosted uranium resources in the Texas Coastal Plain, 2015; U.S. Geological Survey Fact Sheet: 2015-3069; U.S. Geological Survey: Reston, VA, USA, 2015; p. 4.
- Uranium Resources, Inc. United States Securities and Exchange Commission. Form 10-K, Annual Report Pursuant to Section 13 or 15(D) of The Securities Exchange Act of 1934; For the Fiscal Year Ended 31 December 2016; Uranium Resources, Inc.: Centennial, CO, USA, 2016; p. 101. [Google Scholar]


| Mine Name | Fluid Disposed (MG) | Production U3O8 (lb) | Fluid Disposed (MG)/lb U3O8 (Total) 9 | ||||
|---|---|---|---|---|---|---|---|
| Mining | Restoration 7 | Total 8 | Mining | Restoration | Total | ||
| Alta Mesa Project (PAA-1 only) 1 | 224 | 284 | 508 | 1,610,000 (PAA-1) 4,621,600 (total) | 48 | 176 (PAA-1 only) | 225 (partial restoration) |
| Kingsville Dome 2 | 454 | 858 | 1312 | 4,240,200 | 107 | 202 | 309 |
| Mt. Lucas Mine 3 | 148 (estimated) | 299 | 447 | 2,069,425 | 72 | 144 | 216 |
| Palangana 4 | 158 | Not begun | 158 mining only | 560,000 | 282 | Not begun yet | 282 (mining only) |
| Palangana Dome 5 | 112 | 379 | 491 | 340,000 | 329 | 1115 | 1444 |
| Rosita 6 (PAA-1, PAA-2) | 340 | 403 | 743 | 2,650,200 | 128 | 152 | 280 |
| Average all mines (gal/lb U3O8) 10,12 | 137 | 358 | 495 | ||||
| Average excluding ammonium-based (gal/lb U3O8) 11,12 | 89 | 169 | 258 | ||||
Publisher’s Note: MDPI stays neutral with regard to jurisdictional claims in published maps and institutional affiliations. |
© 2022 by the authors. Licensee MDPI, Basel, Switzerland. This article is an open access article distributed under the terms and conditions of the Creative Commons Attribution (CC BY) license (https://creativecommons.org/licenses/by/4.0/). Writings prepared by U.S. Government employees as part of their official duties, including this paper, cannot be copyrighted and are in the public domain.
Share and Cite
Gallegos, T.J.; Scott, A.M.; Stengel, V.G.; Teeple, A.P. A Methodology to Assess the Historical Environmental Footprint of In-Situ Recovery (ISR) of Uranium: A Demonstration in the Goliad Sand in the Texas Coastal Plain, USA. Minerals 2022, 12, 369. https://doi.org/10.3390/min12030369
Gallegos TJ, Scott AM, Stengel VG, Teeple AP. A Methodology to Assess the Historical Environmental Footprint of In-Situ Recovery (ISR) of Uranium: A Demonstration in the Goliad Sand in the Texas Coastal Plain, USA. Minerals. 2022; 12(3):369. https://doi.org/10.3390/min12030369
Chicago/Turabian StyleGallegos, Tanya J., Anne M. Scott, Victoria G. Stengel, and Andrew P. Teeple. 2022. "A Methodology to Assess the Historical Environmental Footprint of In-Situ Recovery (ISR) of Uranium: A Demonstration in the Goliad Sand in the Texas Coastal Plain, USA" Minerals 12, no. 3: 369. https://doi.org/10.3390/min12030369