
Characterization of Bentonites from the In Situ ABM5 Heater Experiment at Äspö Hard Rock Laboratory, Sweden

 , , ,
, , ,
Abstract
:1. Introduction
2. Materials and Methods
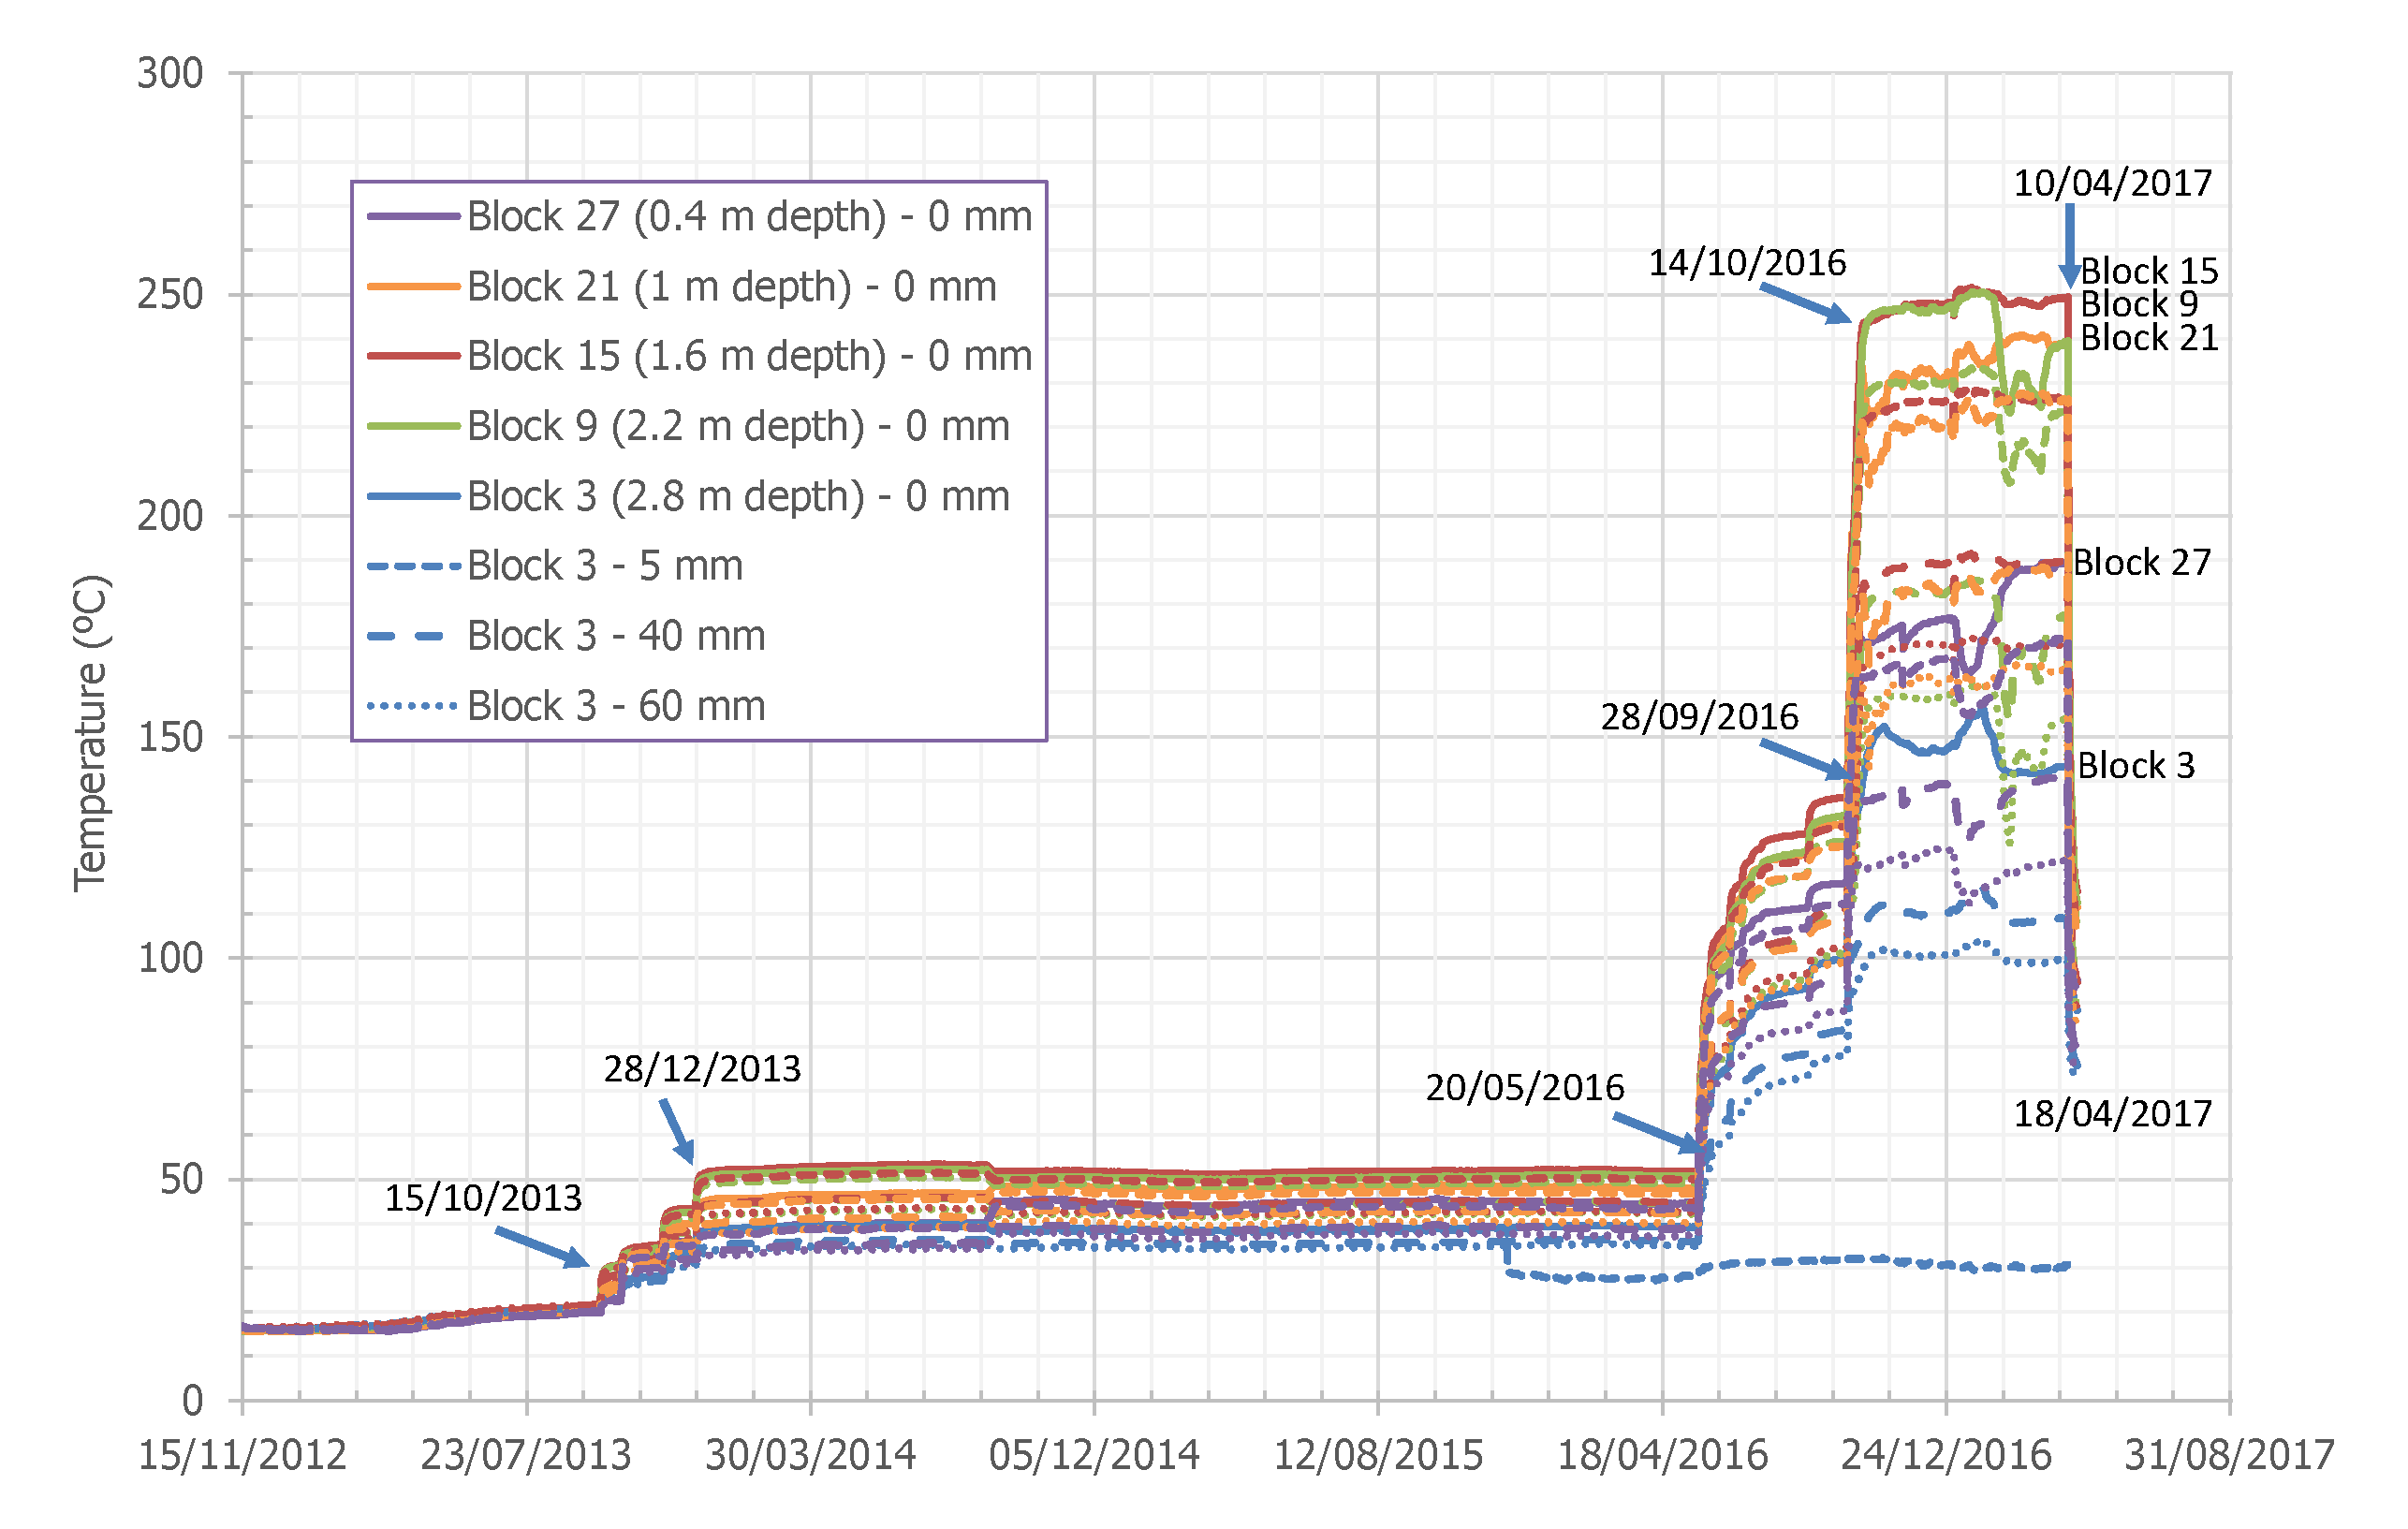
2.1. ABM5 Experiment
2.2. Materials
2.3. Analytical Methods
2.3.1. Physical Properties
2.3.2. Mineralogical Analysis
2.3.3. Geochemical Analysis of Solid Samples
2.3.4. Physico-Chemical Characterization
2.3.5. Pore Water Chemistry
2.3.6. Water Chemical Analyses
3. Results
3.1. Physical Properties
3.2. Mineralogy
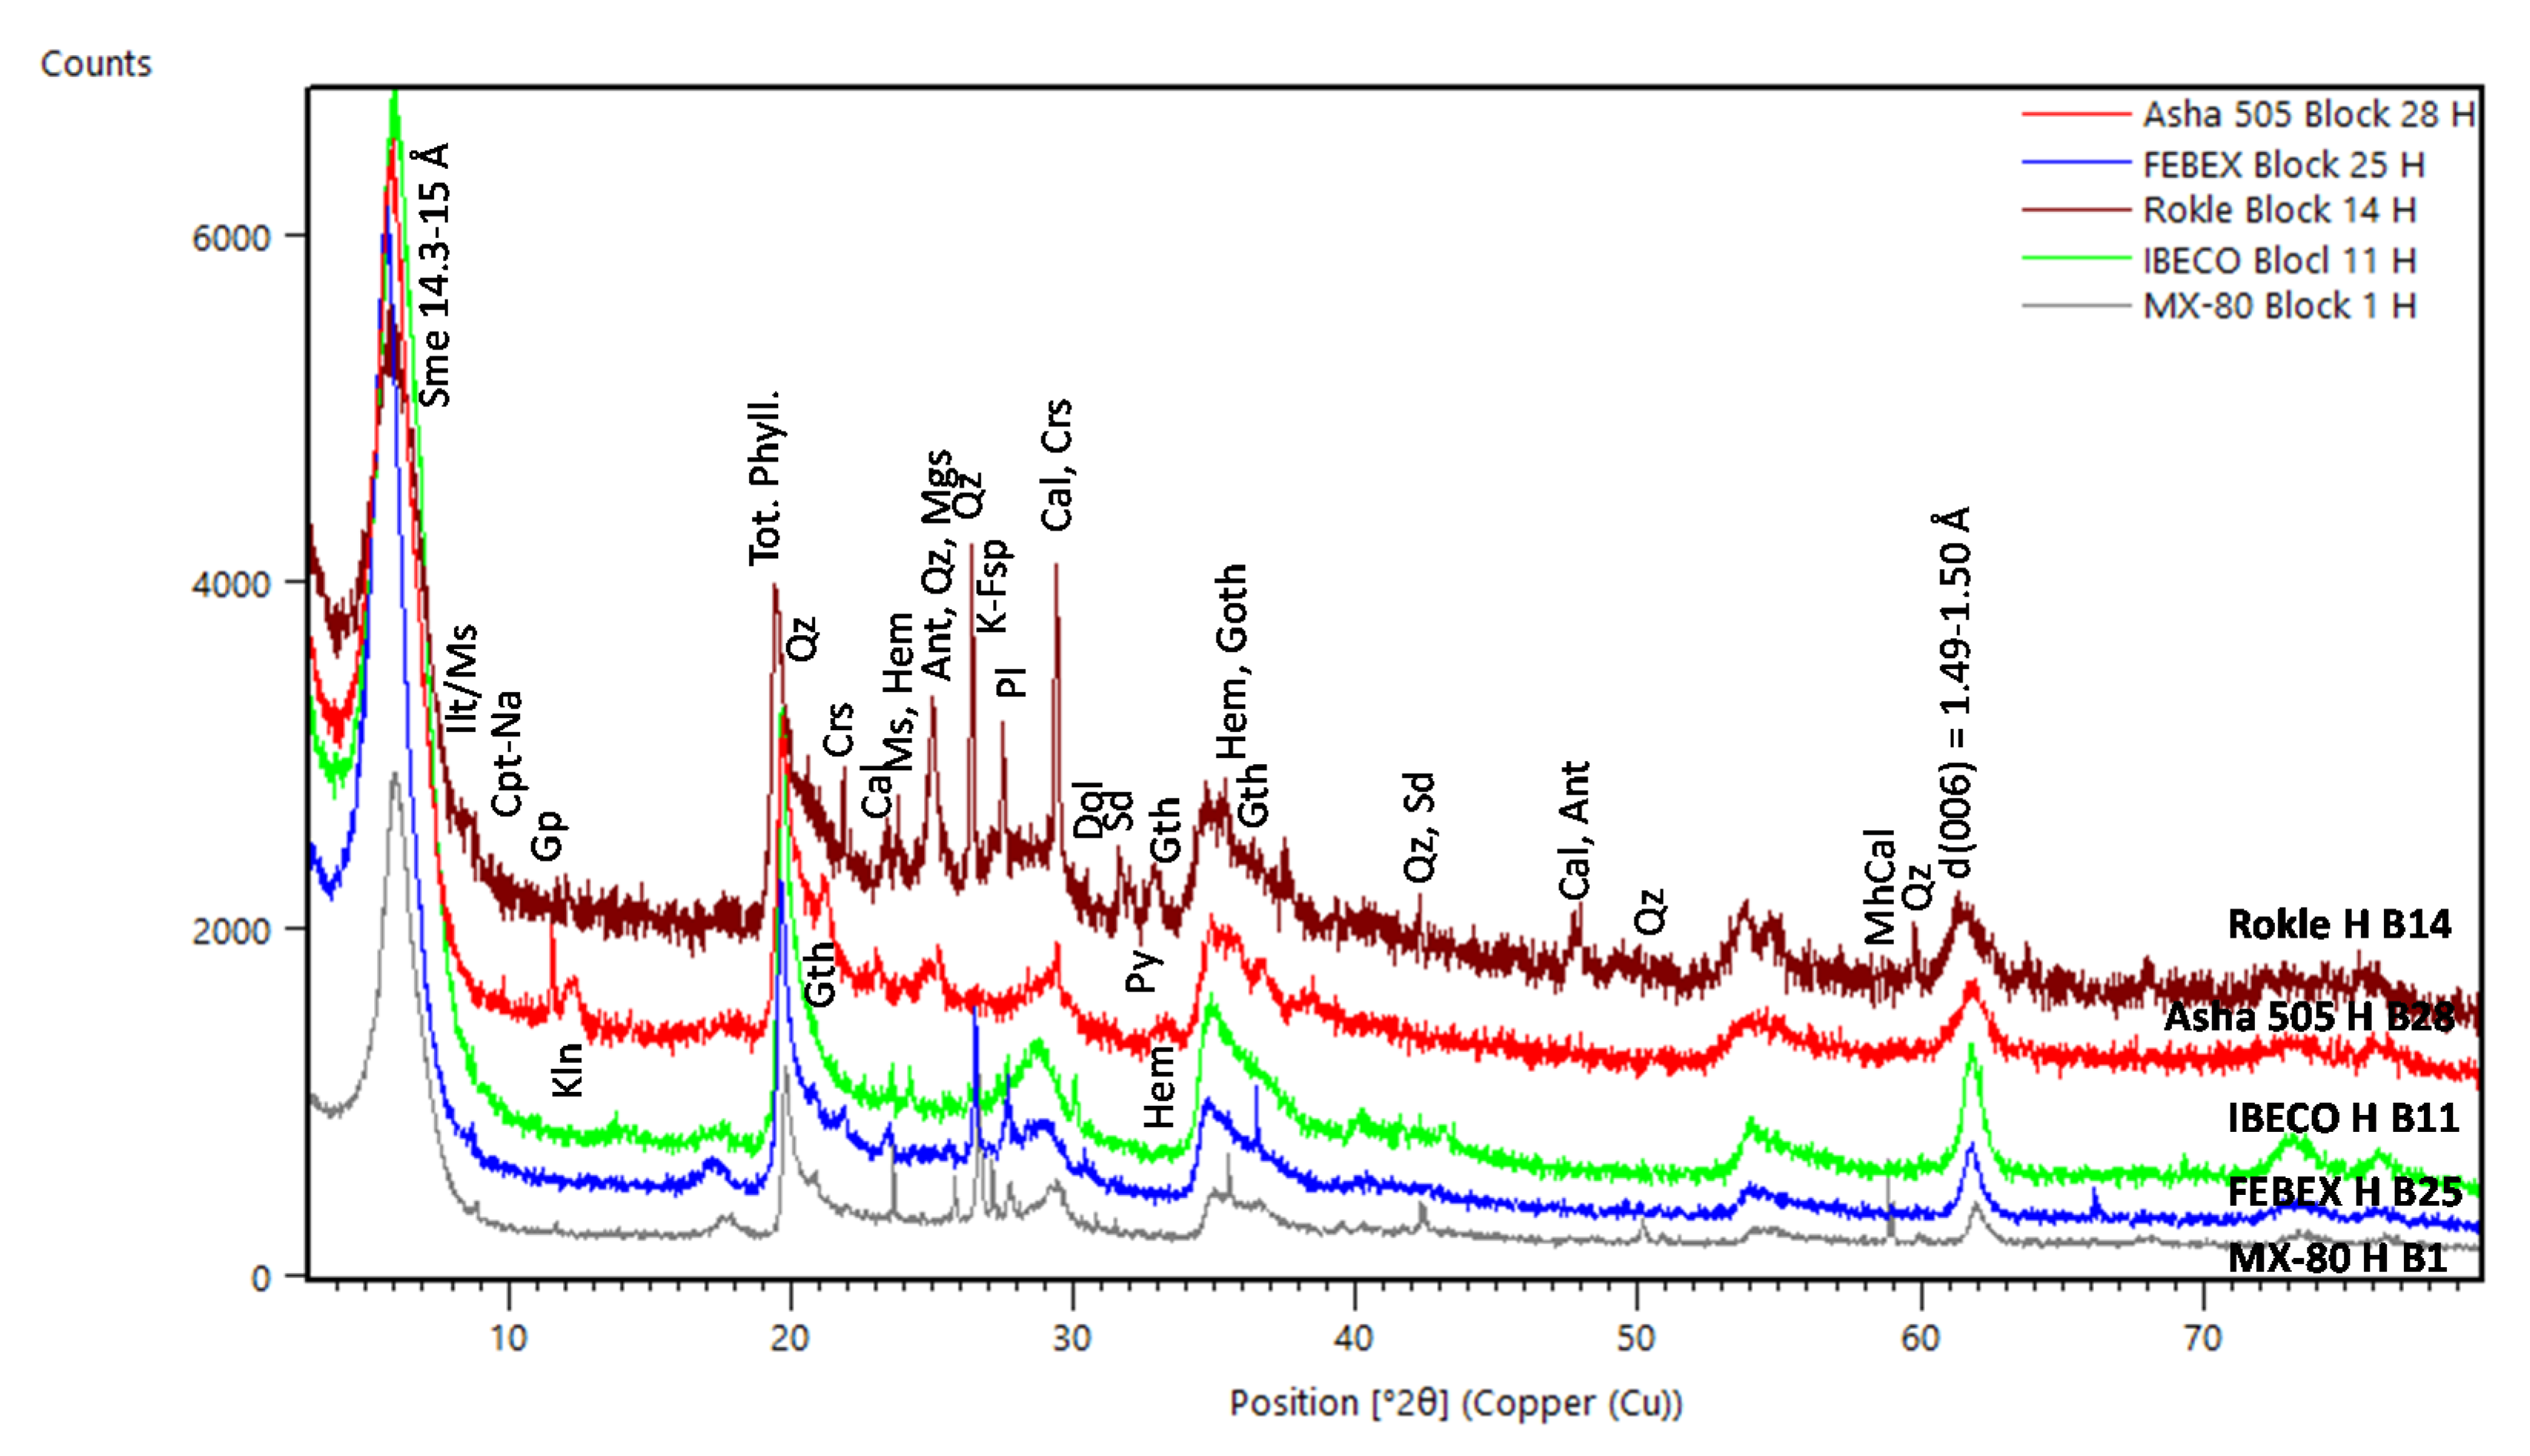
3.2.1. XRD Analysis
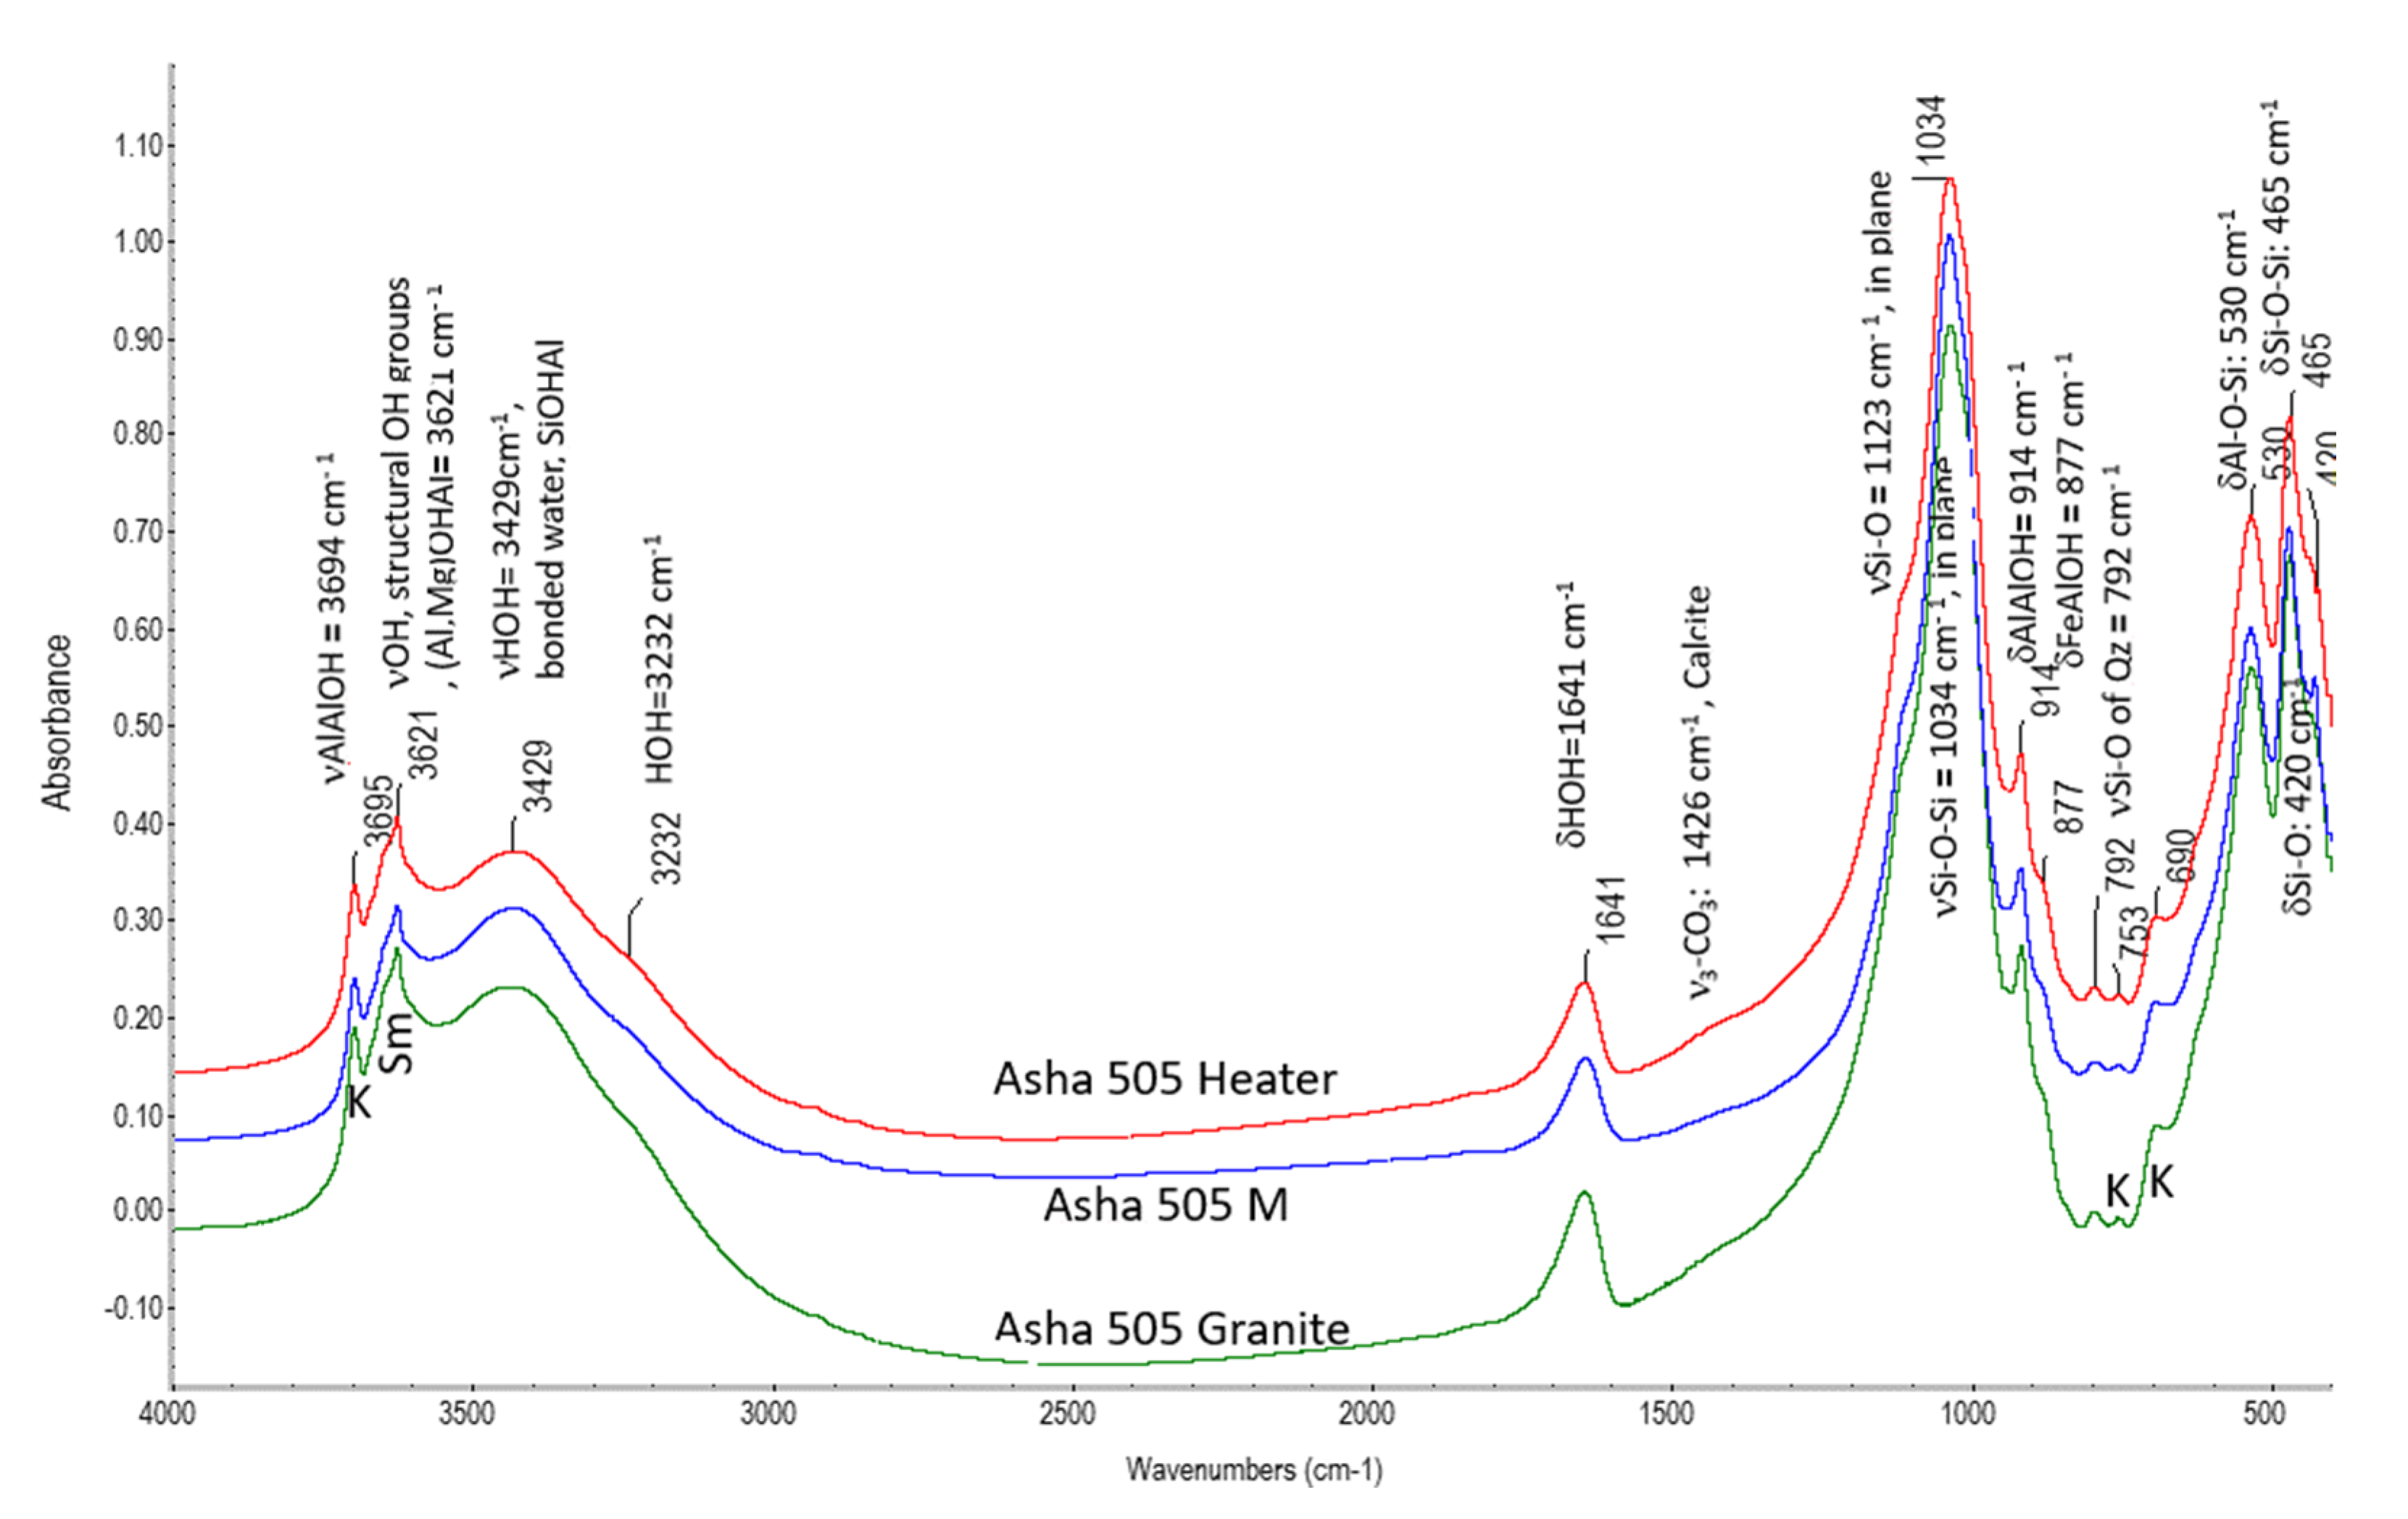
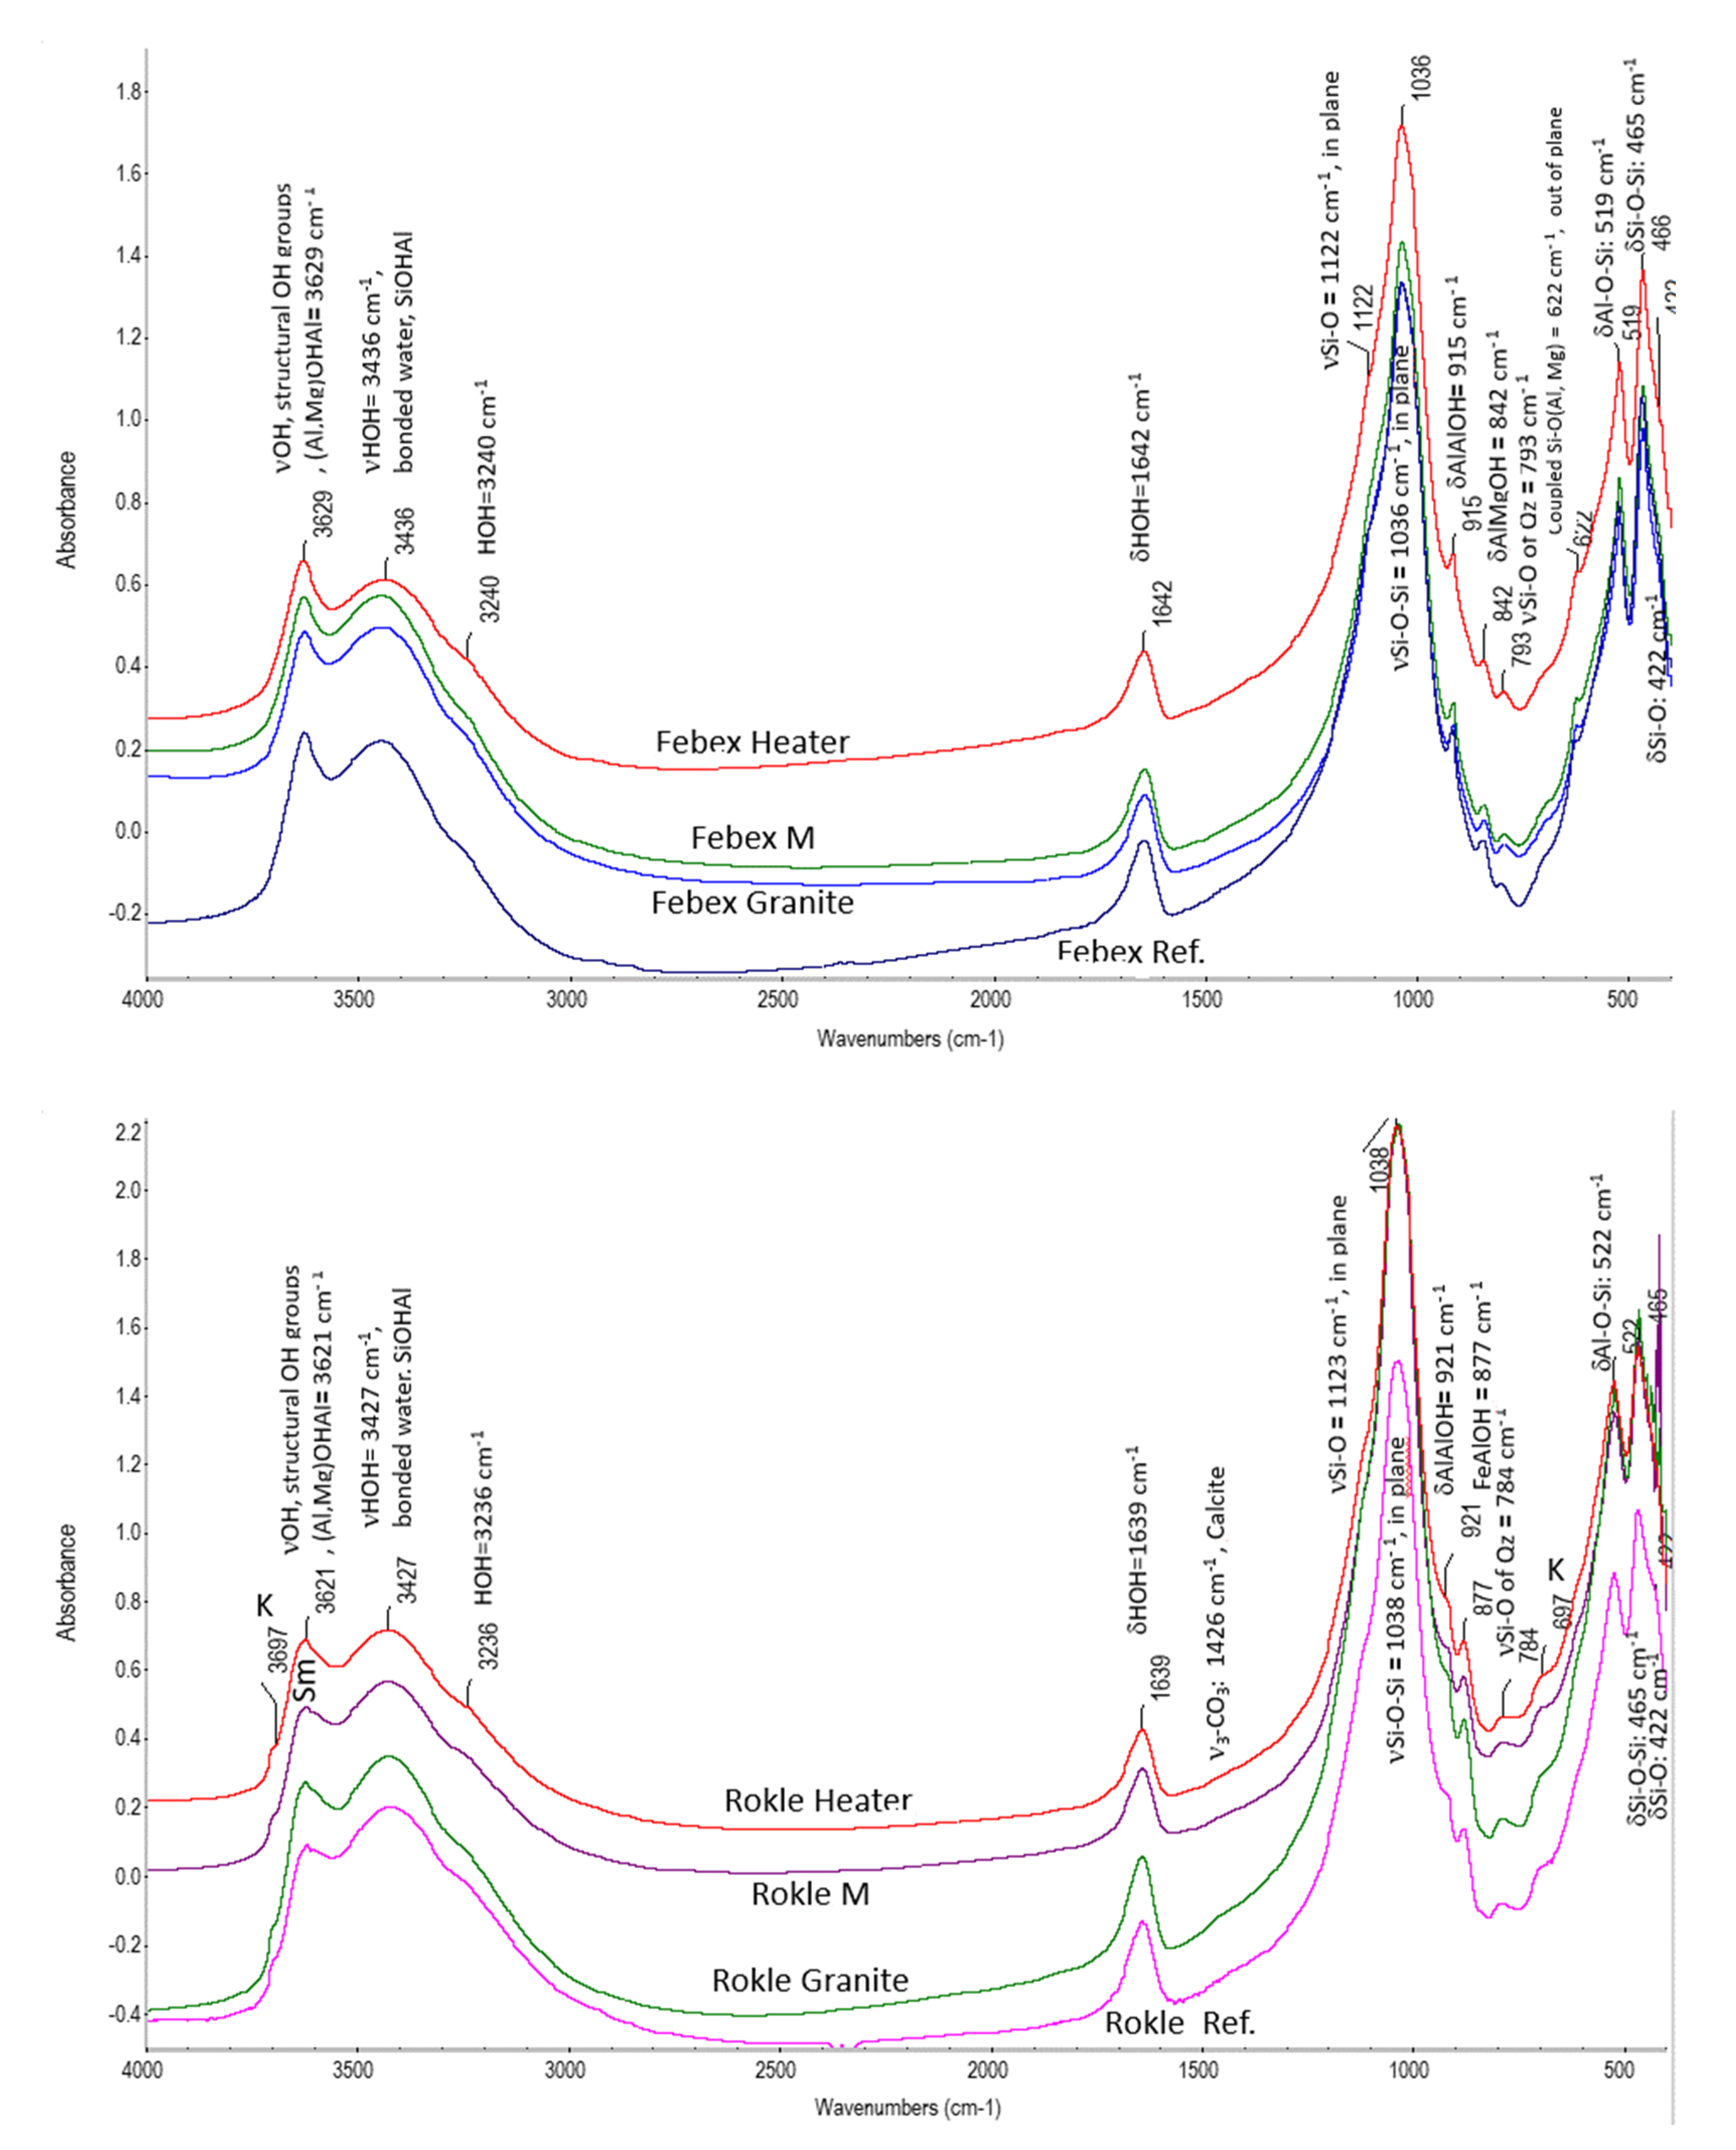
3.2.2. FTIR Analysis
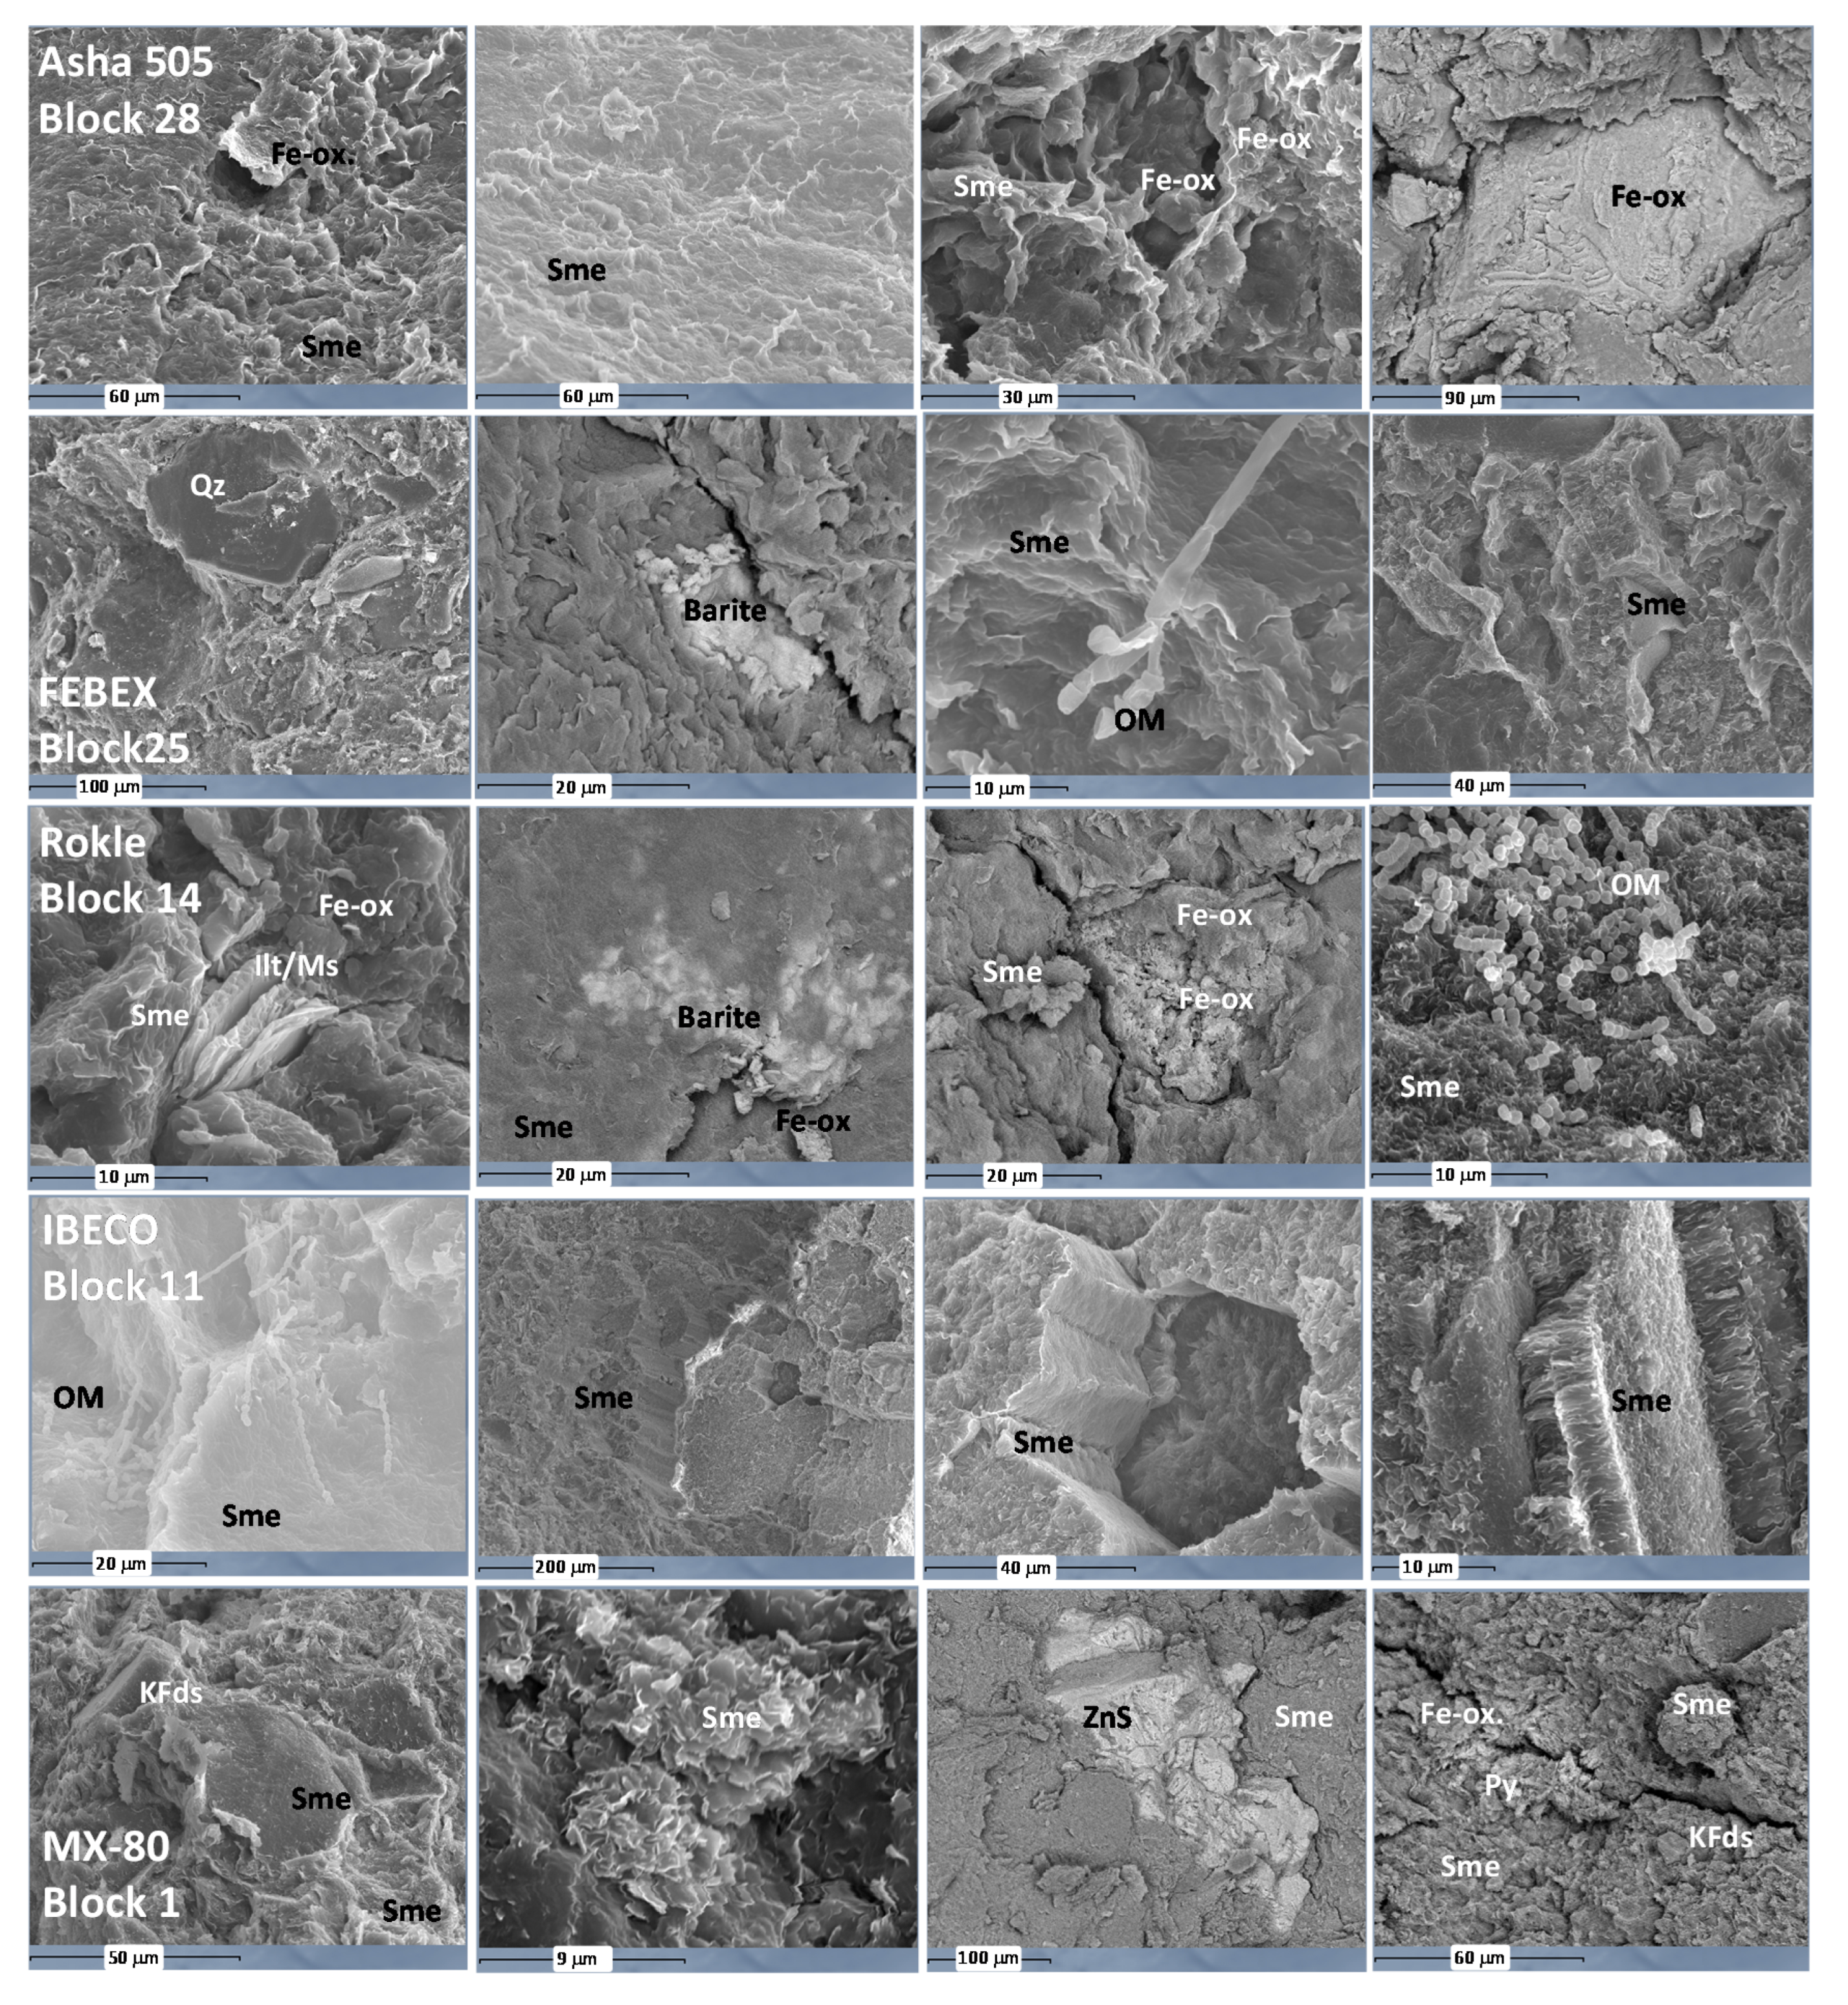
3.2.3. SEM Analysis
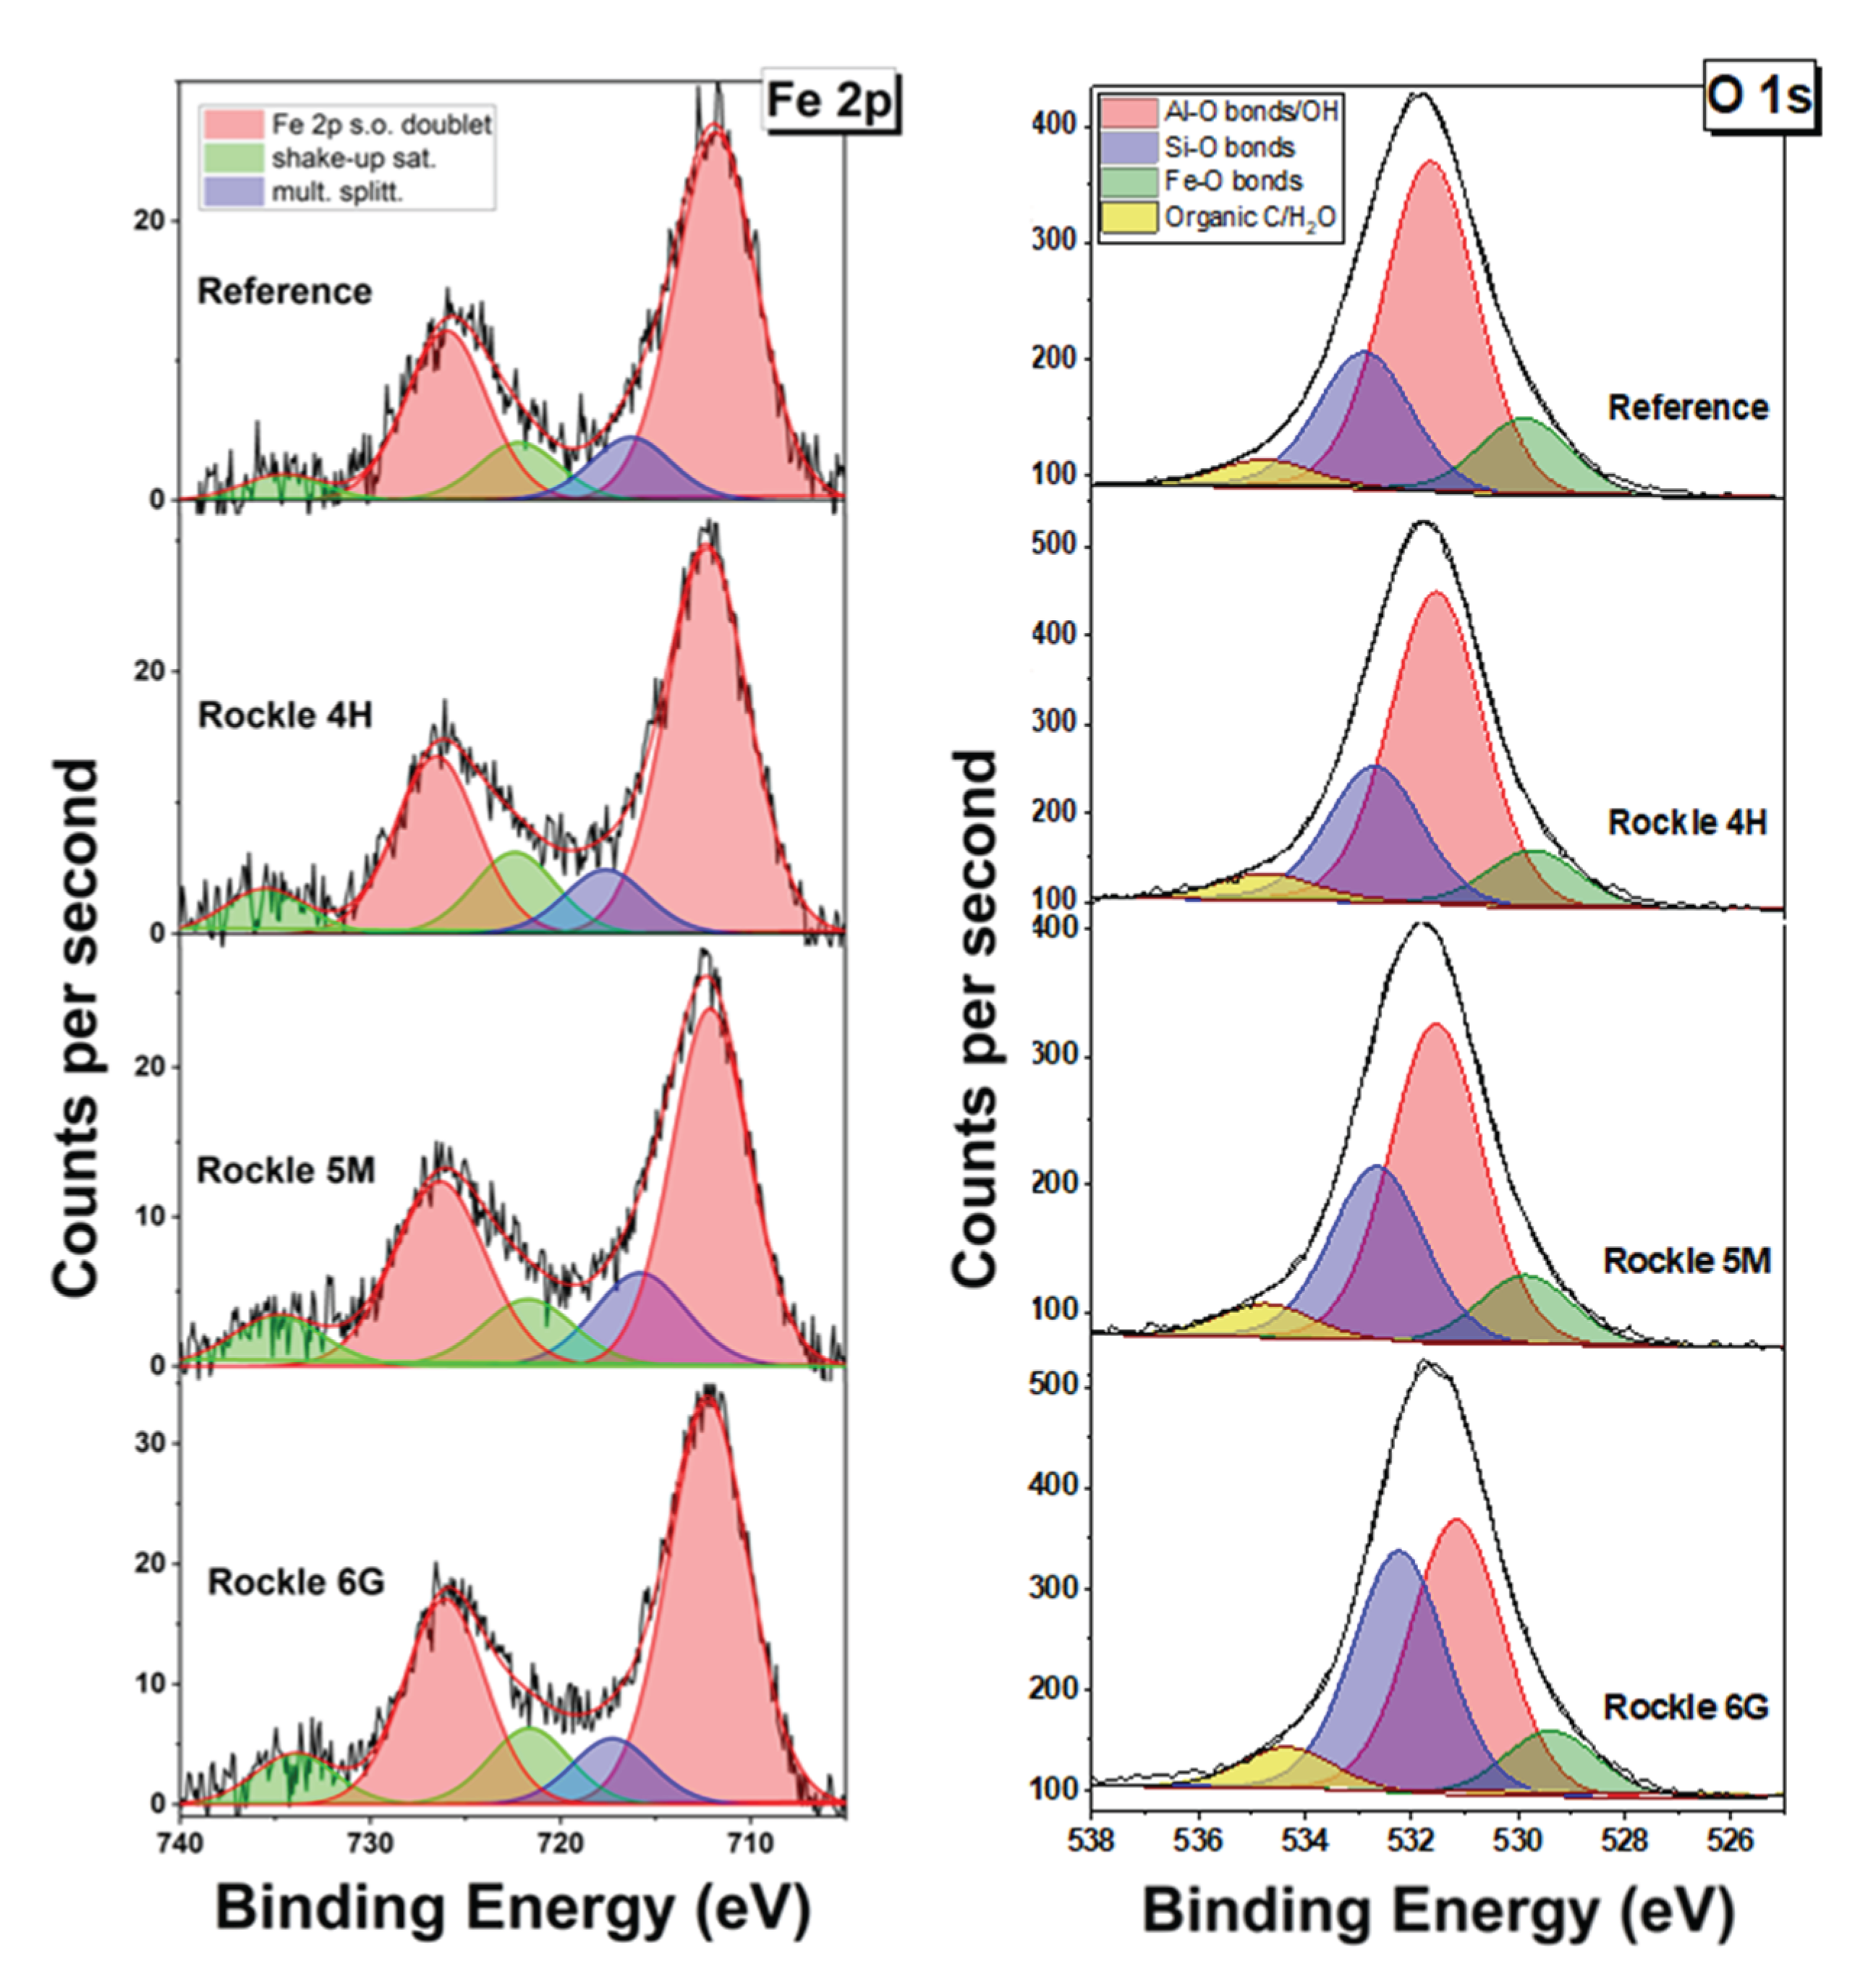
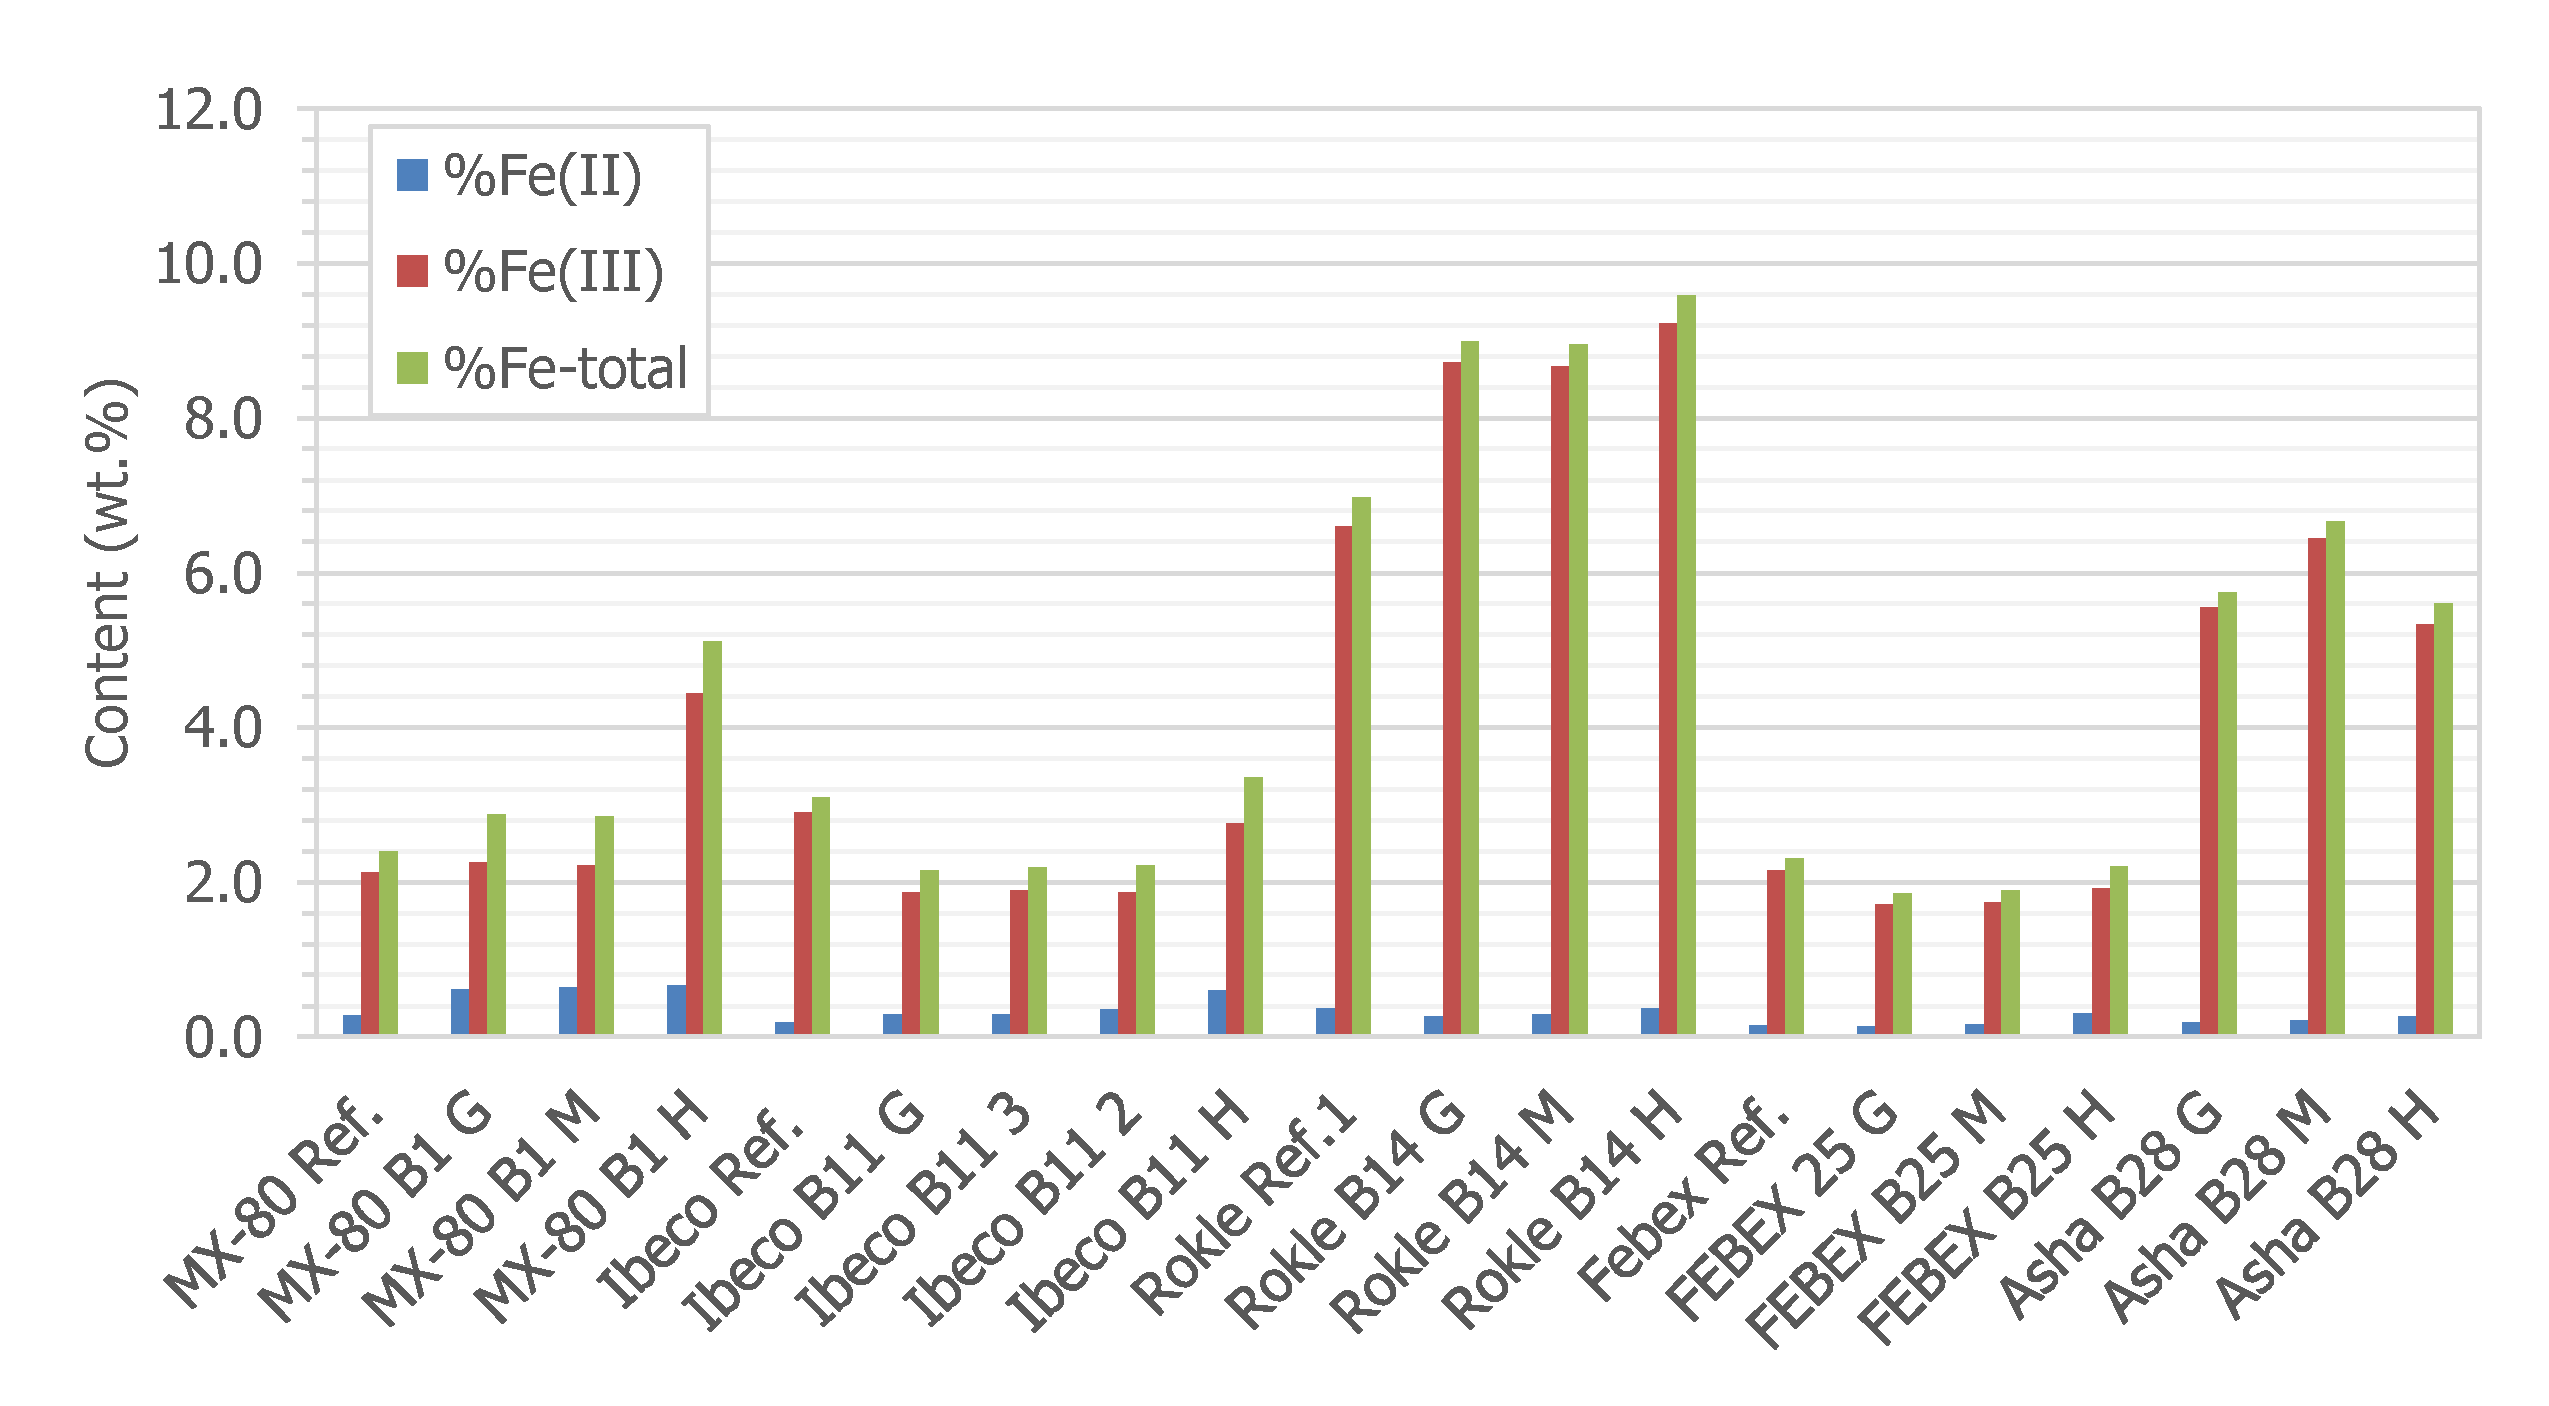
3.2.4. XPS and Mössbauer Analysis
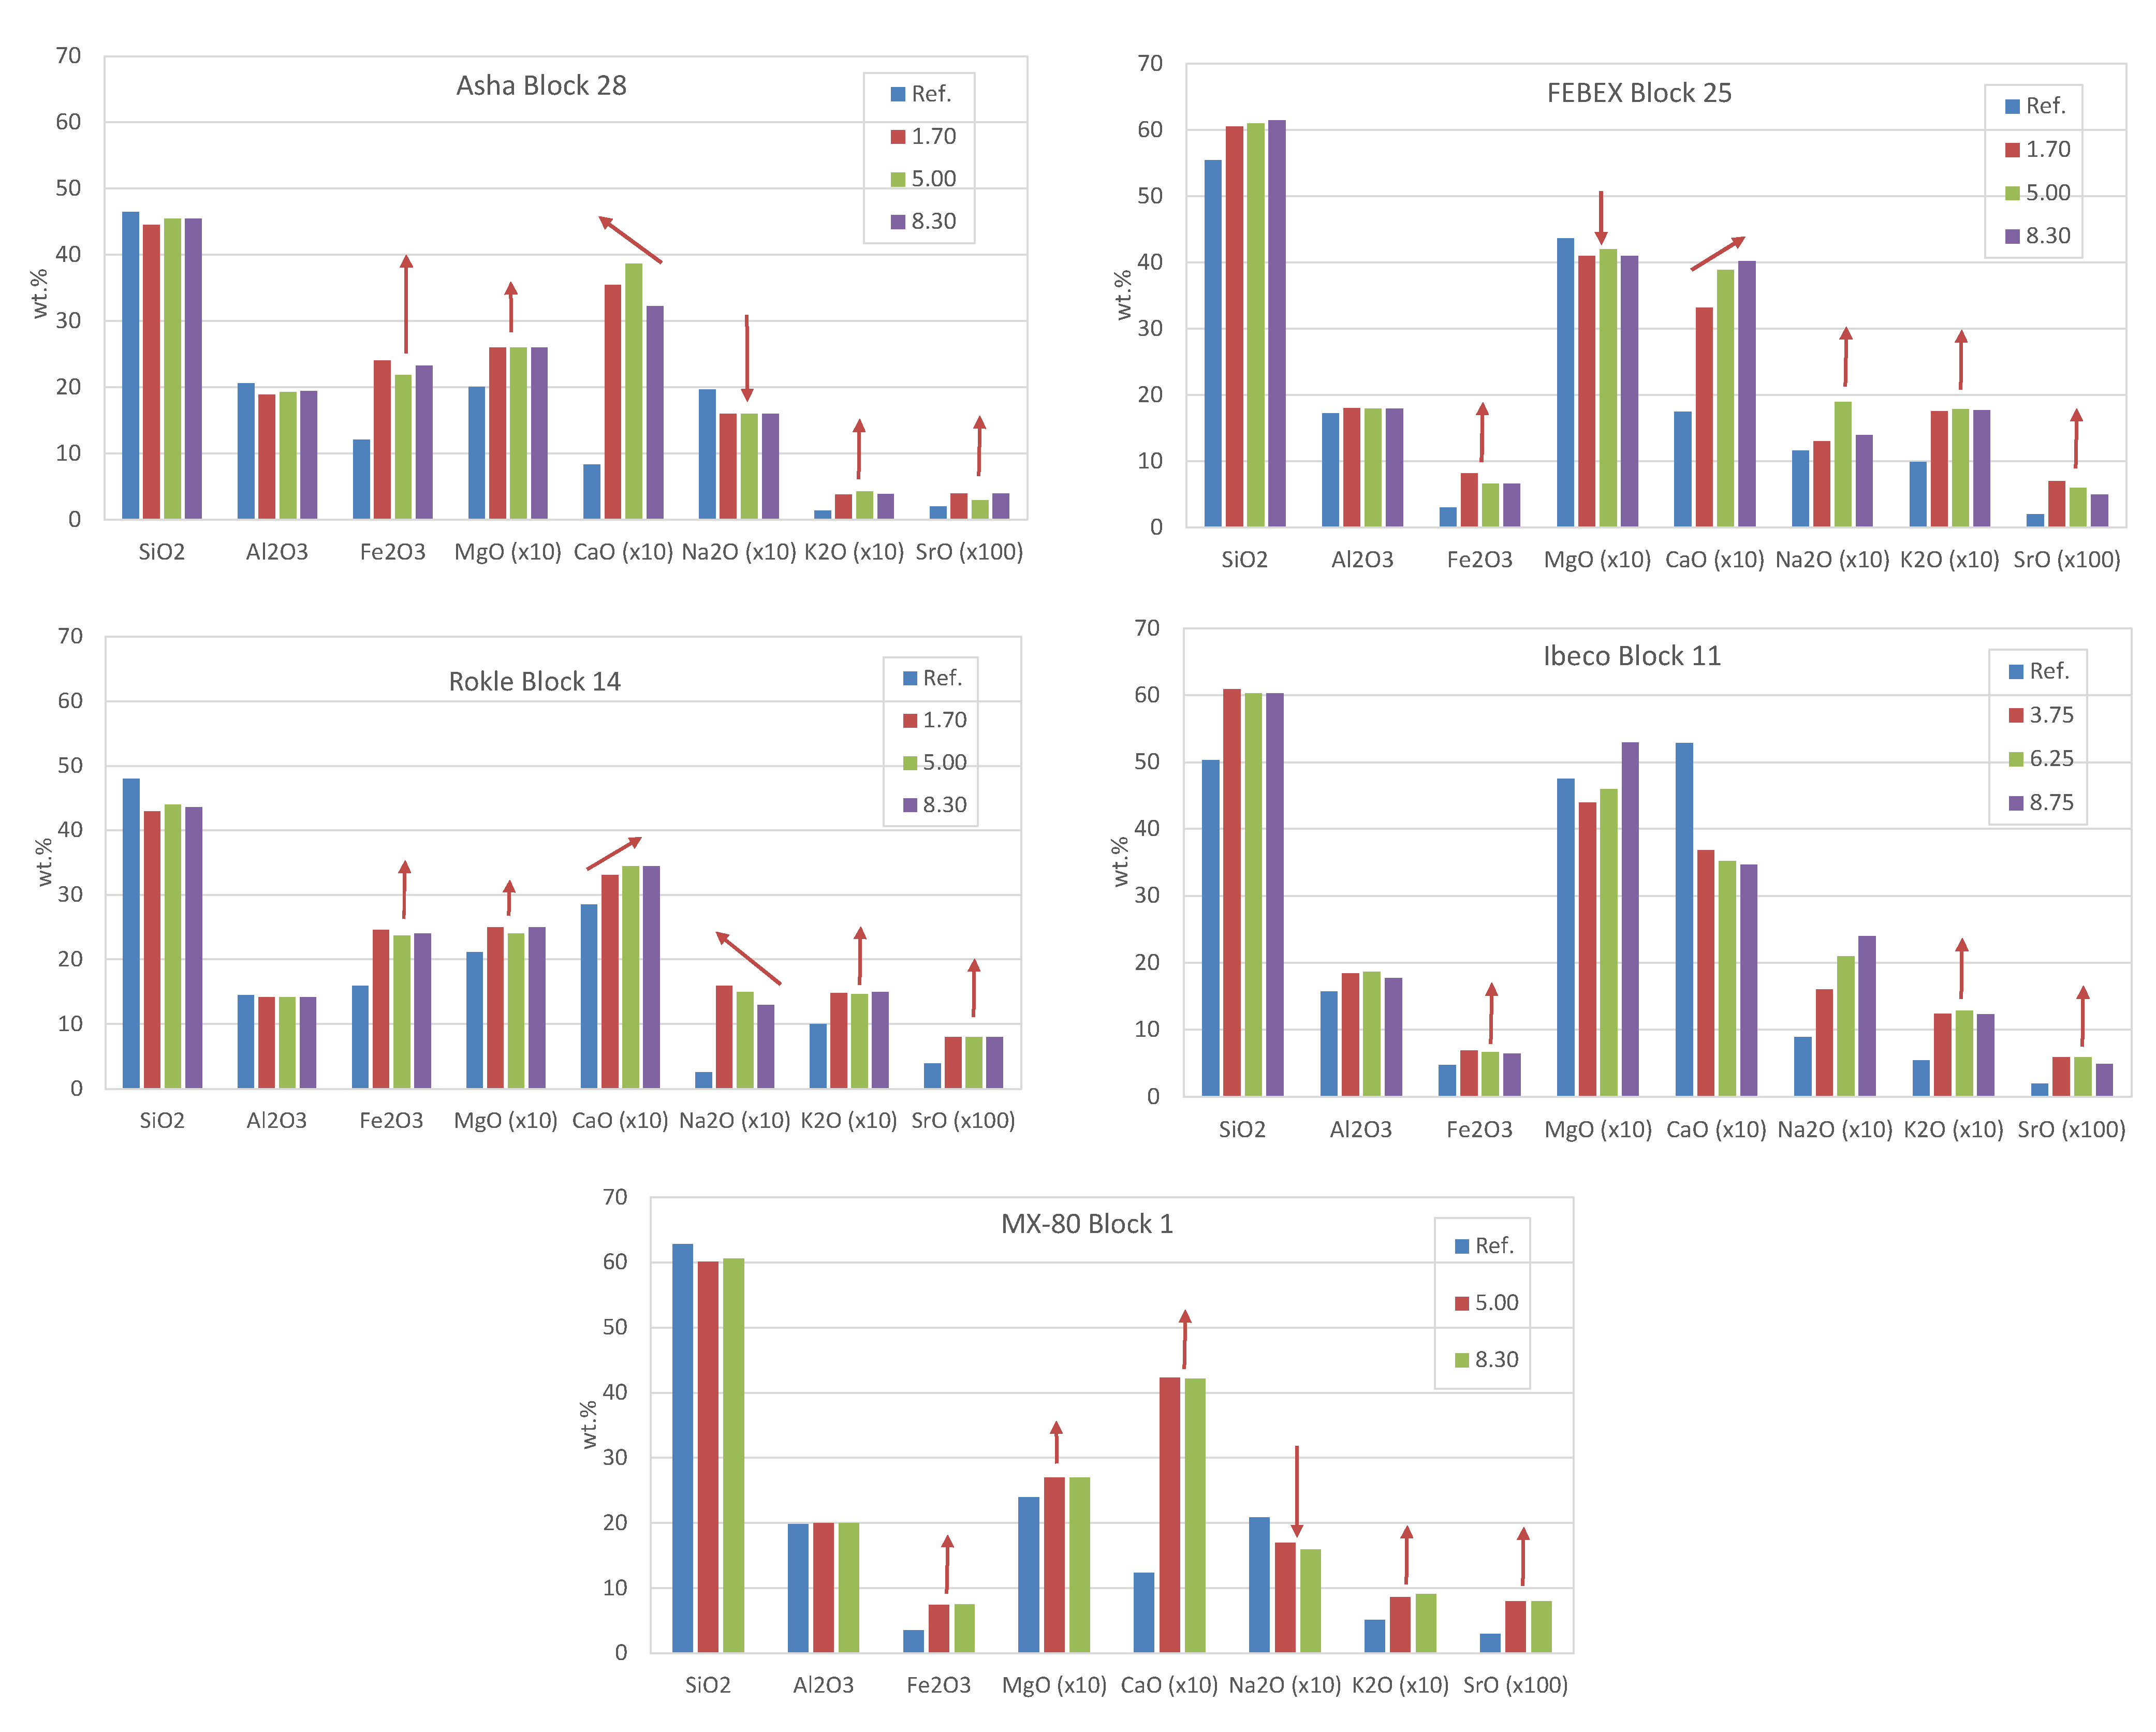
3.3. Geochemistry of the Solid Samples
3.4. Physico-Chemical Properties
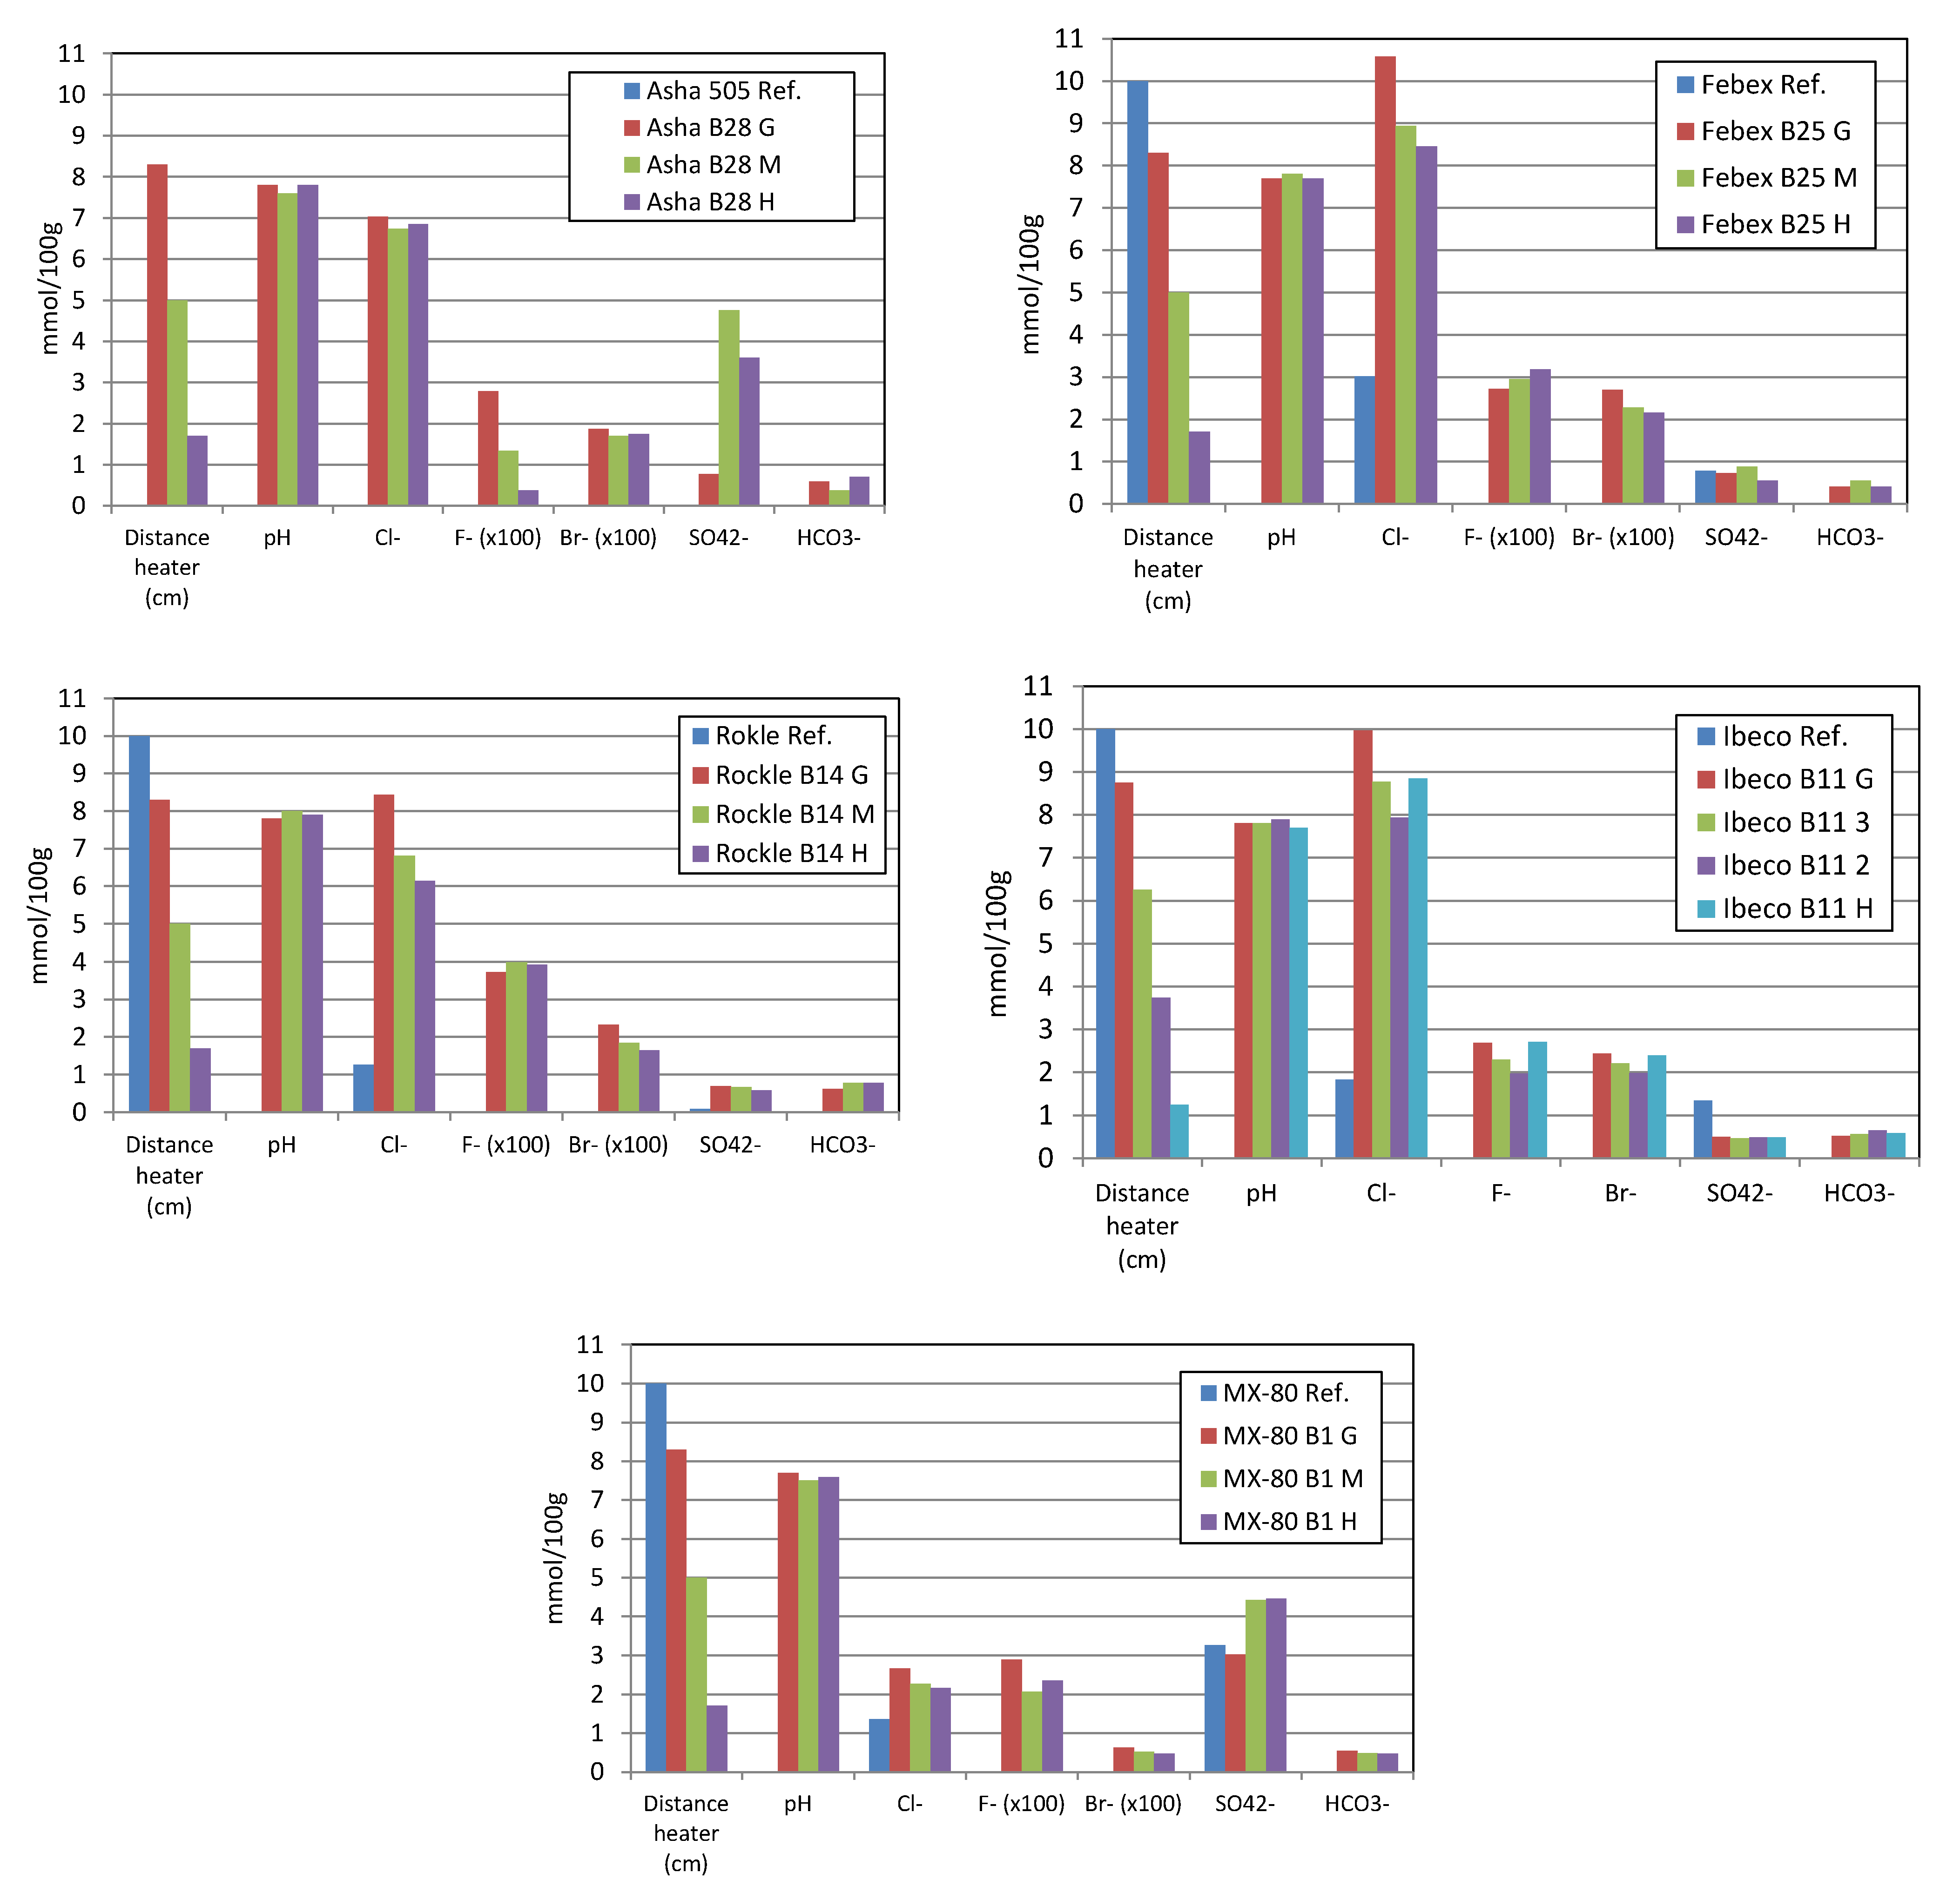
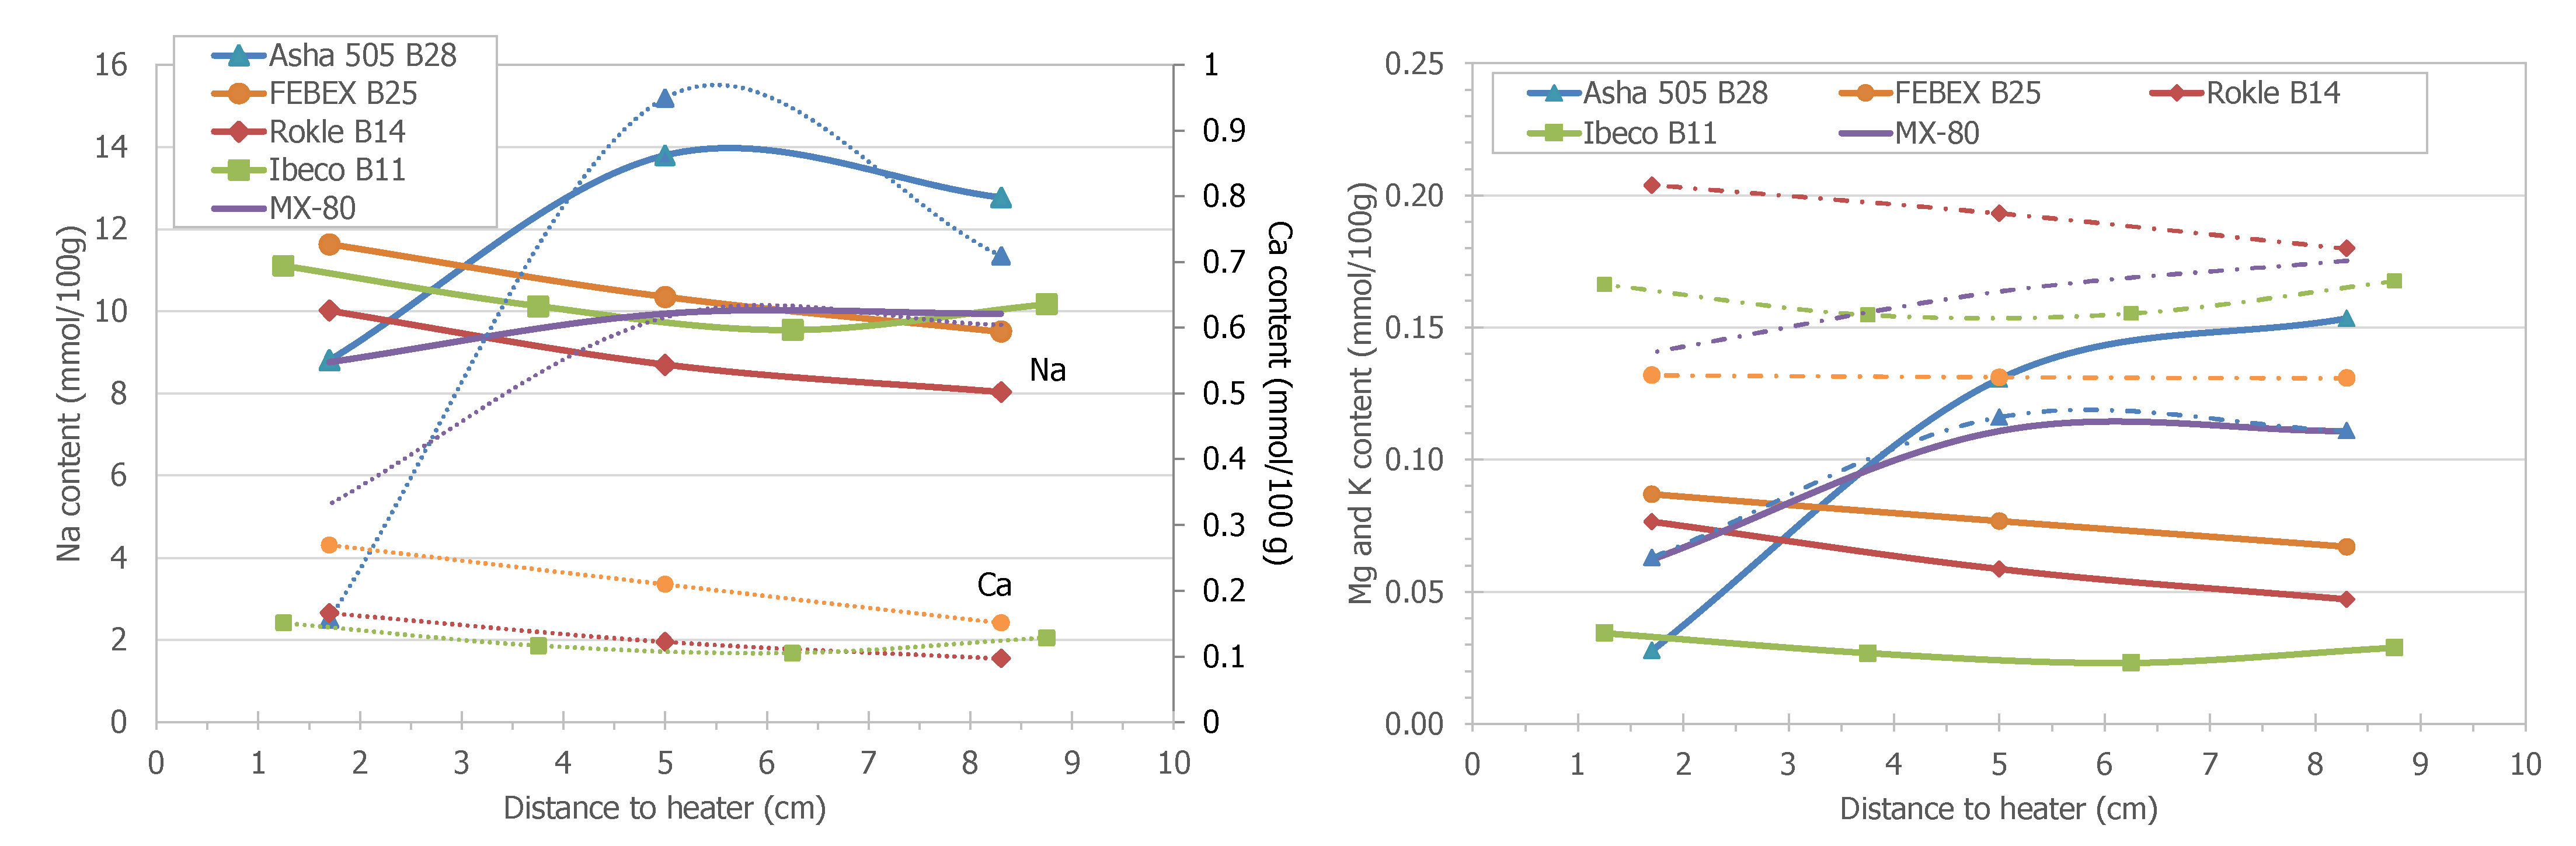
3.5. Pore Water Chemistry
4. Discussion
4.1. Physical Properties Variations
4.2. Mineralogical and Geochemical Alterations
4.3. Redistribution of CEC and Exchangeable Cations
4.4. Pore Water Chemistry Variations
4.5. Iron–Bentonite Interactions
5. Conclusions
Supplementary Materials
Author Contributions
Funding
Data Availability Statement
Acknowledgments
Conflicts of Interest
References
- Posiva SKB. Safety functions, performance targets and technical design requirements for a KBS-3V repository. Conclusions and recommendations from a joint SKB and Posiva working group. In Posiva SKB Report 01; Svensk Kärnbränslehantering AB: Stockholm, Sweden, 2017; p. 116. [Google Scholar]
- Villar, M.V.; Armand, G.; Conil, N.; de Lesquen, C.; Herold, P.; Simo, E.; Mayor, J.C.; Dizier, A.; Li, X.; Chen, G.; et al. D7.1 HITEC. Initial State-of-the-Art on THM Behaviour of (i) Buffer Clay Materials and of (ii) Host Clay Materials. 2020. Deliverable D7.1 HITEC. EURAD Project, Horizon 2020 No 847593. 214p. Available online: https://www.ejp-eurad.eu/sites/default/files/2021-04/EURAD%20-%20D7.1%20Initial%20SotA%20HITEC.pdf (accessed on 7 April 2022).
- Kaufhold, S.; Dohrmann, R. Distinguishing between more and less suitable bentonites for storage of high-level radioactive waste. Clay Miner. 2016, 51, 289–302. [Google Scholar] [CrossRef] [Green Version]
- Dohrmann, R.; Kaufhold, S.; Lundqvist, B. The role of clays for safe storage of nuclear waste. In Handbook of Clay Science; Bergaya, F., Lagaly, G., Eds.; Elsevier: Amsterdam, The Netherlands, 2013; Volume 5B, pp. 677–710. [Google Scholar]
- Svensson, D.; Sandén, T.; Olsson, S.; Dueck, A.; Eriksson, S.; Jägerwall, S.; Hansen, S. Alternative buffer material Status of the ongoing laboratory investigation of reference materials and test package 1. In SKB TR-11-06; Svensk Kärnbränslehantering AB: Stockholm, Sweden, 2011; p. 146. [Google Scholar]
- Kaufhold, S.; Dohrmann, R.; Sandén, T.; Sellin, P.; Svensson, D. Mineralogical investigations of the first package of the alternative buffer material test—I. Alteration of bentonites. Clay Miner. 2013, 48, 199–213. [Google Scholar] [CrossRef]
- Kaufhold, S.; Dohrmann, R.; Götze, N.; Svensson, D. Characterization of the second parcel of the Alternative Buffer Material (ABM) Experiment—I mineralogical reactions. Clays Clay Miner. 2017, 65, 27–41. [Google Scholar] [CrossRef]
- Kaufhold, S.; Dohrmann, R.; Ufer, K.; Svensson, D.; Sellin, P. Mineralogical analysis of bentonite from the ABM5 heater experiment at Äspö hard rock laboratory, Sweden. Minerals 2021, 11, 669. [Google Scholar] [CrossRef]
- Sudheer, K.R.; Podlech, C.; Grathoff, G.; Warr, L.N.; Svensson, D. Thermally induced bentonite alterations in the SKB ABM5 hot bentonite experiment. Minerals 2021, 11, 1017. [Google Scholar] [CrossRef]
- Dohrmann, R.; Olsson, S.; Kaufhold, S.; Sellin, P. Mineralogical investigations of the first package of the alternative buffer material test—II. Exchangeable cation population rearrangement. Clay Miner. 2013, 48, 215–233. [Google Scholar] [CrossRef]
- Dohrmann, R.; Kaufhold, S. Characterisation of the second package of the alternative buffer material (ABM) experiment–II Exchangeable cation population rearrangement. Clays Clay Miner. 2017, 65, 104–121. [Google Scholar] [CrossRef]
- Svensson, P.D.; Hansen, S. Redox chemistry in two iron-bentonite field experiments at Äspö hard rock laboratory, Sweden: An XRD and Fe k-edge XANES study. Clays Clay Miner. 2013, 61, 566–579. [Google Scholar] [CrossRef]
- Wersin, P.; Jenni, A.; Mäder, U.K. Interaction of corroding iron with bentonite in the ABM1 experiment at Äspö, Sweden: A microscopic approach. Clays Clay Miner. 2015, 63, 51–68. [Google Scholar] [CrossRef]
- Wersin, P.; Hadi, J.; Jenni, A.; Svensson, D.; Grenèche, J.-M.; Sellin, P.; Leupin, O.X. Interaction of Corroding Iron with Eight Bentonites in the Alternative Buffer Materials Field Experiment (ABM2). Minerals 2021, 11, 907. [Google Scholar] [CrossRef]
- Muurinen, A. Studies on the Chemical Conditions and Microstructure in Package 1 of Alternative Buffer Materials Project (ABM) in Äspö. Posiva Working Report; Posiva: Eurajoki, Finland, 2010; p. 39. [Google Scholar]
- Sandén, T.; Nilsson, U.; Svensson, D. ABM45 Experiment at Äspö Hard Rock Laboratory; Installation Report; SKB Report P-18-20; Svensk Kärnbränslehantering AB: Stockholm, Sweden, 2018; p. 49. [Google Scholar]
- Gordon, A.; Pahverk, H.; Börjesson, E.; Johanss, A.J. Examination of Copper Corrosion Specimens from ABM45, Package 5; Technical Report TR-18-17; Svensk Kärnbränslehantering AB: Stockholm, Sweden, 2018; p. 27. [Google Scholar]
- Karnland, O.; Olsson, S.; Nilsson, U. Mineralogy and Sealing Properties of Various Bentonites and Smectite-Rich Clay Materials; SKB TR-06-30; Svensk Kärnbränslehantering AB: Stockholm, Sweden, 2006. [Google Scholar]
- Slaughter, M.; Earley, J.W. Mineralogy and Geological Significance of the Mowry Bentonites, Wyoming; Special Paper Nº 87; Geological Society of America: New York, NY, USA, 1965. [Google Scholar]
- Christidis, G.; Scott, P.W.; Marcopoulos, T. Origin of the bentonite deposits of Eastern Milos, Aegean, Greece: Geological, Mineralogical and Geochemical Evidence. Clays Clay Miner. 1995, 43, 63–77. [Google Scholar] [CrossRef]
- Konta, J. Textural variation and composition of bentonite derived from basaltic ash. Clays Clay Miner. 1986, 34, 257–265. [Google Scholar] [CrossRef]
- Přikryl, R.; Woller, F. Going underground: A new market for Czech bentonite in nuclear waste disposal. Ind. Miner. 2002, 415, 72–77. [Google Scholar]
- Huertas, F.; Farina, P.; Farias, J.; Garcia-Sineriz, J.L.; Villar, A.M.; Fernandez, A.M.; Martin, P.L.; Elorza, F.J.; Gens, A.; Sanchez, M.; et al. FEBEX Project. Full-Scale Engineered Barriers Experiment for a Deep Geological Repository for High Level Radioactive Waste in Crystalline Host Rock; Updated Final Report 1994-2004; Technical Publication ENRESA 5-0/2006; ENRESA: Madrid, Spain, 2006; p. 590. [Google Scholar]
- Fernandez, A.M.; Baeyens, B.; Bradbury, M.; Rivas, P. Analysis of the pore water chemical composition of a Spanish compacted bentonite used in an engineered barrier. Phys. Chem. Earth 2004, 29, 105–118. [Google Scholar] [CrossRef]
- Shah, N.R. Indian bentonite: Focus on the Kutch region. Ind. Miner. 1997, 359, 43–47. [Google Scholar]
- Jackson, M.L. Soil Chemical Analysis: Advanced Course; Revised Second Edition; Parallel Press University of Wisconsin-Madison Libraries: Madison, WI, USA, 2005; p. 930. [Google Scholar]
- Moore, D.; Reynolds, R. X-ray Diffraction and the Identification and Analysis of Clay Minerals; Oxford University Press: New York, USA, 1989; p. 332. [Google Scholar]
- Newman, A.C.D. Chemistry of Clays and Clay Minerals. Mineral Society. Monograph N° 6. Longman Sci. Tech. 1987, 6, 480. [Google Scholar]
- Wagner, C.D.; Davis, L.E.; Zeller, M.V.; Taylor, J.A.; Raymond, R.M.; Gale, L.H. Empirical atomic sensitivity factors for quantitative analysis by electron spectroscopy for chemical analysis. Surf. Interface Anal. 1981, 3, 211–225. [Google Scholar] [CrossRef]
- Tarafder, P.K.; Thakur, R. An optimised 1,10-Phenathroline method for the determination of ferrous and ferric oxides in silicate rocks, soils and minerals. Geostand. Geoanal. Res. 2012, 37, 155–168. [Google Scholar] [CrossRef]
- Amman, L.; Bergaya, F.; Lagaly, G. Determination of the cation exchange capacity of clays with copper complexes revisited. Clay Miner. 2005, 40, 441–453. [Google Scholar] [CrossRef]
- Sawhney, B.L. Potassium and caesium ion selectivity in relation to clay mineral microstructure. Clays Clay Miner. 1970, 18, 47–52. [Google Scholar] [CrossRef]
- Gregg, S.J.; Sing, K.S.W. Adsorption, Surface area and Porosity; Academic Press: London, UK, 1982; p. 303. [Google Scholar]
- Keeling, P.S.; Kirby, E.C.; Robertson, R.H.S. Moisture adsorption and specific surface area. J. Brit. Ceram. Soc. 1980, 79, 36–40. [Google Scholar]
- Fernández, A.M.; Sánchez-Ledesma, D.M.; Melón, A.; Robredo, L.M.; Rey, J.J.; Labajo, M.; Clavero, M.A.; Fernández, S.; González, A.E. Thermo-Hydro-Chemical (THC) Behaviour of a Spanish Bentonite after Dismantling Heater#1 and Heater#2 of the FEBEX In Situ Test at the Grimsel Test Site; Nagra Working Reports. NAB 16-25; Nagra: Wettingen, Switzerland, 2018; p. 583. [Google Scholar]
- Fernández, A.M.; Bath, A.; Waber, H.N.; Oyama, T. Annex 2: Water sampling by squeezing drillcores. In Geochemistry of Water in the Opalinus Clay Formation at the Mont Terri Rock Laboratory; Pearson, F.J., Arcos, D., Bath, A., Boisson, J.Y., Fernández, A.M., Gäbler, H.-E., Gaucher, E., Gautschi, A., Griffault, L., Hernán, P., et al., Eds.; Geology Series No. 5; Federal Office for Water and Geology (FOWG): Bern, Switzerland, 2003; pp. 171–199. [Google Scholar]
- Fernández, A.M. Caracterización y Modelización del Agua Intersticial en Materiales Arcillosos: Estudio de la Bentonita de Cortijo de Archidona. Ph.D. Thesis, CIEMAT, Madrid, Spain, 2004; p. 505. [Google Scholar]
- Fernández, A.M.; Sánchez-Ledesma, D.M.; Tournassat, C.; Melón, A.; Gaucher, E.C.; Astudillo, J.; Vinsot, A. Applying the squeezing technique to highly consolidated clayrocks for pore water characterisation: Lessons learned from experiments at the mont terri rock laboratory. Appl. Geochem. 2014, 49, 2–21. [Google Scholar] [CrossRef]
- Entwisle, D.C.; Reeder, S. New apparatus for pore fluid extraction from mudrocks for geochemical analysis. In Geochemistry of Clay-Pore Fluid Interactions; The Mineralogical Society Series; Chapman and Hall: London, UK, 1993; pp. 365–388. [Google Scholar]
- Peters, C.A.; Yang, Y.C.; Higgins, J.D.; Burger, P.A. A preliminary study of the chemistry of pore water extracted from tuff by one-dimensional compression. In Water-Rock Interaction; Kharaka, Y.K., Maes, A.S., Eds.; A.A.Balkema: Rotterdam, The Netherlands, 1992; pp. 741–745. [Google Scholar]
- Svensson, D. The Bentonite Barrier. Swelling Properties, Redox Chemistry and Mineral Evolution. Ph.D. Thesis, Lund University, Lund, Sweden, 2015. [Google Scholar]
- Fernández, A.M.; Kaufhold, S.; Sánchez-Ledesma, D.M.; Rey, J.J.; Melón, A.; Robredo, L.M.; Fernández, S.; Labajo, M.A.; Clavero, M.A. Evolution of the THC conditions in the FEBEX In Situ test after 18 years of experiment: Smectite crystallochemical modifications after interactions of the bentonite with a C-steel heater at 100 °C. Appl. Geochem. 2018, 98, 152–171. [Google Scholar] [CrossRef]
- War, L. IMA–CNMNC approved mineral symbols. Mineral. Mag. 2021, 85, 291–320. [Google Scholar] [CrossRef]
- Alburquenque, D.; Márquez, P.; Troncoso, L.; Pereira, A.; Celis, F.; Sánchez-Arenillas, M.; Marco, J.F.; Gautier, J.L.; Escrig, J. LiM0.5Mn1.5O4-δ (M = Co or Fe) spinels with a high oxidation state obtained by ultrasound-assisted thermal decomposition of nitrates. Characterization and physicochemical properties. J. Solid State Chem. 2020, 284, 121175. [Google Scholar] [CrossRef]
- López, G.P.; Castuer, D.G.; Ratner, B. XPS 0 1s Binding Energies for Polymers Containing Hydroxyl, Ether, Ketone and Ester Groups. Surf. Interf. Anal. 1991, 17, 267–272. [Google Scholar] [CrossRef]
- Marco, J.F.; Gancedo, J.R.; Ortiz, J.; Gautier, J.L. Appl. Characterization of the spinel-related oxides NixCo3−xO4 (x=0.3,1.3,1.8) prepared by spray pyrolysis at 350 °C. Surf. Sci. 2004, 227, 175–186. [Google Scholar] [CrossRef]
- Smirnov, M.Y.; Kalinkin, A.V.; Bukhtiyarov, V.L. X-ray photoelectron spectroscopic study of the interaction of supported metal catalysts with NOx. J. Struct. Chem. 2007, 48, 1053–1066. [Google Scholar] [CrossRef] [Green Version]
- Meskinis, S.; Vasiliauskas, A.; Androlevicious, M.; Peckus, D.; Tamulevicius, S.; Viskontas, K. Diamond Like Carbon Films Containing Si. Struct. Nonlinear Opt. Prop. Mater. 2020, 13, 1003. [Google Scholar]
- Bancroft, G.M. Mössbauer Spectroscopy: An Introduction for Inorganic Chemists and Geochemists; McGraw Hill: Maidenhead, UK, 1973. [Google Scholar]
- Maddock, A.G. Mössbauer Spectrometry in Mineral Chemistry. In Chemical Bonding and Spectroscopy in Mineral Chemistry; Berry, F.J., Vaughan, D.J., Eds.; Springer: Berlin/Heidelberg, Germany, 1985; pp. 141–208. [Google Scholar]
- Coey, J.M.D. Clay minerals and their transformations studied with nuclear techniques: The contribution of Mössbauer spectroscopy. At. Energy Rev. 1980, 18, 73–124. [Google Scholar]
- Heller-Kallai, L.; Rozenson, I. The use of Mössbauer spectroscopy of iron in clay mineralogy. Phys. Chem. Miner. 1981, 7, 223–238. [Google Scholar] [CrossRef]
- De Grave, E.; Vandenbruwaene, J.; Elewaut, E. An57Fe Mössbauer effect study on glauconites from different locations in Belgium and northern France. Clay Miner. 1985, 20, 171–179. [Google Scholar] [CrossRef]
- Dainyak, L.G.; Drits, V.A. Interpretation of Mössbauer spectra of nontronite, celadonite and glauconite. Clays Clay Miner. 1987, 35, 363–373. [Google Scholar] [CrossRef]
- Dainyak, L.G.; Drits, V.A.; Heifits, L.M. Computer simulation of cation distribution in dioctahedral 2:1 layer silicates using IR-data: Application to Mössbauer spectroscopy of a glauconite sample. Clays Clay Miner. 1992, 40, 470–479. [Google Scholar] [CrossRef]
- Pelayo, M.; Marco, J.F.; Fernández, A.M.; Vergara, L.; Melón, A.M.; del Villar, L.P. Infrared and Mössbauer spectroscopy of Fe-rich smectites from Morrón de Mateo bentonite deposit (Spain). Clay Miner. 2018, 53, 17–28. [Google Scholar] [CrossRef]
- Murad, E.; Johnston, J.H. Iron Oxides and Oxyhydroxides. Mössbauer Spectroscopy Applied to Inorganic Chemistry; Gary, J., Ed.; Plenum Press: New York, NY, USA, 1987; Volume 2, Chapter 12; pp. 507–582. [Google Scholar]
- Vandenberghe, R.E.; De Grave, E. Application of Mössbauer spectroscopy in earth sciences. In Mössbauer Spectroscopy. Tutorial Book; Yoshida, Y., Langouche, G., Eds.; Springer: Berlin/Heidelberg, Germany, 2013; Chapter 3; pp. 91–186. [Google Scholar]
- Dang, M.Z.; Rancourt, D.G.; Dutrizac, J.E.; Lamarche, G.; Provencher, R. Interplay of surface conditions, particle size, stoichiometry, cell parameters, and magnetism in synthetic hematite-like materials. Hyperfine Interact. 1998, 117, 271–319. [Google Scholar] [CrossRef]
- Goss, C.J. The kinetics and reaction mechanism of the goethite to hematite transformation. Mineral. Mag. 1987, 51, 437–451. [Google Scholar] [CrossRef] [Green Version]
- Hernández, T.; Sánchez, F.J.; Moroño, A.; Aristu, M.; Marco, J.F. Effect of irradiation on the stability of the corrosion layer produced in Eurofer by contact with lithium ceramics. J. Nucl. Mater. 2021, 545, 152614. [Google Scholar] [CrossRef]
- Sing, K.S.W.; Everett, D.H.; Haul, R.A.W.; Moscou, L.; Pierotti, R.A.; Rouquerol, J.; Siemieniewska, T. Reporting physisorption data for gas/solid systems with Special Reference to the Determination of Surface Area and Porosity. Pure Appl. Chem. 1985, 57, 603–619. [Google Scholar] [CrossRef]
- Fernández, A.M.; Rivas, P. Pore water chemistry of saturated Febex bentonite compacted at different densities. In Advances in Understanding Engineered Clay Barriers; Alonso, E.E., Ledesma, A., Eds.; Balkema Publishers: Leiden, The Netherlands, 2005; pp. 505–514. [Google Scholar]
- Parkhurst, D.L.; Appelo, C.A.J. Description of input and examples for PHREEQC version 3—A computer program for speciation, batch-reaction, one-dimensional transport, and inverse geochemical calculations: U.S. In Geological Survey Techniques and Methods; U.S. Geological Survey: Denver, CO, USA, 2003; Chapter A43; p. 497. [Google Scholar]
- Blanc, P. Thermoddem: Update for the 2017 Version; Report BRGM/RP-66811-FR; BRGM: Orleans, France, 2017; p. 20. [Google Scholar]
- Olsson, S.; Jensen, V.; Johanesson, L.E.; Hansen, E.; Karnland, O.; Kumpulainen, S.; Kirivanta, L.; Svensson, D.; Hansen, S.; Lindén, J. Prototype Repository-Hydromechanical, Chemical and Mineralogical Characterization of the Buffer and Backfill Material from the Outer Section of the Prototype Repository; Technical Report TR-13-21; Svensk Kärnbränslehantering AB: Stockholm, Sweden, 2013. [Google Scholar]
- Missana, T.; Alonso, U.; Fernández, A.M.; García-Gutiérrez, M. Analysis of the stability behaviour of colloids obtained from different smectite clays. Appl. Geochem. 2018, 92, 180–187. [Google Scholar] [CrossRef]
- Kaufhold, S.; Dohrmann, R.; Ufer, K.; Kober, F. Interactions of bentonite with metal and concrete from the FEBEX experiment-mineralogical and geochemical investigations of selected sampling sites. Clay Miner. 2018, 53, 745–763. [Google Scholar] [CrossRef] [Green Version]
- Dohrmann, R.; Kaufhold, S. Cation exchange and mineral reactions observed in MX 80 buffer samples from the Prototype repository in situ experiment in Äspö, Sweden. Clays Clay Miner. 2014, 5, 357–373. [Google Scholar] [CrossRef]
- Heuser, M.; Weber, C.; Stanjek, H.; Chen, H.; Jordan, G.; Schmahl, W.W.; Natzeck, C. The interaction between bentonite and water vapor. I: Examination of physical and chemical properties. Clays Clay Miner. 2014, 62, 188–202. [Google Scholar] [CrossRef]
- Kaufhold, S.; Dohrmann, R. Stability of bentonites in salt solutions: II. Potassium chloride solution. Initial step of illitization? Appl. Clay Sci. 2010, 49, 98–107. [Google Scholar] [CrossRef]
- Herbert, H.-J.; Kasbohm, J.; Sprenger, H.; Fernández, A.M.; Reichelt, C. Swelling pressures of MX-80 bentonite in solutions of different ionic strength. Phys. Chem. Earth 2008, 33, 327–342. [Google Scholar] [CrossRef]
- Kaufhold, S.; Dohrmann, R. Effect of extensive drying on the cation exchange capacity of bentonites. Clay Miner. 2010, 45, 441–448. [Google Scholar] [CrossRef]
- Fernández, A.M.; Cuevas, J.; Rivas, P. Pore water chemistry of the FEBEX bentonite. Mat. Res. Soc. Symp. Proc. 2001, 663, 573–588. [Google Scholar] [CrossRef]
- Wersin, P. Geochemical modelling of bentonite pore water in high-level waste repositorys. J. Contam. Hydrol. 2003, 61, 405–422. [Google Scholar] [CrossRef]
- Bradbury, M.H.; Berner, U.; Curti, E.; Hummel, W.; Kosakowski, G.; Thoenen, T. The Long Term Geochemical Evolution of the Nearfield of the HLW Repository; Nagra Technical Report NTB 12-01; NAGRA: Wettingen, Switzerland, 2014. [Google Scholar]


| Element | Fe | C | Si | Mn | P | S | Cr | Mo | Ni | Cu | Nb | Ti | V |
|---|---|---|---|---|---|---|---|---|---|---|---|---|---|
| maximum | ball | 0.16 | 0.35 | 1.20 | 0.025 | 0.02 | 0.30 | 0.08 | 0.30 | 0.30 | 0.01 | 0.04 | 0.02 |
| Ion | Water-Type | I (M) | Na | K | Ca | Mg | HCO3− | Cl− | SO42− | Br− | F− | Si | pH |
|---|---|---|---|---|---|---|---|---|---|---|---|---|---|
| mg/L | Ca-Na-Cl | 0.91 | 2470 | 12.4 | 2560 | 64.8 | 51.7 | 8580 | 483 | 59 | 1.5 | 6.3 | 7.33 |
| Sample | Depth (m) | Max. Temp. (°C) 4 | Bentonite Mass (g) | Water Content w.c. (%) | Dry Density (g/cm3) | Grain Density (g/cm3) 2 | Porosity (%) | Degree of Saturation (%) | Water Content at Saturation (%) | ||||
|---|---|---|---|---|---|---|---|---|---|---|---|---|---|
| Initial 1 | Initial 1 | Final 3 | Initial 1 | Final 3 | Initial | Final | Initial | Final | Final | ||||
| Asha Block 28 | 0.3 | 187.0 | 10,820 | 13.1 | 30.1 | 1.84 | 1.49 | 2.869 | 36 | 48 | 67.3 | 93.0 | 32.4 |
| FEBEX Block 25 | 0.6 | 216.5 | 10,640 | 14.3 | 27.9 | 1.80 | 1.51 | 2.735 | 34 | 45 | 75.2 | 94.1 | 29.7 |
| Rokle Block 14 | 1.7 | 252.6 | 10,800 | 17.2 | 29.0 | 1.80 | 1.60 | 2.940 | 39 | 46 | 80.3 | 102.2 | 28.4 |
| IBECO Block 11 | 2.0 | 255.1 | 10,740 | 14.7 | 32.0 | 1.86 | 1.50 | 2.753 | 33 | 45 | 83.6 | 106.0 | 30.2 |
| MX-80 Block 1 | 3.0 | 155.0 | 11,040 | 10.6 | 31.1 | 1.93 | 1.49 | 2.735 | 29 | 46 | 69.9 | 101.7 | 30.6 |
| Subsample | Distance to Heater (cm) | Water Content w.c. (%) | Grain Density (g/cm3) 1 | Dry Density (g/cm3) | Porosity (%) | Degree of Saturation (%) |
|---|---|---|---|---|---|---|
| Asha Block 28 granite (G) | 8.33 | 30.3 | 2.869 | 1.49 | 0.48 | 93 |
| Asha Block 28 central (M) | 5.00 | 29.9 | 2.869 | 1.49 | 0.48 | 92 |
| FEBEX Block 25 granite (G) | 8.33 | 28.1 | 2.735 | 1.51 | 0.45 | 94 |
| FEBEX Block 25 central (M) | 5.00 | 27.8 | 2.735 | 1.51 | 0.45 | 94 |
| Rokle Block 14 granite (G) | 8.33 | 29.9 | 2.940 | 1.63 | 0.45 | 109 |
| Rokle Block 14 central (M) | 5.00 | 28.2 | 2.940 | 1.58 | 0.46 | 96 |
| IBECO Block 11 granite (G) | 8.33 | 33.1 | 2.753 | 1.44 | 0.48 | 100 |
| IBECO Block 11 heater (H) | 1.67 | 30.9 | 2.753 | 1.56 | 0.43 | 112 |
| MX-80 Block 1 granite (G) | 8.33 | 32.5 | 2.735 | 1.46 | 0.47 | 102 |
| MX-80 Block 1 heater (H) | 1.67 | 29.8 | 2.735 | 1.52 | 0.45 | 101 |
| Sample | Structural Formula | Layer Charge (eq/h.u.c.) | Σtet | Σoct | τ Charge (%) | O. Charge (%) | Weight (g/mol) p.f.u. |
|---|---|---|---|---|---|---|---|
| Asha 505 Ref. | (Si3.81Al0.19)IV (Al1.28Fe3+0.48Mg0.24)VI O10(OH)2 (Ca0.12Na0.21)0.32 | 0.43 | 4.0 | 2.00 | 44 | 56 | 764.87 |
| Asha 505 Block 28 | (Si3.81Al0.19)IV (Al1.10Fe3+0.74Mg0.16Ti4+0.01)VI O10(OH)2 (Ca0.12Na0.05K0.05)0.33 | 0.33 | 4.0 | 2.01 | 59 | 41 | 778.21 |
| (Si3.84Al0.16)IV (Al1.43Fe3+0.32Mg0.23)VI O10(OH)2 (Ca0.17Na0.10K0.02)0.29 | 0.46 | 4.0 | 1.98 | 36 | 64 | 756.05 | |
| (Si3.78Al0.22)IV (Al1.17Fe3+0.60Mg0.19Ti4+0.01)VI O10(OH)2 (Ca0.17Na0.10K0.02)0.29 | 0.48 | 4.0 | 1.97 | 46 | 54 | 772.63 | |
| (Si3.62Al0.68)IV (Al0.81Fe3+0.98Mg0.24Ti4+0.004)VI O10(OH)2 (Ca0.22Na0.05K0.03)0.29 | 0.51 | 4.0 | 2.04 | 75 | 25 | 798.99 | |
| (Si3.83Al0.17)IV (Al1.38Fe3+0.35Mg0.27Ti4+0.03)VI O10(OH)2 (Ca0.13Na0.08K0.001)0.21 | 0.34 | 4.0 | 2.02 | 50 | 50 | 755.41 | |
| FEBEX Ref. | (Si3.96Al0.04)IV (Al1.49Fe3+0.13Mg0.38)VI O10(OH)2 (Mg0.10Na0.20K0.03)0.32 | 0.42 | 4.0 | 2.00 | 10 | 90 | 742.12 |
| FEBEX Block 25 | (Si3.96Al0.04)IV (Al1.44Fe3+0.12Mg0.43Ti4+0.01)VI O10(OH)2 (Ca0.15Na0.13K0.05)0.32 | 0.47 | 4.0 | 2.00 | 9 | 91 | 746.71 |
| (Si3.72Al0.28)IV (Al1.32Fe3+0.39Mg0.26Ti4+0.05)VI O10(OH)2 (Ca0.15Na0.11K0.03)0.29 | 0.44 | 4.0 | 2.02 | 63 | 37 | 763.51 | |
| Rokle Ref. | (Si3.75Al0.25)IV(Al1.19Fe3+0.67Mg0.15Ti4+0.02Mn2+0.01)VI O10(OH)2 (Ca0.03Na0.14K0.07)0.24 | 0.27 | 4.0 | 2.04 | 93 | 7 | 776.00 |
| Rokle Block 14 | (Si3.89Al0.11)IV (Al0.98Fe3+0.65Mg0.15Ti4+0.08)VI O10(OH)2 (Ca0.14Na0.04K0.08)0.26 | 0.40 | 4.0 | 1.96 | 27 | 73 | 777.36 |
| (Si3.90Al0.10)IV (Al0.98Fe3+0.60Mg0.34Ti4+0.06)VI O10(OH)2 (Ca0.17Na0.03K0.10)0.30 | 0.47 | 4.0 | 1.97 | 21 | 79 | 776.70 | |
| IBECO Ref. | (Si3.96Al0.04)IV (Al1.48Fe3+0.20Mg0.37Ti4+0.01)VI O10(OH)2 (Ca0.04Na0.09K0.02)0.15 | 0.20 | 4.0 | 2.07 | 18 | 82 | 743.37 |
| IBECO Block 11 | (Si4.0)IV (Al1.44Fe3+0.12Mg0.39Ti4+0.04)VI O10(OH)2 (Ca0.08Na0.18K0.05)0.32 | 0.40 | 4.0 | 1.99 | 1 | 99 | 745.27 |
| MX-80 Ref. | (Si4.00)IV (Al1.51 Fe3+0.22Ti0.01Mg0.24)VI O10 (OH)2 (Ca0.06Na0.15K0.01) | 0.29 | 4.00 | 1.98 | 0 | 100 | 744.34 |
| MX-80 Block 1 | (Si3.77Al0.23)IV (Al1.20Fe3+0.60Mg0.17Ti4+0.02)VI O10(OH)2 (Ca0.18Na0.04K0.03)0.26 | 0.44 | 4.0 | 1.98 | 53 | 47 | 772.58 |
| (Si3.92Al0.08)IV (Al1.65Fe3+0.14Mg0.26)VI O10(OH)2 (Ca0.05Na0.06K0.01)0.12 | 0.17 | 4.0 | 2.06 | 48 | 52 | 738.05 |
| Sample | Fe | O | Ti | Ca | Mg | C | Si | Al |
|---|---|---|---|---|---|---|---|---|
| Reference | 3.3 | 52.2 | 0.7 | 1.5 | 3.3 | 15.4 | 20.5 | 3.1 |
| 6G | 4.4 | 56.6 | 0.8 | 1.3 | 2.9 | 11.5 | 19.5 | 3.0 |
| 5M | 4.0 | 54.7 | 0.5 | 1.3 | 3.2 | 14.5 | 15.8 | 6.0 |
| 4H | 3.3 | 53.7 | 0.9 | 1.3 | 3.2 | 14.8 | 18.7 | 4.0 |
| Hyperfine Parameter | D1 | D2 | D3 | S1 | S2 | S3 | S4 |
|---|---|---|---|---|---|---|---|
| δ (mms−1) | 0.36 | 0.38 | 1.03 | 0.37 | 0.33 | 0.35 | 0.37 |
| Δ/2ε (mms−1) | 0.44 | 0.81 | 2.41 | −0.15 | −0.14 | −0.20 | −0.20 |
| H (T) | 27.4 | 20.1 | 51.0 | 47.6 |
| Area (%) | Distance to Heater (cm) | D1 Fe3+ Oh | D2 Fe3+ Oh | D3 Fe2+ | S1 α-FeOOH | S2 α-FeOOH | S3 α-Fe2O3 | S4 α-Fe2O3 like |
|---|---|---|---|---|---|---|---|---|
| Reference | 41 | 29 | 3 | 16 | 7 | 5 | ||
| 6G | 8.33 | 37 | 24 | 2 | 25 | 7 | 5 | |
| 5M | 5.00 | 37 | 21 | 3 | 29 | 5 | 5 | |
| 4H | 1.67 | 30 | 23 | 4 | 20 | 12 | 21 |
| Sample | Distance to Heater (cm) | Water Content (%) 1 | CTotal (wt.%) | CInorg. (wt.%) | COrg. (wt.%) | STotal (wt.%) | Total SA (m2/g) | SBET (m2/g) | CEC (meq/100 g) |
|---|---|---|---|---|---|---|---|---|---|
| Asha 505 Ref. 2 | 13.1 | 0.03 | 0.02 | 0.01 | 0.02 | 88.6 | |||
| Asha B28 G | 8.3 | 16.8 | 0.10 | <0.1 | <0.1 | <0.1 | 585 | 65.41 | 85.8 |
| Asha B28 M | 5.0 | 17.6 | 0.16 | <0.1 | <0.1 | <0.1 | 574 | 55.99 | 83.9 |
| Asha B28 H | 1.7 | 13.4 | 0.19 | <0.1 | <0.1 | <0.1 | 584 | 61.49 | 81.3 |
| FEBEX Ref. | 14.3 | 0.12 | 0.08 | 0.04 | <0.05 | 628 ± 4 | 59.2 ± 5 | 98.1 | |
| Febex B25 G | 8.3 | 13.8 | 0.08 | <0.1 | <0.1 | <0.1 | 640 | 38.01 | 97.6 |
| Febex B25 M | 5.0 | 13.3 | 0.09 | <0.1 | <0.1 | <0.1 | 627 | 45.76 | 96.5 |
| Febex B25 H | 1.7 | 13.2 | 0.05 | <0.1 | <0.1 | <0.1 | 622 | 36.20 | 93.1 |
| Rokle Ref. | 17.2 | 0.27 | 0.10 | 0.17 | 0.02 | 573 ± 5 | 82.8 ± 0.3 | 73.8 | |
| Rokle B14 G | 8.3 | 8.6 | 0.26 | <0.1 | <0.1 | <0.1 | 538 | 66.90 | 73.1 |
| Rokle B14 M | 5.0 | 8.9 | 0.22 | <0.1 | <0.1 | <0.1 | 549 | 64.09 | 73.0 |
| Rokle B14 H | 1.7 | 8.1 | 0.21 | <0.1 | <0.1 | <0.1 | 517 | 58.70 | 70.3 |
| Ibeco Ref. | 14.7 | 0.79 | 0.62 | 0.17 | 0.23 | 611 ± 2 | 57.4 ± 0.4 | 90.2 | |
| Ibeco B11 G | 8.75 | 13.1 | 0.13 | <0.1 | <0.1 | <0.1 | 706 | 49.75 | 97.1 |
| Ibeco B11 3 | 6.25 | 13.1 | 0.13 | <0.1 | <0.1 | <0.1 | 688 | 48.98 | 97.9 |
| Ibeco B11 2 | 3.75 | 13.6 | 0.15 | <0.1 | <0.1 | <0.1 | 660 | 45.04 | 88.6 |
| Ibeco B11 H | 1.25 | 13.6 | 0.10 | <0.1 | <0.1 | <0.1 | 680 | 51.71 | 95.0 |
| MX-80 Ref. | 10.6 | 0.28 | 0.08 | 0.20 | 0.24 | 481 ± 1 | 29.7 ± 0.2 | 83.6 | |
| MX 80 B1 G | 8.3 | 11.6 | 0.27 | 0.16 | 0.11 | 0.16 | 523 | 21.72 | 84.1 |
| MX 80 B1 M | 5.0 | 11.6 | 0.29 | 0.22 | 0.07 | 0.22 | 542 | 18.91 | 87.6 |
| MX 80 B1 H | 1.7 | 11.4 | 0.24 | 0.22 | 0.02 | 0.22 | 528 | 22.48 | 87.8 |
| Core Sample | Initial Mass (g) | Initial Dry Density (g/cm3) | Initial w.c. (%) | Time Elapsed (days) | Squeezing Pressure (MPa) | Pore Fluid Extracted/ Mass Loss (g) | Final Mass (g) | Final Dry Density (g/cm3) | Final w.c. (%) | Efficiency (%) (1) | Efficiency (%) (2) |
|---|---|---|---|---|---|---|---|---|---|---|---|
| Asha B28 | 208.74 | 1.53 | 28.6 | 7 | 20 | 7.3 | 201.44 | 1.62 | 26.4 | 45.3 | 15.7 |
| FEBEX B25 | 369.23 | 1.49 | 26.6 | 7 | 30 | 10.1 | 359.15 | 1.62 | 24.8 | 58.8 | 13.0 |
| Rokle B14 | 292.90 | 1.60 | 31.2 | 5 | 20 | 10.8 | 282.06 | 1.67 | 25.4 | 23.3 | 15.6 |
| IBECO B11 | 187.07 | 1.49 | 36.0 | 3 | 20 | 7.1 | 180.00 | 1.55 | 28.7 | 49.5 | 14.3 |
| MX-80 B1 | 201.08 | 1.51 | 35.8 | 3 | 30 | 5.8 | 195.26 | 1.60 | 25.9 | 17.2 | 11.0 |
| Sample | Asha Block 28 S | FEBEX Block 25 W | Rokle Block 14 NW | IBECO Block 11 S | MX-80 Block 1 IN |
|---|---|---|---|---|---|
| Sq. Pressure (MPa) | 20 | 30 | 20 | 20 | 30 |
| Water content (%) | 28.6 | 26.6 | 31.2 | 36.0 | 35.8 |
| Total weight (g) | 208.74 | 369.23 | 292.90 | 187.07 | 201.08 |
| Water type | Na-Ca-Cl | Na-Ca-Cl | Na-Ca-Cl | Na-Ca-Cl | Na-Cl |
| pH | 7.9 | 7.3 | 7.7 | 7.1 | 7.5 |
| Alkalinity (meq/L) | 0.94 | 0.90 | 0.90 | 0.76 | 1.18 |
| F− (mg/L) | <1 | <1 | <1 | <1 | <1 |
| Br− (mg/L) | 152 | 195 | 128 | 112 | 28 |
| Cl− (mg/L) | 25,000 | 24,000 | 24,000 | 19,000 | 5800 |
| SO42− (mg/L) | 1100 | 1100 | 1100 | 1700 | 1800 |
| NO3− (mg/L) | 6.1 | <1 | <1 | 3.3 | 1.3 |
| Si (mg/L) | 210 | 7.0 | 3.6 | 200 | 8.5 |
| Al (mg/L) | <0.3 | <0.3 | 0.08 | <0.3 | 0.09 |
| Na (mg/L) | 9620 | 8100 | 9460 | 8040 | 3410 |
| K (mg/L) | 185 | 110 | 150 | 256 | 59 |
| Ca (mg/L) | 6100 | 4450 | 4350 | 3175 | 575 |
| Mg (mg/L) | 450 | 1500 | 560 | 850 | 180 |
| Sr (mg/L) | 49 | 60 | 47 | 30 | 12 |
| Ba (mg/L) | 0.45 | 0.52 | 0.55 | <0.3 | 0.33 |
| Fe (mg/L) | <0.3 | 1.4 | <0.03 | <0.3 | 0.04 |
| Cu (mg/L) | 0.67 | 0.70 | 0.39 | 1.0 | 0.19 |
| B (mg/L) | 4.5 | 0.90 | 0.26 | 3.1 | 0.07 |
| Mn (mg/L) | 1.3 | 2.8 | 0.52 | 8.9 | 0.59 |
| Mo (mg/L) | <0.3 | <0.3 | 0.37 | <0.3 | 0.67 |
| Ni (mg/L) | <0.3 | 1.7 | 0.14 | 3.9 | 2.0 |
| Ti (mg/L) | <0.3 | <0.3 | <0.03 | <0.3 | <0.03 |
| V (mg/L) | <0.3 | <0.3 | <0.03 | <0.3 | <0.03 |
| Zn (mg/L) | 0.41 | <0.3 | 0.06 | 0.51 | 0.23 |
| S2O32− (mg/L) | < 1 | <1 | <1 | <1 | <1 |
| Acetate (mg/L) | 51 | <1 | 48 | 21 | 1.8 |
| Formate (mg/L) | 35 | <1 | 2.0 | 741 | 14 |
| TOC (mg/L) | n.d. | 57.1 | 97.1 | n.d | 44.2 |
Publisher’s Note: MDPI stays neutral with regard to jurisdictional claims in published maps and institutional affiliations. |
© 2022 by the authors. Licensee MDPI, Basel, Switzerland. This article is an open access article distributed under the terms and conditions of the Creative Commons Attribution (CC BY) license (https://creativecommons.org/licenses/by/4.0/).
Share and Cite
Fernández, A.M.; Marco, J.F.; Nieto, P.; León, F.J.; Robredo, L.M.; Clavero, M.Á.; Cardona, A.I.; Fernández, S.; Svensson, D.; Sellin, P. Characterization of Bentonites from the In Situ ABM5 Heater Experiment at Äspö Hard Rock Laboratory, Sweden. Minerals 2022, 12, 471. https://doi.org/10.3390/min12040471
Fernández AM, Marco JF, Nieto P, León FJ, Robredo LM, Clavero MÁ, Cardona AI, Fernández S, Svensson D, Sellin P. Characterization of Bentonites from the In Situ ABM5 Heater Experiment at Äspö Hard Rock Laboratory, Sweden. Minerals. 2022; 12(4):471. https://doi.org/10.3390/min12040471
Chicago/Turabian StyleFernández, Ana María, José F. Marco, Paula Nieto, Fco. Javier León, Luz María Robredo, María Ángeles Clavero, Ana Isabel Cardona, Sergio Fernández, Daniel Svensson, and Patrik Sellin. 2022. "Characterization of Bentonites from the In Situ ABM5 Heater Experiment at Äspö Hard Rock Laboratory, Sweden" Minerals 12, no. 4: 471. https://doi.org/10.3390/min12040471