
An Improved Understanding of Chalcopyrite Leaching Mechanisms: The Influence of Anisotropic Crystal Planes


1
School of Resources and Environmental Engineering, Wuhan University of Technology, Wuhan 430070, China
2
Key Laboratory of Green Utilization of Critical Non-Metallic Mineral Resources, Ministry of Education, Wuhan University of Technology, Wuhan 430070, China
*
Author to whom correspondence should be addressed.
Minerals 2023, 13(11), 1461; https://doi.org/10.3390/min13111461
Submission received: 13 October 2023
/
Revised: 5 November 2023
/
Accepted: 14 November 2023
/
Published: 20 November 2023
(This article belongs to the Section Mineral Processing and Extractive Metallurgy)
Abstract
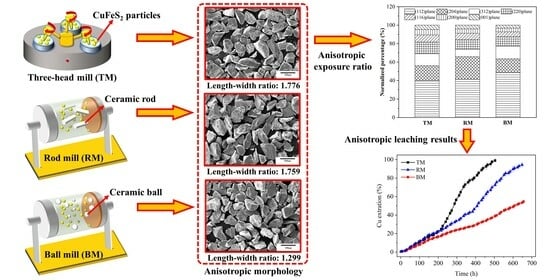
:Chalcopyrite (CuFeS2) particles, exposing anisotropic crystal planes during the grinding process, possess comprehensive surface properties that affect their leaching behaviors. In order to investigate the influence of anisotropic crystal planes on the leaching mechanisms, CuFeS2 particles with anisotropic crystal planes were produced by employing three-head laboratory grinder mill (TM), rod mill (RM), and ball mill (BM) and were then leached in a sulfuric acid solution at pH = 1. Based on the XRD, SEM, XPS, and simulation results, (112), (102), (312), (110), (116), (100), and (001) planes were mainly exposed on the CuFeS2 surface during the crushing and grinding process. In addition, fewer (112), (102), (312), and (110) planes but more (116), (100), and (001) planes were exposed on the CuFeS2 samples in the TM method than in the RM and BM methods. Since the leaching rates were in the order of (001) > (100) > (116) > (110) > (312) > (102) > (112) planes, the Cu extractions followed an order of TM > RM > BM. This study, therefore, provides an excellent theoretical basis for the effect of anisotropic crystal planes on CuFeS2 leaching, further improving the understanding of CuFeS2 leaching mechanisms.
1. Introduction
Copper is an important nonferrous metal that has been widely used in various areas such as the light, electrical, communications, construction, and machinery manufacturing industries and other industries [1]. Copper metal is mainly purified from chalcopyrite (CuFeS2), since approximately 70% of the Earth’s copper resources are found as CuFeS2 [2,3]. The average copper grades are about 0.4% and 1~2% for open-cast and underground CuFeS2 deposits [1], respectively. Generally, a flotation process is employed to obtain a CuFeS2 concentrate [4], followed by the metallurgy process for copper production [5]. In addition, pyrometallurgical methods are preferentially considered for high-grade CuFeS2 concentrates (greater than 20%) [6]. However, these methods lead to extensive environmental problems due to the emission of SO2 [7,8]. As an alternative to pyrometallurgy, hydrometallurgy has been paid much attention due to its advantages, such as being a more economical method of treating low-grade ores and being more environmentally friendly [3,5].
However, hydrometallurgical processing of CuFeS2 has not been widely adopted in the industry due to the extremely slow leaching kinetics [9,10,11,12,13,14], mainly due to the formation of passivation layers on the CuFeS2 surface [15,16,17,18,19,20,21]. Thus, the investigation of the formation and elimination mechanisms of the passivation layer is very important for the application of CuFeS2 hydrometallurgy. In recent years, various analytical methods have been applied to investigate the properties of the passivating layer on the CuFeS2 surface [22,23,24,25], such as scanning electron microscopy (SEM), synchrotron scanning photoelectron microscopy (SPEM), transmission electron microscopy (TEM), and X-ray photoelectron spectroscopy (XPS). However, there is no generally accepted theory as to the composition of the passivation layer. Córdoba et al. [3] reported that the passivation layers were predominantly composed of bimetallic sulfide, iron-deficient copper polysulfide, and elemental sulfide. Li et al. [5] reported that the formation of elemental sulfide, disulfide, polysulfide, and iron hydroxy-oxide inhibited the leaching of CuFeS2. In this case, it is extremely urgent to clarify the surface properties of CuFeS2 to better understand the leaching mechanisms.
In addition, the surface properties of minerals are closely associated with the mineral’s exposed planes. For instance, Wei et al. [26] indicated that the MoS2 face (i.e., (001) plane) exhibited hydrophobic properties while the MoS2 edges (i.e., (103), (105), (100), and (110) planes) exhibited hydrophilic properties. Therefore, investigations on the anisotropic crystal planes are very important for determining the surface properties of CuFeS2. Normally, the CuFeS2 (112), (102), (312), (110), (116), (100), and (001) planes are exposed during the crushing and grinding process [27,28,29,30]. The properties of these crystal planes have been widely investigated using density functional theory (DFT) calculations from the viewpoint of theory. For example, de Oliveira et al. [31] reported three different reconstruction mechanisms for CuFeS2-typical planes, wherein the reconstructed planes presented different properties. Wei et al. [27] investigated the relaxation and oxidation of the CuFeS2 (001) and (112) planes on exposure to O2 and H2O, indicating that the formation of disulfide (S22−) on the CuFeS2 (001) plane and polysulfide (Sn2−) on the CuFeS2 (112) plane inhibited the leaching process. Meanwhile, the CuFeS2 (001) plane per unit area was more easily oxidized than the (112) plane. However, the influence of the anisotropic crystal planes’ properties on the actual leaching performance of CuFeS2 and the underlying mechanisms remain unclear up to now.
In this study, three different grinding methods (i.e., a three-head laboratory mill with a grinder mill (TM), a rod mill (RM), and a ball mill (BM) were considered to obtain CuFeS2 particles with anisotropic crystal planes, followed by the leaching experiment to investigate the influence of the anisotropic crystal plane on the leaching behavior of CuFeS2. The anisotropy of the CuFeS2 raw samples was analyzed using X-ray diffraction (XRD) and SEM; XPS and DFT simulation were employed to investigate the anisotropic oxidation properties of the CuFeS2 planes. This study, therefore, provides an excellent theoretical basis in revealing the influence of anisotropic crystal planes on CuFeS2 leaching mechanisms, providing new insights for the application of CuFeS2 hydrometallurgy.
2. Materials and Methodology
2.1. CuFeS2 Samples
The high-purity chunks of CuFeS2 samples (Figure S1 and Table S1, Supplementary Materials, the content of CuFeS2 was nearly 98 wt%) obtained from the Araci Mine in Peru were crushed to small particles (around 5 mm) and milled in three ways, i.e., TM (RK/XPM 120 × 3 three-head grinding machine, Wuhan Rock Grinding Equipment Manufacturing Co., Ltd., Wuhan, China), RM (XMB-70, three-roller, four-barrel rod mill, Wuhan Prospecting Machinery Factory, Wuhan, China), and BM (XMB-70, three-roller, four-barrel ball mill, grinding mediums using ceramic balls), followed by wet sieving to obtain particles with two size fractions of 38~75 μm and 75~150 μm. These samples were treated using ultrasonication (JP-020, Shenzhen Jie Meng Cleaning Equipment Co., Ltd, Shenzhen China) under ethanol solution conditions at 40 KHz for 2 mins to remove the attached fine particles from the sample surfaces, which were freeze-dried (LGJ-12, vacuum freeze dryer, Beijing Songyuanhuaxing Technology Develop Co., Ltd., Beijing, China) to avoid further surface oxidation.
2.2. Leaching Experiments
Briefly, 500 mL glass reactor vessels with a 5-port lid were used for the leaching experiments. A 1 g CuFeS2 sample and 400 mL of a sulfuric acid solution at pH = 1 were poured into the reactor vessel to avoid interference from other ions [5] and were then heated using a thermostatically controlled silicone oil bath at 75 °C. The 5-port lid provided access to the leach solution; three ports were used to house a thermometer, a Teflon impeller, and a reflux condenser, and the remaining two ports were covered with a plug to avoid moisture evaporation. The four-blade Teflon impeller was driven by a digitally controlled stirrer at a constant agitation speed of 170 rpm.
Subsequently, 5 mL solution samples were taken twice a day at intervals of 8 h and 16 h, respectively. Then, the solution was filtered through a 0.22 µm membrane for pH and Cu-concentration tests. The pH was maintained at 1 by adding 5 M H2SO4 [5].
2.3. Bulk and Surface Analyses
In order to determine the exposed crystal planes for the CuFeS2 samples treated through the TM, RM and BM methods, CuFeS2 samples with size fractions of 38~75 μm and 75~150 μm were directly tested using XRD (D8 Advance, Bruker, Germany, with 2θ from 10° to 70° (Cu Kα) at a scanning speed of 0.2°/min). The obtained data were analyzed using Jade 6.0 software (Materials Data, Inc., Livermore, CA, USA) to determine the exposed crystal planes corresponding to each diffraction peak based on the standard XRD pattern. Since the preferred orientation may exist in the XRD test for bigger CuFeS2 particles, side-loading methods and the rotation of the sample table were considered to avoid the preferred orientation [32]. SEM analyses (Zeiss Ultra Plus, Oberkochen, Germany) were conducted on the surface of leached CuFeS2, with an acceleration voltage of 30 keV.
A Thermo Scientific K-Alpha (Thermo Fisher-VG Scientific, Waltham, MA, USA) was used for XPS analyses of the leached CuFeS2. The XPS instrument was operated using an Al K-Alpha X-ray source (hv = 1486.6 eV) at 12 kV and 6 mA with a pressure of 2.0 × 10⁻⁷ m Bar. Next, 2.0 g of samples with a particle size of 38~75 µm were conditioned. The obtained spectra were analyzed using Avantage software (Thermo Fisher-VG Scientific, Thermo Fisher Scientific, Waltham, MA, USA). The binding energies were referenced to the C 1s peak at 284.8 eV.
2.4. DFT Calculation
The CuFeS2 bulk was constructed through Materials Studio 8.0 according to our previous research [27]. The geometric optimization calculation was performed using the same calculation parameters, i.e., generalized gradient approximation (GGA) with PW91 corrections in the CASTEP package, with a cutoff energy of 351 eV, and a Monkhorst−Pack scheme with a 3 × 3 × 3 k-point mesh. Subsequently, the CuFeS2 (112), (102), (312), (110), (116), (100), and (001) planes were cleaved based on the optimized CuFeS2 bulk. The surface energies (Es) [27,33] and the adsorption energy [34] were calculated to determine the reactivity of the CuFeS2 plane.
3. Results and Discussion
3.1. Anisotropic Leaching Results
In order to investigate the influence of the anisotropic crystal plane on CuFeS2 leaching, three different grinding methods (TM, RM, and BM) were employed to obtain CuFeS2 particles with anisotropic crystal planes, which were then leached in a H2SO4 solution. For the three CuFeS2 samples with a particle size of 38~75 μm, a similar increasing trend of Cu extractions was obtained (Figure 1a), giving Cu extractions at around 76.2%, 78.9%, and 87.5% at 648 h for the TM, RM, and BM methods, respectively. In contrast, significantly different evolutions of Cu extractions were observed for the three CuFeS2 samples with a particle size of 75~150 μm (Figure 1b), giving a Cu extraction order of TM > RM > BM. It should be noted that Cu was nearly completely extracted within 500 h for the TM method, while the Cu extractions were around 94% and 53% at 648 h for the RM and BM methods, suggesting that the TM method was beneficial for the leaching of bigger CuFeS2 particles.
In addition, the leaching rate was higher for smaller CuFeS2 particles in the BM method due to their bigger surface area [5,35]. However, the bigger CuFeS2 particles obtained through the TM and RM methods exhibited a higher leaching rate than the smaller particles, especially for the TM method, suggesting that the surface properties of the CuFeS2 particles in the three grinding methods led to significantly different leaching results.
3.2. Anisotropy of CuFeS2 Raw Samples
In order to investigate the differences in the surface properties, XRD and SEM tests were employed for the CuFeS2 raw samples. Figure 2 shows the XRD patterns; the typical exposed planes for all the CuFeS2 raw samples were the (112), (102), (312), (110), (116), (100), and (001) planes [27,28,29,30]. For the size fraction of 38~75 μm, all diffraction peaks at various planes of the three CuFeS2 samples exhibited a similar intensity, suggesting that the exposed percentages of each plane for the three smaller CuFeS2 particles were similar (Figure 2a), since the intensity of the diffraction peak is highly related to the exposed percentage of the planes [27,33,36]. In contrast, the intensities of diffraction peaks at various planes for the three CuFeS2 samples with a particle size of 75~150 μm were significantly different (Figure 2b), suggesting that bigger CuFeS2 particles from all three grinding methods had different exposed percentages for each plane, thus presenting different leaching rules as shown in Figure 1b. In other words, the anisotropic crystal planes of the CuFeS2 particles seemed to dominate their leaching behavior.
In order to further investigate the anisotropy of the raw CuFeS2 samples, the normalized percentages of the typically exposed planes for three CuFeS2 samples based on the diffraction peak intensity of each plane were calculated (Figure 3 and Tables S2 and S3). Obviously, the normalized percentage rules of the (112), (102), (312), (110), (116), (100), and (001) planes for the three CuFeS2 samples with particle sizes of 38~75 μm and 75~150 μm were different, e.g., the differences in the normalized percentages between the standard value and the experimental value of the (112) plane for the TM, RM, and BM methods were −9.279%, −8.210%, and −7.456% for the three smaller CuFeS2 particles, while they were −15.357%, −13.541%, and −6.307% for the three bigger CuFeS2 particles, respectively, indicating that the three bigger CuFeS2 particles exhibited greater differences in their exposure percentages. For the (001) plane, the three smaller CuFeS2 samples still exhibited similarly normalized percentages for the TM, RM, and BM methods (i.e., 3.856%, 3.908%, and 3.264%, respectively). However, the three bigger CuFeS2 particles exhibited different normalized percentages of the exposed planes for the TM, RM, and BM methods (i.e., 3.613%, 2.959%, and 2.053%, respectively), suggesting that the three bigger CuFeS2 particles exhibited greater anisotropy than the smaller CuFeS2 particles. In addition, the total percentages of the (112), (102), and (312) planes for the three bigger CuFeS2 particles were in the order of TM > RM > BM, while the (110), (116), (100), and (001) planes exhibited a total percentage order of TM < RM < BM (Figure 3), further demonstrating the crystal plane anisotropy for the three bigger CuFeS2 particles.
Figure 4 presents the SEM results of raw CuFeS2 samples at 75~150 µm for the TM, RM, and BM methods. It can be clearly observed that the samples in the TM and RM methods were mainly long, irregular particles, while the samples in the BM method were mainly rounded particles. As shown in Table 1, the length–width ratios based on the average length and width for raw CuFeS2 samples in the TM, RM, and BM methods were 1.776, 1.759, and 1.299, respectively, suggesting that the exposure percentage for each plane was related to the length–width ratio of the particles. Combining the normalized percentage of the typical exposed plane and the length–width ratio of the raw CuFeS2 samples, the long, irregular particles in the TM method exposed fewer (112), (102), (312), and (110) planes but more (116), (100), and (001) planes than the rounded particles in the BM method.
3.3. XPS Analysis
The three bigger CuFeS2 samples were tested using XPS to investigate the species differences on the CuFeS2 surface. Figure 5 and Table 2 show the XPS survey spectra of the CuFeS2 surface and the elemental quantification (at %) of the CuFeS2 surfaces, respectively. The O 1s peak at 532.1 eV was found on the CuFeS2 surface, and the O contents were 43.87%, 53.37%, and 70.40% on the surface of CuFeS2 treated using the BM, RM, and TM methods, respectively, indicating that the order of the oxidation degree of the CuFeS2 surface treated using different methods was TM > RM > BM.
The Fe contents on the surface of CuFeS2 treated using the BM, RM, and TM methods were determined to be 8.56%, 9.48%, and 4.88%, respectively, indicating that Fe was more readily leached from the surface of CuFeS2 when treated with the TM method. The Cu contents on the surface of the CuFeS2 treated using the BM, RM, and TM methods were found to be 38.31%, 32.22%, and 16.64%, respectively, suggesting that Cu was more easily leached from the surface of CuFeS2 when subjected to the TM method, compared with both the BM and RM methods. This observation is consistent with the leaching results presented in Figure 5.
Figure 6 and Table 3 show the fitted S 2p spectra and S species of the bigger CuFeS2 particles treated using the BM, RM, and TM methods. The S 2p3/2 component located at 161.4 eV for CuFeS2 was attributed to the monosulfide S2− species [37,38]. The 2p3/2 spectra due to S22−, Sn2−, S0, SO32−, SO42− and the energy loss of CuFeS2 were located at 162.2, 163.2, 163.7, 166.3, 168.8, and 165.1 eV, respectively [38,39,40]. The concentrations of S22−, Sn2−, S0, SO32−, and SO42− on the BM-treated CuFeS2 surface were 8.60%, 0%, 23.57%, 3.81%, and 34.59%, respectively (Table 3). The presence of oxidized S species indicated that the surface S2− of CuFeS2 was oxidized to S22−, Sn2−, and S0, which were the main substances forming the passivation layer [41]. The passivation layer composed of S22−, Sn2−, and especially S0, hindered the further leaching of CuFeS2, which was the main reason for the low leaching rate of CuFeS2 treated using the BM method.
The concentrations of S22−, Sn2−, S0, SO32−, and SO42− on the RM-treated CuFeS2 surface were 10.32%, 5.50%, 8.12%, 0.54%, and 39.02%, respectively (Table 3). The S species content on the surface of CuFeS2 treated using the TM method was comparable to that observed on the surface of CuFeS2 treated using the RM method, except for a higher presence of SO42− compounds. The low concentration of S0 and the high concentration of SO42− indicated that the surface of CuFeS2 treated using the RM and TM methods had reduced passivation layer formation, enhancing the generation of highly oxidized SO42− during leaching, further facilitating the leaching process. The highest SO42− content was found on the CuFeS2 surface treated using the TM method, indicating a significant oxidation reaction and the maximum leaching rate. Overall, the CuFeS2 samples treated using the BM, RM, and TM methods in the same leaching conditions underwent varying degrees of oxidation, especially showing different evolutions for the S species on the chalcopyrite surface. These results indicate that the anisotropic crystal planes of CuFeS2 significantly affected its leaching behavior.
3.4. The Properties of Anisotropic Crystal Planes
In order to further investigate the reactivities of CuFeS2 planes, the properties of the CuFeS2 planes were investigated through the same calculation methods as in our previous research (e.g., only Fe and S sites were considered for the adsorption of O2) [27]. Due to the symmetry of the CuFeS2 structure (i.e., each Cu/Fe atom is bonded with four surrounding S atoms, each S atom is bonded with two surrounding Cu atoms and two surrounding Fe atoms) [31], the CuFeS2 (112), (312), (116), (100), and (001) planes exposed both sulfur-terminated (only exposing S atoms) and metal-terminated (only exposing Fe/Cu atoms) planes, while the CuFeS2 (102) and (110) planes exposed mixed terminated (exposing both S and Fe/Cu atoms) planes during the cleavage process (Figure S2), which fully exhibited the anisotropic structure of CuFeS2 planes.
Table 4 exhibits the surface energies of the CuFeS2 planes, giving the order of (112)-S < (112)-M < (102) < (312)-M < (312)-S < (110) < (116)-S < (116)-M < (100)-S < (100)-M < (001)-S < (001)-M planes, suggesting that the stabilities of the CuFeS2 planes were in the order of (112) > (102) > (312) > (110) > (116) > (100) > (001) planes [27,42,43,44], consistent with the exposed percentage of CuFeS2 planes for all the grinding methods (Figure 3), e.g., the CuFeS2 (112) plane obtained the lowest surface energy (0.923 J·m−2 for the (112)-S plane and 1.018 J·m−2 for the (112)-M plane) and was, thus, preferentially exposed during the grinding process [27], occupying the highest exposed percentage (more than 40%, Table S1). It should be noted that the CuFeS2 (001) planes with the highest surface energy (1.495 J·m−2 for the (001)-S plane and 1.556 J·m−2 for the (001)-M plane) were less easily exposed during the grinding process, occupying the lowest exposed percentage (less than 5%, Table S1).
Since the leaching experiments were performed in a sulfuric acid solution at pH = 1, components such as H2O, O2, SO42−, and HSO4− that could react with the CuFeS2 planes were present in the solution. Research indicated that O2 was adsorbed on the CuFeS2 planes prior to the adsorption of H2O, SO42−, and HSO4− [27,34,35]. For example, de Lima et al. [34,45] reported that the adsorption energies were −142.12, −105.34, and 95.30 kJ·mol−1 for SO42−, HSO4−, and H2O at Fe sites on the CuFeS2 (001) plane. Wei et al. [27] reported that the adsorption energies of H2O and O2 at Fe sites on the CuFeS2 (001) plane were −153.94 and −556.12 kJ·mol−1, respectively. In addition, the reactivity of the Fe sites was stronger than that of the Cu sites on the CuFeS2 metal-terminated planes [27]. In this case, only the adsorption of O2 at Fe and S sites on the CuFeS2 planes was considered to compare the reactivity of each plane, and the results are shown in Table 4 and Figure 7 and Figure S3.
It was clearly seen that the adsorption energy per unit area at Fe sites on each plane was more negative than that at S sites, suggesting that these Fe sites were more easily oxidized than the S sites due to the higher affinity of Fe sites for O2 than that of S sites for O2 [38]. For the adsorption of O2 at Fe sites on CuFeS2 planes, the adsorption energies per unit area were −1316.631, −1372.095, −1571.115, −1633.777, −1654.440, −1858.123, and −2027.415 kJ·mol−1·nm−2 for the (112)-M, (102), (312)-M, (110), (116)-M, (100)-M, and (001)-M planes, respectively, suggesting that the Fe site of the CuFeS2 (001) plane was more easily oxidized by O2 than that in other planes [27,46], thereby forming two Fe-O bonds with lengths of 1.846 Å and 1.859 Å (Figure 7g). The adsorption energy per unit area of O2 at S sites on the CuFeS2 planes exhibited the same rules as that at Fe sites. The adsorption energies per unit area for the (112)-S, (102), (312)-S, (110), (116)-S, (100)-S, and (001)-S planes were −437.384, −470.755, −477.523, −461.095, −527.396, −588.869, and −690.193 kJ·mol−1·nm−2, respectively, suggesting that both the Fe and S sites of the CuFeS2 (001) plane were more easily oxidized by O2; thus, the (001) plane was preferably leached compared with other planes. Overall, the leaching rates of the CuFeS2 planes were in the order of (001) > (100) > (116) > (110) > (312) > (102) > (112) planes.
In addition, it was clearly seen that the adsorption energies per unit area at Fe sites on the (001)-M and (100)-M planes were more negative than those on other planes (Figure 8a), while those on the (001)-S, (100)-S, and (116)-S planes were significantly more negative than those on other planes at the S sites (Figure 8b). In this case, the CuFeS2 samples that contained more (001), (100), and (116) planes, exhibited faster leaching rates, consistent with the leaching experiment results, in which the Cu extraction was in the order of TM > RM > BM methods (Figure 1).
4. Conclusions
In this work, a three-head laboratory mill with a grinder mill (TM), rod mill (RM), and ball mill (BM) was employed to obtain CuFeS2 samples with anisotropic crystal planes. Interestingly, the trend of Cu extractions for three CuFeS2 samples with a particle size of 38~75 μm increasing with leaching time were similar, while the Cu extractions were in the order of TM > RM > BM methods for the three CuFeS2 samples with a particle size of 75~150 μm, indicating that the anisotropic crystal planes of CuFeS2 particles could significantly affect CuFeS2 leaching behavior. The exposed percentages of the CuFeS2 planes were in the order of (112) > (102) > (312) > (110) > (116) > (100) > (001) planes, and the long, irregular particles obtained using the TM method exposed fewer (112), (102), (312), and (110) planes and more (116), (100), and (001) planes. Since the adsorption of O2 on CuFeS2 planes indicated that the leaching rates were in the order of (001) > (100) > (116) > (110) > (312) > (102) > (112) planes, CuFeS2 samples treated using the TM method exhibited the highest oxidization degree. The formation of more SO42− species indicated that CuFeS2 samples treated using the TM method had the least amount of passivation layer, thus exhibiting the highest leaching rate.
Supplementary Materials
The following are available online at https://www.mdpi.com/article/10.3390/min13111461/s1: Figure S1. XRD patterns of raw CuFeS2 sample (D8 Advance, Bruker, Germany). PDF: 71-0507 was the standard XRD pattern of CuFeS2 from Jade 6.0. It was clear that the diffraction peaks of the raw chalcopyrite sample were highly consistent with the standard CuFeS2 XRD pattern (PDF: 71-0507), indicating that the raw CuFeS2 sample in this study was highly purified. Figure S2. Structure and exposed atoms of CuFeS2 planes. Figure S3. Layout of the adsorption of O2 at S sites on the CuFeS2 planes: (a) (112)-S plane; (b) (102) plane; (c) (312)-S plane; (d) (110) plane; (e) (116)-S plane; (f) (100)-S plane; (g) (001)-S plane; distances are in Å. Table S1. Main element contents of CuFeS2 sample using XRF (Zetium, PANalytical, Almelo, Netherlands) (wt. %). Table S2. Normalized exposure percentage of planes for standard and experimental CuFeS2 particles (%). Table S3. Relatively normalized exposed percentage of planes for CuFeS2 particles between standard value and experimental value (%).
Author Contributions
Software, Z.W.; writing—original draft, Z.W. and X.Y.; writing—review and editing, Y.L.; supervision, X.Y., W.L., Q.M., X.W. and Y.L. All authors have read and agreed to the published version of the manuscript.
Funding
The authors would like to acknowledge the financial support from the Key Research and Development Program of Hubei Province (2021BCA127).
Data Availability Statement
The data presented in this study are available on request from the corresponding author.
Conflicts of Interest
The authors declare no conflict of interest.
References
- Jena, S.S.; Tripathy, S.K.; Mandre, N.R.; Venugopal, R.; Farrokhpay, S. Sustainable use of copper resources: Beneficiation of low-Grade copper ores. Minerals 2022, 12, 545. [Google Scholar]
- Dutrizac, J.E. The kinetics of dissolution of chalcopyrite in ferric ion media. Metall. Trans. B 1978, 9, 431–439. [Google Scholar]
- Córdoba, E.M.; Muoz, J.A.; Blázquez, M.L.; González, F.; Ballester, A. Leaching of chalcopyrite with ferric ion. Part I: General aspects. Hydrometallurgy 2008, 93, 81–87. [Google Scholar]
- Li, W.Q.; Li, Y.B.; Wang, Z.H.; Yang, X.; Chen, W. Selective flotation of chalcopyrite from pyrite via seawater oxidation pretreatment. Int. J. Min. Sci. Technol. 2023. [Google Scholar] [CrossRef]
- Li, Y.B.; Kawashima, N.; Li, J.; Chandra, A.P.; Gerson, A.R. A review of the structure, and fundamental mechanisms and kinetics of the leaching of chalcopyrite. Adv. Colloid Interface Sci. 2013, 197–198, 1–32. [Google Scholar]
- Moskalyk, R.R.; Alfantazi, A.M. Review of copper pyrometallurgical practice: Today and tomorrow. Miner. Eng. 2003, 16, 893–919. [Google Scholar]
- Dimitrijević, M.; Kostov, A.; Tasić, V.; Milosević, N. Influence of pyrometallurgical copper production on the environment. J. Hazard. Mater. 2009, 164, 892–899. [Google Scholar] [CrossRef] [PubMed]
- Savić, M.; Mihajlović, I.; Živković, Ž. An anfis–based air quality model for prediction of SO2 concentration in urban area. Serbian J. Manag. 2013, 8, 25–38. [Google Scholar]
- Khoshkhoo, M.; Dopson, M.; Shchukarev, A.; Sandström, Å. Chalcopyrite leaching and bioleaching: An X-ray photoelectron spectroscopic (XPS) investigation on the nature of hindered dissolution. Hydrometallurgy 2014, 149, 220–227. [Google Scholar]
- Watling, H.R. Chalcopyrite hydrometallurgy at atmospheric pressure: 1. Review of acidic sulfate, sulfate–chloride and sulfate–nitrate process options. Hydrometallurgy 2013, 140, 163–180. [Google Scholar]
- Watling, H.R. Chalcopyrite hydrometallurgy at atmospheric pressure: 2. Review of acidic chloride process options. Hydrometallurgy 2014, 146, 96–110. [Google Scholar]
- Nazari, G.; Dixon, D.G.; Dreisinger, D.B. The mechanism of chalcopyrite leaching in the presence of silver-enhanced pyrite in the galvanox™ process. Hydrometallurgy 2012, 113–114, 122–130. [Google Scholar] [CrossRef]
- Hiroyoshi, N.; Arai, M.; Miki, H.; Tsunekawa, M.; Hirajima, T. A new reaction model for the catalytic effect of silver ions on chalcopyrite leaching in sulfuric acid solutions. Hydrometallurgy 2002, 63, 257–267. [Google Scholar] [CrossRef]
- Pan, H.D.; Yang, H.Y.; Tong, L.L.; Zhong, C.B.; Zhao, Y.S. Control method of chalcopyrite passivation in bioleaching. Trans. Nonferrous Met. Soc. China 2012, 22, 2255–2260. [Google Scholar]
- Tshilombo, A. Mechanism and Kinetics of Chalcopyrite Passivation and Depassivation during Ferric and Microbial Leaching. Ph.D. Thesis, University of British Columbia, Vancouver, BC, Canada, 2004. [Google Scholar]
- Parker, A.; Klauber, C.; Kougianos, A.; Watling, H.R.; van Bronswijk, W. An X-ray photoelectron spectroscopy study of the mechanism of oxidative dissolution of chalcopyrite. Hydrometallurgy 2003, 71, 265–276. [Google Scholar] [CrossRef]
- Harmer, S.L.; Pratt, A.R.; Nesbitt, W.H.; Fleet, M.E. Sulfur species at chalcopyrite (CuFeS2) fracture surfaces. Am. Mineral. 2004, 89, 1026–1032. [Google Scholar] [CrossRef]
- Klauber, C.; Parker, A.; van Bronswijk, W.; Watling, H. Sulphur speciation of leached chalcopyrite surfaces as determined by X-ray photoelectron spectroscopy. Int. J. Miner. Process. 2001, 62, 65–94. [Google Scholar] [CrossRef]
- Córdoba, E.M.; Muñoz, J.A.; Blázquez, M.L.; González, F.; Ballester, A. Passivation of chalcopyrite during its chemical leaching with ferric ion at 68 °C. Miner. Eng. 2009, 22, 229–235. [Google Scholar] [CrossRef]
- Viramontes-Gamboa, G.; Peña-Gomar, M.M.; Dixon, D.G. Electrochemical hysteresis and bistability in chalcopyrite passivation. Hydrometallurgy 2010, 105, 140–147. [Google Scholar] [CrossRef]
- Li, J.; Kawashima, N.; Kaplun, K.; Absolon, V.J.; Gerson, A.R. Chalcopyrite leaching: The rate controlling factors. Geochim. Cosmochim. Acta 2010, 74, 2881–2893. [Google Scholar] [CrossRef]
- Parker, G.K.; Woods, R.; Hope, G.A. Raman investigation of chalcopyrite oxidation. Colloids Surf. A Physicochem. Eng. Asp. 2008, 318, 160–168. [Google Scholar] [CrossRef]
- Ciobanu, C.L.; Cook, N.J.; Ehrig, K. Ore minerals down to the nanoscale: Cu-(Fe)-sulphides from the iron oxide copper gold deposit at Olympic Dam, South Australia. Ore Geol. Rev. 2017, 81, 1218–1235. [Google Scholar] [CrossRef]
- Harmer, S.L.; Thomas, J.E.; Fornasiero, D.; Gerson, A.R. The evolution of surface layers formed during chalcopyrite leaching. Geochim. Cosmochim. Acta 2006, 70, 4392–4402. [Google Scholar] [CrossRef]
- Khoshkhoo, M.; Dopson, M.; Engström, F.; Sandström, Å. New insights into the influence of redox potential on chalcopyrite leaching behaviour. Miner. Eng. 2017, 100, 9–16. [Google Scholar] [CrossRef]
- Wei, Z.L.; Li, Y.B.; Huang, L.Y. New insight into the anisotropic property and wettability of molybdenite: A DFT study. Miner. Eng. 2021, 170, 107058. [Google Scholar] [CrossRef]
- Wei, Z.L.; Li, Y.B.; Gao, H.M.; Zhu, Y.G.; Qian, G.J.; Yao, J. New insights into the surface relaxation and oxidation of chalcopyrite exposed to O2 and H2O: A first-principles DFT study. Appl. Surf. Sci. 2019, 492, 89–98. [Google Scholar] [CrossRef]
- Majuste, D.; Ciminelli, V.S.T.; Eng, P.J.; Osseo-Asare, K. Applications of in situ synchrotron XRD in hydrometallurgy: Literature review and investigation of chalcopyrite dissolution. Hydrometallurgy 2013, 131, 54–66. [Google Scholar] [CrossRef]
- Xie, H.Y.; Su, X.L.; Zheng, G.; Yan, Y.G.; Liu, W.; Tang, H.; Kanatzidis, M.G.; Uher, C.; Tang, X.F. Nonmagnetic in substituted CuFe1–xInxS2 solid solution thermoelectric. J. Phys. Chem. C 2016, 120, 27895–27902. [Google Scholar] [CrossRef]
- Zhang, Y.; Zhao, G.G.; Lv, X.; Tian, Y.; Yang, L.; Zou, G.Q.; Hou, H.S.; Zhao, H.B.; Ji, X.B. Exploration and size engineering from natural chalcopyrite to high-performance electrode materials for lithium-ion batteries. ACS Appl. Mater. Interfaces 2019, 11, 6154–6165. [Google Scholar] [CrossRef]
- de Oliveira, C.; de Lima, G.F.; de Abreu, H.A.; Duarte, H.A. Reconstruction of the chalcopyrite surfaces—A DFT study. J. Phys. Chem. C 2012, 116, 6357–6366. [Google Scholar] [CrossRef]
- Zhou, X.; Liu, D.; Bu, H.; Deng, L.; Liu, H.; Yuan, P.; Du, P.; Song, H. Xrd-based quantitative analysis of clay minerals using reference intensity ratios, mineral intensity factors, rietveld, and full pattern summation methods: A critical review. Solid Earth Sci. 2018, 3, 16–29. [Google Scholar] [CrossRef]
- Hu, Y.H.; Gao, Z.Y.; Sun, W.; Liu, X.W. Anisotropic surface energies and adsorption behaviors of scheelite crystal. Colloids Surf. A Physicochem. Eng. Asp. 2012, 415, 439–448. [Google Scholar] [CrossRef]
- de Lima, G.F.; de Oliveira, C.; de Abreu, H.A.; Duarte, H.A. Sulfuric and hydrochloric acid adsorption on the reconstructed sulfur terminated (001) chalcopyrite surface. Int. J. Quantum Chem. 2012, 112, 3216–3222. [Google Scholar] [CrossRef]
- Sokic, M.D.; Markovic, B.; Zivkovic, D. Kinetics of chalcopyrite leaching by sodium nitrate in sulphuric acid. Hydrometallurgy 2009, 95, 273–279. [Google Scholar] [CrossRef]
- Gao, Z.Y.; Li, C.W.; Sun, W.; Hu, Y.H. Anisotropic surface properties of calcite: A consideration of surface broken bonds. Colloids Surf. A Physicochem. Eng. Asp. 2017, 520, 53–61. [Google Scholar] [CrossRef]
- Moimane, T.; Plackowski, C.; Peng, Y.J. The critical degree of mineral surface oxidation in copper sulphide flotation. Miner. Eng. 2020, 145, 106075. [Google Scholar] [CrossRef]
- Li, Y.B.; Chandra, A.P.; Gerson, A.R. Scanning photoelectron microscopy studies of freshly fractured chalcopyrite exposed to O2 and H2O. Geochim. Cosmochim. Acta 2014, 133, 372–386. [Google Scholar] [CrossRef]
- Zhang, P.; Huang, W.; Ji, Z.; Zhou, C.G.; Yuan, S.H. Mechanisms of hydroxyl radicals production from pyrite oxidation by hydrogen peroxide: Surface versus aqueous reactions. Geochim. Cosmochim. Acta 2018, 238, 394–410. [Google Scholar] [CrossRef]
- Khoso, S.A.; Hu, Y.H.; Lu, F.; Gao, Y.; Liu, R.Q.; Sun, W. Xanthate interaction and flotation separation of H2O2-treated chalcopyrite and pyrite. Trans. Nonferrous Met. Soc. China 2019, 29, 2604–2614. [Google Scholar] [CrossRef]
- Li, Y.B.; Wei, Z.L.; Xiao, Q.; Gao, H.M.; Song, S.X. A fundamental DFT study of chalcopyrite surface evolution due to impurity divalent ions during leaching process. Miner. Eng. 2018, 121, 205–211. [Google Scholar] [CrossRef]
- Silva, J.C.M.; Abreu, H.A.D.; Duarte, H.A. Electronic and structural properties of bulk arsenopyrite and its cleavage surfaces—A DFT study. Rsc Adv. 2014, 5, 2013–2023. [Google Scholar] [CrossRef]
- Hung, A.; Muscat, J.; Yarovsky, I.; Russo, S.P. Density-functional theory studies of pyrite FeS2 (100) and (110) surfaces. Surf. Sci. 2002, 513, 511–524. [Google Scholar] [CrossRef]
- Hung, A.; Muscat, J.; Yarovsky, I.; Russo, S.P. Density-functional theory studies of pyrite FeS2 (111) and (210) surfaces. Surf. Sci. 2002, 520, 111–119. [Google Scholar] [CrossRef]
- de Lima, G.F.; de Oliveira, C.; de Abreu, H.A.; Duarte, H.A. Water adsorption on the reconstructed (001) chalcopyrite surfaces. J. Phys. Chem. C 2011, 115, 10709–10717. [Google Scholar] [CrossRef]
- Xiong, X.L.; Hua, X.M.; Zheng, Y.F.; Lu, X.G.; Li, S.G.; Cheng, H.W.; Xu, Q. Oxidation mechanism of chalcopyrite revealed by X-ray photoelectron spectroscopy and first principles studies. Appl. Surf. Sci. 2018, 427, 233–241. [Google Scholar] [CrossRef]
Figure 1.
Leaching experiment results of CuFeS2 samples obtained through three grinding methods: (a) 38~75 µm; (b) 75~150 µm.
Figure 1.
Leaching experiment results of CuFeS2 samples obtained through three grinding methods: (a) 38~75 µm; (b) 75~150 µm.
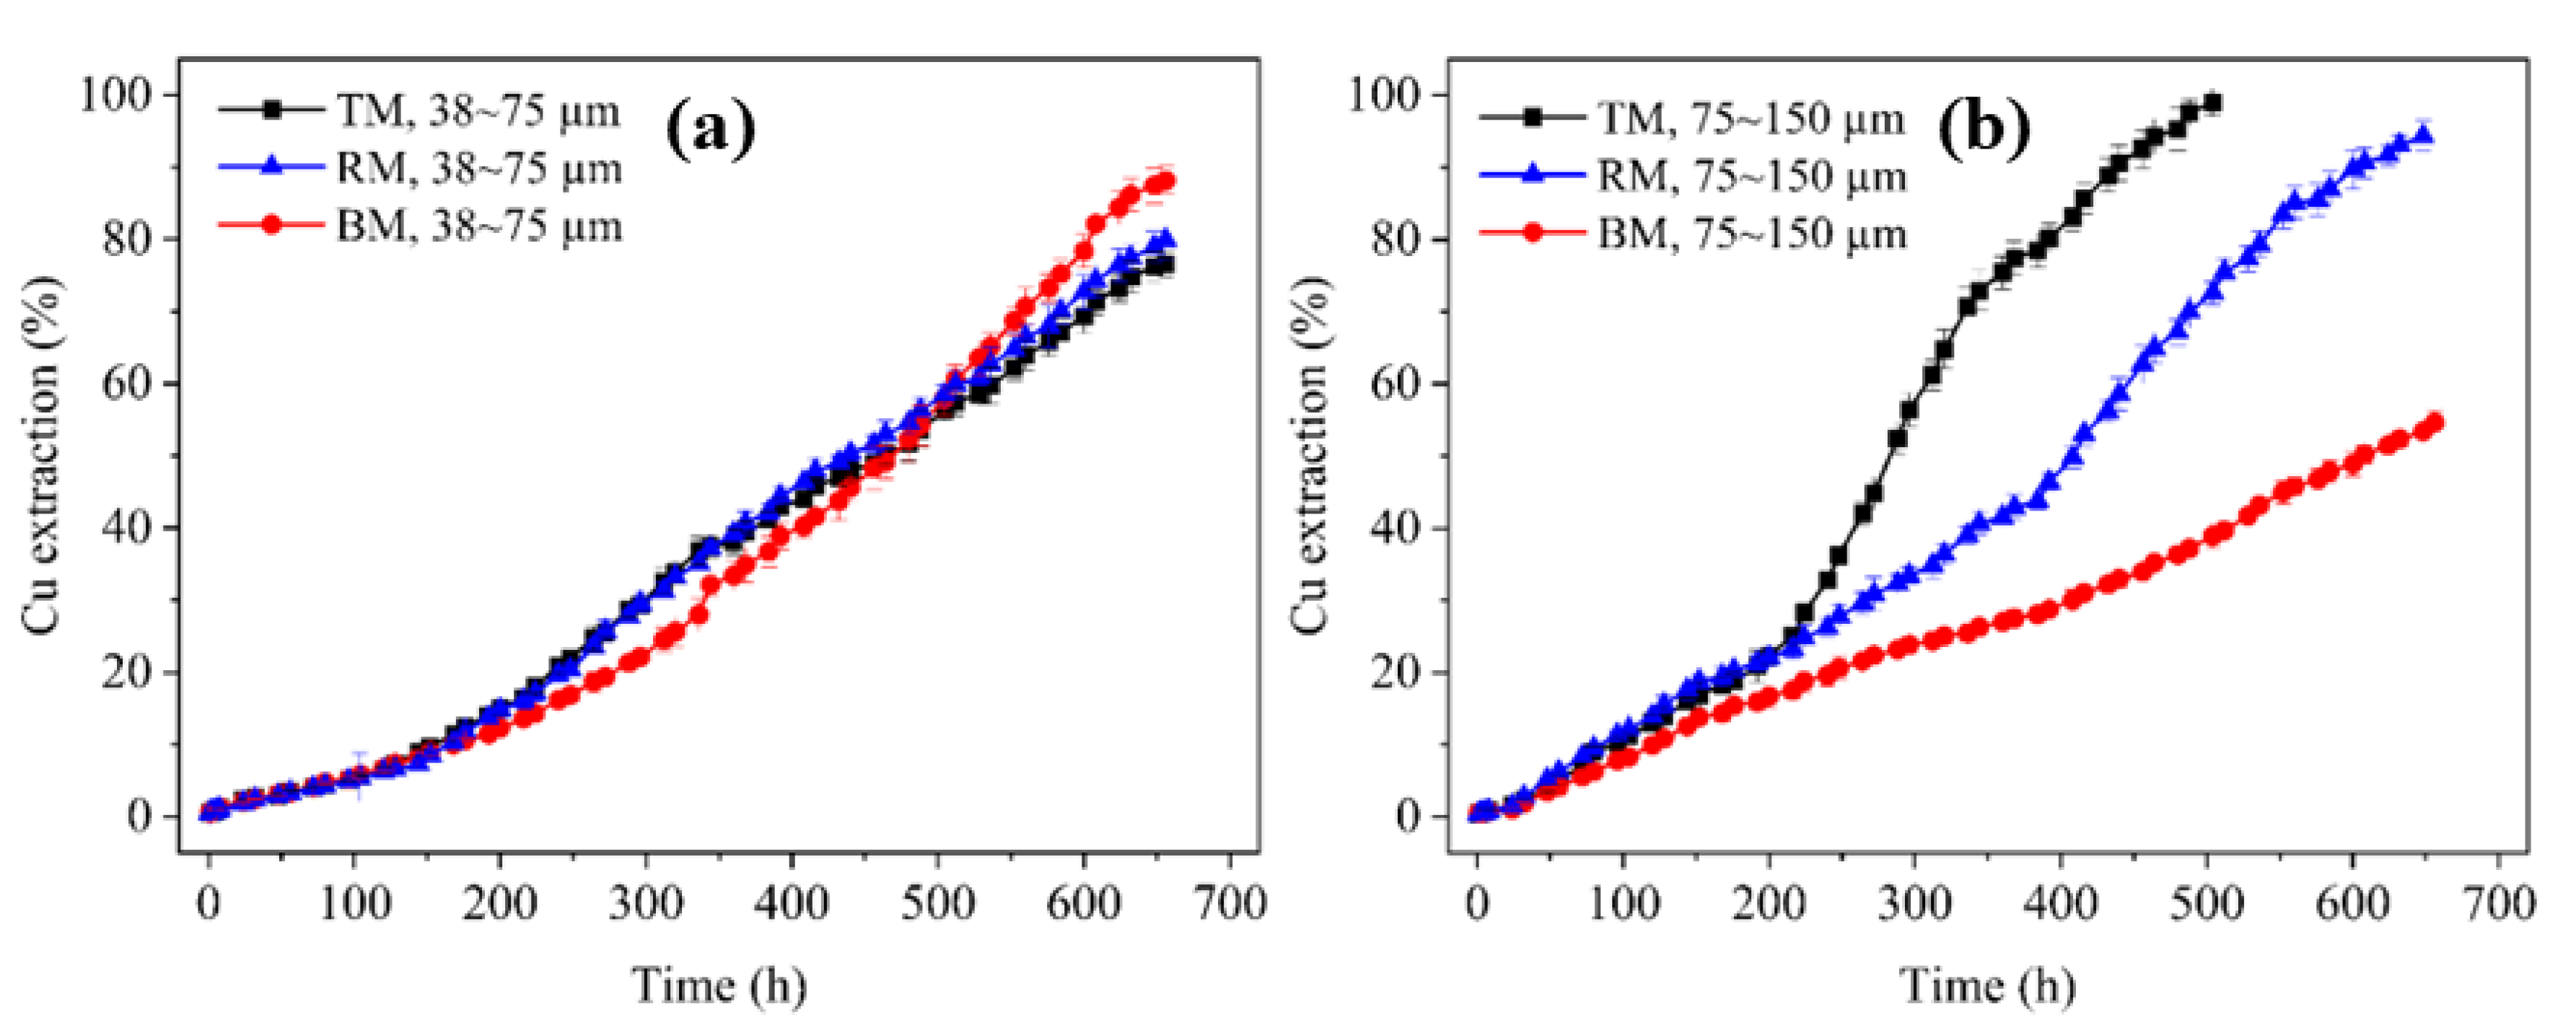
Figure 2.
XRD patterns of raw CuFeS2 samples obtained through three grinding methods: (a) 38~75 µm; (b) 75~150 µm. PDF: 71-0507 was the standard XRD pattern of CuFeS2 from Jade 6.0.
Figure 2.
XRD patterns of raw CuFeS2 samples obtained through three grinding methods: (a) 38~75 µm; (b) 75~150 µm. PDF: 71-0507 was the standard XRD pattern of CuFeS2 from Jade 6.0.
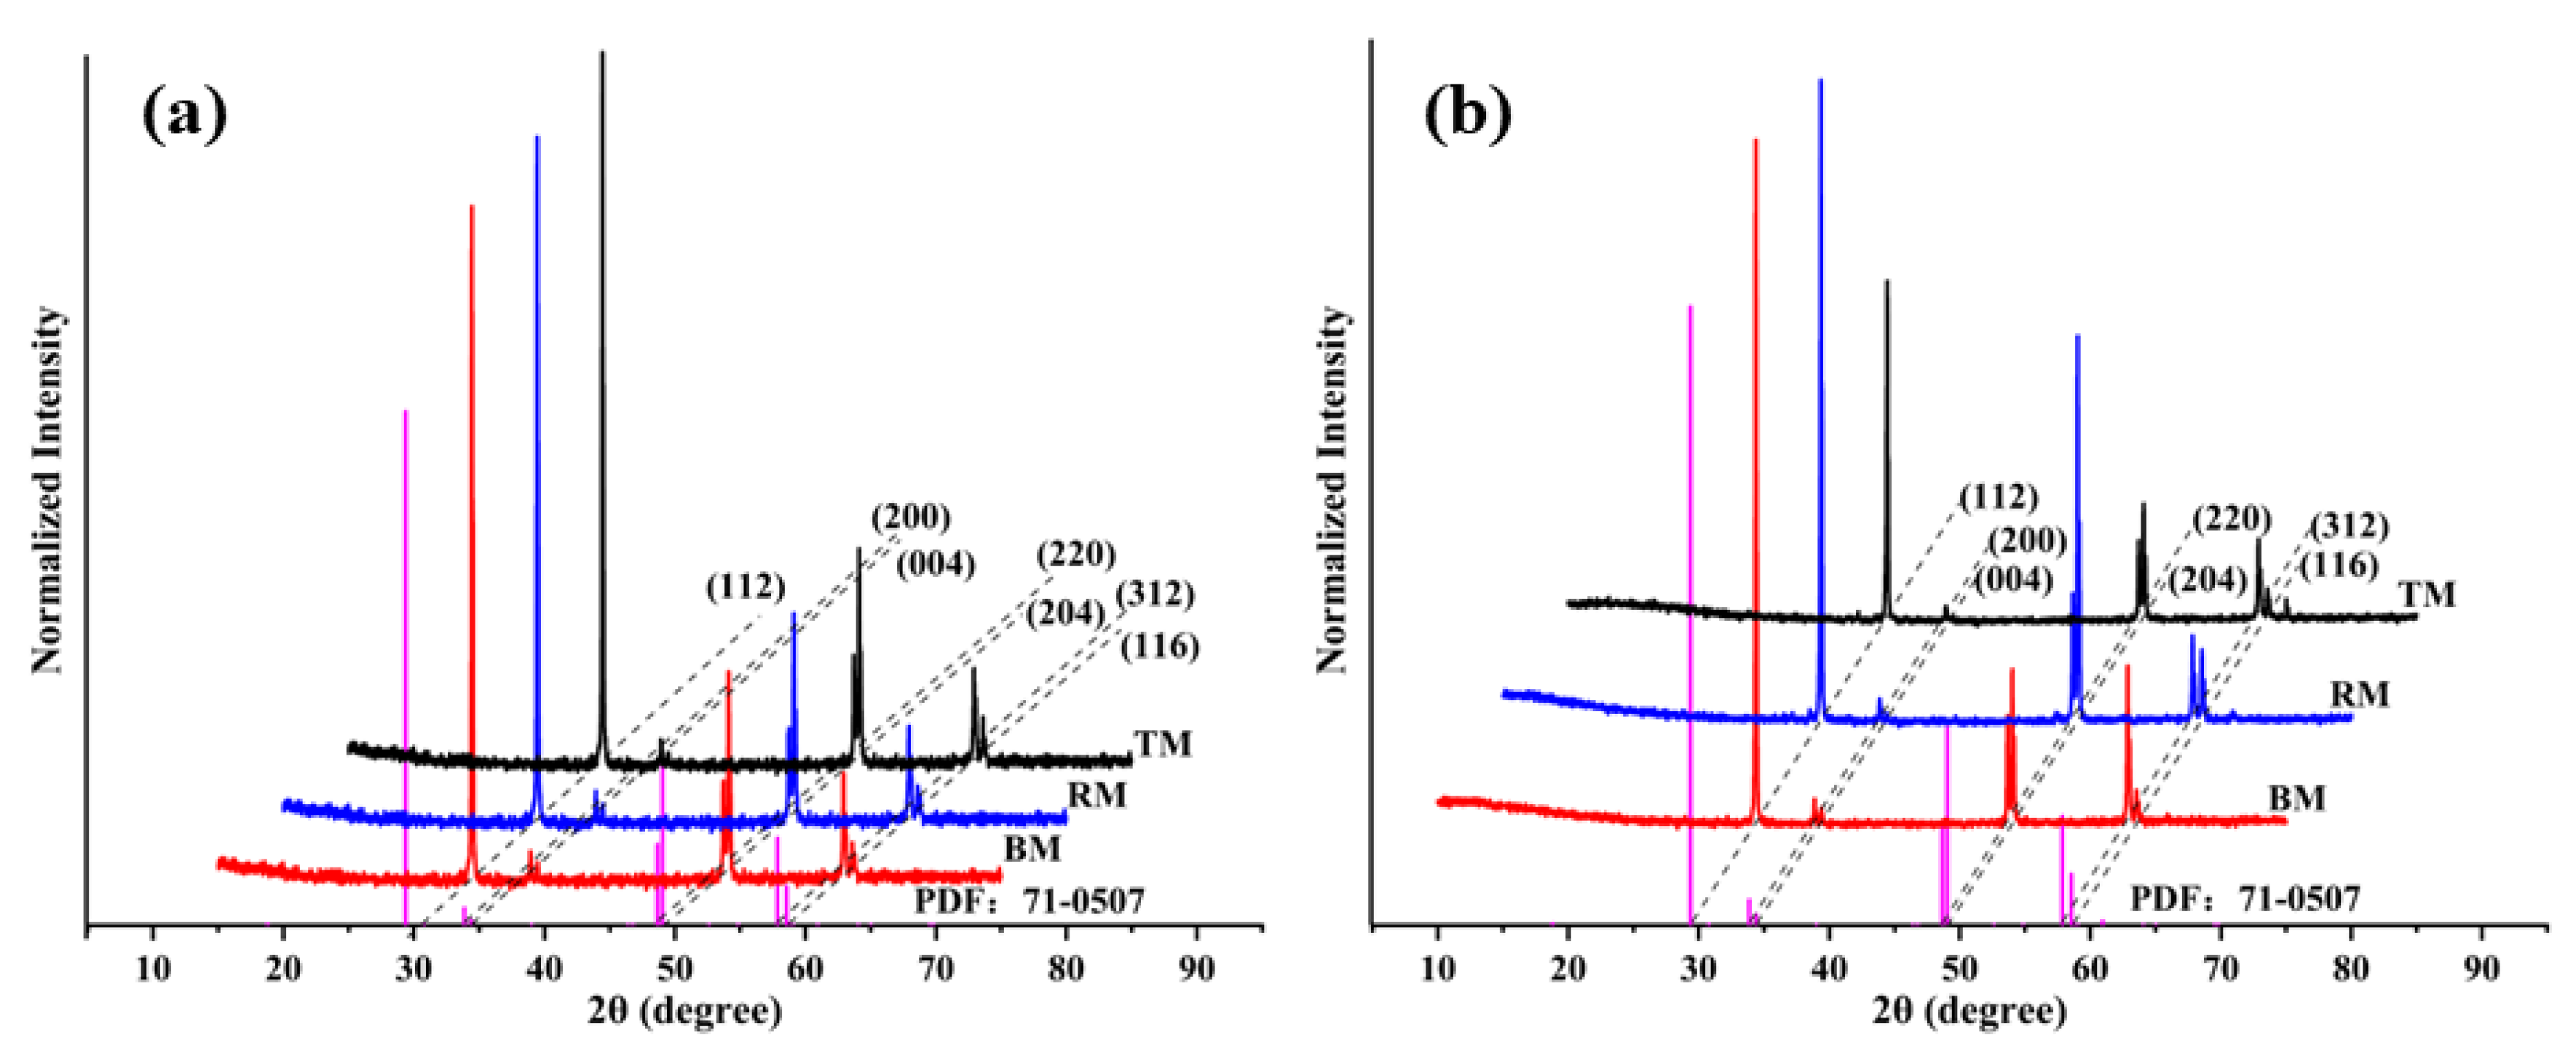
Figure 3.
Normalized percentage of planes for three CuFeS2 samples (%): (a) 38~75 µm; (b) 75~150 µm.
Figure 3.
Normalized percentage of planes for three CuFeS2 samples (%): (a) 38~75 µm; (b) 75~150 µm.
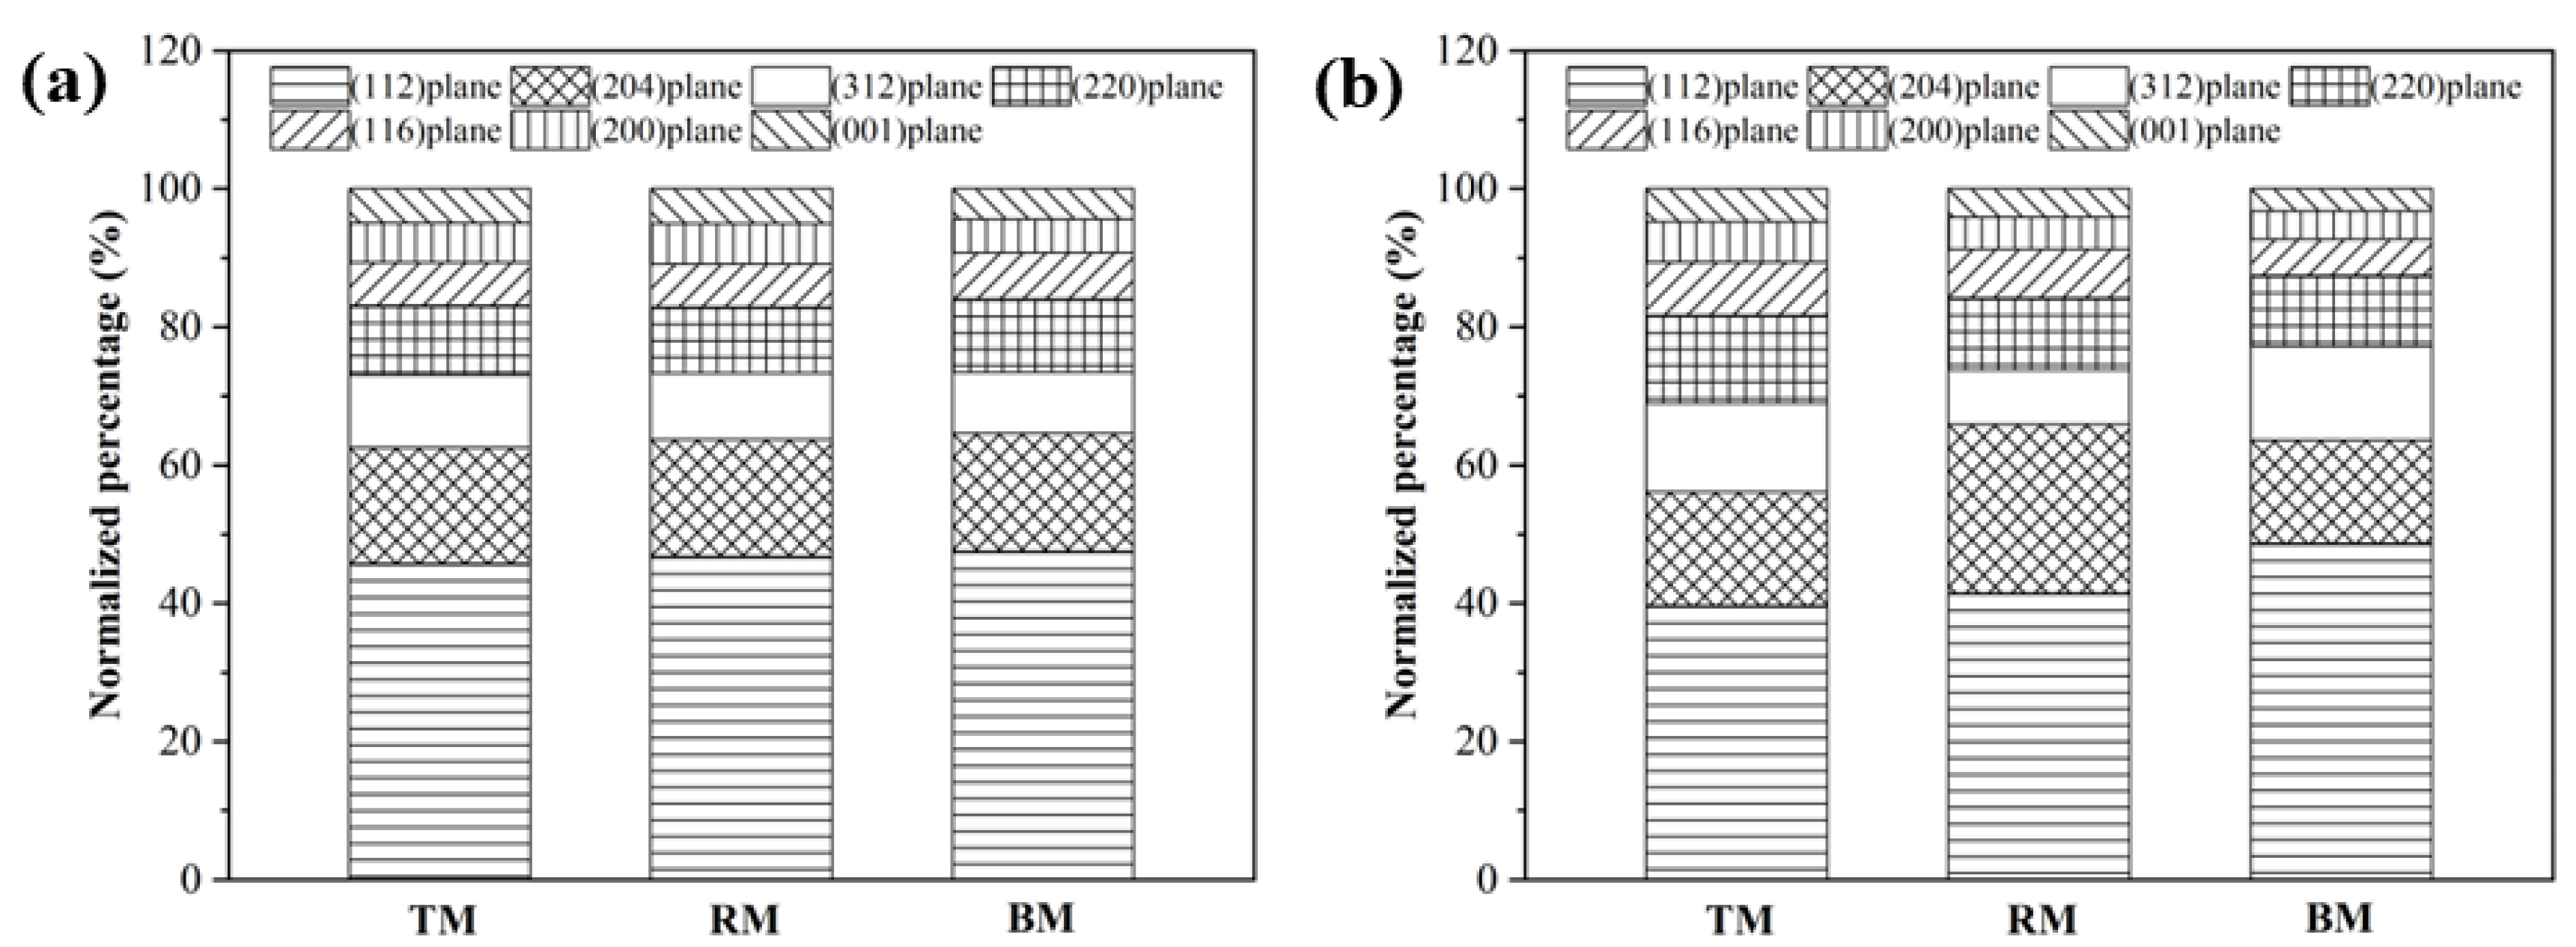
Figure 4.
SEM images of raw CuFeS2 samples (75~150 µm) obtained through three grinding methods: (a) TM; (b) RM; (c) BM. The average length and width of each raw CuFeS2 sample was calculated based on 5 lengths and 5 widths as shown in (a) (the red lines), respectively.
Figure 4.
SEM images of raw CuFeS2 samples (75~150 µm) obtained through three grinding methods: (a) TM; (b) RM; (c) BM. The average length and width of each raw CuFeS2 sample was calculated based on 5 lengths and 5 widths as shown in (a) (the red lines), respectively.
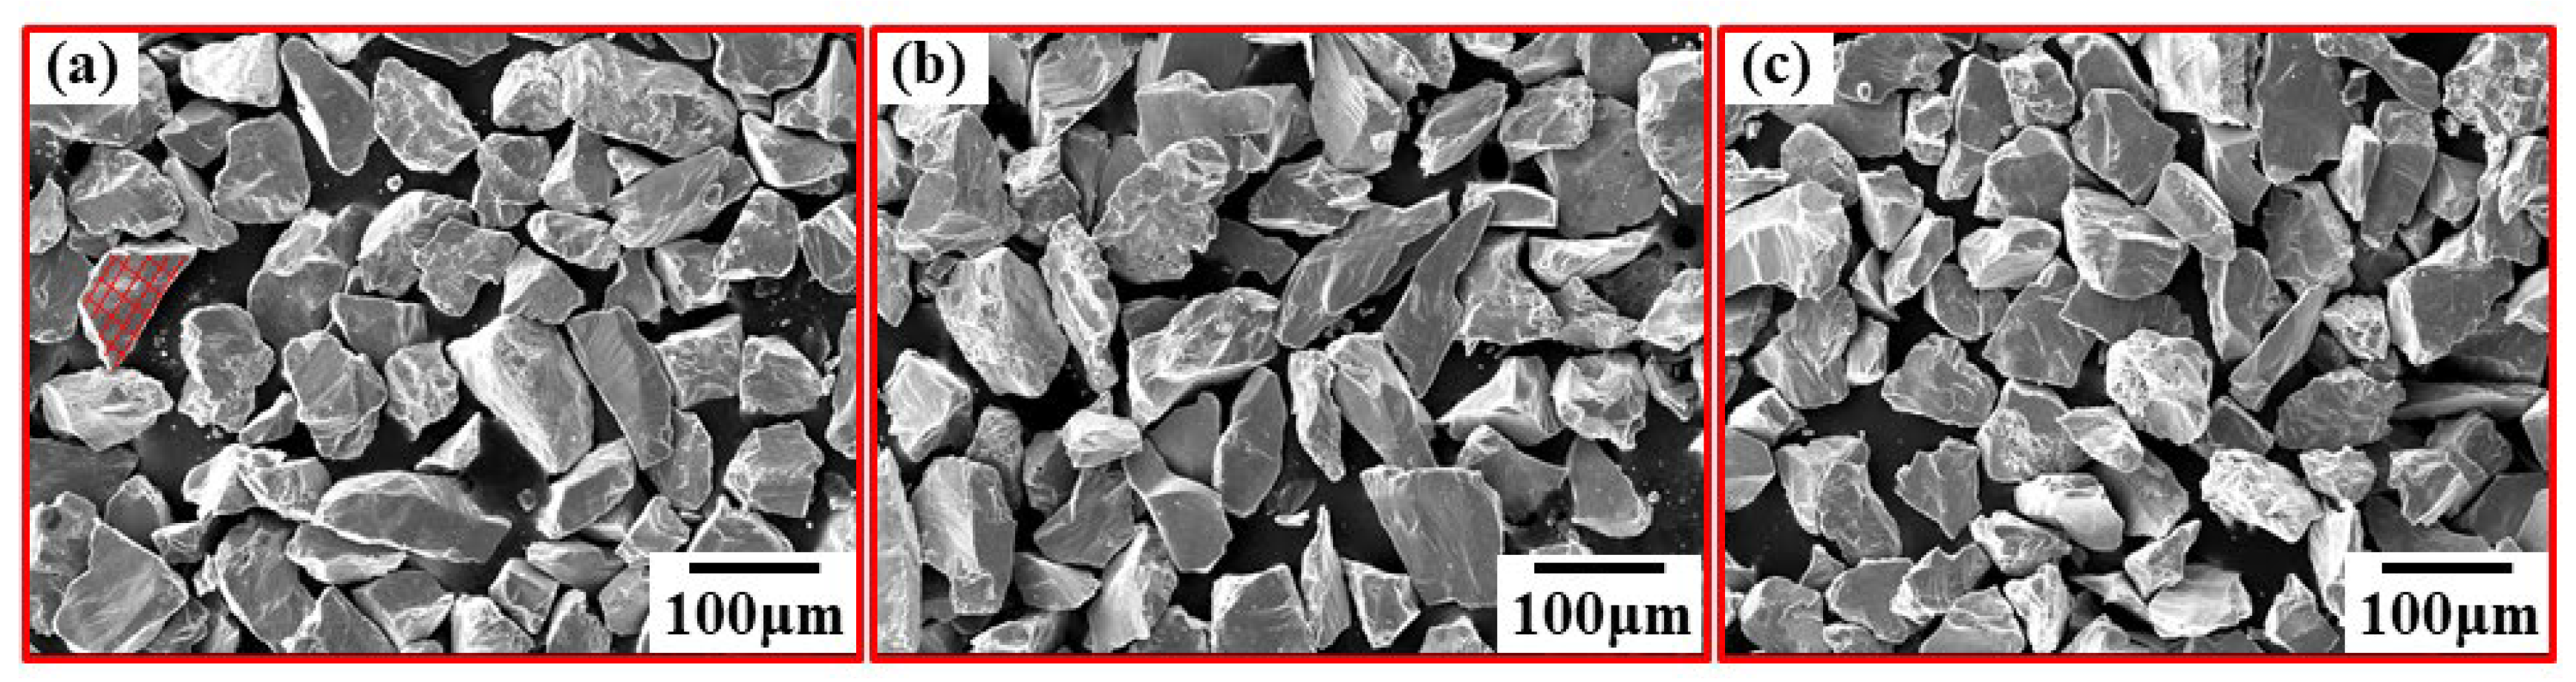
Figure 5.
XPS survey spectra of CuFeS2 treated using BM, RM, and TM.

Figure 6.
S 2p XPS spectra of CuFeS2 treated using the (a) BM, (b) RM, and (c) TM methods.
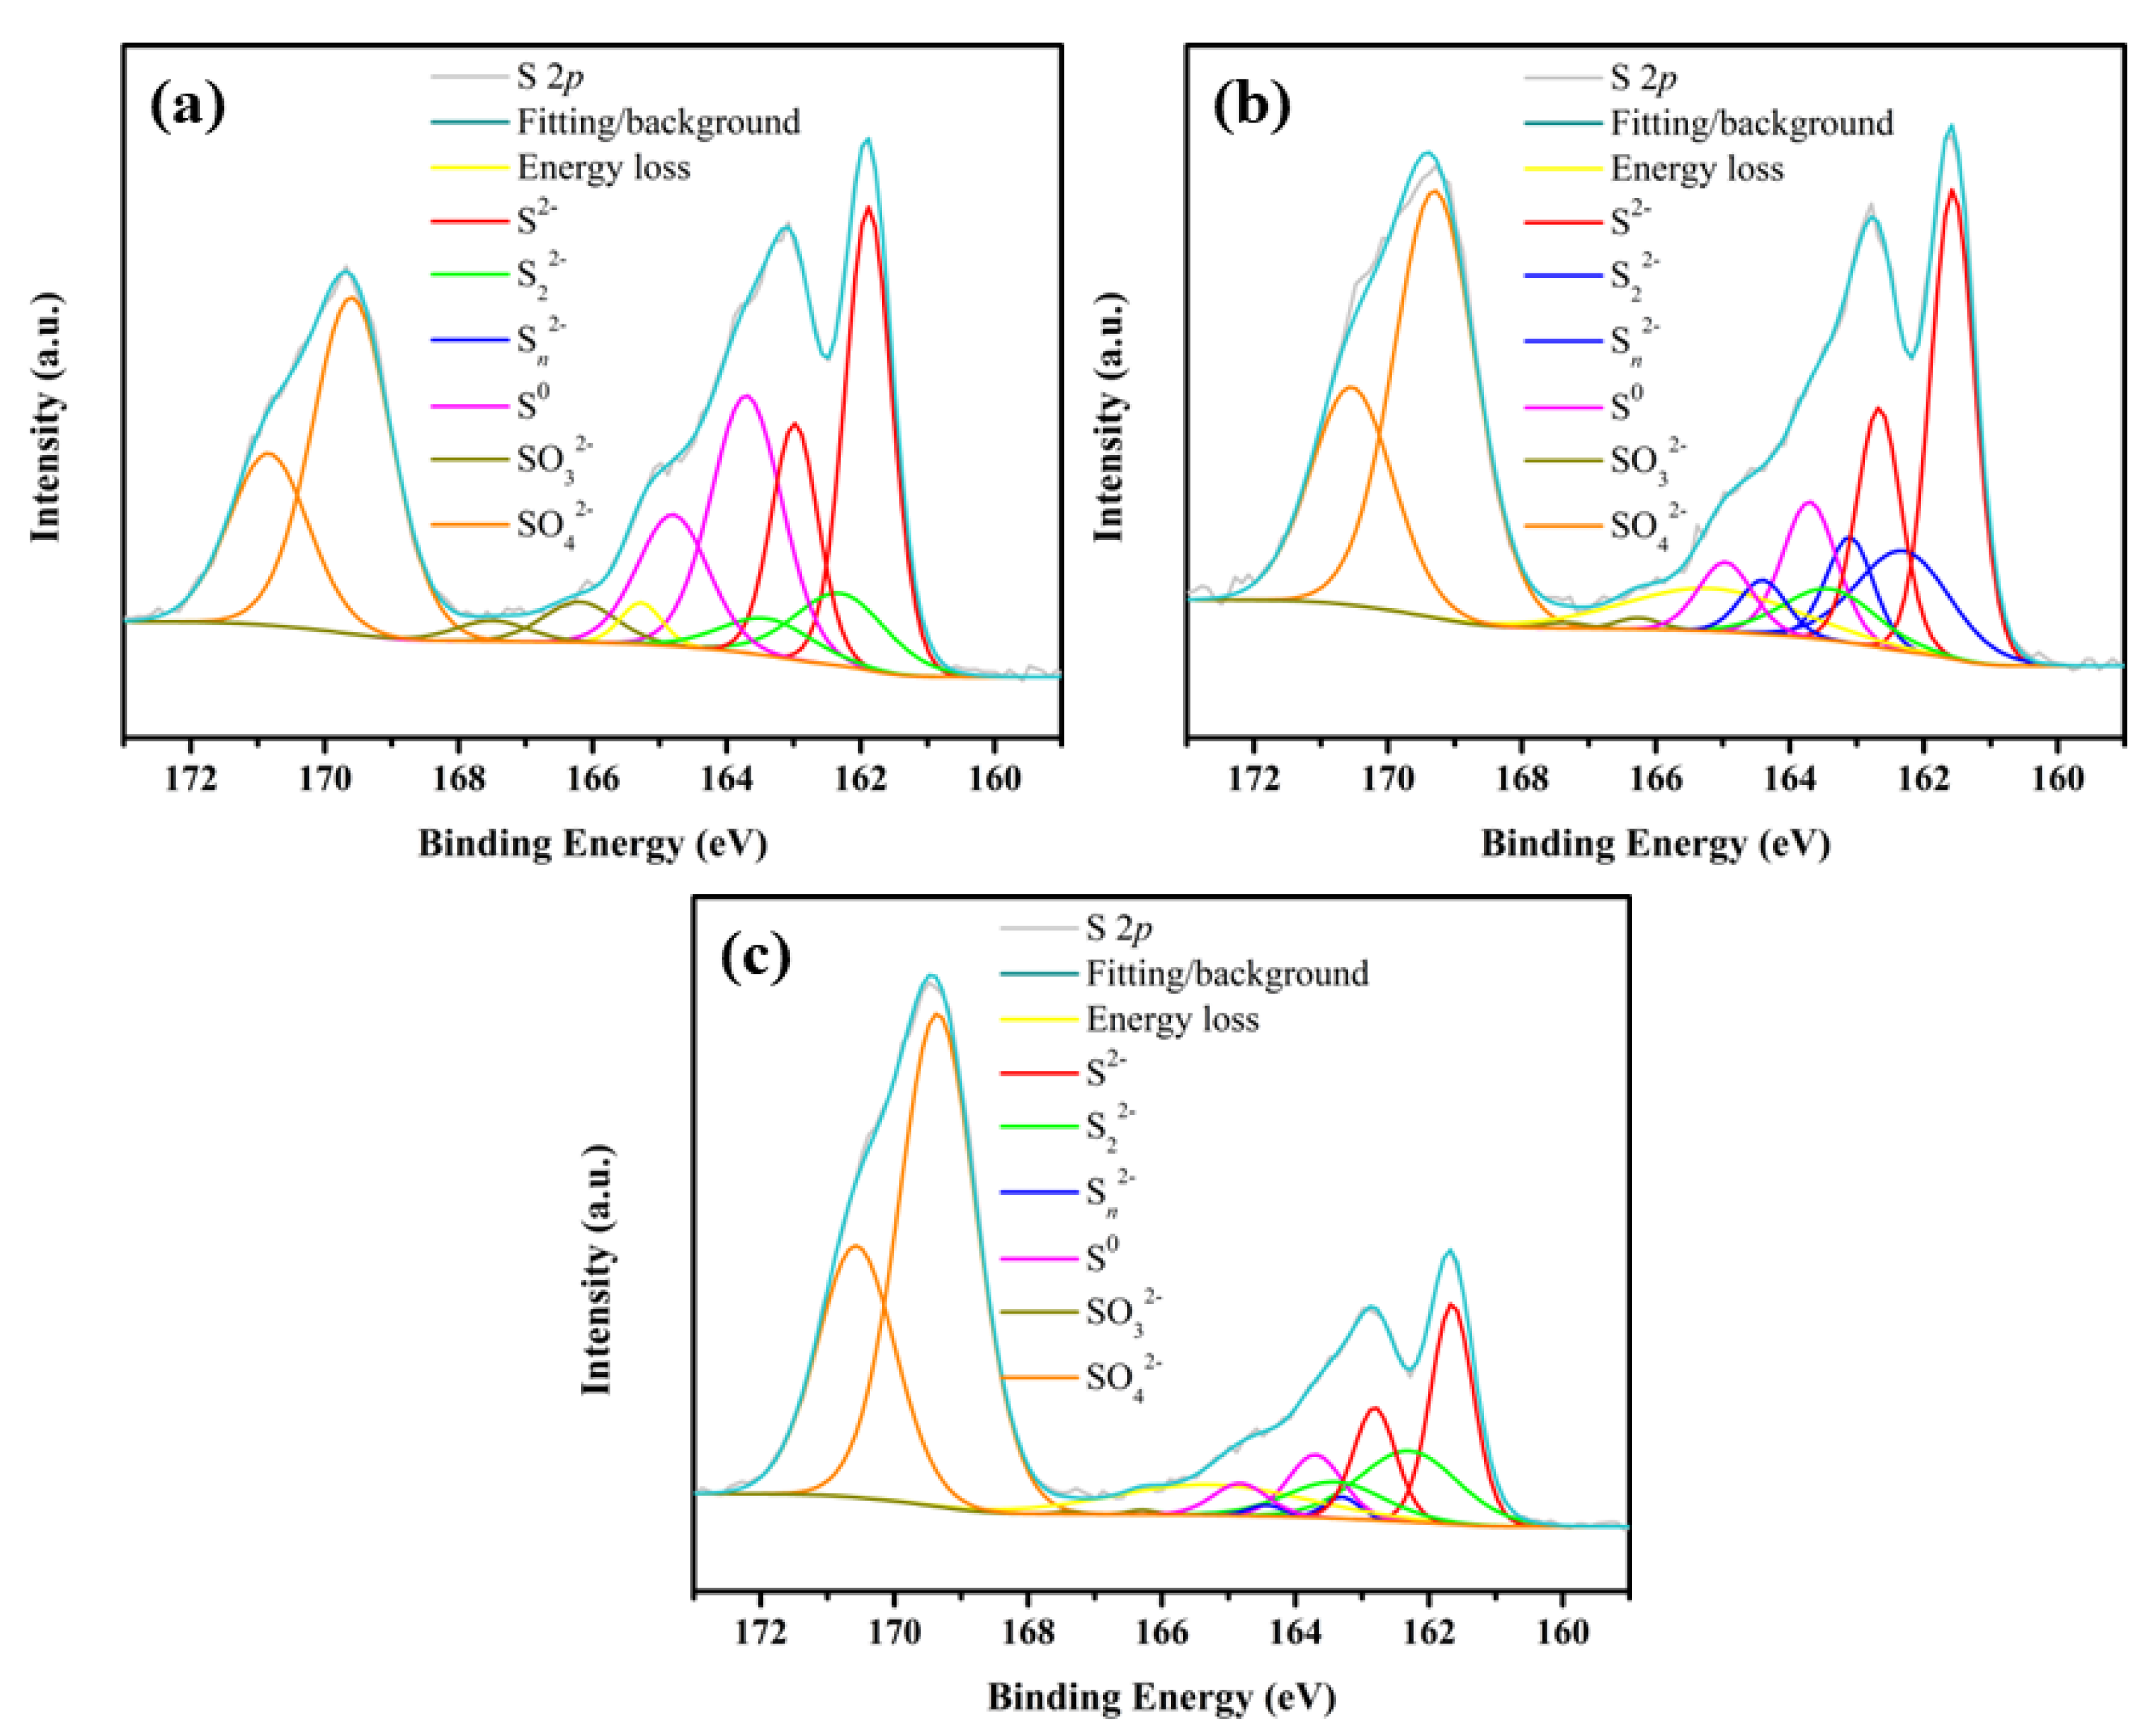
Figure 7.
Layout of the adsorption of O2 at Fe sites on CuFeS2 planes: (a) (112)-M plane; (b) (102) plane; (c) (312)-M plane; (d) (110) plane; (e) (116)-M plane; (f) (100)-M plane; (g) (001)-M plane; distances are in Å.
Figure 7.
Layout of the adsorption of O2 at Fe sites on CuFeS2 planes: (a) (112)-M plane; (b) (102) plane; (c) (312)-M plane; (d) (110) plane; (e) (116)-M plane; (f) (100)-M plane; (g) (001)-M plane; distances are in Å.
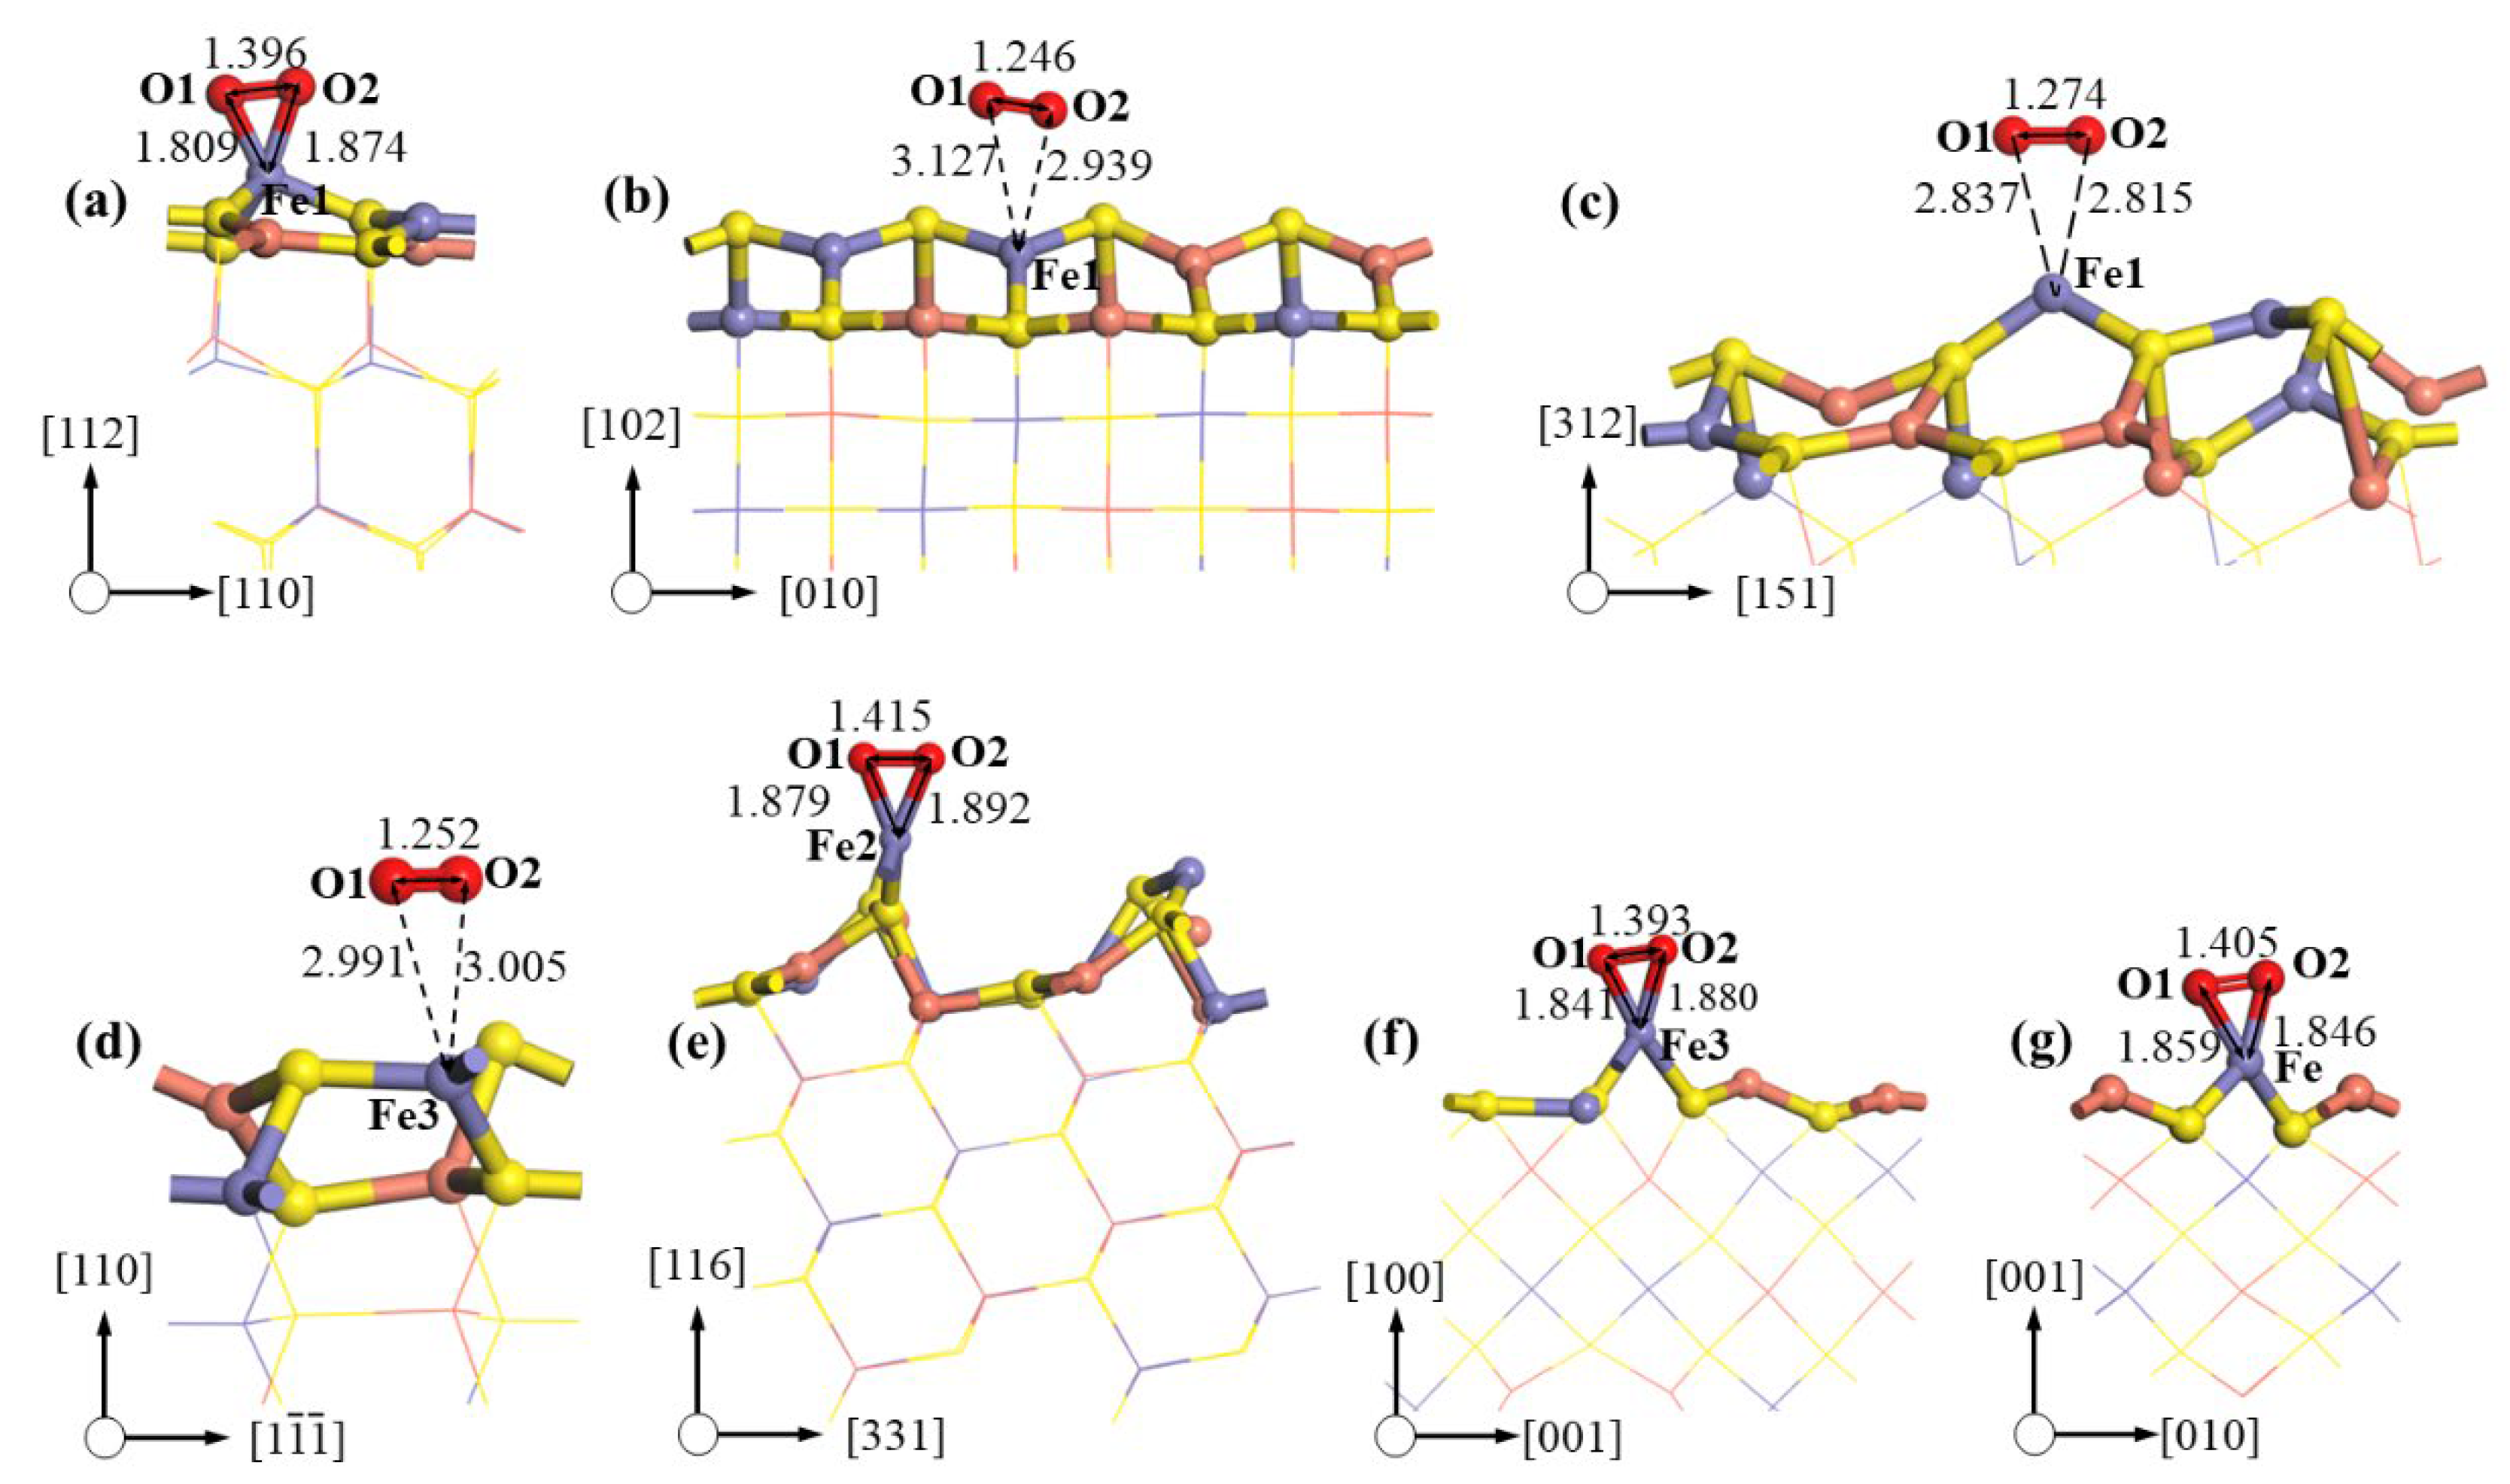
Figure 8.
Adsorption energy per unit area for O2 on CuFeS2 planes: (a) Fe sites; (b) S sites.


Table 1.
Average length, width, and length–width ratio for three raw CuFeS2 samples.
| Grinding Methods | Average Length (μm) | Average Width (μm) | Length–Width Ratio |
|---|---|---|---|
| TM | 127.762 | 71.953 | 1.776 |
| RM | 124.724 | 70.917 | 1.759 |
| BM | 95.234 | 73.276 | 1.299 |
Table 2.
Elemental quantification (at %) of CuFeS2 surface.
| Element | Bonding Energy (eV) | CuFeS2 | ||
|---|---|---|---|---|
| BM | RM | TM | ||
| S 2p | 161.4 | 9.26 | 4.93 | 8.08 |
| O 1s | 532.1 | 43.87 | 53.37 | 70.40 |
| Fe 2p | 710.8 | 8.56 | 9.48 | 4.88 |
| Cu 2p | 932.6 | 38.31 | 32.22 | 16.64 |
Table 3.
S species (at %) on CuFeS2 surfaces treated under different conditions.
| S Species | Bonding Energy (eV) | Full Width at Half-Maximum (eV) | CuFeS2 | ||
|---|---|---|---|---|---|
| BM | RM | TM | |||
| S2− | 161.4 | 0.7–0.8 | 27.98 | 23.01 | 14.87 |
| S22− | 162.2 | 0.7–0.9 | 8.60 | 10.32 | 11.07 |
| Sn2− | 163.2 | 1.1–1.3 | 0 | 5.50 | 1.19 |
| S0 | 163.7 | 1.0–1.2 | 23.57 | 8.12 | 5.44 |
| SO32− | 166.3 | 1.1–1.3 | 3.81 | 0.54 | 0.20 |
| SO42− | 168.8 | 1.5–1.6 | 34.59 | 39.02 | 61.14 |
| Energy loss | 165.1 | 1.4–1.7 | 1.46 | 5.37 | 6.10 |
Table 4.
Area, surface energy, and adsorption energy per unit area of O2 for CuFeS2 planes.
| Planes | Area (nm2) | Surface Energy, Es (J·m−2) | Adsorption Site | Adsorption Energy per Unit Area (kJ·mol−1·nm−2) |
|---|---|---|---|---|
| 112-S | 0.473 | 0.923 a | S1 | −437.384 |
| 112-M | 0.473 | 1.018 a | Fe1 | −1316.631 |
| 102 | 0.774 | 1.128 a | Fe1 | −1372.095 |
| S3 | −470.755 | |||
| 312-M | 1.874 | 1.207 a | Fe1 | −1571.115 |
| 312-S | 1.874 | 1.221 | S2 | −477.523 |
| 110 | 0.408 | 1.332 | Fe3 | −1633.777 |
| S1 | −461.095 | |||
| 116-S | 0.909 | 1.351 | S2 | −527.396 |
| 116-M | 0.909 | 1.494 | Fe2 | −1654.440 |
| 100-S | 0.545 | 1.450 | S3 | −588.869 |
| 100-M | 0.545 | 1.498 | Fe3 | −1858.123 |
| 001-S | 0.274 | 1.495 a | S2 | −690.193 |
| 001-M | 0.274 | 1.566 a | Fe | −2027.415 |
a These data have been published in our previous research [27].
Disclaimer/Publisher’s Note: The statements, opinions and data contained in all publications are solely those of the individual author(s) and contributor(s) and not of MDPI and/or the editor(s). MDPI and/or the editor(s) disclaim responsibility for any injury to people or property resulting from any ideas, methods, instructions or products referred to in the content. |
© 2023 by the authors. Licensee MDPI, Basel, Switzerland. This article is an open access article distributed under the terms and conditions of the Creative Commons Attribution (CC BY) license (https://creativecommons.org/licenses/by/4.0/).
Share and Cite
MDPI and ACS Style
Wei, Z.; Yang, X.; Li, W.; Ma, Q.; Wu, X.; Li, Y. An Improved Understanding of Chalcopyrite Leaching Mechanisms: The Influence of Anisotropic Crystal Planes. Minerals 2023, 13, 1461. https://doi.org/10.3390/min13111461
AMA Style
Wei Z, Yang X, Li W, Ma Q, Wu X, Li Y. An Improved Understanding of Chalcopyrite Leaching Mechanisms: The Influence of Anisotropic Crystal Planes. Minerals. 2023; 13(11):1461. https://doi.org/10.3390/min13111461
Chicago/Turabian StyleWei, Zhenlun, Xu Yang, Wanqing Li, Qiang Ma, Xiaoyong Wu, and Yubiao Li. 2023. "An Improved Understanding of Chalcopyrite Leaching Mechanisms: The Influence of Anisotropic Crystal Planes" Minerals 13, no. 11: 1461. https://doi.org/10.3390/min13111461
Note that from the first issue of 2016, this journal uses article numbers instead of page numbers. See further details here.