
Prediction of Long-Term Geochemical Change in Bentonite Based on the Interpretative THMC Model of the FEBEX In Situ Test

1
Lawrence Berkeley National Laboratory, Berkeley, CA 94720, USA
2
Centro de Investigaciones Energéticas Medioambientales y Tecnológicas, 28040 Madrid, Spain
*
Author to whom correspondence should be addressed.
Minerals 2023, 13(12), 1522; https://doi.org/10.3390/min13121522
Submission received: 16 October 2023
/
Revised: 16 November 2023
/
Accepted: 24 November 2023
/
Published: 5 December 2023
(This article belongs to the Special Issue Implications of THMC Processes on Long-Term Safety of Geological Disposal of Radioactive Waste)
Abstract
:Since nuclear energy is crucial in the decarbonization of the energy supply, one hurdle to remove is the handling of high-level radioactive waste (HLW). Disposal of HLW in a deep geological repository has long been deemed a viable permanent option. In the design of a deep geological repository, compacted bentonite is the most commonly proposed buffer material. Predicting the long-term chemical evolution in bentonite, which is important for the safety assessment of a repository, has been challenging because of the complex coupled processes. Models for large-scale tests and predictions based on such models have been some of the best practices for such purposes. An 18-year-long in situ test with two dismantling events provided a unique set of chemical data that allowed for studying chemical changes in bentonite. In this paper, we first developed coupled thermal, hydrological, mechanical, and chemical (THMC) models to interpret the geochemical data collected in the in situ test and then extended the THMC model to 200 years to make long-term prediction of the geochemical evolution of bentonite. The interpretive coupled THMC model shows that the geochemical profiles were strongly affected by THM processes such as evaporation/condensation, porosity change caused by swelling, permeability change, and the shape of concentration profiles for major cations were largely controlled by transport processes, but concentration levels were regulated by chemical reactions, and the profiles of some species such as pH, bicarbonate, and sulfate were dominated by these reactions. The long-term THMC model showed that heating prolongs the time that bentonite becomes fully saturated in the area close to the heater/canister; however, once the bentonite becomes fully saturated, high concentrations of ions in bentonite near the heater, which was observed in the field test, will disappear; illitization continues for 50 years but will not proceed further.
Keywords:
high-level radioactive waste; repository; bentonite; model; THMC; field test; geochemical; long-term; prediction1. Introduction
Bentonite is the most commonly proposed buffer material for an engineered barrier system (EBS) in a deep geological repository for high-level radioactive waste (HLW). After being emplaced adjacent to heat-generating waste, the bentonite buffer will be simultaneously heated from the waste package and hydrated from the host rock, which results in a series of thermal, hydrological, mechanical, and chemical (THMC) changes that might affect the long-term performance of bentonite buffer. These THMC processes are coupled and evolve temporally and spatially. As the temperature in the buffer increases and then decreases with time, the buffer, which is initially partially saturated, experiences desaturation followed by re-saturation and goes through changes in stress due to swelling and thermal expansion. The thermal and hydrological perturbation in bentonite and the interaction between bentonite and host rocks lead to geochemical changes in bentonite, such as changes in pore-water chemistry and minerals phase, which may affect the long-term stability of bentonite buffer.
The geochemical changes of bentonite in the context of waste disposal have been studied extensively using laboratory experiments, numerical modeling, and field tests. Some of them focus on the alteration of bentonite as a result of heating [1,2,3,4]; some are dedicated to the chemical changes at the interfacial areas such as bentonite/concrete [5,6], bentonite/canister [7,8,9,10] and bentonite/host rocks [11]; or more comprehensive analysis of the geochemical changes at near field [12]. Because the life span of a repository is much longer than any test can run, numerical models, particularly reactive transport models, have been used to predict the long-term alteration of bentonite [13,14]. These models ideally should be built upon an accurate representation of all relevant processes and formulated with parameters that are either calibrated at the scale close to the repository or measured reliably at conditions relevant to the repository, which, however, is proven to be very difficult because of (1) the incapability of numerical models to capture all the relevant processes, (2) the inaccuracy of measuring those parameters by current experiment, and (3) the mismatch between what models need and what experiments can measure. Over time, researchers keep expanding the modeling capability, for instance, expanding THC [15] to THMC [16], including electrostatic potential in the reactive transport model [17], and improving experimental capability such as studying ion exchange selectivity at nano-scale using the high-resolution transmission electron microscopy at cryogenic conditions (cryo-TEM) [18]. Before we synergize all the latest modeling capabilities with a thorough understanding of the key processes and parameters that can be reliably measured, model prediction based on the large-scale field test is probably still the best practice so far to predict the long-term evolution of bentonite buffer. One such practice is the models for the FEBEX (Full-scale Engineered Barrier EXperiment in crystalline host rock) in situ test. The test had run for 18 years with two dismantling events providing a unique set of chemical data that allows for studying chemical changes in bentonite. Throughout the in situ test, models have been developed for different stages and aspects of the test: THM modeling analysis [19,20] for the entire time span of the in situ test; THC model [15] for the data collected after the first dismantling event, reactive transport model for the intermediate time [21], and THMC model for the prediction of the geochemical changes at the second dismantling [22], reactive transport model just for concrete/bentonite interaction [13] and bentonite/canister interaction [23]. Modeling the geochemical changes for long-term, large-scale tests like the FEBEX in situ test has been challenging. First, chemical data were often obtained via an indirect method [24] and had to be “re-calibrated” before they were compared with the model. Such re-calibration introduced undesirable uncertainties and ambiguity. Second, geochemical changes are strongly affected by coupled THM processes [16], and simplification in terms of the coupled process might compromise the accuracy and reliability of the model. This paper first provides a “re-calibration” of the geochemical data collected after the second dismantling, then a THMC model that can reasonably interpret the chemical changes in the FEBEX in situ test, and finally, a long-term (200 years) predictions of the evolution of bentonite-based on the extension of the THMC model for the in situ test to answer some questions about the long term performance of bentonite buffer.
2. FEBEX In Situ Test
FEBEX is a research and demonstration project that lasted 18 years and has been reported in numerous technical reports [25,26] and papers [22]. The key experiment of the FEBEX is the in situ test at the Grimsel test site in Switzerland, which has been simulated by several models [13,19,20,22,27,28]. Here, in the following sections, we briefly describe the configuration, key dates, and available data to facilitate the presentation of model results. The test comprised five fundamental elements: the drift, the heating system, the bentonite barrier, the instrumentation, and the monitoring and control system. Two heaters, Heater #1 and Heater #2, are positioned one meter apart to simulate full-sized canisters. These heaters are enclosed within a cylindrical steel liner, measuring 4.54 m in length and having a diameter of 0.9 m with a wall thickness of 0.1 m. The heaters were maintained at 100 °C at the interface between the steel liner and bentonite 61 days after the heating commenced.
The bentonite barrier consisted of blocks of densely compacted bentonite with an average initial dry density of 1.7 g/cm3 and a water content of 14.4%.
The in situ test commenced on 27 February 1997. Heater #1 was dismantled from May to September 2002. To avoid too much disturbance of the non-dismantled area, the bentonite blocks and all components were removed up to a distance of 2 m from Heater #2. To fill the space left by the removal of Heater #1, a 1-m-long dummy steel cylinder was inserted at the buffer’s center. An extensive post-mortem bentonite sampling and analysis work was conducted on the solid and liquid phases to study the physical and chemical changes resulting from the effect of hydration and heating, and the data were used to evaluate the THM and THC model predictions [26].
Following the removal of Heater #1, the tunnel was sealed with shotcrete, and Heater #2 was kept operating under regular conditions (Figure 1). Heater #2 was turned off on 24 April 2015. After a brief cooling period, the dismantling process progressed incrementally from the shotcrete side toward the bentonite section (Figure 1). During this dismantling process, samples were collected for THMC (Thermo–Hydro–Mechanical–Chemical) analysis and microbiological characterization.
The dismantling of sections around Heater #1 in 2002 and Heater #2 in 2015 (Table 1) yielded two sets of measurements for water content, dry density, and ion concentrations in the pore-water of the bentonite. These snapshots offer valuable insights into the temporal changes in bentonite. The THM (Thermo–Hydro–Mechanical) data, along with the associated THM model, were previously presented by Zheng et al. [28]. However, in this paper, our primary focus is on the chemical data and the corresponding chemical model.
3. Chemical Data for Bentonite
3.1. Ion Concentrations in Pore-Water
Bentonite samples were taken after dismantling Heater #1 in 2002 and Heater #2 in 2015, and ion concentrations of bentonite in pore-water were measured. They provided spatial distribution of ion concentrations at two time points, which are very valuable to constrain the chemical model and understand the geochemical evolution of bentonite in the test. The chemical results from the THMC model are primarily tested against ion concentration data.
Bentonite samples obtained post-dismantling were carefully preserved, and the concentration of pore-water was determined using two distinct methods: squeezing tests and aqueous extract tests (AET). In the squeezing process, interstitial fluid is expelled from the saturated bentonite as it is compressed. The volume of water extracted in squeezing experiments depends on various factors, including the water content of the rock sample, the inherent properties of the rock (e.g., dry density, the proportions of easily squeezed clays, and more resistant materials like quartz and calcite), and the experimental conditions, such as the applied pressure, the duration of squeezing, and the size of the squeezing cell, as discussed by Fernández et al. [32].
In this study, following the dismantling of Heater #2, Fernández et al. [33] conducted squeezing tests on three samples from section 36, three from section 47, and five from section 59. However, since our model exclusively represents the “hot” sections (those around the middle of the heater), we have used solely the data obtained from section 47 to compare with the model in this paper.
Aqueous extract tests (AET) were conducted on samples from sections 19, 28, and 29 after the removal of Heater #1, and these results were inferred using an inverse modeling procedure as described by Zheng et al. [24]. Following the dismantling of Heater #2, Fernández et al. [33] carried out 1:4 AET on 154 samples. Among these, 36 samples were collected from section 47 and another 36 from section 53. The AET procedure is illustrated in Figure 2.
It is important to note that the concentrations of ions (referred to as Caq in Figure 2) measured in AET do not directly represent the pore-water concentration. In addition to dilution, chemical reactions take place, necessitating geochemical modeling to reconstruct the ion concentrations in the original pore-water (Cpore). These original concentrations correspond to samples with initial water content (θi). As a result, a geochemical model was developed to reverse the AET process. In this model, a water and bentonite system with known water content (θf) and concentration (Caq) undergoes a kind of “evaporation” process (i.e., removing pure water) and eventually reaches the original water content (θi) and Cpore values. The chemical model considers the same chemical reactions as in the THMC model (Section 4.3) and simulates the reversal process of AET. The model starts with known water content (θf) and concentration (Caq) and remains at the same water content for 2 days (assimilating the 2-day mixing in AET), and then pure water is removed until the water content decreases to θi. Cpore is the result of chemical reactions and changes in water content over the course of this reversed AET process. These reconstructed values are then compared with results from THMC models in the subsequent section of the study.
Inferred concentration data from aqueous extract tests for samples collected at sections 29, 28, and 19 [34] at 5.3 years and inferred concentration data from the aqueous extract test for sections 47 and 53 at 18.3 years are employed in this paper to compare with the results from the THMC model. Concentration data from the squeezing test for section 47 at 18.3 years are also included for comparison.
3.2. Geochemical Data in Solid Phase
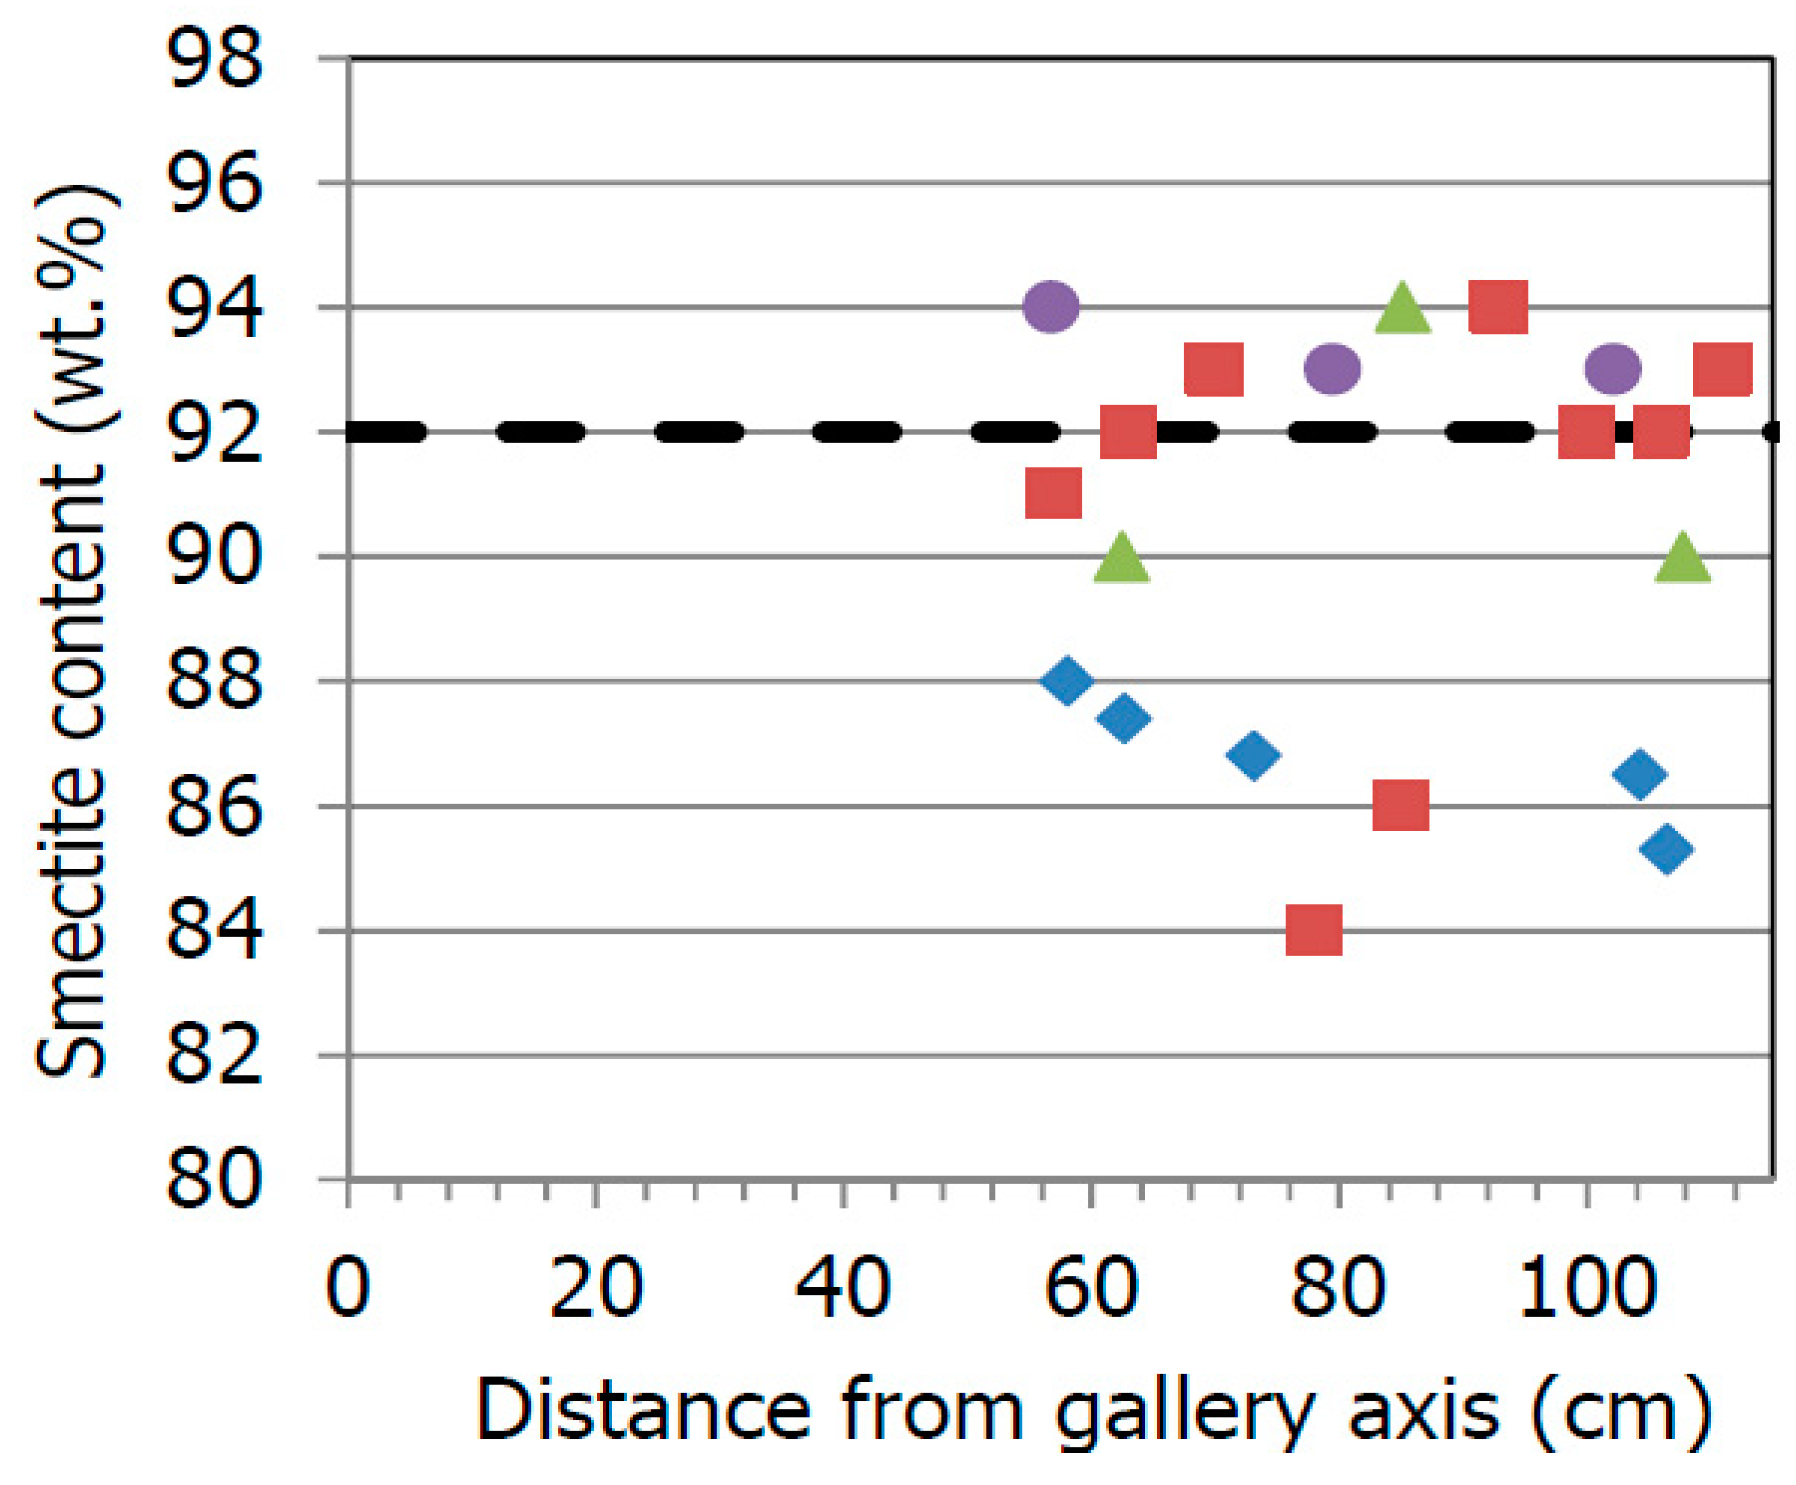
Mineralogical and geochemical characterization were conducted for samples in several sections. Among them, S42–S53 surrounds the heater and is located in the “hot” section. Characterization results are documented in Villar et al. [35]. Smectite phases and the illite/smectite mixed layers in ground bulk materials were analyzed by X-ray diffraction (XRD). The smectite content ranges from 82–96%, depending on the sample and laboratory. Because of the large variation of measured illite fraction in the illite/smectite mixed layer between samples, it is unclear if there is any increase or decrease in illite mass fraction compared with the reference bentonite. The crystal thickness of the smectite particles fell within the range of 7.65 to 10.31 nanometers, with the number of total layers (TOT) in the quasi-crystals being consistently between 5 and 6. This observation aligns with previous analyses of the reference FEBEX bentonite [26,32]. These findings collectively suggest that no structural alterations occurred in the montmorillonite during the experiment.
Minerals present in the bulk materials, aside from illite/smectite, were quantified using XRD and Scanning Electron Microscopy (SEM). Minerals consistently observed in all the samples included K-feldspars, quartz, cristobalite, calcite, and plagioclase. These minerals were present in proportions less than 5%. The total inorganic carbon (TIC) content in the bulk material, specifically in fractions larger than 2 μm, corresponds to an average calcite content of approximately 0.9%. This finding is consistent with the calcite content determined for the reference bentonite based on XRD analysis.
Regarding cation exchange capacity (CEC), the first impression is that data vary a great deal depending on the measuring method, ranging from 88 meq/100 g to 108 meq/100 g [35]. Second, there is no clear spatial trend no matter what method was employed. The biggest potential problem with CEC is that soluble cations were not separated from the exchangeable cations. Therefore, we do not use CEC data to constrain our model.
3.3. Chemical Data for Granite Pore-Water
Groundwater geochemistry was measured for the in situ test to study the solute transport from bentonite to granite. Two boreholes for hydro–geochemical investigation (FU-1, FU-2) were drilled at the end of 2005 in the FEBEX drift (Figure 3) to carry out in situ studies of the geochemical processes related to the migration of solutes in crystalline rocks [36]. FU-1 (17.8 m long) is parallel to the axis of the drift and relatively close to the bentonite interface (20 cm). FU-2 is 17.6 m long and presents a vertical deviation (2°) in relation to the axis of the gallery and 1° parallel to the gallery. It lies approximately 60 cm away from the bentonite interface [36]. The FU-1 and FU-2 boreholes were separated into several intervals. A total of 157 water samples were collected from FU-1 and FU-2 from 2006 to 2016. Data for the sample collected from intervals FU1-3 and FU2-2 are relevant to the models in this paper and, therefore, used in comparison with model results. Because most ions in pore-water in bentonite have higher concentrations than those of the pore-water of granite, diffusion from bentonite to granite is expected to increase the ion concentrations in granite.
4. Model Development
TOUGHREACT-FLAC3D is used to conduct all the simulations. The code sequentially couples the multiphase fluid flow and reactive transport simulator, using TOUGHREACT V3 [37], with the geomechanical code FLAC3D [38].
4.1. Modeling Setup
Due to the symmetrical nature of bentonite hydration, we have employed an axi-symmetrical mesh, as depicted in Figure 4. This approach allows us to optimize computational efficiency and direct our attention to the critical coupling processes. It is important to note that this modeling approach is suitable for interpreting and predicting THMC behavior exclusively in the “hot sections,” which refers to the sections of the bentonite block that surrounds the heater. Typically, this includes sections 41 to 54, with section 49 being the most representative, as indicated in Figure 1.
The model encompasses two distinct material zones: one representing the bentonite and the other corresponding to the granite. The two nodes positioned within the radial range of 0.45 to 0.46 m are used to represent the external surface of the heater. The bentonite zone extends from 0.45 m to 1.135 m in radial distance. The remainder of the computational domain, extending up to 50 m, simulates the properties of granite.
The simulation began on 27 February 1997 and continued until 1 July 2015, spanning a total of 6698 days or approximately 18.3 years.
4.2. THM Model
The model in this paper is built upon the THMC model reported by Zheng et al. [28] by adding a full chemical model. Details of the model setup, including mesh, THM initial and boundary conditions, THM processes, and parameters, are referred to Zheng et al. [28]. The chemical model will be discussed in the following sections. A brief description of the THM model is as follows for the convenience of understanding the THMC model.
The thermal model considers conductive and convective heat flux; the hydrological model is a two-phase (air and water) flow described with a multiphase version of Darcy’s Law. Vapor flow in the air phase is controlled by both advection and diffusion, and dispersion according to Fick’s law; the mechanical model is described by the typical momentum balance equation, and a state–surface approach is used for the constitutive relationship between void ratio, net stress, and suction. Regarding coupled processes, the THM model includes some obvious and important couplings such as TC (the temperature-dependent chemical reactions), HC (the effect of hydrological properties on chemical reactions), TM (the temperature-dependent mechanical deformation), and HM (the effect of fluid pressure on mechanical deformation and stress) couplings, but paid special attention to TH coupling, including thermal osmosis and saturation-dependent thermal conductivity and HM coupling via density-dependent permeability.
The initial temperature is 12 °C, and a constant temperature of 100 °C was prescribed at the heater/bentonite interface while the temperature at the external boundary remains at its initial value of 12 °C (r = 50 m). A non-flow boundary condition is given at the heater, whereas a liquid pressure of 0.7 MPa is set at r = 50 m. Initial total stress was 0.15 MPa in bentonite and 0.15 MPa to 11.5 MPa in granite, depending on the radial distance. Zero normal displacement was prescribed at r = 0.47 m and 50 m.
4.3. Chemical Model
Initial chemical conditions, such as the initial mineralogical and pore-water compositions in bentonite and granite, are key parts of the chemical model. During the operation of the FEBEX in situ test, extensive mineralogical characterization was conducted [25,32,39]. After the final dismantling of the FEBEX in situ test, the characterization of mineral phases was conducted [35]. In this paper, the mineral phases and their mass fraction (Table 2) were decided according to [25,32,35,39]. Trace amounts of zircon, monazite, biotite, muscovite, ilmenite, and apatite have been reported in Villar et al. [35], but zircon, monazite and apatite not included in the model because there is no water chemistry data for Zr, Ce and phosphate; biotite, muscovite and ilmenite are trace rock-forming minerals and unlikely have tangible interactions with the aqueous phase and therefore are not considered in the model. Minerals that exhibit zero initial mass fractions are secondary minerals that could potentially form during the experiment.
The detailed mineralogical composition of the Grimsel granite is provided in Garralon et al. [40]. Notably, earlier THC models for the in situ test, such as those by Samper et al. [15] and Zheng et al. [34], consider only quartz in the mineral phases of granite. However, Siitari–Kauppi et al. [41] reported that Grimsel granite consists of K-feldspar, plagioclase, quartz, and a small amount of “dark material”. In the current model, we take into account quartz, K-feldspar, and plagioclase in the granite, with their respective mass fractions as specified in Table 2.
The FEBEX bentonite blocks initially contained a gravimetric water content ranging from 13.5% to 14% [25]. The model described in this paper relies on the pore-water composition data (refer to Table 3) that was deduced by Fernández et al. [32] based on aqueous extract data. As for the pore-water composition in granite (Table 3), this information is sourced from Zheng et al. [34].
In the chemical model, we consider aqueous complexation, cation exchange, surface complexation, and mineral dissolution/precipitation. The disassociation constants for aqueous complexes, which are presented in reactions involving primary species, are provided in Appendix A. These thermodynamic data have been sourced from Data0.dat.YMPv4.0, a database associated with EQ3/6 [42] and certified by the U.S. Department of Energy for the Yucca Mountain project.
Cation exchange reactions are calculated using the selectivity coefficient listed in Table A2 with a Cation Exchange Capacity (CEC) of 98 meq/100 g. Surface complexation reactions are calculated with the reactions in Table A3 using the site density of for strong sites and for weak sites [43] and a surface area of 10 m2/g.
The computation of mineral dissolution/precipitation requires equilibrium constants for the precipitation/dissolution of primary (those initially present) and secondary minerals (Table A4). It is worth noting that mineral dissolution/precipitation processes are kinetically controlled, and the kinetic law governing these reactions can be found in Xu et al. [37]. The kinetic rates and surface areas for the minerals considered in the model have been derived from the work of Zheng et al. [44].
5. Model Results
The primary objective of employing a coupled THMC model to interpret the data collected during the FEBEX in situ test is to gain a comprehensive understanding of the THMC evolution of bentonite. This understanding allows us to identify the most relevant processes and parameters that are needed to accurately describe the behavior of bentonite. After the coupled THMC model can effectively replicate various measured parameters such as temperature, water content, relative humidity, stress, aqueous concentrations, and mineral phase changes, it can then be extended for use in predicting the long-term behavior of bentonite under different conditions. For example, it can be used to predict how bentonite behaves at higher temperatures [44] or for a longer term, as attempted in this paper.
5.1. THM Evolution in the Test
Zheng et al. [28] presented the details of THM evolution and the performance of the model; a concise description is given here to facilitate the understanding of geochemical evolution. After the heater reached 100 °C, the temperature profile was quickly stabilized, with a temperature of 45 °C at the bentonite–granite boundary, as shown by the temperature data obtained by sensors located at different radial distances. Temporal evolution of relative humidity measured at several radial distances and spatial distribution of water content after two dismantling events are the major hydrological data, which shows strong desaturation at the area close to the heater in the early time, but saturation dominates later in the bentonite barrier. However, full saturation was not reached for the entire barrier after the final dismantling −80% water saturation at the area close to the heater. Throughout the test, normal stress kept increasing, as shown by sensors at different locations. The model took most parameters measured by laboratory tests but calibrated initial thermal and osmotic permeability, parameters for the state surface approach, and a reasonable match between the THM model and data was achieved [28].
5.2. Geochemical Evolution in the Test
As presented in Section 3, two types of geochemical data are available for the FEBEX in situ test: ion concentration in the pore-water of bentonite and granite, compositions of solid phase including minerals phases, and exchangeable cations. While both types of data help us understand the geochemical evolution in the in situ test, model interpretation has to focus heavily on the ion concentration in the pore-water of bentonite and granite. The solid phases underwent relatively small changes, and their spatial and temporal evolution are overshadowed by the measurement variation. For example, the measured mass fraction of smectite ranges from 85% to 96%, depending on the laboratory and sample; such variation is much larger than expected the change in smectite mass fraction and has no clear spatial trend, and therefore the measured mass fractions of smectite are of little use for constraining the model. Some geochemical data, such as the content of calcium in solid phases, shows clear trends and can be used to qualitatively constrain the model because such data are not comparable to the model results unless additional information, e.g., for this case, a complete list of mass fraction of all minerals, is known. In this section, we primarily compare the model and data for ion concentrations in pore-water of bentonite to guide the discussion, with data from solid phases providing supplementary information. However, attention is called that the ion concentrations in pore-water of bentonite are measured through an indirect method, aqueous extract, and geochemical modeling was conducted to infer the “true” ion concentration in pore-water from aqueous extract data, thus adding another layer of uncertainties to understand the chemical evolution in bentonite.
The geochemical evolution results from the interplay of coupled THMC processes. Among these processes, THM processes exert a strong influence on the geochemical evolution, but typically, the reverse relationship is not as significant. Therefore, once the THM processes have been effectively established, as demonstrated in the work by Zheng et al. [28], the study of potential chemical reactions becomes the next focus.
However, before delving into the investigation of chemical reactions, it is crucial to constrain the transport processes. While the advection of chemical species is defined and accounted for in the THM model, diffusion must be calibrated in the chemical model to accurately represent the movement of chemical species in the system.
Chloride concentration serves as a valuable indicator of transport processes because it is solely controlled by these processes. The effective diffusion coefficient for chloride, which has been calibrated, is calculated as where is porosity and S is water saturation. Depending on time and location, the effective diffusion coefficient ranges from 8 × 10⁻¹⁴ m2/s to 1.4 × 10⁻¹² m2/s, with an effective diffusion coefficient for most time and locations around 0.4–1.4 × 10⁻¹² m2/s. As shown in Figure 5, the THMC model shows a good agreement with the data near the heater, suggesting that chloride concentration can be relatively high at the interface between the canister and bentonite. If this trend remains over an extended duration until the canister corrodes completely, the elevated chloride concentration may have a significant impact on waste degradation. As the granite pore-water with lower chloride concentration infiltrates into the bentonite, it leads to significant dilution of the bentonite pore-water, especially evident in the very low chloride concentration near the granite (within a radial distance between 0.8 and 1.1 m). Conversely, bentonite pore-water is pushed closer to the heater, and evaporation contributes to increased chloride concentrations, as indicated by the higher chloride levels near the heater.
Another mass exchange process between bentonite and granite is the diffusion of Cl from the bentonite to the granite, which leads to higher Cl concentration in granite pore-water. Granite pore-water samples were collected in two tunnels, 0.2 and 0.6, away from the tunnel wall (bentonite–granite interface), respectively. We therefore check the comparison of model results and data (Figure 6). A reasonable fit was achieved, which supports the parameterization of the transport process in bentonite.
The spatial profile of measured sulfate data (Figure 5) is very different from that of chloride, indicating that chemical reactions play a significant role in shaping the spatial and temporal evolution of sulfate in addition to transport processes. The final calibrated effective diffusion coefficient for sulfate is the same as Cl−, ranging from 8 × 10⁻¹⁴ m2/s to 1.4 × 10⁻¹² m2/s, and at most times and locations, the effective diffusion coefficient is around 0.4–1.4 × 10⁻¹² m2/s. A nice match between model results and sulfate concentration measured at the two tunnels in granite (Figure 6) seems to support the calibrated effective diffusion coefficient for sulfate. However, the model and data for the spatial profiles in bentonite faced a great challenge in matching each other for both small-scale heating and hydration tests [16] or the in situ test after dismantling of Heater #1 [34]. The challenge lies in (1) the data is not directly measured but rather inferred from aqueous extract (see Section 3) using a geochemical model in which the initial amount of gypsum is critical and (2) initially FEBEX bentonite [25] contains small amount of gypsum, whether the bentonite samples contains gypsum or how much when bentonite sample were collected after dismantling is highly uncertain because of spatial heterogeneity. The current model assumes that initially, there is a 0.3% mass fraction of gypsum. Once the heating starts, gypsum dissolves, and anhydrite (CaSO4·2H2O), which has lower solubility than gypsum at temperatures higher than 43 °C, is formed (Figure 7). As granite pore-water infiltrates into the bentonite, anhydrite dissolves, which raises the concentration of sulfate. After more granite pore-water flows into the bentonite, sulfate concentration decreases due to dilution, and concentration at the area near the granite where more dilution occurs is even lower. Meanwhile, evaporation near the heater leads to higher sulfate concentration and more precipitation of anhydrite therein (Figure 7). The simulated concentration profiles at 5.3 and 18.3 years reflect the effect of these processes. The model results match the inferred data decently at 5.3 years but not at 18.3 years (Figure 5). Another possibility is that pyrite oxidation occurs at the early stage of the in situ test, and sulfate reduction takes place when the bentonite becomes more reducing at the latter stage of the test. However, Fernández et al. [33] showed a fairly high dissolved O2 in the initial pore-water of bentonite, 0.2 mmol/L, which makes the water highly under-saturated with respect to pyrite and essentially rules out the possibility of the existence of pyrite. Moreover, if pyrite is initially present, it will be quickly oxidized and would lead to a high Fe concentration in the bentonite pore-water, which has not been observed in the FEBEX in situ test. However, as we are synthesizing the measured pore-water concentration, gas, biological, and mineralogical data, other possibilities could exist for better interpretation of the sulfate data. The precipitation of anhydrite is consistent with the high sulfur content in some samples.
Previous modeling efforts, such as those by Zheng et al. [34], have revealed that the pH in the system is effectively buffered by surface protonation and remains relatively stable at its initial level. As depicted in Figure 5, over the course of 5.3 years to 18.3 years, pH exhibits minimal changes in most areas. The spatial distribution of pH is also generally uniform, with exceptions occurring in regions close to the granite and the heater. The increase in pH in the bentonite pore-water near the vicinity of the heater is primarily attributed to the dissolution of montmorillonite, as illustrated in Figure 7. The current model confirms that surface protonation buffers pH. In the in situ test, granite water has a pH just slightly higher than bentonite pore-water, and surface protonation seems to be able to maintain pH at a stable level in most areas. The model also indicates that the pH buffer by surface protonation is limited—when there is significant mineral dissolution or precipitation, the pH could go up or down significantly. It remains to be seen whether surface protonation can maintain a stable pH in bentonite when it is in contact with concrete, whose pore-water is highly alkaline.
Bicarbonate concentration data were very challenging to match by models because of the uncertainties in both the CO2 gas evolution in the bentonite barrier in the in situ test and the inference of bicarbonate concentration data from aqueous extract experiment to measure the pore-water concentration, which shows a roughly decreasing trend from granite towards the heater (Figure 5). The current model, which accounts for the evolution of CO2 gas and carbonate minerals, has the same trend except for the area near the heater. Even though organic reactions, i.e., bacteria-mediated reactions, are considered, the model results might not be very different.
The sodium concentration within the bentonite barrier is subject to transport processes similar to those governing chloride concentration profiles in the bentonite. This results in higher sodium concentrations near the heater and lower concentrations near the granite, as depicted in Figure 8. However, chemical reactions, particularly cation exchange, play a mitigating role in these concentration changes. As a result, the sodium concentration is not as low as that of chloride near the granite and not as high as that of chloride near the heater. The final calibrated effective diffusion coefficient for sodium is the , ranging from 1.2 × 10⁻¹³ m2/s to 2.1 × 10⁻¹² m2/s, and at most times and locations the effective diffusion coefficient is around 0.6–2.1 × 10⁻¹² m2/s. Model results and sodium concentration data in granite show a similar trend (Figure 6), which weakly confirms that the mass exchange between bentonite and granite calculated by the model is roughly in the ballpark and provides supplementary support for the parameters for sodium transport. Exchangeable sodium data are not used here because they are unreliable. No sodium-bearing mineral precipitates in the current model. Further investigation of both model and data is needed.
Accurate predictions of the evolution of potassium concentration are of great importance because potassium plays a critical role in the illitization process, which is a major concern for the bentonite barrier. The in situ test, the longest field test, offers a valuable opportunity to gain insights into the evolution of potassium concentration. The current THMC model reasonably replicates the concentration data at 5.3 years and 18.3 years, as shown in Figure 8. Modeling efforts indicate that, in addition to the transport processes, cation exchange is the most influential reaction governing the temporal and spatial distribution of potassium. However, it is worth noting that this conclusion cannot be definitively confirmed by the measured exchange of potassium because the available data is considered unreliable. The final calibrated effective diffusion coefficient for potassium is the , ranging from 1.2 × 10⁻¹³ m2/s to 2.1 × 10⁻¹² m2/s, and at most times and locations the effective diffusion coefficient is around 0.6–2.1 × 10⁻¹² m2/s.
The evolution of calcium in bentonite is significant for the performance of the bentonite barrier due to its influence on several key aspects. This includes its impact on pH through the dissolution and precipitation of carbonate minerals like calcite and dolomite, as well as its complexation with uranium. Additionally, calcium can affect redox conditions by influencing gypsum dissolution and sulfate reduction. The current model performs well in matching the calcium data at 5.3 years but faces challenges in accurately replicating the calcium data at 18.3 years, as indicated in Figure 8. This suggests that further refinements or adjustments to the model may be necessary to better capture the long-term behavior of calcium in the bentonite barrier. An increase in the initial amount of gypsum in bentonite helps to improve the fits at 18.3 years but worsens the match at 5.3 years. However, just like inferred aqueous extract data for bicarbonate, calcium data are less reliable because of the involvement of CO2 gas and calcite dissolution over the course of conducting the aqueous extract experiment, whereas the amount of calcite is unknown before the aqueous extract is conducted. In other words, it is not clear if the mismatch between the THMC model data and inferred data is caused by the THMC model or the uncertainty in the inference of aqueous extract data. The final calibrated effective diffusion coefficient for calcium is the , ranging from 1.2 × 10⁻¹³ m2/s to 2.1 × 10⁻¹² m2/s, and at most times and locations the effective diffusion coefficient is around 0.6–2.1 × 10⁻¹² m2/s. Model results and calcium concentration data in granite match each other roughly (Figure 6), which provides supplementary support for the parameters for the calcium transport in bentonite. Calcite precipitates more in bentonite near the granite and less in bentonite near the heater, which is consistent with the trend of measured calcium content in the solid phases [35].
The current THMC model matches decently the magnesium data at 5.3 years and 18.3 years (Figure 8). Data collected after the final dismantling showed that magnesium contents in the solid phases increase towards the heater, which the current model does not explain. Precipitation of dolomite could be a possible explanation for the increase in magnesium towards the heater, but it contradicts the decrease of calcium content in the solid phases towards the heater. Further study on both the data and model is needed.
The evolution of clay minerals, particularly montmorillonite and illite, holds significant implications for the long-term stability of the bentonite barrier in geological repositories. It is important to note that many laboratory heating tests are often too short to reveal substantial changes in clay minerals. Additionally, laboratory test conditions can differ significantly from the complex and dynamic in situ conditions in an actual repository. Therefore, the implications of laboratory test results must be carefully interpreted when applied to the field-scale setting. The mineral characterization of samples collected after the final dismantling of the in situ test does provide valuable insights into the possible changes in clay minerals after long-term heating and hydration. However, a significant challenge arises from the large variation in the illite fraction within the illite/smectite mixed layer between samples (Figure 9). This variation makes it difficult to definitively conclude whether there has been an increase or decrease in the illite mass fraction compared to the reference bentonite. The modeling results suggest the occurrence of illitization near the heater, as indicated by illite precipitation and montmorillonite dissolution (Figure 7). However, the degree of illitization appears to be relatively small, on the order of less than 1%. Unfortunately, the available data does not provide conclusive evidence to prove or disprove this model prediction. To gain a better understanding of the changes in clay minerals in the bentonite barrier over time, further investigations and data collection may be required.
5.3. Long-Term Evolution
After the THMC models have undergone testing with the data from the in situ test, an extension of the base THMC model to longer timeframes allows us to address several lingering questions. The first question pertains to the duration required for the bentonite to become fully saturated. The second question concerns whether high ion concentrations in the pore-water near the canister are expected in the long run. As demonstrated in previous sections, high chloride concentrations were observed in the area near the heater, which could have significant implications for canister corrosion and waste degradation. However, once the bentonite achieves full saturation, do ion concentrations near the heater/canister remain elevated? The third question revolves around the long-term evolution of smectite. The current model suggests relatively small illitization in the vicinity of the heater after 18 years of heating and hydration. While 18 years is a substantial period for the test, it remains very short in comparison to the lifespan of a repository. The key question is whether significant illitization is expected under such conditions if the model is extended for much longer durations. These questions are essential in gaining a comprehensive understanding of the behavior and long-term stability of the bentonite barrier in geological repositories. Further model extensions and investigations may be required to address these questions and provide more insight into the performance of the bentonite barrier over extended periods.
To answer these questions, we extended the base THMC model to 200 years while keeping all other conditions the same, including the temperature at the heater; this test is called an “extended base model” when discussing results. Obviously, as the waste decays, heat emission will not remain at the same level forever, and heat decreases gradually as isotopes decay. Then, in “Run F,” a thermal decay function is applied to the heat source. The shape of the function is similar to that used in Rutqvist et al. [45] for a 2-D model, but the magnitude is scaled down so that the temperature in the EBS close to the heat source is around 100 °C. In the “extended base model,” the heater was maintained at 100 °C, and the spatial profile remained similar from 5 to 200 years (Figure 5), whereas in “Run F,” the spatial gradient of temperature kept decreasing (Figure 5).
In bentonite barriers, the area near granite becomes fully saturated quite fast. Whether the entire bentonite barrier becomes fully saturated is determined by the water saturation at areas near the heater/canister. In the “extended base model”, the water saturation degree is close to 1 after 200 years (Figure 10). However, in “Run F”, after 30 years, the entire bentonite barrier is close to full saturation (Figure 10). The difference between the “extended base model” and “Run F” highlights the relationship between the time needed to fully saturate the bentonite barrier and the thermal condition of the barrier. Heating released from the canister is the reason that bentonite remains unsaturated for an extended time period.
In the FEBEX in situ test, elevated ion concentrations were observed in the pore-water of the bentonite barrier, with chloride concentration profiles (Figure 5) showing concentrations of about 2 mol/L near the heater. These high concentrations were primarily a result of evaporation and concentration of solutes within the pore-water. The key question is whether these elevated concentrations will decrease once the bentonite barrier becomes fully saturated. The answer largely depends on the processes at play in the system. When bentonite becomes fully saturated, the influence of evaporation diminishes significantly, which can lead to a dilution effect as lower concentration groundwater from the surrounding rock infiltrates the barrier. However, the overall behavior will depend on the complex interplay of processes such as advection, diffusion, and chemical reactions. Advanced modeling and further investigations may be required to provide a more precise answer to this question, considering the specific conditions and parameters of the repository site. If the FEBEX in situ test continues running for 200 years, as simulated by the “extended base model”, the concentration level near the heater is expected to decrease but remain relatively high. For example, after 200 years, the concentration of Cl− in the pore-water of bentonite near the heater is predicted to be around 0.8 mol/L (Figure 11), indicating that if the heater (or canister) remains hot, a relatively high concentration around the heater (or canister) is expected for a long time. Unlike the “extended base model”, “Run F” (Figure 11) shows that after 50 years, the concentration of Cl− near the heater goes back to the concentration level of the initial pore-water; after 200 years, the Cl− concentration is about 0.1 mol/L, which lower than the initial concentration, and it is largely the results of mixing pore-waters in bentonite and granite (granite has low Cl− concentration).
As we found from previous modeling work [34], the concentration profiles of cations (calcium, potassium, magnesium, and sodium) were largely affected by transport processes despite their concentrations being affected by mineral dissolution/precipitation and cation exchange. We here show the concentration profile of potassium for the “extended base model” and “Run F” as an example (Figure 12), which illustrate similar patterns as the concentration profile of chloride: in the “extended base model”, concentration in bentonite near the heater remains relatively high, whereas in “Run F”, concentration is low everywhere.
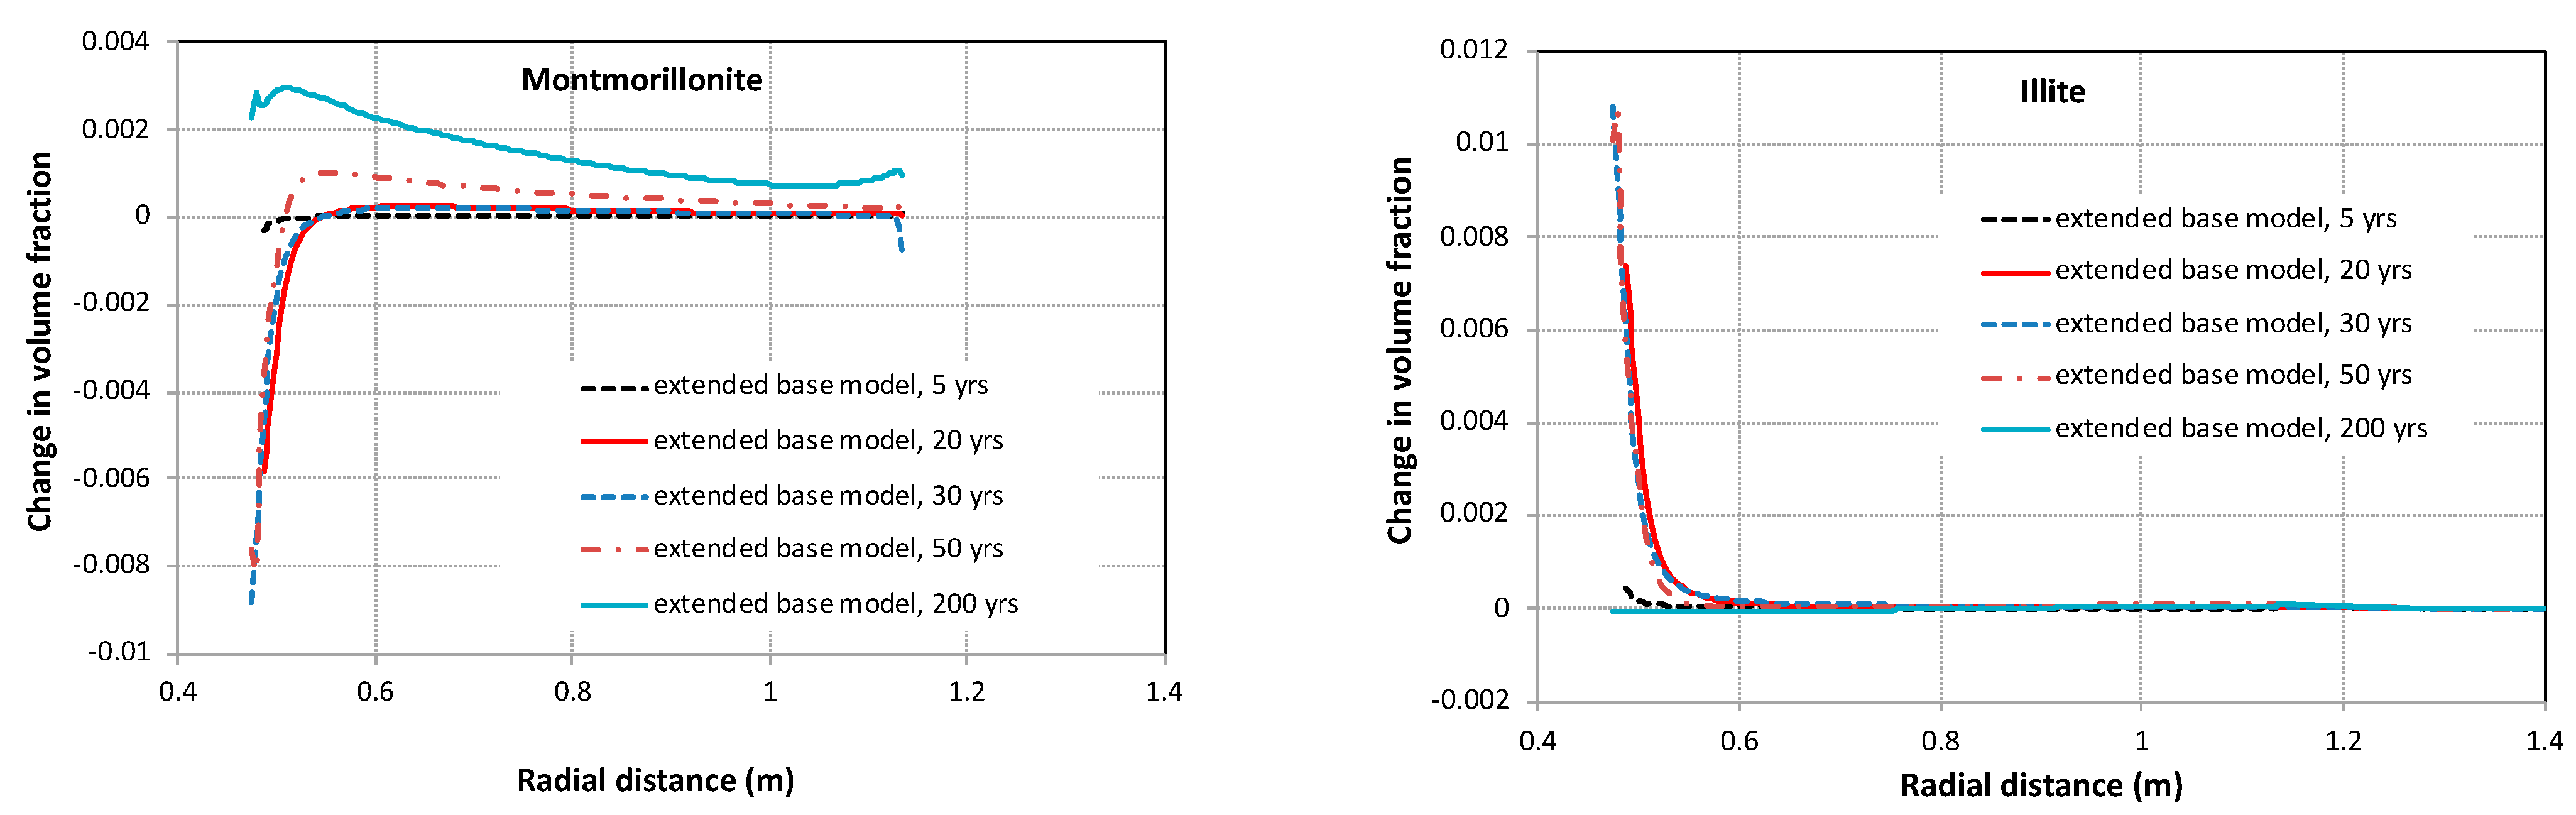
Illitization is a significant concern that has led to the establishment of a thermal limit of 100 °C for the design of geological repositories worldwide, especially those using a bentonite barrier [44]. The base THMC model has indicated that illitization occurred in the bentonite near the heater, with the amount being less than 1% after 18 years. However, this model prediction neither received confirmation nor disapproval from the available data, largely due to the scattered nature of the mineral phase data. It is well-known that illitization is a very slow process [44]. The key question raised here is whether, if the model were to run for a longer period, a significant amount of illitization would occur. Here we simply run the base model for FEBEX in situ test longer, as the “extended base model”, precipitation of illite and dissolution of montmorillonite (Figure 13) continues until 50 years. Then, the reactions proceed in the opposite direction: illite dissolves, and montmorillonite precipitates. After 200 years, the volume change of montmorillonite increased by 0.3%, and the volume of illite decreased by 0.05%, indicating the content of montmorillonite in bentonite was roughly the same as under initial conditions.
“Run F” shows very different illitization results than the “extended base model”. Illitization does not proceed after 50 years, as shown by similar results for 50 and 200 years; rather, illitization is stalled. The difference between “Run F” and the “extended base model” in terms of illitization indicates that while illitization is affected by temperature, it is much more determined by chemical conditions. In the current model, the reaction rates for montmorillonite and illite depend on temperature according to Arrhenius’s law. After 50 years, the temperature in “Run F” is substantially lower than in the “extended base model”. If temperature is the determining factor, one would expect fewer changes along the same reaction directions (e.g., less precipitation for montmorillonite, for example, in Figure 13). However, we see completely different reaction directions in “Run F” (Figure 14) compared with that in the “extended base model”, which indicates that other chemical conditions play more important roles in affecting illitization, the concentration of potassium (Figure 12) is an important factor, the concentration of silicate is another one because of its effect of the precipitation of secondary silicates minerals, pH is also relevant due to its involvement in the illitization process.
6. Conclusions
Given the time frame needed for the performance assessment of the HLW repository, numerical modeling is an inevitable tool for such an exercise. Although synergizing all the latest modeling capabilities with a thorough understanding of the key processes and parameters that can be reliably measured is possible the route for conducting such models, model prediction based on the large-scale field test is probably still the best practice so far to predict the long term evolution of bentonite buffer. One such practice is the models for the FEBEX in situ test. In this paper, we conducted a “re-calibration” of the geochemical data collected after the second dismantling and a THMC model that can reasonably interpret the chemical changes in the in situ test, and finally, a long-term (200 years) predictions based on the extension of the THMC model. Some key observations from the comparison of “re-calibrated” geochemical data and THMC models are as follows:
- –
- Since geochemical data in solid phases were either too scattered to constrain the model or incomparable with model output, the current model predominantly relied on the ion concentration in the aqueous phase to understand the geochemical change in the bentonite.
- –
- Concentrations of most chemical species along the radial direction were higher near the heater and lower away from the heater.
- –
- Geochemical profiles were strongly affected by THM processes such as evaporation/condensation, porosity change due to swelling, permeability change,
- –
- The shape of concentration profiles for major cations was largely controlled by transport processes (advection and diffusion), but concentration levels were regulated by chemical reactions, and the profiles of some species, such as pH, bicarbonate, and sulfate, were dominated by these reactions.
- –
- Measured mass fractions of illite in the illite/smectite mixed layer varied a great deal depending on the laboratory and sample and, therefore, showed no clear spatial trend and were indistinguishable from the reference bentonite. The model results showed a small amount of illite precipitation and montmorillonite dissolution in the vicinity of the heater, which is neither proved nor disapproved by the measured data.
The THMC model was applied for simulation of longer time periods (up to 200 years) under two conditions: with constant heating at 100 °C at the heater and with time-dependent (decreasing) heat load (as from the waste), and we have the following remarks by comparing these two cases:
- –
- Heating prolongs the time that bentonite becomes fully saturated at the area close to the heater/canister: full saturation is expected in 30–40 years based on the model with heat decay function, whereas 200 years is needed if constant heating at 100 °C is maintained.
- –
- High concentrations of ions in bentonite near the heater, observed in the field test, will disappear after bentonite becomes fully saturated.
- –
- Illitization will continue for 50 years but will not proceed. Chemical conditions are the major controlling factor, while temperature plays a secondary role.
Although the models in this paper are advanced in considering coupled THMC processes, there are several aspects that the models have not considered yet. First, the model assumes all the pores are available for flow and transport, whereas pores in bentonite exhibit different level of continuum (e.g., macropores vs. micropores), and the accessibility of each continuum for flow and transport are different. Second, the diffuse double lay (DDL) with Donnan equilibrium might be important in controlling the diffusion of cations and anions, which are neglected in the current models. Third, the temperature dependence of the water retention curve might be important but not considered in the model. Expanding the THMC model to consider these aspects is challenging but should be feasible given the advancement of computation capability.
Author Contributions
L.Z. contribution: modeling work including conceptualization, model development, results processing, writing—original draft preparation; A.M.F. contribution: Geochemical data, writing—review and editing. All authors have read and agreed to the published version of the manuscript.
Funding
This research was funded by the Spent Fuel and Waste Science and Technology, Office of Nuclear Energy, of the U.S. Department of Energy under Contract Number DE-AC02-05CH11231 with Lawrence Berkeley National Laboratory.
Data Availability Statement
The data presented in this study are available on request from the corresponding author. The data are not publicly available due to missing public data repository.
Acknowledgments
Data from the test site were provided through FEBEX-DP consortia.
Conflicts of Interest
The authors declare no conflict of interest.
Appendix A
Aqueous complexes and their disassociation constants for reactions that are written in terms of the primary species are listed in Table A1. These thermodynamic data were taken from Data0.dat.YMPv4.0, an EQ3/6 [42] database qualified by the U.S. Department of Energy for the Yucca Mountain project. Surface protonation reactions are shown in Table A2, and cation exchange reactions in Table A3. Equilibrium constants for minerals are shown in Table A4.

Table A1.
Aqueous complexes and their dissociation constants.
| Species | Log K (25 °C) | Species | Log K (25 °C) |
|---|---|---|---|
| OH− | 13.99 | MgHCO3+ | −1.03 |
| Al+3 | −22.88 | CO2(aq) | −6.34 |
| HAlO2(aq) | −6.45 | CO3−2 | 10.33 |
| NaAlO2(aq) | 0.75 | CaCO3(aq) | 7.01 |
| AlOH+2 | −17.87 | KCl(aq) | 1.50 |
| Al(OH)2+ | −12.78 | MgCl+ | 0.14 |
| Al(OH)3(aq) | −6.72 | MgSO4(aq) | −2.38 |
| CaCl+ | 0.70 | NaSO4− | −0.81 |
| CaCl2(aq) | 0.65 | KSO4− | −0.88 |
| CaSO4(aq) | −2.10 | NaHSiO3(aq) | 8.30 |
| NaCl(aq) | 0.78 | CaOH+ | 12.85 |
| FeCl+ | 0.17 | NaOH(aq) | 14.15 |
| FeHCO3+ | −2.04 | NaCO3− | 9.82 |
| FeCO3(aq) | 4.88 | NaHCO3(aq) | −0.17 |
| FeCl4−2 | 1.94 | CaHCO3+ | −1.04 |
Table A2.
Cation exchange reactions on montmorillonite and illite [43].
Table A2.
Cation exchange reactions on montmorillonite and illite [43].
| Cation Exchange Reaction | KNa/M |
|---|---|
| Na+ + mon_H = mon_Na + H+ | 1 |
| Na+ + mon_K = mon_Na + K+ | 0.0775 |
| Na+ + 0.5 mon_Ca = mon_Na + 0.5Ca+2 | 0.302 |
| Na+ + 0.5 mon_Mg = mon_Na + 0.5Mg+2 | 0.302 |
Table A3.
Surface protonation reactions on montmorillonite [43].
Table A3.
Surface protonation reactions on montmorillonite [43].
| Surface Complexation | Log K |
|---|---|
| mon_sOH2+ = mon _sOH + H+ | −4.5 |
| mon_sO− + H+ = mon _sOH | 7.9 |
| mon_w1OH2+ = mon_w1OH + H+ | −4.5 |
| mon_w1O− + H+ = mon_w1OH | 7.9 |
| mon_w2OH2+ = mon_w2OH + H+ | −6 |
| mon_w2O− + H+ = mon_w2OH | 10.5 |
Table A4.
Equilibrium constants for mineral precipitation/dissolution at 25 °C.
| Primary Mineral | log(K) | Secondary Mineral | log(K) |
|---|---|---|---|
| Calcite | 1.85 | Siderite | 1.543 |
| Smectite-Na | −34.62 | Dolomite | 2.524 |
| Quartz | −3.75 | Ankerite | −1.035 |
| K-feldspar | −22.91 | Illite | −47.33 |
| Albite | −20.133 | Chlorite | 4.298 |
| Anorthite | −19.19 | Kaolinite | −39.9 |
| Gypsum | −4.472 | Anhydrite | −4.297 |
References
- Caporuscio, F.A.; Sauer, K.B.; Rock, M.J. Engineered Barrier System R&D and International Collaborations–LANL–FY21. In Technical Report by Los Alamos National Laboratory, Report Member: LA-UR-21-26538; Los Alamos National Lab. (LANL): Los Alamos, NM, USA, 2021. [Google Scholar]
- Guillaume, D.; Neaman, A.; Cathelineau, M.; Mosser-Ruck, R.; Peiffert, C.; Abdelmoula, M.; Dubessy, J.; Villieras, F.; Michau, N. Experimental study of the transformation of smectite at 80 to 300 °C in the presence of Fe oxides. Clay Miner. 2004, 39, 17–34. [Google Scholar] [CrossRef]
- Cheshire, M.C.; Caporuscio, F.A.; Jove Colón, C.F.; Norskog, K.E. Fe-saponite growth on low-carbon and stainless steel in hydrothermal-bentonite experiments. J. Nucl. Mater. 2018, 511, 353–366. [Google Scholar] [CrossRef]
- Cheshire, M.C.; Caporuscio, F.A.; Jove Colón, C.; McCarney, M.K. Bentonite Clay evolution at elevated pressures and temperatures: An experimental study for generic nuclear repositories. Am. Mineral. 2014, 99, 1662–1675. [Google Scholar] [CrossRef]
- Fernández, R.; Torres, E.; Ruiz, A.I.; Cuevas, J.; Alonso, M.C.; Calvo JL, G.; Calvo, J.L.G.; Rodríguez, E.; Turrero, M.J. Interaction processes at the concrete-bentonite interface after 13 years of FEBEX-Plug operation. Part II: Bentonite contact. Phys. Chem. Earth Parts A/B/C 2017, 99, 49–63. [Google Scholar] [CrossRef]
- Marty, N.C.M.; Bildstein, O.; Blanc, P.; Claret, F.; Cochepin, B.; Gaucher, E.C.; Jacques, D.; Lartigue, J.-E.; Liu, S.; Mayer, K.U.; et al. Benchmarks for multicomponent reactive transport across a cement/clay interface. Comput. Geosci. 2015, 19, 635–653. [Google Scholar] [CrossRef]
- Necib, S.; Diomidis, N.; Keech, P.; Nakayama, M. Corrosion of carbon steel in clay environments relevant to radioactive waste geological disposals, Mont Terri rock laboratory (Switzerland). Swiss J. Geosci. 2017, 110, 329–342. [Google Scholar] [CrossRef]
- Bourdelle, F.; Truche, L.; Pignatelli, I.; Mosser-Ruck, R.; Lorgeoux, C.; Roszypal, C.; Michau, N. Iron–clay interactions under hydrothermal conditions: Impact of specific surface area of metallic iron on reaction pathway. Chem. Geol. 2014, 381, 194–205. [Google Scholar] [CrossRef]
- Bourdelle, F.; Mosser-Ruck, R.; Truche, L.; Lorgeoux, C.; Pignatelli, I.; Michau, N. A new view on iron-claystone interactions under hydrothermal conditions (90 °C) by monitoring in situ pH evolution and H2 generation. Chem. Geol. 2017, 466, 600–607. [Google Scholar] [CrossRef]
- Mon, A.; Samper, J.; Montenegro, L.; Turrero, M.J.; Torres, E.; Cuevas, J.; Fernández, R.; De Windt, L. Reactive transport models of the geochemical interactions at the iron/bentonite interface in laboratory corrosion tests. Appl. Clay Sci. 2023, 240, 106981. [Google Scholar] [CrossRef]
- Sauer, K.; Caporuscio, F.; Rock, M.; Cheshire, M.; Jove Colon, C. Hydrothermal interactions of Wyoming bentonite and Opalinus clay. Clay Clay Miner. 2020, 68, 144–160. [Google Scholar] [CrossRef]
- Bradbury, M.H.; Berner, U.; Curti, E.; Hummel, W.; Kosakowski, G.; Thoenen, T. The Long Term Geochemical Evolution of the Nearfield of the HLW Repository (No. NTB-12-01); Paul Scherrer Institute (PSI): Villigen, Switzerland, 2014. [Google Scholar]
- Mon, A.; Samper, J.; Montenegro, L.; Naves, A.; Fernández, J. Long-term non-isothermal reactive transport model of compacted bentonite, concrete and corrosion products in a HLW repository in clay. J. Contam. Hydrol. 2017, 197, 1–16. [Google Scholar] [CrossRef] [PubMed]
- Chaparro, M.C.; Finck, N.; Metz, V.; Geckeis, H. Reactive Transport Modelling of the Long-Term Interaction between Carbon Steel and MX-80 Bentonite at 25 °C. Minerals 2021, 11, 1272. [Google Scholar] [CrossRef]
- Samper, J.; Zheng, L.; Montenegro, L.; Fernández, A.M.; Rivas, P. Coupled thermo-hydro-chemical models of compacted bentonite after FEBEX “in situ” test. Appl. Geochem. 2008, 23, 1186–1201. [Google Scholar] [CrossRef]
- Zheng, L.; Samper, J.; Montenegro, L.; Fernández, A.M. A coupled THMC model of a heating and hydration laboratory experiment in unsaturated compacted FEBEX bentonite. J. Hydrol. 2010, 386, 80–94. [Google Scholar] [CrossRef]
- Tournassat, C.; Steefel, C.I. Modeling diffusion processes in the presence of a diffuse layer at charged mineral surfaces: A benchmark exercise. Comput. Geosci. 2021, 25, 1319–1336. [Google Scholar] [CrossRef]
- Whittaker, M.L.; Lammers, L.N.; Carrero, S.; Gilbert, B.; Banfield, J.F. Ion exchange selectivity in clay is controlled by nanoscale chemical-mechanical coupling. Proc. Natl. Acad. Sci. USA 2019, 116, 22052–22057. [Google Scholar] [CrossRef]
- Bosch, J.A.; Qiao, Y.; Ferrari, A.; Laloui, L. Thermo-hydro-mechanical analysis of the complete lifetime of the bentonite barrier in the FEBEX in-situ test. Geomech. Energy Environ. 2023, 34, 100472. [Google Scholar] [CrossRef]
- Sánchez, M.; Pomaro, B.; Gens, A. Coupled THM analysis of a full-scale test for high-level nuclear waste and spent fuel disposal under actual repository conditions during 18 years of operation. Géotechnique 2023, 73, 418–438. [Google Scholar] [CrossRef]
- Sedighi, M.; Thomas, H.R.; Vardon, P.J. Reactive transport of chemicals in compacted bentonite under non-isothermal water infiltration. J. Geotech. Geoenvironmental Eng. ASCE 2018, 144, 04018075. [Google Scholar] [CrossRef]
- Samper, J.; Mon, A.; Montenegro, L. A revisited thermal, hydrodynamic, chemical and mechanical model of compacted bentonite for the entire duration of the FEBEX in situ test. Appl. Clay Sci. 2018, 160, 58–70. [Google Scholar] [CrossRef]
- Wilson, J. FEBEX-DP: Geochemical Modelling of Iron-Bentonite Interactions; Technical Report, Report Number: QRS-1713A-R3 (v1.3); Quintessa Ltd.: Henley-On-Thames, UK, 2017. [Google Scholar]
- Zheng, L.; Samper, J.; Montenegro, L. Inverse hydrochemical models of aqueous extracts tests. Phys. Chem. Earth Parts A/B/C 2008, 33, 1009–1018. [Google Scholar] [CrossRef]
- ENRESA. Full-Scale Engineered Barriers Experiment for a Deep Geological Repository in Crystalline Host Rock FEBEX Project; European Commission: Brussels, Belgium, 2000; p. 403.
- ENRESA. FEBEX: Final THG Modelling Report; PT 05-3/2006; ENRESA Technology Publisher: Madrid, Spain, 2006; 155p. [Google Scholar]
- Sánchez, M.; Gens, A.; Guimarães, L. Thermal–hydraulic–mechanical (THM) behaviour of a large-scale “in situ” heating experiment during cooling and dismantling. Can. Geotech. J. 2012, 49, 1169–1195. [Google Scholar] [CrossRef]
- Zheng, L.; Xu, H.; Rutqvist, J.; Reagan, M.; Birkholzer, J.; Villar, M.V.; Fernández, A.M. The hydration of bentonite buffer material revealed by modeling analysis of a long-term in situ test. Appl. Clay Sci. 2020, 185, 105360. [Google Scholar] [CrossRef]
- Huertas, F.; dela Cruz, B.; Fuentes-Cantillana, J.L.; Alonso, E.; Linares, J.; Samper, J.; Elorza, J.; Svemar, C.; Salo, J.-P.; Muurinen, A.; et al. Full-Scale Engineered Barriers Experiment for a Deep Geological Repository for High-Level Waste in Crystalline Host Rock–Phase II; EUR 21922; Nuclear Science and Technology; European Commission: Brussels, Belgium, 2005; pp. 1–44.
- Bárcena, I.; Fuentes-Cantillana, J.L.; García-Siñeriz, J.L. Dismantling of the Heater 1 at the FEBEX In Situ Test. Description of Operations. Enresa Technical Report 9/2003. 2003. Available online: https://www.osti.gov/etdeweb/biblio/20449105 (accessed on 22 November 2023).
- Garcia-Sineriz, J.L.; Abós, H.; Martínez, V.; De la Rosa, C.; Mäder, U.; Kober, F. FEBEX-DP Dismantling of the heater 2 at the FEBEX “in situ” test. In Nagra Arbeitsbericht NAB 16-011; Nagra: Wettingen, Switzerland, 2016; p. 92. [Google Scholar]
- Fernández, A.M.; Baeyens, B.; Bradbury, M.; Rivas, P. Analysis of the porewater chemical composition of a Spanish compacted bentonite used in an engineered barrier. Phys. Chem. Earth Parts A/B/C 2004, 29, 105–118. [Google Scholar] [CrossRef]
- Fernández, A.M.; Sánchez-Ledesma, D.M.; Melón, A.; Robredo, L.M.; Rey, J.J.; Labajo, M.; Clavero, M.A.; Carretero, S.; González, A.E. Thermo-Hydro-Chemical (THC) Behaviour of a Spanish Bentonite after Dismantling Heater#1 and Heater#2 of the FEBEX In Situ Test at the Grimsel Test Site; Nagra Working Reports; European Union: Wettingen, Switzerland, 2018; pp. 16–25. [Google Scholar]
- Zheng, L.; Samper, J.; Montenegro, L. A coupled THC model of the FEBEX “in situ” test with bentonite swelling and chemical and thermal osmosis. J. Contam. Hydrol. 2011, 126, 45–60. [Google Scholar] [CrossRef] [PubMed]
- Villar, M.V.; Fernández, A.M.; Romero, E.; Dueck, A.; Cuevas, J.; Plötze, M.; Kaufhold, S.; Dohrmann, R.; Iglesias, R.J.; Sakaki, T.; et al. FEBEX-DP Post-Mortem THM/THG Analysis Report, Nagra Technical Report: NAB 16–17 Rev.1. 2018. Available online: https://www.research-collection.ethz.ch/handle/20.500.11850/463965(accessed on 22 November 2023).
- Pérez-Estaún, A.; Carbonell, R.; Martinez-Landa, L.; Dentz, M.; Suso, J.; Carretero, G.; Bueno, J.; Buil, B.; Garralón, A.; Gómez, P.; et al. New boreholes to investigate the bentonite/crystalline rock interface in the FEBEX tunnel (Grimsel, Switzerland). In 1st Annual Workshop Proceedings of Integrated Project FUNMIG, Stockholm, Sweden, 21–23 November 2006; 6TH EC F-FUNMIG IP. CEA-R-6122; CEA: Budapest, Hungary, 2006; pp. 157–162. [Google Scholar]
- Xu, T.; Sonnenthal, E.; Spycher, N.; Zheng, L. TOUGHREACT V3. 0-OMP Reference Manual: A Parallel Simulation Program for Non-Isothermal Multiphase Geochemical Reactive Transport; University of California, Berkeley: Berkeley, CA, USA, 2014. [Google Scholar]
- Itasca. FLAC3D, Fast Lagrangian Analysis of Continua in 3 Dimensions; Version 4.0; Itasca Consulting Group: Minneapolis, MN, USA, 2009. [Google Scholar]
- Ramírez, S.; Cuevas, J.; Vigil, R.; Leguey, S. Hydrothermal alteration of “La Serrata” bentonite (Almeria, Spain) by alkaline solutions. Appl. Clay Sci. 2002, 21, 257–269. [Google Scholar] [CrossRef]
- Garralón, A.; Gómez, P.; Turrero, M.J.; Torres, E.; Buil, B.; Sánchez, L. Hydrogeochemical characterisation of the groundwater in the FEBEX gallery. In Arbeitsbericht NAB 16-14; Nagra: Wettingen, Switzerland, 2017. [Google Scholar]
- Siitari-Kauppi, M.; Leskinen, A.; Kelokaski, M.; Togneri, L.; Alonso, U.; Missana, T.; García-Gutiérrez, M.; Patelli, A. Physical Matrix Characterisation: Studies of Crystalline Rocks and Consolidated Clays by PMMA Method and Electron Microscopy as Support of Diffusion Analyses. CIEMAT Technical Report, 1127. December 2007. Available online: https://www.osti.gov/etdeweb/biblio/20988489 (accessed on 22 November 2023).
- Wolery, T.J. EQ3/6, A Software Package for Geochemical Modelling of Aqueous Systems; Version 7.2; Lawrence Livermore National Laboratory: Livermore, CA, USA, 1993.
- Bradbury, M.H.; Baeyens, B. Modelling the sorption of Mn(II), Co(II), Ni(II), Zn(II), Cd(II), Eu(III), Am(III), Sn(IV), Th(IV), Np(V) and U(VI) on montmorillonite: Linear free energy relationships and estimates of surface binding constants for some selected heavy metals and actinides. Geochim. Cosmochim. Acta 2005, 69, 875–892. [Google Scholar] [CrossRef]
- Zheng, L.; Rutqvist, J.; Birkholzer, J.T.; Liu, H.-H. On the impact of temperatures up to 200 °C in clay repositories with bentonite engineer barrier systems: A study with coupled thermal, hydrological, chemical, and mechanical modeling. Eng. Geol. 2015, 197, 278–295. [Google Scholar] [CrossRef]
- Rutqvist, J.; Ijiri, Y.; Yamamoto, H. Implementation of the Barcelona Basic Model into TOUGH–FLAC for simulations of the geomechanical behavior of unsaturated soils. Comput. Geosci. 2011, 37, 751–762. [Google Scholar] [CrossRef]
Figure 1.
In situ test configuration following dismantling of Heater #1 [29].
Figure 1.
In situ test configuration following dismantling of Heater #1 [29].

Figure 2.
The aqueous extract test (AET) (left) to measure ion concentration in pore-water for samples obtained during the final dismantling of the in situ test, and the geochemical model (right) that reverses the AET procedure to infer the ion concentration for the original pore-water.
Figure 2.
The aqueous extract test (AET) (left) to measure ion concentration in pore-water for samples obtained during the final dismantling of the in situ test, and the geochemical model (right) that reverses the AET procedure to infer the ion concentration for the original pore-water.

Figure 3.
Schematic situation of parallel boreholes (FU-1, FU-2 and FU-3) and radial boreholes, plain view [36].
Figure 3.
Schematic situation of parallel boreholes (FU-1, FU-2 and FU-3) and radial boreholes, plain view [36].

Figure 4.
Mesh used for the model. Not to scale.

Figure 5.
Inferred chloride, sulfate, and bicarbonate concentration and pH data at 5.3 years [34] and 18.3 years, and model results from the THMC model.
Figure 5.
Inferred chloride, sulfate, and bicarbonate concentration and pH data at 5.3 years [34] and 18.3 years, and model results from the THMC model.

Figure 6.
Model results and chloride, sulfate, sodium, and calcium concentration data in granite. Data in FU1-3 are collected from a tunnel 0.2 m away from the bentonite/granite interface; Data in FU2-2 are data from a tunnel 0.6 m away from the bentonite/granite interface.
Figure 6.
Model results and chloride, sulfate, sodium, and calcium concentration data in granite. Data in FU1-3 are collected from a tunnel 0.2 m away from the bentonite/granite interface; Data in FU2-2 are data from a tunnel 0.6 m away from the bentonite/granite interface.

Figure 7.
Model results of gypsum, anhydrite, calcite, illite, and smectite volume fraction change at 5.3 and 18.3 years. Negative values mean dissolution and positive values mean precipitation.
Figure 7.
Model results of gypsum, anhydrite, calcite, illite, and smectite volume fraction change at 5.3 and 18.3 years. Negative values mean dissolution and positive values mean precipitation.

Figure 8.
Inferred sodium, potassium, magnesium, and calcium concentration data at 5.3 and 18.3 years were compared with results from the THMC model.
Figure 8.
Inferred sodium, potassium, magnesium, and calcium concentration data at 5.3 and 18.3 years were compared with results from the THMC model.

Figure 9.
Smectite content in samples from different sections around the heater was determined by X-ray diffraction by different laboratories (marked by different color and symbols in the figure). The dashed line indicates the content in the reference sample [35].
Figure 9.
Smectite content in samples from different sections around the heater was determined by X-ray diffraction by different laboratories (marked by different color and symbols in the figure). The dashed line indicates the content in the reference sample [35].

Figure 10.
Spatial distribution of temperature and water saturation degree at several time points in the “extended base model” and “run F”.
Figure 10.
Spatial distribution of temperature and water saturation degree at several time points in the “extended base model” and “run F”.


Figure 11.
Inferred chloride concentration data at 5.3 and 18.3 years and model results from the “extended base model” and “Run F” at different times.
Figure 11.
Inferred chloride concentration data at 5.3 and 18.3 years and model results from the “extended base model” and “Run F” at different times.

Figure 12.
Inferred potassium concentration data at 5.3 and 18.3 years and model results from the “extended base model” and “Run F” at different times.
Figure 12.
Inferred potassium concentration data at 5.3 and 18.3 years and model results from the “extended base model” and “Run F” at different times.

Figure 13.
Model results for montmorillonite (left) and illite (right) volume fraction change from the “extended base model”. Positive values indicate precipitation.
Figure 13.
Model results for montmorillonite (left) and illite (right) volume fraction change from the “extended base model”. Positive values indicate precipitation.

Figure 14.
Model results for montmorillonite (left) and illite (right) volume fraction change from the “Run F” at different times. A negative value means dissolution.
Figure 14.
Model results for montmorillonite (left) and illite (right) volume fraction change from the “Run F” at different times. A negative value means dissolution.

| Event | Date | Time (Day) | Time (Year) |
|---|---|---|---|
| Commencement of heating | 27 February 1997 | 0 | 0.0 |
| Heater #1 was switched off | 28 February 2002 | 1827 | 5.0 |
| # Bentonite sampling | 2 May 2002 | 1930 | 5.3 |
| Heater #2 was switched off | 24 April 2015 | 6630 | 18.1 |
| $ Bentonite sampling | 3 July 2015 | 6700 | 18.3 |
# The sampling work started on 2 April 2002 and progressed section by section [30]; when sections 28 and 29 (from where data in this paper were used) were sampled, it was about 2 May 2002. $ This is the time when section 49 was sampled.
Table 2.
Mineral mass fraction (dimensionless, ratio of the mass for a mineral to the total mass of medium) FEBEX bentonite [25,32,39] and granite [34].
| Mineral | FEBEX Bentonite | Granite |
|---|---|---|
| Calcite | 0.008 | 0 |
| Smectite | 0.925 | 0 |
| Gypsum | 0.003 | 0 |
| Quartz | 0.03 | 0.373 |
| Cristobalite | 0.01 | 0 |
| K-Feldspar | 0.01 | 0.353 |
| Plagioclase | 0.01 | 0.272 |
| Dolomite | 0.0 | 0 |
| Illite | 0.0 | 0 |
| Kaolinite | 0.0 | 0 |
| Siderite | 0.0 | 0 |
| Ankerite | 0.0 | 0 |
| Anhydrite | 0.0 | 0 |
| Chlorite | 0.0 | 0 |
Table 3.
Pore-water composition (mol/kg water except for pH) of FEBEX bentonite [32] and granite [34].
| EBS Bentonite: FEBEX | Granite | |
|---|---|---|
| pH | 7.72 | 8.35 |
| Cl− | 1.60 × 10⁻¹ | 1.31 × 10⁻⁵ |
| SO4−2 | 3.20 × 10⁻² | 7.86 × 10⁻⁵ |
| HCO3− | 4.1 × 10⁻⁴ | 3.97 × 10⁻⁴ |
| Ca+2 | 2.2 × 10⁻² | 1.81 × 10⁻⁴ |
| Mg+2 | 2.3 × 10⁻² | 1.32 × 10⁻⁶ |
| Na+ | 1.3 × 10⁻¹ | 3.76 × 10⁻⁴ |
| K+ | 1.7 × 10⁻³ | 7.80 × 10⁻⁶ |
| Fe+2 | 2.06 × 10⁻⁸ | 2.06 × 10⁻⁸ |
| SiO2(aq) | 1.1 × 10⁻⁴ | 6.07 × 10⁻⁴ |
| AlO2− | 1.91 × 10⁻⁹ | 3.89 × 10⁻⁸ |
Disclaimer/Publisher’s Note: The statements, opinions and data contained in all publications are solely those of the individual author(s) and contributor(s) and not of MDPI and/or the editor(s). MDPI and/or the editor(s) disclaim responsibility for any injury to people or property resulting from any ideas, methods, instructions or products referred to in the content. |
© 2023 by the authors. Licensee MDPI, Basel, Switzerland. This article is an open access article distributed under the terms and conditions of the Creative Commons Attribution (CC BY) license (https://creativecommons.org/licenses/by/4.0/).
Share and Cite
MDPI and ACS Style
Zheng, L.; Fernández, A.M. Prediction of Long-Term Geochemical Change in Bentonite Based on the Interpretative THMC Model of the FEBEX In Situ Test. Minerals 2023, 13, 1522. https://doi.org/10.3390/min13121522
AMA Style
Zheng L, Fernández AM. Prediction of Long-Term Geochemical Change in Bentonite Based on the Interpretative THMC Model of the FEBEX In Situ Test. Minerals. 2023; 13(12):1522. https://doi.org/10.3390/min13121522
Chicago/Turabian StyleZheng, Liange, and Ana María Fernández. 2023. "Prediction of Long-Term Geochemical Change in Bentonite Based on the Interpretative THMC Model of the FEBEX In Situ Test" Minerals 13, no. 12: 1522. https://doi.org/10.3390/min13121522
Note that from the first issue of 2016, this journal uses article numbers instead of page numbers. See further details here.