
A Multiphysics Model for the Near-Field Evolution of a Geological Repository of Radioactive Waste

1
Department of Civil Engineering, University of Ottawa, Ottawa, ON K1N 6N5, Canada
2
Canada Nuclear Safety Commission (CNSC), Ottawa, ON K1P 5S9, Canada
*
Author to whom correspondence should be addressed.
Minerals 2023, 13(12), 1535; https://doi.org/10.3390/min13121535
Submission received: 13 October 2023
/
Revised: 20 November 2023
/
Accepted: 4 December 2023
/
Published: 10 December 2023
(This article belongs to the Special Issue Implications of THMC Processes on Long-Term Safety of Geological Disposal of Radioactive Waste)
Abstract
:The safety and robustness of Deep Geological Repositories (DGRs) are of paramount importance for the long-term management of spent nuclear fuel from electricity generation. The introduction of a multi-barrier system, which includes the host rock formation and an engineered barrier system (including the bentonite buffer), has been a widely used approach to ensure the safety of DGRs. The assessment of the long-term safety of DGRs involves the mathematical modeling of the coupled thermal–hydraulic–mechanical–chemical (THMC) processes that occur in the near-field of the DGRs and their impact on the behaviour and engineering properties of the bentonite buffer. This paper presents a review of the THMC-coupled processes that arise in the bentonite buffer as well as a mathematical model governing such coupled processes. The model is verified against existing analytical solutions and validated against measured data of a thermal diffusion experiment in a sand bentonite column. Also, scoping analyses were performed to assess the influence of coupled THM processes on solute transport in clayrocks. The results of the numerical model closely matched those of the analytical solutions and experimental data demonstrating the capability of the provided mathematical model as well as the numerical approach in enhancing our comprehension of DGR behaviour. This enhanced comprehension will be valuable for safety prediction and assessment in the context of DGRs. The work presented in this paper is part of the Canadian Nuclear Safety Commission’s (CNSC) regulatory research to gain independent knowledge on the safety of the geological disposal of radioactive waste.
1. Introduction
1.1. Deep Geological Disposal Concept
Several nations, including Canada, which generate electricity from nuclear power, are presently contemplating the geological disposal of radioactive waste in deep geological formations. Geological disposal entails the use of several barriers to contain the waste for an extended period and retard the migration of radionuclides from the waste ensuring the protection of the near-surface environment. The current Canadian concept for the geological disposal of spent nuclear fuel (Figure 1), similar to international concepts, involves burying the waste deep underground in a repository that is excavated in a suitable rock formation such as crystalline or sedimentary rock [1]. Desirable attributes of the rock formation are (1) depth should be sufficient to isolate the DGR from the human environment, (2) appropriate low permeability reduce the potential of fluid flow through the repository post closure, (3) the absence of exploitable natural resources to reduce chances of human intrusion, and (4) geological stability.
1.2. Multibarrier System
In this concept, long-term safety is provided by a system of multiple, redundant barriers that will contain the spent fuel and isolate it from the near-surface environment [2]:
- The first barrier is the nuclear fuel pellets, which is durable and temperature resistant, and has a low dissolution potential.
- The second barrier is the fuel elements and fuel bundles. A bundle consists of several sealed tubes called elements, into which fuel pellets are inserted. The fuel elements are made of corrosion-resistant zircaloy.
- The third barrier is the spent fuel containers (UFCs), which are designed to withstand anticipated loads and corrosion.
- The fourth barrier, called a buffer, is a compact bentonite sealing system that encapsulates the UFCs in the emplacement room. The primary roles of this barrier are to reduce water flow around the UFCs to limit corrosion processes and microbial activities. Also, the buffer protects the UFCs by mitigating mechanical damage from seismic events and small-scale fault movement. The buffer, due to its low permeability and high sorption capacity would also constitute an additional barrier to radionuclides migration, should they be released from the UFCs in the future.
- The outermost barrier is the natural rock formation that will protect the DGR from natural events and human intrusion. Also, it provides a barrier to potential radionuclide migration to the near surface.
The set of the first four barriers is generally referred to as the engineered barrier system (EBS), while the host rock is referred to as the natural barrier. The system of in–room engineered barriers and the host rock in the vicinity of the rooms is herein called the near–field of the DGR.
It is expected that over the very long period following the closure of the DGR, this multiple barrier system will be subject to disruptions that will affect its long-term performance and safety functions. These disturbances result from processes and activities like the excavation of the DGR emplacement rooms and shafts, heat generated by the waste, the hydration of saline water from adjacent rock, gas generated from corrosion products and organic material within the repository, as well as geological events such as glaciation and seismicity [3]. These events disrupt the existing equilibrium of the EBS and the natural barrier for very long periods, inducing complex coupled THMC processes. The long-term performance of the barriers will be affected by the coupled THMC processes, and therefore, it is necessary to understand these processes through experimental and theoretical research in order to evaluate the long-term safety of the DGR system. Consequently, over the past few decades, several academic and non-academic organizations have conducted experimental and modeling studies to better understand these THMC processes and their potential impact on the long-term safety of DGR systems. For example, since the early 1990s, the CNSC has been collaborating with Canadian and international partners to conduct research on these coupled THMC processes ([4,5,6,7,8,9,10,11,12,13]), including both experimental and theoretical research. The experimental data were generated from small-scale experiments performed in conventional surface laboratories, larger-scale experiments from underground research laboratories, and geological-scale data from paleohydrogeological information. The experimental data provide the basis for the development of a mathematical framework of coupled THMC processes. In this study, the general mathematical framework and resulting mathematical model will be discussed. Examples on how the mathematical model has been adapted to simulate different situations where coupled THMC processes prevail will be presented.
2. Conceptualization and Mathematical Model of Multiphysical Processes in the near Field of a DGR
2.1. Conceptual Model
The THMC processes in the near field of a DGR can be conceptualized as illustrated in Figure 2. To start with, it is widely accepted that the EBS and the host rock can be characterized as porous materials made up of solid particles forming a solid skeleton. The solid skeleton contains discontinuities such as pores, cracks, and microcracks, which we will refer to as pores. These pores can contain various types of fluids, either in a gaseous or liquid state. The host rock is generally saturated with water with salinity characteristics of seawater or dense brine depending on the geological formations. On the other hand, the EBS is initially placed in an unsaturated state, with pores containing a mixture of liquid water, water vapor, and air. At the early age of the post-closure stage of the DGR, the radiogenic heat emitted from the containers leads to higher temperatures in both the EBS and rock, with higher temperatures closer to the containers (red arrow). The maximum temperature in the area surrounding the waste containers is anticipated to reach 100 °C or even 140 °C depending on the national concept and design. In Canada, the anticipated temperature would be maintained below 100 °C [1]. This temperature increase creates a thermal gradient that generates thermal stresses and strains in both media, including the solid particles and pore fluid.
Moreover, the flow of heat causes liquid water in the buffer to evaporate and move outward, then condense at cooler temperatures, which is referred to as moisture movement (blue dash arrow). Essentially, moisture movement causes the buffer to dry out near the container and become moist again near the interface between the buffer and the rock. These changes in water content prompt a mechanical response from the buffer, which can either shrink or swell.
The host rock is mainly saturated, whereas the buffer is only partially saturated in the early stages, causing pore water to move from areas of higher pore pressure to lower pressure (blue arrow). Before heating, pore water flows from the nearby rock towards the EBS. However, during heating, the pore pressure near the periphery of the EBS increases due to the thermal expansion coefficient of water which is about one order of magnitude higher than the one of the solid skeletons. Because of the low permeability of the medium (for instance, at the South Bruce site in Ontario, a potential location for a DGR for spent fuel in Canada, the potential host formation has a permeability of the order of 10−21 m2 [14]), pore water movement is restricted, resulting in a buildup of pore pressure during the initial stages, which induces a temporary outward flow from the EBS. During the later stages, as the thermally induced pore pressure subsides, water migrates gradually from the heat source, allowing the pore pressure to dissipate.
Additionally, porewater located in deep geological formations may contain high concentrations of solutes. For instance, at the Bruce site, the total dissolved solids (TDS) in the porewater can reach up to 450 g/L at depths greater than 500 m [2]. The concentrated brine in the host rock could penetrate the EBS (green arrow), causing intricate THMC processes that may impact the swelling capacity of the bentonite. These processes are interrelated and much more complex than the swelling behaviour of bentonite infiltrated with deionized water. As a result, coupled models are necessary to incorporate the relevant THMC processes and account for the interaction between the EBS and host rock, as these THMC processes are strongly coupled.
2.2. Mathematical Model
From the conceptual model discussed above, a mathematical model is formulated following the methodology in [15,16,17,18] by invoking the fundamental principles of momentum conservation, mass conservation and energy conservation.
Equations (1), (2), (5) and (6) in Section 2.2.1, Section 2.2.2, Section 2.2.3 and Section 2.2.4 below constitute the set of governing equations of the mathematical model to simulate the THMC behaviour of partially saturated bentonite buffer and host rock in which the four primary unknowns are displacement (ui), temperature (T), porewater pressure (p) and total dissolved solid concentration (C). These variables are functions of both space (xi) and time (t). These equations could be solved numerically using the finite element method (FEM). In this work, we used the built-in modules (Heat transfer, Darcy’s law and Solid Mechanics) of a commercial general-purpose finite element software, COMSOL Multiphysics® (version 6.1, COMSOL, Inc., Burlington, MA 01803, USA). The partial differential equations used in these modules were modified and adapted to match the governing equations described in the following.
The main assumptions of the model are as follows:
- The geological medium is conceptualized as a porous medium.
- Only heat is considered in the energy balance equation. Thermal equilibrium is assumed between the solid and liquid phases. Furthermore, heat convection may be neglected, and heat transfer occurs only by conduction [19].
- The porewater can exist either in a liquid or gaseous (vapour) state. The flow of liquid water is driven by advection and is assumed to follow Darcy’s law, while the vapour flow is driven by diffusion.
- A modified Biot’s effective stress principle is assumed:
2.2.1. Equation of Heat Conservation
= qc: heat flux described by Fourier’s law of heat conduction (W/m3);
: thermal conductivity tensor of porous media (W/m°C);
T: temperature (°C);
is the density of porous medium (kg/m3) and n, and are the porosity, density of fluid and density of solid, respectively;
Q: volumetric rate of heat generation (W/m3);
: special heat capacity of porous medium (J/kg°C);
t: time [s].
2.2.2. Equation of Momentum Conservation (Quasi-Static Equilibrium)
The equation of momentum conservation that considered the combined effects of stresses and thermally induced deformation considering the medium is in a partially saturated condition is:
where:
: fourth-order stiffness tensor;
: displacement in the solid skeleton;
: volumetric thermal expansion coefficient of the solid particles (1/K);
: Kronecker delta;
α: Biot’s coefficient;
: degree of saturation;
: body force (MPa/m).
The stiffness tensor is a general stress–strain tensor that can be further defined to include plasticity and swelling for both the buffer and the host rock. The development of reliable constitutive relations for the buffer and host rock is the focus of the authors’ ongoing research, e.g., [16,18,20,21]. However, in the present paper for verification and preliminary validation of the model, linear elastic behaviour is considered.
When the solid skeleton is assumed to be linearly elastic, Equation (2) reduces to:
where is bulk modulus of the drain material (MPa−1), G and are Lamé’s constants, which relate to Young’s modulus () and Poisson’s ratio (ν) in form of: .
2.2.3. Equation of Mass Conservation
The equation of mass conservation of pore fluid in partially saturated media neglecting vapor storage is [20]:
where the left-hand side is the net flux of fluid mass through the boundary of the volume, the right-hand side represents the rate of fluid mass accumulation (i.e., storage term), and and are, respectively, the liquid water mass flux and water vapour mass flux relative to the solid [(kg/m3) × (m/s)].
The final equation of pore fluid flow in the variably unsaturated porous medium derived from the consideration of mass conservation is ([15,16,20]):
- The first term of the equation results from the adoption of Darcy’s law for pore fluid flow in unsaturated porous media.
- The second term represents vapour flow due to thermal gradients and pressure gradients.
- The third term denotes water retention due to the unsaturated state of the medium. In this term, w is the gravimetric water content and is the specific gravity of the soil particles. When the medium is fully saturated, w is independent of p, and this term becomes zero.
- The fourth term implies water retention due to compressibility of the water and solid phase.
- The fifth term represents water retention due to the consolidation of the porous medium.
- The sixth term represents water flow due to difference in thermal expansion between the water and solid material.
The involved parameters of the equation, except those described earlier, are listed as follows:
: intrinsic saturated permeability tensor (m2);
: relative permeability of unsaturated media (-);
μ: dynamic viscosity of fluid (Pa·s);
: bulk modulus of fluid (Pa);
: bulk modulus of solid (Pa);
: volumetric thermal expansion coefficient of the fluid (1/K);
: volumetric thermal expansion coefficient of the solids (1/K);
: volumetric thermal expansion coefficient of the porous medium (1/K);
Se: degree of saturation (-) in unsaturated media. Se is often described in the form of soil–water retention models (for example, the van Genuchten model [22] and the Brook and Corey model [23]), in which the relationship between Se and capillary pressure (pc) is defined using data from suction tests. An example of the Brook and Corey water retention model adopted in this paper can be found in Section 4.2.1. Also, it is worth noting that pc is the negative porewater pressure under the assumptions of (1) small and constant air pressure and (2) the absence of osmotic suction [18]. When gas is involved or pore fluid in unsaturated media is filled with salty water, Equation (4) should be modified accordingly.
Parameters relating to the second term, which will be elaborated upon in Section 4.2.3, is briefly listed as follows:
: diffusion coefficient of water vapour under pressure gradient (m2/s·Pa);
: diffusion coefficient of water vapour under temperature gradient (m2/s·°C);
: vapour diffusion coefficient (m2/s);
: liquid water density (kg/m3);
: vapour density (kg/m3);
Rv: gas constant for vapor (-);
fTv: thermal enhancing factor for vapour diffusion (-);
RH: relative humidity (-);
: saturated vapour density (kg/m3);
: free diffusion coefficient of water vapour in the atmosphere (m2/s);
: tortuosity factor (-).
2.2.4. Equation of Solute Transport
The equation for non-reactive solute transport in unsaturated porous media:
where:
C: solute concentration (mol/m3);
: diffusion coefficient tensor (m2/s);
: Darcy’s velocity of the pore fluid;
: source flux of chemicals (mol/m3);
diffusive flux described by Fick’s law which accounts for the motion of the solute due to concentration gradients (mol/m2s);
: advective flux causes translation of solute field by moving the solute with the flow velocity (mol/m2s).
3. Verification
To verify a mathematical model, it is always advantageous to have a general analytical solution available to use as benchmark. In this section, we conduct verification against analytical solutions to verify the accuracy of the model in terms of the HM and THM coupling algorithm proposed in Section 2. For the verification of the HM coupling mechanism, we adopt the widely known analytical solution for one-dimensional consolidation suggested by Terzaghi [24]. In terms of THM coupling processes, we use the analytical solution from Booker and Savvidou [25] for the problem of consolidation around a point heat source.
3.1. The 1D Consolidation of Soil Column
The Terzaghi 1D consolidation problem has been extensively used as a benchmark for the verification of numerical codes relating to poroelasticity ([26,27,28]). Its main utility is to test the accuracy of the solid–fluid coupling that relates fluid pressure to solid deformation and vice versa. The problem considers a saturated soil column of thickness H with an impermeable and fixed base, a free-draining and free-moving surface and laterally confined and impermeable vertical sides. The column is instantaneously compressed from its upper boundary by a constant uniaxial load ∆σ. This creates a sudden increase in pore pressure in the column which then dissipates by flow through the upper boundary. No temperature and solute transport are relevant for this situation and the soil column is saturated. Only governing Equations (2) and (5) are applicable in this situation, and with the assumption of linear elasticity of the solid skeleton, they are reduced to a one-dimensional coupled HM problem:
Equations (7) and (8) are equivalent to Terzaghi’s [24]. The analytical solution for the temporal and spatial evolution in excess hydraulic pore fluid pressure may be expressed as follows [29]:
where:
: excess hydrostatic pore pressure at a specific depth () and time ().
: initial value of excess hydrostatic pore pressure. At the beginning of the consolidation process when water has not expelled from the soil column, = ∆σ.
: the maximum drainage path of the fluid. In this case, when fluid is restricted to dissipate via the upper layer exclusively, = H.
is dimensionless time factor expressed as:
where is the coefficient of consolidation and is a measure of the rate at which the consolidation process proceeds. is related to hydraulic conductivity () and compressibility of soil through the relationship:
where is coefficient of volume compressibility (or also termed as coefficient of confined compressibility) and can be described in terms of the elastic constants’ Young’s moduli (E) and Poisson’s ratios (ν) as:
As excess hydraulic pore pressure dissipates, the consolidation process occurs which brings about the settlement of the sample. The degree of settlement () is defined as the ratio between settlement due to pressure dissipation at time t () and the final settlement when the consolidation finished (). Us can be expressed as:
where is the average change of effective stress at any time t and is the final change of effective stress at the end of the consolidation.
Equation (8) and (9) are used to obtain the analytical solutions for excess pore fluid pressure evolution and the surface settlement due to consolidation. The comparison between analytical and numerical results of the same problem was carried out in [15] with the finite element code FRACON. For the purpose of comparison, we here use input data identical to those specified in [15] to implement in COMSOL Multiphysics®:
E = 35 × 109 Pa;
= 0.2;
= 1;
= 10−11 m/s;
∆σ = 30 × 106 Pa;
H = 5000 m.
The finite element mesh and the boundary conditions are shown in Figure 3, where the soil column of thickness H is underlain by impermeable base and lateral confinement. A load of ∆σ is applied at the top surface of soil column where the only drainage is provided.
Figure 4a illustrates the evolution of normalized excess hydrostatic pore fluid pressure (presented by ) and time factor at two specific depths (z/H = 0.579 and 0.104). The temporal variation of normalized surface settlement (described in form of where G is the shear modulus, is shown in Figure 4b. For both results, the numerical results agree well with the results calculated from analytical solutions presented above.
3.2. Thermal Consolidation around a Point Heat Source
In this problem, we consider a point heat source embedded in an infinite saturated porous medium. The heat source will induce temperature rise in both pore fluid and soil skeleton leading to the thermal expansion of both components. Due to the differences in the thermal expansion of pore fluid and solid materials (e.g., in this section, the chosen values of volumetric thermal expansivity of the pore fluid is 4 × 10⁻⁴ (1/K), while that of the solid materials is 4.5 × 10⁻⁵ (1/K)), the pore fluid pressure increases and reduces the effective stress. This excess pore fluid pressure will dissipate at a rate proportional to the permeability of the porous medium.
The analytical solution for the point heat source consolidation was proposed by Booker and Savvidou [25] for linearly elastic porous media and was later extended for different shapes of embedded heat sources (e.g., cylinder source, sphere source) by [30,31,32]. The solution provides the evolution of temperature, pressure and displacement fields. In this study, we adopt input data identical to those specified by [32] to validate the proposed numerical code in terms of THM-coupled processes (Table 1).
The governing Equations (1), (2) and (5) simplify to:
The finite element mesh used for this problem along with the boundary conditions are shown in Figure 5. Invoking symmetry, only one eighth of a spherical geometry is represented, with symmetry planes defined at x = 0, y = 0 and z = 0, while the infinite domain is truncated at radius R = 30 m. The results for the temperature, pore pressure and displacement components at various points P1, P2, P3, P4 and P5 are shown in Figure 6. Temperature and pore pressure at an extremity of the domain (P6) were also illustrated in Figure 6 to confirm the boundary conditions of the model. The numerical modelling results are in near-perfect comparison with the analytical results. The same results at point P5 were documented by Chaudhry et al. [32].
Regarding the pore pressure evolution, initially there is a rise in pore pressure, followed by a decrease over time. This initial elevation in pore pressure occurs because the pore fluid has higher thermal expansivity compared to the solid skeleton. The induced pore pressure gradient drives the flow of pore fluid away from the heat source. However, as time passes, the drainage of pore fluid occurs due to the finite permeability of the medium, resulting in pore pressure dissipation.
4. Validation against Sand/Bentonite Column Experiment
A laboratory column experiment, along with its field scale heater experiment (HE-E) at the Mont Terri underground research facility in Switzerland, have been well investigated by [33,34,35] in the framework of PEBS. Through these experiments, the behaviour of buffer and the near field of DRG with respect to thermal evolution and associated thermally induced THM interactions were evaluated. Also, the experiments provided experimental data that can be used to calibrate and validate numerical models.
In this study, we only consider the laboratory column experiment that uses the same bentonite/sand mixture as in the in situ HE-E experiment in order to verify the TH aspect of our proposed mathematical model. Still, it is also worthy to briefly describe the in situ HE-E experiment in order to provide some contextual information. The in situ HE-E experiment consists of two tunnel sections: one is filled using pure MX-80 (Wyoming, USA) bentonite pellets, while the other is filled with a 65/35 granular sand/bentonite mixture, which has a higher thermal conductivity [35]. Heaters are placed to mimic the heat generation from waste containers and water infiltration after the heating phase was conducted to represent the re-saturation of buffer due to water ingress from host rock. During the experiment, temperature, humidity and water saturation were monitored through a system of sensors. More details regarding the HE-E experiment can be found in [36].
For characterizing the buffer materials, Villar et al. [35] conducted well controlled laboratory column experiments of the pure MX-80 bentonite and the sand-bentonite mixture. In order to mimic the heating of the buffer material and the re-saturation caused by the water recirculation from the host rock, the experiments were divided into (1) a heating phase and (2) a simultaneous heating and hydration phase.
In this section, we only focus on the laboratory column experiment for sand/bentonite mixture (here called S/B) during the first heating phase (i.e., the simulation stops prior to hydration). In the following sections, the main characteristic of the test is given in order to facilitate the understanding of the conceptual and numerical models developed in our work.
4.1. Experimental Set-Up
The experimental set-up of the column test is described in detail in [35]. The experiment apparatus is schematically shown in Figure 7a. The S/B column diameter is 7 cm while the length is 50 cm. Materials are filled into the column cell and are gently compacted to the required density (1.45–1.47 g/cm3). Heating was supplied at the cell bottom while the top is connected to the hydration system which permits water permeation towards the EBS material. Insulation layers were added during the course of the experiments to reduce the lateral heat loss around the cell. Three sensors for the measurement of relative humidity and temperature were installed to different depths (10, 22 and 40 cm from the heater, respectively).
4.2. Modelling Approach
A model was established with COMSOL multiphysics (version 6.1), as shown in Figure 7b. Assuming symmetry along the vertical axis, only one angular section was represented, with symmetry boundaries imposed on the vertical sides. Initial conditions and boundary conditions are consistent with those in the experiments that were detailed by Villar et al. [35].
The heating phase imposed a stepwise temperature increase at the heater plate from ambient temperature (22.5 °C) to 100 °C, followed by a later step (from 100 to 140 °C). This is the expected maximum temperature reached in the area surrounding the waste containers ([36,37]). The heating phase lasts for 3692 h for the SB column. The temporal heating profile is provided in Figure 8a.
According to [35], there was some unintended water leakage into the soil column from the top boundary during the initial period of the experiment. To take into account this incident in the model, we included a pre-heating infiltration as a mass flux from the top boundary (Figure 8b). The duration of this pre-heating infiltration is 160 h before the heating phase begins at = 0.
The soil column had insulation on its sides, However, the insulation was imperfect, resulting in some heat loss. To capture this heat loss in the model, we introduced natural heat convection on the sides of the column, as depicted in Figure 9a,b. As we anticipated a greater heat gradient between the inside and outside of the column near the bottom where the heater was located, we used an enhanced heat transfer coefficient for the bottom section (z ≤ 20 cm) in Figure 9a, and a lower value for the z > 20 cm area in Figure 9b. Both figures showed a sharp decline in the heat transfer coefficient after 1600 h, resembling the time when the insulation material is upgraded [35].
Based on the nature of the experiment, the governing Equations (1), (2) and (4) are directly applicable. The parameters of the equations are described as follows.
4.2.1. Soil Water Characteristic Curve (SWCC) and Relative Permeability (kr)
In this study, we adopted the Brooks and Corey model [23] where the model parameters, including the air-entry value (α), n and l, are provided by Nguyen et al. [16] and are listed in Table 2. The suction degree of the saturation relationship is described below and displayed in Figure 10.
From the Brooks and Corey model, the relative permeability takes the form:
λ is reported to be equal to 10 for BS mixture [37]. For the simulation in this study, the value of λ is assigned by default as
4.2.2. Thermal Conductivity and Specific Heat Capacity
4.2.3. Theory of Vapour Transport in Porous Media
The term in Equation (3) is the flow of water vapour due to thermal gradients and pressure gradients and was proposed by Phillips and de Vries [39]. While the liquid water () is assumed to migrate by advection and obey Darcy’s law, the water vapour flux is, on the other hand, assumed to migrate by diffusion and be driven by thermal gradient and pressure gradient. The rate of water vapour diffusion is given as [39]:
where the diffusivity coefficient due to pressure gradient () and thermal gradient () are expressed as:
with the parameter of vapour diffusion coefficient is a function of degree of saturation and expressed as:
in which the free diffusion coefficient of water vapour in the atmosphere () at different temperature (T[K]) is expressed as [40]:
The relative humidity () in the pore space is related to matric suction and temperature in the form of the Kelvin’s equation:
The density of vapour () at a certain suction and temperature is then related to by definition as (see, e.g., [41])
in which the density of saturated vapour density can be defined in terms of a polynomial function of temperature (T[K]) based on data published by [42] as:
The summary of necessary parameters for the numerical simulation are listed in Table 2. In Table 2, the thermal diffusivity enhanced factor needed some fine-tuning based on [43]. As discussed above, most other parameters such as porosity, permeability, water retention characteristics (Brooks and Corey) are derived from experimental measurements, while physical constants and functions are well established values available from physics databases (e.g., water compressibility and density, molecular weight, …).

Table 2.
Input parameters for the numerical simulation of the BS column test.
| Parameter | Value | Unit |
|---|---|---|
| Porosity (n) | 0.463 | - |
| Compressibility of fluid (χf) | 4 × 10⁻¹⁰ | 1/Pa |
| Compressibility of solid (χp) | 1 × 10⁻⁸ | 1/Pa |
| Density of water | 1000 | kg/m3 |
| Initial negative pore pressure (suction) | −1.08 × 10⁸ | Pa |
| Tortuosity factor | 0.5 | - |
| Molecular weight of water | 18 × 10−3 | kg/mol |
| Ideal gas constant | 8.314 | J/mol/K |
| Gas constant for vapour | 461.5 | J/kg/K |
| Thermal diffusivity enhanced factor | 4 [43] | - |
| Brook and Corey parameters: | ||
| α | 8.92 × 10⁻³ | mH2O−1 |
| n | 0.55 | - |
| l | −1.37 | - |
| Saturated permeability (kij) | 1 × 10⁻¹⁹ | m2 |
4.3. Results
The modelling results of temperature and relative humidity (RH) are compared to the laboratory column tests in Figure 12a,b while the relevant model-based results of pore water pressure and degree of saturation are shown in Figure 12c,d. In Figure 12, the solid lines indicate simulated results while square and triangle symbols refer to measured data. The good agreement with each other indicates a satisfying validation has been achieved in this study.
Regarding the temperature changes (Figure 12a), there is a more significant increase observed in the lower part of the soil (e.g., sensor 3) where the heater is located. When the first heat spike of 100 °C was introduced, the temperature in the soil column immediately shifted from 22.5 to around 34 °C, then remained constant before experiencing an increase up to 42 °C which corresponds to the upgrade of insulator material. Then, the soil temperature jumped to 52 °C as a result of the second heat surge (140 °C).
As a result of the heating, the liquid water of soil sample in proximity to the heater is vaporized, which is reflected by a boost in RH (red line in Figure 12b). Still, due to the vapour transport mechanism where the humidity is driven by heat and moves toward the colder region, this RH increase quickly diminishes and gradually declines. The vapour transport mechanism brings water vapour upward, which results in the consistent increase in RH in sensors 2 and 1 (green and blue lines, respectively, in Figure 12b) before reaching an equilibrium value at about 80%. It is worth noting in Figure 12b that there was not a perfect match in RH between the model and readings in sensor 1 (blue line). This is thought to be caused by the disturbance of water leakage into the soil during the initial period of the experiment.
5. Scoping Analysis of THM-Solute Transport Coupling
Solute transport in porous media has been investigated intensively in the last few decades; however, research that couple solute transport to THM processes are much less active. Thus, the main purpose of this section is to explore the influence of coupled THM processes on solute transport within porous media. To achieve this, we performed scoping analyses from a simplified model inspired from an ongoing solute thermodiffusion experiment conducted in the Tournemire Underground Research Lab (URL), located 20 m beneath the surface in Southern France. As there are currently no published findings regarding this specific experiment, we rely on all available information provided by the IRSN (Institut de Radioprotection et de Sûreté Nucléaire) and make assumptions regarding model parameters to conduct this research.
The experiment involves a primary vertical borehole (BH1), which measures 100 cm in diameter and has a depth of 300 cm, drilled into argillaceous sedimentary rock that contains test water and a system of observation boreholes (PP1, PP2, PP3 and PP4 located 10, 20, 30 and 50 cm, respectively, away from BH1). Within this main borehole, there is test water containing specific solutes (e.g., Cl−, Br−, I−) at concentrations of 500, 50 and 50 mol/m3, respectively. These concentrations are chosen to create a sufficiently high chemical gradient to be observed in core samples compared to the background concentrations in the porewater of the clayrock. To maintain a consistent temperature of 80 °C, the water is continuously heated using heaters (Figure 13a).
Over time, it is anticipated that the water carrying solute species will penetrate into the surrounding formation through two main mechanisms: (1) convection (advection) driven by Darcy’s flow and (2) diffusion caused by concentration gradients of the species. Additionally, dispersion, another factor influencing solute transport, could be taken into account. However, to simplify the analysis, we assumed a homogeneous media with a constant, low permeability and minimal variation in fluid velocity, making the dispersion term negligible.
The Soret effect, also known as thermal diffusion effect, which involves the transport of solutes due to thermal gradients, can also be considered. However, it seems to have little impact on the solute transport behaviour [44]. As a result, this study focuses solely on investigating the influence of temperature on solute transport behaviour without considering the Soret effect, although a thorough assessment of this effect is beneficial to comprehend such influence.
In this scoping analysis, a simplified model is represented in Figure 13c,d. The full set of governing Equations (1), (2), (4) and (5) is applicable to this situation. For this scoping analysis we assume that the medium is fully saturated and linearly elastic. And they simplify to the following:
To investigate how coupled THM processes affect solute transport in our research, we aim to contrast changes in concentration under two scenarios: (1) solute transport driven by diffusion alone (referred to as case C1) and (2) solute transport which considers fully coupled THM processes (referred to as case C2). The equations that govern case C2 are the equations in set 11, whereas for case C1, only the diffusion-driven solute transport is considered, which reads:
The boundary conditions for cases C1 and C2 are presented in Figure 13c,d, respectively. In both scenarios, the displacement is exclusively constrained to the left boundary and an assumed solute concentration gradient of the solute was applied, extending from the left to the right boundary. The initial pore pressure of 0.2 MPa applied in case C2 corresponds to the ambient pore pressure. It is worth noting that even though a water column of 0.5 m exists at the borehole wall, which exerts pressure on the ambient formation, this aspect is considered negligible. Furthermore, since the primary objective of this study is to underscore the impact of coupled THM processes on solute transport, we omitted this component for the sake of simplification. The governing equations described, together with the assumed initial and boundary conditions, were numerically solved using the finite element method. The 2D axis-symmetrical models were developed in COMSOL Multiphysics with the corresponding initial and boundary conditions. The size of the model was carefully chosen to ensure the attainment of a steady-state condition, thereby obtaining reliable results. The THM properties required for input to the model were gathered from various published and unpublished sources. The input data are presented in Table 3.
The concentration changes observed at different positions (PP1, PP2, PP3, PP4) for scenarios C1 and C2 are shown in Figure 14 using solid and dashed lines, respectively. For the remainder of this paper, it is established that solid lines denote case C1, whereas the dashed lines depict case C2 in order to facilitate clarity and comprehension.
As illustrated in Figure 14, we observed a slight decrease in concentration under condition C2 near the main borehole wall (PP1, indicated by the blue lines). This disparity gradually diminishes over time. For positions farther away from the borehole wall, such as PP2, PP3 and PP4, the concentration remains almost identical under both conditions. The variance in concentration can be attributed to the involvement of advective flux in case C2, brought about by Darcy’s flow resulting from overpressure arising from the differential volume expansion of pore fluid and solid materials—akin to the discussion in earlier sections. The mechanism under this concentration disparity can be elucidated by exploring the interplay between the magnitude of advective, diffusive and total flux, as elaborated upon below.
The total flux, diffusive flux and concentration gradient profiles under both conditions C1 and C2 are illustrated in Figure 15a–c, respectively. Also, advective flux in case C2 is shown in Figure 15d. It can be seen from Figure 15b,d that the advective flux magnitude in case C2 is extremely minor comparing to the diffusive flux magnitude (for example, the highest magnitude of advective flux is in the order of 1 × 10⁻¹² while that of the diffusive flux is 1 × 10⁻⁸). This is evident since the rock medium permeability is extremely low (k = 5 × 10⁻¹⁹ m2). This pronounced dominance of diffusive flux leads to the diffusive flux (indicated by dashed lines in Figure 15b) and the total flux (also indicated by dashed lines in Figure 15a) being practically indiscernible.
By comparing diffusive flux magnitude between two cases (Figure 15b), we observed that although having the same diffusion coefficient, the values of diffusive flux are lesser in case C2 than case C1. This phenomenon can be explained as the impact of advective flux, which is a result of thermally induced pressure build-up. That is, the introduction of advective flux alters the concentration gradient, subsequently affecting the diffusive flux magnitude since diffusion is driven by the concentration gradient. This argument is strengthened by the similarity in disparity between dashed lines and solid lines of concentration gradient (Figure 15c) and diffusive flux (Figure 15d).
Furthermore, the reasoning behind the reduction in concentration when heat transfer is taken into account can be explained by the boundary conditions established in our model. Specifically, due to the presence of open drain boundaries on both the left and right sides of the model (depicted in Figure 13c), fluid movement is permitted in both directions. This implies that the nuclide can be transported either toward the right boundary or backward to the source. Figure 16a,b present the development of pressure and the Darcy velocity field relative to the radial distance from BH1. As indicated by Figure 16b, the velocity field exhibits negative values in close proximity to the borehole wall, signifying backward flow, with absolute magnitudes relatively higher than those of the forward flow (positive velocity). Similarly, Figure 16a reveals a steeper pressure gradient closer to the left boundary. These observations highlight the intensity of the backward flow, causing the lower concentration in case C2 in comparison to case C1.
In a nutshell, it can be concluded that the very small concentration difference between the two cases stems of the existence of a small the advective flux results in the coupled THM case. Additionally, due to the implementation of free drain boundary conditions, this advective flux transports the nuclide backward to the source, thus diminishing the recorded solute concentration at locations proximate to the borehole. However, this effect caused by the advective flux gradually diminishes over time and space. Due to the very low permeability of the clayrock, solute transport remains diffusion-dominant despite the high transient pore pressure gradients induced by THM effects. It is anticipated that the influence of THM effects would become important when the damage and fracturing of the rock occurs. The current scoping analysis only considers linear elastic behaviour; therefore, it cannot account for the above possibilities. A comprehensive and thorough analysis of thermo-diffusion at the Tournemire site has been undertaken by the authors. This analysis will be further substantiated and validated as additional experimental data to become available in the future. The examination will encompass the following key aspects: (i) anisotropy due to bedding; (ii) damage susceptibility of the clayrock; and (iii) Soret effects.
6. Conclusions
Ensuring the safety of deep geologic repositories (DGRs) is critical for the long-term management of spent nuclear fuel from electricity generation. To achieve this, a multi-barrier system, consisting of the host rock formation and an engineered barrier system, is implemented in the design of the facility. The assessment of DGR safety needs to evaluate the influence of thermal–hydraulic–mechanical–chemical (THMC) processes that occur in the DGRs’ on the long-term performance of the multi-barrier system.
This paper presents a review of the THMC-coupled processes that occur in the porous media, along with a mathematical model governing such interactions. To build confidence in the performance of the model, it is compared against established analytical solutions for 1D Terzaghi consolidation and thermal consolidation around a point heat source problem. Furthermore, the model is partially validated in terms of TH-coupled processes in unsaturated media using measured data from a thermal diffusion experiment conducted in a sand–bentonite column. Finally, scoping analyses were performed to assess the influence of THM-coupled processes on solute transport.
The model’s results show close agreement with analytical solutions and experimental data. This confirms the model’s potential for reliably simulating coupled processes in the near field of a DGR. The mathematical framework presented herein is promising and is the first phase of a multi-year research program at the CNSC that includes experimental work combined with the development, calibration and validation of the current model in an iterative manner. Future endeavours include, among others, heterogeneity; plasticity; the swelling characteristics of compacted bentonite under chemical and thermal gradients; thermodiffusion; thermal and chemical osmosis; and last but not least, the multiple porosity nature of bentonite-based buffer material.
Author Contributions
Conceptualization, U.V., M.F., J.Á.I.S., T.S.N.; methodology, U.V., M.F., J.Á.I.S., T.S.N.; software, M.F., T.S.N.; validation, U.V., M.F., J.Á.I.S., T.S.N.; analysis, U.V., T.S.N.; investigation, U.V., T.S.N.; resources, M.F., T.S.N.; data curation, T.S.N.; writing—original draft preparation, U.V.; writing—review and editing, M.F., J.Á.I.S., T.S.N.; supervision, M.F., J.Á.I.S., T.S.N.; project administration, M.F., T.S.N.; funding acquisition, M.F., T.S.N. All authors have read and agreed to the published version of the manuscript.
Funding
This research was funded by the Canadian Nuclear Safety Commission’s research project RSP-691.8.
Data Availability Statement
Data are contained within this article.
Acknowledgments
The authors sincerely thank the Institut de Radioprotection et de Sûreté Nucléaire (IRSN), in particular Jean-Michel Matray and Maïwenn Humbezi-Desfeux, for providing details of the experimental setup and the preliminary experimental results of the thermodiffusion experiment which was discussed in this paper.
Conflicts of Interest
The authors declare no conflict of interest.
References
- NWMO. Deep Geological Repository Conceptual Design Report Crystalline/Sedimentary Rock Environment. NWMO Report APM-REP-00440-0015 R001. 2016. Available online: https://www.nwmo.ca/en/Reports (accessed on 1 May 2023).
- Nuclear Waste Management Organization (NWMO). Confidence in Safety—South Bruce Site; Report NWMO-TR-2022-12; Nuclear Waste Management Organization (NWMO): Toronto, ON, Canada, 2022. [Google Scholar]
- Nguyen, T.S. Thermo-Hydro-Mechanical-Chemical processes in geological disposal of radioactive waste—An example of reg-ulatory research. Adv. Geo-Energy Res. 2018, 2, 173–189. [Google Scholar] [CrossRef]
- Chijimatsu, M.; Fujita, T.; Sugita, Y.; Taniguchi, W. Evaluation of Couple Thermohydro-Mechanical Phenomena in the Near Field for Geological Disposal of High-Level Radioactive Waste. No. JNC-TN-8400-2000-008. Japan Nuclear Cycle Development Institute. 2000. Available online: https://inis.iaea.org/search/search.aspx?orig_q=RN:31062628 (accessed on 1 May 2023).
- Nguyen, T.S.; Selvadurai, A.P.S. Coupled thermal-hydraulic- mechanical processes in a cylindrical cavity in rock. In NUMOG VI: Proceedings of the International Symposium on Numerical Models in Geomechanics, Montreal, QC, Canada, 2–4 July 1997; Pande, G.N., Pietruszczak, S., Eds.; A.A. Balkema: Leiden, The Netherlands, 1997; pp. 315–324. [Google Scholar]
- Pintado, X.; Autio, J.; Punkkinen, O. On the behaviour of compacted bentonite under thermal gradients. Phys. Chem. Earth 2011, 36, 1799–1805. [Google Scholar] [CrossRef]
- Schanz, T.; Long, N.T.; Datcheva, M. A Column experiment to study the thermo-hydro-mechanical behaviour of expansive soils. Rock Mech. Rock Eng. 2013, 46, 1287–1301. [Google Scholar] [CrossRef]
- Selvadurai, A. Heat-induced moisture movement in a clay barrier: 2. Computational modelling and comparison with experimental results. Eng. Geol. 1996, 41, 219–238. [Google Scholar] [CrossRef]
- Gens, A.; Sánchez, M.; Guimarães, L.D.N.; Alonso, E.E.; Lloret, A.; Olivella, S.; Villar, M.V.; Huertas, F. A full-scale in situ heating test for high-level nuclear waste disposal: Observations, analysis and interpretation. Géotechnique 2009, 59, 377–399. [Google Scholar] [CrossRef]
- Villar, M.; Lloret, A. Influence of temperature on the hydro-mechanical behaviour of a compacted bentonite. Appl. Clay Sci. 2004, 26, 337–350. [Google Scholar] [CrossRef]
- Fall, M.; Nasir, O.; Nguyen, T. A coupled hydro-mechanical model for simulation of gas migration in host sedimentary rocks for nuclear waste repositories. Eng. Geol. 2014, 176, 24–44. [Google Scholar] [CrossRef]
- Nasir, O.; Fall, M.; Nguyen, T.; Evgin, E. Modelling of the hydro-mechanical response of sedimentary rocks of Southern Ontario to past glaciations. Eng. Geol. 2011, 123, 271–287. [Google Scholar] [CrossRef]
- Nasir, O.; Fall, M.; Nguyen, T.S.; Evgin, E. Modeling of the thermo-hydro-mechanical-chemical response of Ontario sedimentary rocks to future glaciations. Can. Geotech. J. 2015, 52, 836–850. [Google Scholar] [CrossRef]
- Abdi, H. Mechanical and Hydromechanical Behavior of Host Sedimentary Rocks for Deep Geological Repository for Nuclear Wastes. Ph.D. Thesis, University of Ottawa, Ottawa, ON, Canada, 2014. [Google Scholar]
- Nguyen, T.S. Computational Modelling of Thermal-Hydological-Mechanical Processes in Geological Media. Ph.D. Thesis, McGill University, Montreal, QC, Canada, 1995. [Google Scholar]
- Nguyen, T.S.; Li, Z.; Garitte, B.; Barnichon, J.D. Modelling a heater experiment for radioactive waste disposal. Environ. Geotech. 2019, 6, 87–100. [Google Scholar] [CrossRef]
- Dagher, E.E.; Nguyen, T.S.; Sedano, J.A.I. Development of a mathematical model for gas migration (two-phase flow) in natural and engineered barriers for radioactive waste disposal. Geol. Soc. Lond. Spéc. Publ. 2018, 482, 115–148. [Google Scholar] [CrossRef]
- Li, Z.; Su, G.; Zheng, Q.; Nguyen, T.S. A dual-porosity model for the study of chemical effects on the swelling behaviour of MX-80 bentonite. Acta Geotech. 2020, 15, 635–653. [Google Scholar] [CrossRef]
- Gens, A.; Vaunat, J.; Garitte, B.; Wileveau, Y. In situ behaviour of a stiff layered clay subject to thermal loading: Observations and interpretation. Géotechnique 2007, 57, 207–228. [Google Scholar] [CrossRef]
- Nguyen, T.; Selvadurai, A.; Armand, G. Modelling the FEBEX THM experiment using a state surface approach. Int. J. Rock Mech. Min. Sci. 2005, 42, 639–651. [Google Scholar] [CrossRef]
- Nguyen, T.S.; Li, Z.; Le, D.A. Constitutive model development and field simulation of excavation damage in bedded argillaceous rock. Eur. J. Environ. Civ. Eng. 2020, 27, 2850–2871. [Google Scholar] [CrossRef]
- van Genuchten, M.T. A closed-form equation for predicting the hydraulic conductivity of unsaturated soils. Soil Sci. Soc. Am. J. 1980, 44, 892–898. [Google Scholar] [CrossRef]
- Brooks, R.H.; Corey, A.T. Properties of Porous Media Affecting Fluid Flow. J. Irrig. Drain. Div. 1996, 92, 61–90. [Google Scholar] [CrossRef]
- Terzaghi, K. Die Berechnung der Durchlassigkeitsziffer des Tones aus Dem Verlauf der Hidrodynamichen Spannungs-er-scheinungen Akademie der Wissenschaften in Wien. Math.-Naturwissen-Schaftliche Kl. Sitzungsberichte Ab-Teil. IIa 1923, 132, 125–138. [Google Scholar]
- Booker, J.R.; Savvidou, C. Consolidation around a point heat source. Int. J. Numer. Anal. Methods Géoméch. 1985, 9, 173–184. [Google Scholar] [CrossRef]
- Zheng, X.; Pisano, F.; Vardon, P.J.; Hicks, M.A. An explicit stabilized material point method for coupled hydromechanical problems in two-phase porous media. Comput. Geotech. 2021, 135, 104–112. [Google Scholar] [CrossRef]
- Jeremić, B.; Cheng, Z.; Taiebat, M.; Dafalias, Y. Numerical simulation of fully saturated porous materials. Int. J. Numer. Anal. Methods Géoméch. 2008, 32, 1635–1660. [Google Scholar] [CrossRef]
- Bandara, S.; Soga, K. Coupling of soil deformation and pore fluid flow using material point method. Comput. Geotech. 2014, 63, 199–214. [Google Scholar] [CrossRef]
- Das, B.M.; Sivakugan, N. Fundamentals of Geotechnical Engineering, 5th ed.; Cengage Learning: Boston, MA, USA, 2017. [Google Scholar]
- Booker, J.; Savvidou, C. Consolidation around a spherical heat source. Int. J. Solids Struct. 1984, 20, 1079–1090. [Google Scholar] [CrossRef]
- Nguyen, T.S.; Selvadurai, A.P.S. Modelling of thermal consolidation of sparsely fractured rock in the context of nuclear waste management. In Mechanics of Poroelastic Media; Selvadurai, A.P.S., Ed.; Kluwer Academic Publisher: Dordrecht, The Netherlands, 1996; Volume 35, pp. 159–180. [Google Scholar]
- Chaudhry, A.A.; Buchwald, J.; Kolditz, O.; Nagel, T. Consolidation around a point heat source (correction and verification). Int. J. Numer. Anal. Methods Géoméch. 2019, 43, 2743–2751. [Google Scholar] [CrossRef]
- Gaus, I.; Wieczorek, K.; Mayor, J.C.; Trick, T.; García-Siñeriz, J.L.; Schuster, K.; Garitte, B.; Kuhlman, U. EBS behaviour immediately after repository closure in a clay host rock: The HE-E experiment (Mont Terri URL). In Proceedings of the 14th International Conference on Environmental Remediation and Radioactive Waste Management (ICEM’11), Reims, France, 25–29 September 2011. [Google Scholar]
- Ballarini, E.; Graupner, B.; Bauer, S. Thermal–hydraulic–mechanical behaviour of bentonite and sand-bentonite materials as sealfor a nuclear waste repository: Numerical simulation of column experiments. Appl. Clay Sci. 2017, 135, 289–299. [Google Scholar] [CrossRef]
- Villar, M.V.; Martín, P.L.; Romero, F.J. Long-Term THM Tests Reports: THM Cells for the HE-E Test: Update of Results until February 2014. CIEMAT Technical Report CIEMAT/DMA/2G210/03/2014. 2014. Available online: https://cordis.europa.eu/docs/projects/files/249/249681/long-term-thm-tests-reports-thm-cells-for-the-he-e-test-update-of-results-until-february-2014.pdf (accessed on 1 May 2023).
- Gaus, I.; Garitte, B.; Senger, R.; Gens, A.; Vasconcelos, R.; Garcia-Sineriz, J.-L.; Trick, T.; Wieczorek, K.; Czaikowski, O.; Schuster, K.; et al. Long-term Performance of Engineered Barrier Systems PEBS: The HE-E Experiment: Lay-out, Interpretation and THM Modelling. Narga Arbeitsbericht NAB 14-53. Nagra, Wettingen. 2014. Available online: https://www.pebs-eu.de/PEBS/EN/Downloads/D2_2_1_1.pdf?__blob=publicationFile&v=1 (accessed on 1 July 2023).
- Gaus, I.; Wieczorek, K.; Schuster, K.; Garitte, B.; Senger, R.; Vasconcelos, R.; Mayor, J.C. EBS Behaviour Immediately after Repository Closure in a Clay Host Rock: HE-E Experiment (Mont Terri URL); Geological Society; Special Publications: London, UK, 2014; Volume 400, pp. 71–91. [Google Scholar] [CrossRef]
- Baumgartner, P. Generic Thermal-Mechanical-Hydraulic (THM) Data for Sealing Materials—Volume 1: Soil–Water Relationships; Ontario Power Generation Report 06819-REP-01300-10122-R00; Ontario Power Generation, Nuclear Waste Management Division: Toronto, ON, Canada, 2006. [Google Scholar]
- Philip, J.R.; De Vries, D.A. Moisture movement in porous materials under temperature gradients. Trans. Am. Geophys. Union 1957, 38, 222–232. [Google Scholar] [CrossRef]
- Krischer, O.; Rohnalter, H. Wärmeleitung und Dampfdiffusion in Feuchten Gütern: Mit 4 Zahlentafeln; VDI-Verlag: Düsseldorf, Germany, 1940. [Google Scholar]
- Charlaix, E.; Ciccotti, M. Capillary Condensation in Confined Media. In Handbook of Nanophysics I: Principles and Methods, 1st ed.; Sattler, K.D., Ed.; CRC Press: Boca Raton, FL, USA; Taylor & Francis Group: Boca Raton, FL, USA, 2010; Volume 1, pp. 194–210. [Google Scholar]
- HYPERPHYSICS by Department of Physics and Astronomy, Georgia State University, Georgia State University, USA. Available online: http://hyperphysics.phy-astr.gsu.edu/hbase/Kinetic/watvap.html (accessed on 1 May 2023).
- Gu, L.; Ho, C.K.; Plumb, O.A.; Webb, S.W. Diffusion with condensation and evaporation in porous media. In Proceedings of the 7th AIAA/ASME Joint Thermophysics and Heat Transfer Conference, Alburquerque, NM, USA, 15–18 June 1998. [Google Scholar]
- Soler, J.M. The effect of coupled transport phenomena in the Opalinus Clay and implications for radionuclide transport. J. Contam. Hydrol. 2001, 53, 63–84. [Google Scholar] [CrossRef]
Figure 1.
Canadian concept of geological disposal (from [1]).
Figure 1.
Canadian concept of geological disposal (from [1]).
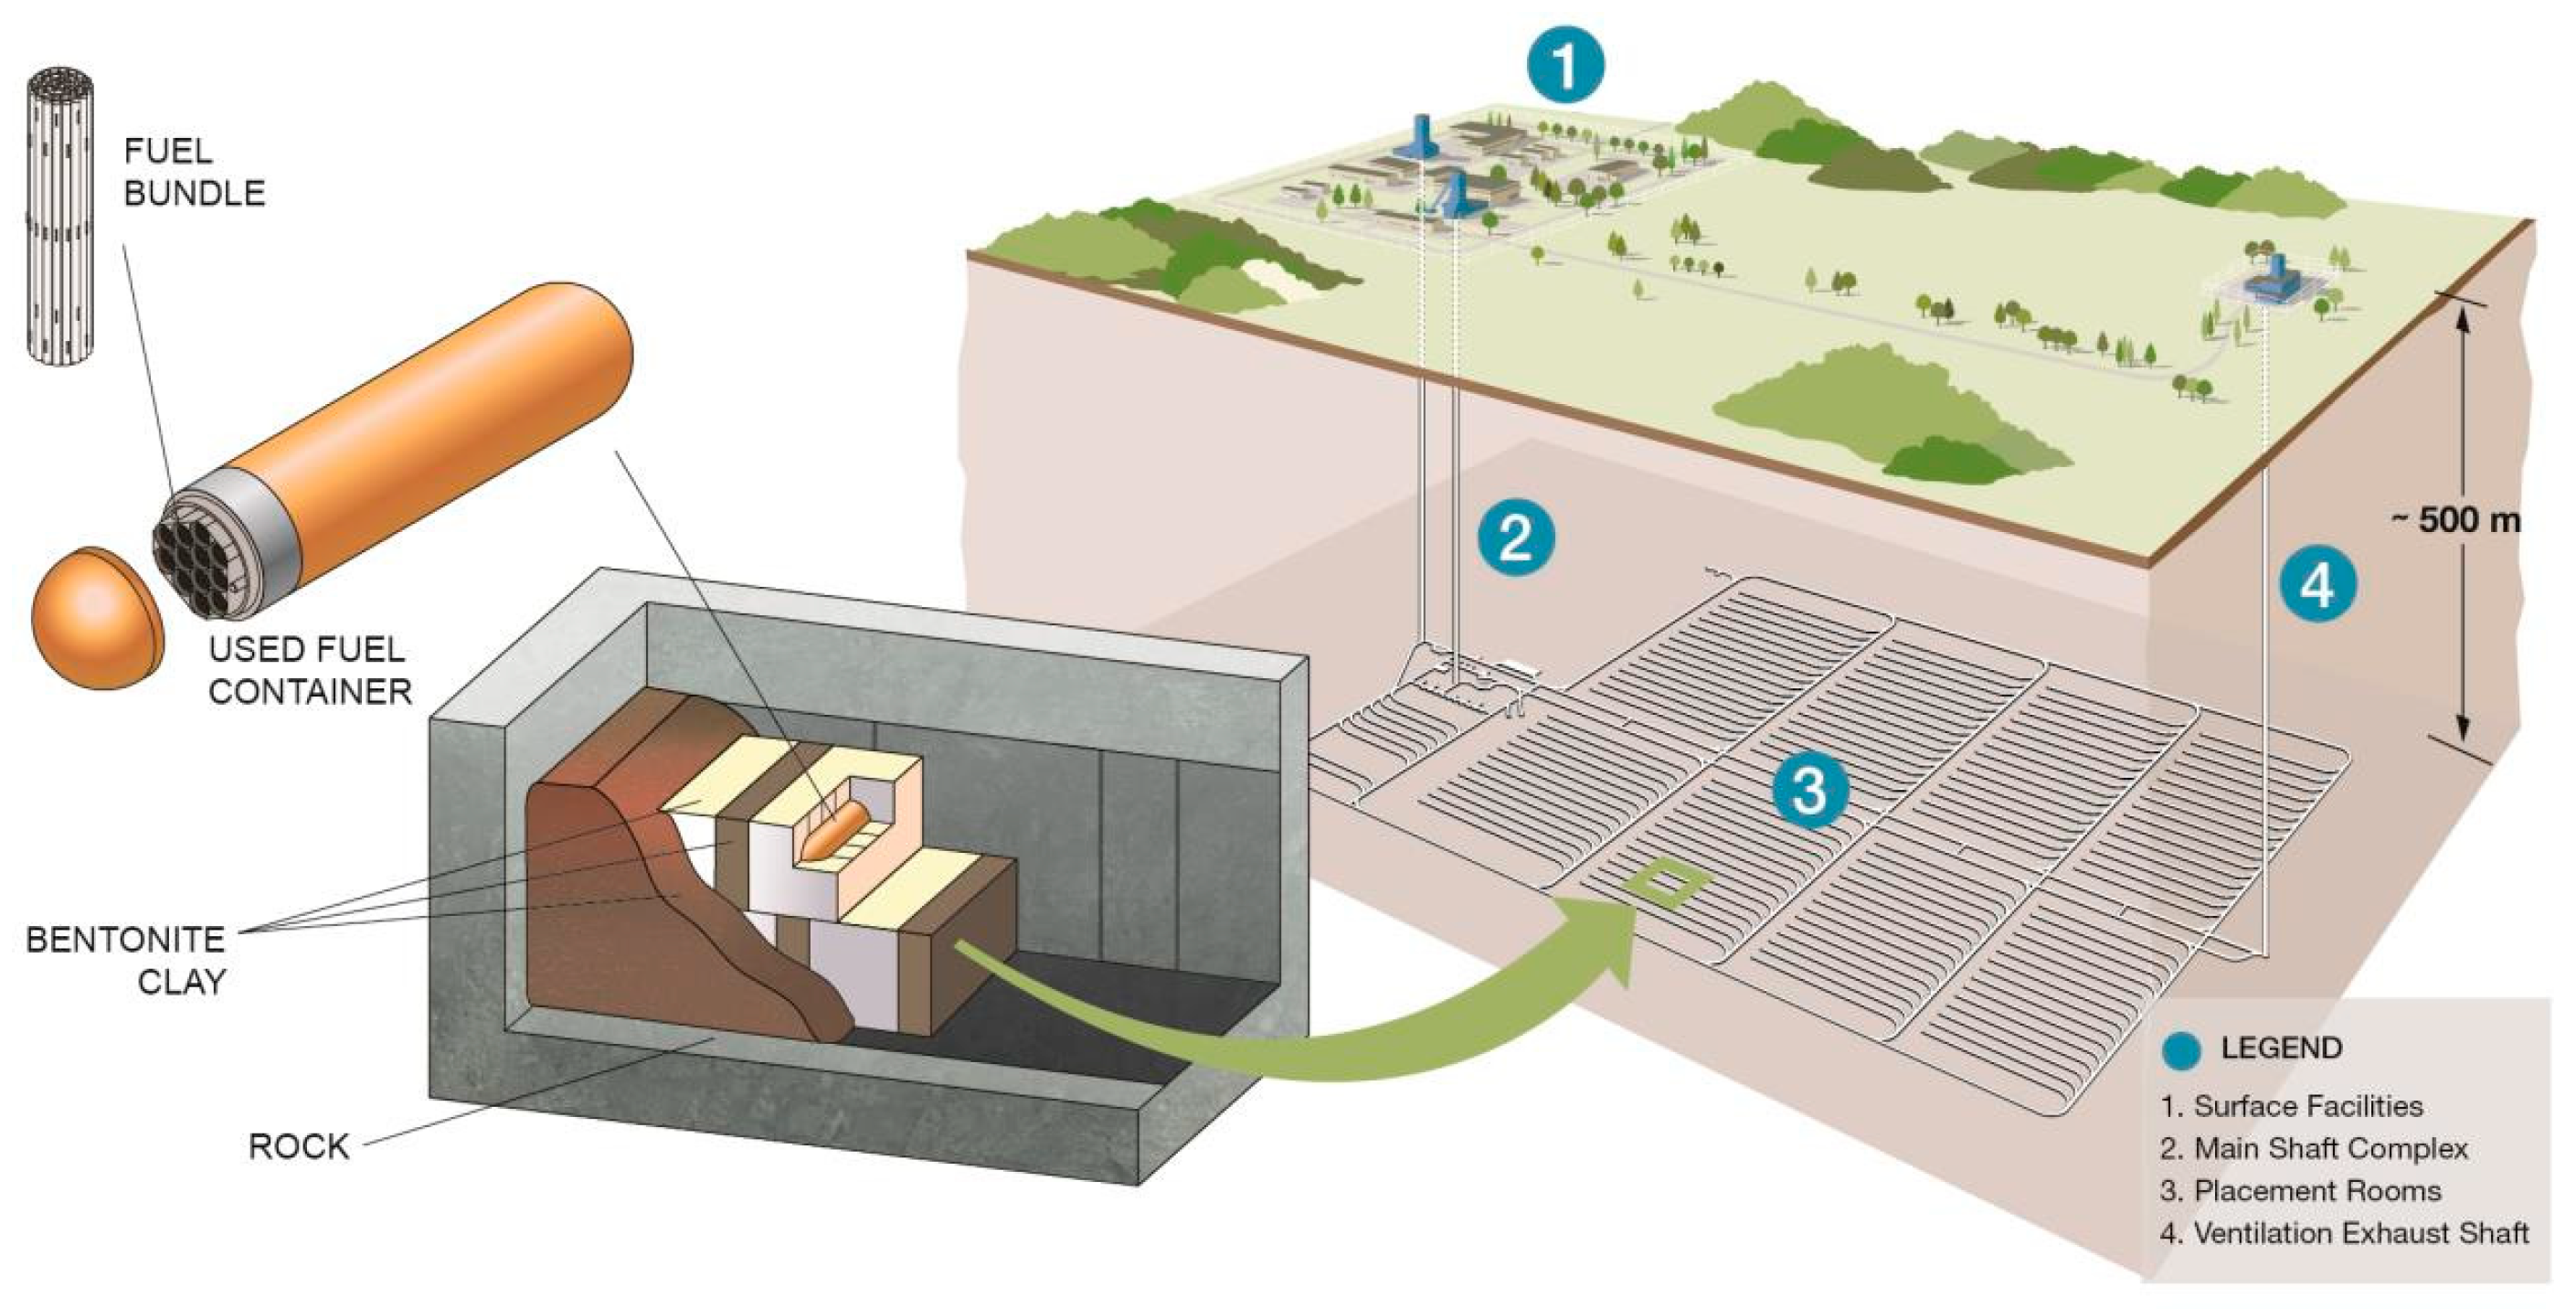
Figure 2.
Conceptualization of coupled multiphysics in the buffer and near-field.

Figure 3.
Finite element mesh and boundary conditions for 1D isothermal consolidation.
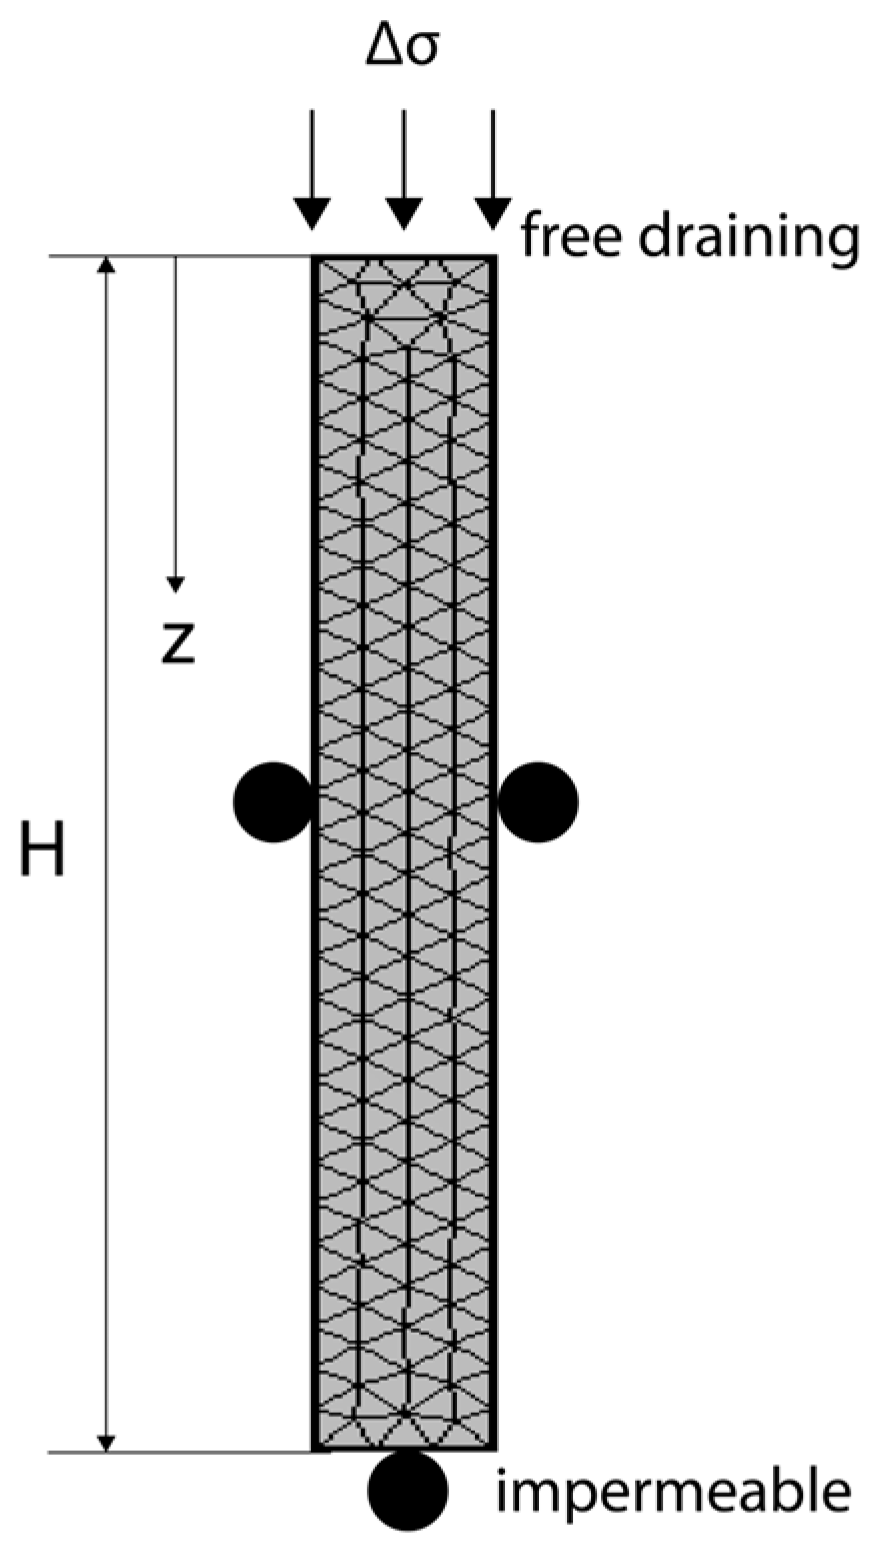
Figure 4.
Comparison between numerical and analytical results in (a) normalized pore pressure evolution at different depths and (b) vertical settlement at the surface.
Figure 4.
Comparison between numerical and analytical results in (a) normalized pore pressure evolution at different depths and (b) vertical settlement at the surface.
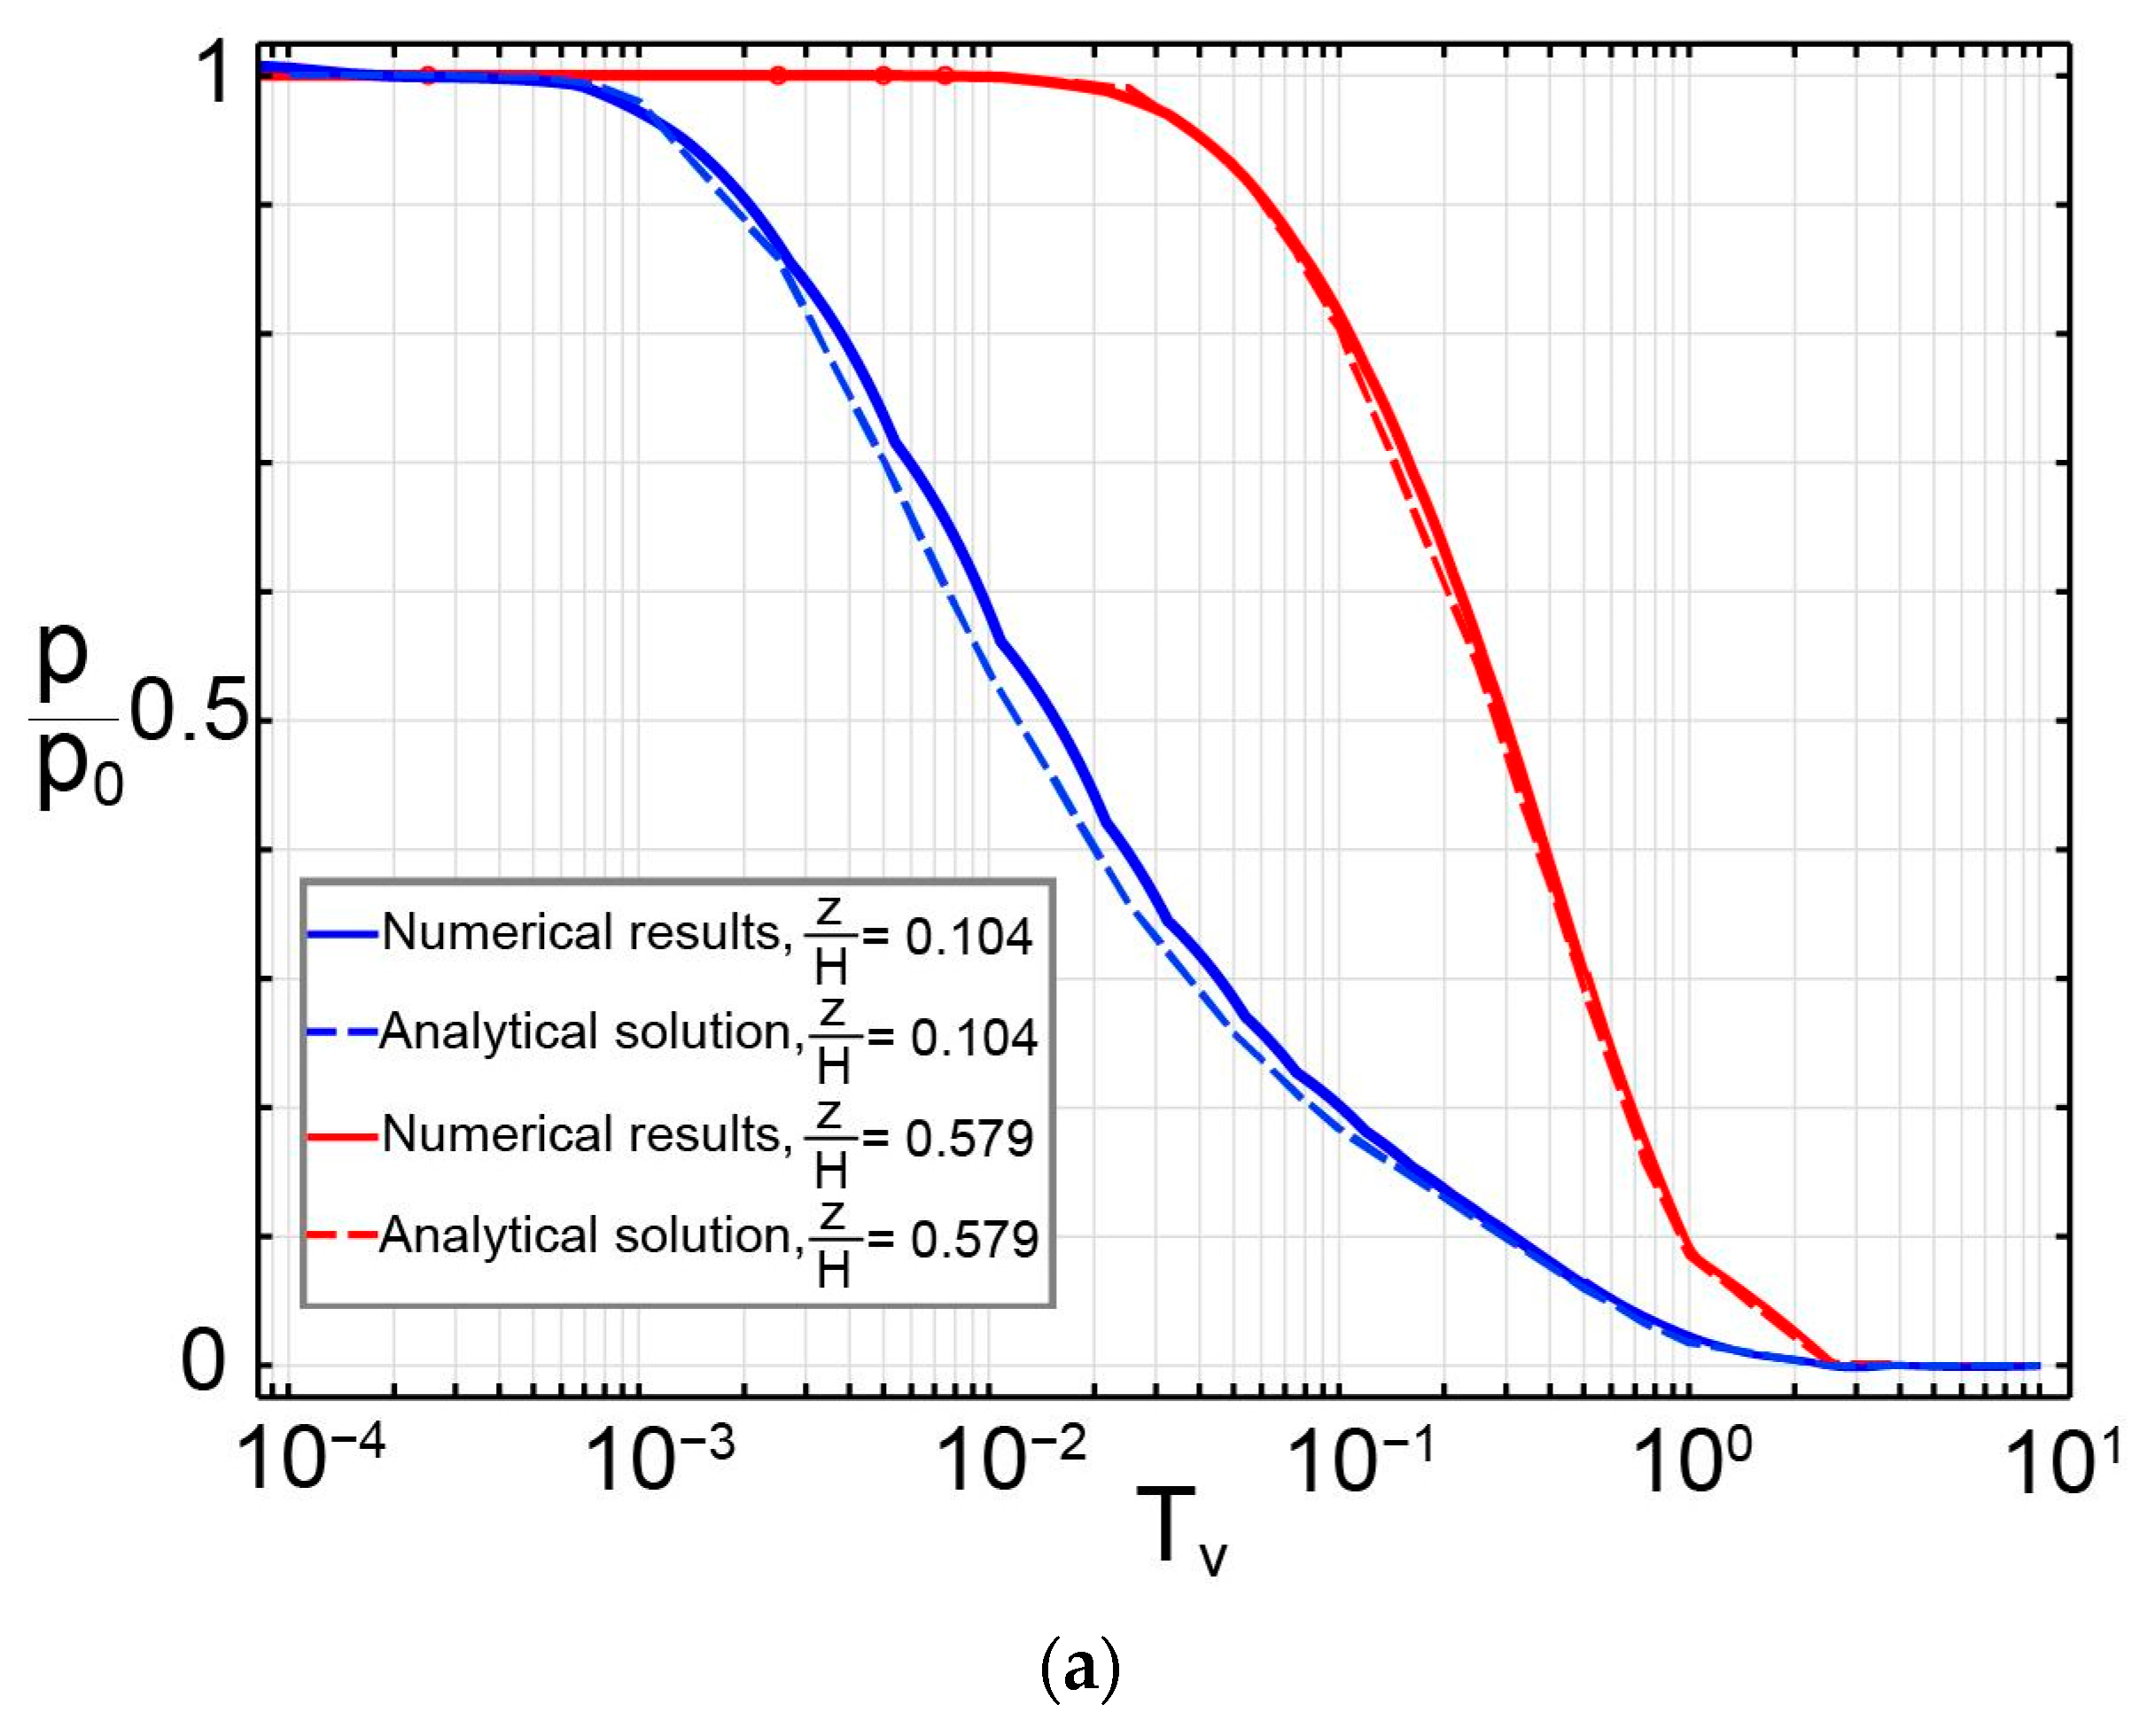
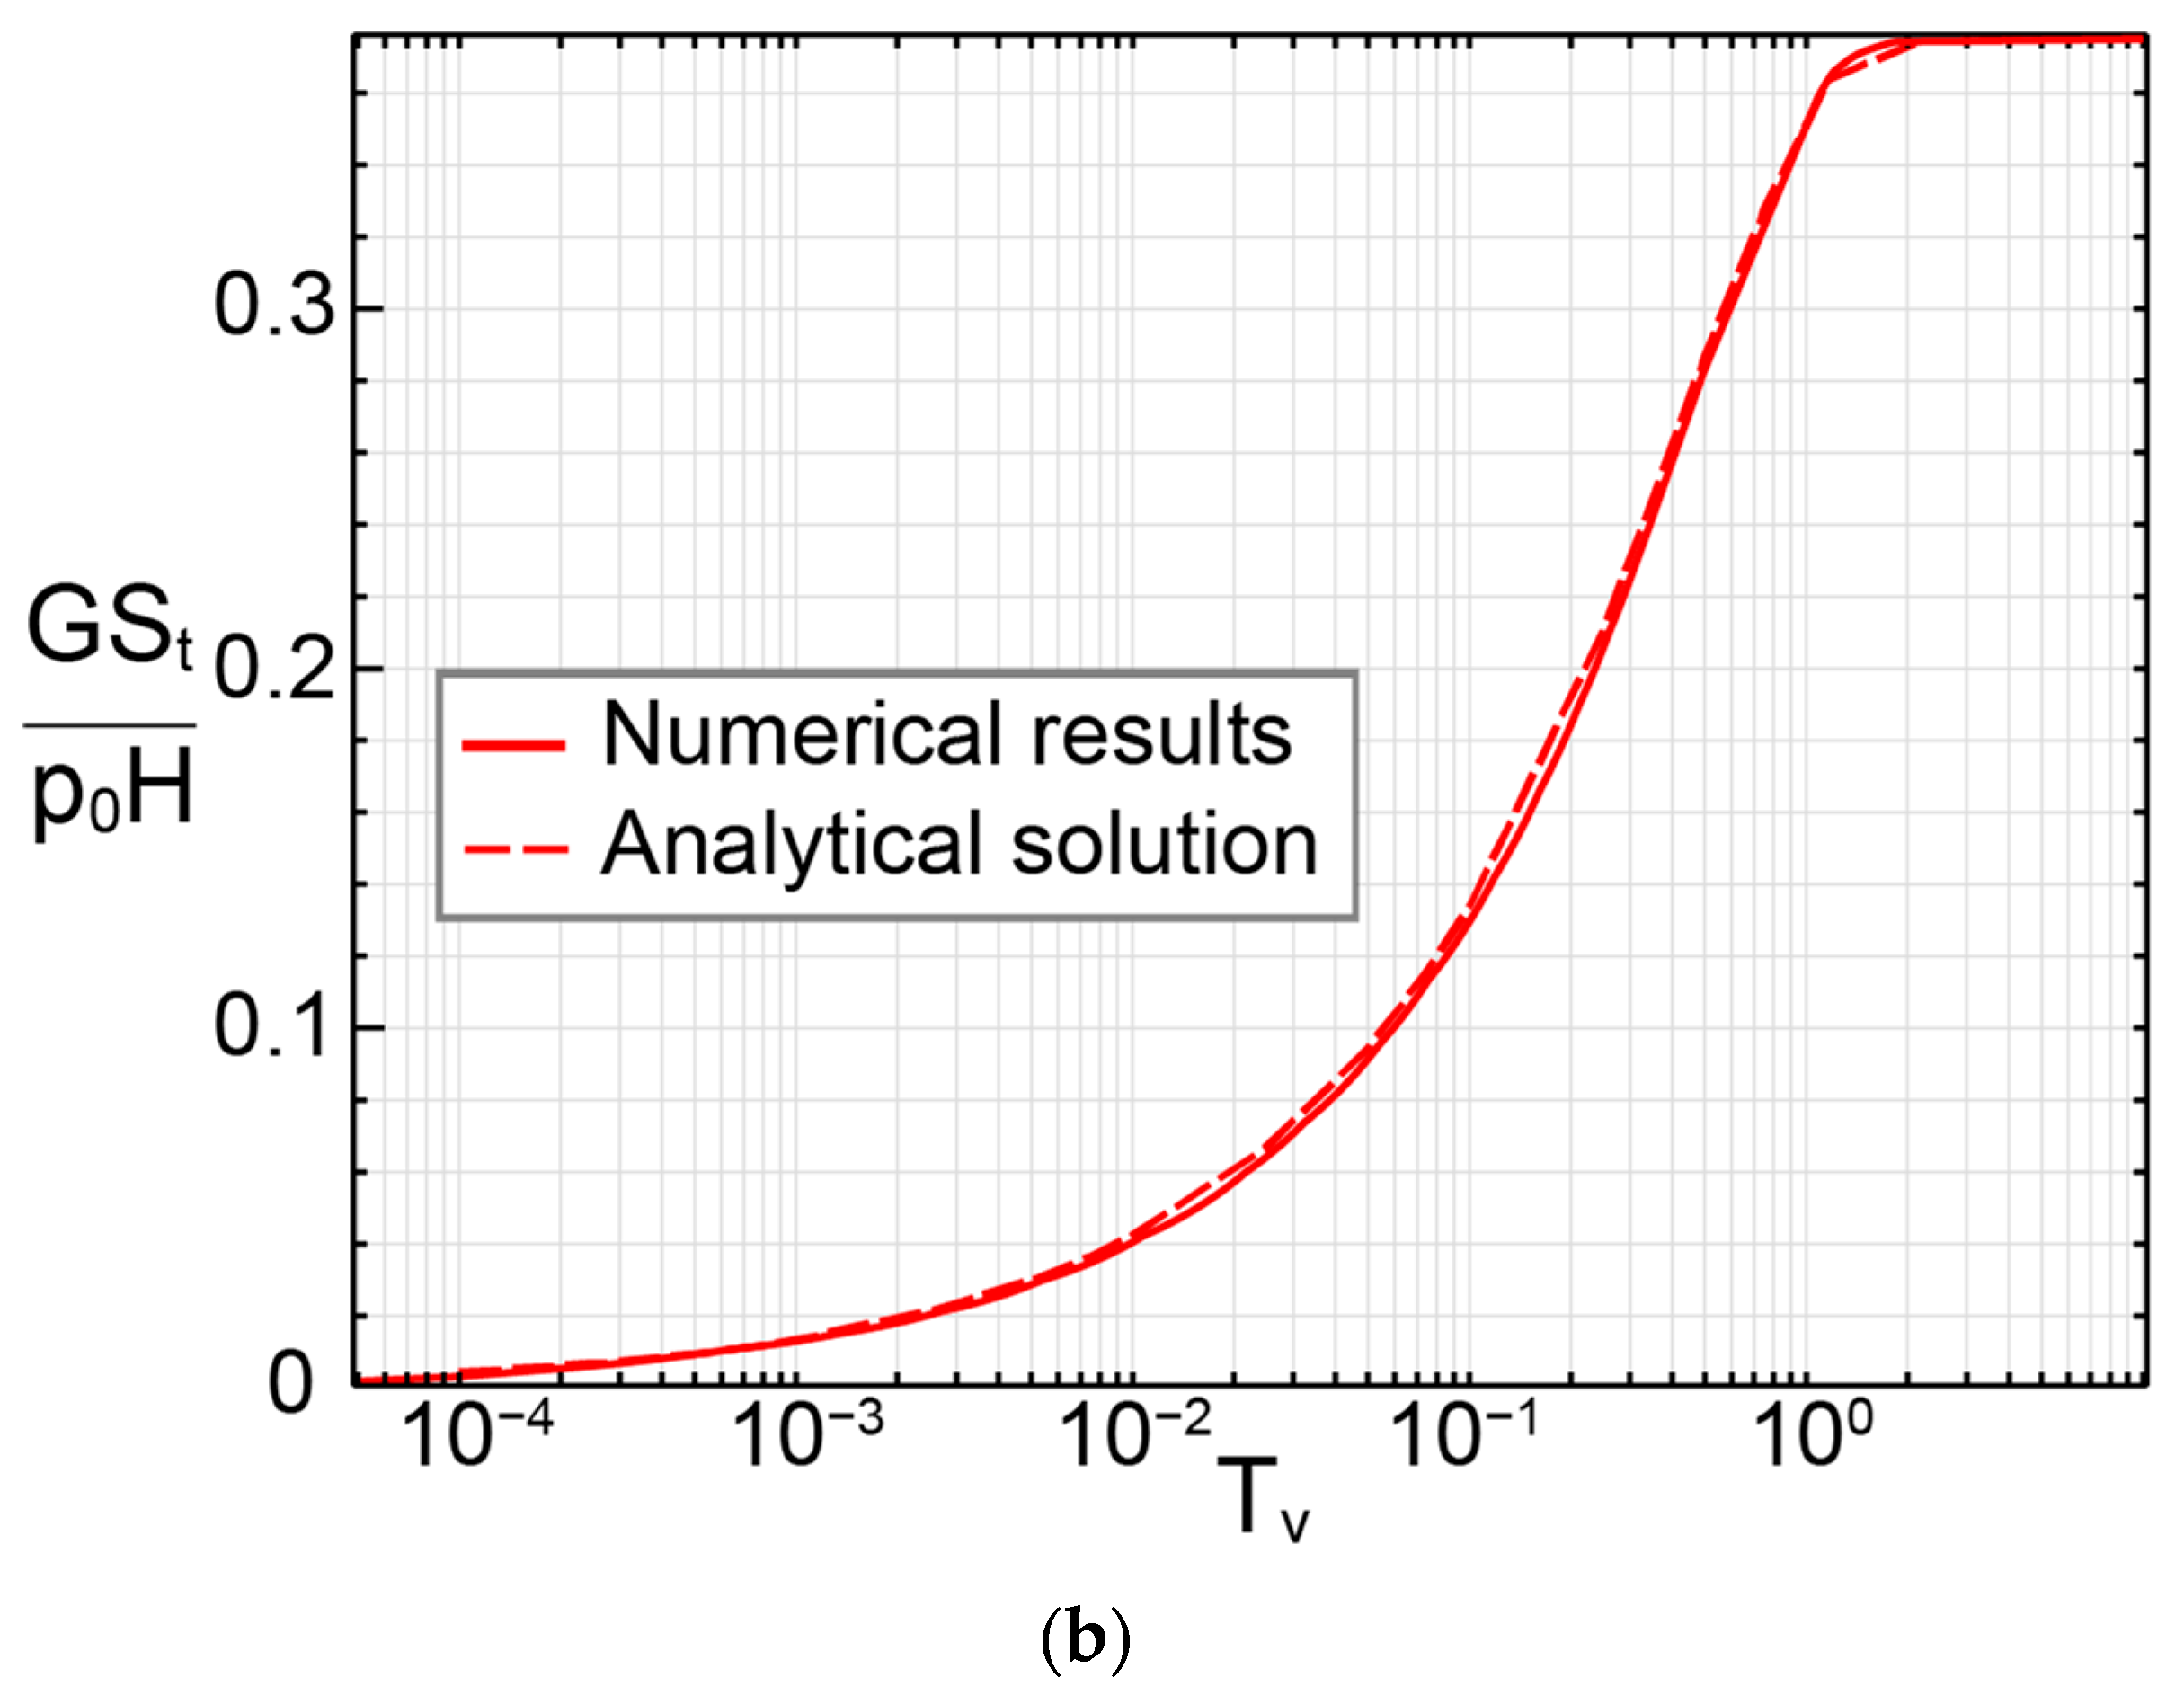
Figure 5.
Finite element mesh and boundary conditions for thermal consolidation around a point heat source problem.
Figure 5.
Finite element mesh and boundary conditions for thermal consolidation around a point heat source problem.

Figure 6.
Variations in (a) temperature, (b) pressure and (c) displacement components as functions of time at various points. Dashed lines represent analytical results while the numerical results are denoted by solid lines.
Figure 6.
Variations in (a) temperature, (b) pressure and (c) displacement components as functions of time at various points. Dashed lines represent analytical results while the numerical results are denoted by solid lines.


Figure 7.
(a) Sketch of the column test (after [35]) and (b) mesh and boundary conditions.
Figure 7.
(a) Sketch of the column test (after [35]) and (b) mesh and boundary conditions.
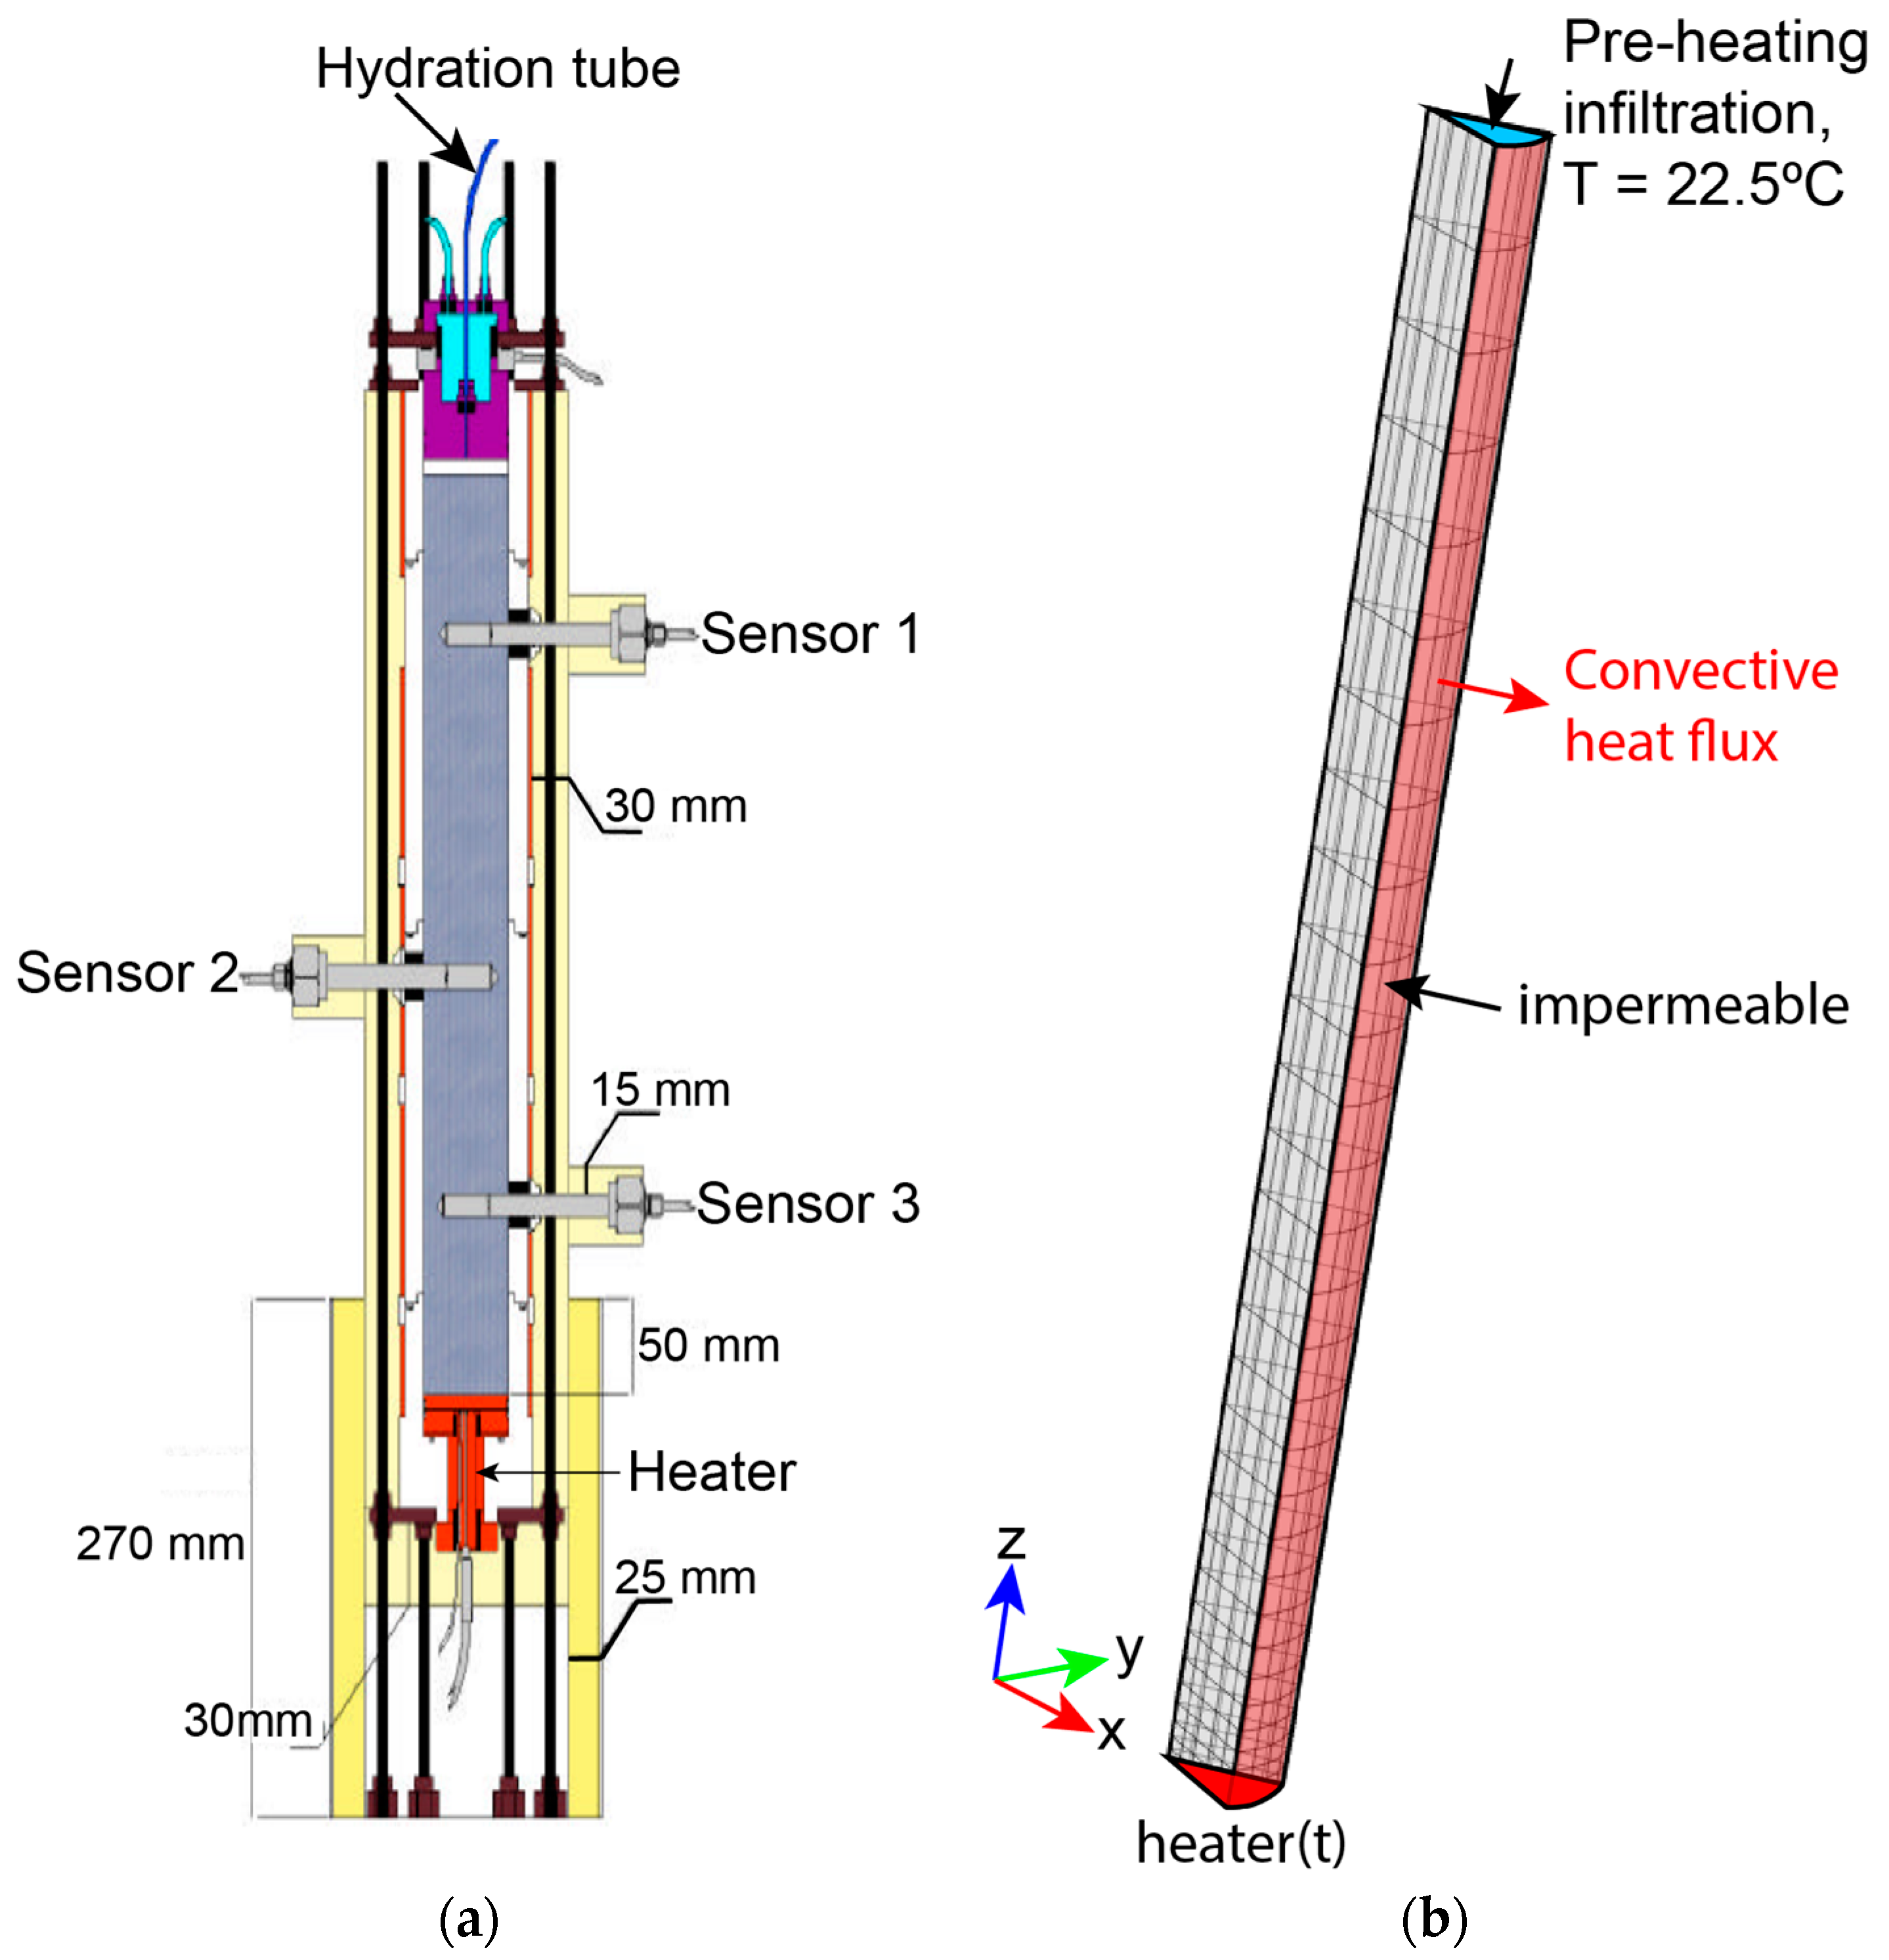
Figure 8.
(a) Temporal heater profile and (b) pre-heating infiltration.
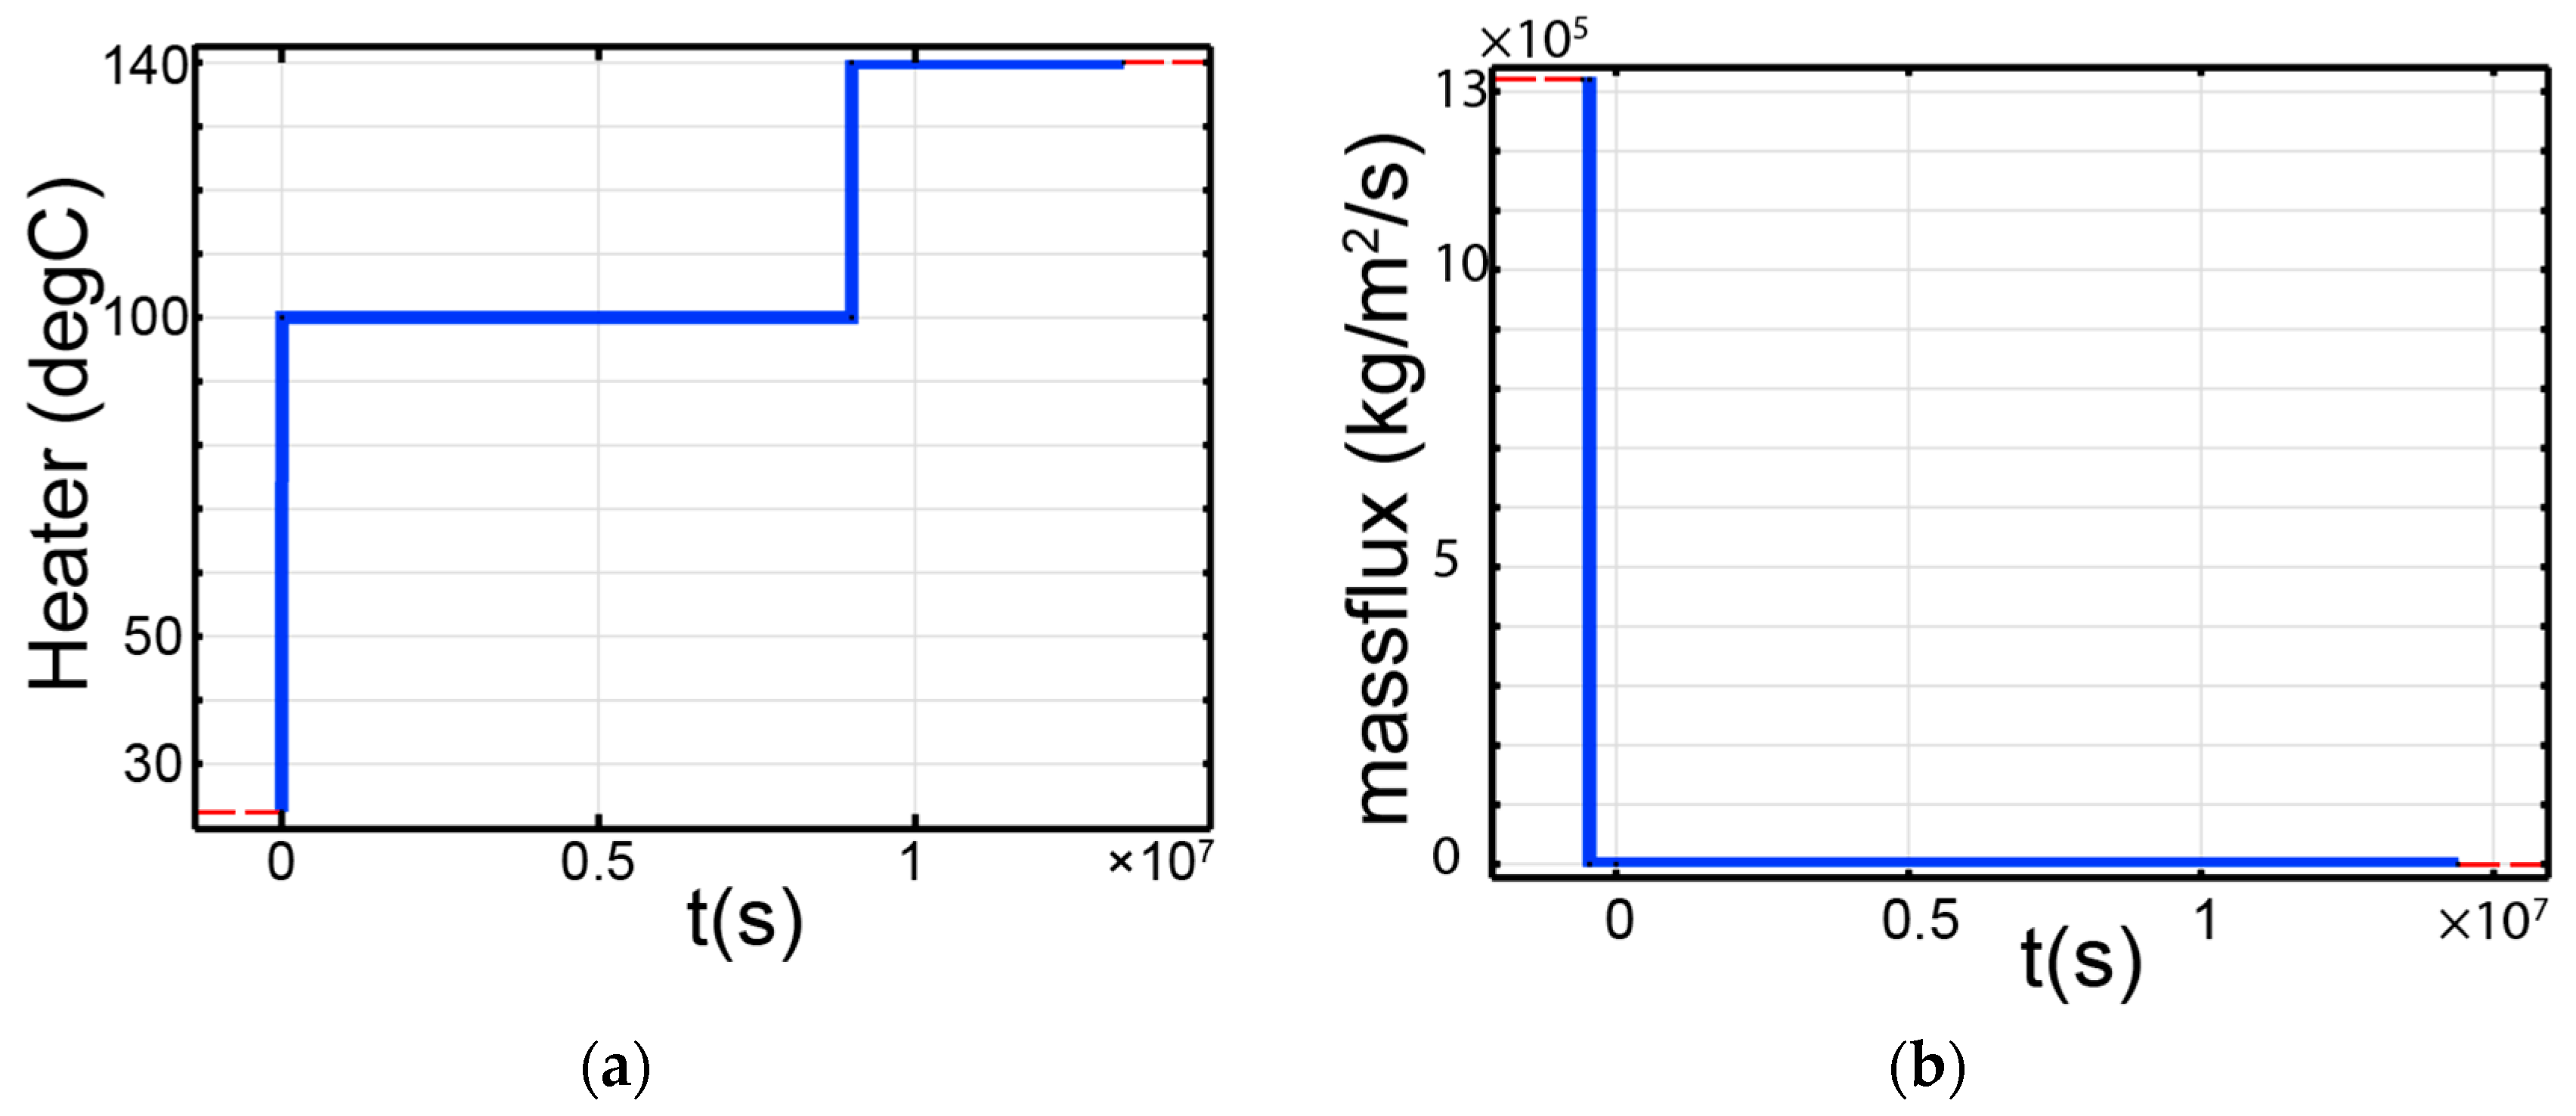
Figure 9.
Heat transfer coefficient profile to simulate conductive heat flux leaking at (a) z ≤ 20 cm and (b) z > 20 cm.
Figure 9.
Heat transfer coefficient profile to simulate conductive heat flux leaking at (a) z ≤ 20 cm and (b) z > 20 cm.
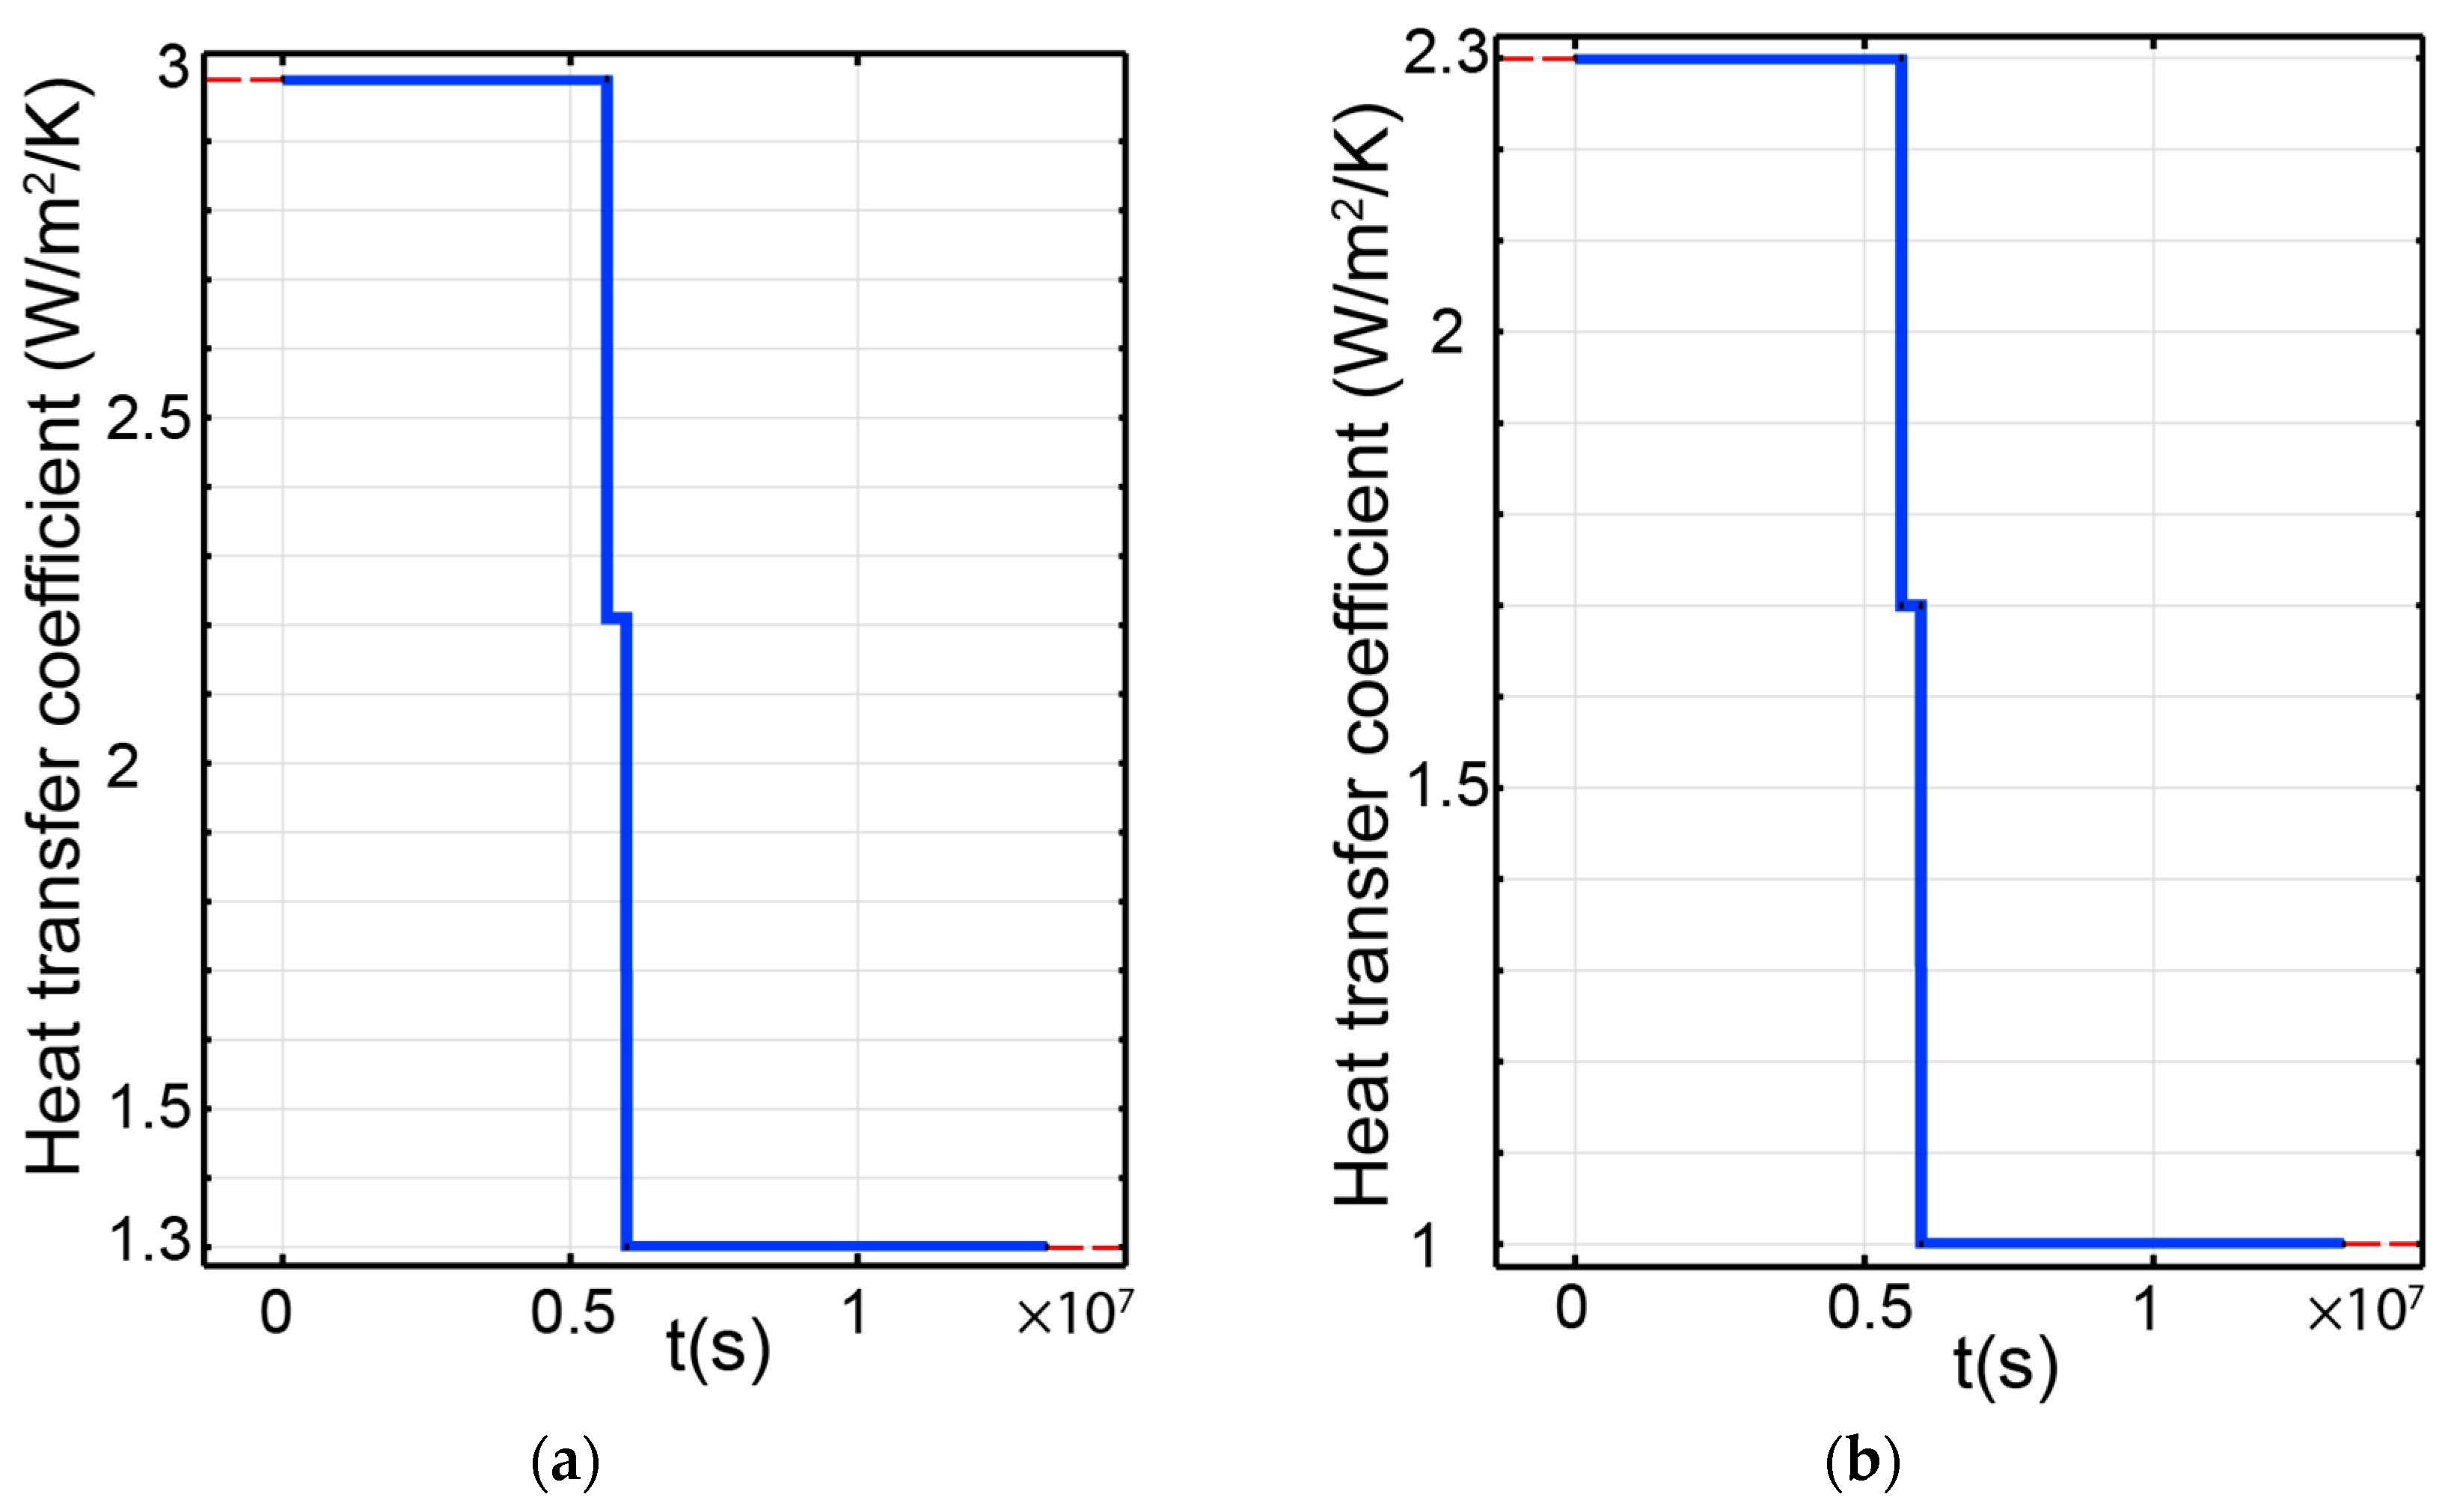
Figure 10.
SWCC for BS column (after [16]).
Figure 10.
SWCC for BS column (after [16]).

Figure 11.
(a) Thermal conductivity and (b) specific heat capacity [38].
Figure 11.
(a) Thermal conductivity and (b) specific heat capacity [38].

Figure 12.
Evolution of (a) temperature, (b) RH, (c) pore water pressure, (d) degree of saturation within the B/S sample and comparison between simulated results (solid lines) and test results (squares and triangles) of temperature and RH evolution.
Figure 12.
Evolution of (a) temperature, (b) RH, (c) pore water pressure, (d) degree of saturation within the B/S sample and comparison between simulated results (solid lines) and test results (squares and triangles) of temperature and RH evolution.

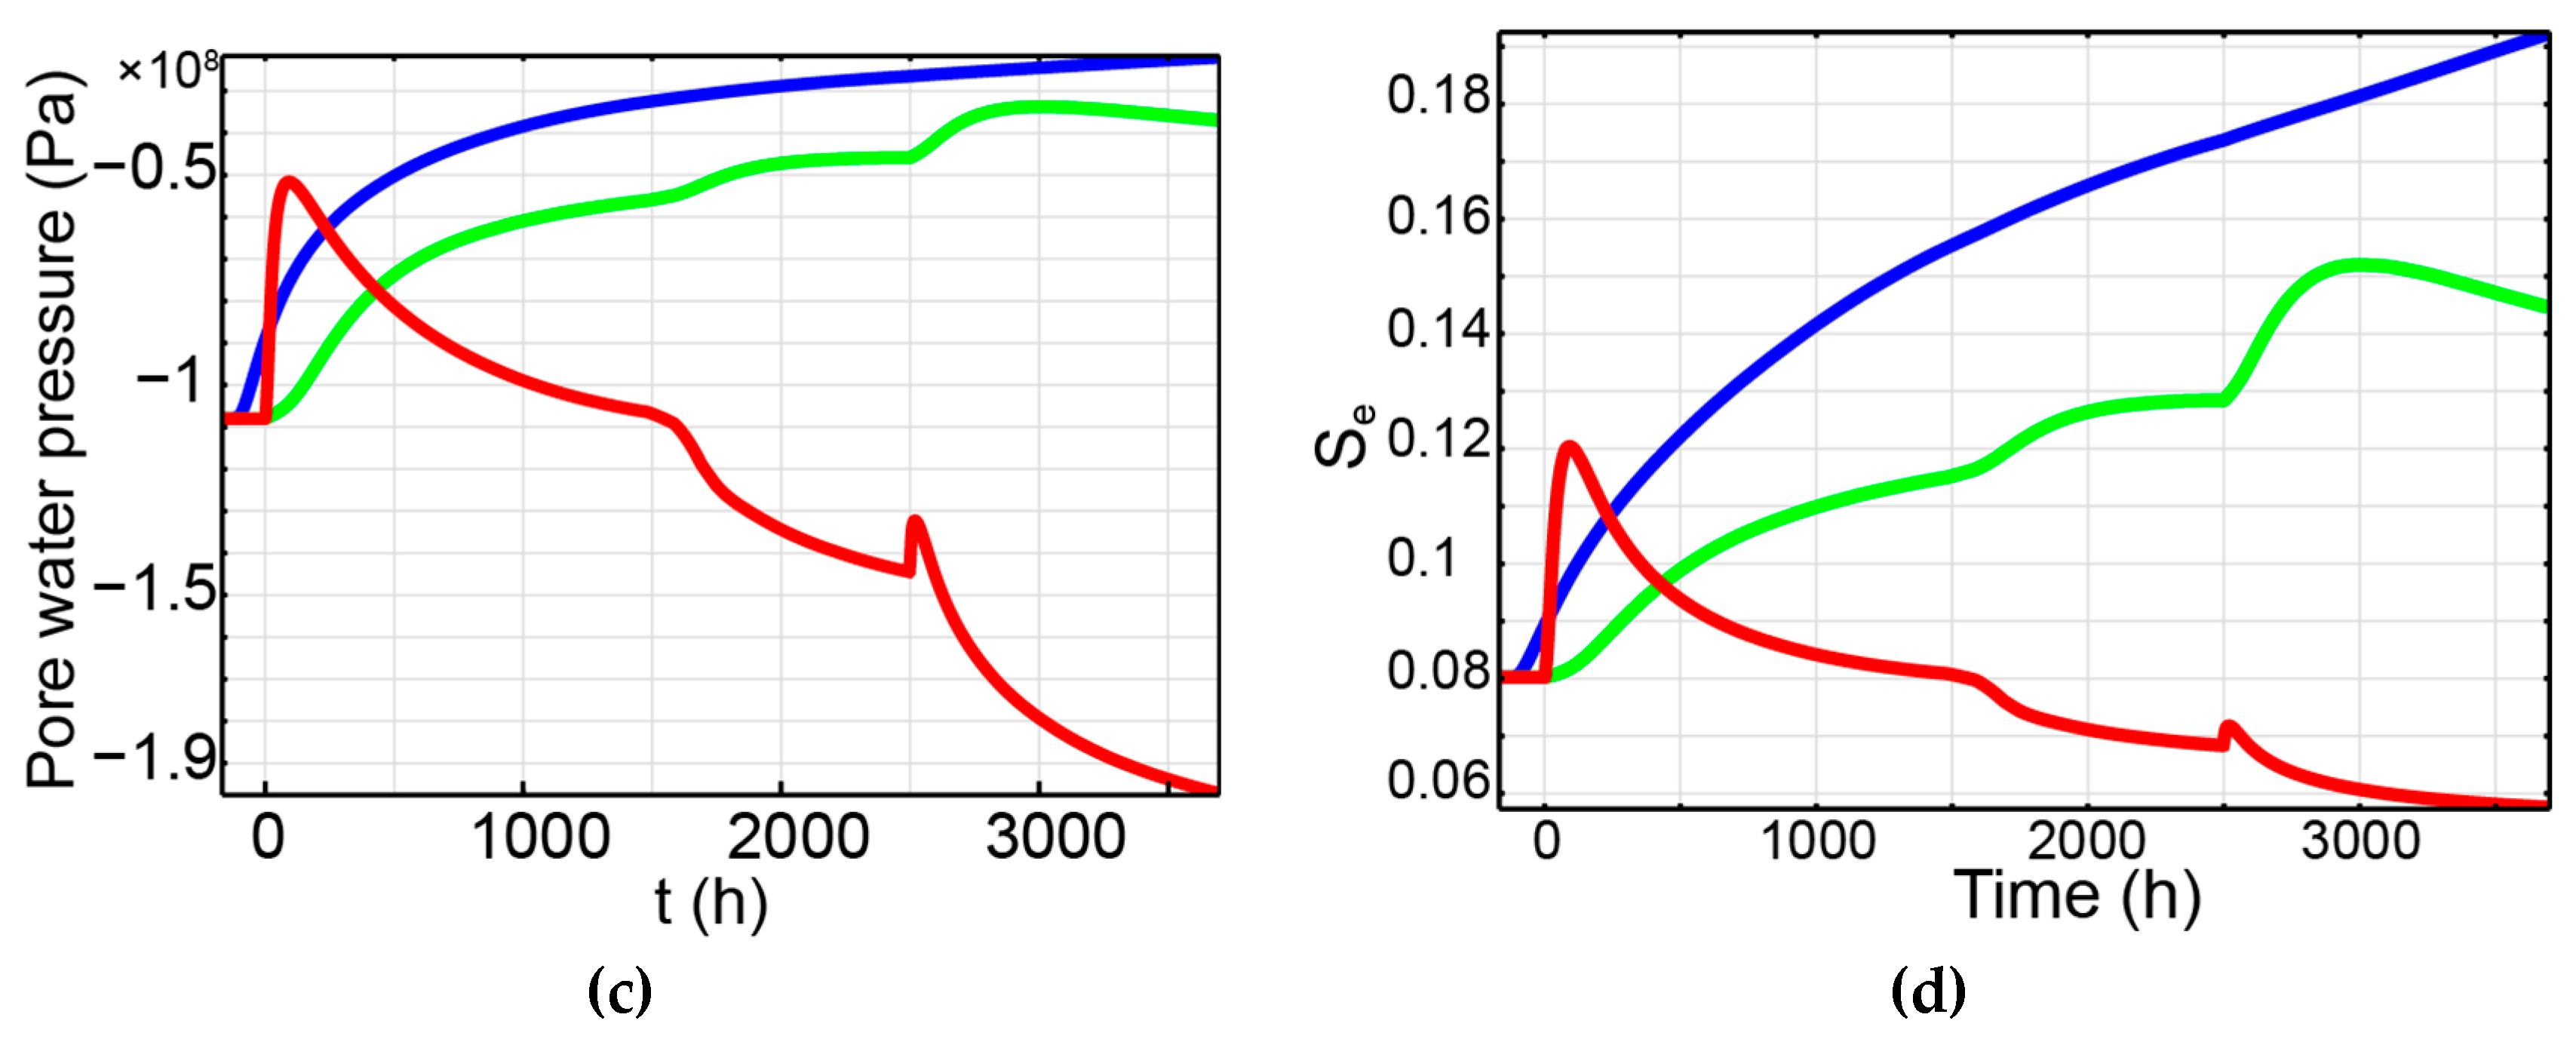
Figure 13.
(a) Illustration of the solute thermodiffusion experiment setup; (b) A-A cross-sectional geometry; (c) finite element axisymmetric model for scoping analysis with boundary conditions around B-B for case C2 and (d) case C1.
Figure 13.
(a) Illustration of the solute thermodiffusion experiment setup; (b) A-A cross-sectional geometry; (c) finite element axisymmetric model for scoping analysis with boundary conditions around B-B for case C2 and (d) case C1.

Figure 14.
Solute concentration variation profile as a function of time at various locations. Dashed lines represent C2 while C1 is denoted by solid lines.
Figure 14.
Solute concentration variation profile as a function of time at various locations. Dashed lines represent C2 while C1 is denoted by solid lines.
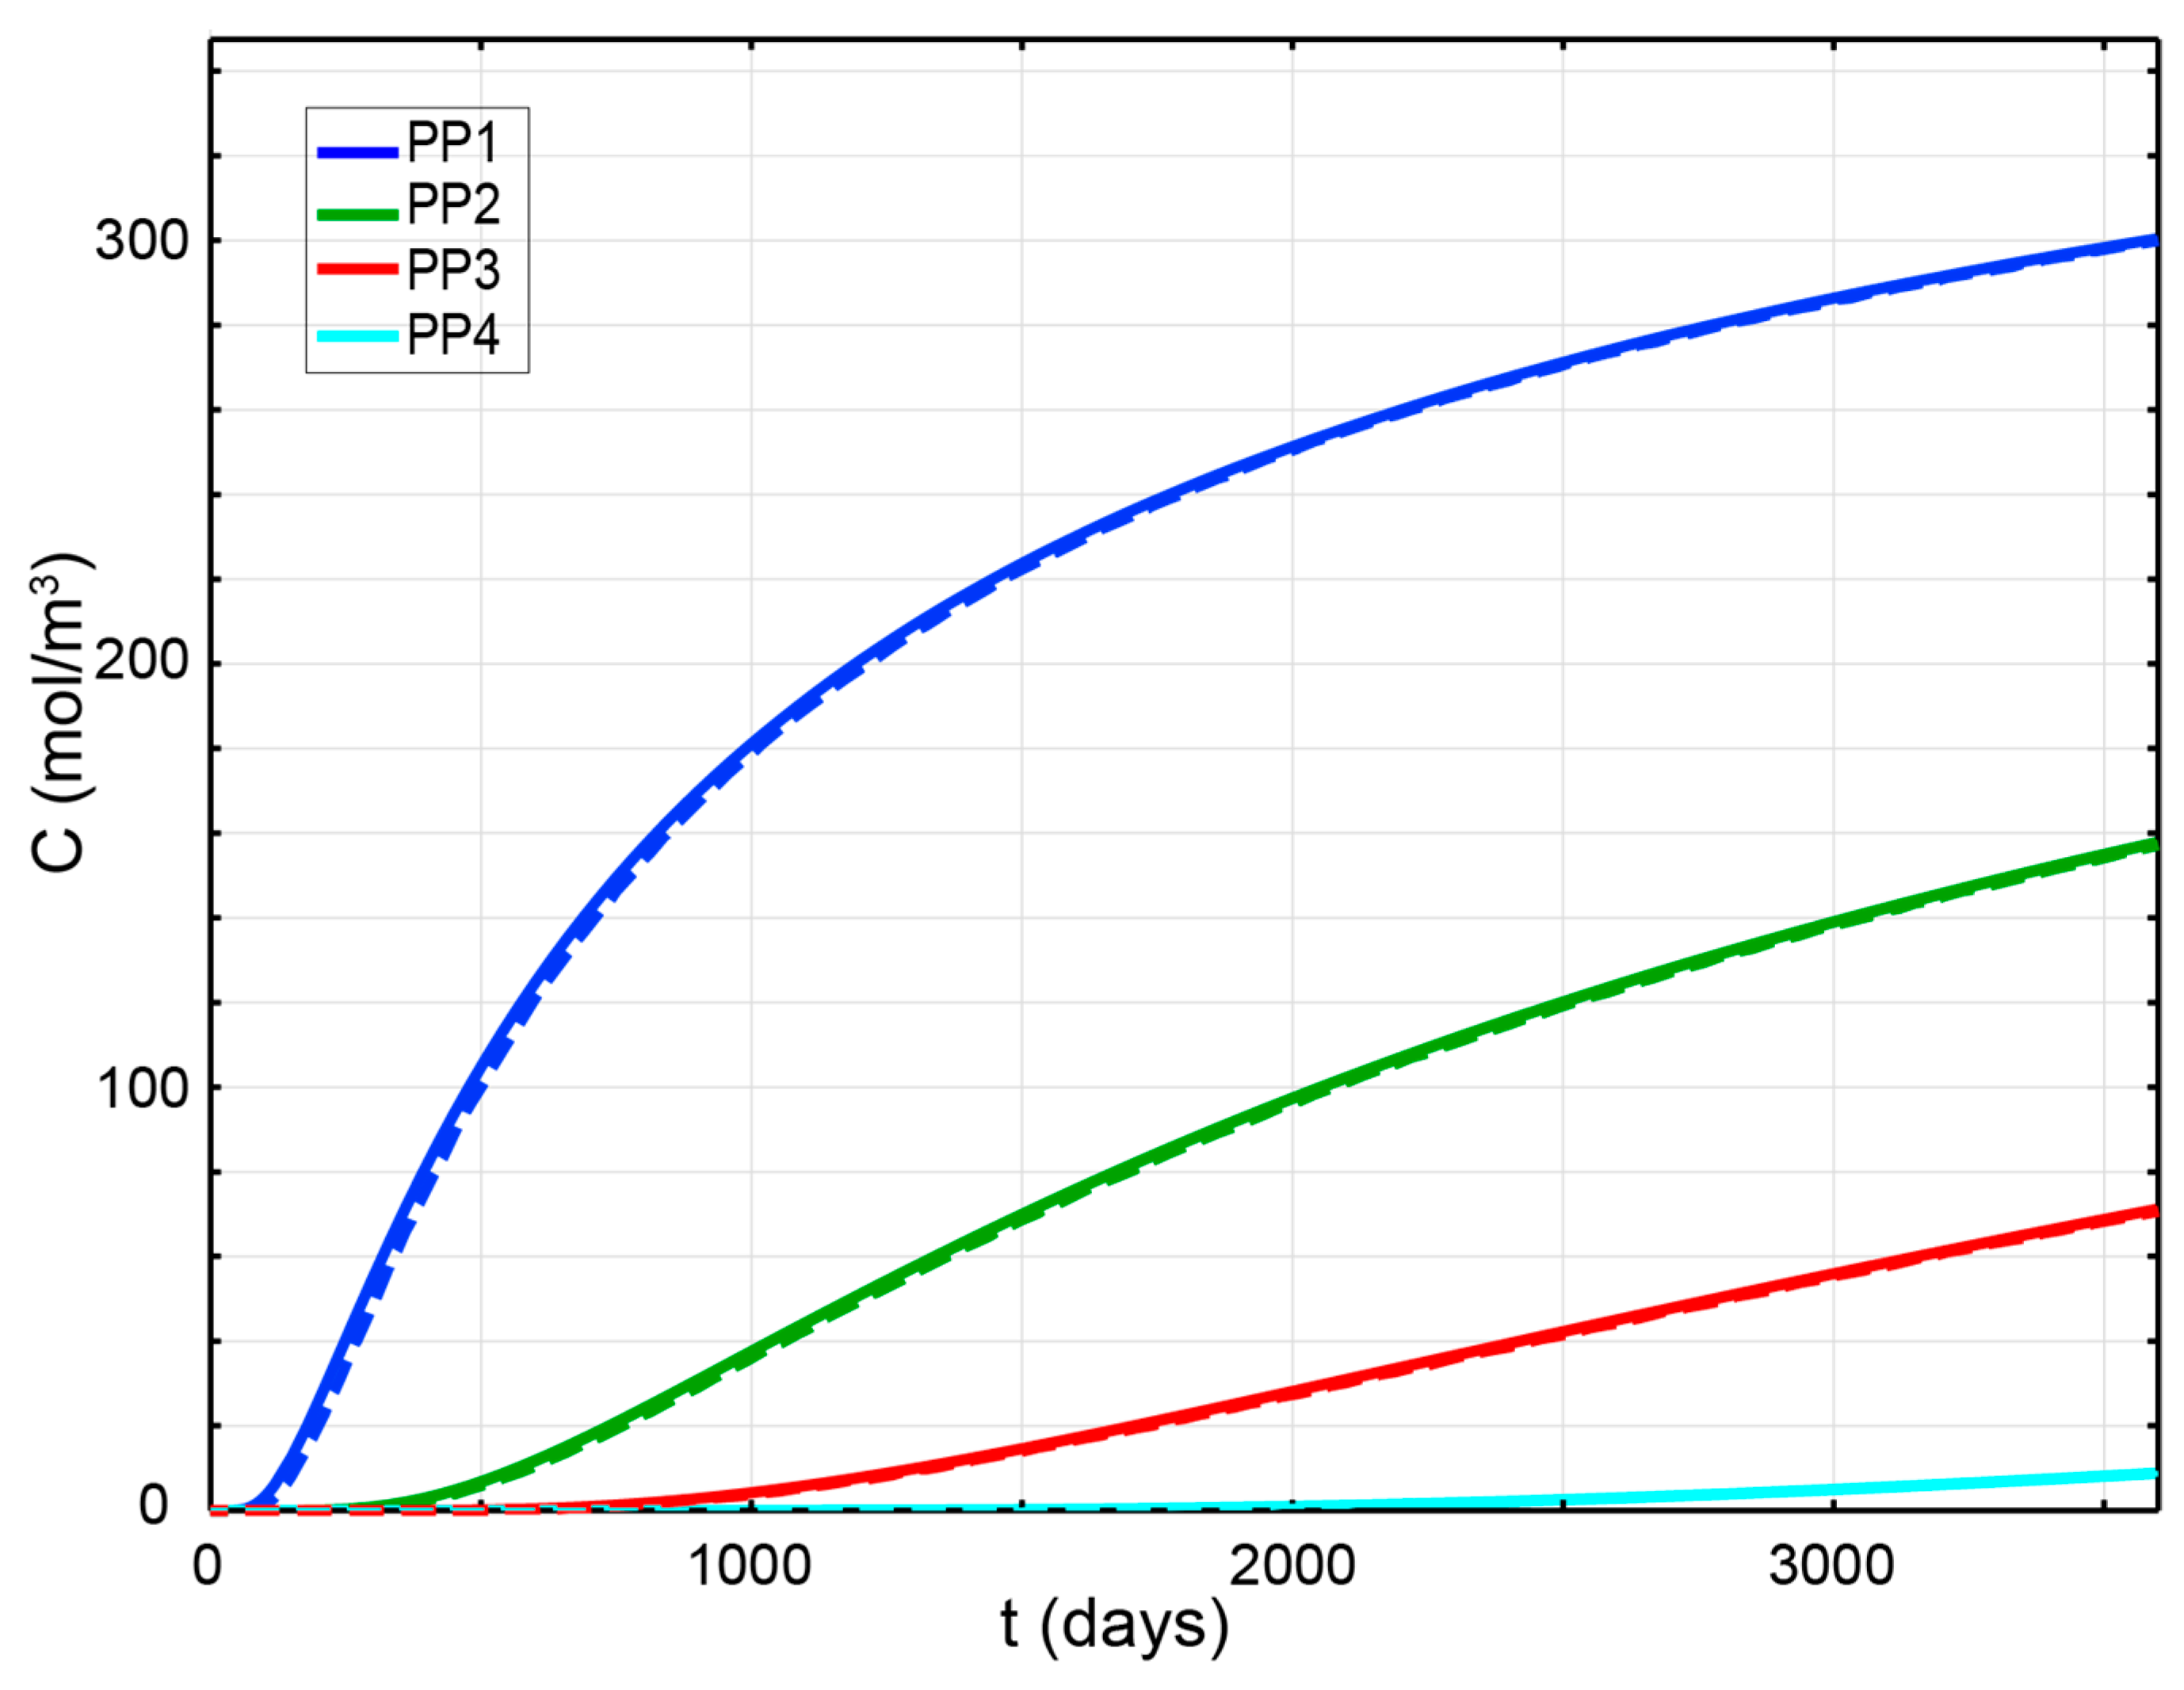
Figure 15.
Temporal evolution of total fluxes (a), diffusive fluxes (b), concentration gradient (c) in both cases and advective fluxes (d) in case C2.
Figure 15.
Temporal evolution of total fluxes (a), diffusive fluxes (b), concentration gradient (c) in both cases and advective fluxes (d) in case C2.
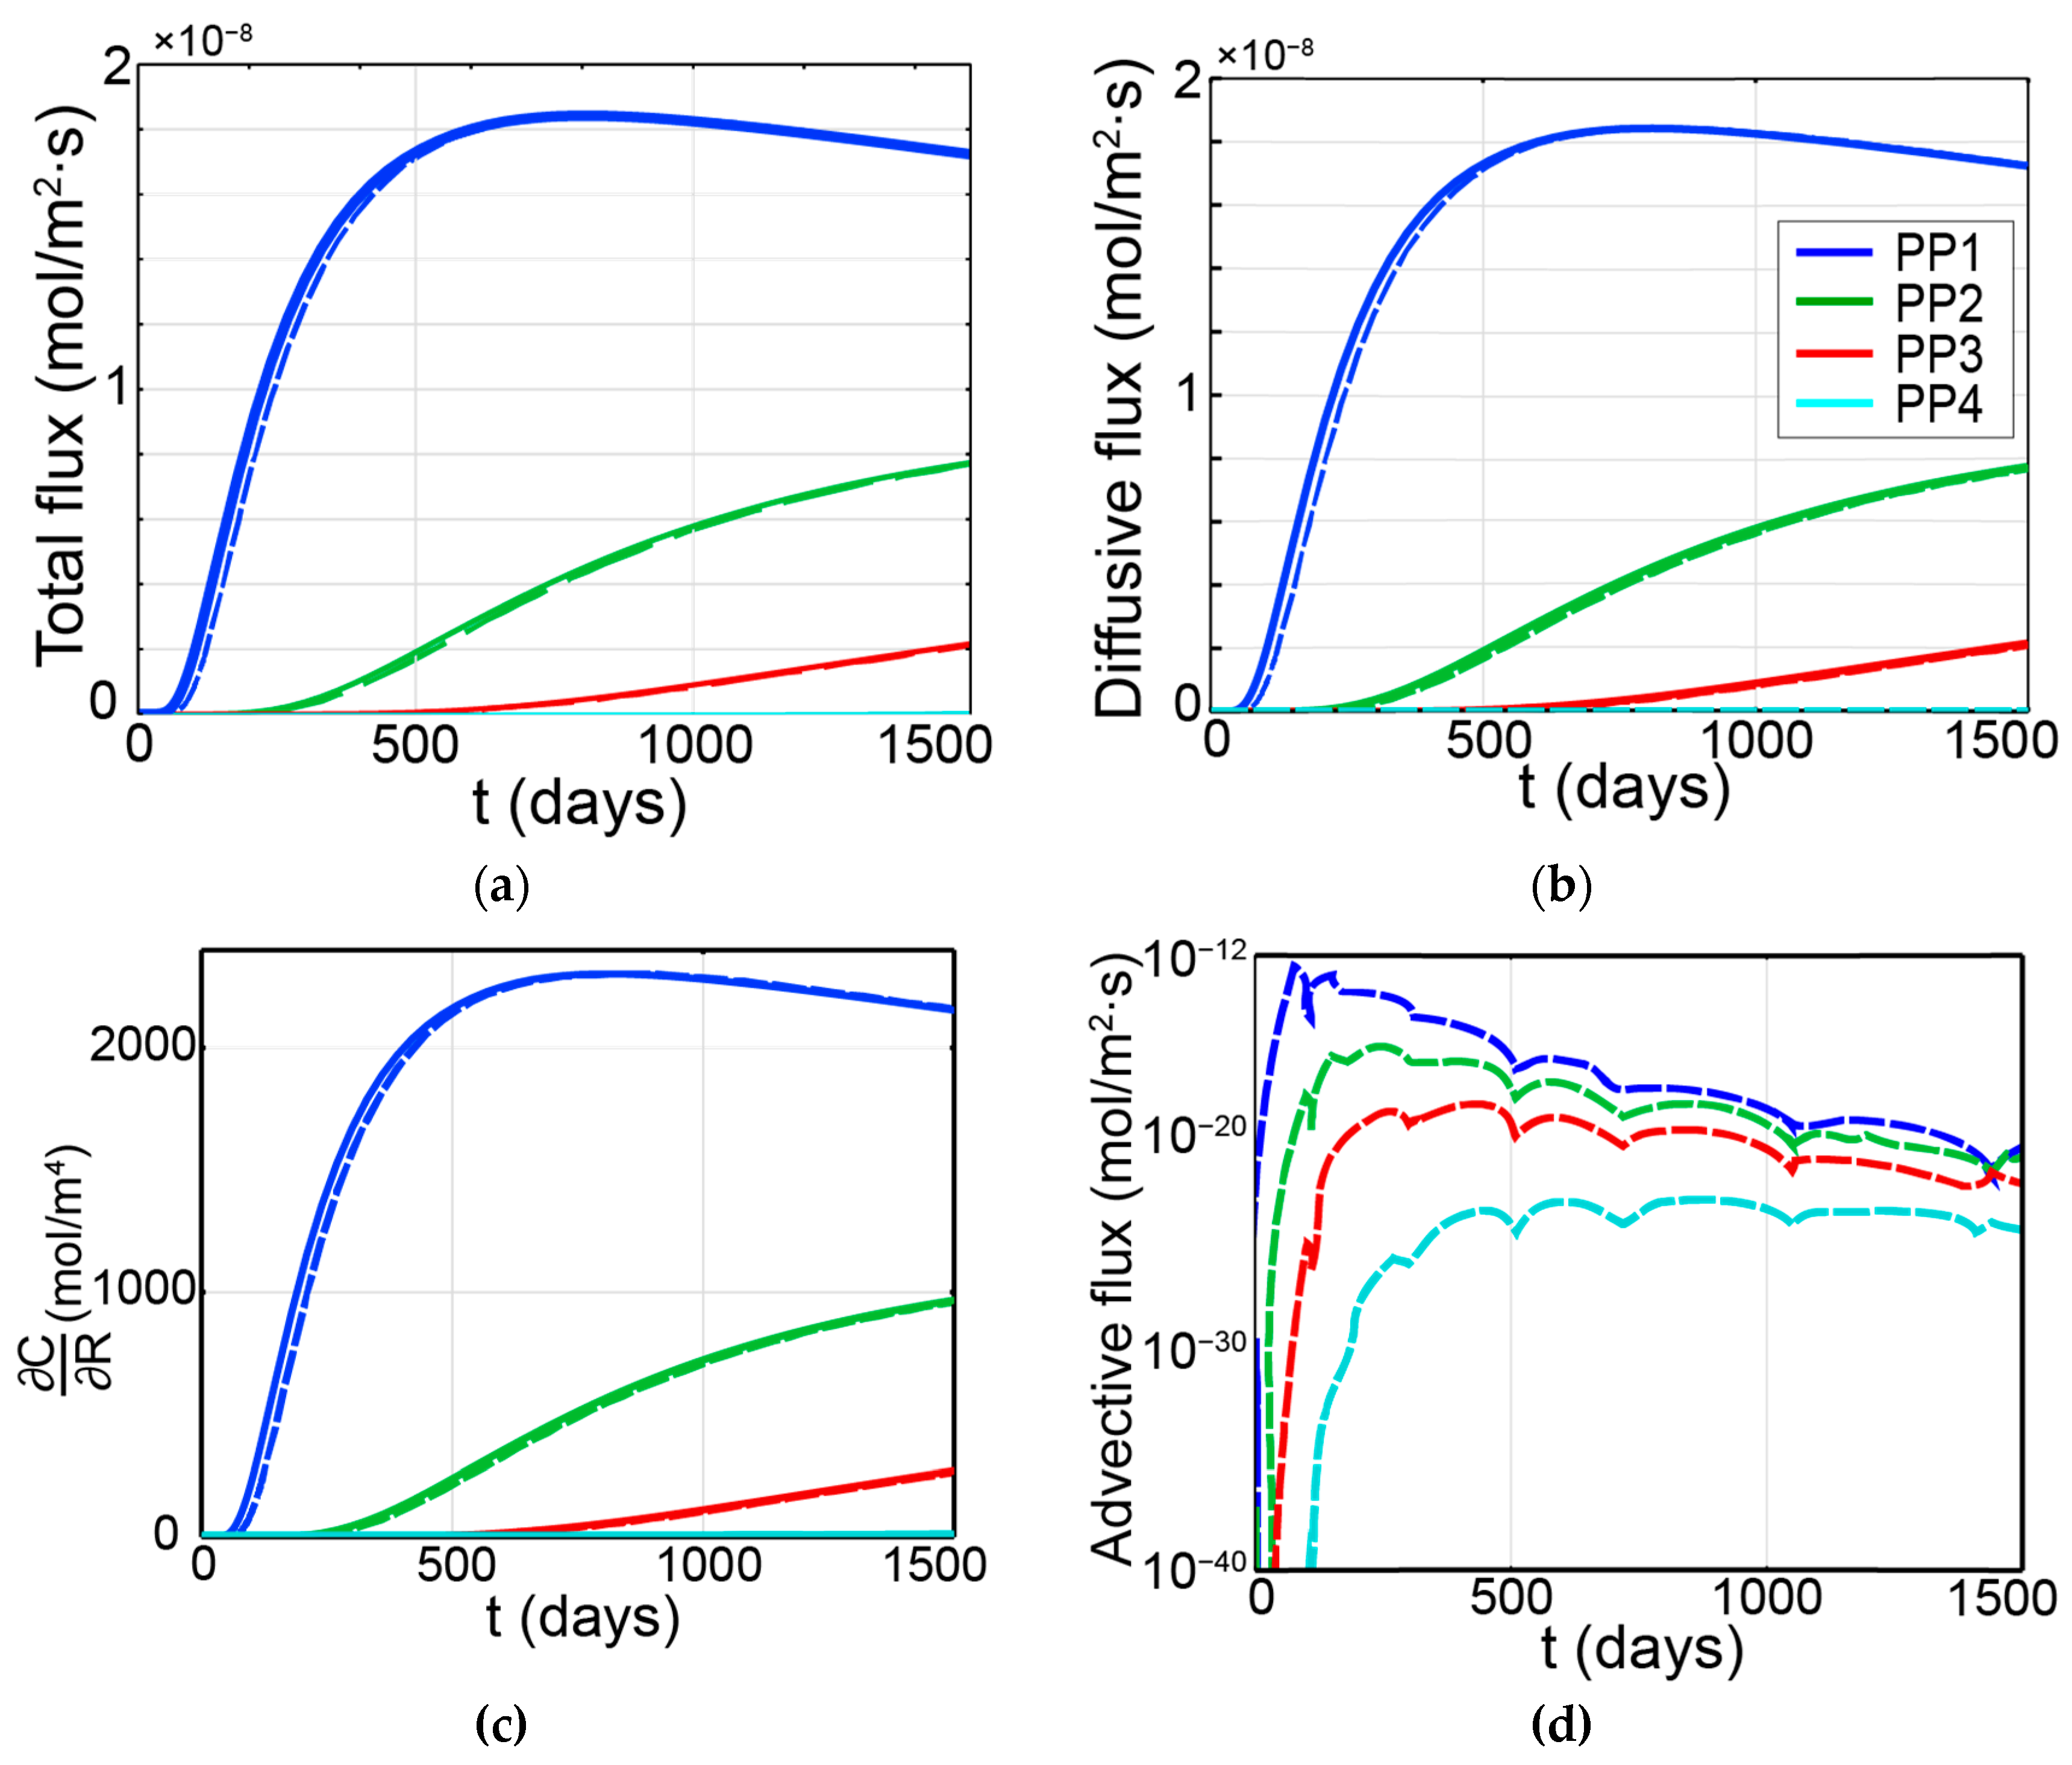
Figure 16.
Development of (a) pressure and (b) Darcy’s velocity as a function of radial distance from primary borehole BH1.
Figure 16.
Development of (a) pressure and (b) Darcy’s velocity as a function of radial distance from primary borehole BH1.

Table 1.
Parameters for verification of thermal consolidation problem.
| Parameter | Value | Unit |
|---|---|---|
| Young’s modulus (E) | 5 × 10⁹ | Pa |
| Poisson’s ratio (ν) | 0.3 | - |
| Biot’s coefficient (α) | 1 | - |
| Shear modulus (G) | E/(1 + ν)/2 | Pa |
| Point heat source (Q) | 300 | W |
| Porosity (n) | 0.16 | - |
| Density of water | 999.1 | kg/m3 |
| Density of solid | 2290 | kg/m3 |
| Equivalent density | kg/m3 | |
| Dynamic viscosity of water (μ) | 0.001 | Pa·s |
| Isobaric specific heat capacity of water (cw) | 4280 | J/kg/K |
| Isobaric specific heat capacity of solid (cs) | 917.654 | J/kg/K |
| Equivalent heat capacity (cp) | J/kg/K | |
| Volumetric thermal expansion coefficient of water | 4 × 10⁻⁴ | (1/K) |
| Volumetric thermal expansion coefficient of solid | 4.5 × 10⁻⁵ | (1/K) |
| Linear thermal expansion coefficient of solid | ||
| Intrinsic permeability (k) | 2 × 10⁻²⁰ | m2 |
| Thermal conductivity of water (Kw) | 0.6 | W/m/K |
| Thermal conductivity of solid (Ks) | 1.838 | W/m/K |
| Equivalent thermal conductivity (K) | nKw + (1 − n)Ks | W/m/K |
| P1 (x1, y1, z1) | (1, 0, 0) | m |
| P2 (x2, y2, z2) | (0, 2, 0) | m |
| P3 (x3, y3, z3) | (0, 0, 3) | m |
| P4 (x4, y4, z4) | (0.35, 0.5, 0.6) | m |
| P5 (x5, y5, z5) | (1.3, 0.682, 0) | m |
| P6 (x6, y6, z6) | (30, 0, 0) | m |
Table 3.
Parameters used as input in mathematical simulation.
| Parameter | Value | Unit |
|---|---|---|
| Young’s modulus | 13.5 × 10⁹ [21] | Pa |
| Poisson’s ratio | 0.15 [21] | - |
| Biot’s coefficient | 0.8 [21] | |
| Porosity | 0.1 * | - |
| Density of water | 1000 | kg/m3 |
| Density of solid | 2550 | kg/m3 |
| Dynamic viscosity of water | 0.001 | Pa.s |
| Isobaric specific heat capacity of porous medium | 1096 | J/kg/K |
| Volumetric thermal expansion coefficient of porous medium | 1.5 × 10⁻⁵ | 1/K |
| Intrinsic permeability | 5 × 10⁻¹⁹ | m2 |
| Thermal conductivity | 3 * | W/m/K |
| Compressibility of fluid (χf) | 4 × 10⁻¹⁰ | 1/Pa |
| Compressibility of solid (χp) | 1 × 10⁻¹¹ | 1/Pa |
| Fluid diffusion coefficient () | 8 × 10⁻¹² * | m2/s |
* Unpublished data by IRSN.
Disclaimer/Publisher’s Note: The statements, opinions and data contained in all publications are solely those of the individual author(s) and contributor(s) and not of MDPI and/or the editor(s). MDPI and/or the editor(s) disclaim responsibility for any injury to people or property resulting from any ideas, methods, instructions or products referred to in the content. |
© 2023 by the authors. Licensee MDPI, Basel, Switzerland. This article is an open access article distributed under the terms and conditions of the Creative Commons Attribution (CC BY) license (https://creativecommons.org/licenses/by/4.0/).
Share and Cite
MDPI and ACS Style
Vo, U.; Fall, M.; Sedano, J.Á.I.; Nguyen, T.S. A Multiphysics Model for the Near-Field Evolution of a Geological Repository of Radioactive Waste. Minerals 2023, 13, 1535. https://doi.org/10.3390/min13121535
AMA Style
Vo U, Fall M, Sedano JÁI, Nguyen TS. A Multiphysics Model for the Near-Field Evolution of a Geological Repository of Radioactive Waste. Minerals. 2023; 13(12):1535. https://doi.org/10.3390/min13121535
Chicago/Turabian StyleVo, Uy, Mamadou Fall, Julio Ángel Infante Sedano, and Thanh Son Nguyen. 2023. "A Multiphysics Model for the Near-Field Evolution of a Geological Repository of Radioactive Waste" Minerals 13, no. 12: 1535. https://doi.org/10.3390/min13121535
Note that from the first issue of 2016, this journal uses article numbers instead of page numbers. See further details here.