
The Influence of Micro-Heterogeneity on Water Injection Development in Low-Permeability Sandstone Oil Reservoirs
1
School of Petroleum Engineering, Xi’an Shiyou University, Xi’an 710065, China
2
The Key Laboratory of Well Stability and Fluid & Rock Mechanics in Oil and Gas Reservoir of Shaanxi Province, Xi’an Shiyou University, Xi’an 710065, China
3
No. 12 Oil Production Plant, Changqing Oilfield Company, PetroChina, Qingyang 745000, China
*
Author to whom correspondence should be addressed.
Minerals 2023, 13(12), 1533; https://doi.org/10.3390/min13121533
Submission received: 4 November 2023
/
Revised: 5 December 2023
/
Accepted: 7 December 2023
/
Published: 9 December 2023
Abstract
:Micro-heterogeneity in low-permeability sandstone oil reservoirs significantly influences the uniformity of water injection during development. This leads to the formation of preferred channels for water injection, causing premature water breakthroughs in oil wells. Not only does this reduce oil displacement efficiency, but it also enriches residual oil in the formation, which ultimately impacts the overall recovery rate. This study employed various methods, including thin-section casting, qualitative analysis through scanning electron microscopy, quantitative analysis of X-ray diffraction, high-pressure mercury intrusion and particle size, and experimental techniques, such as wettability and micro-displacement, to investigate the impact mechanism of micro-heterogeneity on water injection development in low-permeability oil reservoirs. A typical low-permeability sandstone oil reservoir in the Ordos Basin was used as a case study. The results reveal that the reservoir’s micro-heterogeneity is determined by the heterogeneity of the interstitial material, porosity, and particle size. Micro-heterogeneity plays a critical role in the flow characteristics and oil displacement efficiency of low-permeability oil reservoirs. The less the micro-heterogeneity, the better the water injection development outcome. This study suggests a technical policy adjustment method that is critical for guiding the development of low-permeability water injection oil reservoirs, thereby improving the effectiveness of water injection development.
1. Introduction
To effectively develop oil and gas fields, it is important to consider the heterogeneity of reservoirs. This heterogeneity arises from the uneven distribution of reservoirs during sedimentation, lithification, and structural processes, and it primarily manifests as spatial variability in reservoir physical properties, rock types, electrical properties, and oil and gas properties [1]. In order to quantify this heterogeneity, researchers have classified it based on its size [2] and scope [3], its impact on fluid flow [4], and its depositional characteristics [5]. Mr. Qiu [6], factoring in the characteristics of China’s terrestrial reservoirs and considering the scale of heterogeneity and actual development and production, divided the heterogeneity of clastic rock reservoirs into four levels from large to small: interlayer, planar, intralayer, and micro-heterogeneous. The first three belong to the category of macroscopic heterogeneity, which directly affects the sweep efficiency of the water drive in oilfield water injection development. Micro-heterogeneity, on the other hand, affects the fluid flow within micropores and throats [7], and it includes factors such as the size, connectivity, and configuration of pores and throats, as well as the composition, particle arrangement, and interstitial material distribution of the rock [8,9]. In water injection development in low-permeability oil reservoirs, micro-heterogeneity directly affects the characteristics of oil–water flow and micro-displacement efficiency, thereby controlling the distribution of microscopic residual oil in the pore structure [10].
Micro-heterogeneity can be categorized into three types, based on its content [11,12]: interstitial material heterogeneity, pore heterogeneity, and particle heterogeneity. Interstitial material heterogeneity pertains to its content, mineral composition, and sensitivity. Pore heterogeneity describes the variance in the type, size, distribution, and degree of sorting of pores and throats in rocks. These features can be quantitatively detailed using pore structure parameters such as the maximum pore radius, median pore radius, maximum connected throat radius, median throat radius, minimum-flow throat radius, and others [13,14,15]. Particle heterogeneity refers to the variance in particle size, shape, sorting, arrangement, and contact relationships. These factors affect both pore heterogeneity and permeability anisotropy, and they also influence the dynamic changes in a reservoir itself during water injection development [16,17].
In the process of investigating the effects of micro-heterogeneity on water injection development in oil and gas fields, scholars have drawn conclusions from experiments such as physical property analysis, casting thin-section observation, scanning electron microscopy and X-ray diffraction testing, CT scanning, and nuclear magnetic resonance. The results have indicated that porosity heterogeneity is a critical factor leading to a non-uniform water drive, and the stronger the porosity heterogeneity, the higher the likelihood of producing annular residual oil [18,19,20]. Pore heterogeneity and surface roughness primarily affect the permeability and storage space of reservoirs [21]. The difference in water drive recovery rates between micropores and macropores in tight sandstone is influenced by pore heterogeneity [22]. The heterogeneity of pores significantly impacts the saturation of movable fluids, with weaker heterogeneity leading to higher saturation [23,24]. Pore heterogeneity inhibits the migration of two-phase fluids and the swept area of single-phase fluids, with stronger heterogeneity leading to worse gas–liquid exchange [25,26]. The stronger the micro-heterogeneity, the rougher the surface of the pores, making it more likely for the injected fluid to flow along well-developed and interconnected pore areas [27]. The micropore throat structure of low-porosity and low-permeability sandstone oil reservoirs controls the seepage characteristics, directly affecting the efficiency of water injection development in oilfields [28]. While the above scholars have researched how micro-heterogeneity affects water injection development in oil and gas fields, most of these studies have only analyzed pore heterogeneity, neglecting interstitial material and particle heterogeneity. Moreover, impact analyses of water injection development in oil and gas fields often only focus on residual oil, movable fluids, and seepage characteristics. There is a lack of research concerning the relationship between micro-heterogeneity and the increase rate of the water cut and waterflood front, both of which are crucial factors for water injection development. Additionally, no relevant reports have been found on the production status analysis of micro-heterogeneity combined with water injection development of oil reservoir blocks. These two issues are vital for transforming water injection reservoir theory into practice.
This study focused on a typical low-permeability sandstone oil reservoir, spanning less than 6 km2, yet showcasing stark differences in water injection development traits among adjacent production wells and significant micro-heterogeneity. The impact of micro-heterogeneity on seepage characteristics and oil displacement efficiency was revealed through experimental analysis, and the correlation between the water cut rise rate and micro-heterogeneity was demonstrated via experiments. The influence of micro-heterogeneity on the water injection development of low-permeability sandstone oil reservoirs was confirmed through the observation of changes in the water cut of production wells. The findings of this study can offer practical guidance for adjusting the water injection development technology policy in low-permeability oil reservoirs.
2. Geological Background
2.1. General Geological Situation of the Ordos Basin
The Ordos Basin is a substantial oil- and gas-bearing basin in central China. It detached from the North China Plate in the Late Triassic and has evolved independently ever since. It is a multi-cycle cratonic basin [29] currently characterized by a gentle westward dipping monocline with a slope of less than 1° [30]. Based on the history of the basin’s structural evolution and its present structural features, the Ordos Basin is divided into six primary structural units (Figure 1a): the Yimeng Uplift, Western Edge Thrust Belt, Tianhuan Depression, Yishan Slope, Western Shanxi Folding Belt, and Weibei Uplift [31]. The Mesozoic oil resources in the Ordos Basin are vast, with the Jurassic Yan’an Formation being a primary exploration and development target for layers within the basin [32,33]. The Yan’an Formation is split into a total of 10 oil layer groups, labeled from bottom to top as Yan 10 to Yan 1 [34]. The Yan 10 oil layer group is a braided river sedimentary system, the Yan 9 to Yan 6 oil layer groups are river–lake delta sedimentary systems, the Yan 5 and Yan 4 oil layer groups have evolved into a network of a river–residual-lake sedimentary system, and the Yan 3 to Yan 1 oil layer groups are braided meandering river sedimentary systems [35] (Figure 1b).
2.2. Selection of the Target Area
The YW oil reservoir, a non-faulted and non-fractured, low-permeability waterflooding reservoir in the Ordos Basin, was chosen for the study to explore the impact of micro-heterogeneity on the water injection development of low-permeability sandstone oil reservoirs. This area is located in the southwest of the Yishan Slope (Figure 1a). The study horizon included the Yan 9 layers, whose geological age is the Middle Jurassic era, which has a relatively stable stratigraphic structure and belongs to the lithologic-structural reservoir. The sedimentary environment of the YW oil reservoir is a meandering river delta plain, which is further divided into distributary channels, natural embankments, floodplains, and other subfacies. Among these, the distributary channels and natural embankments form a sand body sedimentary framework, acting as the main reservoirs for oil and gas. The formation temperature of the YW oil reservoir is 58.5 °C, the original formation pressure is 16.2 MPa, the viscosity of crude oil is 6.87 mPa·s, the average permeability is 4.9 mD, and the average porosity is 12.9%, while the surface porosity is only 6.5%. This marks it as a typical low-permeability sandstone oil reservoir.
2.3. Genesis of the YW Low-Permeability Reservoir
The formation of low-permeability reservoirs is predominantly influenced by sedimentation and diagenesis [36]. Sedimentation is a foundational element in the creation of these reservoirs, dictating the nature and degree of subsequent diagenesis. Diagenesis, particularly intense compaction and cementation in its early stage, is critical to the development of low-porosity and low-permeability reservoirs [37].
The sedimentary system of the YW oil reservoir falls within the meandering river delta plain. Different sedimentary facies are characterized by distinct hydrodynamic conditions and transportation methods, leading to spatial variations in the sandstone size, degree of sorting, and matrix content. These directly control the original porosity and permeability of the reservoir. However, in facies belts, such as alluvial fans, underwater fans, fan delta plains, and delta fronts, low-porosity and low-permeability reservoirs are usually developed. In these facies belts, the sorting of sediments is poor, the shale content is high, and the compaction is strong, forming low-porosity and low-permeability reservoirs at the early stage of diagenesis [38]. Moreover, the development horizon of the YW oil reservoir is the Y9 layer, which belongs to the coal measure strata. Core observation mainly reveals oblique and massive bedding with visible plant debris and coal lines (Figure 2). Typically, reservoirs located in or near coal measures are low-porosity and low-permeability reservoirs. Due to the gentle ancient terrain during the deposition of coal measure strata, the sorting and rounding of sedimentary particles are poor. The sedimentary environment of coal measure strata is enriched with aquatic and terrestrial plants. During deposition or early diagenesis, plants decompose quickly to produce humic acid, creating an acidic environment that hinders the formation of cement precipitated under alkaline conditions such as carbonate, sulfate, and silicate. Hence, in the early stage of diagenesis, there is a lack of cementation and filling of calcite, gypsum, and laumontite minerals, resulting in a lack of cement support between particles. Sediments are prone to compaction [39,40], leading to low porosity and permeability.
Low-permeability oil reservoirs are characterized by significant heterogeneity and subpar physical properties. After fracking, only a fracture network is established near the wellbore area. As the extraction time increases, the energy from the oil layer in the vicinity of the wellbore is rapidly depleted, resulting in a continual decline in reservoir pressure, diminished oil well output, and even instances of cessation in blowout and production. The remaining oil distanced from the wellbore remains in the formation, unable to be produced above ground. This natural energy method of development manages to produce only 5% to 15% of the geological reserves, resulting in a low recovery rate. To enhance this rate, gas injection and water injection are considered development options. However, due to constraints related to gas sources and cost considerations, over 95% of the low-permeability reservoirs developed via directional drilling in the Ordos Basin use water injection to sustain and supplement formation energy. With the application of reasonable water injection technology policies, the ultimate recovery rate can reach between 30% and 40%.
3. Materials and Methods
3.1. Rock Samples and Fluids
Experiments were required to demonstrate the influence of micro-heterogeneity on water injection development; thus, the selection of core wells must take into account not just geological factors but also engineering ones. Additionally, the experiment incorporated the geological static experimental analysis of cast thin sections, scanning electron microscopy, X-ray diffraction of the whole rock, X-ray diffraction of clay, high-pressure mercury intrusion, and particle size images, as well as the fluid dynamic experimental analysis of relative permeability, the water displacement of oil, and wettability testing. To enhance the comparability of geological and fluid experimental results and minimize interference from geological and engineering factors, we proposed two principles for the underground depth position and planar well location distribution of the core samples: firstly, the depth position of each core sample needed to be at the same location as much as possible, with an interval of less than 10 cm; secondly, core wells were to be situated at similar elevations in the same oil reservoir, with a minimal distance between wells, devoid of geological factors such as faults and fractures, and without engineering differences.
Utilizing the principles of core sample analysis, eight sets of experiments were conducted. Each set comprised five samples, leading to a total of 40 cylindrical standard rock samples. These samples, each measuring 25 mm in diameter and 50 mm in length, were meticulously extracted from five carefully chosen core wells, with eight samples taken from each well. All the selected wells belonged to the same oil reservoir, representing the topographic highs of the reservoir structure. Key geological parameters such as faults, fractures, or edge and bottom water were notably absent. The fracturing and renovation scale across the wells were kept uniform. The distance between production wells varied from 550 m to 2100 m, with an average distance of 1070 m. Figure 1c illustrates the geographic location of these core wells in the designated research area.
The rock samples selected for this study were obtained from the drilled cores of the YW oil reservoir and stored in the core library of the Changqing Oilfield. The temperature was maintained between 25 and 30 °C during the observation and sampling of these cores.
3.2. Experimental Apparatus and Testing Methods
Throughout the experiment, standard rock samples were utilized to obtain measurements of porosity and permeability, high-pressure mercury intrusion, relative permeability, the water drive oil experiment, and the wettability test. The remaining experimental test samples were composed of small rock fragments. Following an oil cleansing process, all rock samples were dried at temperatures ranging from 105 to 110 °C over a period of three to four hours. Subsequent experiments were then conducted at a temperature setting of 25 °C.
3.2.1. Measurement of Porosity and Permeability
According to the core analysis method (GB/T 29172-2012) [41], nitrogen gas of 99.999% purity was selected as the working medium for the test.
The porosity measurement was based on Boyle’s law, using the KX-07 gas porosity tester (Huiao, Wuxi, China). The dried standard rock samples were placed in the device, and a pressure of 200 psi was applied, allowing the nitrogen to fill the pore space of the rock samples and the intermediate container. After the nitrogen had diffused into the pores of the rock samples, the pressure data before and after equilibrium were recorded to determine the pore volume of the rock samples [42].
The permeability measurements were based on Darcy’s law and the steady-state method, using the DX-07G gas permeability tester (Huiao, Wuxi, China). A confining pressure of 1.6 MPa was slowly applied, and a pressure of 0.1 MPa was applied to the inlet of the high-pressure nitrogen cylinder. Nitrogen entered the rock samples at a certain flow rate. After the nitrogen flow rate stabilized, the inlet pressure, outlet pressure, and outlet flow rate were recorded, and the permeability of the rock samples was calculated using Darcy’s law. When the permeability was less than 0.1 mD, the Klinkenberg effect would occur in gas permeation; when the permeability was higher than 0.1 mD, the flowing fluid could be considered a continuous medium, and the gas flow would follow Darcy’s law, with the Klinkenberg effect negligible [43,44]. The average permeability of the target area was 4.9 mD, and the minimum permeability was also greater than 1 mD, so the Klinkenberg effect was not considered during testing.
3.2.2. Cast Thin Sections and Scanning Electron Microscopy Observation
The rock samples, which had been cleaned and dried, were vacuumed for 15 to 30 min according to the rock thin-section identification method (SY/T 5368-2016) [45]. Following that, dyed epoxy resin and a curing agent were injected into the pore space of the rock sample. The samples were then placed in a high-pressure rock chamber with a pressure of 30 MPa and a temperature of 60 °C for 4 h to expedite the curing reaction between the epoxy resin and the curing agent, resulting in a hard, solid epoxy resin. The rock samples were then ground into 25 mm × 0.05 mm flakes through a four-step process of coarse, medium, fine, and ultrafine plane grinding, and observations and analysis were conducted using a 59 XC-PC polarizing microscope (Jingtong, Wuxi, China).
In accordance with the rock sample scanning electron microscope analysis method (SY/T 5162-2021) [46], the cleaned and dried rock samples were sliced into small cubes of 1 cm. Following this, the samples were then gradually transitioned from coarse (about 800 mesh) to fine sandpaper (2000 mesh) until the visual surface was smooth. The rock samples were then placed into an argon ion polishing instrument, where the smooth surfaces were further polished with an oil-based polishing fluid. Afterward, the rock samples were baked at 60 °C for 4 h, cooled to room temperature, and gold plated. The samples were finally observed and analyzed using a FEI Quanta 450 FEG scanning electron microscope (Thermo Fisher, Waltham, MA, USA).
3.2.3. X-ray Diffraction of Whole Rocks and X-ray Diffraction of Clay Analysis
As per the X-ray diffraction analysis method for clay minerals and non-clay minerals in sedimentary rocks (SY/T 5163-2018) [47], the rock samples were dried at a temperature of 60 °C for 4 h and cooled to room temperature. Next, the rock samples were ground thoroughly in an agate mortar until all the particles were less than 40 microns, or until no grains could be felt when rubbed with fingers. Then, the ground powder rock samples were placed in the groove of the glass rock sample holder and uniformly compacted with a glass slide. The surface of the rock sample was smooth and flat on the same horizontal plane as the edge of the rock sample holder. The whole-rock mineral contents were tested using a D8 Discover X-ray diffractometer (Bruker, Karlsruhe, Germany).
The rock samples were crushed to a 1 mm particle size, 6 g rock sample powder was placed in a 200 mL beaker, and the rock solution was processed with an ultrasonic crusher. If clay particles were suspended, about 50 mL of the clay solution from above was extracted with a syringe and placed in a centrifuge tube and centrifuged at a speed of 3000 rpm for 30 min. If clay particles were not suspended, an appropriate amount of hydrogen peroxide was added to remove the carbonate and a small amount of organic matter in the solution until the solution no longer bubbled and no oil slicks formed, repeatedly washed until suspended, and then extracted and centrifuged. Subsequently, the clay particles obtained after centrifugation were smeared onto glass slides with a pipette. After they were naturally dried, a uniform and smooth natural clay orientation sheet was made, and the clay mineral content was tested using a D/MAX-3C X-ray diffractometer (Rigaku, Osaka, Japan).
3.2.4. Particle Size Image Analysis
Particle size testing often employs techniques such as screening analysis, sedimentation procedures, and thin-section analysis. Given that the YW oil reservoir is a low-permeability sandstone reservoir, the rock sample particles are well cemented and difficult to completely disperse. For this reason, this study adopted the thin-section analysis approach. As the core analysis method (GB/T 29172-2012), the production process is similar to that of the casting thin-section experiment. The retrieved rock sample was injected with color-dyed epoxy resin and affixed onto a glass slide. This sample was then ground down to an approximate thickness of 30 μm, allowing most of the sandstone particles to be penetrated with transmitted light. The observation and photography of the sample were conducted using a 59XC-PC polarizing microscope, followed by particle size image analysis using the CIAS 2.31 software.
3.2.5. High-Pressure Mercury Intrusion Experiment
Following the determination method for the rock capillary pressure curve (GB/T 29171-2012), standard rock samples were cut into a cylindrical shape of 25 mm × 25 mm. The rock samples were initially baked at a temperature of 120 °C for 4 h; then, they were placed in a dryer and baked again at a temperature of 80 °C for 2 h before use. The AutoPoreIV-9620 Automatic Mercury Injection Instrument (Micromeritics, Atlanta, GA, USA) was used for this test, which had a working pressure of 0~414 MPa, a working temperature of 10~35 °C, a contact angle of 140 °C, and surface tension of 480 mN/m, and the minimum pore throat radius that could be measured was about 3 nm. The room temperature was controlled below 20 °C, and the rock samples were loaded into the dilatometers. Sealing grease was evenly and continuously applied at the seal of the dilatometers, the sealing pads were sleeved, the sealing heads were tightened, and the sealing grease was evenly applied at 2 cm to 3–5 cm from the bottom of the dilatometer rod to ensure complete sealing. The dilatometers were then placed into the low-pressure chamber for vacuuming, and when the vacuum was pumped to 50 μmHg, the mercury switch was activated. After the mercury injection was completed, the total mass of the rock samples after mercury injection was weighed using the dilatometers. After weighing, the rock samples were loaded into two high-pressure chambers in order, and high-pressure analysis started to identify the displacement pressure, median pressure, capillary pressure curve, and pore structure characteristic parameters.
3.2.6. Relative Permeability and a Water-Driving Oil Experiment
In accordance with the method for determining the relative permeability of two-phase fluids in rocks (GB/T 28912-2012) [48], the artificially configured simulated oil and simulated water were used in the experiment. The simulation oil was prepared via the mixing of kerosene and crude oil according to the viscosity of crude oil in the YW reservoir of 6.87 mPa·s. The simulated water was prepared based on the viscosity of the formation water and the injected water, which was about 1 mPa·s, with a salinity of 80 g/L. Throughout the experiment, the confining pressure was maintained at 12 MPa. The dried rock samples were put into a vacuum container for extraction, following which the formation water was drawn into the vacuum container, completely submerging the rock samples for 48 h to procure a saturated formation water sample. A formation temperature of 58.5 °C was simulated, and the unsteady state test was carried out using a HBXS-70 high-temperature and high-pressure two-phase fluid relative permeability instrument (Huabao, Wuxi, China).
In the initial phase of the experiment, oil-driving water was applied using simulated oil at a speed of 0.1 mL/min. This speed was incrementally adjusted upwards until no water was observed to exit from the rock sample. The total water production at the conclusion of the oil-driving water was calculated, and the irreducible water saturation was determined using a weighing method. In the subsequent phase, the oil phase’s effective permeability under the irreducible water saturation condition was measured thrice consecutively, maintaining a relative error margin of less than 3%. The rock sample was then subjected to an aging process for 48 h at the formation temperature. This procedure was performed to obtain rock wettability that closely mirrored the wettability of the reservoir. In the final stage, water-driving oil was implemented using simulated water at a displacement speed of 0.5 mL/min. Recordings of the pressure at the rock sample’s inlet, the displacement pressure difference at both ends, the total liquid production, and the total oil production at the rock sample’s outlet were made at varying intervals. This continued until the water content at the rock sample’s outlet reached 99.95% or after the water was injected at 30 times the pore volume. Following the conclusion of the experiment, the permeability of the water phase under residual oil conditions was measured.
The water-driving oil experiment was carried out with the same steps for water-driving oil used in the relative permeability experiment. The displacement pressure at the inlet end, displacement time, and oil production and water production at the outlet end were recorded during the displacement process. Throughout the water-driving oil process, the pore volume multiples of the initial simulated water droplet falling into the measuring cylinder were noted, and the anhydrous recovery rate was calculated. Data corresponding to different pore volume multiples were recorded until no oil was detected at the exit, signifying the termination of the experiment. The oil displacement efficiency at 95%, 98%, and 100% water cuts was calculated so as to obtain the relationship between oil displacement efficiency and the injection pore volume multiples.
3.2.7. Wettability Test Experiment
According to the method for determining the wettability of reservoir rocks (SY/T 5153-2017) [49], the water-flooding oil experiment was first carried out, which applied the same steps as the water-driving oil in the relative permeability experiment. Upon the conclusion of the experiment, the rock samples were promptly retrieved, and any surface oil residues were swiftly wiped off. The samples were then immediately placed into a water absorption instrument with formation water filled up to the half of the scale. The interfaces were secured with Vaseline. Once the oil discharge had stabilized for a continuous six-hour span, the self-absorbed oil discharge from the rock samples was noted. In a similar vein, following the completion of the oil-driving water experiment, any surface water was quickly eliminated from the samples, which were subsequently positioned into an oil suction instrument. The self-absorbed water discharge from the rock samples was logged when the water discharge had remained constant for an unbroken six-hour period. The wettability of the rock samples was determined via measuring and comparing the self-absorbed water discharge and self-absorbed oil discharge.
4. Results and Discussion
4.1. Analysis of Micro-Heterogeneity Characteristics of Reservoirs
4.1.1. Interstitial Material Heterogeneity
The mineral composition of each sample, as observed under a thin-section, scanning electron microscope, and analyzed using whole-rock and clay X-ray diffraction data (Figure 3 and Figure 4), showed no significant variation in the YW oil reservoir. The samples were primarily composed of quartz sandstone with high compositional and structural maturity. Quartz, the main mineral, averaged 87.6%. Clay minerals, consisting of illite and kaolinite, accounted for an average of 5.6%. Under the scanning electron microscope, kaolinite filled the pores in a book-page-like structure (Figure 4a), while illite appeared filamentous (Figure 4b). The interstitial materials were mainly kaolinite, siderite (Figure 4c), siliceous (Figure 4d), anhydrite (Figure 4e), limonite (Figure 4f), and feldspar (Figure 4g), amounting to 7.9% of the total pore volume. Anhydrite (1.9%) appeared cemented in patches. Siderite (1.4%) filled in around the particles in a nodular or radiating spherical structure. Siliceous (1.9%) filled the pores with single quartz crystals, commonly with secondary quartz enlargement on the edges. Feldspar (0.9%) filled the pores with aggregated twin-crystal plagioclase, striped feldspar, and lattice twin-crystal microcline feldspar, commonly with secondary enlargement of the feldspar edges. Limonite (0.9%) was mostly distributed around particles in an uneven-thickness film.
While the differences in mineral content and clay features among the five samples were not substantial, there were notable variations in the properties of the interstitial substances. Specifically, siderite and limonite barely regenerated once formed, resulting in a negligible effect on the modifications in the reservoir’s porosity. The secondary cementation of siliceous and feldspathic materials can lead to a decrease in reservoir porosity. Anhydrite, on the other hand, is highly susceptible to metasomatism and recrystallization [50], a critical diagenetic process that results in reduced reservoir porosity and permeability. The X3 sample contained the highest proportion of interstitial material, approximately 12.5%, primarily attributed to the high content of anhydrite (7.0%), leading to a drastic decrease in the surface porosity of the X3 sample (Figure 3 and Figure 4h,i). Due to the variance in the content and bonding methods of the interstitial materials, the reservoir exhibited significant micro-heterogeneity.
4.1.2. Pore Heterogeneity
- Qualitative Evaluation of Pore Heterogeneity
Analysis of sample casting thin sections and the utilization of scanning electron microscopy revealed that the predominant types of pore structure developed in the reservoir were intergranular pores (Figure 5a,e), feldspar dissolution pores (Figure 5b), and rock debris dissolution pores (Figure 5c,f). Fewer intergranular pores were observed (Figure 5d). The surface porosity averaged 6.05%, of which 3.20% was attributed to intergranular pores, 1.50% to feldspar dissolution pores, and 1.00% to rock debris dissolution pores. The pore combination type was a mix of dissolution pores and intergranular pores. The sorting ranged from medium to high quality, and the psephicity was predominantly sub-round to sub-angular. All types of pores served as bonding types, with point–line contact being the primary mode (Figure 5g), characterized by particle support (Table 1).
In the X3 sample, the porosity was minimized to a mere 3.50% (Figure 6) due to the cementing effect of anhydrite as an interstitial material, thereby reducing the intergranular pores. Despite this, the X3 sample exhibited well-sorted characteristics, sub-round psephicity (Figure 5i), and point–line contact, causing a weaker compaction effect. This resulted in the X3 sample possessing the least micro-heterogeneity when compared to the other samples. On the other hand, the X4 sample demonstrated medium sorting with psephicity ranging from sub-round to sub-angular and linear contact (Figure 5h), leading to a strong compaction effect. Hence, the X4 sample showed the highest micro-heterogeneity compared to the other samples. The proximity of the five wells used for this coring was notable, with a mere 600 m separating the X3 and X4 wells (Figure 1c). However, due to the complex nature of the diagenetic process, significant differences in pore structure, compositional maturity, and cementation type emerged, resulting in pronounced micro-heterogeneity.
- Quantitative Evaluation of Pore Heterogeneity
The shape of the high-pressure mercury intrusion curve offered a direct representation of pore structure attributes like the extent of pore development, connectivity, and pore throat sorting. Pore heterogeneity can be evaluated quantitatively using specific test parameters. The parameters of the high-pressure mercury intrusion curve of each sample in the YW oil reservoir varied greatly, and the mercury removal efficiency was generally low (Figure 7), indicating that the reservoir pore heterogeneity was strong. Based on the pore structure parameters and the curve shape from the high-pressure mercury intrusion, the pore heterogeneity was categorized into three types, ranging from good to poor: Type I, Type II, and Type III (Figure 8a). Type I (the X2 and X3 samples) was characterized by low displacement and median pressure, an extended plateau duration, a large pore throat radius, and excellent pore throat connectivity and sorting, along with high mercury removal efficiency. Type III (the X4 sample), on the contrary, exhibited high displacement and median pressure, a short plateau duration, a small pore throat radius, subpar pore throat connectivity and sorting, and low mercury removal efficiency. Type II (the X1 and X5 samples) represented intermediate conditions.
High-pressure mercury intrusion analysis showed distinct characteristics in the pore size distribution curve for the three different types (Figure 8b). Type I was marked with a single peak shape, primarily comprising large pore throats, predominantly ranging from 1.6 to 10.0 um. Type II also presented a peak shape but with a smaller proportion of large pore throats, favoring medium pore throats instead and showing an uptick in the frequency of small pore throats, within a range of 0.63 to 2.50 um. Type III was characterized by a bimodal distribution, lacking in large pore throats, and primarily incorporating small pore throats, notably within 0.063 to 0.630 um.
Upon comparing the X2 and X3 samples, it became evident that the X3 sample showcased a longer plateau period, demonstrating good sorting. In contrast, the X2 sample’s plateau period was short. Following the attainment of 50% mercury saturation, the curve depicted a rapid growth trend, suggesting the filling of the large pore throat with mercury. A substantial increase in injection pressure would be inevitable if mercury continued to infiltrate the smaller pore throat. The X3 sample’s curve exhibited a pronounced growth trend at around 80% mercury saturation, indicating the existence of more effectively connected large pore throats, higher mercury saturation, and superior mercury removal efficiency in X3. The pore heterogeneity in the X2 sample was stronger than that in the X3 sample.
When comparing samples X1 and X5, the mercury injection and withdrawal curves were essentially identical, with negligible differences in the displacement pressure, median pressure, and pore throat radius. Nevertheless, the X5 sample had good sorting and high mercury withdrawal efficiency, suggesting weak pore heterogeneity and good pore throat connectivity.
Through evaluating the pore heterogeneity parameters, the heterogeneity of the five samples could be ranked from highest to lowest in the following order: X4 > X1 > X5 > X2 > X3.
- The Relationship between Pore Structure and Pore Heterogeneity
The pore structures of the reservoir, as depicted in Figure 6, predominantly consist of intergranular pores, feldspar dissolution pores, and rock debris dissolution pores. Intergranular pores serve as the primary porosity, persisting as intergranular spaces within the reservoir post-compaction, acting as the principal pathways for oil and gas seepage. Feldspar and rock debris dissolution pores, on the other hand, represent the secondary porosity. These are pore spaces created via secondary dissolution transformations, serving as secondary seepage channels for oil and gas. The relationship between pore structure and pore heterogeneity serves mainly to analyze the contribution of pores and throats in the pore structure to oil and gas seepage. In the capillary pressure curve, the mercury entry curve is the sum of the throat volume and pore volume, and the mercury withdrawal curve only reflects the volume of the throat, while the residual mercury saturation reflects the size of the pore, and the residual mercury mainly exists in the pore. Therefore, the relationship between the pore structure and pore heterogeneity can be analyzed using the pore throat volume ratio and pore structure. The pore throat volume ratios of rock samples can be calculated using the following formula [51]:
where is the pore throat volume ratio, is the residual mercury saturation %, and is the maximum mercury saturation %.
The smaller the pore throat volume ratio, the more developed the throat, the more favorable the migration of oil and gas, and the more easily the oil and gas in the pore can be displaced through the throat; on the contrary, a larger pore throat volume ratio is not conducive to the migration and enrichment of oil and gas and later mining. The pore throat volume ratio of the X3 sample was the smallest (Table 2), indicating that the throat was the most developed and the main oil and gas seepage channel. This finding can explain the reason why the X3 sample had low surface porosity, low permeability, and low displacement pressure.
An examination of the relationship curve between the pore throat volume ratio and both intergranular pores and surface porosity revealed a weak correlation (Figure 9). This suggests a limited association between the pore structure and its heterogeneity. While the pore structure signifies the manner in which pores exist, it does not define the proportion of effective pore throats or their contribution to seepage. Therefore, an integrated approach involving sorting, roundness, and contact methods is essential to accurately assess pore heterogeneity.
4.1.3. Particle Heterogeneity
The debris primarily consisted of medium to coarse sand particles, with medium sand accounting for 75.3% on average, and coarse sand accounting for 23.1%. There was a small amount of fine sand and very coarse sand present. Notably, the X4 sample had the highest proportion of coarse sand. According to the SY/T 5368-2016 standard, the X4 sample was identified as arenaceous medium-grained sandstone, while the other samples were categorized as medium-grained sandstone.
Particle size distribution characteristics can be analyzed using a frequency curve of particle size distribution. A single peak frequency curve with a narrow spread and high peak suggests good sorting and minimal micro-heterogeneity. Conversely, a wide spread and low peak indicate poor sorting and substantial micro-heterogeneity [52,53]. The bimodal frequency curve signifies mixed deposition, with poor to moderate sorting. If two peaks are close together and high, this suggests good sorting. However, wide peaks and a low peak suggest poor sorting. Based on the logarithmic normal distribution frequency curve of the particle size of the samples (Figure 10), all samples had a single peak. The X3 sample had the narrowest spread and the highest peak, suggesting minimal micro-heterogeneity. The X4 sample had the widest spread and the lowest peak, indicating maximum micro-heterogeneity. Standard particle size parameters, such as average particle size, standard deviation, skewness, and kurtosis, were evaluated for micro-heterogeneity [53,54]. According to Folk and Ward’s criteria [55,56], the X4 sample was an arenaceous medium-grained sandstone, but it had the lowest average particle size of only 1.12 mm. It also had the lowest kurtosis value, substantial skewness, and the highest micro-heterogeneity. The X2 sample had a medium particle size, maximum standard deviation, low kurtosis, high skewness, and significant micro-heterogeneity. The X3 sample had the largest average size, smallest standard deviation, highest kurtosis, and minimal micro-heterogeneity (Table 3). The heterogeneity of X2, X3, and X4 could be observed, with their respective rankings from highest to lowest being: X4, X2, and then X3. Upon comparing the samples of X1, X2, and X5, it was found that the X2 sample exhibited the greatest standard deviation and skewness, marking it as the most heterogeneous among the three. Despite the X5 sample having the largest mean particle size, its standard deviation and skewness surpassed those of the X1 sample. This indicated a diverse composition in the size and particle distribution of the X5 sample, resulting in a low sorting coefficient. Consequently, the heterogeneity of the X5 sample was more pronounced than that of the X1 sample. Evaluating the parameters of particle heterogeneity enabled the samples’ micro-heterogeneity to be ranked from highest to lowest as follows: X4 > X2 > X5 > X1 > X3.
Particle heterogeneity is influenced by the initial sedimentary environment. On the other hand, the interstitial material and pore heterogeneity are predominantly governed by sedimentary facies and diagenetic processes. Originally, the variability in the sandstone reservoir’s material composition and primary pore development was dictated by the sedimentary environment. Later on, diagenesis reshaped the original accumulation material and primary pores, intensifying the interstitial material and pore heterogeneity. The micro-heterogeneity becomes more pronounced with larger variances in sedimentary facies and diagenetic processes across regions.
Despite the proximity of the five rock samples, the interstitial material characteristics varied significantly, demonstrating strong heterogeneity. The maturity of the pore structure also differed greatly, with clear classifications in capillary pressure curves and pore throat distribution, indicating high pore heterogeneity. The particle size distribution characteristics were still different, reflecting particle heterogeneity. Lastly, different evaluation results for each micro-heterogeneity factor implied that the overall micro-heterogeneity of the sandstone reservoir was determined by the combined heterogeneity of the interstitial material, pores, and particles.
Micro-heterogeneity not only influences the physical properties of reservoirs but also restricts the accumulation and distribution of oil and gas. Additionally, it impacts the permeation characteristics and effectiveness of water injection development of reservoirs. This research incorporated relative permeability experiments, water-drive oil experiments, wettability tests, and the analysis of water cut changes to illuminate the mechanism of micro-heterogeneity’s impact on reservoir development.
4.2. Analysis of the Impact of Micro-Heterogeneity on Reservoir Water Injection Development
4.2.1. The Relationship between Micro-Heterogeneity and Relative Permeability
- Analysis of Experimental Data on Relative Permeability
The gas measurement of the sample exhibited an average porosity of 15.9%, with an average permeability of 14.5 mD. The average oil phase permeability in the presence of irreducible water was 3.62 mD, showing high water saturation of 54.1%. At the isotonic point, the average oil–water phase permeability was 0.089 mD, and the water saturation was 62.8%—all samples exceeded 50%, indicating hydrophilic wettability. The average water phase permeability of the residual oil was 0.99 mD, with a water saturation of 66.6%. The oil–water co-permeability zone had an average water saturation of 12.5%, signifying a narrow co-permeability zone.
The X1 sample exhibited the highest permeability, with the lowest water saturation of 48.9%, which includes the proportion of irreducible water, and it also had the highest water phase permeability in the presence of residual oil. Among all the samples, the X2 sample had the highest saturation of irreducible water, reaching 63.3%. At the isotonic point, the water saturation peaked at 71.6%. The residual oil with the highest water saturation was at 75.0%. Although the permeability of sample X3 was the lowest at only 1.91 mD, it had the widest range of oil–water co-permeability (Table 4).
- Analysis of the Characteristics of the Relative Permeability Curve
The relative permeability curve of the investigated area exhibited a concave upward type in the water phase, aligning with the standard shape for oil–water relative permeability curves (Figure 11) [57,58]. Initially, a rapid decline was observed in the oil phase permeability curve, which gradually decelerated as water saturation increased. Conversely, the rate of increase in water-phase permeability accelerated with the rise in water saturation, displaying a single inflection point on the curve.
The area under investigation was a low-permeability oil reservoir. When compared to conventional oil reservoirs, its relative permeability curve was distinguished by high irreducible water saturation, a narrow co-permeability interval, and low water-phase relative permeability. This is primarily due to the low porosity of low-permeability samples, where water occupies smaller pores, and oil flows through larger ones. With increasing water saturation, oil loses its continuity and exists as droplets within larger pores, obstructing the flow of the water phase. As a result, under conditions of residual oil saturation, the relative permeability of the water phase is generally low.
The primary factors impacting the oil–water relative permeability curve encompass micro-heterogeneity (such as rock heterogeneity, pore structure and distribution, and rock wettability), reservoir physical properties, fluid characteristics (like fluid type, saturation and distribution, and viscosity), interfacial tension, and formation temperature. The relative permeability curve shapes of the five samples were essentially similar, indicating that the seepage characteristics of different sand bodies within the same oil reservoir were largely consistent. Since the samples were all collected from the same oil reservoir, there were no significant differences in their fluid properties, formation temperatures, and interfacial tension. However, the complexity of reservoir sedimentation and diagenetic processes leads to certain differences in reservoir physical properties. This explains why different reservoir micro-heterogeneities and physical properties result in variations in irreducible water saturation, isotonic point saturation, and residual oil saturation. Therefore, it is crucial to study the relationship between the physical properties of the reservoir and relative permeability to clarify the weight of the influence of reservoir micro-heterogeneity and physical properties on relative permeability.
- Analysis of the Relationship between Reservoir Physical Properties and Relative Permeability
Typically, reservoir physical properties mainly refer to the porosity and permeability of reservoir rocks. In low-permeability reservoirs, the impact of porosity on reservoir development is relatively small, largely due to the influence of permeability. Generally, as core permeability increases, the reservoir shows a negative correlation, and at the same time, the irreversible water saturation and residual oil saturation decrease [59]. This is mainly reflected in two aspects. On one hand, the lower the sample permeability, the smaller the corresponding pore throat radius, the more significant the impact of capillary forces, and the greater the resistance encountered when the oil phase enters the sample. On the other hand, the lower the permeability of the sample, the larger the specific surface area of the pore, and the volume of the water film formed by the water phase on the pore surface increases, leading to an increase in irreversible water saturation.
In this study, a definitive positive correlation was observed between the air permeability of the X2, X4, and X5 samples and the water saturation during the irreducible water time, at the isotonic point, and with residual oil (Figure 12). The correlation coefficients were 0.9505, 0.907, and 0.8887, respectively, contradicting the theoretical expectations. The X1 sample exhibited the highest permeability and the lowest irreducible water saturation, yet it held the highest residual oil saturation at 38.3%, which also contrasted with the theory. The X3 sample, despite having the lowest permeability, displayed relatively low irreducible water and residual oil saturation, again conflicting with the theory. These findings suggest that the physical properties of the reservoir do not directly influence the development of the reservoir, but rather, the micro-heterogeneity of the reservoir plays a decisive role.
- The Relationship between Micro-Heterogeneity and Relative Permeability
The quantitative analysis of pore and particle heterogeneity in micro-heterogeneity is feasible. The co-permeability zone of the oil–water phase serves as a holistic reflection of irreducible water saturation, residual oil saturation, water-phase relative permeability, and relative permeability parameters at isotonic points. Hence, the correlation analysis between the co-permeability zone saturation, average pore throat radius, and average particle size was used to assess the impact of pore and particle heterogeneity on relative permeability.
From analyzing the regression curves of the co-permeability zone saturation in relation to the average pore throat radius and average particle size (Figure 13), it became clear that both factors demonstrated a strong positive correlation with the co-permeability zone saturation. This suggests that the samples within the higher co-permeability zone possessed a broader distribution of pore throat radius and an optimized pore throat structure. The interference of the two-phase fluid in the pore throat was minimal. A larger pore throat radius facilitates a better shared flow space for the oil–water phase, leading to a gradual increase in the water cut in such samples during the development process, without any sudden rise or water breakthrough incidents.
4.2.2. The Relationship between Micro-Heterogeneity and Oil Displacement Efficiency
The oil displacement efficiency of the samples averaged 7.5% during the anhydrous period, reaching a final efficiency of 26.7%. Notably, the X2 sample showed the highest oil displacement efficiency during the anhydrous period, at 10.9%; its final efficiency was also the highest, at 31.8%. Conversely, the X4 sample demonstrated the lowest efficiency during the anhydrous period, at just 5.0%; its final oil displacement efficiency was also the lowest, at 20.8% (Figure 14).
The correlation between the average pore throat radius, average particle size, and oil displacement efficiency during the anhydrous period was studied, as well as the final oil displacement efficiency (Figure 15). The data revealed a significant positive relationship between the average pore throat radius and average particle size with both the anhydrous period and final oil displacement efficiency. Notably, the pore throat radius displayed the strongest correlation with the final oil displacement efficiency, with a correlation coefficient above 0.9. This suggests that pore heterogeneity significantly influences the final oil displacement efficiency.
The graph illustrating the correlation between the waterflood injection ratio and oil displacement efficiency suggests that the waterflood curve of the sample can be categorized into three distinct types, as evidenced by clear demarcation lines (Figure 16). Specifically, X2 and X3 were classified under Type I, X1 and X5 under Type II, and X4 under Type III, which was consistent with the classification of the high-pressure mercury injection curve, indicating the strong correlation between pore heterogeneity and oil displacement efficiency. The cores in Type I exhibited high levels of pore connectivity, leading to relatively low resistance during water injection and, thus, high waterflooding efficiency due to the broad flooding area. Type II followed in performance, with Type III trailing behind as the least efficient.
While the X4 sample exhibited high permeability, it also demonstrated the most significant micro-heterogeneity, leading to the least effective water drive impact and the most restricted range of oil–water co-permeability. During the process of water injection development, the formation of a dominant channel can occur if the intensity of water injection is exceedingly high, or the pore throat has been washed to prolonged water injection. This can result in a swift surge in the water cut of oil wells. The pore structure within low-permeability oil reservoirs is characterized by significant differences. Greater micro-heterogeneity increases the likelihood of oil-phase interruption during water flooding, disrupting the continuous flow characteristics of the oil phase and enhancing the flow resistance of the injected water. This results in a rapid breakthrough of the injected water in channels with lower seepage resistance, reducing the sweep area of the water phase [60,61], and resulting in a lower final oil displacement efficiency.
4.2.3. The Relationship between Micro-Heterogeneity and Wettability
The permeability attributes and efficiency of oil displacement via water injection in a reservoir are significantly influenced by its wettability [62,63]. It is clear that the relative wettability index of all samples, barring X4, shares a robust positive correlation with both the oil displacement efficiency in the non-aqueous phase and the ultimate oil displacement efficiency (Table 5 and Figure 17). This suggests that a reservoir with a tendency towards hydrophilicity encourages water injection to act as a potential plug displacement. Such a process promotes uniform oil displacement in the reservoir, thus enhancing the overall efficiency. The leftover oil predominantly clings onto the surface of the rock particles, taking the form of an oil film.
The X2 sample demonstrated superior physical properties, weak micro-heterogeneity, a high wetting index, and the most efficient oil displacement during the anhydrous period. Conversely, the X3 sample, despite its inferior physical properties and weakest micro-heterogeneity, outperformed expectations. It had a low wetting index but still achieved a relatively high oil displacement efficiency both during the anhydrous period and in terms of the final oil displacement. As for the X4 sample, despite its excellent physical properties, strong micro-heterogeneity, and highest wetting index, it showed the least effective oil displacement during the anhydrous period and ultimately the lowest final oil displacement efficiency. These findings suggest that, while physical properties, micro-heterogeneity, and wettability all influence the oil displacement efficiency, it is micro-heterogeneity that plays the pivotal role. A lower degree of micro-heterogeneity tends to result in higher oil displacement efficiency.
4.2.4. The Relationship between Micro-Heterogeneity and the Water Cut Change Law
- Relationship between the Water Cut, Waterflood Front, and Water Saturation
The graph depicting the correlation between the water cut and water saturation (Figure 18) indicates that the water cut undergoes a slow rise during the early stages of water injection. This increase becomes more pronounced as the volume of injected water rises. However, in the final phase, the growth of the water cut begins to taper off. The patterns of the water cut elevation across all five samples were largely similar. The X3 sample, notable for its minimal micro-heterogeneity, most easily achieved a piston-type uniform displacement. Interestingly, as the water cut rose, its saturation increase was the least significant.
In the case of the relationship curve between the water cut () and water saturation (), we used Point (, 0) to draw a tangent to the water cut curve. Here, the x-coordinate of this tangent point represents the water saturation at the waterflood front (), and the y-coordinate signifies the water cut () at the same location. This tangent intersects a straight line, which has a water saturation value of 1, at another point. The x-coordinate of this intersecting point represents the average water saturation within the two-phase region () (Figure 19) [64]. During the process of water injection in oil reservoirs, the variations in physical attributes, primarily permeability, can induce a phenomenon known as ‘fingering’ at each reservoir’s waterflood front. We observed a direct correlation between the micro-heterogeneity of the reservoir and the difference in water saturation levels, i.e., the less the difference between the waterflood front and irreducible water, the more heterogeneous the reservoir. This micro-heterogeneity can increase the likelihood of ‘fingering’, which can consequently result in early water breakthroughs in oil wells [65,66].
A graphical method was used to ascertain the water saturation at the waterflood front of the sample. A significant discrepancy in water saturation was observed between the waterflood front and the irreducible water in the X3 sample (Table 6). This suggests that the X3 sample had the least micro-heterogeneity, displayed the longest phase of uniform piston-type displacement, and thus exhibited the most effective water injection development. By contrast, the X4 sample demonstrated the poorest performance in terms of water injection development.
The difference between the water saturation at the waterflood front and the isotonic point revealed that the waterflood front reached the isotonic point when the water saturation exceeded 1.0% within the waterflood front. This suggests that prolonging the oil recovery period devoid of water, deferring the increase in the water cut, and preventing the reservoir’s water saturation from hitting the isotonic point prematurely can boost the effectiveness of water injection development. When the water saturation surpassed 0.3% of the isotonic point, the X4 sample hit the waterflood front, indicating the highest micro-heterogeneity and the oil well’s susceptibility to an early water breakthrough.
The difference in water saturation between the residual oil and the waterflood front demonstrated that the gap in the X3 sample’s water saturation was the most significant. This suggests that after reaching the waterflood front, the reservoir can sustain a fairly low water cut rise rate for water injection development, ensuring more even water flooding than other reservoirs and thereby achieving optimal development outcomes.
- Relationship between the Water Cut, Water Saturation, and the Water Cut Increase Rate
The correlation graph between the water cut increase rate and the water cut (Figure 20) highlights substantial variations in the water cut increase across different reservoirs within the same oil field. The X1 sample exhibited the greatest water cut increase rate, whereas the X2 sample showed the lowest. Although the X3 and X4 samples demonstrated distinct micro-heterogeneity, they followed a nearly identical pattern in terms of the water cut increase rate. However, the connection between the rate of the water cut increase and micro-heterogeneity remained ambiguous. By studying the relationship between the water cut increase rate and the water cut, we could provide further clarity on the connection with micro-heterogeneity. Using the permeability curve, we could derive a mathematical model, shown as Formula 2, that characterizes the relationship between the water cut and its increase rate.
where is the water content %, is the irreducible water saturation %, is the increase rate of the water content %, and A and b are coefficients that are generally mainly influenced via rock and fluid properties, such as viscosity, temperature, pore structure, and wettability.
The correlation between the rate of the water cut increase and irreducible water saturation was evident (Figure 21, Formula 2). As irreducible water saturation rose, the rate of the water cut increase tended to decrease. Notably, samples X3 and X5 had an identical irreducible water saturation at 50.7%, yet their water cut increase rates varied. This discrepancy, as per Formula 1, can be attributed to the variable ‘b’. Despite being sourced from the same oil reservoir, with identical basic properties such as viscosity and temperature, these samples exhibited different pore structures. These variations indicated micro-heterogeneity, thus suggesting that the primary determinants of the water cut increase rate are irreducible water saturation and micro-heterogeneity. In scenarios where irreducible water saturation varies, it becomes the critical factor for the water cut increase rate. However, if the irreducible water saturation remains constant, the role of micro-heterogeneity diminishes, impacting the water cut increase rate inversely. Samples X3 and X4, despite having different irreducible water saturation, displayed essentially similar water cut increase patterns. This implies that the reservoir’s micro-heterogeneity governs the water cut increase rate for samples X3 and X4.
4.2.5. Production Dynamic Verification
The commencement dates for oil wells tended to be inconsistent when comparing and analyzing the production performance of different samples corresponding to different oil wells through time alignment (Figure 22). For example, well X1 exhibited the highest water cut during the initial production phase. Although it maintained high water cut production, it also showed the highest increase rate. As water injection development progresses, the water cut is expected to rise sharply in the later stages. After 60 months of operation, wells X2 and X3 displayed a stable water cut, hovering around 60%. This stability can be attributed to high irreducible water saturation, weak micro-heterogeneity, favorable well physical properties, and a low water cut increase rate. Additionally, well X2 exhibited the longest period of anhydrous oil recovery. Well X3, displaying the weakest micro-heterogeneity, was the most conducive to achieving piston-type uniform displacement, resulting in a relatively low water cut increase. Despite occasional fluctuations during development, the water cut remained generally stable. The water cut patterns of wells X4 and X5 were basically consistent, beginning with a low water cut in the initial production phase. Owing to micro-heterogeneity impacts, the water cut varied with water injection development until high permeability channels formed, causing the water cut to surge or ascend in a stepwise fashion. Analyzing the production performance revealed that, in a standard water injection development process, if the production wells under study belonged to the same reservoir, were not affected by geological variables such as faults and cracks, and had similar initial transformation scales without subsequent transformation measures, the micro-heterogeneity of the reservoir directly influenced the water cut change in the production wells.
Analysis of micro-heterogeneity’s impact on water injection development in low-permeability sandstone oil reservoirs led to the formation of a technical strategy adjustment method.
Initially, during the early stage of water injection development, it is crucial to identify the micro-heterogeneity of oil wells in different well groups within the reservoir. Microsphere profile control and flooding should be implemented in the water injection well areas corresponding to oil wells with strong micro-heterogeneity. This helps prevent the premature formation of water-injection-dominant channels and reduces the effects of water injection development.
Secondly, during the mid-stage of water injection development, the relationship between micro-heterogeneity and water cut change must be clarified, and the normal water cut rising trend of oil production wells should be grasped. If an abnormal rise in the water cut of oil production wells in the well group is observed, stratified water injection should be carried out promptly on the corresponding water injection wells. This ensures that the injected water can be evenly pushed forward to prevent finger-like sudden advancement.
Finally, for the water injection wells that have conducted stratified water injection, the micro-heterogeneity characteristics of the sand bodies opened via perforation in the injection wells should be taken into account. The dominant permeation channels should be identified, and the stratified injection distribution should be optimized, or profile control measures should be implemented. This helps reduce the water cut of the production wells and improve the efficiency of water injection development.
5. Conclusions
(1) The micro-heterogeneity of a reservoir is largely determined by the diversity of its interstitial material, porosity, and particle size. This micro-heterogeneity is a crucial factor in determining the flow characteristics and oil displacement efficiency within oil reservoirs. The less pronounced the micro-heterogeneity, the more effective the water injection development results.
(2) Micro-heterogeneity increases when the gap between water saturation at the leading edge of the water drive and the bound water is small. This heightened micro-heterogeneity leads to a higher likelihood of the fingering phenomenon, which can result in water’s premature appearance in oil wells. While bound water saturation is a major determinant of the water cut increase rate in scenarios with different bound water saturations, in cases with uniform bound water saturation, the weaker the micro-heterogeneity, the slower the water cut increase rate. Hence, the water injection development effect is more efficient.
(3) A method to adjust technical policies to guide the development of low-permeability water injection oil reservoirs has been established. This system, characterized by its scientific and practical approach, simplicity, and speed, offers valuable technical support to similar low-permeability sandstone oil reservoirs, thereby enhancing the efficacy of water injection development. It holds great potential for practical application.
Author Contributions
Conceptualization, methodology, formal analysis, and writing—original draft preparation, M.L.; investigation and data curation, M.W. and W.R.; validation, resources, and writing—review and editing, Z.Q. All authors have read and agreed to the published version of the manuscript.
Funding
This research was funded by the National Natural Science Foundation of China (No. 52274007 and No. 51974255).
Data Availability Statement
All datasets generated for this study are included in the article, further inquiries can be directed to the corresponding author.
Acknowledgments
The authors are grateful for the equipment support of the Key Laboratory of Well Stability and Fluid & Rock Mechanics in Oil and Gas Reservoir of Shaanxi Province, as well as the editors and anonymous reviewers for their constructive comments and suggestions, which greatly improved the quality of the manuscript.
Conflicts of Interest
The authors declare no conflict of interest. M.W. and W.R. are employees of Changqing Oilfield Company. The company had no roles in the design of the study; in the collection, analysis, or interpretation of data; in the writing of the manuscript, or in the decision to publish the articles. The paper reflects the views of the scientists and not the company.
References
- Chen, Z.B.; Fu, L.; Chen, X.J.; Zhang, T.; Xie, Y.H.; Wang, H.B. Quantitative Evaluation Method for Micro Heterogeneity of Tight Sandstone: A case study of Chang-6 reservoir of Yanchang Formation in Huaqing area, Ordos Basin. ACTA Sedimentol. Sin. 2021, 39, 1086–1099. [Google Scholar] [CrossRef]
- Pettijohn, F.J.; Potter, P.E.; Siever, R. Sand and Sand-Stone; Springer: Berlin, Germany, 1973; pp. 550–554. [Google Scholar]
- Haldorsen, H.H. Reservoir Characterisation Procedures for Numerical Simulation; University of Texas at Austin: Austin, TX, USA, 1983. [Google Scholar]
- Weber, K.J. How heterogeneity affects oil recovery. In Reservoir Characterization; Academic Press: Orlando, FL, USA, 1986; pp. 487–543. [Google Scholar]
- Aigner, T.; Heinz, J.; Hornung, J.; Asprion, U. A hierarchical process-approach to reservoir heterogeneity: Examples from outcrop analogues. Bull. Cent. Rech. Explor. Prod. 1999, 22, 531. [Google Scholar] [CrossRef]
- Qiu, Y.N. Developments in reservoir sedimentology of continental clastic rocks in China. Acta Sedimentol. Sin. 1992, 10, 16–24. [Google Scholar]
- Wang, S.Q. A Heterogeneous Model Describing the Heterogeneity of the Production Reservoir in Shuanghe Oil Field. Pet. Expolor. Dev. 1987, 01, 61–69. [Google Scholar]
- Lai, J.; Wang, G.; Wang, Z.; Chen, J.; Pang, X.; Wang, S.; Zhou, Z.; He, Z.; Qin, Z.; Fan, X. A review on pore structure characterization in tight sandstones. Earth-Sci. Rev. 2018, 177, 436–457. [Google Scholar] [CrossRef]
- Chen, Z.K.; Yu, X.H.; Li, S.L. Sedimentary Microfacies and Heterogeneity in Fault Block Reservoir Shu266, Shuguang Oilfield, Bohai Gulf Basin. J. Geomech. 2006, 12, 91–95. [Google Scholar]
- Dong, L.F.; Zhang, D.X. Method of Indoor Experiment and Its Monitoring on Water Flooding in Micro Heterogeneity Reservoir. Sci. Technol. Eng. 2018, 18, 190–194. [Google Scholar]
- Fan, C.W.; Cao, J.J.; Luo, J.L.; Li, S.S.; Wu, S.J.; Dai, L.; Hou, J.X.; Mao, Q.R. Heterogeneity and influencing factors of marine gravity flow tight sandstone under abnormally high pressure: A case study from the Miocene Huangliu Formation reservoirs in LD10 area, Yinggehai Basin, South China Sea. Pet. Explor. Dev. 2021, 48, 1048–1062. [Google Scholar] [CrossRef]
- Nan, F.C.; Lin, L.B.; Yu, Y.; Chen, Z.B.; Mu, S.C.; Wang, H.B.; Ji, G.H.; Ma, J.M. Application of backward elimination procedure in evaluation of microscopic reservoir heterogeneity in Chang 6 Member, Ordos Basin. Oil Gas Geol. 2022, 43, 1155–1166. [Google Scholar]
- Sun, S.W.; Shu, L.S.; Zeng, Y.W.; Cao, J.; Feng, Z.Q. Porosity–permeability and textural heterogeneity of reservoir sandstones from the Lower Cretaceous Putaohua Member of Yaojia Formation, Weixing Oilfield, Songliao Basin, Northeast China. Mar. Pet. Geol. 2007, 24, 109–127. [Google Scholar] [CrossRef]
- Jiang, Z.; Mao, Z.; Shi, Y.; Wang, D. Multifractal Characteristics and Classification of Tight Sandstone Reservoirs: A Case Study from the Triassic Yanchang Formation, Ordos Basin, China. Energies 2018, 11, 2242. [Google Scholar] [CrossRef]
- Guo, Q.; Dong, M.C.; Mao, H.B.; Ju, J.T. Micro-Scale Pore-Throat Heterogeneity of Tight Oil Sandstone Reservoirs and Its Influence on Fluid Occurrence State. Front. Earth Sci. 2022, 10, 959796. [Google Scholar] [CrossRef]
- Guo, Y.H.; Zhao, D.F. Analysis of micro-scale heterogeneity characteristics in marine shale gas reservoir. J. China Univ. Min. Technol. 2015, 44, 300–307. [Google Scholar] [CrossRef]
- Feng, X.; Peng, X.; Li, L.X.; Yang, X.F.; Wang, J.; Li, Q.; Zhang, C.; Deng, H. Influence of reservoir heterogeneity on water invasion differentiation in carbonate gas reservoirs. Nat. Gas Ind. 2018, 38, 67–75. [Google Scholar] [CrossRef]
- Ma, Y.; Li, W.H.; Liu, C.Y. Microscopic characteristics of water flooding and the affecting factors of low-permeability sandstone reservoir in Zhidan area, Ordos Basin, China. Energy Explor. Exploit. 2015, 33, 145–156. [Google Scholar] [CrossRef]
- Zhong, X.Y.; Zhu, Y.S.; Jiao, T.; Qi, Z.; Luo, J.H.; Xie, Y.H.; Liu, L.Y. Microscopic pore throat structures and water flooding in heterogeneous low-permeability sandstone reservoirs: A case study of the Jurassic Yan’an Formation in the Huanjiang area, Ordos Basin, Northern China. JAESc 2021, 219, 104903. [Google Scholar] [CrossRef]
- Sun, P.K.; Xu, H.M.; Zhu, H.Q.; Jia, L.B.; Hu, X.N.; Fang, H.J.; Jiang, H.Q.; Xu, Z.H.; Jiang, T.W.; Jiang, X.; et al. Investigation of pore-type heterogeneity and its control on microscopic remaining oil distribution in deeply buried marine clastic reservoirs. Mar. Pet. Geol. 2021, 123, 104750. [Google Scholar] [CrossRef]
- Li, P.; Zheng, M.; Bi, H.; Wu, S.T.; Wang, X.R. Pore throat structure and fractal characteristics of tight oil sandstone: A case study in the Ordos Basin, China. J. Pet. Sci. Eng. 2017, 149, 665–674. [Google Scholar] [CrossRef]
- Xiao, P.F.; Leng, X.Y.; Xiao, H.M.; Sun, L.H.; Zhang, H.Q.; Mei, S.S.; Zhang, H.Y. Investigation effect of wettability and heterogeneity in water flooding and on microscopic residual oil distribution in tight sandstone cores with NMR technique. Open Phys. 2017, 15, 544–550. [Google Scholar] [CrossRef]
- Li, P.; Sun, W.; Wu, B.; Gao, Y.; Du, K. Occurrence characteristics and influential factors of movable fluids in pores with different structures of Chang 63 reservoir, Huaqing Oilfield, Ordos Basin, China. Mar. Pet. Geol. 2018, 97, 480–492. [Google Scholar] [CrossRef]
- Gao, Y.L.; Li, P.; Li, T. Influence of different pore structure types on the occurrence features of movable fluid in Chang-10 reservoir in Wuqi–Ansai Oilfield. J. Pet. Explor. Prod. Technol. 2021, 11, 1609–1620. [Google Scholar] [CrossRef]
- Zhang, F.; Jiang, Z.; Sun, W.; Zhang, X.; Zhu, L.; Li, X.; Zhao, W. Effect of Microscopic Pore-Throat Heterogeneity on Gas-Phase Percolation Capacity of Tight Sandstone Reservoirs. Energy Fuels 2020, 34, 12399–12416. [Google Scholar] [CrossRef]
- Yang, Y.B.; Xiao, W.L.; Zheng, L.L.; Lei, Q.H.; Qin, C.Z.; He, Y.A.; Liu, S.S.; Li, M.; Li, Y.M.; Zhao, J.Z.; et al. Pore throat structure heterogeneity and its effect on gas-phase seepage capacity in tight sandstone reservoirs: A case study from the Triassic Yanchang Formation, Ordos Basin. Pet. Sci. 2023, 28, 14211–14232. [Google Scholar] [CrossRef]
- Zhao, X.; Yang, Z.; Zhou, S.; Luo, Y.; Liu, X.; Zhang, Y.; Lin, W.; Xiao, Q.; Niu, Z. Research on Characterization and Heterogeneity of Microscopic Pore Throat Structures in Tight Oil Reservoirs. ACS Omega 2021, 6, 24672–24682. [Google Scholar] [CrossRef] [PubMed]
- Tong, Q.; He, D.B.; Xia, Z.H.; Huang, J.X.; Di, K.X.; Xu, F.; Guo, S.W. Influence of Reservoir Pore-Throat Structure Heterogeneity on Water-Flooding Seepage: A Case Study of Yanchang Formation in Ordos Basin. Minerals 2022, 12, 1243. [Google Scholar] [CrossRef]
- Wang, L.; Lv, D.; Hower, J.C.; Zhang, Z.; Raji, M.; Tang, J.; Liu, Y.; Gao, J. Geochemical characteristics and paleoclimate implication of Middle Jurassic coal in the Ordos Basin, China. Ore Geol. Rev. 2022, 144, 104848. [Google Scholar] [CrossRef]
- Cui, J.; Li, S.; Mao, Z. Oil-bearing heterogeneity and threshold of tight sandstone reservoirs: A case study on Triassic Chang7 member, Ordos Basin. Mar. Pet. Geol. 2019, 104, 180–189. [Google Scholar] [CrossRef]
- Ding, F.; Shi, C.Q.; Zhang, P.H. Characteristics of the Braided River Deposits in the Tenth Member of Jurassic Yan’an Formation From Jiyuan Area in the Western Ordos Basin, China. Pet. Sci. Technol. 2013, 31, 2422–2430. [Google Scholar] [CrossRef]
- He, Z.X. Ordos Basin Evolution and Petroleum; Petroleun Industry Press: Beijing, China, 2003. [Google Scholar]
- Zhao, Y.D.; Qi, Y.L.; Luo, A.X.; Cheng, D.X.; Li, J.H.; Huang, J.X. Application of Fluid Inclusions and Dating of Authigenic Illite in Reconstruction Jurassic Reservoirs Hydrocarbon Filling History, Ordos Basin. J. Jilin Univ. Earth Sci. Ed. 2016, 46, 1637–1648. [Google Scholar] [CrossRef]
- He, J.X.; Duan, Y.; Zhang, X.L.; Wu, B.X.; Xu, L.; Xia, J. Stratigraphic Correlation and Sedimentary Microfacies of Yan 9 Subsection of Yan′an Formation in Linzhen Area, Ordos Basin. Nat. Gas Geosci. 2012, 23, 291–298. [Google Scholar]
- Shi, Z.Q.; Han, Y.L.; Zhao, J.X.; Yang, Y.; Ji, X.L. Depositional System and Paleogeographic Evolution of the Middle Jurassic Yan’anian Stage in the Central and Southern Ordos Basin. Acta Geosicientia Sin. 2003, 24, 49–54. [Google Scholar]
- Zeng, D.; Li, S. Types and Characteristics of Low Permeability Sandstone Peservoirs in China. Acta Pet. Sin. 1994, 15, 38. [Google Scholar]
- Xu, Z.; Zhang, X.; Wu, S.; Zhao, Y. Genesis of the low-permeability reservoir bed of upper Triassic Xujiahe Formation in Xinchang gas field, western Sichuan Depression. Pet. Sci. 2008, 5, 230–237. [Google Scholar] [CrossRef]
- Wang, S.; Yang, X.; Lu, Y.; Su, P.; Liu, D.; Meng, L.; Wang, Q.; Li, L.; Radwan, A.E. Densification mechanism of deep low-permeability sandstone reservoir in deltaic depositional setting and its implications for resource development: A case study of the Paleogene reservoirs in Gaoshangpu area of Nanpu sag, China. Front. Earth Sci. 2022, 10, 996167. [Google Scholar] [CrossRef]
- Liu, Z.; Wu, S.; Xu, Z.; Guo, R.; Liu, Z.; Liu, J.; Jia, C.; Xu, Z. Impact of coal evolution on formation of tight sandstone reservoirs: A case study in the Daniudi gas field, Ordos Basin, China. Energy Explor. Exploit. 2023, 41, 1576–1602. [Google Scholar] [CrossRef]
- Shuai, Y.; Zhang, S.; Gao, Y.; Lu, H.; Chen, J.; Mi, J.; Liu, J.; Hu, G. Effect and quantitative evaluation of CO2 derived from organic matter in coal on the formation of tight sandstone reservoirs. Sci. China Earth Sci. 2013, 56, 756–762. [Google Scholar] [CrossRef]
- Pu, Y.; Li, S.; Tang, D.; Chen, S. Effect of Magmatic Intrusion on In Situ Stress Distribution in Deep Coal Measure Strata: A Case Study in Linxing Block, Eastern Margin of Ordos Basin, China. Nat. Resour. Res. 2022, 31, 2919–2942. [Google Scholar] [CrossRef]
- Sun, J.; Dong, X.; Wang, J.; Schmitt, D.R.; Xu, C.; Mohammed, T.; Chen, D. Measurement of total porosity for gas shales by gas injection porosimetry (GIP) method. Fuel 2016, 186, 694–707. [Google Scholar] [CrossRef]
- Rui-Lan, L.; Lin-Song, C.; Hua-Yin, Z.; Jian-Fei, L.; Hui, R. Problems on the Study of Slippage Effect in Low-Permeability Gas Reservoirs. Nat. Gas Ind. 2007, 27, 92–94. [Google Scholar]
- Zhu, G.Y.; Liu, X.G.; Li, S.T. A Study of Slippage Effect of Gas Percolation in Low Permeability Gas Pools. Nat. Gas Ind. 2007, 27, 44–47. [Google Scholar]
- Huang, H.; Sun, Y.; Chang, X.; Wu, Z.; Li, M.; Qu, S. Experimental Investigation of Pore Characteristics and Permeability in Coal-Measure Sandstones in Jixi Basin, China. Energies 2022, 15, 5898. [Google Scholar] [CrossRef]
- Wang, Y.; Zhou, S.; Liang, F.; Huang, Z.; Li, W.; Yan, W.; Guo, W. Reservoir Space Characterization of Ordovician Wulalike Formation in Northwestern Ordos Basin, China. Processes 2023, 11, 2791. [Google Scholar] [CrossRef]
- Zhang, S.; Zhao, F.; Liu, D.; Zhao, L.; Zhang, X.; Lin, J.; Dong, H.; Zhao, S.; Liu, X.; Zan, M. Modes of Occurrence of Critical Metal Elements (Li, REEs and Other Critical Elements) in Low-Grade Bauxite from Southern Shanxi Province, China. Minerals 2022, 12, 990. [Google Scholar] [CrossRef]
- Zhi, J.; Zhang, R.; Qu, G.; Jiang, N. Experimental Study on Stimulation of Horizontal Wells Filled with Film-Coated Gravel in Deep-Sea Bottom-Water Gas Reservoirs. ACS Omega 2022, 7, 9024–9032. [Google Scholar] [CrossRef]
- Li, H.; Yang, Z.; Zhou, T.; Li, H.j.; Liu, W.; Guo, H.; Dai, Y.; Luo, Y.; Zhang, Y. Analysis on the mechanism of the enforced imbibition effect of tight oil reservoir by the activated water. Energy Rep. 2023, 10, 3158–3165. [Google Scholar] [CrossRef]
- Xiong, J.Y.; Guan, P.; Han, D.K.; Zhang, W.T.; Wang, J.Y.; Luo, M.; Li, D.L. Diagenesis of anhedritite in the Cretaceous reservoir and its influence on the hydrocarbon distribution in southeast Jianghan Basin. Pet. Explor. Dev. 2007, 34, 39–42. [Google Scholar] [CrossRef]
- Li, D. The Development of the Low Permeability Sandstone Oil Field; Publishing House of Oil Industry: Beijing, China, 1997. [Google Scholar]
- Xue, T.Q. Investigation on Characteristics of Granulometric Distribution of Sediments in Low-permeability Sandstone Reservoir. Acta Sedimentol. Sin. 2006, 3, 414–418. [Google Scholar]
- Li, C.; Liu, M.; Guo, B. Classification of tight sandstone reservoirs based on NMR logging. Appl. Geophys. 2020, 16, 549–558. [Google Scholar] [CrossRef]
- Ding, Y.; Gao, Y.; Meng, Z.; Narengerile; Huang, X. Particle Size Characteristics of Wind Erosion Surface Soil in the Desert Steppe. Soils 2016, 48, 803–812. [Google Scholar] [CrossRef]
- Folk, R.L.; Ward, W.C. Brazos River bar: A study in the significance of grain size parameters. J. Sediment. Res. 1957, 27, 3–26. [Google Scholar] [CrossRef]
- Folk, R.L. A Review of Grain-Size Parameters. Sedimentology 1966, 6, 73–93. [Google Scholar] [CrossRef]
- Li, S.; Feng, Q.; Zhang, X.; Yu, C.; Huang, Y. A new water flooding characteristic curve at ultra-high water cut stage. J. Pet. Explor. Prod. Technol. 2022, 13, 101–110. [Google Scholar] [CrossRef]
- Lisha, Q.; Zhibin, J.; Xiaowei, W.; Jie, W.; Chuanchuan, Q.; Liu, H. Seepage Characteristics of a Low Permeability Sandstone Reservoir in Mobei Oilfield, Junggar Basin. Lithosphere 2021, 2021, 6944088. [Google Scholar] [CrossRef]
- Lv, C.Y. Experimental study on oil-water relative permeability under natural reservoir conditions. Pet. Explor. Dev. 2003, 30, 102–104. [Google Scholar] [CrossRef]
- Sun, H.; Yao, J.; Zhao, Y. Water displacement characteristics at the high water-cut stage based on microscopic experiments and simulations. Simulation 2019, 97, 155–166. [Google Scholar] [CrossRef]
- Zhou, S.; Zhou, Y.; Shi, J.; Zhu, Y.; Xiao, W.; Zhang, R. Micropore structure and water driving characteristics of tight sandstone reservoirs in Ordos Basin. J. Pet. Explor. Prod. Technol. 2021, 12, 601–612. [Google Scholar] [CrossRef]
- Aghaeifar, Z.; Strand, S.; Puntervold, T. Significance of Capillary Forces during Low-Rate Waterflooding. Energy Fuels 2019, 33, 3989–3997. [Google Scholar] [CrossRef]
- Jia, K.; Zeng, J.; Wang, X.; Li, B.; Gao, X.; Wang, K. Wettability of Tight Sandstone Reservoir and Its Impacts on the Oil Migration and Accumulation: A Case Study of Shahejie Formation in Dongying Depression, Bohai Bay Basin. Energies 2022, 15, 4267. [Google Scholar] [CrossRef]
- Henry, W.J. A Simplified Method for Computing Oil Recovery by Gas or Water Drive. J. Pet. Technol. 1952, 4, 91–98. [Google Scholar] [CrossRef]
- Zhao, F.; Shen, R.; Gao, S.S.; Xu, G. Application and Calculation Method of Waterflood Front in Low Permeability Reservoir. J. Jpn. Pet. Inst. 2014, 57, 271–275. [Google Scholar] [CrossRef]
- Wang, C.; Sun, Z.; Sun, Q.; Zhang, L.; Zhang, X. Comprehensive evaluation of waterflooding front in low-permeability reservoir. Energy Sci. Eng. 2021, 9, 1394–1408. [Google Scholar] [CrossRef]
Figure 1.
Area and structural location map of the sampling well. (a) Location and structural map of the Ordos Basin. (b) Histogram of strata, sedimentary systems, and structural evolution in the Ordos Basin. Among them, sedimentary facies indicate the appearance of sedimentary systems during each stratum’s sedimentary period, which could be a single system or a transition between multiple systems; the subfacies represent the main types of sedimentary subfacies. (c) Map showing the structure and location of the sampling well in the study area.

Figure 2.
Core structure photos of typical wells in the YW reservoir.

Figure 3.
The proportion of clay and interstitial content in the samples.

Figure 4.
Characteristics of sandstone reservoir cementation in the YW oil reservoir under an objective microscope. (a) X1, 2302.20 m, filled with book-shaped kaolinite (Kao) between particles. (b) X3, 2340.50 m, filamentous illite (It) cementitious pores. (c) X2, 2294.33 m, spherical siderite (Sd) filling pores. (d) X4, 2320.55 m, quartz enlargement (Qz). (e) X3, 2340.50 m, cemented with anhydrite (Anh). (f) X3, 2340.50 m, limonite (Lm) thin film surrounding particle distribution. (g) X5, 2263.90 m, feldspar enlargement (Pi). (h,i) X3, 2340.50 m, intergranular anhydrite (Anh) filling pores.
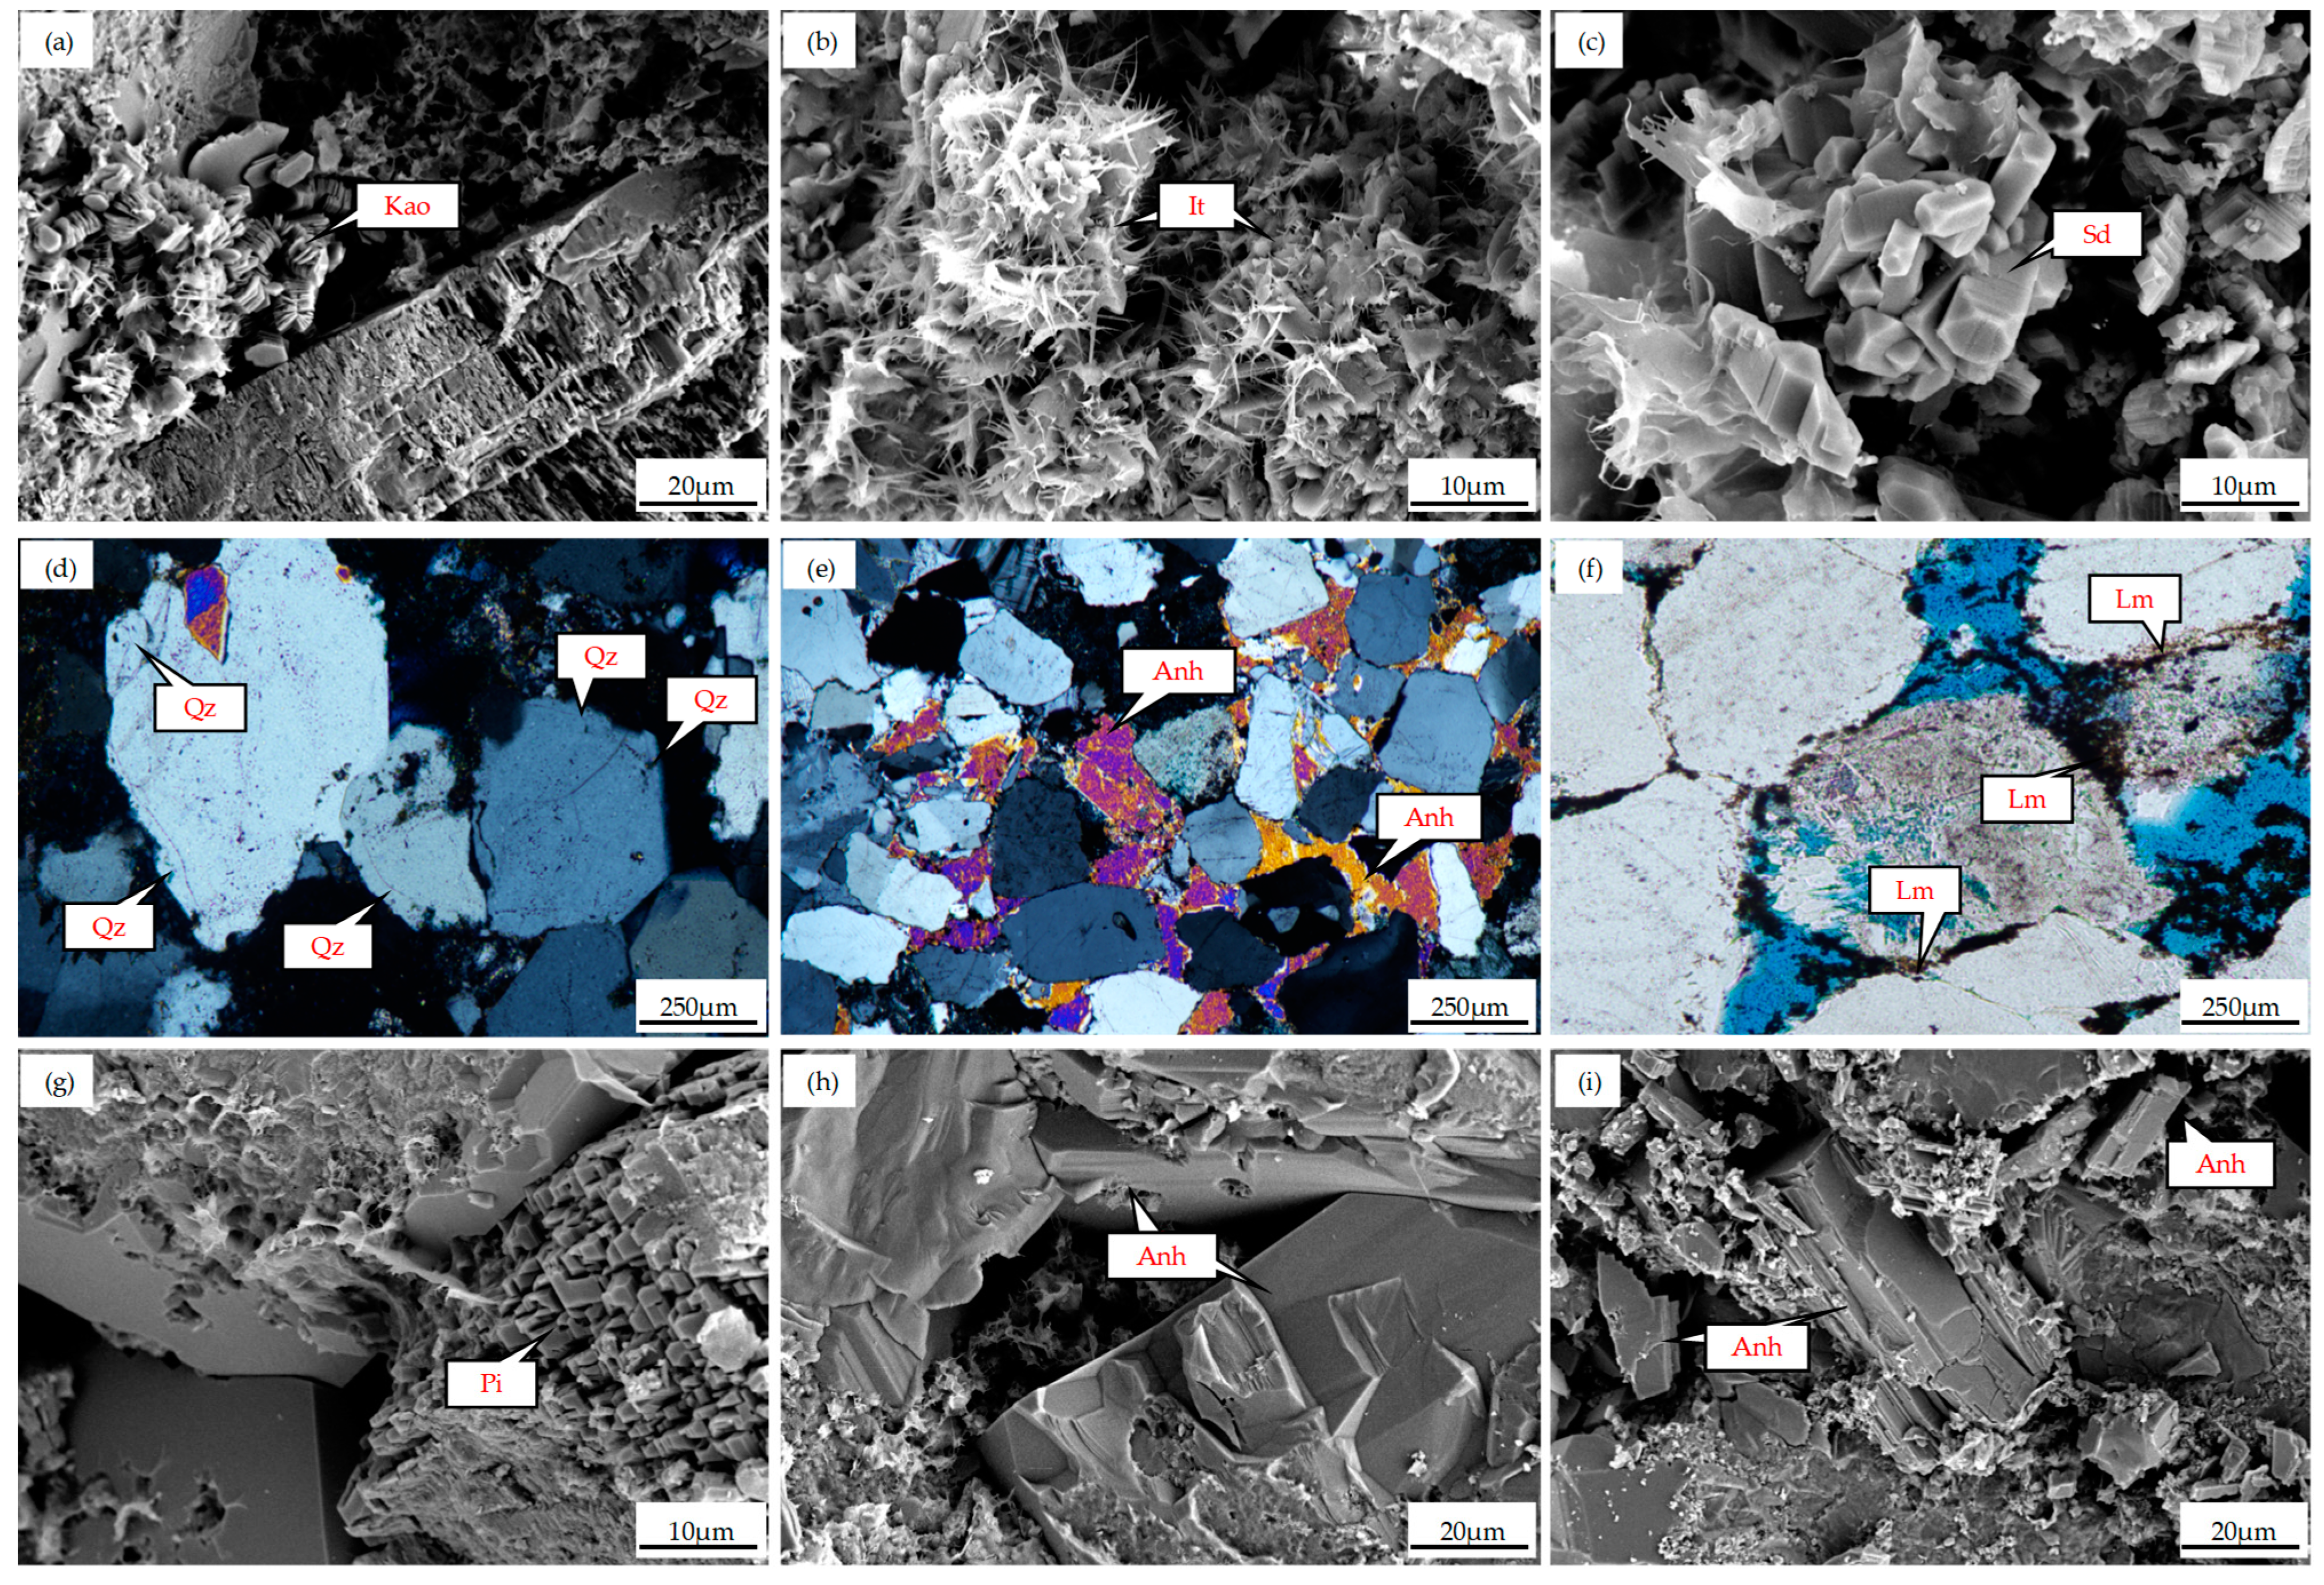
Figure 5.
Types and contact modes of sandstone reservoir space in the YW oil reservoir. (a) X2, 2294.33 m, intergranular pores (Igp). (b) X4, 2320.55 m, feldspar dissolution pores (Fdp). (c) X4, 2320.55 m, rock debris dissolution pores (Ddp). (d) X1,2302.20 m, kaolinite intergranular pores (Icp). (e) X1, 2302.20 m, intergranular pores (Igp) developed. (f) X5, 2263.90 m, rock debris dissolution pores (Ddp). (g) X1, 2302.20 m, point–line contact (Plc). (h) X4, 2320.55 m, line contact (Lc). (i) X3, 2340.50 m, sub-round psephicity (Rsc).
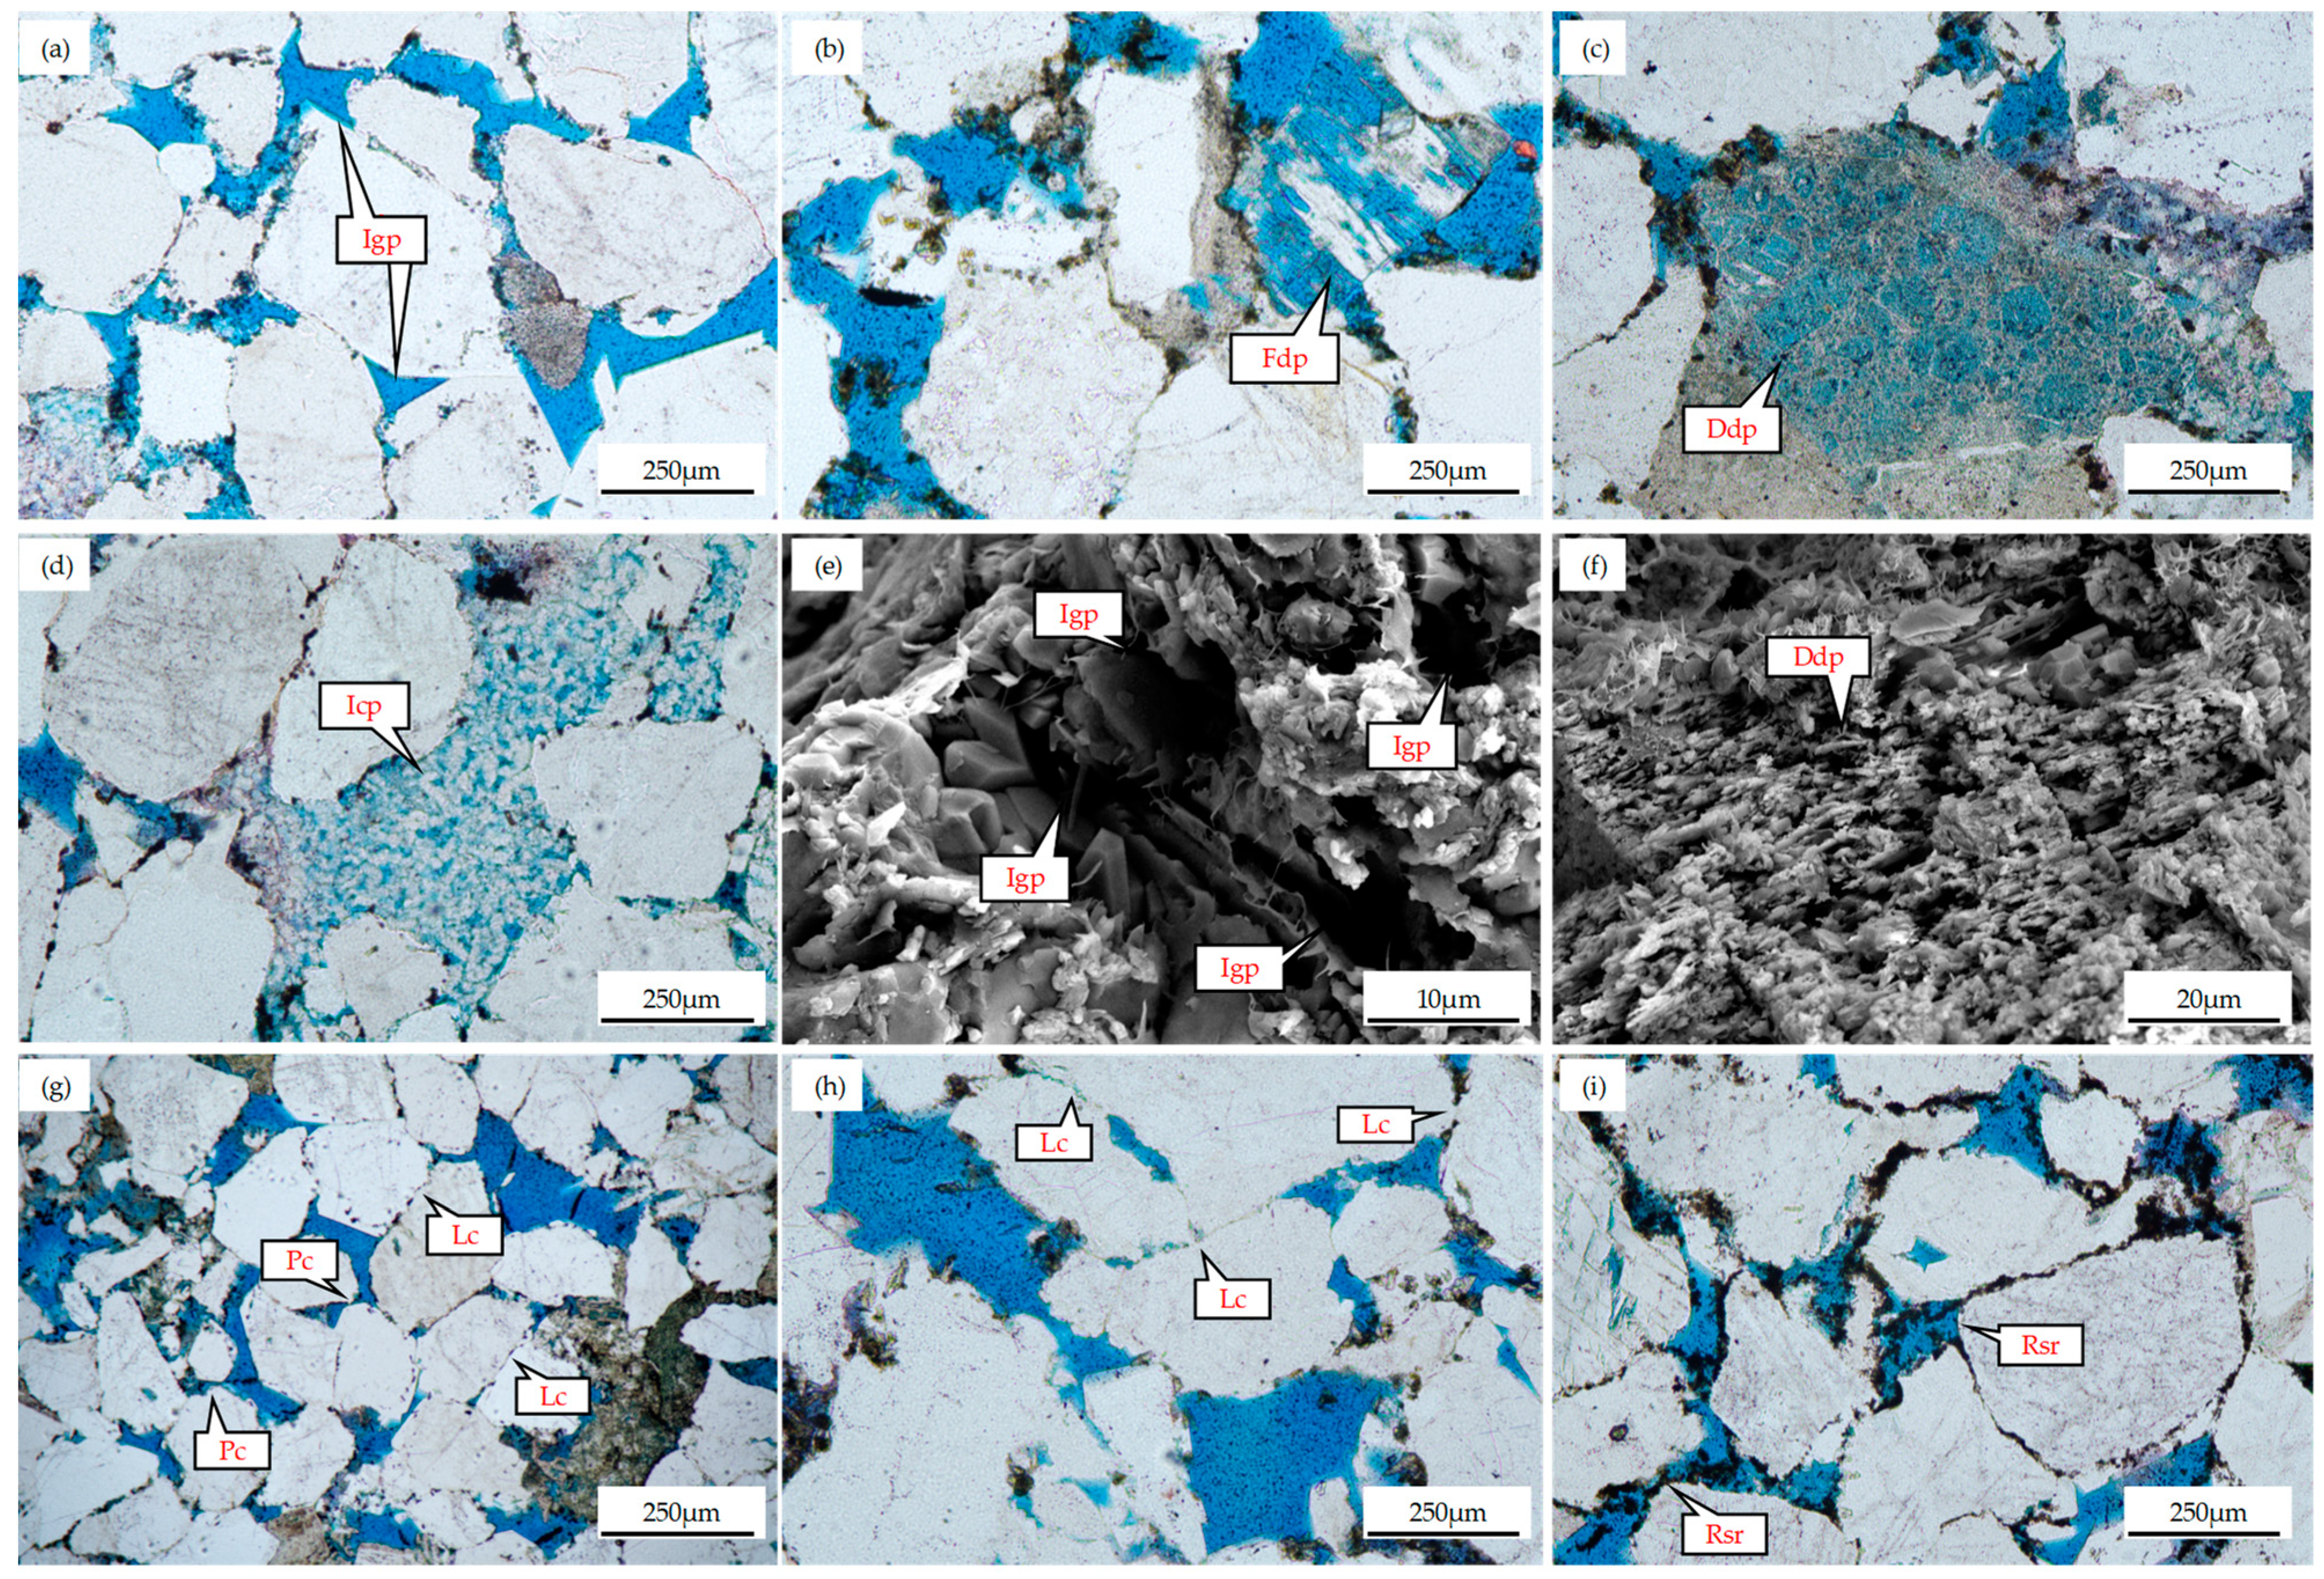
Figure 6.
The samples’ pore structure and different pore types’ proportions.
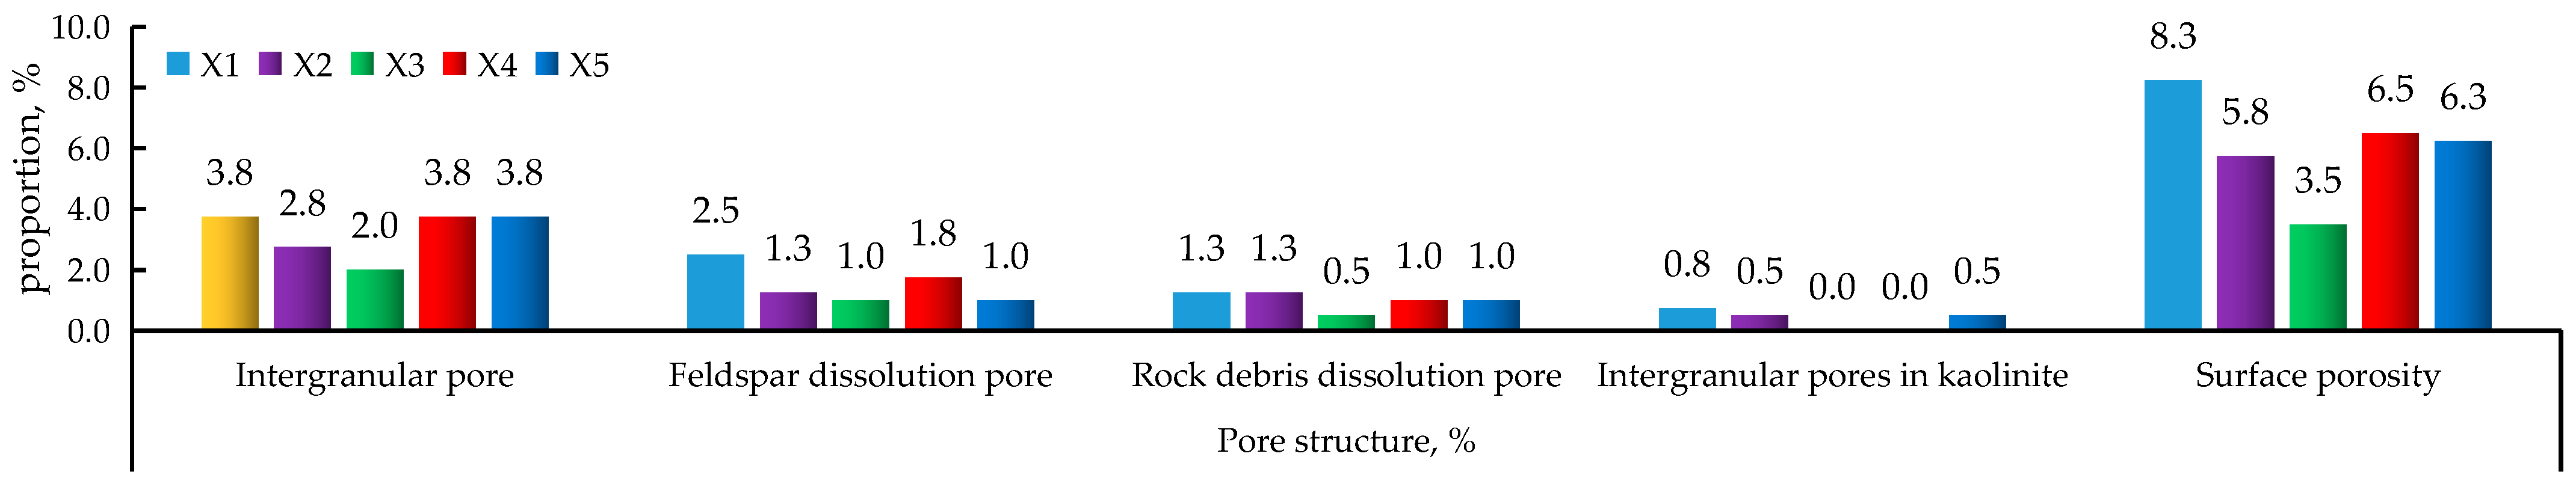
Figure 7.
High-pressure mercury intrusion curve parameters of the samples.

Figure 8.
High-pressure mercury intrusion curve (a) and pore throat radius distribution (b) of the samples.
Figure 8.
High-pressure mercury intrusion curve (a) and pore throat radius distribution (b) of the samples.

Figure 9.
The relationship between the pore throat volume ratio and the intergranular pore (a) and the face rate (b).
Figure 9.
The relationship between the pore throat volume ratio and the intergranular pore (a) and the face rate (b).
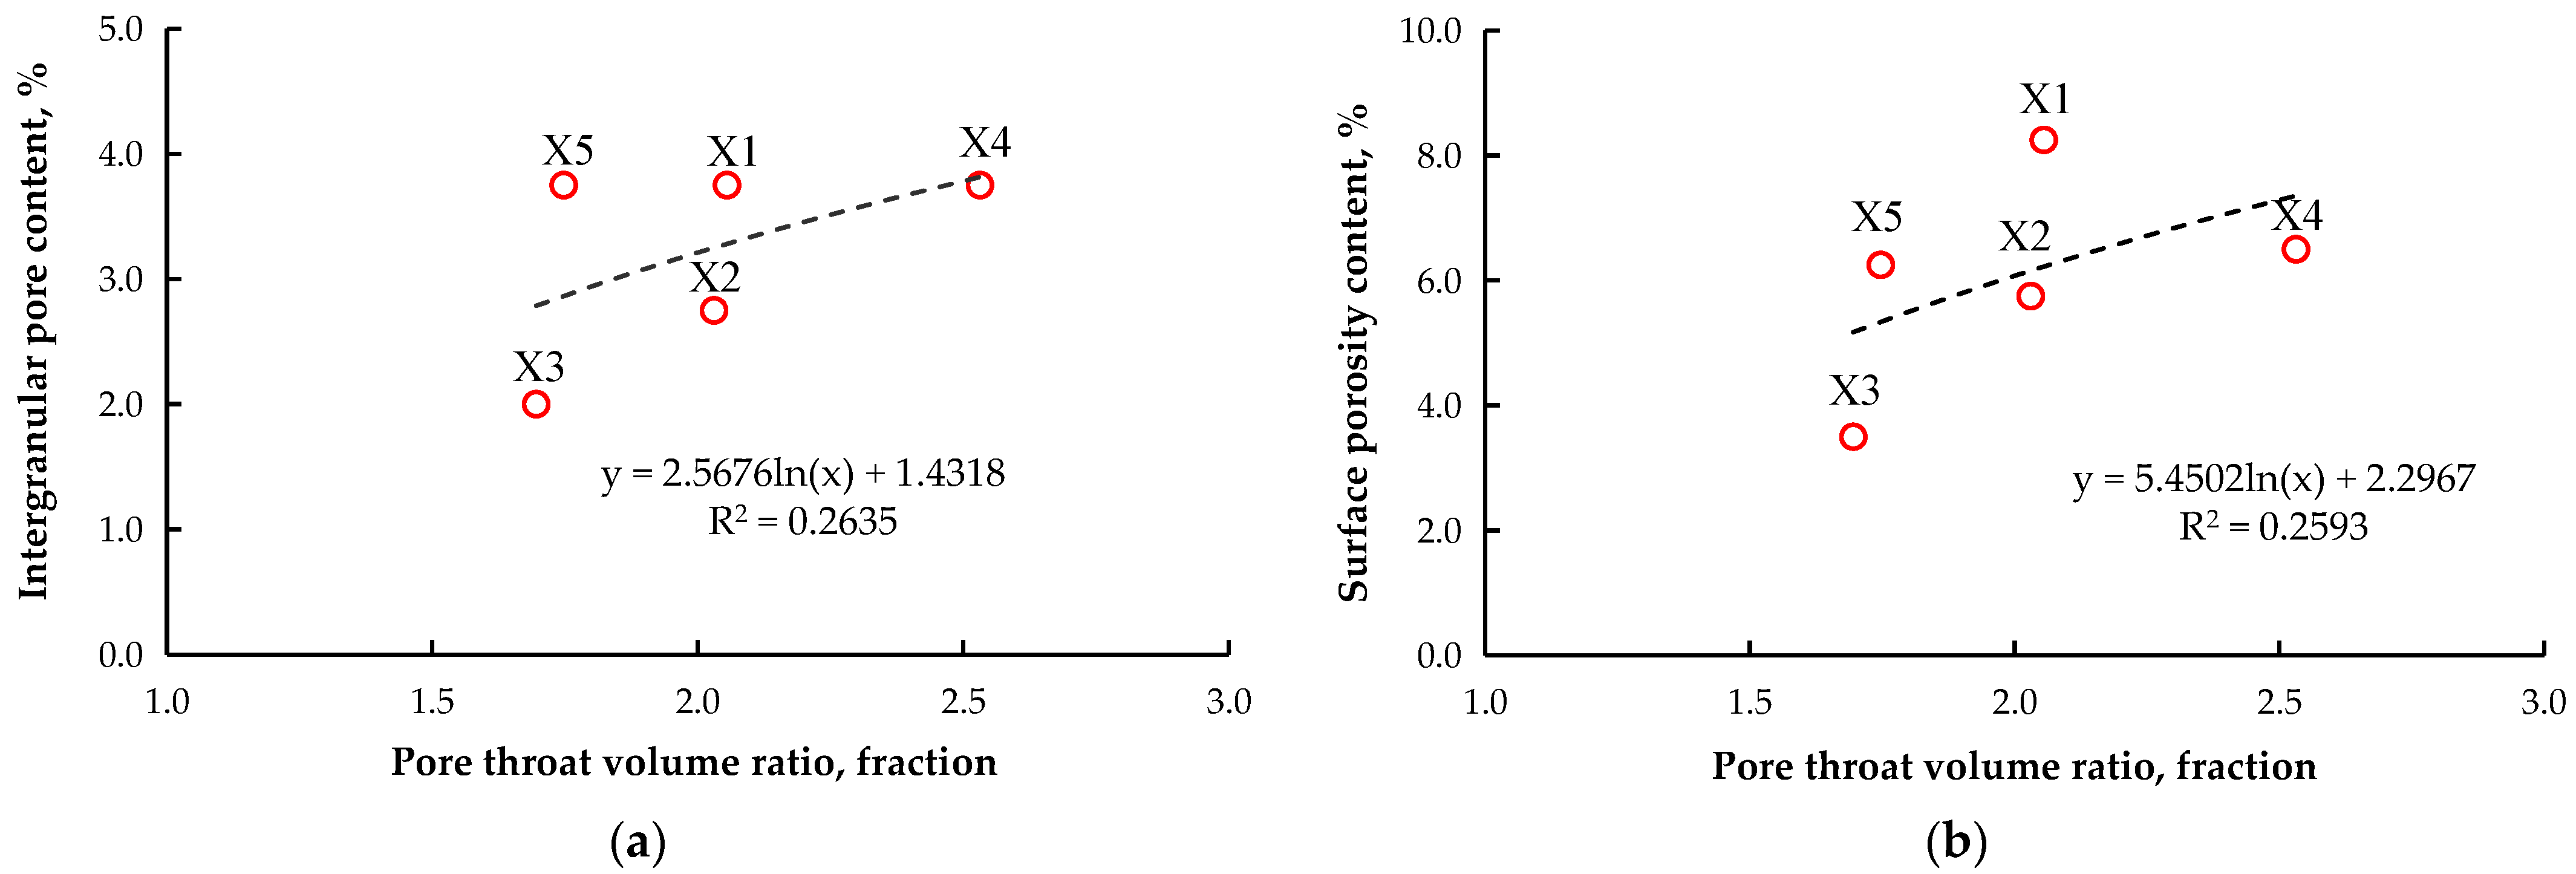
Figure 10.
Frequency curve of the lognormal distribution of the sample particle size.
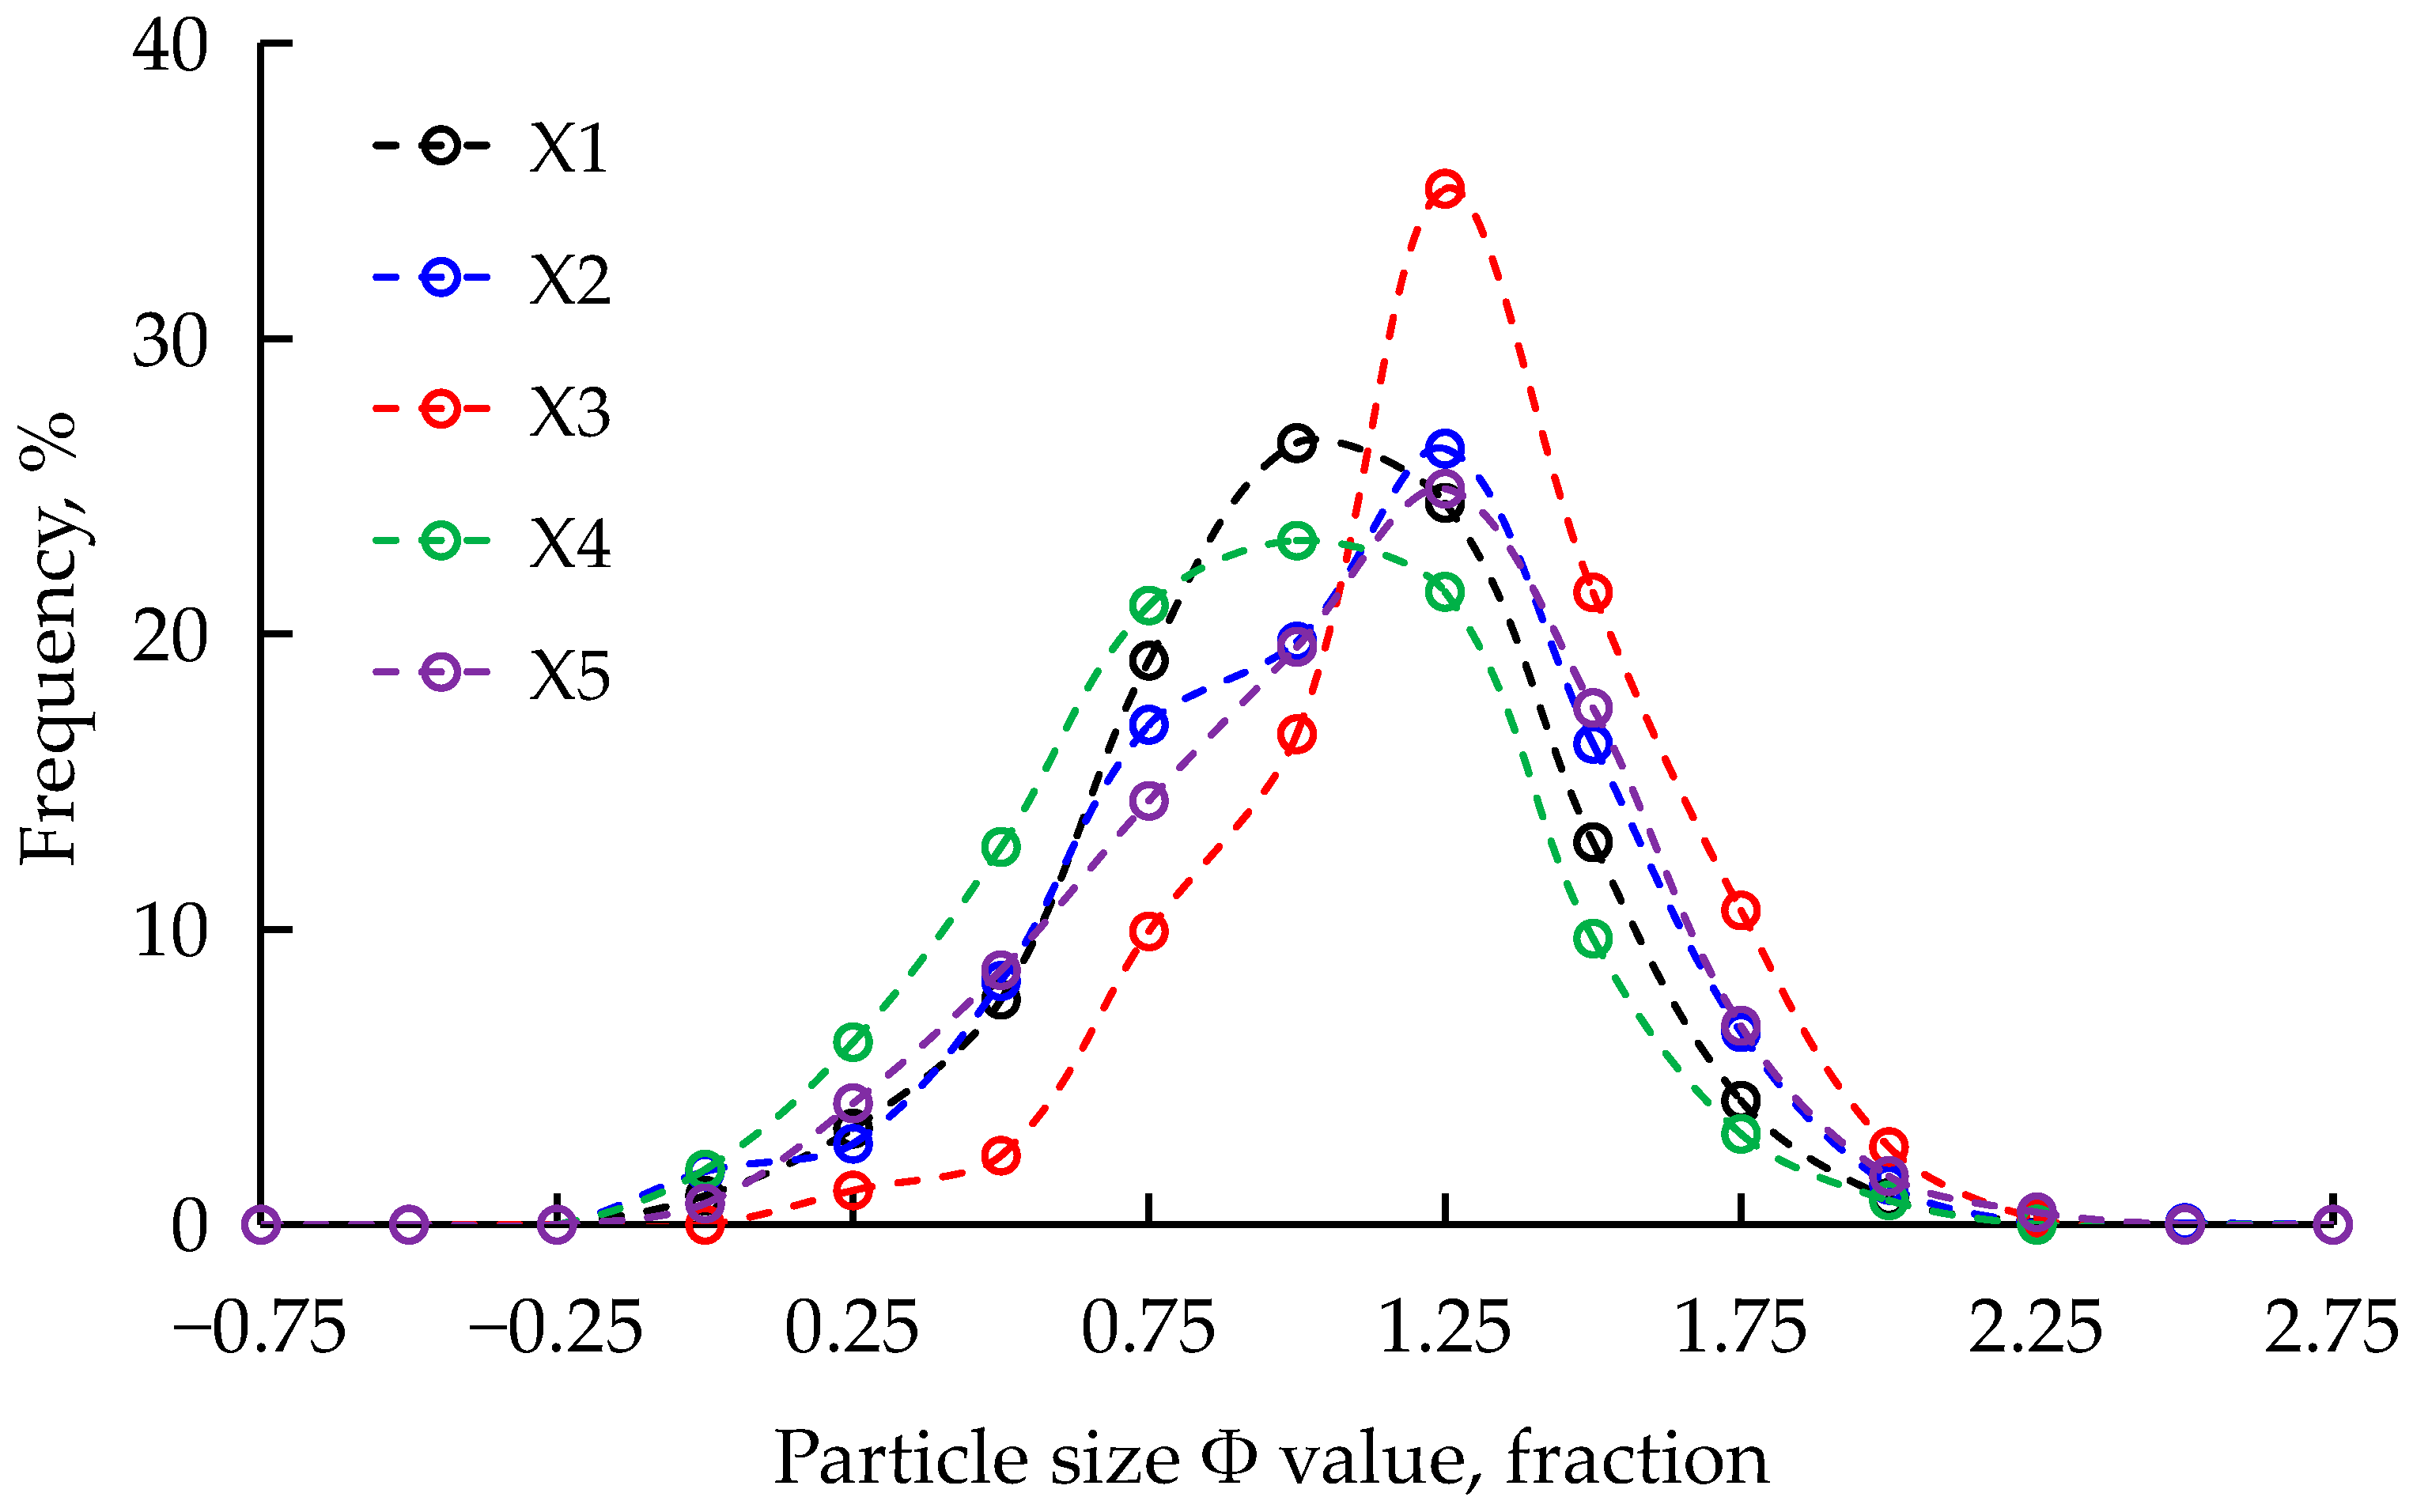
Figure 11.
Sample relative permeability curve (Kro represents the relative oil-phase permeability, and Krw represents the relative water-phase permeability).
Figure 11.
Sample relative permeability curve (Kro represents the relative oil-phase permeability, and Krw represents the relative water-phase permeability).
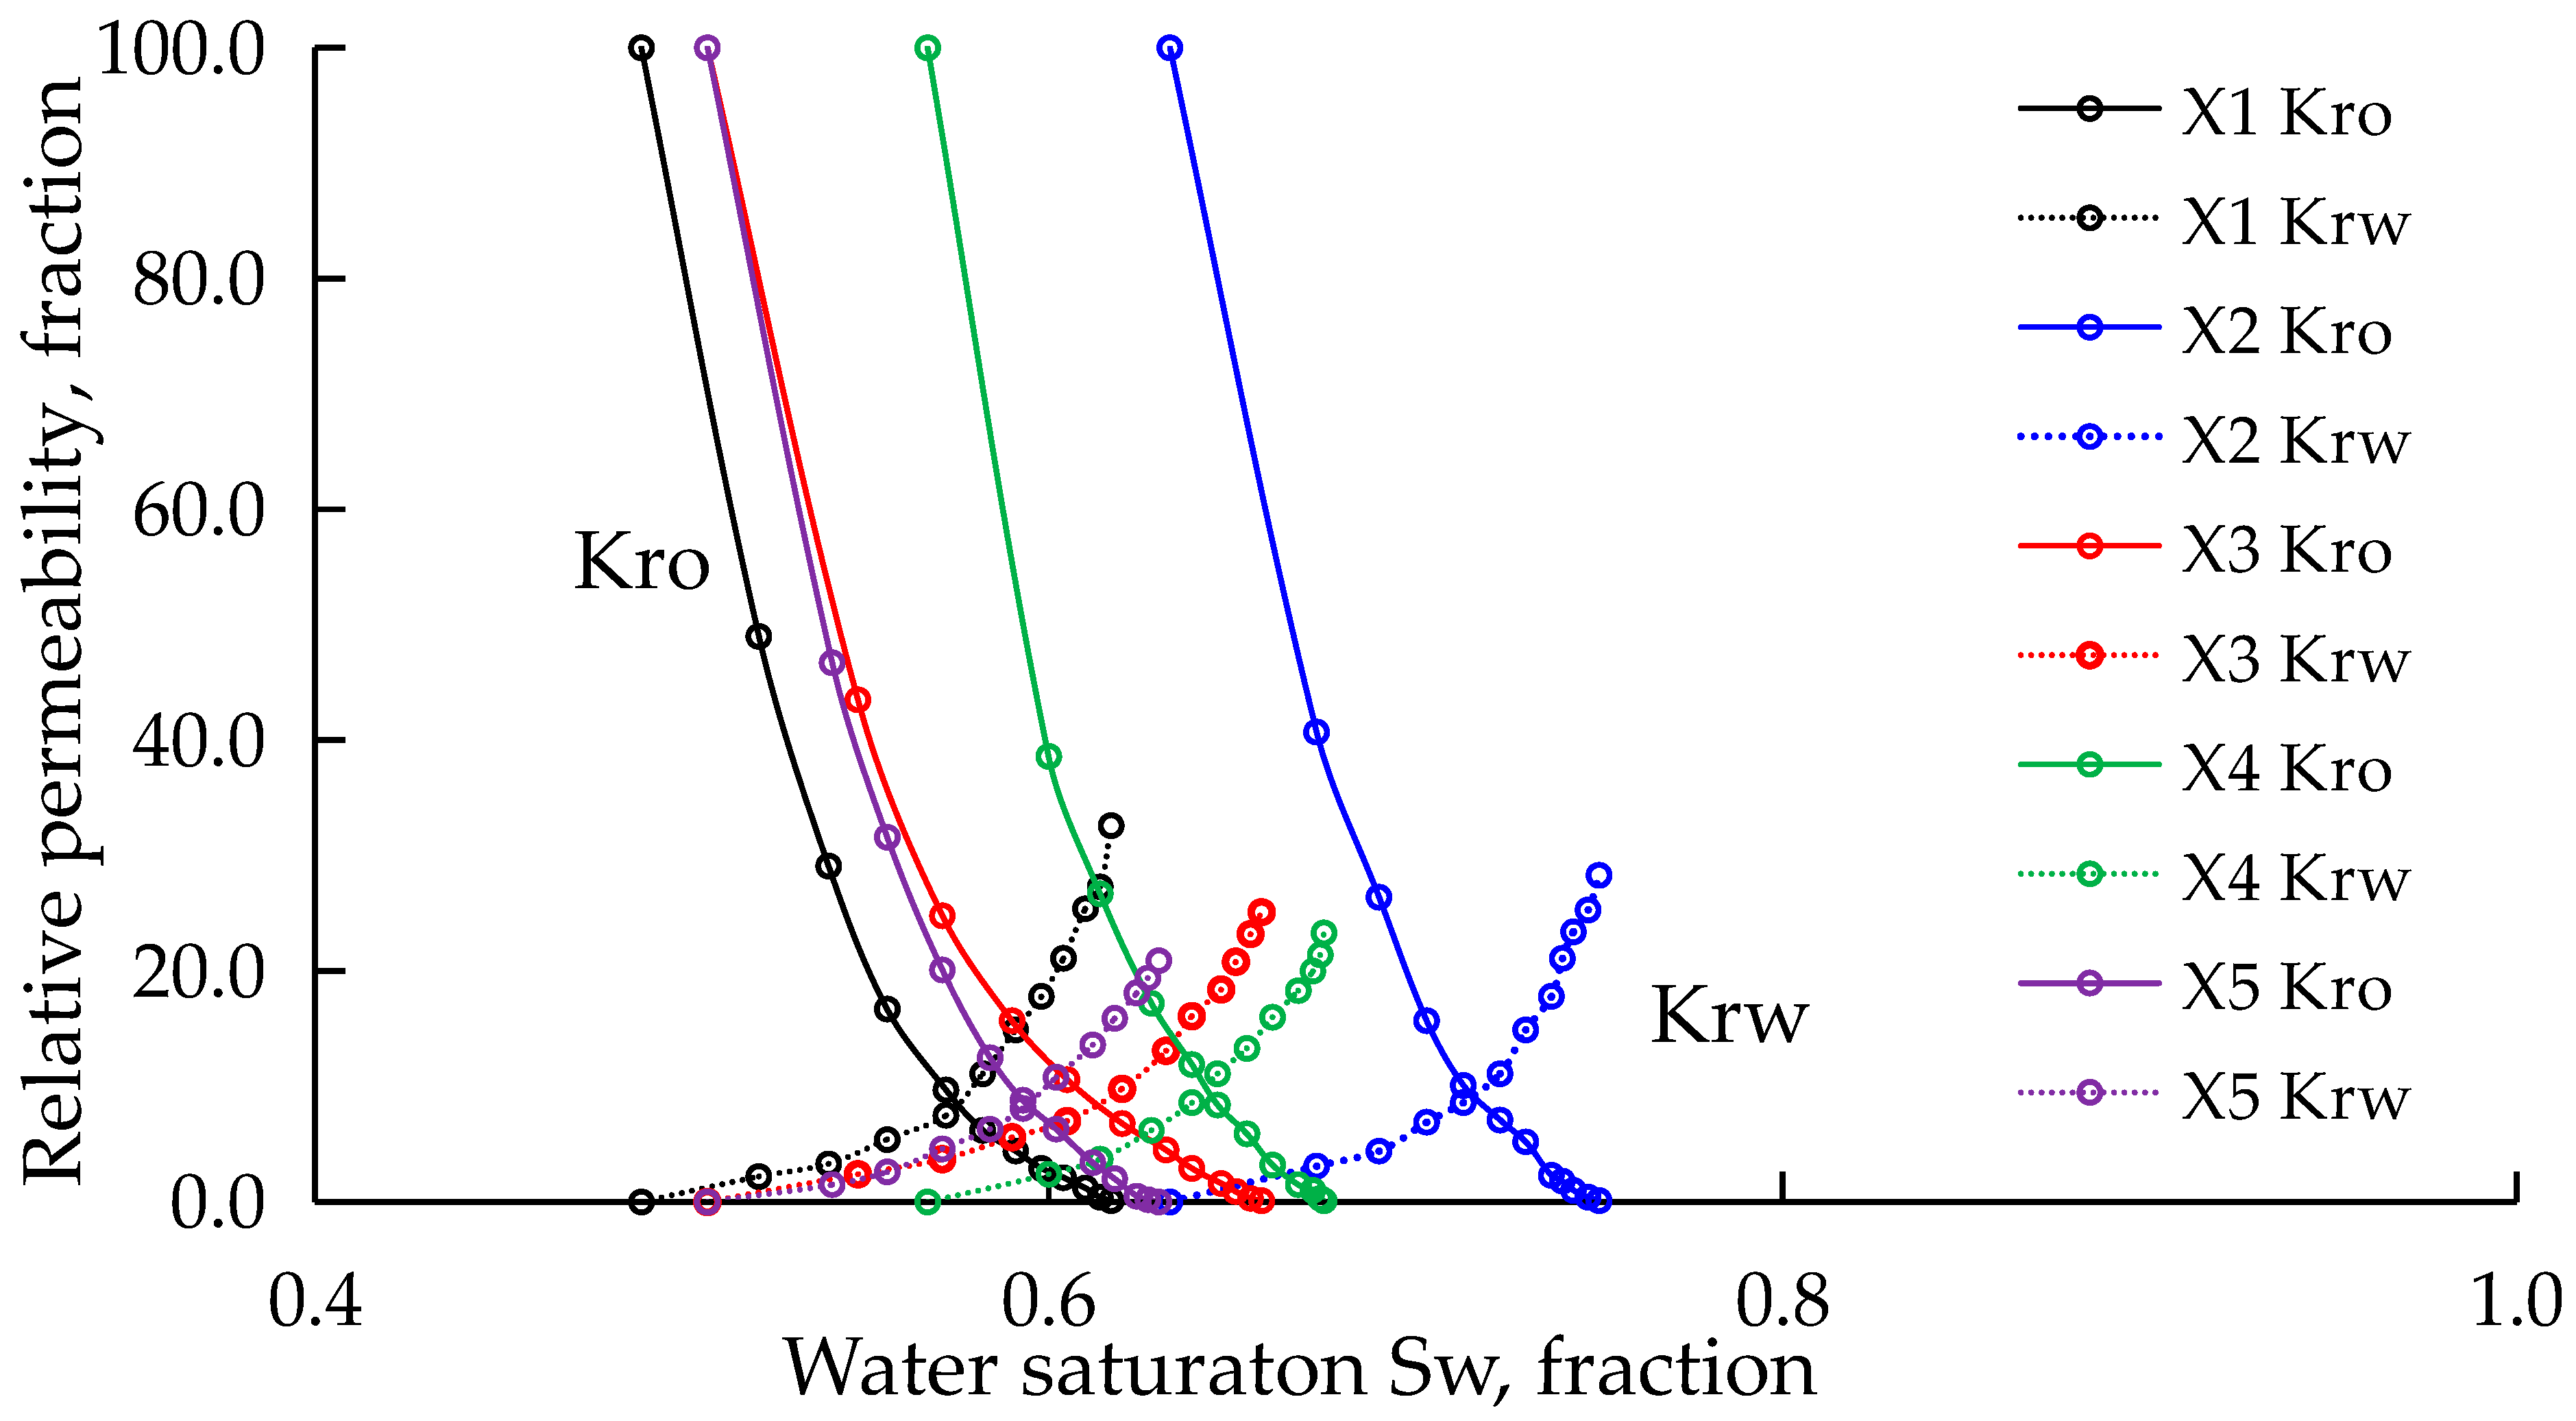
Figure 12.
Relationship between air permeability and water saturation at different stages of the samples’ relative permeability experiment.
Figure 12.
Relationship between air permeability and water saturation at different stages of the samples’ relative permeability experiment.

Figure 13.
The relationship between co-permeation zone saturation and the average pore throat radius (a) and average particle size (b).
Figure 13.
The relationship between co-permeation zone saturation and the average pore throat radius (a) and average particle size (b).
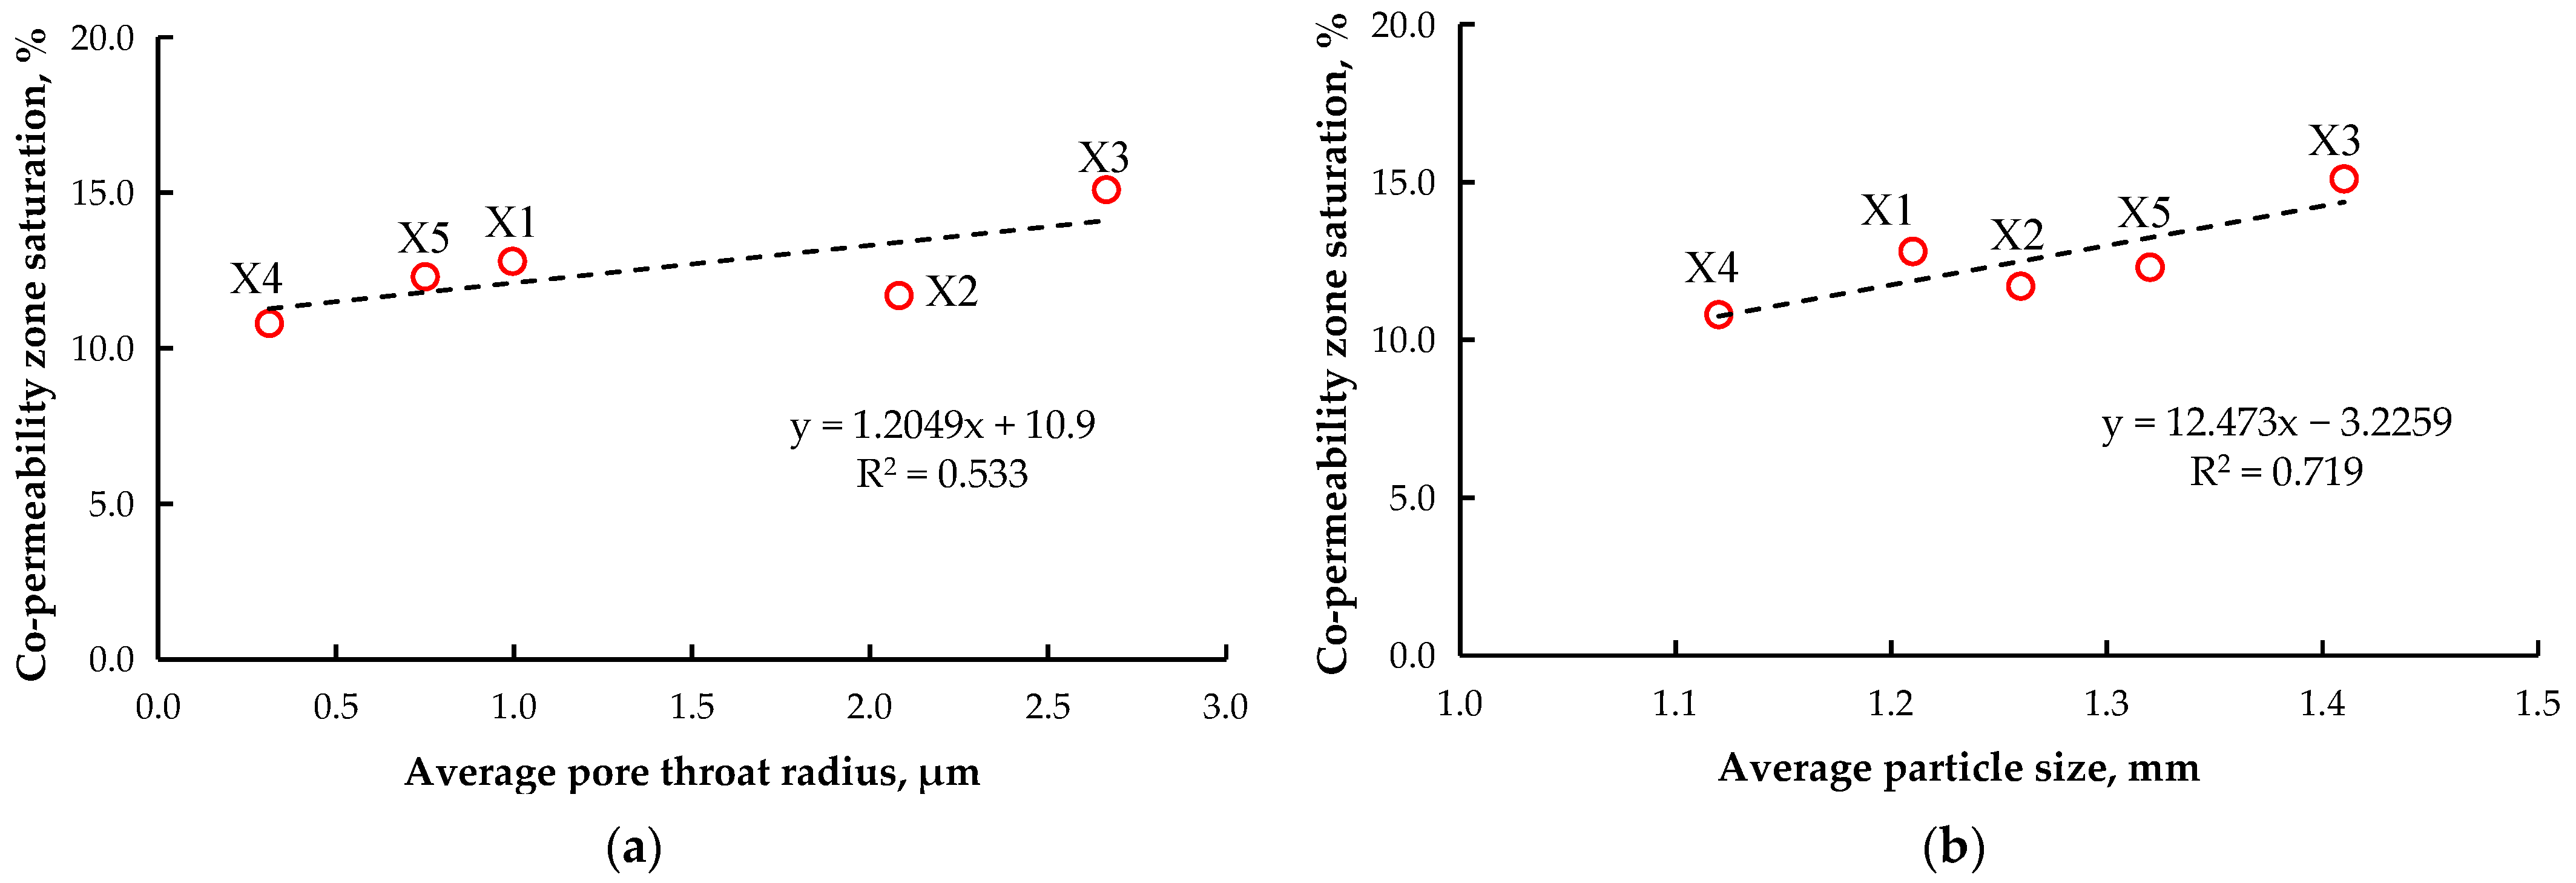
Figure 14.
Water-drive oil experiment results of the samples.

Figure 15.
The relationship between oil displacement efficiency and the average pore throat radius (a) and average particle size (b).
Figure 15.
The relationship between oil displacement efficiency and the average pore throat radius (a) and average particle size (b).
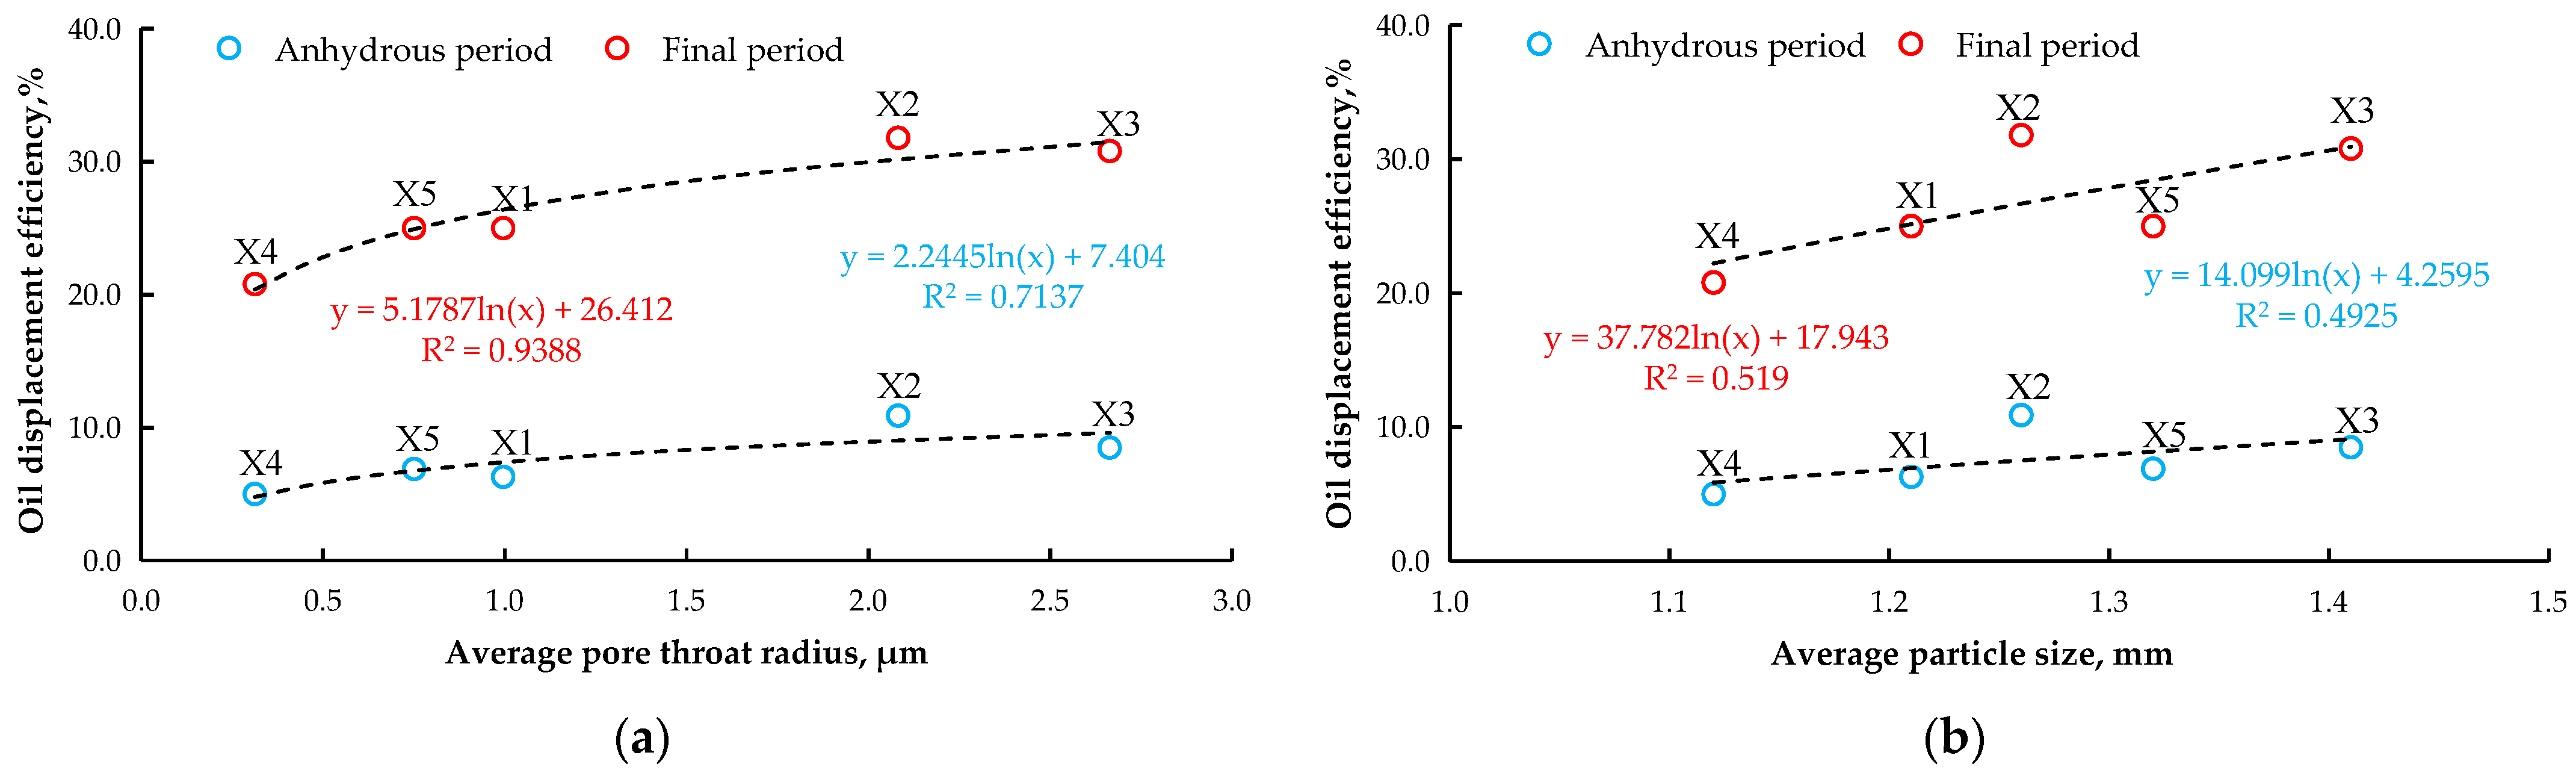
Figure 16.
Relationship curve between the sample injection ratio and oil displacement efficiency.
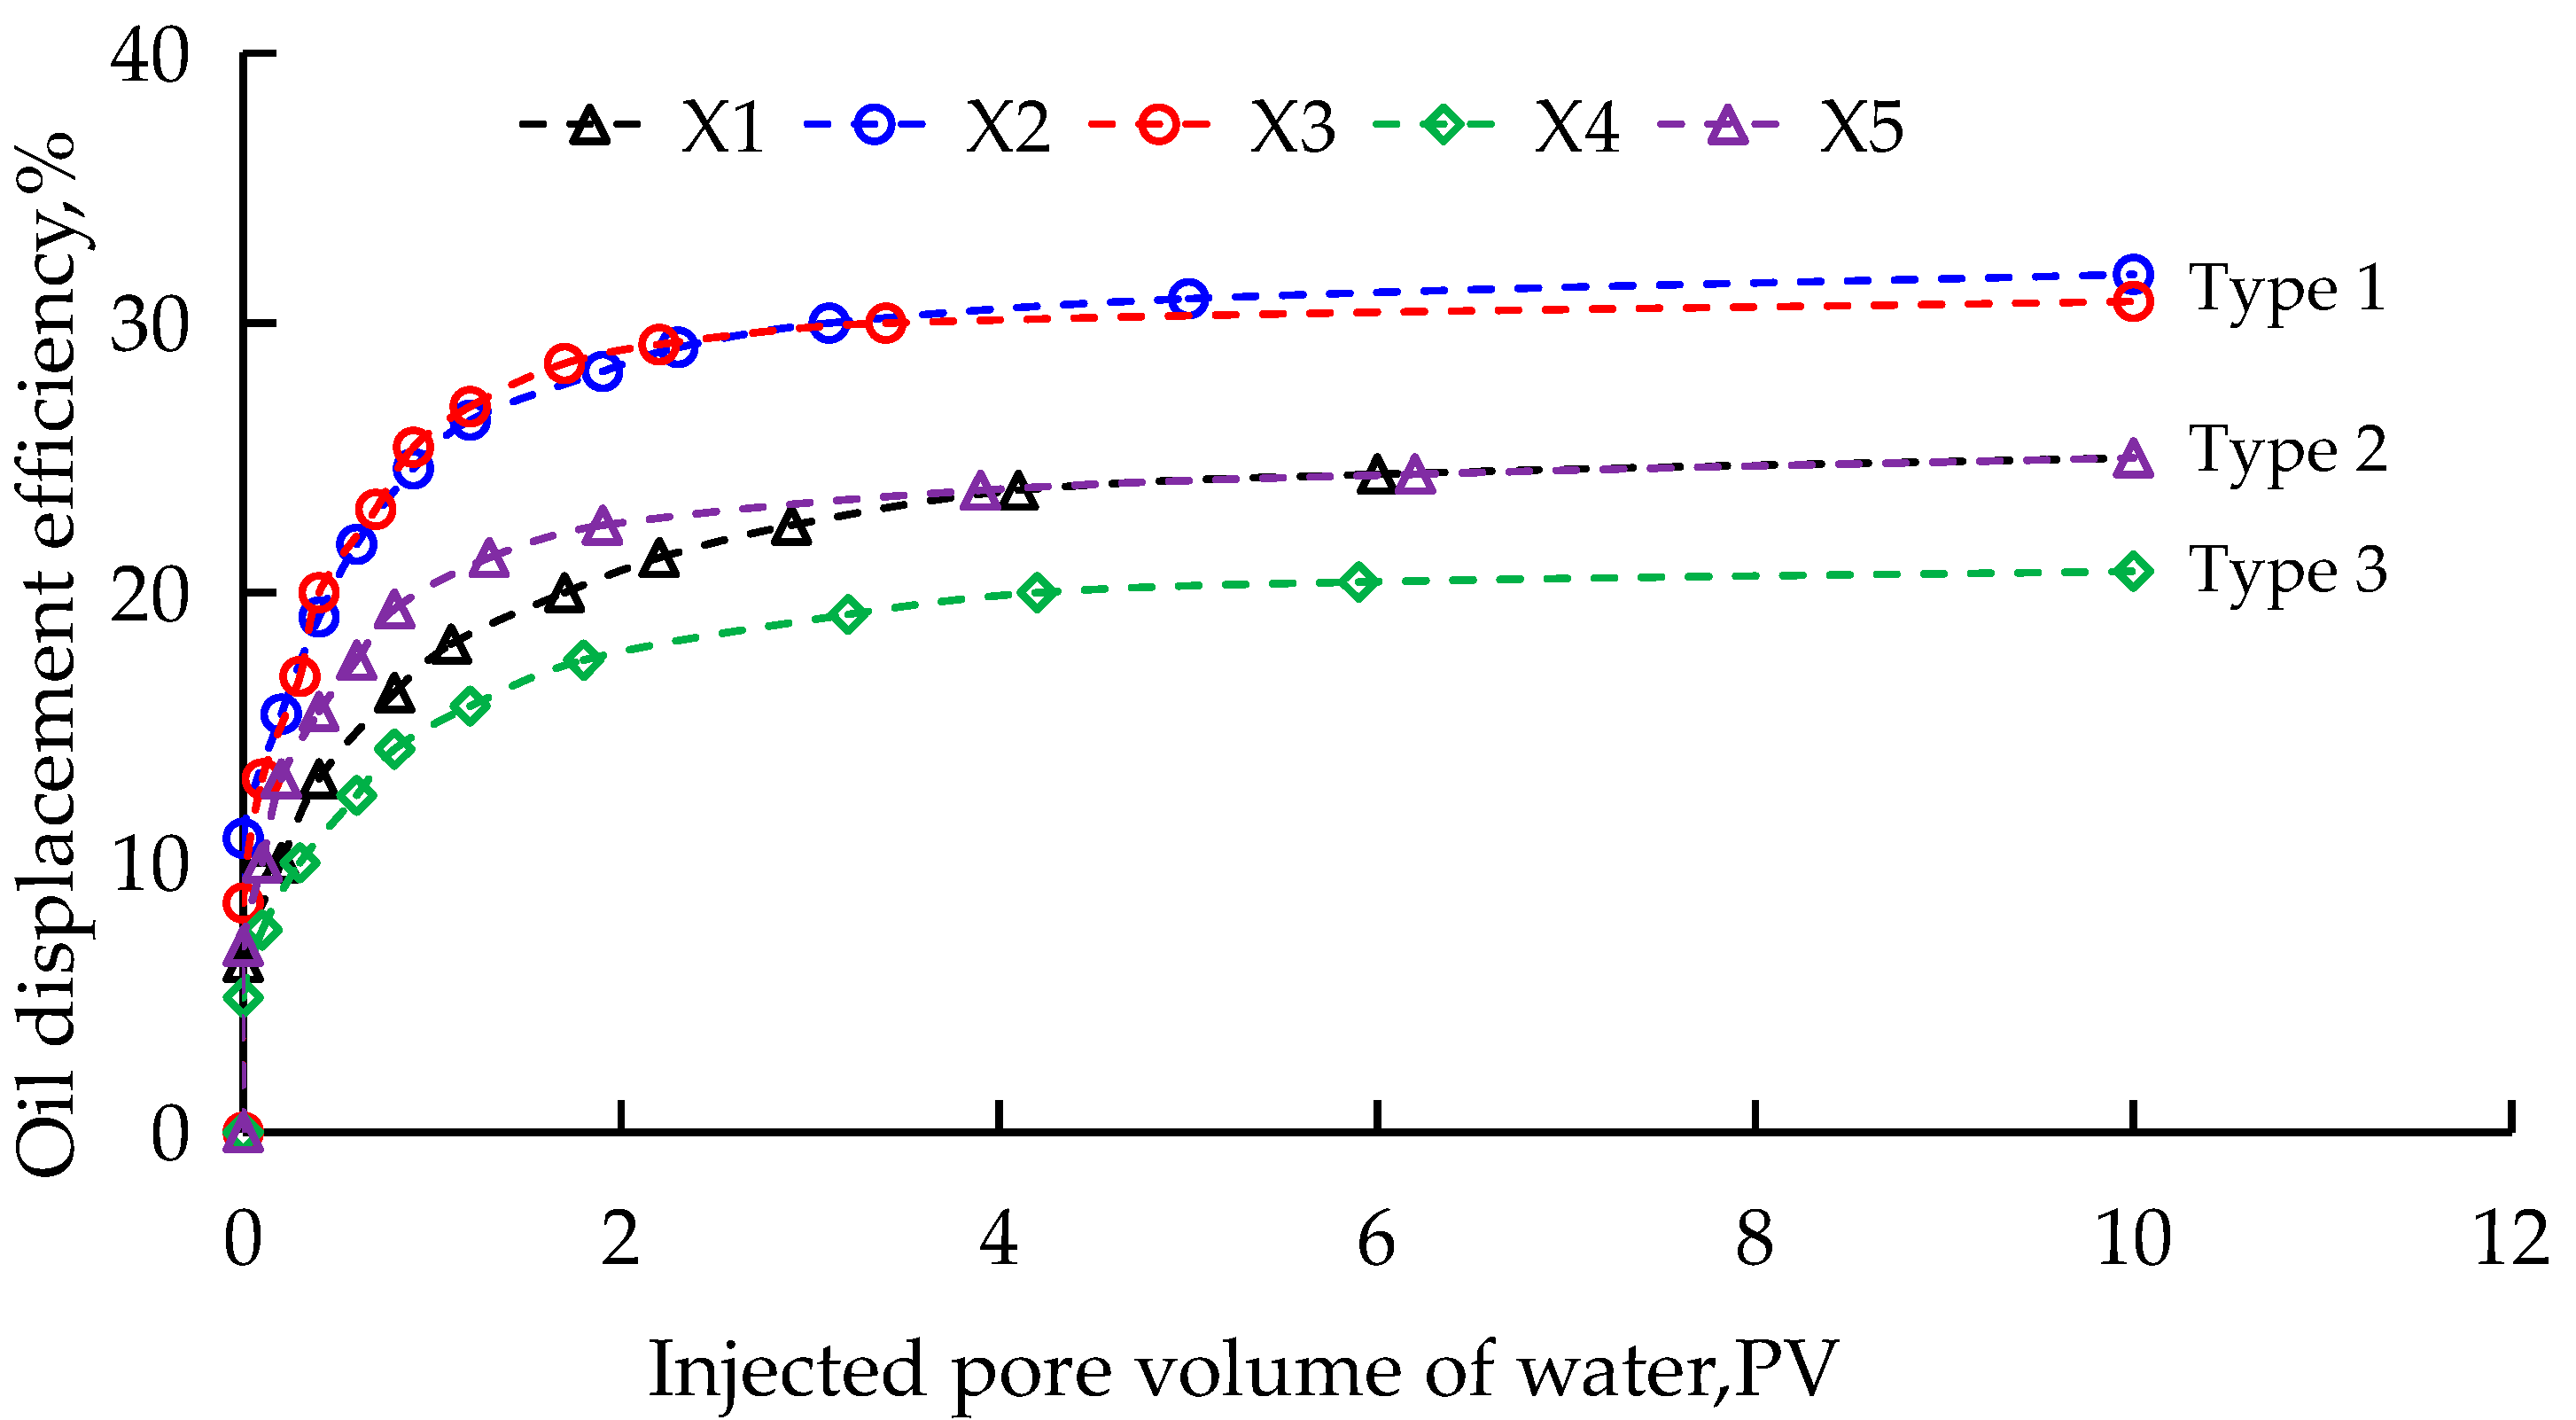
Figure 17.
Relationship between the samples’ relative wettability index and oil displacement efficiency.
Figure 17.
Relationship between the samples’ relative wettability index and oil displacement efficiency.
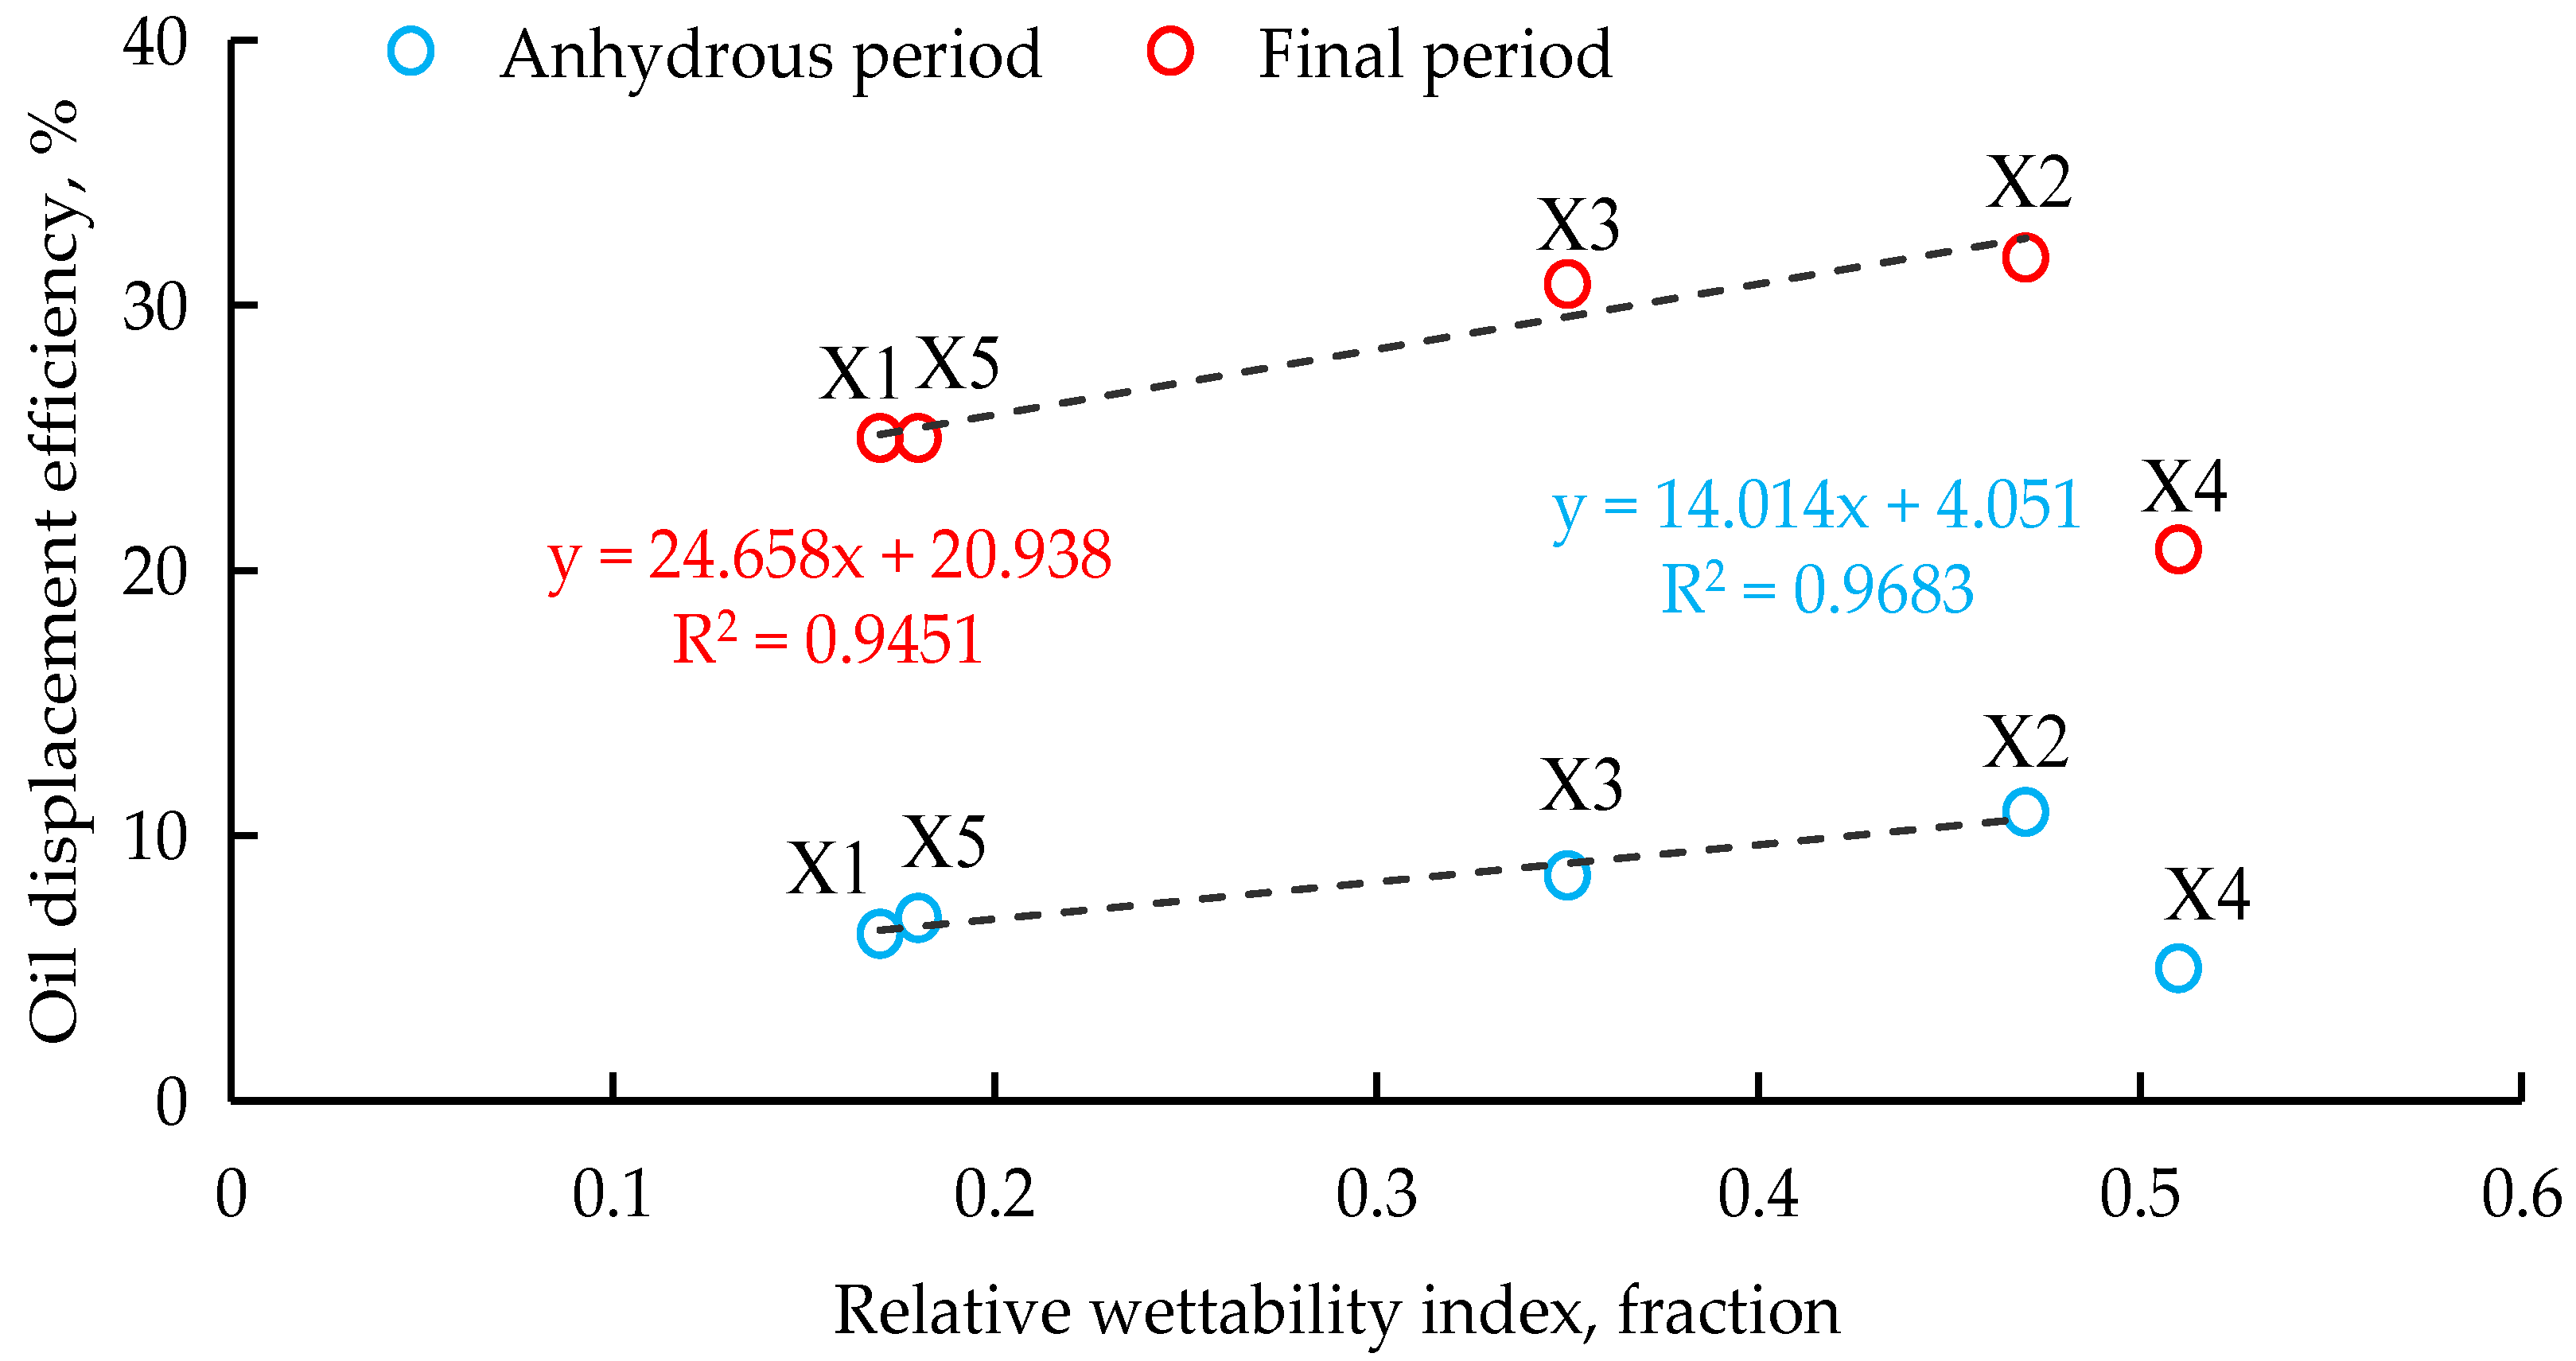
Figure 18.
Relationship curve between the water cut and water saturation.
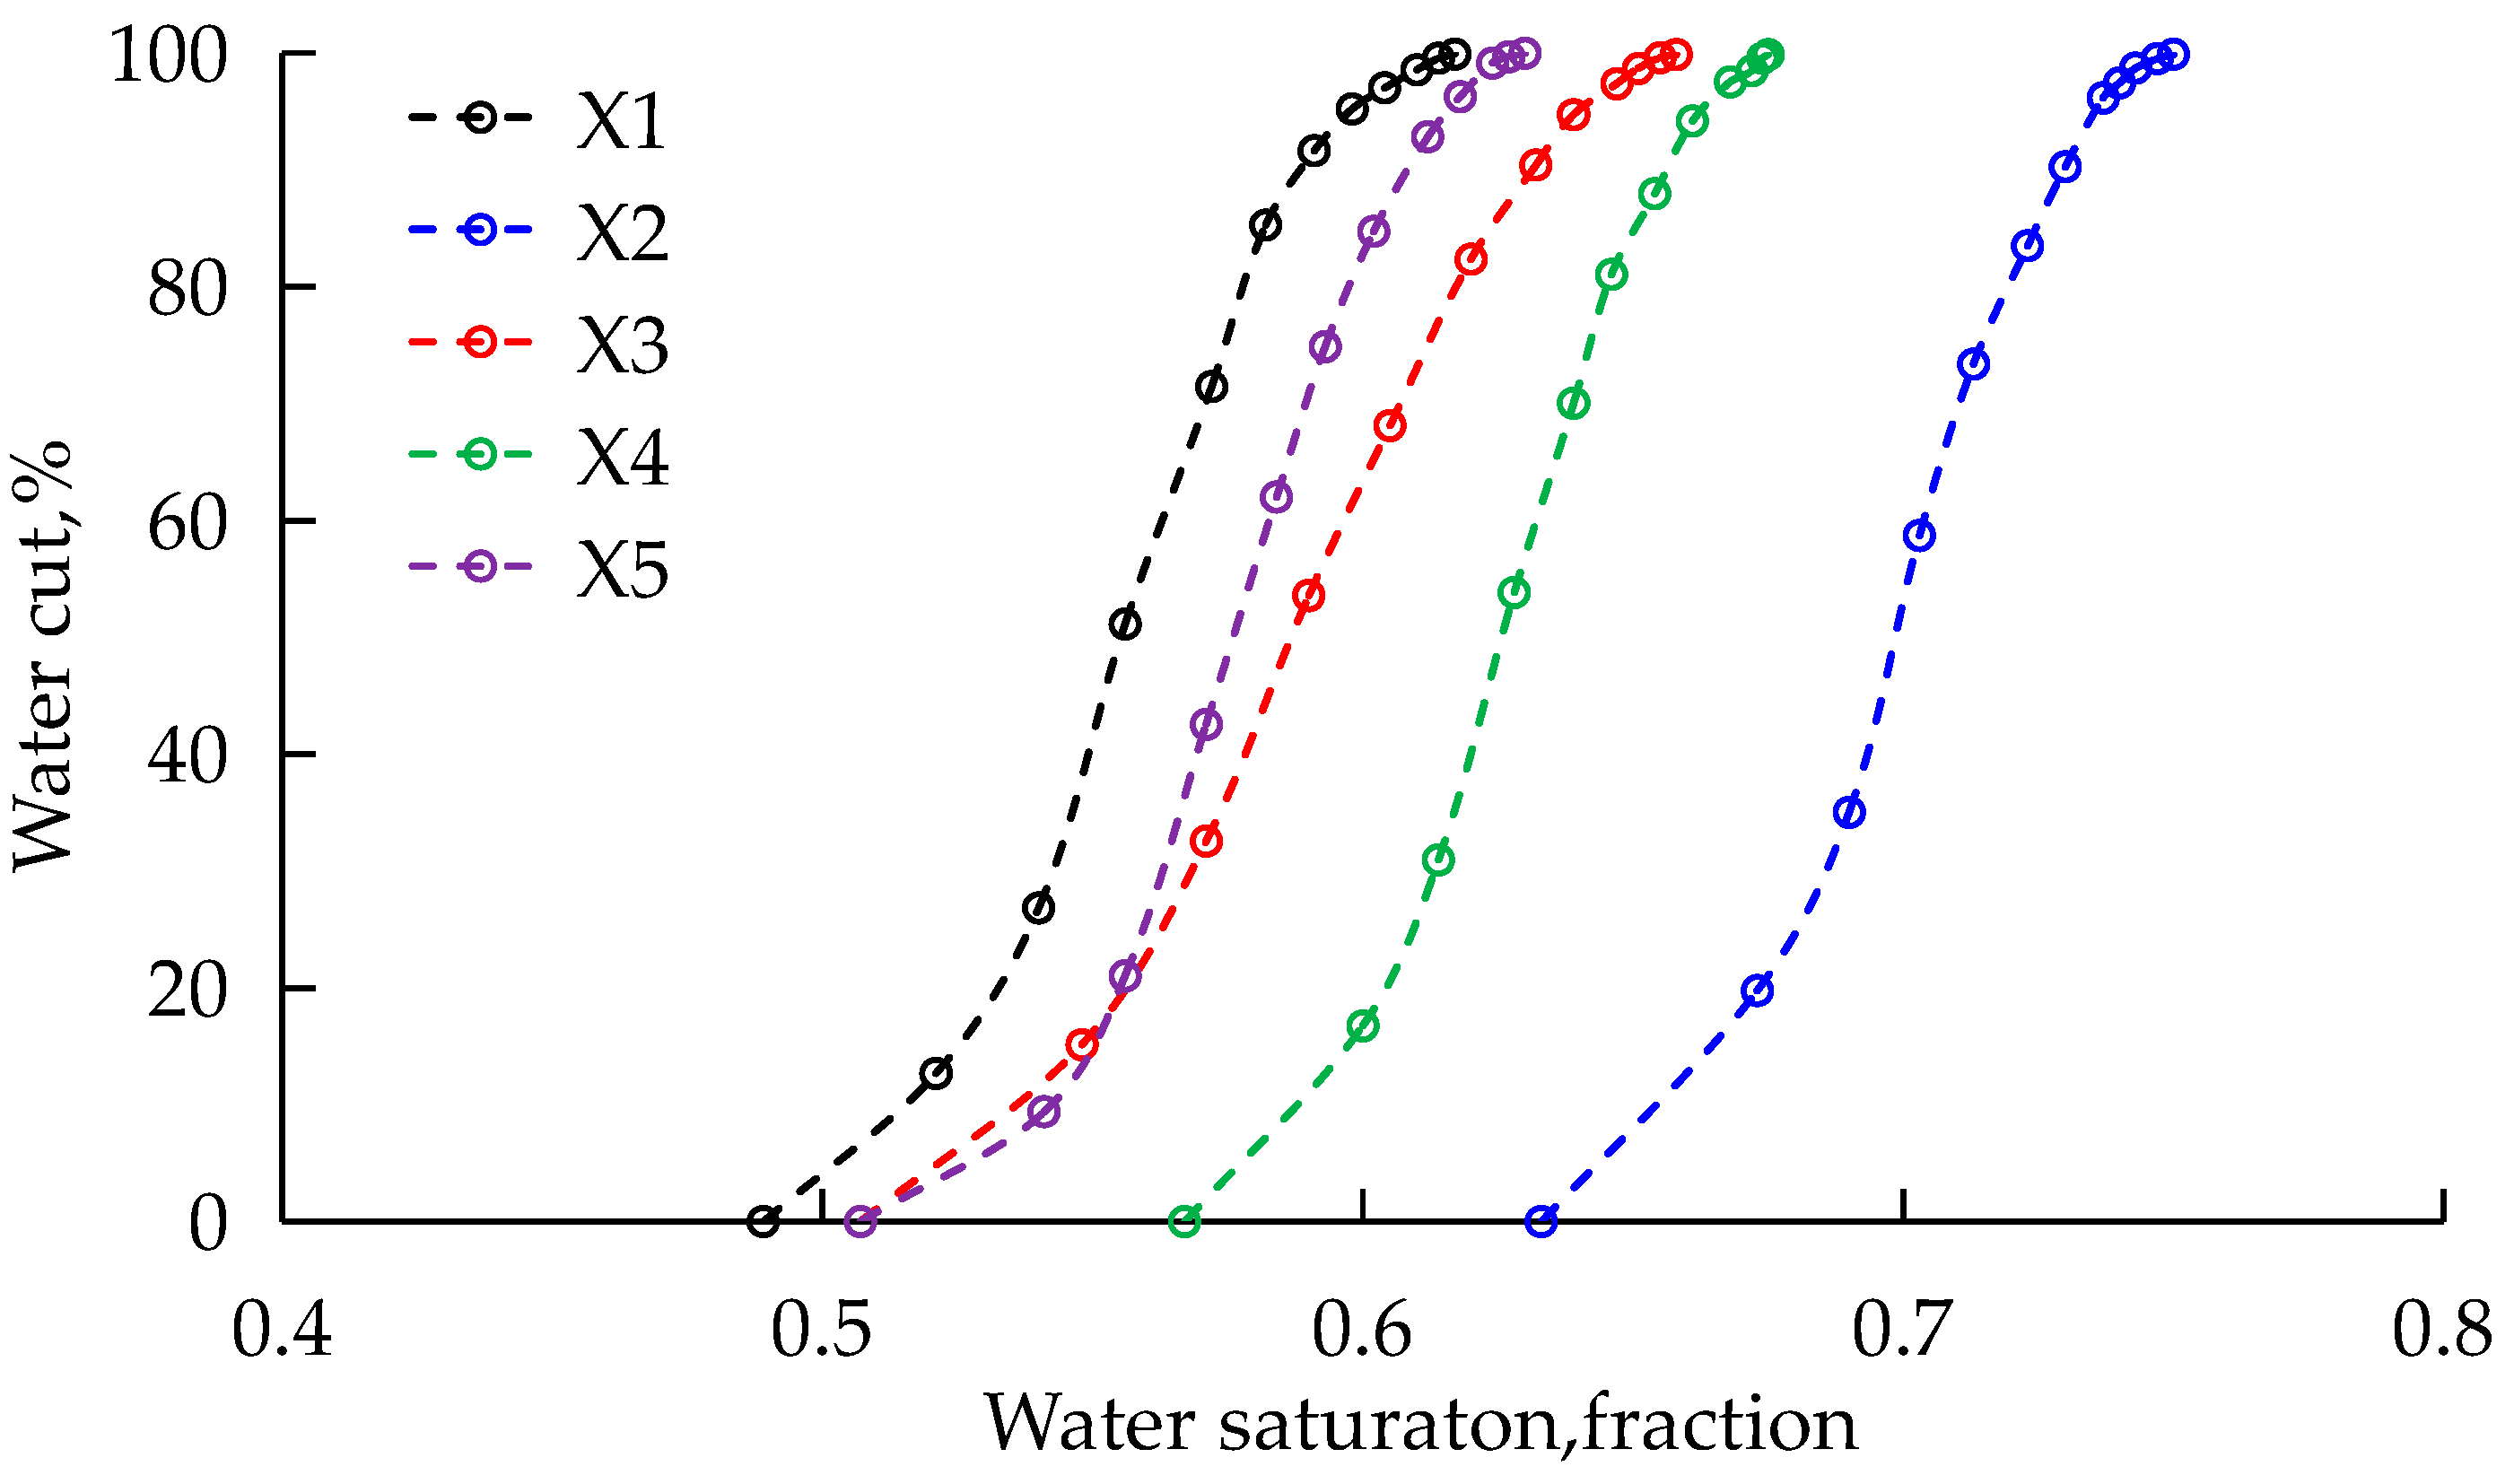
Figure 19.
Schematic diagram of obtaining the waterflood front.
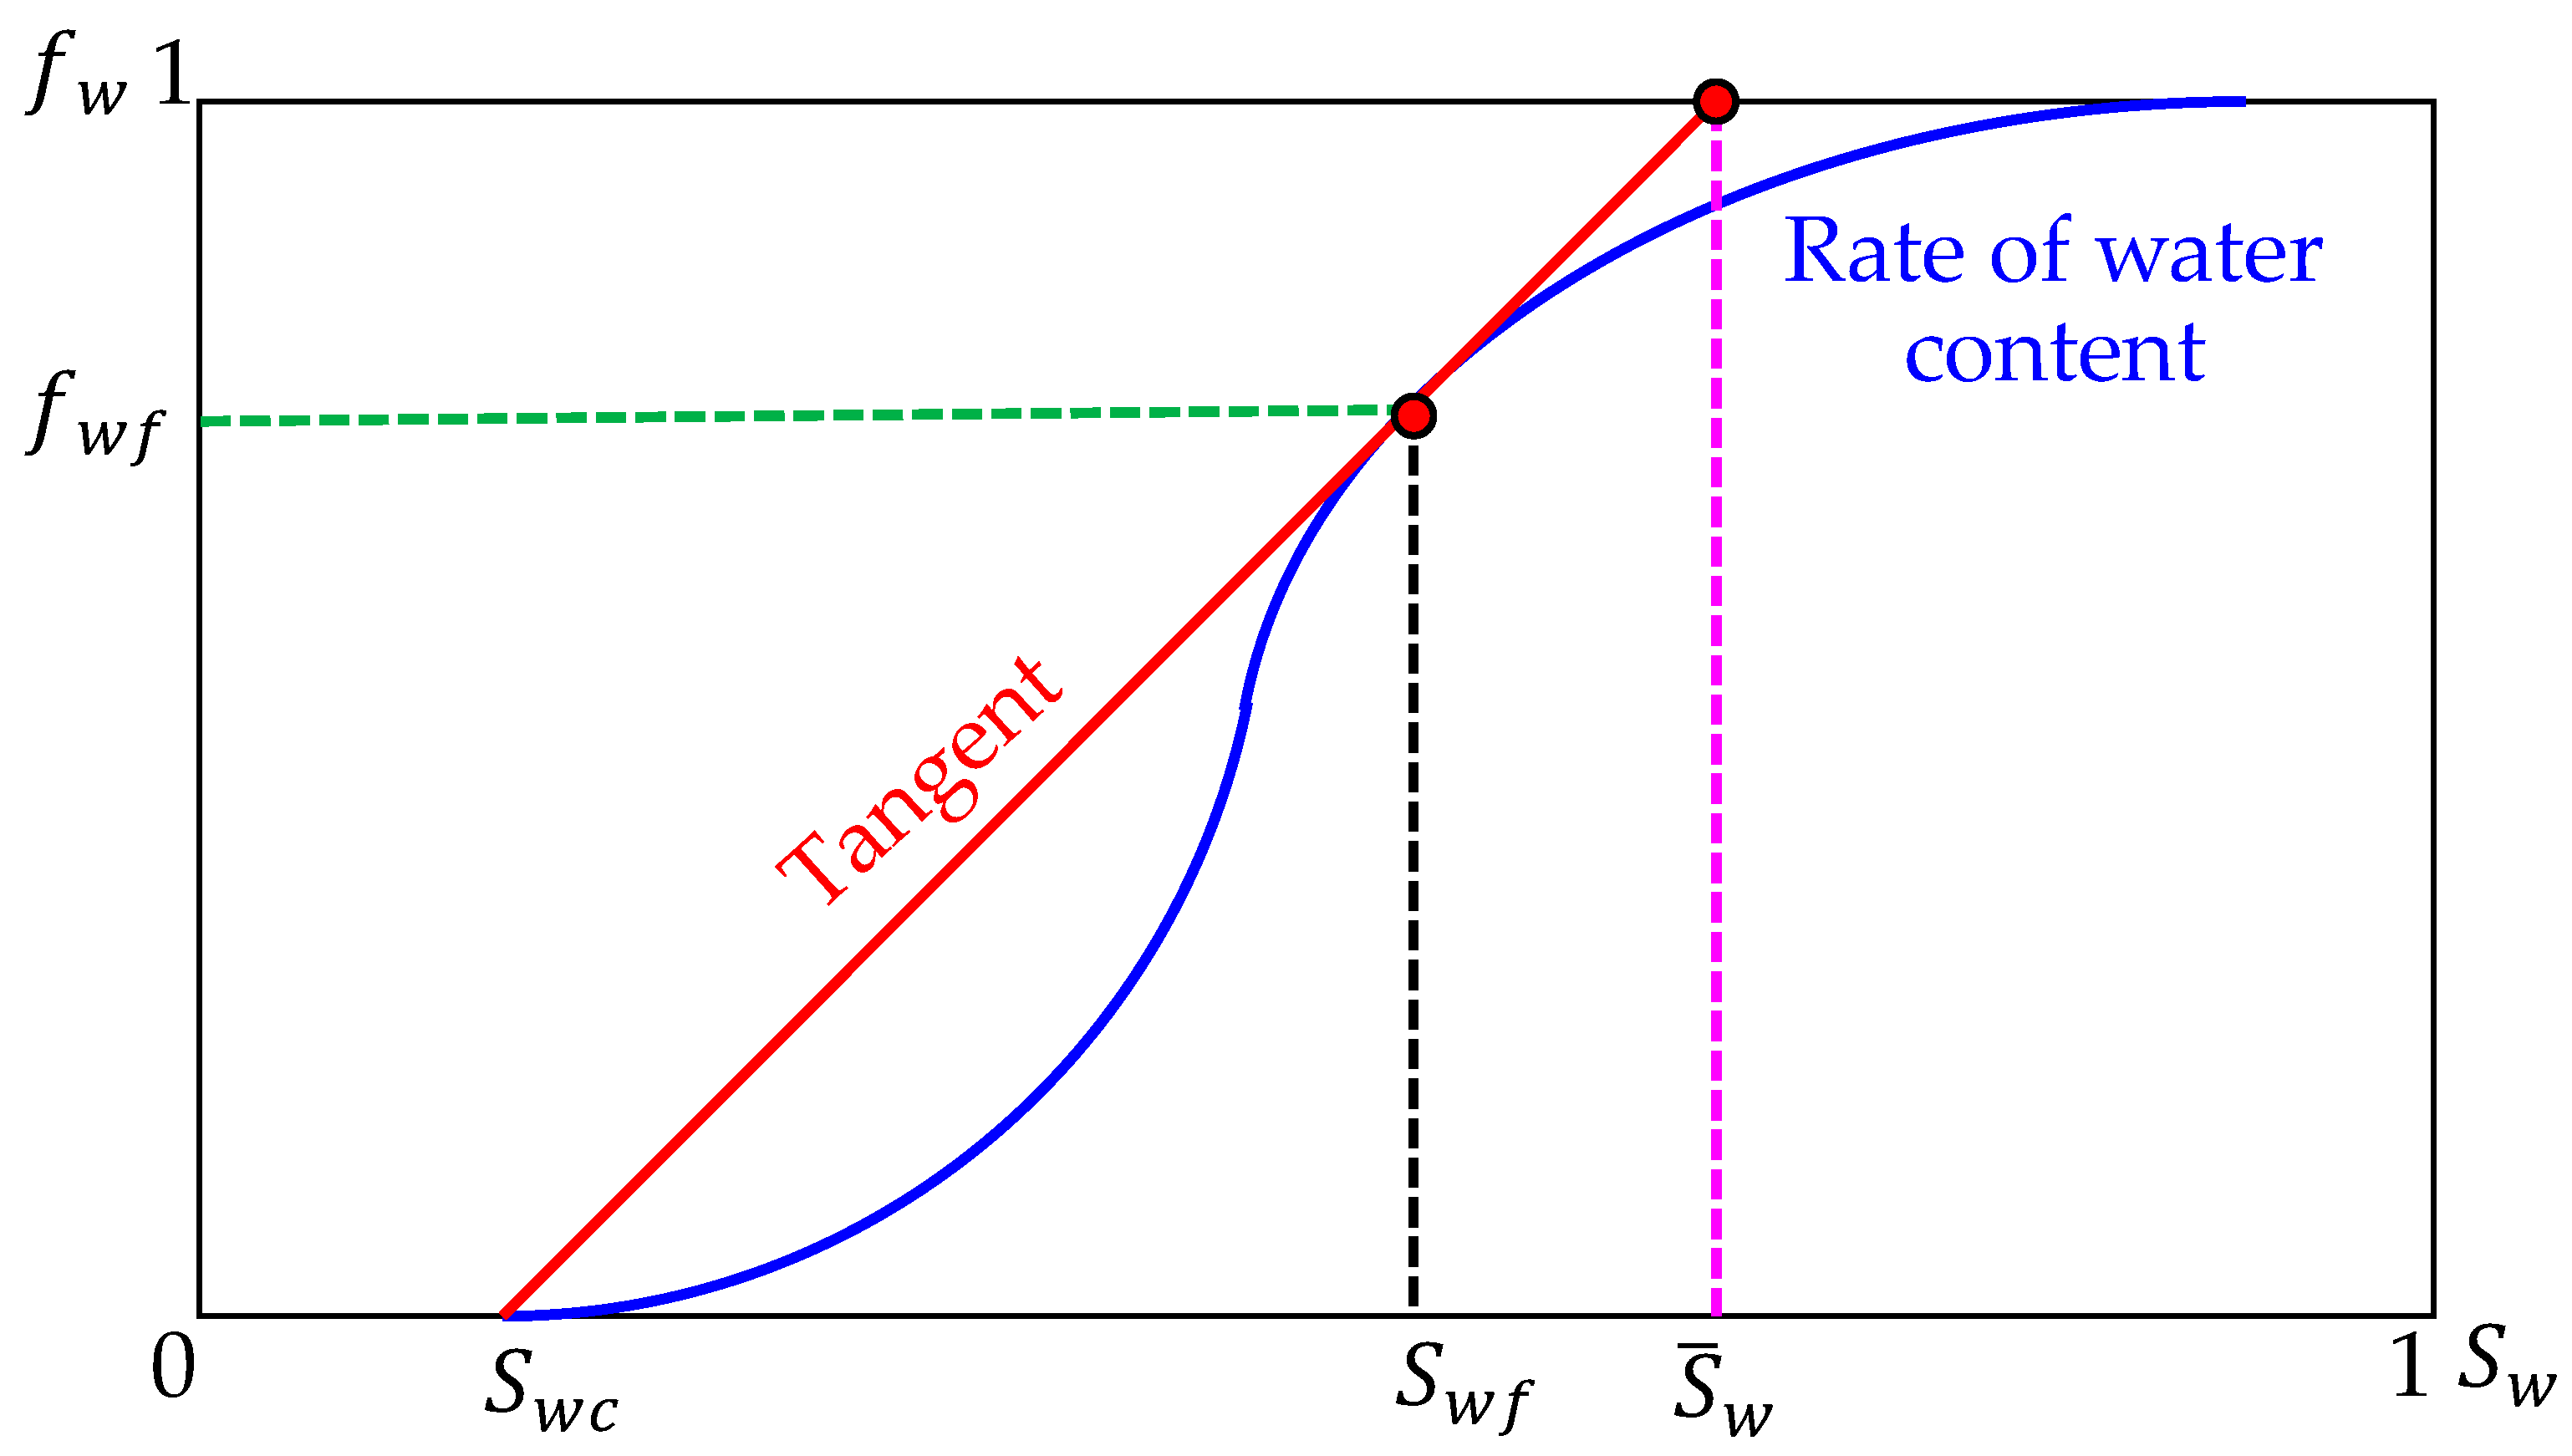
Figure 20.
Relationship curve between the water cut increase rate and water cut.
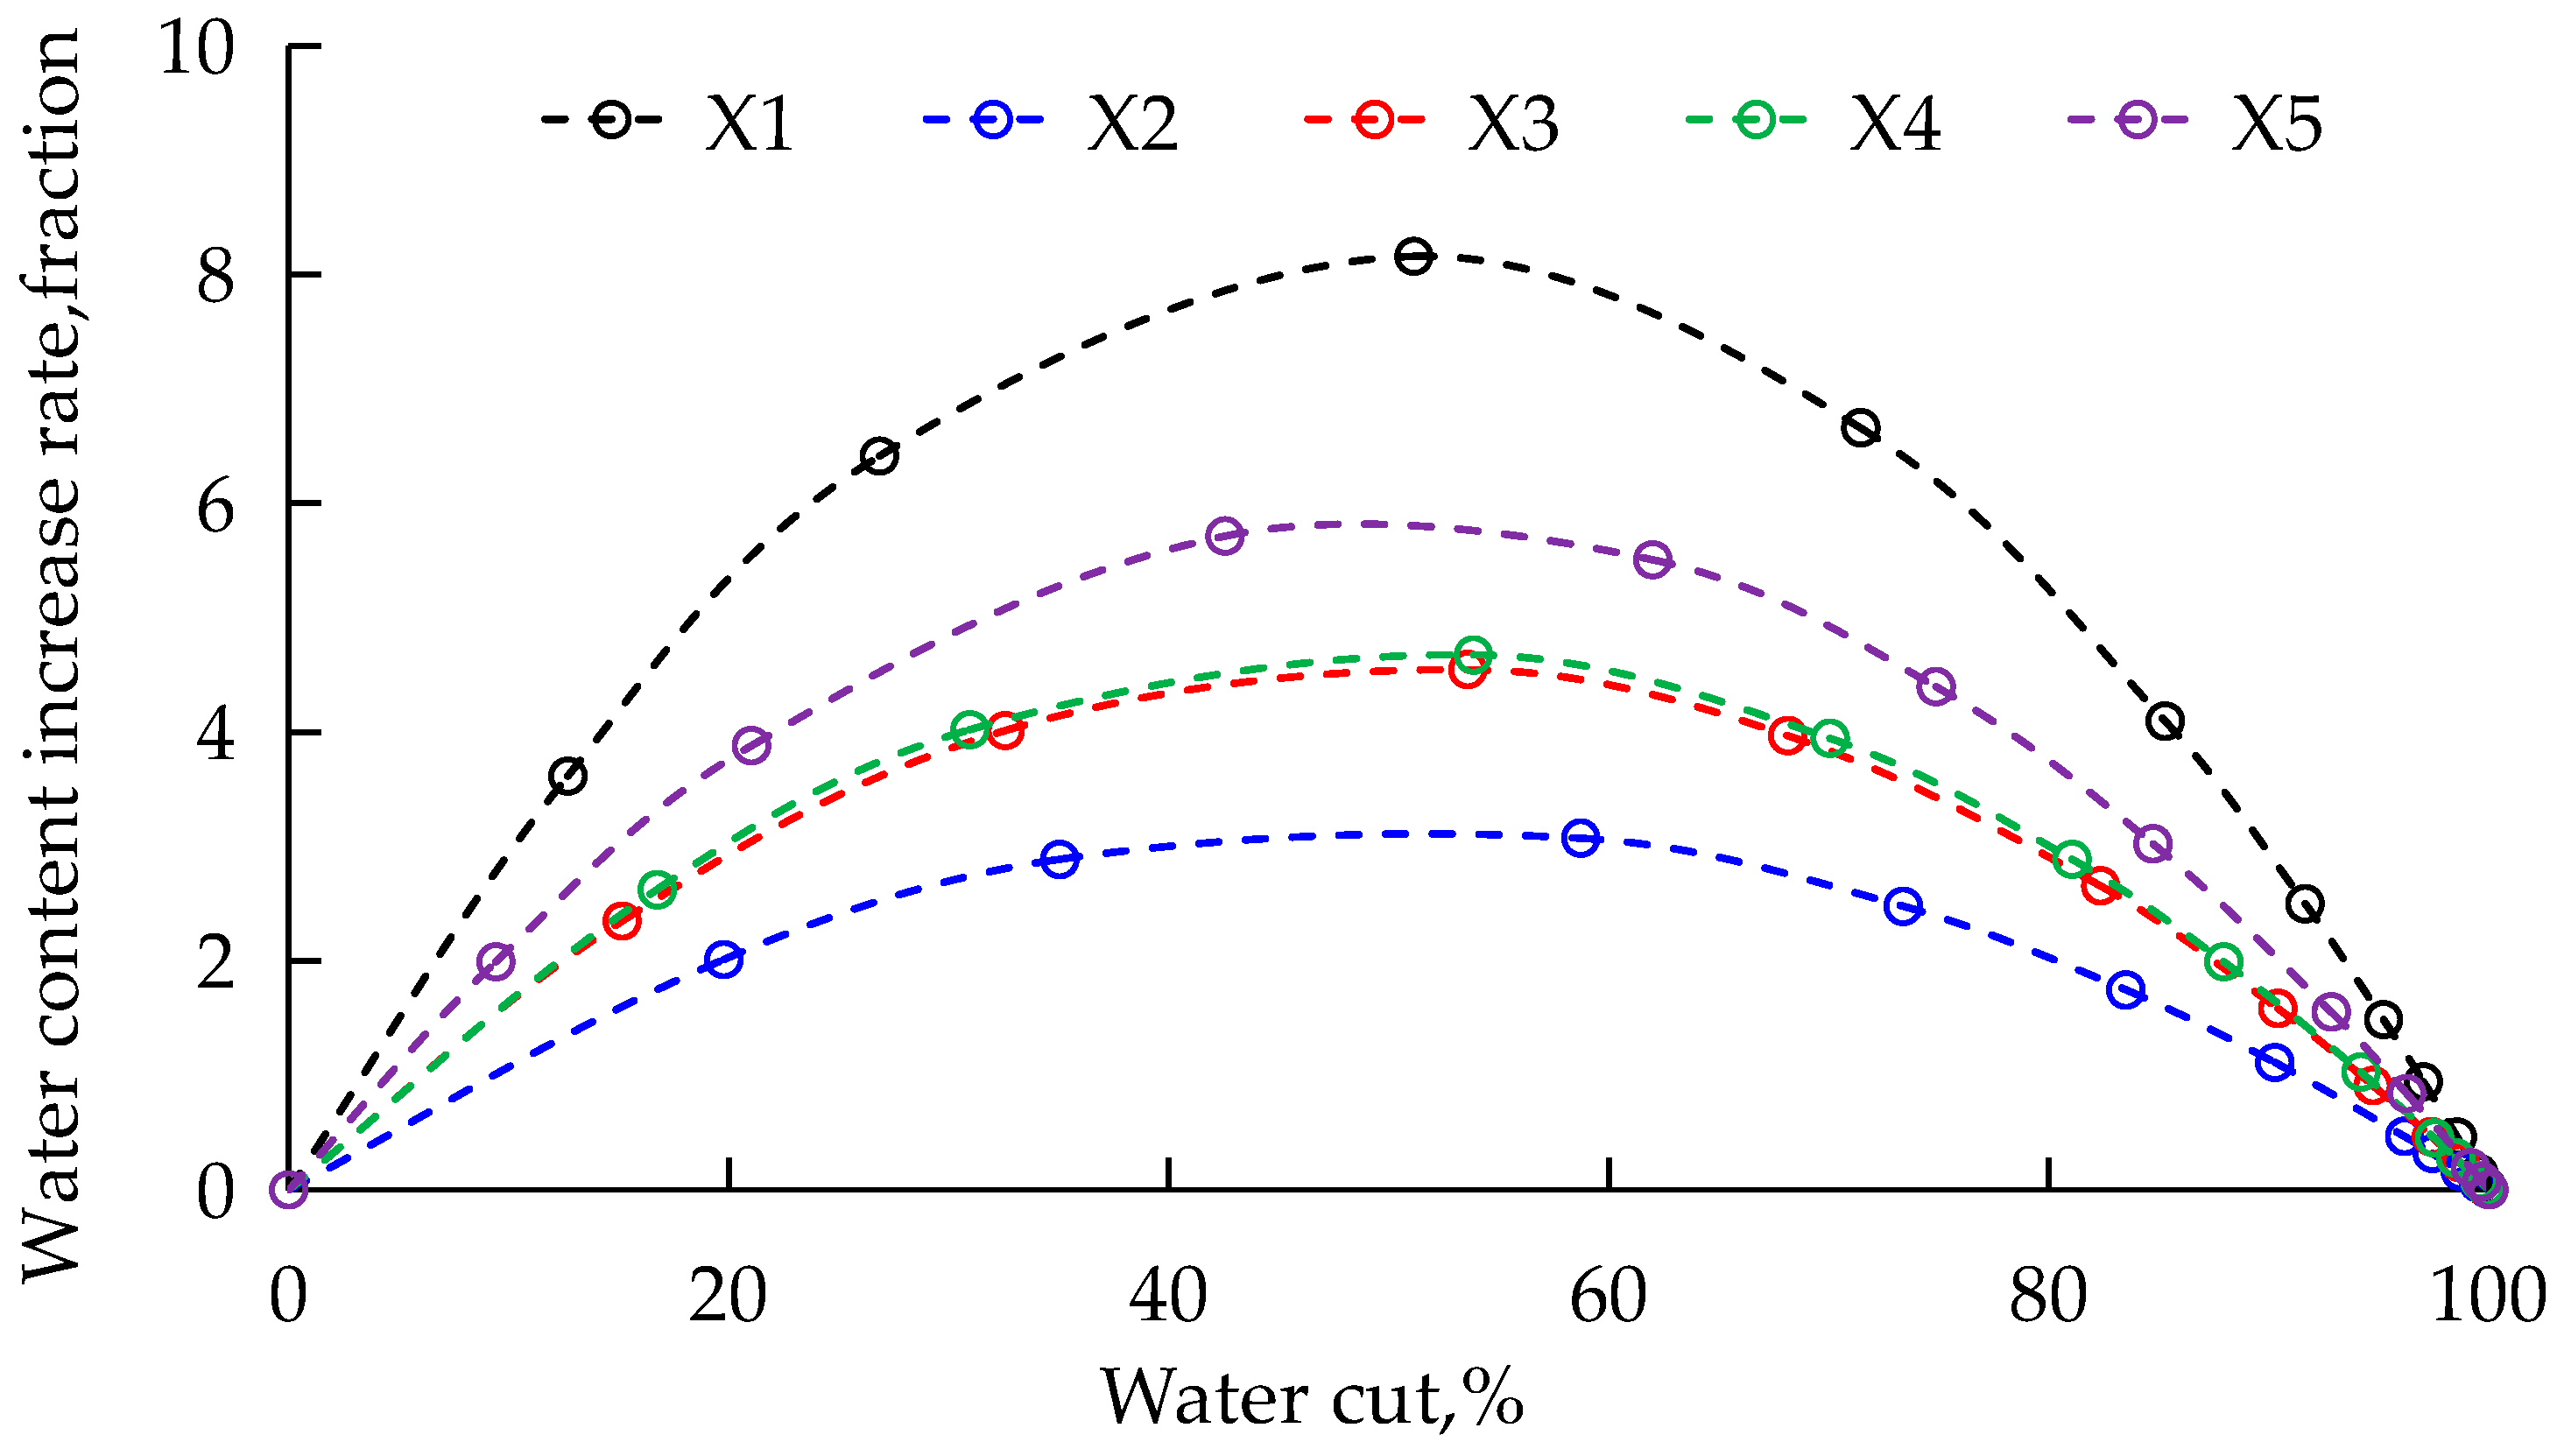
Figure 21.
Relationship curve between water cut increase rate and water saturation.

Figure 22.
Water cut curve of corresponding oil wells in the YW oil reservoir samples.
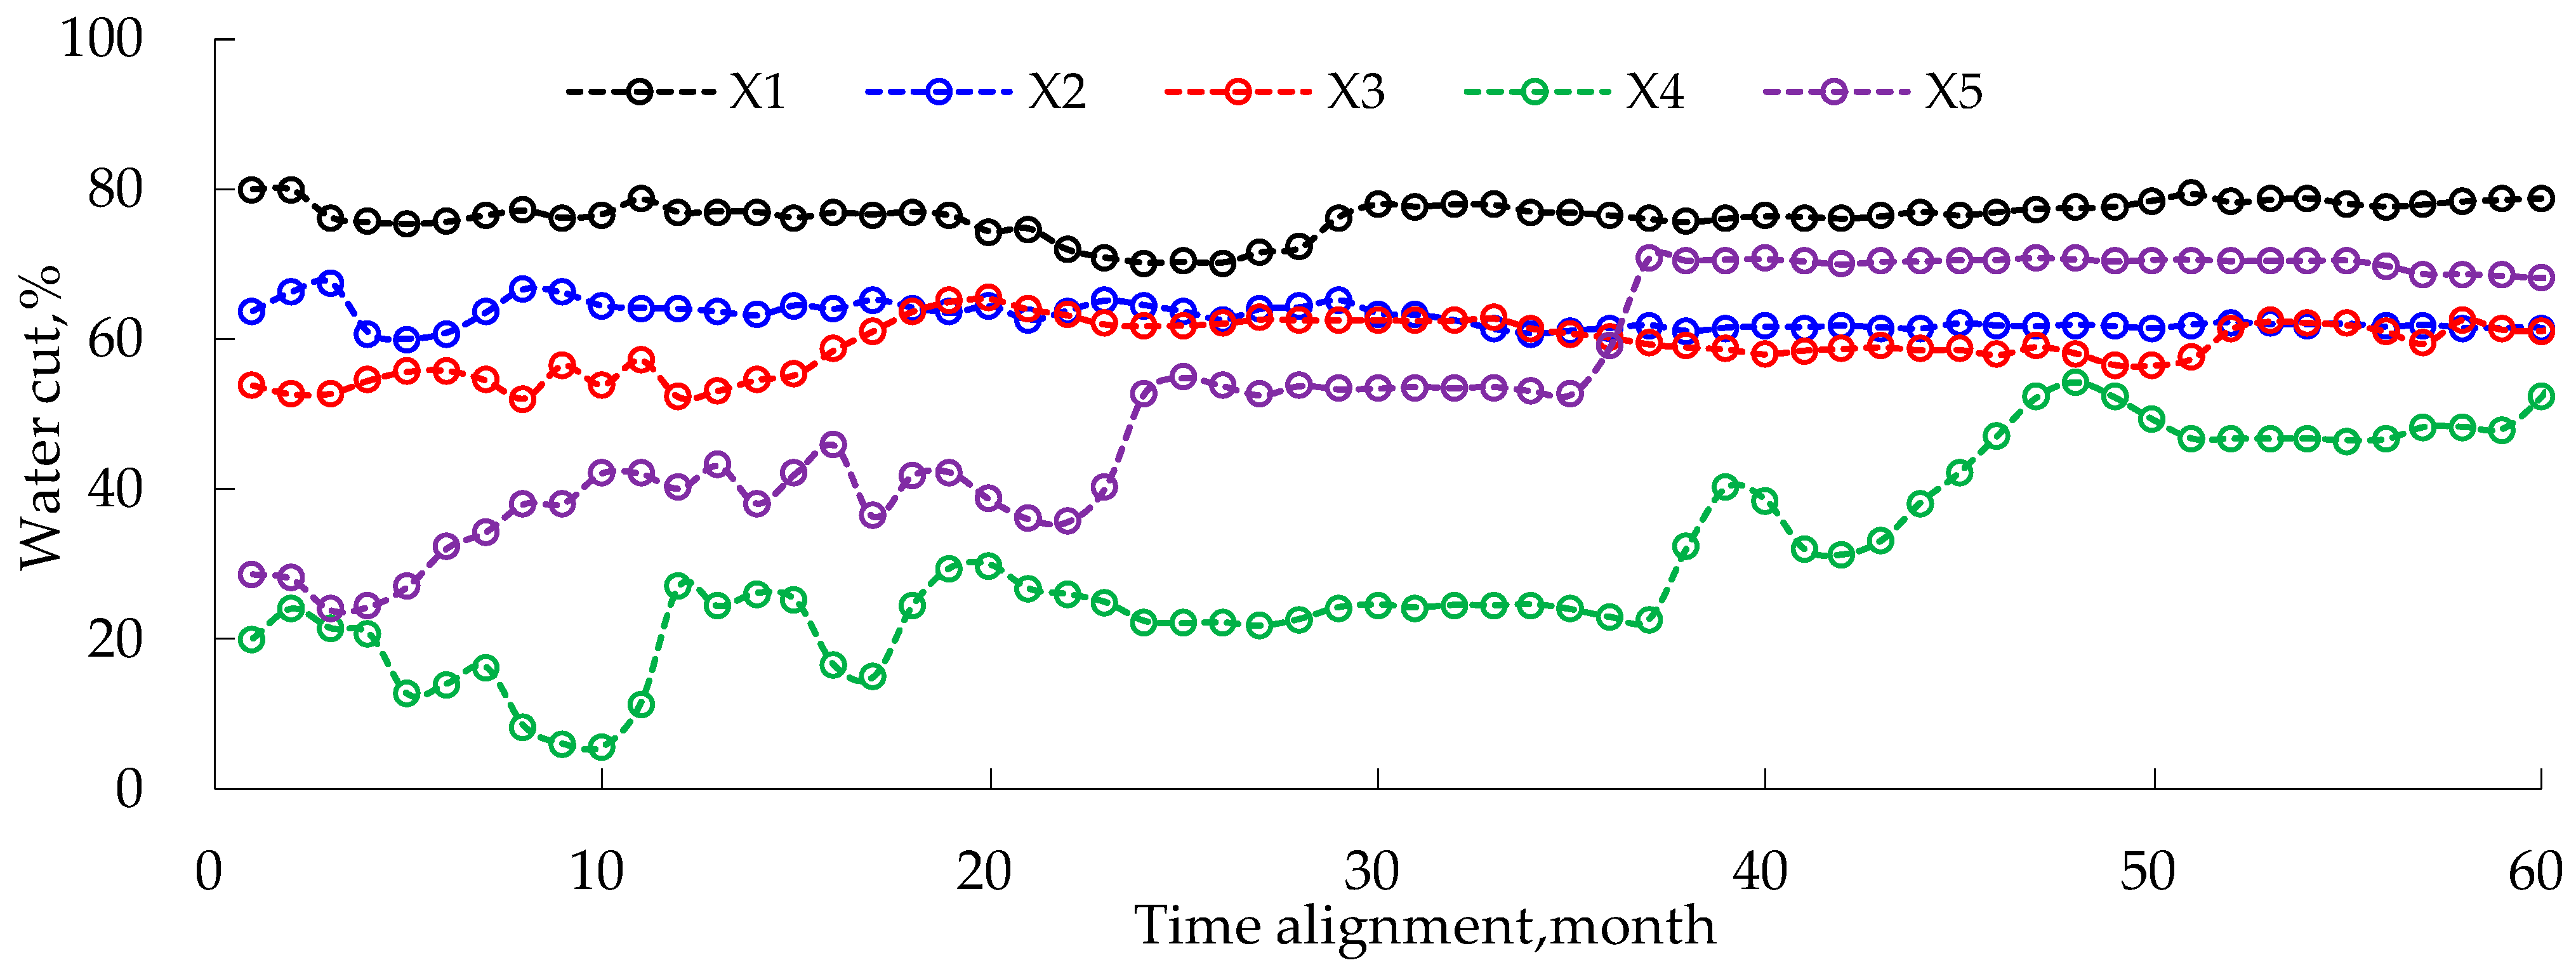

Table 1.
Statistical table of sample pore heterogeneity characteristic parameters.
| No. | Textural Maturity | Cementitious Contact Type | |||
|---|---|---|---|---|---|
| Sorting | Psephicity | Cementation Type | Support Type | Contact Method | |
| X1 | Medium | Sub-round, sub-angular | Pore-type | Particle | Point–line contact |
| X2 | Well | Sub-round, sub-angular | Pore-type | Particle | Point–line contact |
| X3 | Well | Sub-round | Pore-type | Particle | Point–line contact |
| X4 | Medium | Sub-round, sub-angular | Pore-type | Particle | Line contact |
| X5 | Well | Sub-round, sub-angular | Pore-type | Particle | Point–line contact |
Table 2.
Pore throat volume ratios and pore-structure-related parameters.
| No. | Permeability /mD | Intergranular Pore/% | Surface Porosity/% | Maximum Mercury Saturation/% | Residual Mercury Saturation/% | Pore Throat Volume Ratio | Displacement Pressure/MPa |
|---|---|---|---|---|---|---|---|
| X1 | 34.0 | 3.75 | 8.25 | 94.1 | 63.3 | 2.06 | 0.33 |
| X2 | 16.9 | 2.75 | 5.75 | 90.1 | 60.4 | 2.03 | 0.12 |
| X3 | 1.91 | 2.00 | 3.50 | 95.7 | 60.2 | 1.70 | 0.08 |
| X4 | 15.1 | 3.75 | 6.50 | 83.7 | 60.0 | 2.53 | 1.38 |
| X5 | 11.4 | 3.75 | 6.25 | 91.3 | 58.1 | 1.75 | 0.39 |
Table 3.
Statistical table of particle size characteristics of the samples.
| No. | Depth /m | Lithology | Very Coarse Sand/% | Coarse Sand/% | Medium Sand/% | Fine Sand/% | Average Particle Size/mm | Standard Deviation | Skewness | Kurtosis |
|---|---|---|---|---|---|---|---|---|---|---|
| −1 < Φ ≤ 0 | 0 < Φ ≤ 1 | 1 < Φ ≤ 2 | 2 < Φ ≤ 4 | |||||||
| X1 | 2300.3 | Medium-grained sandstone | 0.0 | 24.7 | 74.7 | 0.7 | 1.21 | 0.34 | −0.09 | 1.01 |
| X2 | 2298.3 | Medium-grained sandstone | 0.9 | 22.5 | 75.0 | 1.6 | 1.26 | 0.38 | −0.83 | 1.02 |
| X3 | 2340.5 | Medium-grained sandstone | 0.0 | 13.9 | 84.2 | 1.8 | 1.41 | 0.32 | −0.17 | 1.13 |
| X4 | 2370.6 | Arenaceous medium-grained sandstone | 0.0 | 30.7 | 68.7 | 0.6 | 1.12 | 0.36 | −0.43 | 0.93 |
| X5 | 2263.9 | Medium-grained sandstone | 0.8 | 23.6 | 74.0 | 1.6 | 1.32 | 0.37 | −0.12 | 0.97 |
| Avg | 0.3 | 23.1 | 75.3 | 1.3 | 1.26 | 0.35 | −0.19 | 1.02 |
Table 4.
Statistical table of the samples’ relative permeability test results.
| No. | Porosity /% | Permeability /mD | With Irreducible Water (Wwc) | At Isotonic Point (Aip) | With Residual Oil (Wor) | Water Saturation in Oil–Water Co-Permeability Zone/% | |||
|---|---|---|---|---|---|---|---|---|---|
| Oil Phase Permeability /mD | Water Saturation /% | Oil–Water Co-Permeability /mD | Water Saturation /% | Water Phase Permeability /mD | Water Saturation /% | ||||
| X1 | 15.4 | 34.0 | 6.82 | 48.9 | 0.086 | 57.5 | 2.220 | 61.7 | 12.8 |
| X2 | 14.8 | 16.9 | 3.44 | 63.3 | 0.093 | 71.6 | 0.974 | 75.0 | 11.7 |
| X3 | 13.1 | 1.91 | 1.51 | 50.7 | 0.085 | 61.3 | 0.378 | 65.8 | 15.1 |
| X4 | 13.3 | 15.1 | 3.49 | 56.7 | 0.099 | 64.3 | 0.811 | 67.5 | 10.8 |
| X5 | 15.9 | 11.4 | 2.83 | 50.7 | 0.084 | 59.4 | 0.591 | 63.0 | 12.3 |
| Avg | 14.5 | 15.9 | 3.62 | 54.1 | 0.089 | 62.8 | 0.990 | 66.6 | 12.5 |
Table 5.
Statistical table of the samples’ wettability test results.
| No. | Permeability /mD | Water Wettability Index | Oil Wettability Index | Relative Wettability Index | Wettability Assessment | Anhydrous Period Oil Displacement Efficiency/% | Final Oil Displacement Efficiency/% |
|---|---|---|---|---|---|---|---|
| X1 | 34.0 | 0.50 | 0.33 | 0.17 | Slightly water-wet | 6.3 | 25.0 |
| X2 | 16.9 | 0.67 | 0.20 | 0.47 | Water-wet | 10.9 | 31.8 |
| X3 | 1.91 | 0.60 | 0.25 | 0.35 | Water-wet | 8.5 | 30.8 |
| X4 | 15.1 | 0.63 | 0.12 | 0.51 | Water-wet | 5.0 | 20.8 |
| X5 | 11.4 | 0.43 | 0.25 | 0.18 | Slightly water-wet | 6.9 | 25.0 |
Table 6.
Related parameters of the waterflood front sample.
| No. | Waterflood Front/% | Water Saturation/% | Water Saturation Difference/% | |||||
|---|---|---|---|---|---|---|---|---|
| Water Saturation | Water Current | When Irreducible Water | When Isotonic Point | When Residual Oil | When Waterflood Front and Irreducible Water | When Waterflood Front and Isotonic Point | When Residual Oil and Waterflood Front | |
| X1 | 58.2 | 85.3 | 48.9 | 57.5 | 61.7 | 9.3 | 0.7 | 3.5 |
| X2 | 72.3 | 83.5 | 63.3 | 71.6 | 75.0 | 9.0 | 0.7 | 2.7 |
| X3 | 62.0 | 82.3 | 50.7 | 61.3 | 65.8 | 11.3 | 0.7 | 3.8 |
| X4 | 64.6 | 81.0 | 56.7 | 64.3 | 67.5 | 7.9 | 0.3 | 2.9 |
| X5 | 60.2 | 84.7 | 50.7 | 59.4 | 63.0 | 9.5 | 0.8 | 2.8 |
Disclaimer/Publisher’s Note: The statements, opinions and data contained in all publications are solely those of the individual author(s) and contributor(s) and not of MDPI and/or the editor(s). MDPI and/or the editor(s) disclaim responsibility for any injury to people or property resulting from any ideas, methods, instructions or products referred to in the content. |
© 2023 by the authors. Licensee MDPI, Basel, Switzerland. This article is an open access article distributed under the terms and conditions of the Creative Commons Attribution (CC BY) license (https://creativecommons.org/licenses/by/4.0/).
Share and Cite
MDPI and ACS Style
Li, M.; Qu, Z.; Wang, M.; Ran, W. The Influence of Micro-Heterogeneity on Water Injection Development in Low-Permeability Sandstone Oil Reservoirs. Minerals 2023, 13, 1533. https://doi.org/10.3390/min13121533
AMA Style
Li M, Qu Z, Wang M, Ran W. The Influence of Micro-Heterogeneity on Water Injection Development in Low-Permeability Sandstone Oil Reservoirs. Minerals. 2023; 13(12):1533. https://doi.org/10.3390/min13121533
Chicago/Turabian StyleLi, Mao, Zhan Qu, Mu Wang, and Wang Ran. 2023. "The Influence of Micro-Heterogeneity on Water Injection Development in Low-Permeability Sandstone Oil Reservoirs" Minerals 13, no. 12: 1533. https://doi.org/10.3390/min13121533
Note that from the first issue of 2016, this journal uses article numbers instead of page numbers. See further details here.