
Pressure-Induced Reverse Structural Transition of Calcite at Temperatures up to 873 K and Pressures up to 19.7 GPa


1
Key Laboratory of High-Temperature and High-Pressure Study of the Earth’s Interior, Institute of Geochemistry, Chinese Academy of Sciences, Guiyang 550081, China
2
University of Chinese Academy of Sciences, Beijing 100049, China
*
Authors to whom correspondence should be addressed.
Minerals 2023, 13(2), 188; https://doi.org/10.3390/min13020188
Submission received: 2 December 2022
/
Revised: 24 January 2023
/
Accepted: 26 January 2023
/
Published: 27 January 2023
(This article belongs to the Special Issue High-Pressure Physical and Chemical Behaviors of Minerals and Rocks)
Abstract
:In situ Raman scattering and electrical conductivity experiments have been performed to investigate the structural phase transitions of calcite during the compressed and decompressed processes in a diamond anvil cell at temperatures of 298–873 K and pressures up to 19.7 GPa. Upon compression, calcite (CaCO3-I phase) underwent three structural phase transitions from CaCO3-I to CaCO3-II phases at 1.6 GPa, from CaCO3-II to CaCO3-III phases at 2.2 GPa, and from CaCO3-III to CaCO3-VI phases at 16.8 GPa under room temperature conditions, which were evidenced by the evolution of Raman peaks, as well as the discontinuities in the pressure-dependent Raman shifts and electrical conductivity. Upon decompression, the structural phase transitions from CaCO3-VI to CaCO3-III to CaCO3-II to CaCO3-I phases took place at the respective pressures of 5.4, 1.5, and 0.4 GPa, indicating the reversibility of calcite. Furthermore, an obvious ~11 GPa of pressure hysteresis was detected in the CaCO3-VI to CaCO3-III phase transition, whereas other reverse phase transition pressures were very close to those of compressed results. At three given representative pressure conditions (i.e., 10.5, 12.5, and 13.8 GPa), a series of electrical conductivity experiments were performed at temperature ranges of 323–873 K to explore the temperature-dependent relation of CaCO3-III to CaCO3-VI structural phase transition. With increasing pressure, the transition temperature between CaCO3-III and CaCO3-VI phases gradually decreases, which reveals an obviously negative temperature-pressure relation, i.e., P (GPa) = 19.219 (±1.105) − 0.011 (±0.002) T (K). Our acquired phase diagram of calcite can be employed to understand the high-pressure structural transitions and phase stability for carbonate minerals along various subducting slabs in the deep Earth’s interior.
1. Introduction
In nature, calcium-carbonate minerals crystallize in three different structural forms: rhombohedral calcite, orthorhombic aragonite and hexagonal vaterite. Among those of calcium-carbonate minerals, calcite is an important and common rock-forming mineral in the Earth’s crust, and is considered as a crucial carrier of carbon. Calcite plays a key role in the deep carbon cycle of the Earth’s interior, which can be transported into the interior of the Earth through the subduction of oceanic crust [1,2,3,4,5,6,7,8]. Thus, it is vital to investigate the structural transition and phase stability for calcite under high-temperature and high-pressure conditions.
A great number of Raman scattering investigations on the structural transition and phase stability of calcite have been performed under conditions of room temperature and high pressure [9,10,11,12]. For most of these previously acquired results, three main high-pressure polymorphs of calcite (CaCO3-I phase) were disclosed, i.e., monoclinic calcite (CaCO3-II phase), layered triclinic calcite (CaCO3-III phase), and non-layered triclinic calcite (CaCO3-VI phase). The structural phase transitions for these of CaCO3-I to CaCO3-II phases and CaCO3-II to CaCO3-III phases have been well documented at lower pressure points of 1.6 GPa and 2.0 GPa by means of Raman scattering spectroscopy in a diamond anvil cell at room temperature [9,10]. However, the high-pressure crystalline structure of CaCO3-III phase and its corresponding transformation pressure remains controversial in all of the listed previously reported results. For example, Suito et al. explored the structural phase transition of calcite through Raman scattering measurement in combination with synchrotron X-ray experiments at room temperature and pressures up to 10.0 GPa [11]. Their results showed that CaCO3-I to CaCO3-II and CaCO3-II to CaCO3-III phase transitions appear at the respective pressures of 1.7 GPa and 2.1 GPa. The authors further increased pressure to 10.0 GPa, and totally new Raman peaks exhibiting the discrepancy with the CaCO3-III phase were observed, which was possibly related to a pressure-induced structural phase transition from CaCO3-III phase to aragonite. Subsequently, Liu et al. investigated the high-pressure behavior of calcite up to 75.0 GPa by virtue of Raman spectroscopy and theoretical calculations [12]. They revealed that the CaCO3-I to CaCO3-III phase transition takes place at 2.0 GPa, and further, the CaCO3-III phase transforms into the CaCO3-VI phase instead of aragonite at 16.0 GPa, which is inconsistent with the high-pressure Raman scattering results to be reported by Suito et al. Therefore, further Raman spectroscopic investigation on calcite is indispensable to explore its vibrational properties with increasing pressure at room temperature.
On the other hand, high-pressure electrical conductivity measurement is also an effective experimental means of extrapolating structural transition and phase stability for carbonate minerals at high temperatures [13,14,15,16,17]. Bagdassarov and Slutskii conducted the electrical conductivity measurement of calcite under temperature ranges from 600 K to 1200 K and pressures of 0.5–2.5 GPa in a piston cylinder apparatus to establish the phase boundaries from calcite to aragonite, from CaCO3-I to CaCO3-IV phases and from CaCO3-IV to CaCO3-V phases [13]. However, owing to the uppermost limited pressure range in the piston cylinder apparatus, their maximum experimental pressure is only up to 2.5 GPa under simultaneous high-temperature and high-pressure conditions. Therefore, it is important to investigate the structural transition and phase stability for calcite by means of electrical conductivity measurement under broader temperature and pressure ranges.
In the present work, we have investigated the structural transition and phase stability for calcite under conditions of 298–873 K and pressures up to 19.7 GPa in a diamond anvil cell by in situ Raman spectroscopy and electrical conductivity measurements. Three high-pressure structural transformations from CaCO3-I to CaCO3-II to CaCO3-III to CaCO3-VI phases were revealed at the respective pressures of 1.6, 2.2, and 16.8 GPa under atmospheric temperature. At three fixed pressure points (i.e., 10.5, 12.5, and 13.8 GPa), the phase transition temperatures between CaCO3-III and CaCO3-VI phases were individually determined. Furthermore, a pressure-temperature phase diagram of calcite was well established at the temperatures of 298–773 K, pressures up to 16.0 GPa and depth up to 480 km, and further, its potential geophysical implications were discussed in detail.
2. Materials and Methods
2.1. Sample Preparation and Characterization
Naturally transparent single-crystal calcite (Spec: 3.0 cm × 3.0 cm × 2.0 cm) was gathered from Nanyang ore district in Qingyang county, Anhui province, China. We crushed and ground the initial single-crystal calcite into powder in an agate mortar. The crystalline structure of the starting sample was characterized by X-ray diffraction (XRD) experiments operating with a PIXcel3D area detector (X-ray wavelength: 0.154056 nm; collection time: 4 min; beam size: 0.5 mm; working voltage: 2.2 kV and resolution: 0.028°) in the State Key Laboratory of Ore Deposit Geochemistry, Institute of Geochemistry, Chinese Academy of Sciences. As shown in Figure 1, the obtained XRD pattern can be well indexed with a trigonal crystalline system of the space group of : Rc. The GSAS software package was employed to fit and refine the obtained XRD data [18]. The lattice parameters of calcite were determined as a = b = 4.988 ± 0.003 Å, c = 17.052 ± 0.002 Å; α = β = 90°, γ = 120°; and V = 367.48 ± 0.56 Å3 (JCPDS NO. 83-0578), which agrees well with previously reported results [19,20].
2.2. High-Pressure Raman Spectroscopy Measurements
High-pressure Raman scattering experiments of calcite were carried out using a piston-cylinder diamond anvil cell (DAC) with a 300-μm diameter anvil culet. A piece of custom-built T-301 stainless steel (Spec: the area of 5 × 5 mm2 and its corresponding thickness of 250 μm) was utilized as the gasket and then was pre-indented into an approximate 50-μm thickness. In the center of the pre-indented gasket, one new 100-μm hole was drilled as the sample chamber. Subsequently, calcite powder samples together with several tiny grains of ruby were sealed into the sample chamber. The pressure inside the sample chamber was calibrated on the basis of the wavenumber shift of the fluorescence peak of the trivalent chromic ion from ruby [21]. The high-pressure Raman scattering experiments of calcite were conducted in the backscattering geometry by means of a confocal Renishaw 2000 Raman spectrometer with an Olympus charge-coupled device (CCD) camera. The 514.5 nm wavenumber of Argon ion laser was applied as the excitation laser with the magnitude of powers of 1 mW and 0.5–50 μW for high-pressure Raman measurements of calcite and each corresponding pressure calibration of ruby, respectively. The Raman spectra of calcite were collected within the wavenumber range of 100–1200 cm−1 with a resolution of 0.1 cm−1 at each pre-designed pressure. The acquisition time was set as 240 s for each individual Raman spectroscopy measurement.
2.3. High-Pressure Electrical Conductivity Measurements
High-temperature and high-pressure electrical conductivity measurements of calcite were performed using a well-designed four column-type DAC with a 300-μm diameter taking advantage of its large lateral space, which has been widely applied to our previous electrical transport experiments [22,23,24,25,26,27,28,29,30,31,32,33,34]. A mixture of cubic boron nitride (c-BN) and epoxy resin powders was utilized to constitute an insulating sample chamber. Then, a new central hole with the 120-μm diameter was made by a laser drilling machine. Plate electrodes of platinum with 4-μm thickness were integrated separately onto the upper and lower counterparts of the sample chamber. Prior to the electrical conductivity measurement, experimental samples were heated to 373 K in a vacuum oven for 12 h to eliminate the absorbed water. The alternating current (AC) impedance spectroscopy of calcite was measured using the combination interface of Solartron-1260 and Solartron-1296 impedance analyzers within the frequency range of 10−1–107 Hz at a fixed signal voltage of 1.0 V. High-temperature conditions were provided by two external resistance heating furnaces which were tightly twisted around the tungsten carbide bases. A k–type thermocouple (NiCr–NiAl) with temperature error of ±5 K was attached to the side face of a diamond to monitor the temperature of the sample chamber. For high-temperature and high-pressure electrical conductivity measurements, we firstly compressed the sample to pre-determined pressure values, and gradually heated the sample chamber from 298 K to 873 K with a temperature interval of 50 K. Then, the temperature was sustained for at least ten minutes to achieve the thermal transference equilibrium. In order to protect the sample assemblage, a cooling system equipped with circulating water was used under high-temperature conditions. The detailed descriptions of the high-temperature and high-pressure experimental methods and measurement procedures have been reported in our previous work [35,36,37].
3. Results and Discussion
3.1. High-Pressure Raman Spectroscopy at Room Temperature
Figure 2 presents in situ Raman spectra of calcite with increasing pressures up to 19.4 GPa at atmospheric temperature. At the pressure of 0.5 GPa, the Raman spectrum of sample shows four Raman-active modes within the wavenumber range of 100–1200 cm−1. According to previously reported Raman results on calcite [12], the strongest Raman characteristic peak at 1087.4 cm−1 is assigned to the symmetric stretching vibrational mode of carbonate ions (v1). The weakest Raman peak of 714.4 cm−1 is related to the in-plane bend mode of carbonate ions (v4) and two lattice modes of the translational (T) and librational (L) vibrations are observed at the respective positions of 155.4 cm−1 and 283.6 cm−1. All those available Raman modes are in good agreement with previously reported Raman scattering results [9,10,11].
As seen from Figure 2a, within the pressure range of 0.5–1.1 GPa, all of the observed Raman peaks of sample tended to shift towards higher wavenumbers with increasing pressure. Upon compression to 1.6 GPa, the translational vibration mode (T) completely disappeared, which was accompanied by the emergence of three absolutely new Raman peaks at 129.5 cm−1 (M1), 153.5 cm−1 (M2), and 204.4 cm−1 (M3). At the same time, the Raman peak of v4 split into two Raman peaks at the respective positions of 709.7 cm−1 (M4) and 724.5 cm−1 (v4). These obvious Raman variations including the disappearance of the characteristic T mode, the appearance of three new Raman peaks (M1, M2, and M3), and the splitting of the v4 mode can provide robust evidences for the occurrence of structural transition from CaCO3-I to CaCO3-II phases, which is related to a strong rotational disorder of the CO3 groups with clockwise rotation [38]. With the rise of pressure up to 2.2 GPa, the librational vibration mode (L) suddenly disappeared and seven new Raman peaks emerged at the respective positions of 108.7 cm−1 (M5), 225.3 cm−1 (M6), 275.1 cm−1 (M7), 302.9 cm−1 (M8), 345.1 cm−1 (M9), 693.7 cm−1 (M10), and 867.5 cm−1 (M11). Simultaneously, a shoulder peak was observed at 1089.6 cm−1 (M12) near the v1 peak. In short, all of these clues from the variations of Raman characteristic peaks at 2.2 GPa reveal the occurrence of CaCO3-II to CaCO3-III structural phase transition by the displacement of Ca atom and the rotational disorder of CO3 groups under high pressure [38]. In the pressure range of 2.2–14.2 GPa, the Raman peaks of sample continuously shifted towards higher wavenumbers except for the M11 Raman peak showing a red shift. As the pressure was increased to 16.8 GPa, the shoulder peak (M12) and the v4 peak suddenly disappeared, and a new Raman peak at 325.7 cm−1 (M13) appeared in the lattice vibrational range of calcite. Meanwhile, the M11 mode exhibited a noticeable change from red shift to blue shift. These remarkable changes in Raman spectra indicate that CaCO3-III phase transforms into CaCO3-VI phase at 16.8 GPa. In addition, we also carefully checked the pressure-dependent Raman shifts of calcite during compression, as illustrated in Figure 3, and the corresponding pressure coefficients are clearly displayed in Table 1. It is noted that three obvious discontinuities in the pressure-dependent Raman shifts were detected at those of corresponding pressure points (i.e., 1.6, 2.2 and 16.8 GPa), which further denotes the pressure-induced structural phase transitions of calcite. In sum, our high-pressure Raman spectroscopic results reveal that calcite undergoes three structural phase transitions from CaCO3-I to CaCO3-II phases at 1.6 GPa, from CaCO3-II to CaCO3-III phases at 2.2 GPa, and from CaCO3-III to CaCO3-VI phases at 16.8 GPa upon compression, which are in excellent agreement with the reported Raman scattering results [9,10,11].
Figure 4 displays in situ Raman spectra of calcite in the process of decompression from 18.3 GPa to 1 atm at room temperature. The corresponding pressure-dependent Raman shifts and pressure coefficients for calcite are illustrated in Figure 5 and Table 2, respectively. It is obvious that the Raman peaks of CaCO3-VI phase exhibited red shift with decreasing pressure at 18.3–6.9 GPa. As the pressure was decompressed to 5.4 GPa, the characteristic Raman peaks of CaCO3-III phase were recovered at the corresponding wavenumbers, implying the appearance of CaCO3-VI to CaCO3-III phase transition. Upon decompression to 1.5 GPa, the librational vibration mode (L) reemerged at 283.4 cm−1, which reveals the structural phase transformation from CaCO3-III to CaCO3-II phases. Further releasing pressure to 0.4 GPa, the recoverable Raman peaks of CaCO3-I phase are indicative of the onset of reverse structural transition from CaCO3-II to CaCO3-I phases. In brief, during decompression, the reverse structural phase transitions from CaCO3-VI to CaCO3-III to CaCO3-II to CaCO3-I phases are disclosed at the respective pressures of 5.4, 1.5, and 0.4 GPa. In comparison with the structural phase transitions of calcite at 1.6, 2.2, and 16.8 GPa in the compression process, a considerable pressure hysteresis of ~11 GPa between CaCO3-VI and CaCO3-III phases was detected, which is in good consistency with the obvious hysteresis of previously high-pressure infrared spectroscopy results on calcite to be reported by Catalli and Williams [39].
3.2. High-Pressure Electrical Conductivity at Ambient Temperature
Previously available results have confirmed that the occurrence of pressure-induced phase transition for some representative minerals from the regions of the mid-lower Earth’s crust and subduction zone also accompanied some discontinuous variations in electrical transport properties [28,29,31,40,41,42,43]. At room temperature, the in situ impedance spectroscopy experiments of calcite were measured up to 19.7 GPa to further shed light on its structural transitions, as plotted in Figure 6. It can be clearly seen from Figure 6a–c that the impedance spectra of calcite consist of a semicircular arc in the high frequency region (~103–107 Hz) and an oblique line in the low frequency range (10−1–~103), which stands for the grain interior resistance (Rgi) and the grain boundary resistance (Rgb) for the calcite sample, respectively. To precisely determine the resistance values of the sample, ZView software was employed to fit the obtained impedance spectra. The fitting equivalent circuit is composed of two components in series and each component includes a resistance (R) and a constant phase element (CPE) in parallel. The fitting uncertainties of the impedance spectra were controlled to be less than 5%.
The electrical conductivity of calcite (σ) is calculated on the basis of the following equation:
where L is the experimental sample length (cm), S is the cross-sectional area of electrode (cm2), and R is the resistance of sample (Ω), respectively. Figure 6d exhibits the pressure-dependent logarithmic electrical conductivity of calcite in both compressed and decompressed processes at room temperature. In light of the pressure-dependent electrical conductivity relation, three separate pressure regions were distinguished upon compression: (i) from 0.5 GPa to 2.3 GPa, the logarithmic electrical conductivity rapidly increased with a steep slope of 0.36 S cm−1 GPa−1; (ii) from 2.3 GPa to 15.5 GPa, a gentle slope of 0.07 S cm−1 GPa−1 was acquired; (iii) from 15.5 GPa to 19.7 GPa, the logarithmic electrical conductivity values kept stable with a tiny slope of 0.03 S cm−1 GPa−1. According to the high-pressure electrical conductivity results of calcite, two striking discontinuities at 2.3 GPa and 15.5 GPa were detected, which can be attributed to the pressure-induced structural phase transitions from CaCO3-II to CaCO3-III phases and CaCO3-III to CaCO3-VI phases, respectively. Upon decompression, an apparent discontinuity in the electrical conductivity of calcite at 5.4 GPa can be ascribed to the reverse structural phase transition of CaCO3-VI to CaCO3-III phases. Furthermore, the recoverable electrical conductivity magnitude at 0.6 GPa indicates the reversibility of the structural transition of calcite.
In addition, Table 3 displays the structural phase transition pressures of calcite at room temperature obtained from previously reported results and ours for comparison. During compression, according to our presently obtained high-pressure Raman scattering and electrical conductivity results, calcite undergoes a series of structural transitions from CaCO3-I to CaCO3-II phases at 1.6 GPa, from CaCO3-II to CaCO3-III phases at 2.2 GPa, and from CaCO3-III to CaCO3-VI phases at 16.8 GPa, which accords well with the phase transition pressures of calcite in previous results reported by high-pressure Raman spectroscopy, Brillouin spectroscopy, synchrotron X-ray diffraction, shock wave experiment, and infrared spectroscopy measurements [9,10,11,12,38,39,44,45,46].
3.3. Electrical Conductivity at High Temperature and High Pressure
In order to explore the influence of temperature on the structural transition pressure between CaCO3-III and CaCO3-VI phases, a series of high-temperature electrical conductivity measurements were implemented at three representative pressure points of 10.5, 12.5, and 13.8 GPa. Figure 7a–c shows the impedance spectra of calcite in the temperature range of 323–873 K at a given pressure of 10.5 GPa. The corresponding logarithmic electrical conductivity as a function of reciprocal temperature is displayed in Figure 7d. The fitted parameters of the Arrhenius relation for the electrical conductivity of calcite at the pressure of 10.5, 12.5, and 13.8 GPa are displayed in a Table 4. Within the temperature ranges of 323–573 K and 723–873 K, the logarithmic electrical conductivity of the sample significantly increased with the rise of temperature, which is correlated with the enhanced mobility of charge carried at high temperatures [47]. However, a remarkable reduction in logarithmic electrical conductivity by approximately three orders of magnitude was observed at 573–723 K, which is probably related to the structural transition from CaCO3-III to CaCO3-VI phases. Specifically, at a fixed pressure of 10.5 GPa, the CaCO3-III to CaCO3-VI structural phase transition was completely ended at 723 K. Subsequently, we also measured the impedance spectra of calcite under conditions of temperature ranges of 323–873 K and 12.5 GPa, and the relationship between electrical conductivity and reciprocal temperature was established, as shown in Figure 8 in detail. Simultaneously, Figure 9 also displayed the impedance spectra of calcite, and its corresponding constructed relationship of logarithmic electrical conductivity with the variation of temperature within the fixed temperature range of 323–873 K and 13.8 GPa. Analogous to the above-mentioned Figure 7, all of these discontinuities in electrical conductivity with increasing temperature reveal the occurrences of the structural transformation from CaCO3-III to CaCO3-VI phases within the temperature ranges of 473–623 K and 423–523 K at the respective pressures of 12.5 GPa and 13.8 GPa. According to a series of detailed high-pressure electrical transport characterizations on calcite, we can initially outline that the CaCO3-III to CaCO3-VI structural phase transitions occurs at temperatures of 723, 623, and 523 K corresponding to three typical pressure points of 10.5, 12.5, and 13.8 GPa, respectively. In comprehensive combination with our previously obtained high-pressure Raman spectroscopy and electrical conductivity results at atmospheric temperature and high-temperature electrical conductivity results at high pressure, an obvious reducing tendency of phase transition temperature for calcite from the CaCO3-III to CaCO3-VI phases was observed with the rise of pressure.
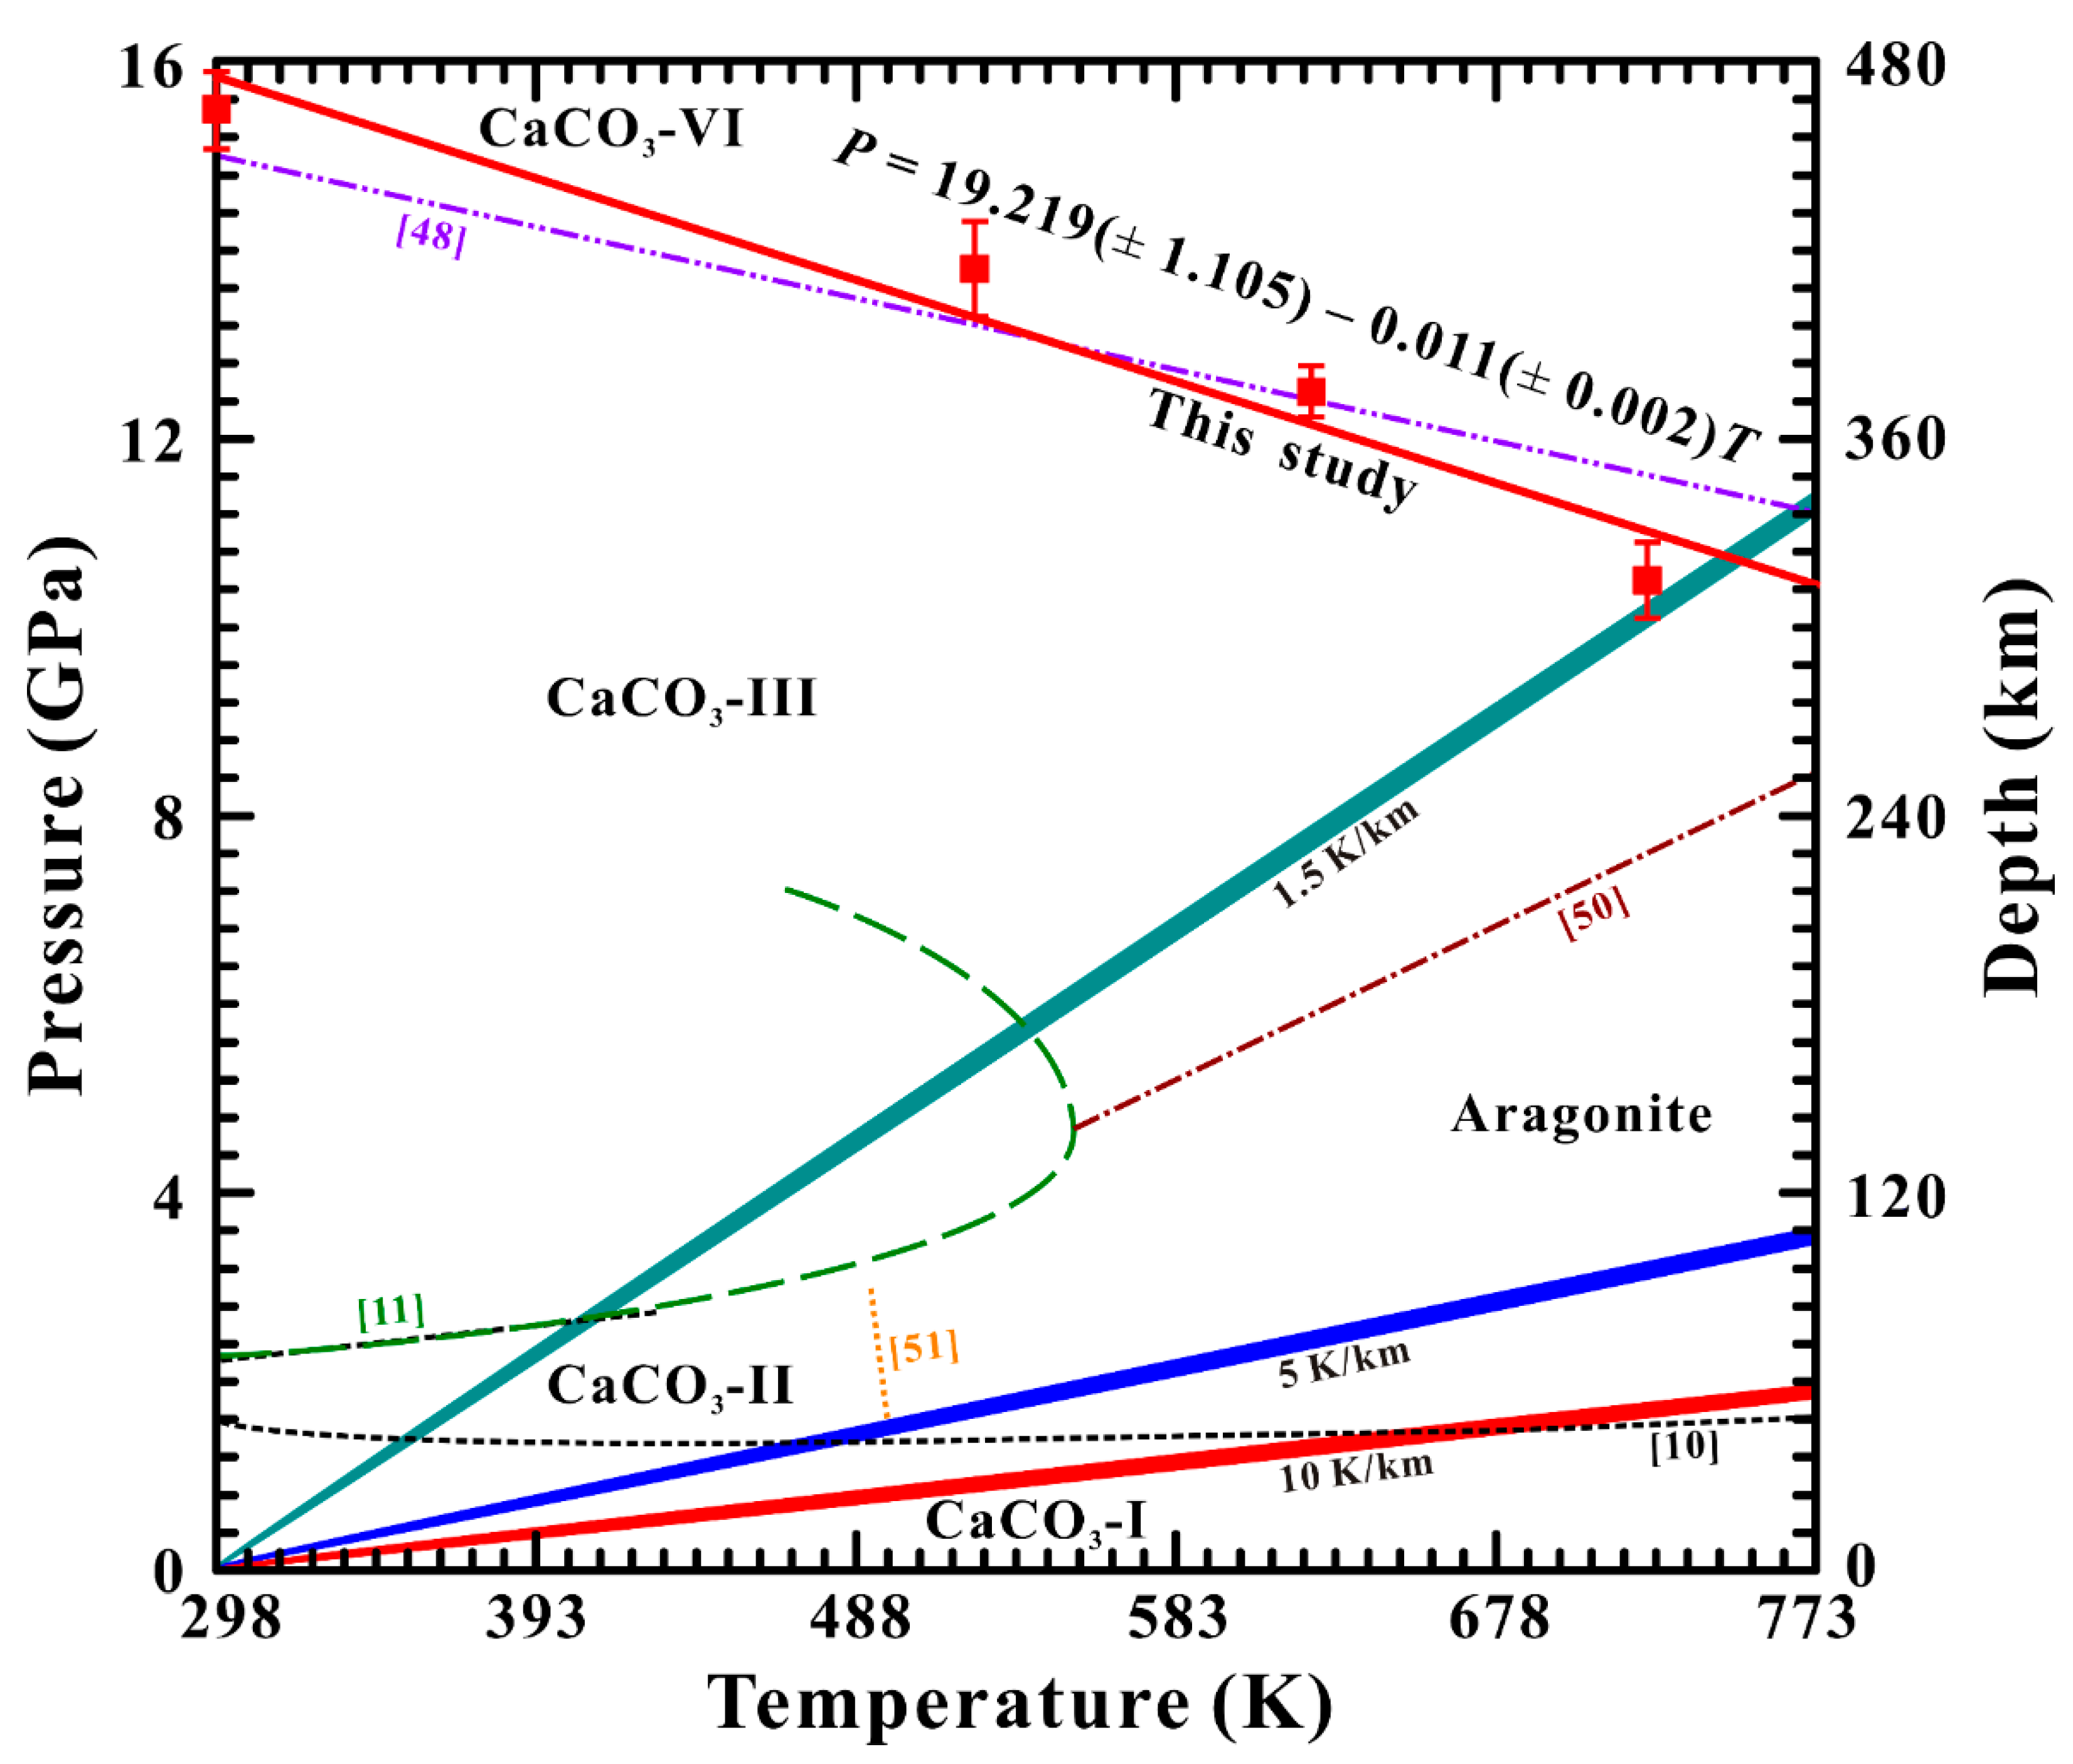
Figure 10 shows the pressure–temperature phase diagram between CaCO3-III and CaCO3-VI phases within the temperature range of 298–773 K over a wider pressure range from 1 atm to 16.0 GPa based on our acquired high-temperature and high-pressure electrical conductivity results. In here, the depth is fully considered according to the increasing pressure gradient value of 30 km/GPa in the deep Earth to be reported by Maeda et al. [6]. It is evident from the phase diagram of calcite that the phase transition pressures from CaCO3-III to CaCO3-VI phases decrease with the rise of temperature, and therefore, a negative dependence relation of phase transformation pressure on temperature was presented for the CaCO3-III to CaCO3-VI phase boundary. More importantly, the structural transition boundary between CaCO3-III and CaCO3-VI phases can be described as
where P is the experimental pressure (GPa) and T is the experimental temperature (K). A negative phase transition slope between CaCO3-III and CaCO3-VI phases (–0.011 GPa K−1) is observable, which is very close to the previously obtained value (–0.007 GPa K−1) from the Raman spectroscopy measurements by Koch-Müller et al. [48]. In this study, the magnitude of higher absolute value in the slope indicates that the obtained phase transformation dependence relation of temperature on pressure is stronger by virtue of high-temperature and high-pressure electrical conductivity measurements. In addition, the Clausius-Clapeyron relation (dT/dP = ∆V/∆S) has been widely applied to describe the correlation among entropy change (∆S), molar volume change (∆V) and phase transition slope (dT/dP) and to interpret the slope of structural transition of calcite under high-temperature and high-pressure conditions [46,49]. According to the previously available synchrotron X-ray results [44], CaCO3-VI phase is denser than CaCO3-III phase. Thus, the molar volume change (∆V) would be a negative value before and after the phase transition. Entropy (S) is an important thermodynamic parameter of describing the disorder degree of a crystal. The high-pressure CaCO3-VI phase with non-layered structure is more disordered than the CaCO3-III phase containing planar CO3 groups, leading to a positive value for the ∆S [44]. In comprehensive consideration of the negative ∆V and positive ∆S values, the phase transition boundary (dT/dP) between CaCO3-III and CaCO3-VI phases would be negative, which is consistent with our results obtained from high-temperature and high-pressure electrical conductivity measurements.
P (GPa) = 19.219 (±1.105) − 0.011 (±0.002) T (K)
4. Implications
In the present studies, we investigated the high-pressure phase stabilities of calcite, and a negative phase boundary between CaCO3-III and CaCO3-VI phases has been determined by means of Raman spectroscopy and electrical conductivity measurements under high-temperature and high-pressure conditions. Furthermore, a detailed phase diagram of calcite within the temperature range of 298–773 K and pressure of 0–16.0 GPa has been successfully established, and previously reported phase transition boundary results on calcite were also displayed in Figure 10 for comparison [9,10,48,50,51]. As seen in Figure 10, along the hot subducting slab with a geothermal gradient value of 10 K/km, calcite will transform into aragonite at the temperature of 650 K [10]. In the case of the cold subducting slab with a geothermal gradient value of 5 K/km, the CaCO3-I phase first transforms into the CaCO3-II phase at the temperature of 450 K, and further, the transformed CaCO3-II phase turns into aragonite at the temperature of 500 K [10,51]. Significantly, along the very cold subducting slab with a geothermal gradient value of 1.5 K/km such as the Tonga subduction [52], the high-pressure structural transitions of calcite are more complex than those of the hot and cold subducting slabs. More specifically, along the very cold subducting slab, the structural phase transition from CaCO3-I to CaCO3-II phases appears at lower temperature of 350 K [10]. Subsequently, as the pressure increases up to 2.6 GPa, the CaCO3-II phase is transformed into CaCO3-III phase at the temperature of 400 K [10,11]. More importantly, our well-constructed phase boundary relationship between CaCO3-III and CaCO3-VI phases reveals that the transformed CaCO3-III phase retains structural stability within the temperature range from 400 K to 750 K. Beyond the pressure of 10.8 GPa, the CaCO3-VI phase emerges at the corresponding temperature of 750 K. Obviously, on the basis of previous results, it is possible that both of the CaCO3-I and CaCO3-II phases will transform into aragonite along the geothermal gradient values of 10 K/km and 5 K/km corresponding to the hot and cold slabs of subduction zone, respectively [10,51]. In conclusion, our new established phase diagram of the high-pressure polymorphs of CaCO3-III and CaCO3-VI phases at conditions of 298–773 K and 2.3–16.0 GPa has been well presented along the geothermal gradient value of 1.5 K/km corresponding to the very cold slab of subduction zone, which was similarly observed in the high-pressure MgO–SiO2–H2O multi-phase equilibrium system along the geothermal gradient value of 1.5 K/km for the stagnant Tonga slab of a deeply subducted region up to 660 km [52].
Author Contributions
L.D. and H.H. supervised the project. L.D. and H.H. performed the conceptualization of this article and led the project. X.Z. and C.L. performed the investigation including X-ray diffraction (XRD), high-pressure Raman spectra, and high-pressure electrical conductivity measurements. L.D., H.H. and X.Z. contributed to the analysis, interpretation, and discussion of these results. X.Z., L.D. and H.H. performed the writing—original draft. L.D., H.H., X.Z. and C.L. performed the writing—review & editing. All authors have read and agreed to the published version of the manuscript.
Funding
This research was financially supported by the NSF of China (grant number 42072055 and 42274137) and the Youth Innovation Promotion Association of CAS (grant number 2019390).
Data Availability Statement
The data that support the findings of this study are available from the corresponding author upon reasonable request.
Acknowledgments
The authors acknowledge the technical support of the in situ high-pressure Raman scattering measurements provided by Heping Li at the Key Laboratory of High-temperature and High-pressure Study of the Earth’s Interior, Institute of Geochemistry, Chinese Academy of Sciences.
Conflicts of Interest
The authors declare no conflict of interest.
References
- Dasgupta, R.; Hirschmann, M.M. The deep carbon cycle and melting in the Earth’s interior. Earth Planet. Sci. Lett. 2010, 298, 1–13. [Google Scholar] [CrossRef]
- Dasgupta, R.; Hirschmann, M.M.; McDonough, W.F.; Spiegelman, M.; Withers, A.C. Trace element partitioning between garnet lherzolite and carbonatite at 6.6 and 8.6 GPa with applications to the geochemistry of the mantle and of mantle-derived melts. Chem. Geol. 2009, 262, 57–77. [Google Scholar] [CrossRef]
- Doucet, L.S.; Li, Z.X.; El Dien, H.G. Oceanic and super-deep continental diamonds share a transition zone origin and mantle plume transportation. Sci. Rep. 2021, 11, 16958. [Google Scholar] [CrossRef] [PubMed]
- Ghosh, S.; Ohtani, E.; Litasov, K.D.; Terasaki, H. Solidus of carbonated peridotite from 10 to 20 GPa and origin of magnesiocarbonatite melt in the Earth’s deep mantle. Chem. Geol. 2009, 262, 17–28. [Google Scholar] [CrossRef]
- Litasov, K.D.; Ohtani, E. Solidus and phase relations of carbonated peridotite in the system CaO-Al2O3-MgO-SiO2-Na2O-CO2 to the lower mantle depths. Phys. Earth Planet. Inter. 2009, 177, 46–58. [Google Scholar] [CrossRef]
- Maeda, F.; Ohtani, E.; Kamada, S.; Sakamaki, T.; Hirao, N.; Ohishi, Y. Diamond formation in the deep lower mantle: A high-pressure reaction of MgCO3 and SiO2. Sci. Rep. 2017, 7, 40602. [Google Scholar] [CrossRef] [PubMed] [Green Version]
- Minarik, W.G.; Watson, E.B. Interconnectivity of carbonate melt at low melt fraction. Earth Planet. Sci. Lett. 1995, 133, 423–437. [Google Scholar] [CrossRef]
- Tao, R.B.; Fei, Y.W. Recycled calcium carbonate is an efficient oxidation agent under deep upper mantle conditions. Commun. Earth Environ. 2021, 2, 45. [Google Scholar] [CrossRef]
- Liu, L.G.; Mernagh, T.P. Phase transitions and Raman spectra of calcite at high pressures and room temperature. Am. Mineral. 1990, 75, 801–806. [Google Scholar]
- Yuan, X.; Mayanovic, R.A.; Zhang, G. Phase transitions in CaCO3 under hydrous and anhydrous conditions: Implications for the structural transformations of CaCO3 during subduction processes. Am. Mineral. 2021, 106, 1780–1788. [Google Scholar] [CrossRef]
- Suito, K.; Namba, J.; Horikawa, T.; Taniguchi, Y.; Sakural, N.; Kobayashi, M.; Onodera, A.; Shimomura, O.; Kikegawa, T. Phase relations of CaCO3 at high pressure and high temperature. Am. Mineral. 2001, 86, 997–1002. [Google Scholar] [CrossRef]
- Liu, J.; Caracas, R.; Fan, D.W.; Bobocioiu, E.; Zhang, D.Z.; Mao, W.L. High-pressure compressibility and vibrational properties of (Ca,Mn)CO3. Am. Mineral. 2016, 101, 2723–2730. [Google Scholar] [CrossRef]
- Bagdassarov, N.S.; Slutskii, A.B. Phase transformations in calcite from electrical impedance measurements. Phase Transit. 2003, 76, 1015–1028. [Google Scholar] [CrossRef] [Green Version]
- Hu, H.Y.; Jing, C.X.; Dai, L.D.; Yin, C.Y.; Chen, D.M. Electrical conductivity of siderite and its implication for high conductivity anomaly in the slab-mantle wedge interface. Front. Earth Sci. 2022, 10, 985740. [Google Scholar] [CrossRef]
- Mibe, K.; Ono, S. Electrical conductivity of MgCO3 at high pressures and high temperatures. Phys. B Condens. Matter 2011, 406, 2018–2020. [Google Scholar] [CrossRef]
- Ono, S.; Mibe, K. Electrical conductivity of aragonite in the subducted slab. Eur. J. Mineral. 2013, 25, 11–15. [Google Scholar] [CrossRef]
- Ono, S.; Mibe, K. Influence of pressure and temperature on the electrical conductivity of dolomite. Phys. Chem. Minerals. 2015, 42, 773–779. [Google Scholar] [CrossRef] [Green Version]
- Larson, A.C.; Von Dreele, R.B. General structure analysis system (GSAS). Los Alamos Natl. Lab. Rep. 2004, 748, 86–748. [Google Scholar]
- Ishizawa, N.; Setoguchi, H.; Yanagisawa, K. Structural evolution of calcite at high temperatures: Phase V unveiled. Sci. Rep. 2013, 3, 2832. [Google Scholar] [CrossRef] [PubMed] [Green Version]
- Maslen, M.; Streltsov, V.A.; Streltsova, N.R. X-ray study of the electron density in calcite, CaCO3. Acta Cryst. 1993, B49, 636–641. [Google Scholar] [CrossRef]
- Mao, H.K.; Xu, J.; Bell, P.M. Calibration of the ruby pressure gauge to 800 kbar under quasi-hydrostatic conditions. J. Geophys. Res. Solid Earth 1986, 91, 4673–4676. [Google Scholar] [CrossRef]
- Dai, L.D.; Wu, L.; Li, H.P.; Hu, H.Y.; Zhuang, Y.K.; Liu, K.X. Evidence of the pressure-induced conductivity switching of yttrium-doped SrTiO3. J. Phys. Condens. Matter 2016, 28, 475501. [Google Scholar] [CrossRef]
- Dai, L.D.; Wu, L.; Li, H.P.; Hu, H.Y.; Zhuang, Y.K.; Liu, K.X. Pressure-induced phase-transition and improvement of the microdielectric properties in yttrium-doped SrZrO3. Europhys. Lett. 2016, 114, 56003. [Google Scholar] [CrossRef]
- Hong, M.L.; Dai, L.D.; Hu, H.Y.; Zhang, X.Y.; Li, C. High-temperature and high-pressure phase transition of natural barite investigated by Raman spectroscopy and electrical conductivity. Front. Earth Sci. 2022, 10, 864183. [Google Scholar] [CrossRef]
- Hong, M.L.; Dai, L.D.; Hu, H.Y.; Zhang, X.Y.; Li, C.; He, Y. Pressure-induced structural phase transition and metallization of CrCl3 under different hydrostatic environments up to 50.0 GPa. Inorg. Chem. 2022, 61, 4852–4864. [Google Scholar] [CrossRef]
- Hong, M.L.; Dai, L.D.; Hu, H.Y.; Zhang, X.Y.; Li, C.; He, Y. High-pressure structural phase transitions and metallization in layered HfS2 under different hydrostatic environments up to 42.1 GPa. J. Mater. Chem. C 2022, 10, 10541–10550. [Google Scholar] [CrossRef]
- Hu, H.Y.; Dai, L.D.; Sun, W.Q.; Zhuang, Y.K.; Liu, K.X.; Yang, L.F.; Pu, C.; Hong, M.L.; Wang, M.Q.; Hu, Z.M.; et al. Some remarks on the electrical conductivity of hydrous silicate minerals in the earth crust, upper mantle and subduction zone at high temperature and high pressures. Minerals 2022, 12, 161. [Google Scholar] [CrossRef]
- Liu, K.X.; Dai, L.D.; Li, H.P.; Hu, H.Y.; Wu, L.; Zhuang, Y.K.; Pu, C.; Yang, L.F. Migration of impurity level reflected in the electrical conductivity variation for natural pyrite at high temperature and high pressure. Phys. Chem. Miner. 2018, 45, 85–92. [Google Scholar] [CrossRef]
- Liu, K.X.; Dai, L.D.; Li, H.P.; Hu, H.Y.; Yang, L.F.; Pu, C.; Hong, M.L.; Liu, P.F. Phase transition and metallization of orpiment by Raman spectroscopy, electrical conductivity and theoretical calculation under high pressure. Materials 2019, 12, 784. [Google Scholar] [CrossRef] [Green Version]
- Yang, L.F.; Dai, L.D.; Li, H.P.; Hu, H.Y.; Zhuang, Y.K.; Liu, K.X.; Pu, C.; Hong, M.L. Pressure-induced structural phase transition and dehydration for gypsum investigated by Raman spectroscopy and electrical conductivity. Chem. Phys. Lett. 2018, 706, 151–157. [Google Scholar] [CrossRef]
- Yang, L.F.; Dai, L.D.; Li, H.P.; Hu, H.Y.; Hong, M.L.; Zhang, X.Y.; Liu, P.F. High-pressure investigations on the isostructural phase transition and metallization in realgar with diamond anvil cells. Geosci. Front. 2021, 12, 1031–1037. [Google Scholar] [CrossRef]
- Zhang, X.Y.; Dai, L.D.; Hu, H.Y.; Hong, M.L. Pressure-induced metallic phase transition in gallium arsenide up to 24.3 GPa under hydrostatic conditions. Mod. Phys. Lett. B 2021, 35, 2150460. [Google Scholar] [CrossRef]
- Zhang, X.Y.; Dai, L.D.; Hu, H.Y.; Hong, M.L.; Li, C. Pressure-induced coupled structural-electronic transition in SnS2 under different hydrostatic environments up to 39.7 GPa. RSC Adv. 2022, 12, 2454–2461. [Google Scholar] [CrossRef]
- Zhuang, Y.K.; Dai, L.D.; Wu, L.; Li, H.P.; Hu, H.Y.; Liu, K.X.; Yang, L.F.; Pu, C. Pressure-induced permanent metallization with reversible structural transition in molybdenum disulfide. Appl. Phys. Lett. 2017, 110, 122103. [Google Scholar] [CrossRef]
- Dai, L.D.; Zhuang, Y.K.; Li, H.P.; Wu, L.; Hu, H.Y.; Liu, K.X.; Yang, L.F.; Pu, C. Pressure-induced irreversible amorphization and metallization with a structural phase transition in arsenic telluride. J. Mater. Chem. C 2017, 5, 12157–12162. [Google Scholar] [CrossRef]
- Dai, L.D.; Liu, K.X.; Li, H.P.; Wu, L.; Hu, H.Y.; Zhuang, Y.K.; Yang, L.F.; Pu, C.; Liu, P.F. Pressure-induced irreversible metallization accompanying the phase transitions in Sb2S3. Phys. Rev. B 2018, 97, 024103. [Google Scholar] [CrossRef]
- Dai, L.D.; Pu, C.; Li, H.P.; Hu, H.Y.; Liu, K.X.; Yang, L.F.; Hong, M.L. Characterization of metallization and amorphization for GaP under different hydrostatic environments in diamond anvil cell up to 40.0 GPa. Rev. Sci. Instrum. 2019, 90, 066103. [Google Scholar] [CrossRef] [PubMed]
- Sivakumar, A.; Shailaja, P.; Nandhini, M.; Sahaya Jude Dhas, S.; Kumar, R.S.; Almansour, A.I.; Arumugam, N.; Chakraborty, S.; Martin Britto Dhas, S.A. Ternary switchable phase transition of CaCO3 by shock waves. Ceram. Int. 2022, 48, 8457–8465. [Google Scholar] [CrossRef]
- Catalli, K.; Williams, Q. A high-pressure phase transition of calcite-III. Am. Mineral. 2005, 90, 1679–1682. [Google Scholar] [CrossRef]
- Hu, H.Y.; Dai, L.D.; Li, H.P.; Hui, K.S.; Sun, W.Q. Influence of dehydration on the electrical conductivity of epidote and implications for high-conductivity anomalies in subduction zones. J. Geophys. Res. Solid Earth 2017, 122, 2751–2762. [Google Scholar] [CrossRef]
- Hu, H.Y.; Dai, L.D.; Li, H.P.; Sun, W.Q.; Li, B.S. Effect of dehydrogenation on the electrical conductivity of Fe-bearing amphibole: Implications for high conductivity anomalies in subduction zones and continental crust. Earth Planet. Sci. Lett. 2018, 498, 27–37. [Google Scholar] [CrossRef]
- Hu, H.Y.; Dai, L.D.; Sun, W.Q.; Wang, M.Q.; Jing, C.X. Constraints on fluids in the continental crust from laboratory-based electrical conductivity measurements of plagioclase. Gondwana Res. 2022, 107, 1–12. [Google Scholar] [CrossRef]
- Hong, M.L.; Dai, L.D.; Hu, H.Y.; Zhang, X.Y. Pressure-induced structural phase transitions in natural kaolinite investigated by Raman spectroscopy and electrical conductivity. Am. Mineral. 2022, 107, 385–394. [Google Scholar] [CrossRef]
- Merlini, M.; Hanfland, M.; Crichton, W.A. CaCO3-III and CaCO3-VI, high-pressure polymorphs of calcite: Possible host structures for carbon in the Earth’s mantle. Earth Planet. Sci. Lett. 2012, 333, 265–271. [Google Scholar] [CrossRef]
- Zhao, C.S.; Li, H.P.; Chen, P.F.; Jiang, J.J. Sound velocities across calcite phase transition by Brillouin scattering spectroscopy. Am. Mineral. 2019, 104, 418–424. [Google Scholar] [CrossRef]
- Zhao, X.; Zheng, Z.; Chen, J.Z.; Gao, Y.; Sun, J.H.; Hou, X.; Xiong, M.J.; Mei, S.H. High P-T calcite-aragonite phase transitions under hydrous and anhydrous conditions. Front. Earth Sci. 2022, 10, 907967. [Google Scholar] [CrossRef]
- Trnovcová, V.; Furár, I.; Hanic, F. Influence of technological texture on electrical properties of industrial ceramics. J. Phys. Chem. Solids 2007, 68, 1135–1139. [Google Scholar] [CrossRef]
- Koch-Müller, M.; Jahn, S.; Birkholz, N.; Ritter, E.; Schade, U. Phase transitions in the system CaCO3 at high P and T determined by in situ vibrational spectroscopy in diamond anvil cells and first-principles simulations. Phys. Chem. Miner. 2016, 43, 545–561. [Google Scholar] [CrossRef] [Green Version]
- Hou, M.Q.; Zhang, Q.; Tao, R.B.; Liu, H.; Kono, Y.; Mao, H.K.; Yang, W.G.; Chen, B.; Fei, Y.W. Temperature-induced amorphization in CaCO3 at high pressure and implications for recycled CaCO3 in subduction zones. Nat. Commun. 2019, 10, 1963. [Google Scholar] [CrossRef] [Green Version]
- Bayarjargal, L.; Fruhner, C.J.; Schrodt, N.; Winkler, B. CaCO3 phase diagram studied with Raman spectroscopy at pressures up to 50 GPa and high temperatures and DFT modeling. Phys. Earth Planet. Inter. 2018, 281, 31–45. [Google Scholar] [CrossRef]
- Hess, N.J.; Ghose, S.; Exarhos, G.J. Raman spectroscopy at simultaneous high pressure and temperature: Phase relations of CaCO3 and the lattice dynamics of the calcite CaCO3(II) phase transition. In Recent Trends in High Pressure Research; Proceedings of the X IIIth AIRAPT International Conference on High Pressure Science and Technology, Bangalore, India, 7–11 October 1991; Singh, A.K., Ed.; US Department of Energy: Oak Ridge, TN, USA, 1991; pp. 236–241. [Google Scholar]
- Komabayashi, T.; Omori, S.; Maruyama, S. Petrogenetic grid in the system MgO-SiO2-H2O up to 30 GPa, 1600 °C: Applications to hydrous peridotite subducting into the Earth’s deep interior. J. Geophys. Res. Solid Earth 2004, 109, B03206. [Google Scholar] [CrossRef] [Green Version]
Figure 1.
Powder X-ray diffraction (XRD) pattern and structural refinement for calcite at ambient conditions. The red solid line and the black crosses represent the calculated and observed results, respectively. The vertical blue bars stand for the standard peak positions of calcite. The green solid line denotes the deviation curve of measurement. Inset: the optical image of calcite.
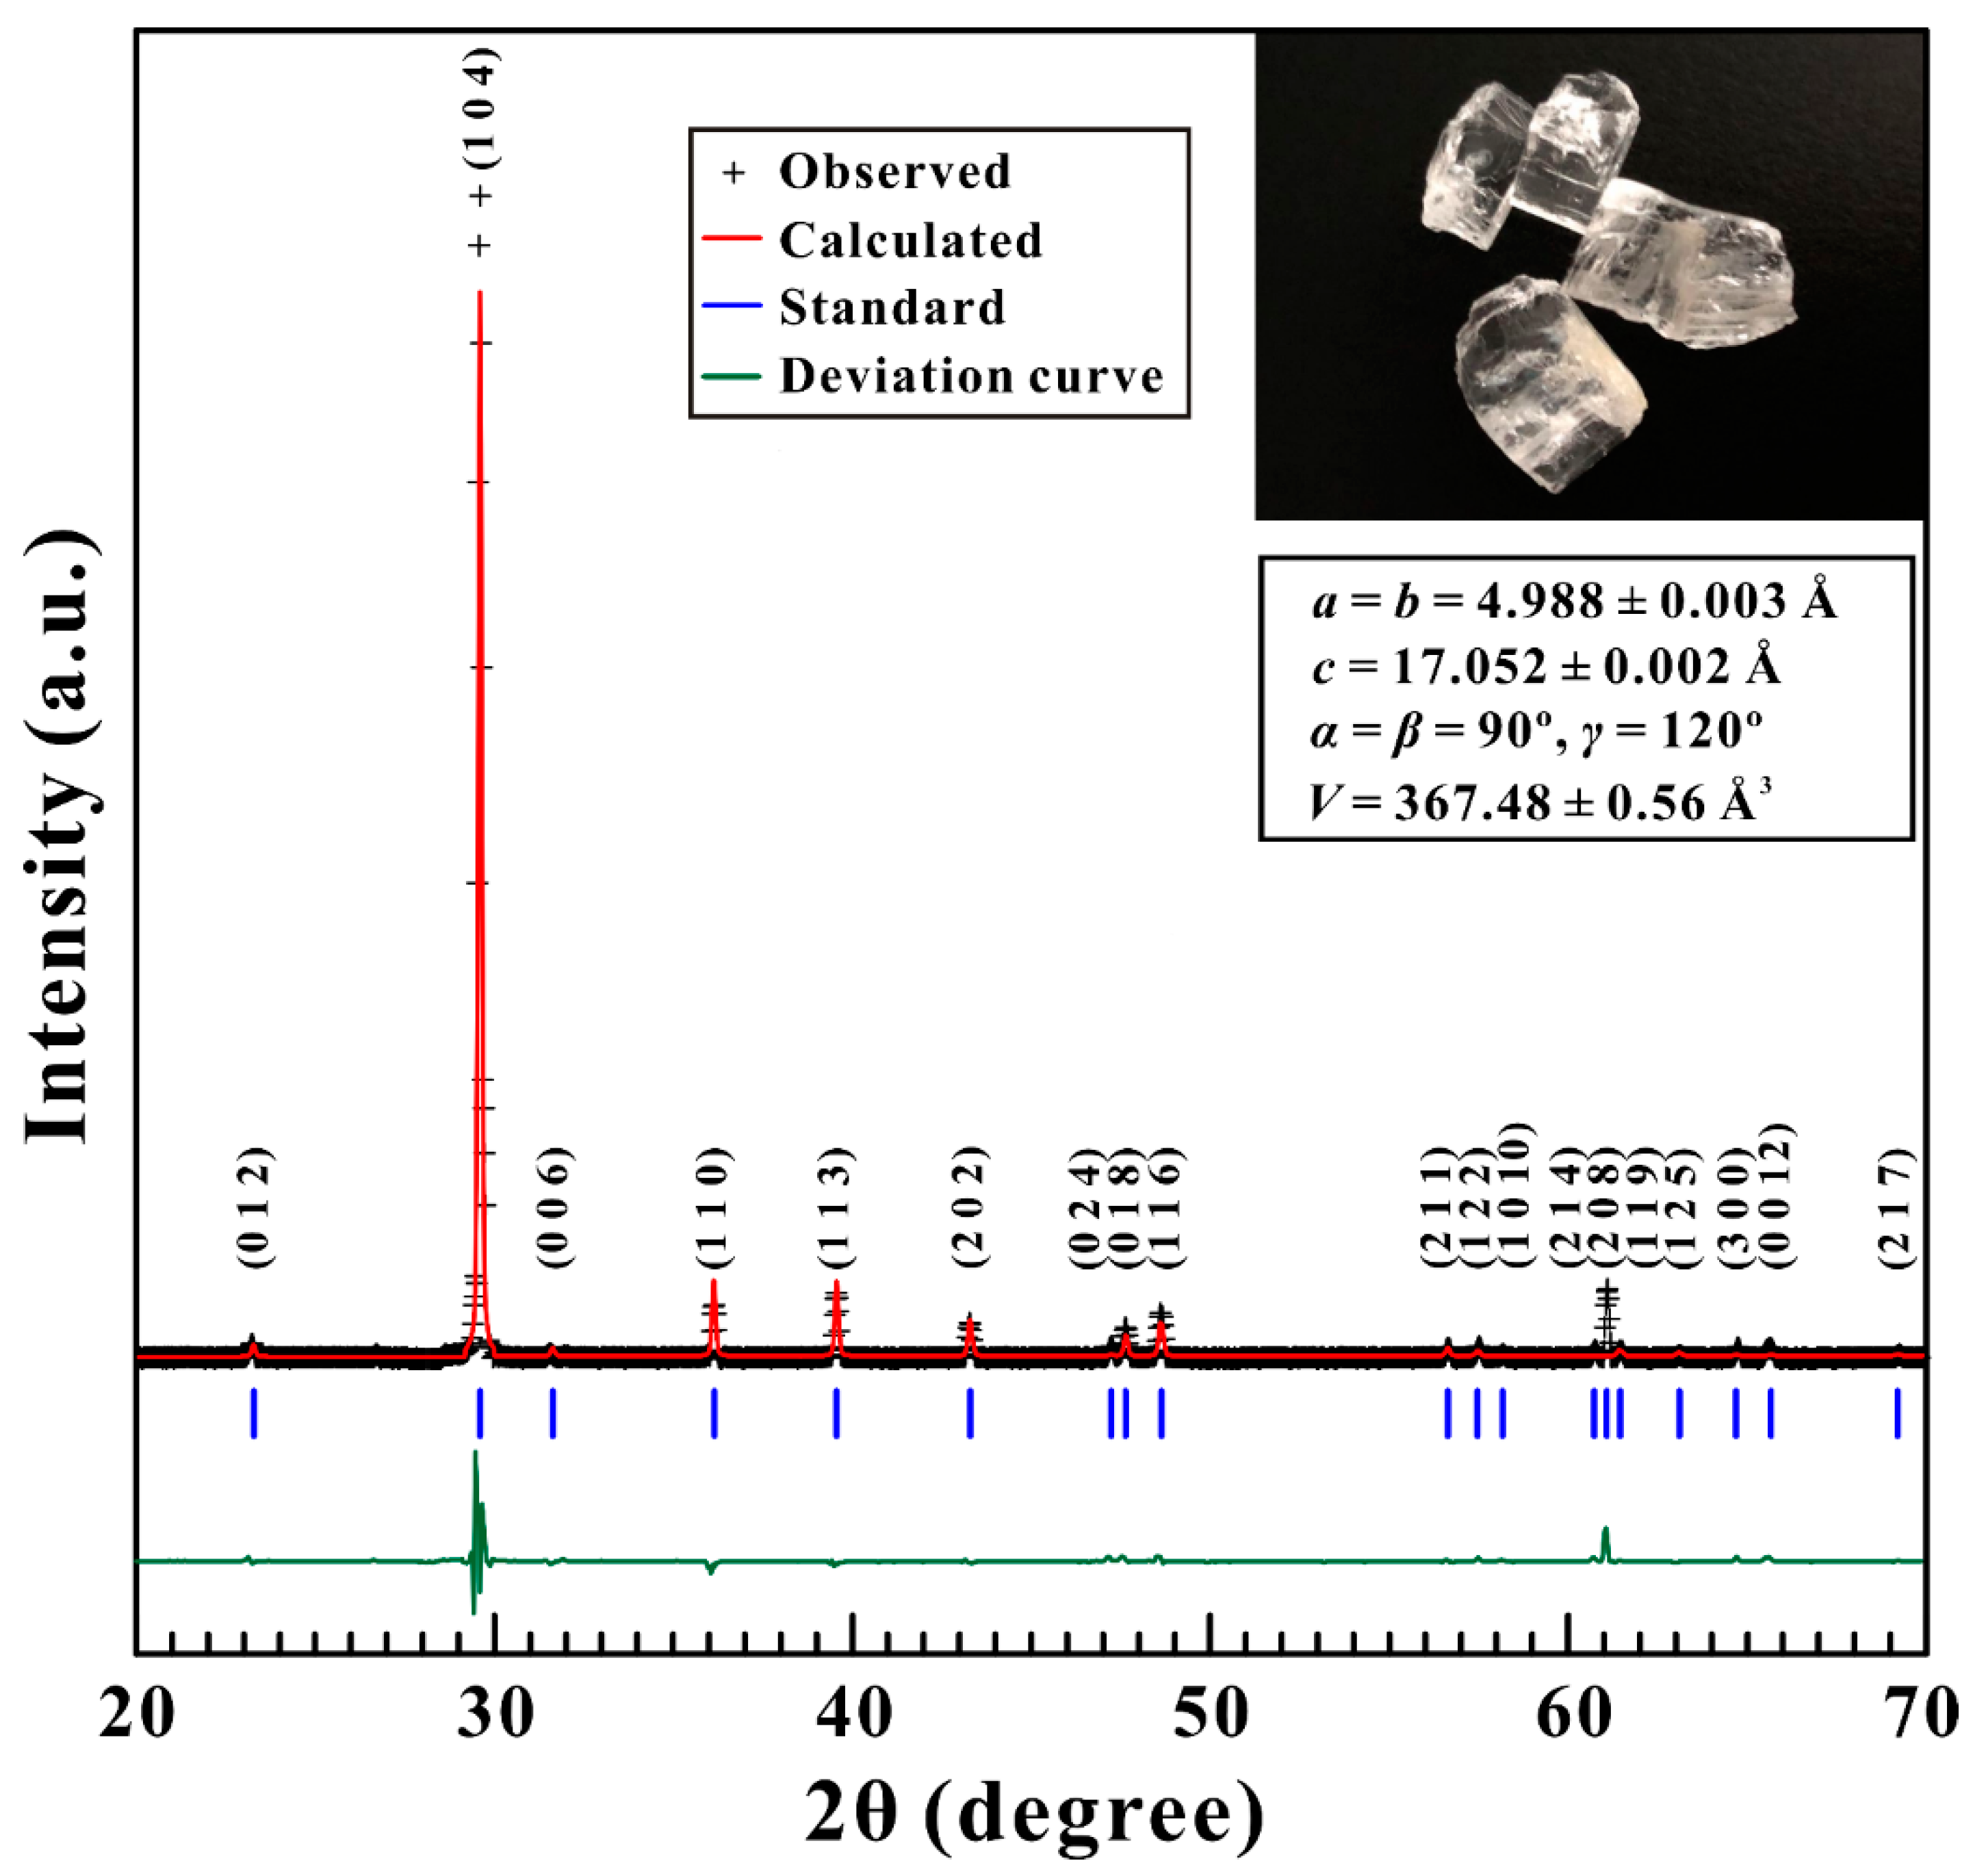
Figure 2.
Raman scattering spectra of calcite at different pressure points up to 19.4 GPa upon compression at the atmospheric temperature. (a) 0.5–5.7 GPa; (b) 8.5–19.4 GPa. The red, blue, and green asterisks denote the positions of the Raman peaks of high-pressure CaCO3 polymorphs. The colored dashed lines are used to guide the eyes.
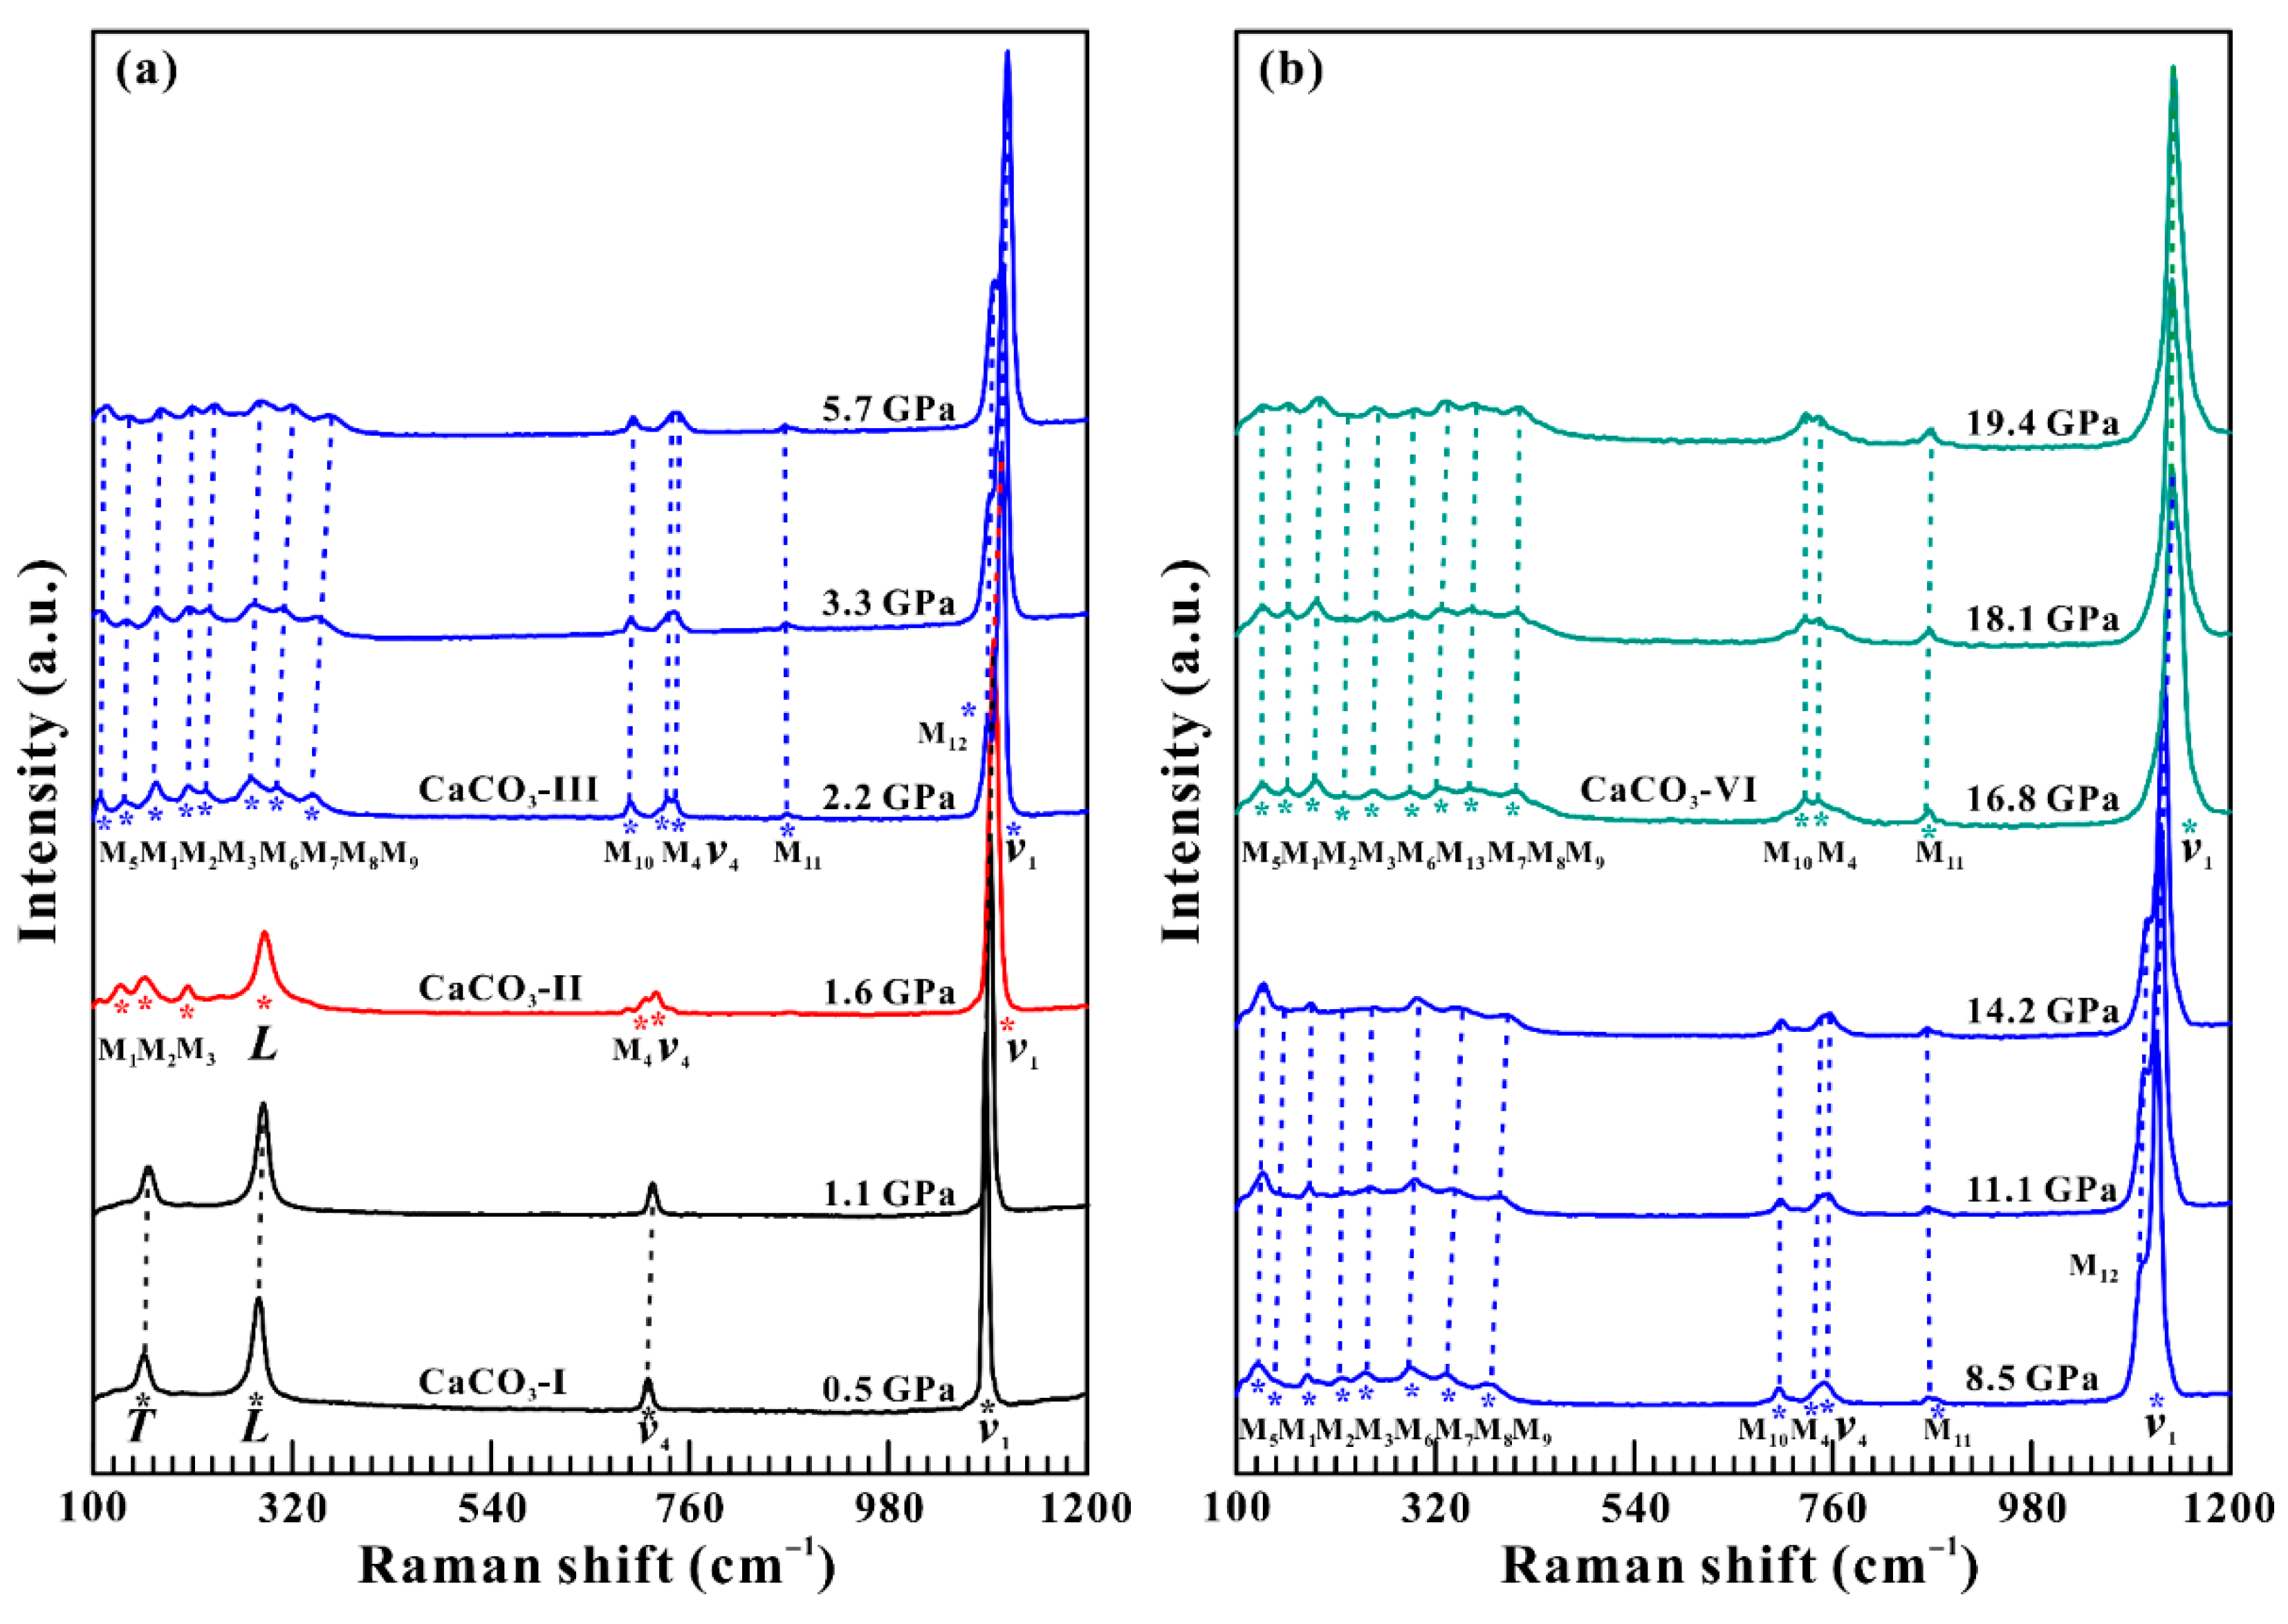
Figure 3.
Pressure dependence of the Raman shifts of calcite upon compression within the wavenumber range of 100–1200 cm−1 at the atmospheric temperature. The colored solid lines and the vertical black dashed lines are used to guide the eyes.
Figure 3.
Pressure dependence of the Raman shifts of calcite upon compression within the wavenumber range of 100–1200 cm−1 at the atmospheric temperature. The colored solid lines and the vertical black dashed lines are used to guide the eyes.

Figure 4.
Raman scattering spectra of calcite upon decompression at the atmospheric temperature. (a) 18.3–6.9 GPa; (b) 5.4 GPa−1 atm. The colored dashed lines are used to guide the eyes.
Figure 4.
Raman scattering spectra of calcite upon decompression at the atmospheric temperature. (a) 18.3–6.9 GPa; (b) 5.4 GPa−1 atm. The colored dashed lines are used to guide the eyes.
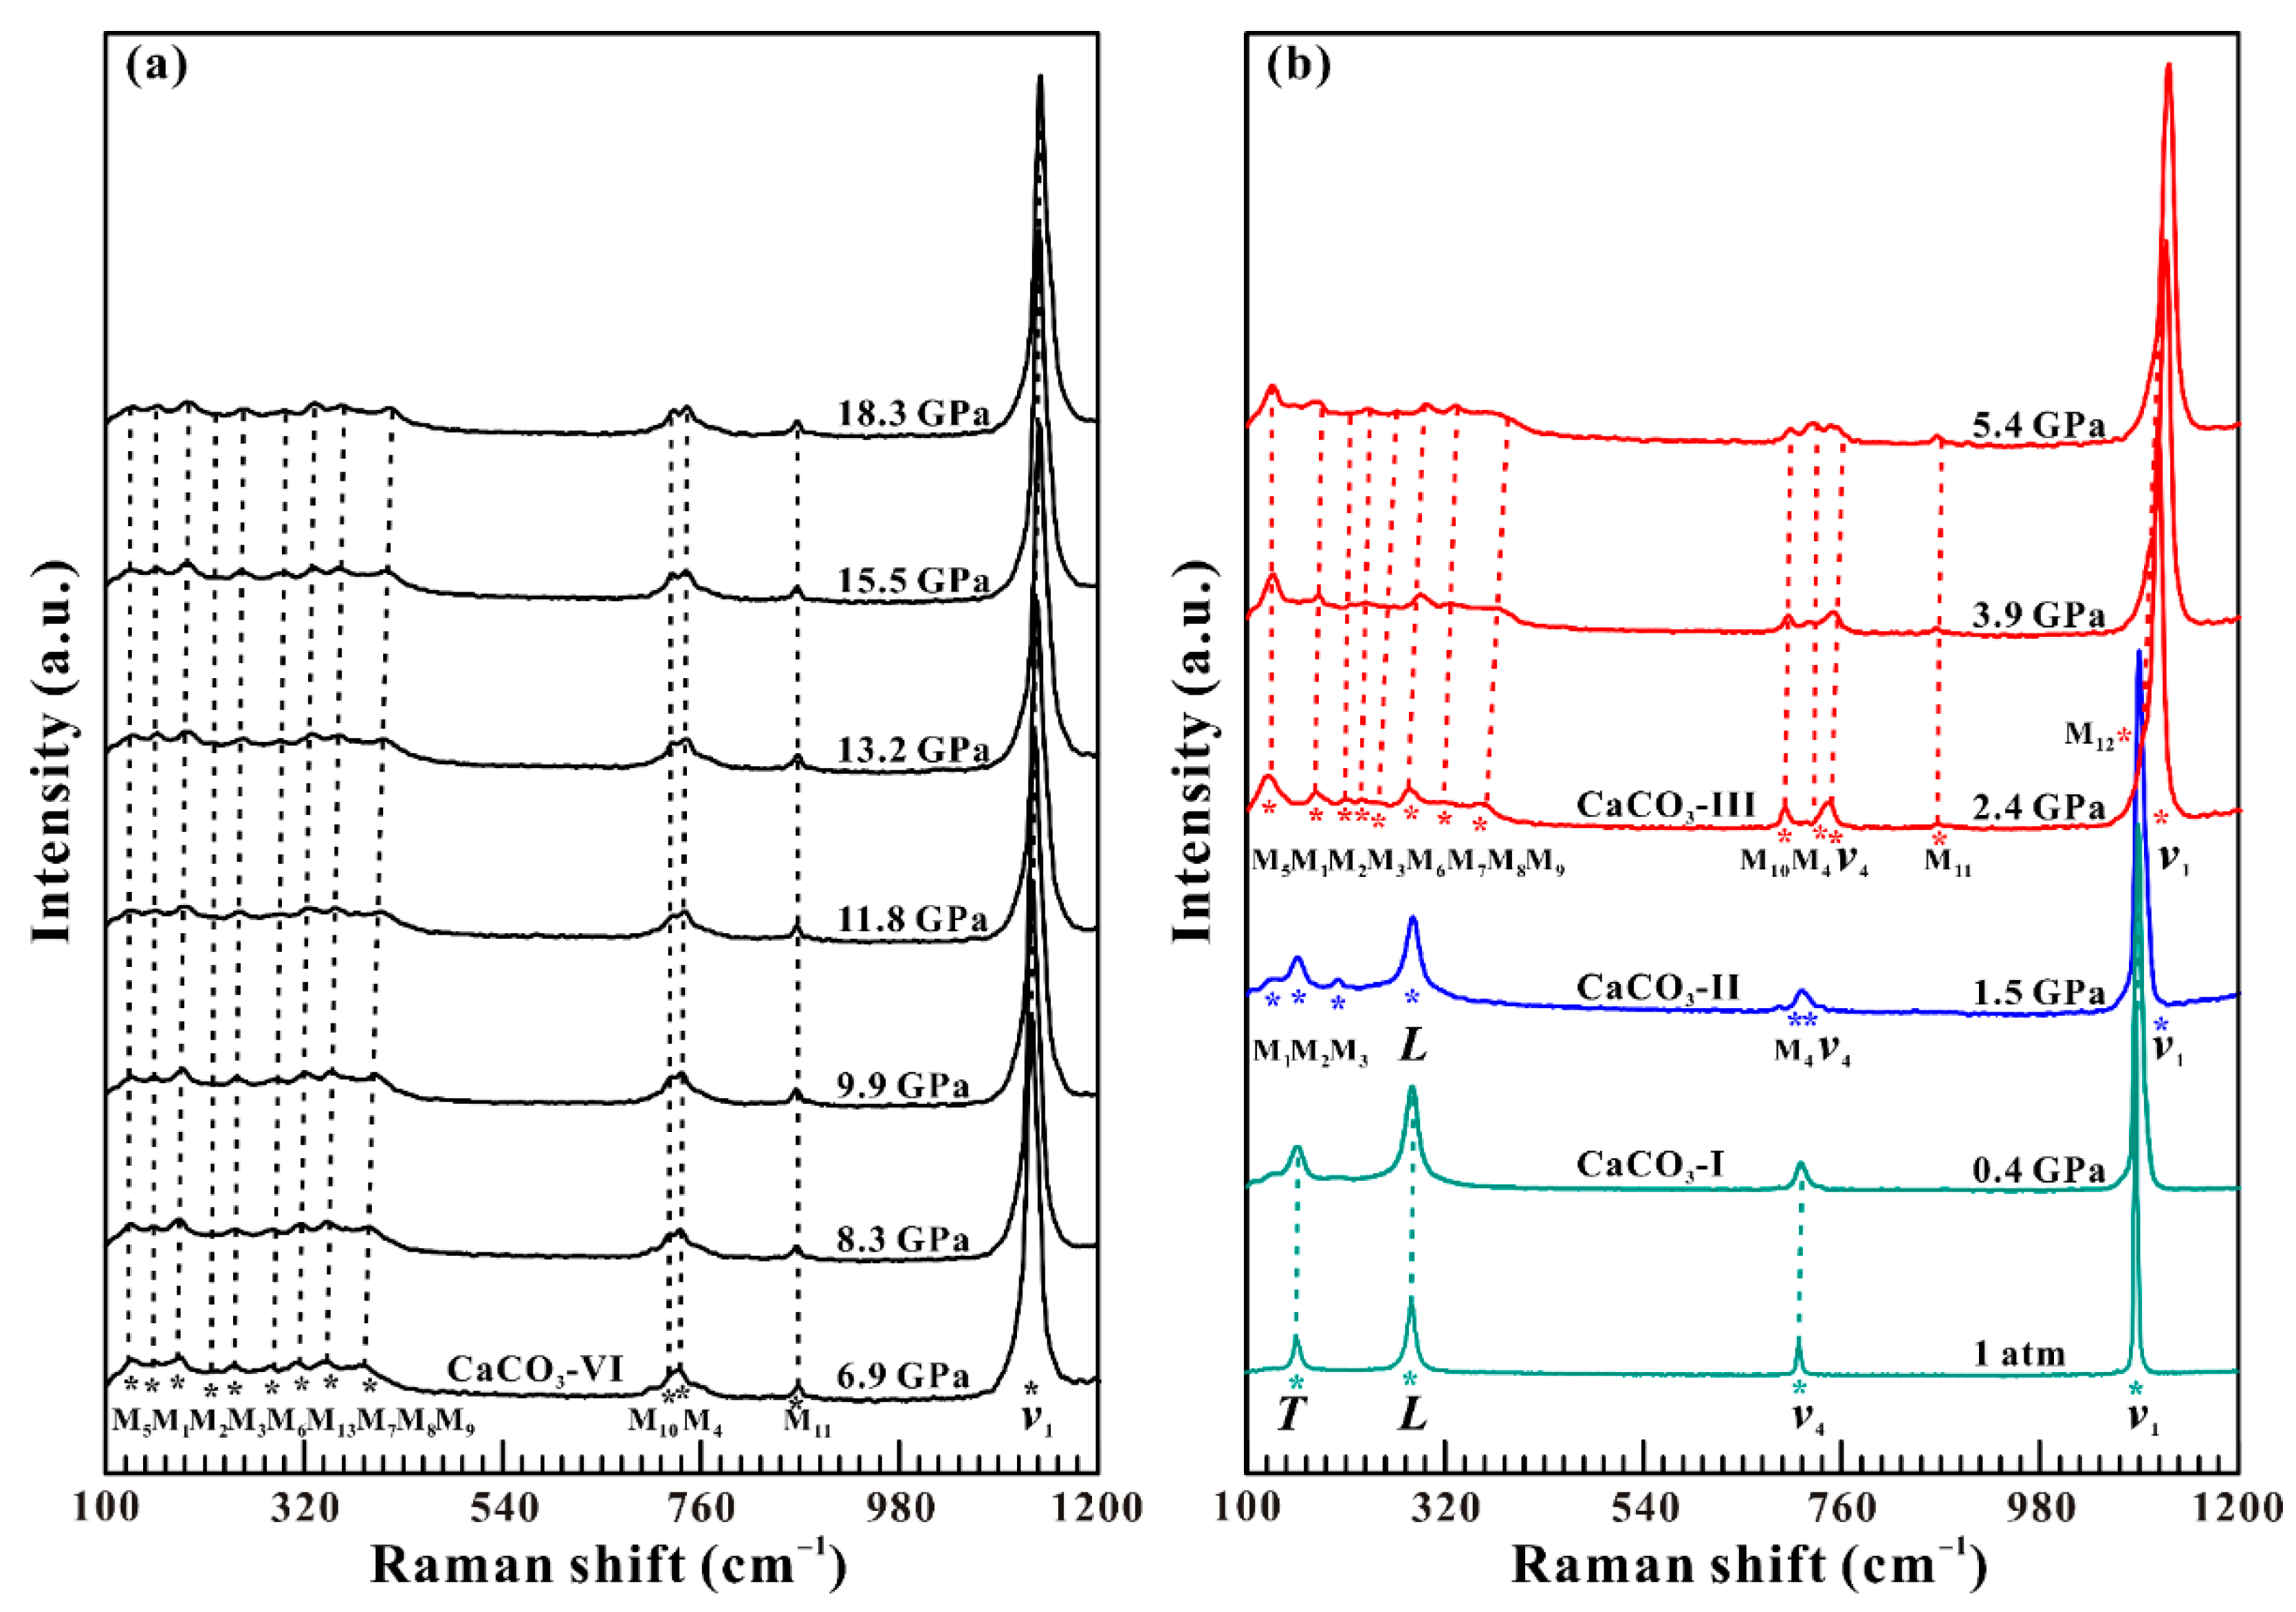
Figure 5.
Pressure dependence of the Raman shifts of calcite upon decompression within the wavenumber range of 100–1200 cm−1 at the atmospheric temperature. The colored solid lines and the vertical black dashed lines are used to guide the eyes.
Figure 5.
Pressure dependence of the Raman shifts of calcite upon decompression within the wavenumber range of 100–1200 cm−1 at the atmospheric temperature. The colored solid lines and the vertical black dashed lines are used to guide the eyes.
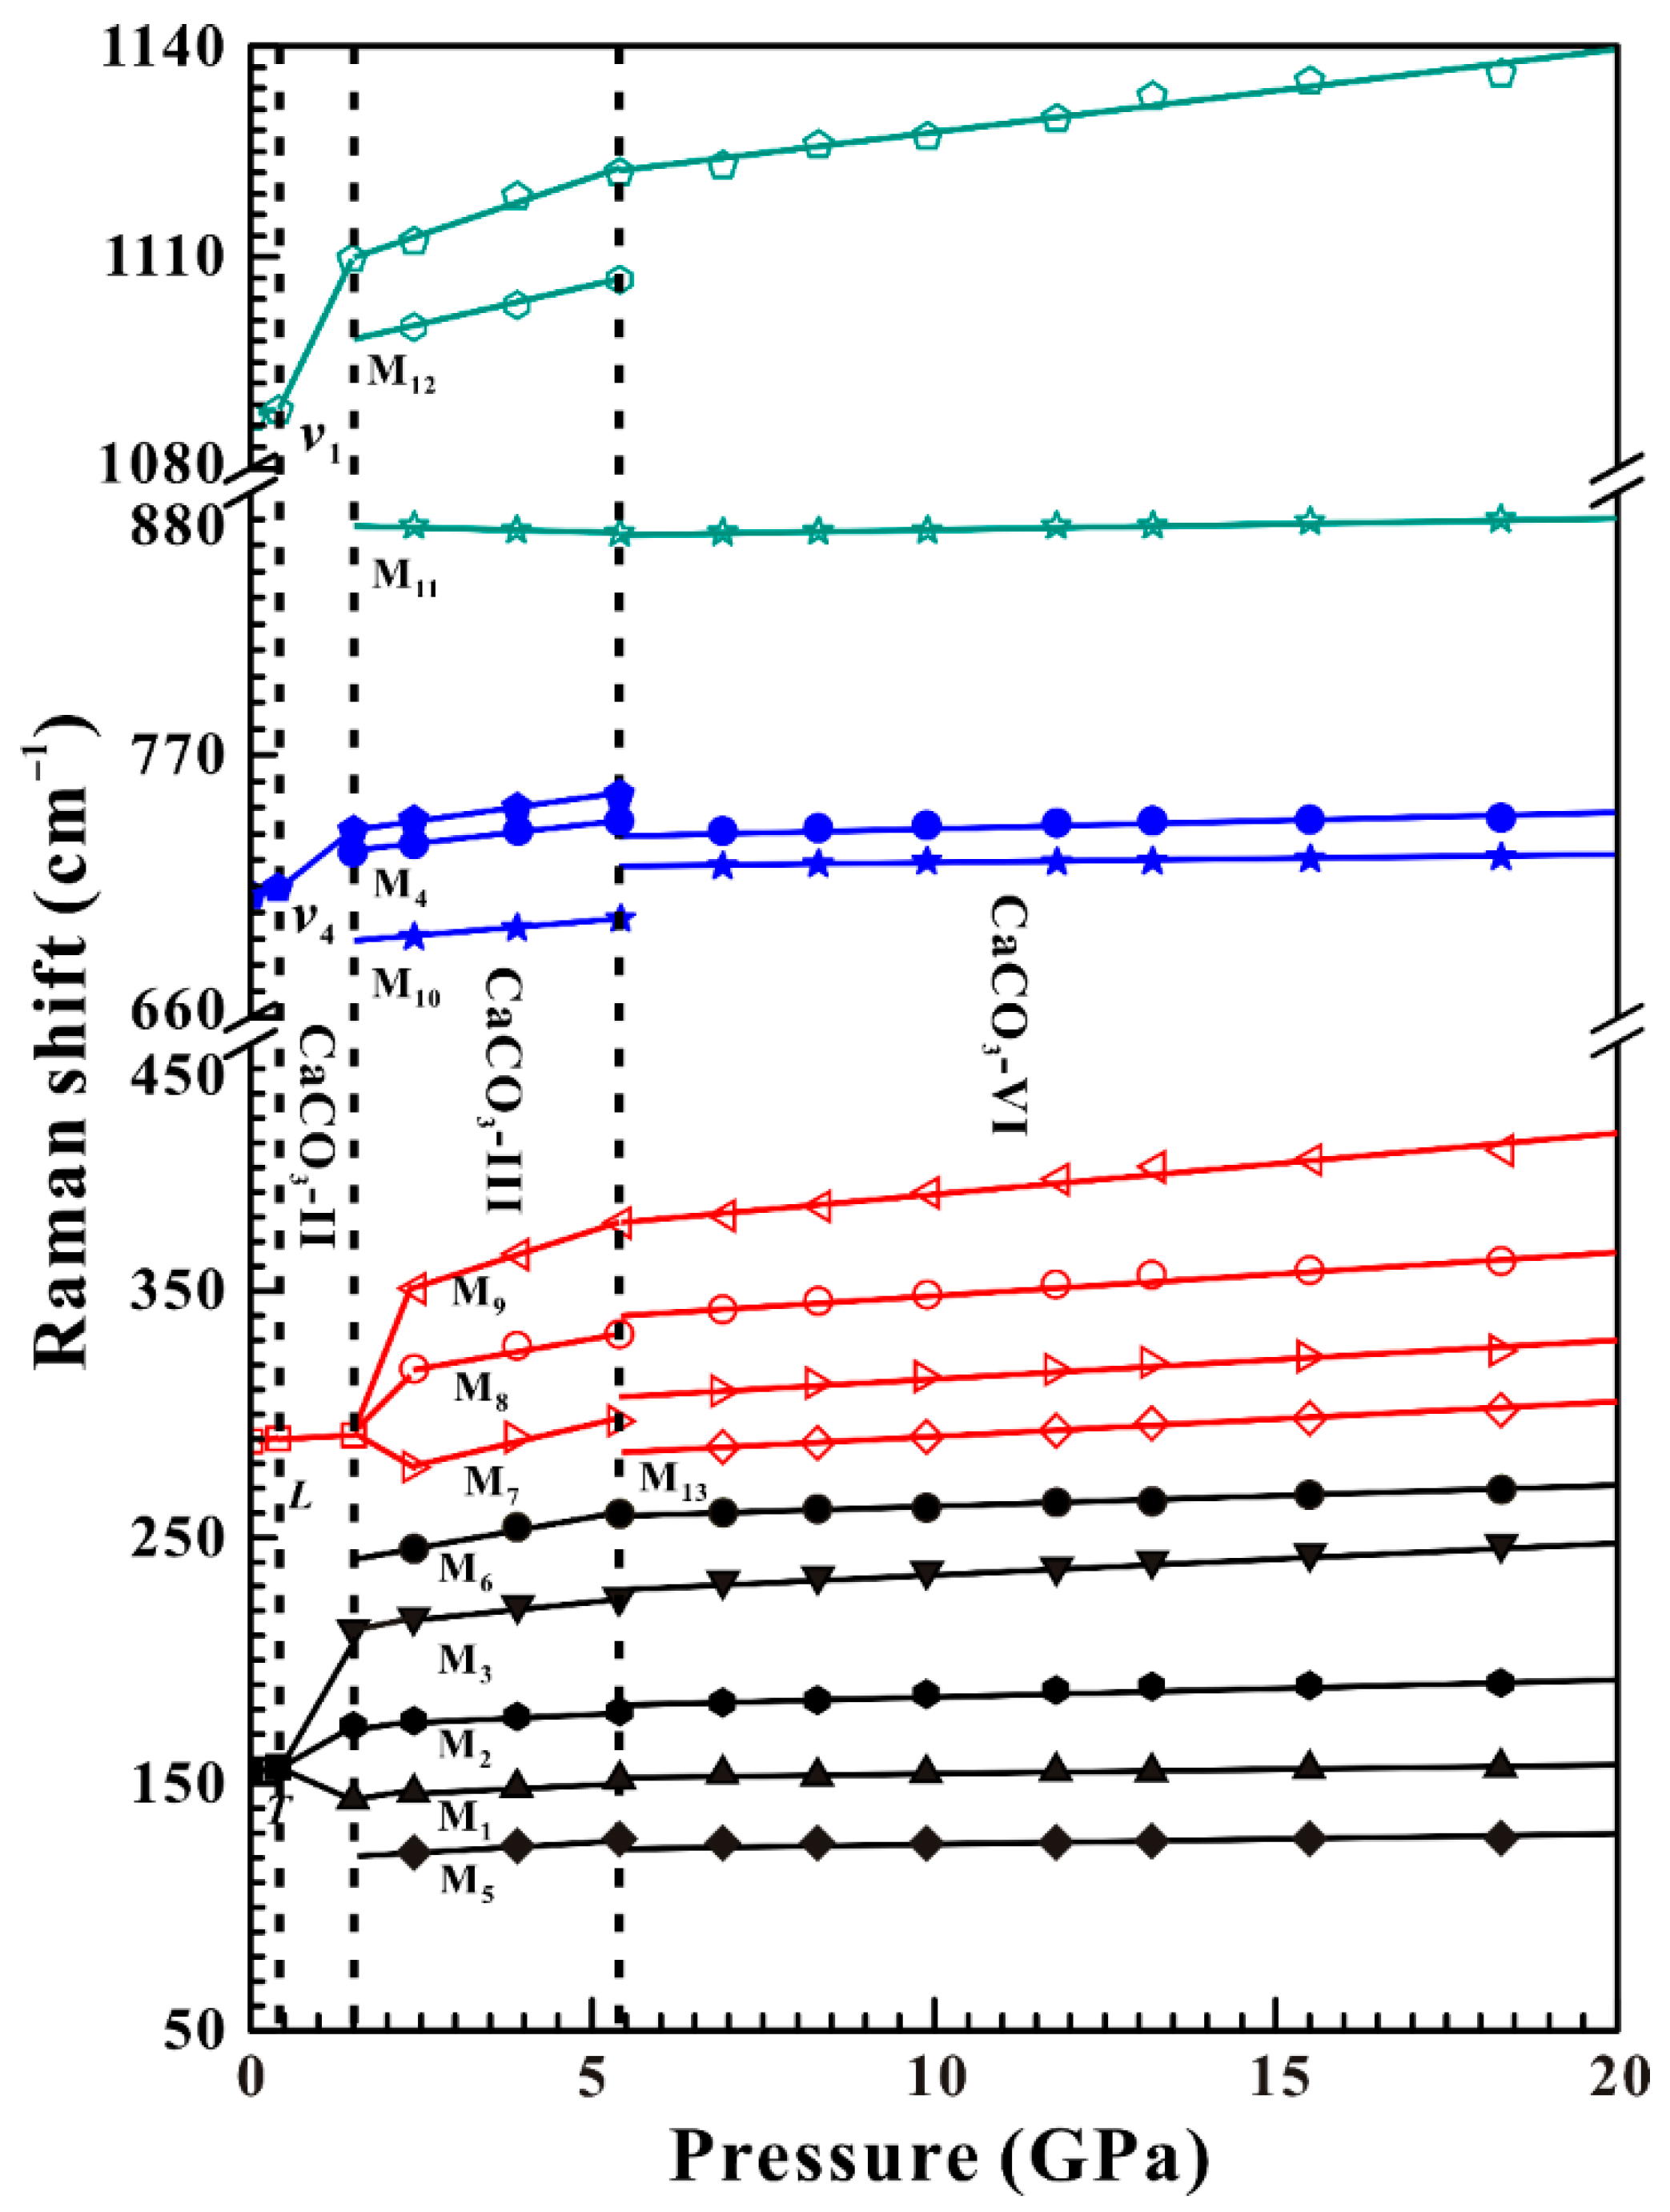
Figure 6.
Complex impedance spectra of calcite at the atmospheric temperature within the pressure range of 0.5–19.7 GPa. (a) 0.5–4.4 GPa; (b) 6.7–13.6 GPa; (c) 15.5–19.7 GPa. (d) The pressure dependence of the logarithmic electrical conductivity of calcite in both processes of compression and decompression. Here, the symbols of Z’ and Z” represent the real and imaginary parts of complex impedance spectra. The colored curves are the results of the fitting to the impedance spectra. The colored dashed lines and solid lines are employed to guide the eyes.
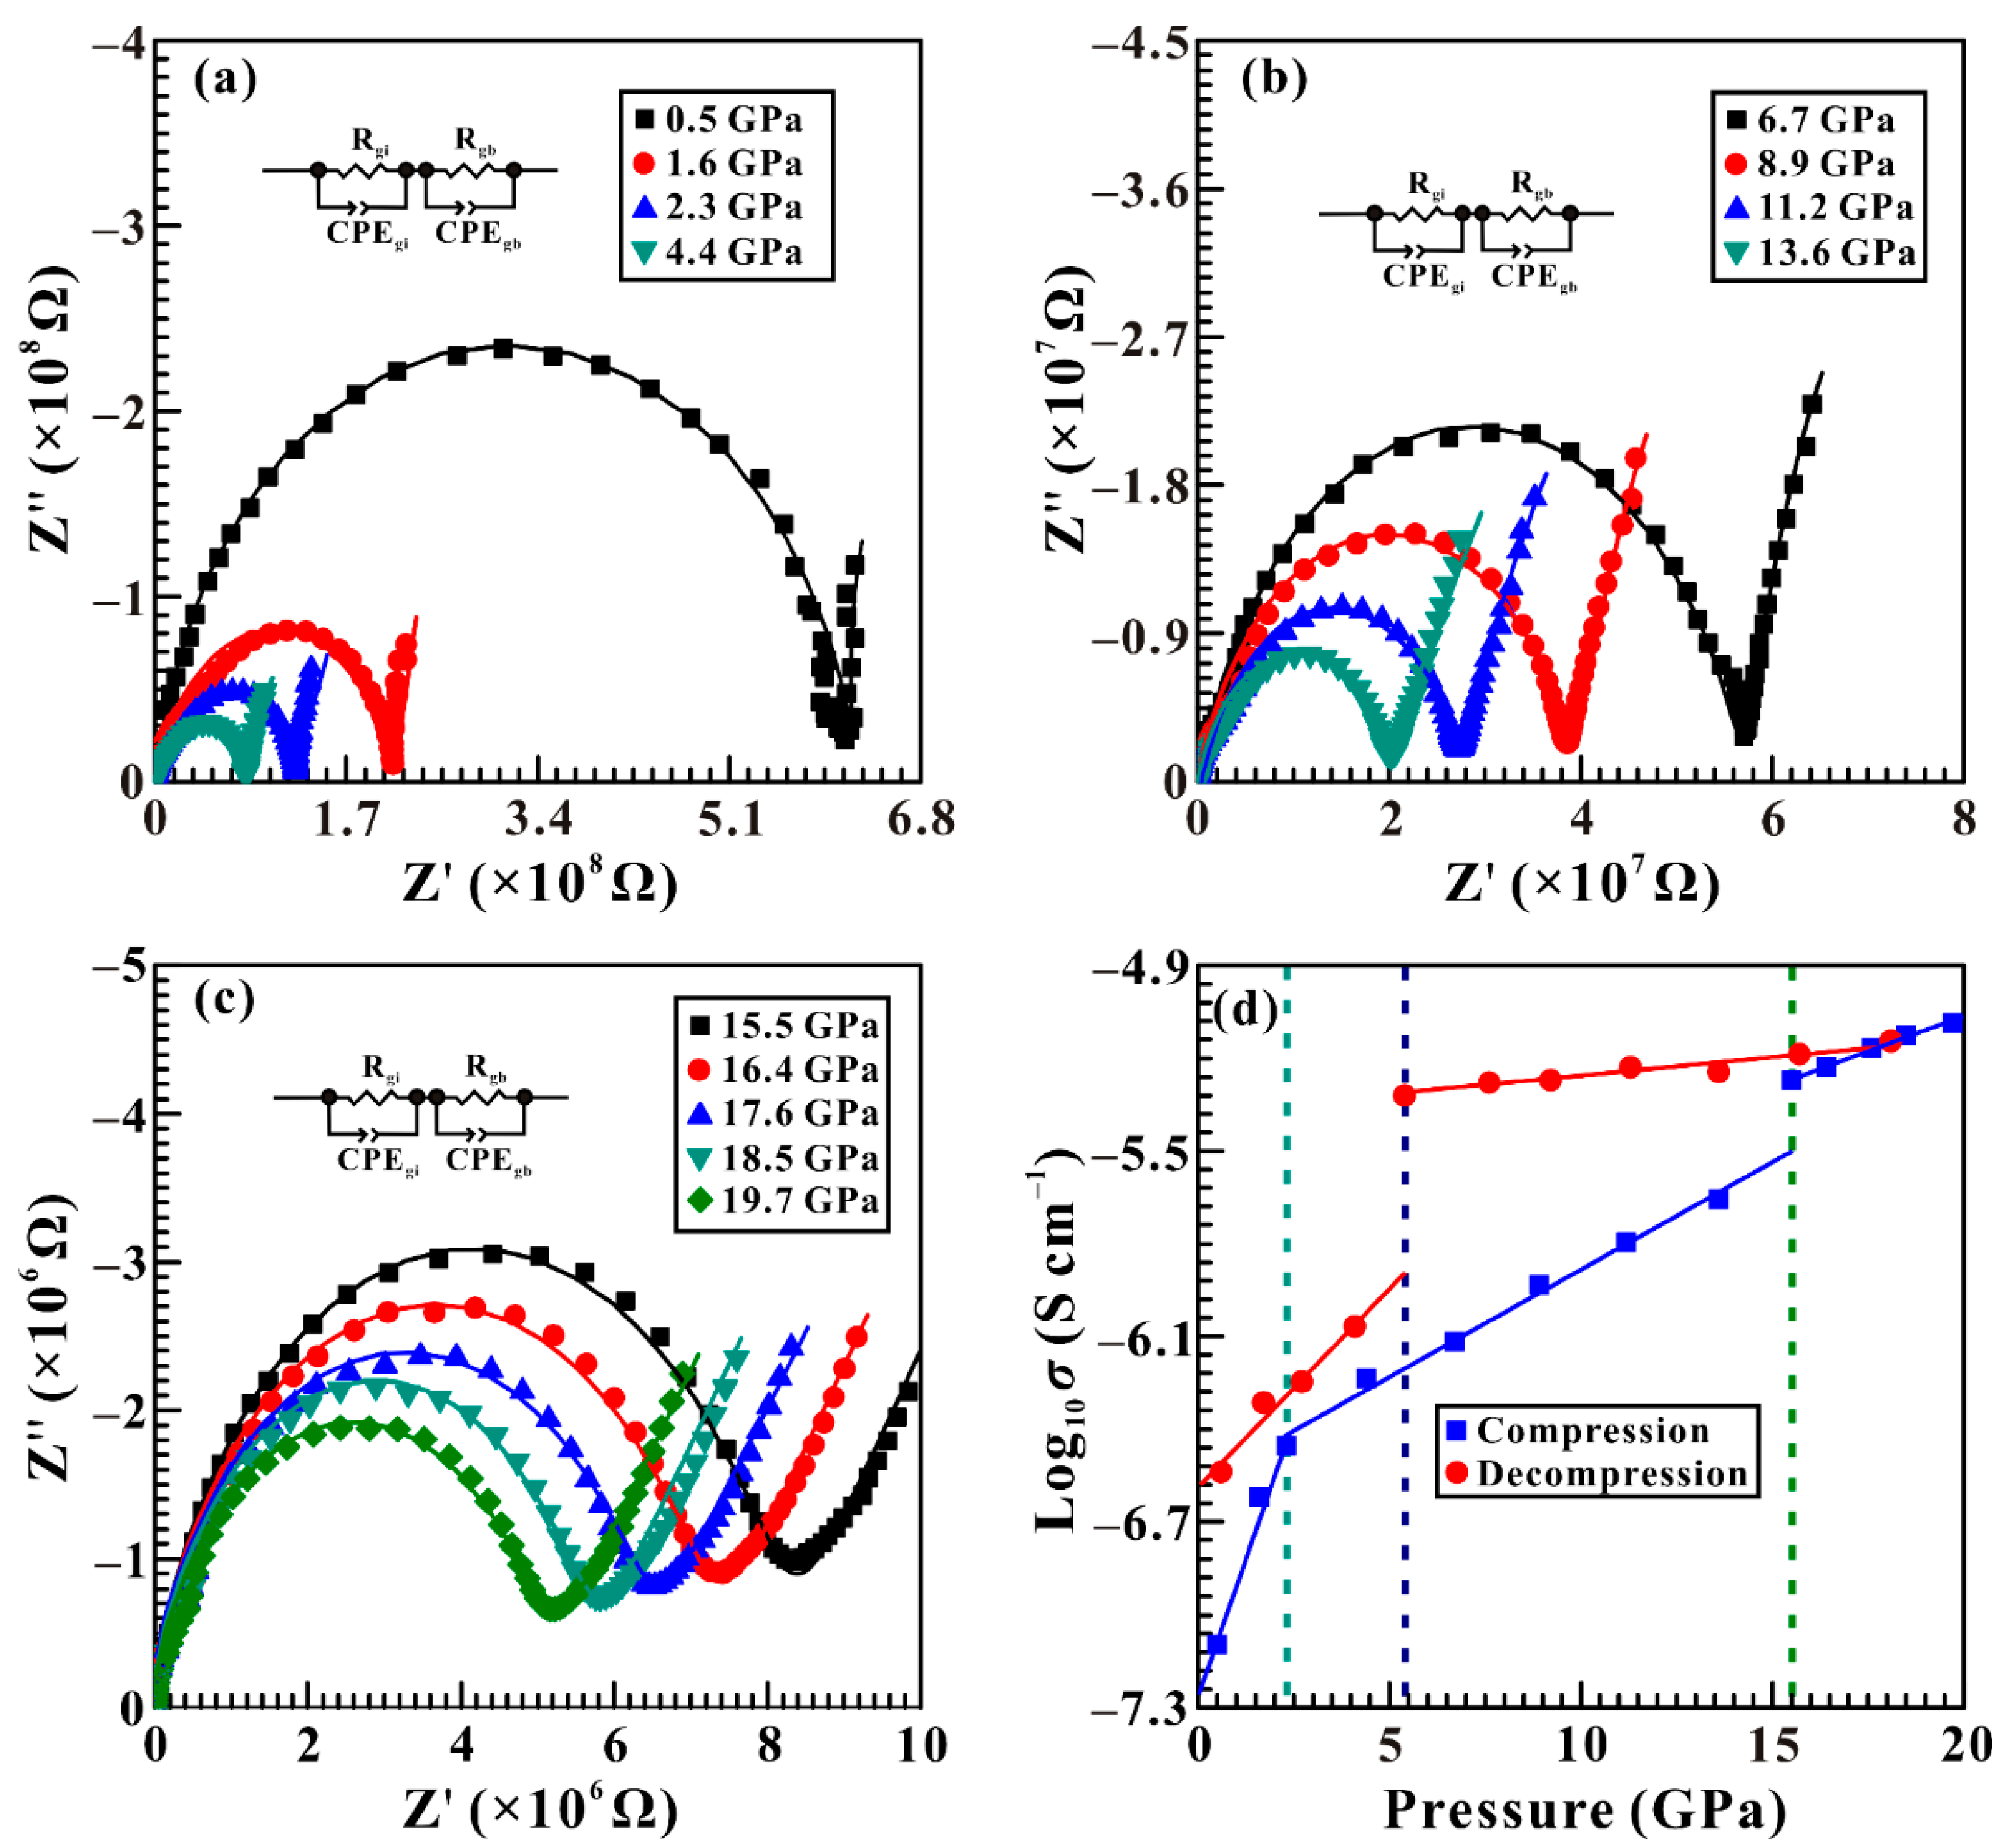
Figure 7.
Complex impedance spectra of calcite in the temperature range of 323–873 K at a certain pressure point of 10.5 GPa. (a) 323–523 K; (b) 573–723 K; (c) 773–873 K. (d) The logarithmic electrical conductivity of calcite against reciprocal temperature. Z’ is the real part of complex impedance spectra and Z” is the imaginary part. The colored curves are the results of the fitting to the impedance spectra. The black solid lines are obtained from the Arrhenius fitting results of the data.
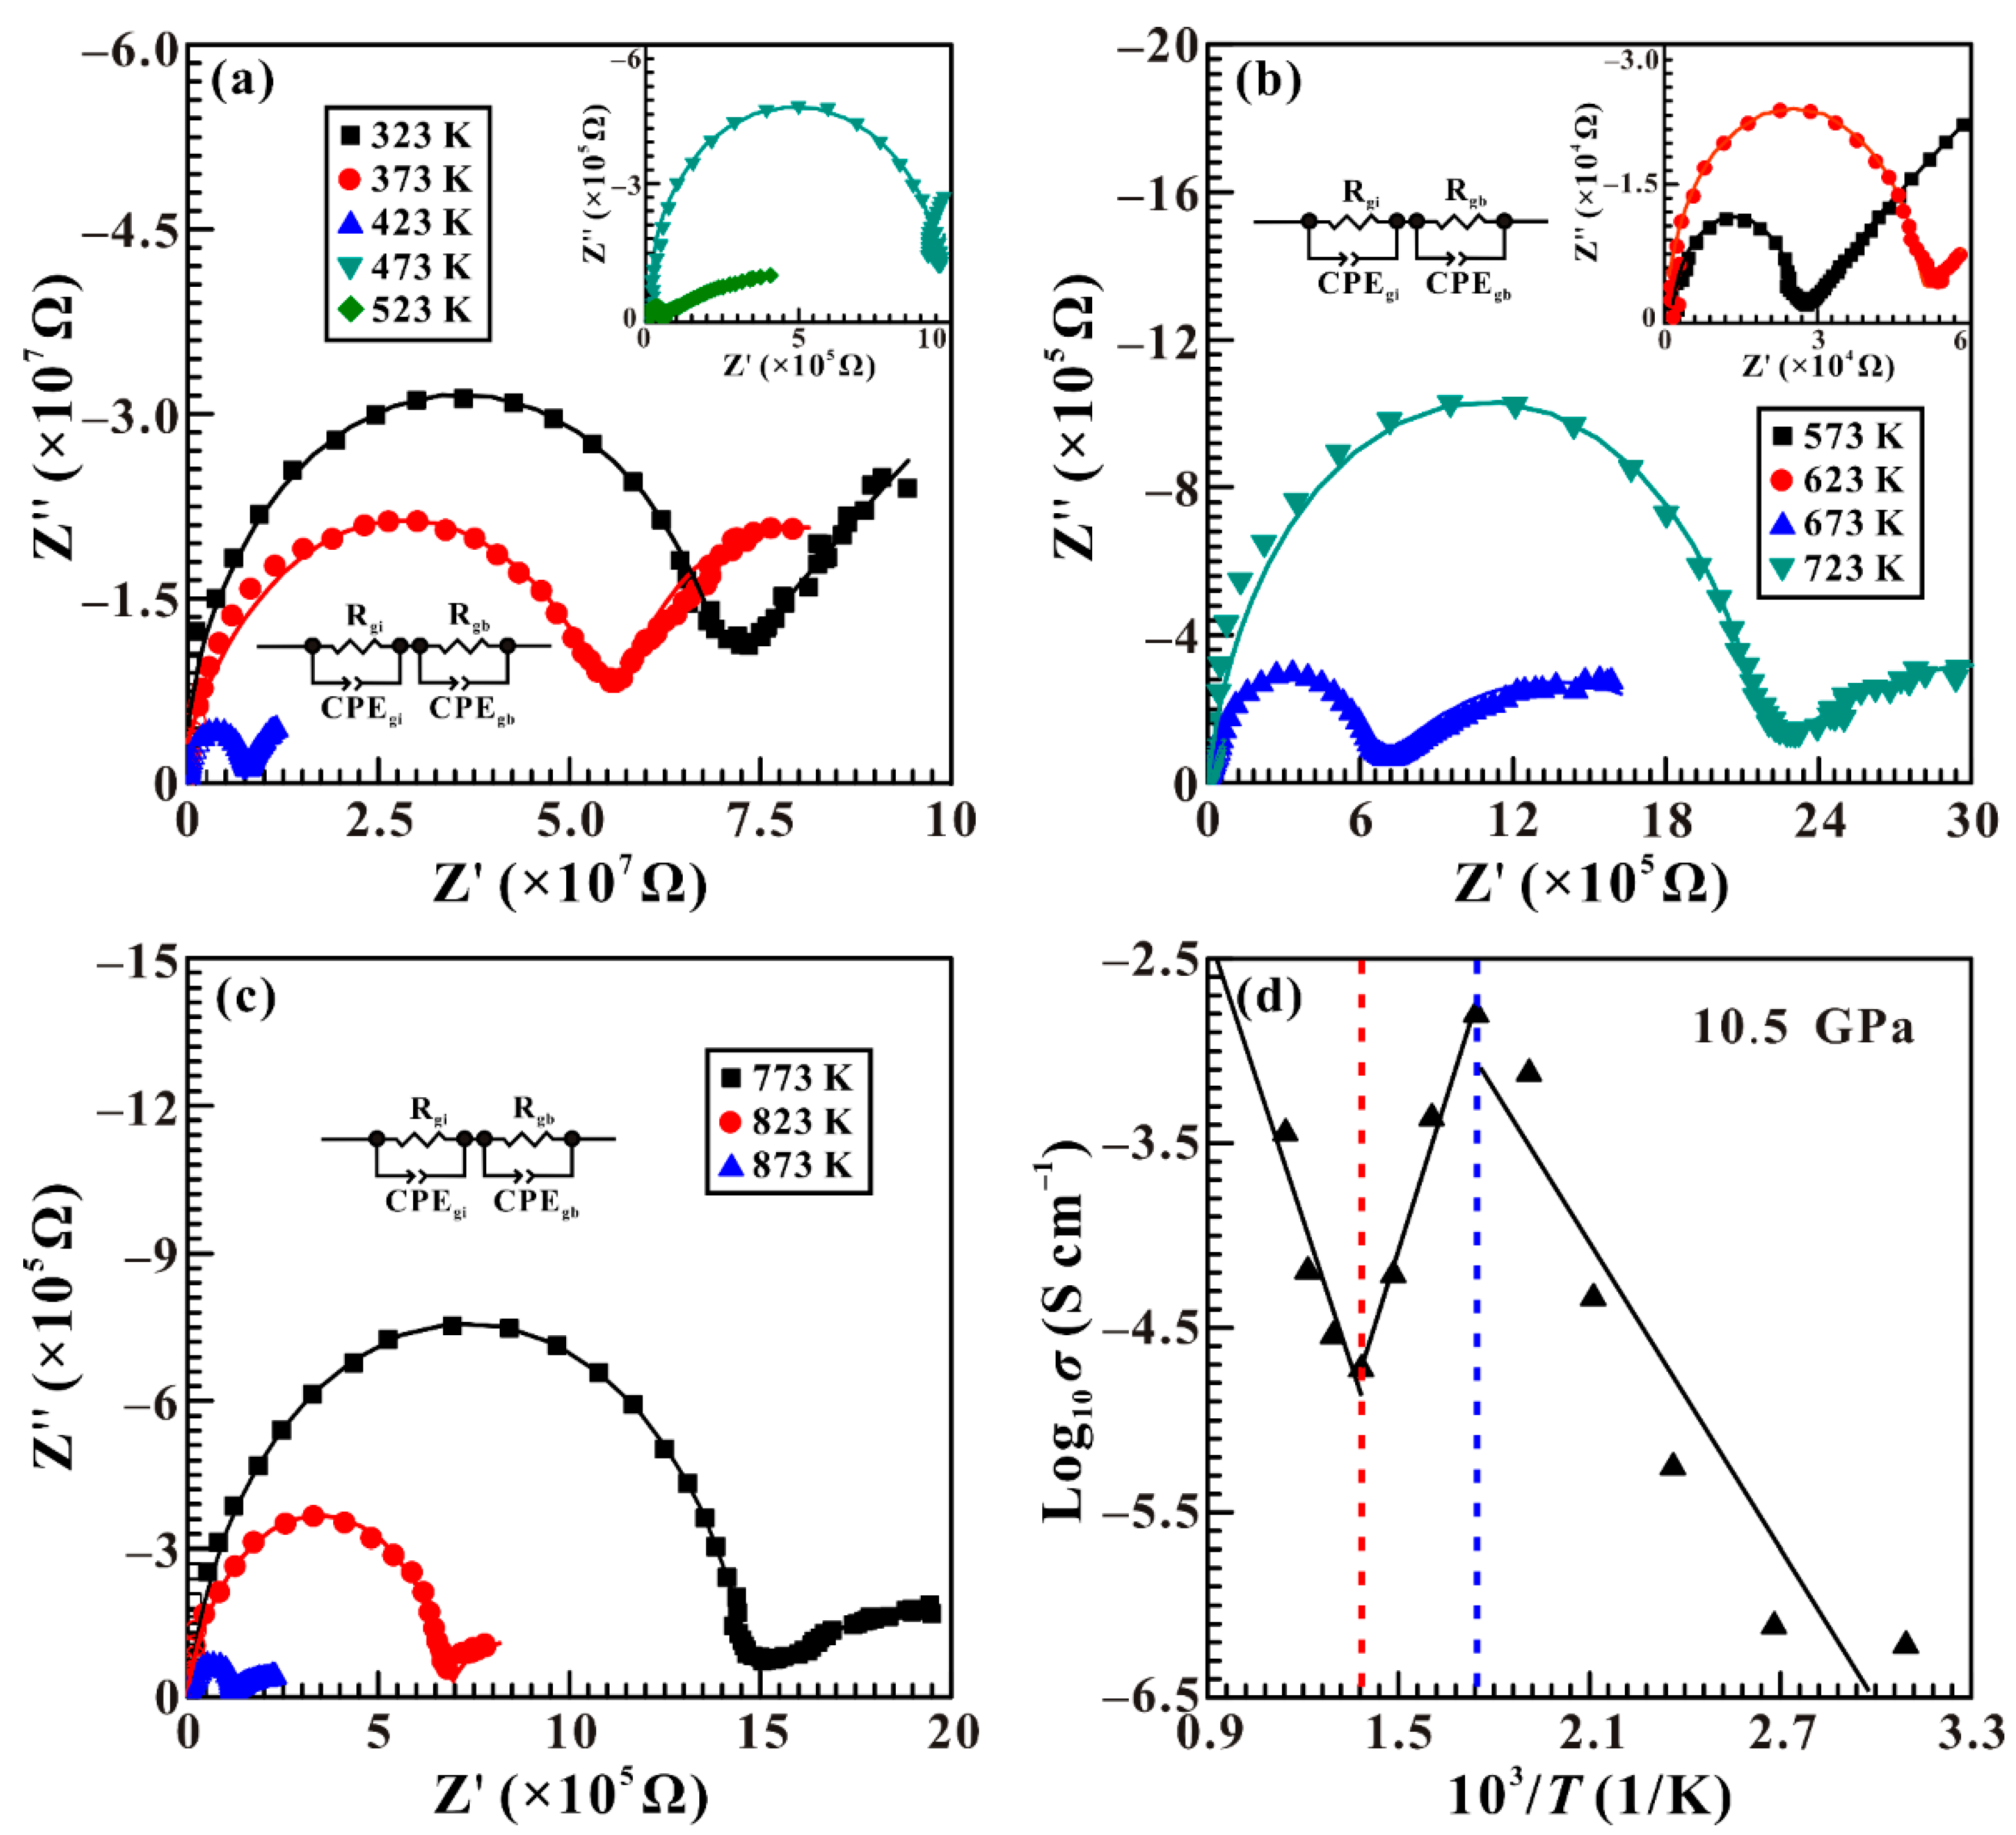
Figure 8.
Complex impedance spectra of calcite in the temperature range of 323–873 K at 12.5 GPa. (a) 323–423 K; (b) 473–623 K; (c) 673–873 K. (d) The logarithmic electrical conductivity of calcite against reciprocal temperature. Z’ is the real part of the complex impedance spectra and Z” is the imaginary part. The colored curves are the results of the fitting to the impedance spectra. The black solid lines are obtained from the Arrhenius fitting results of the data.

Figure 9.
Complex impedance spectra of calcite in the temperature range of 323–873 K at 13.8 GPa. (a) 323–473 K; (b) 523–673 K; (c) 723–873 K. (d) The logarithmic electrical conductivity of calcite against reciprocal temperature. Z’ is the real part of the complex impedance spectra and Z” is the imaginary part. The colored curves are the results of the fitting to the impedance spectra. The black solid lines are obtained from the Arrhenius fitting results of the data.
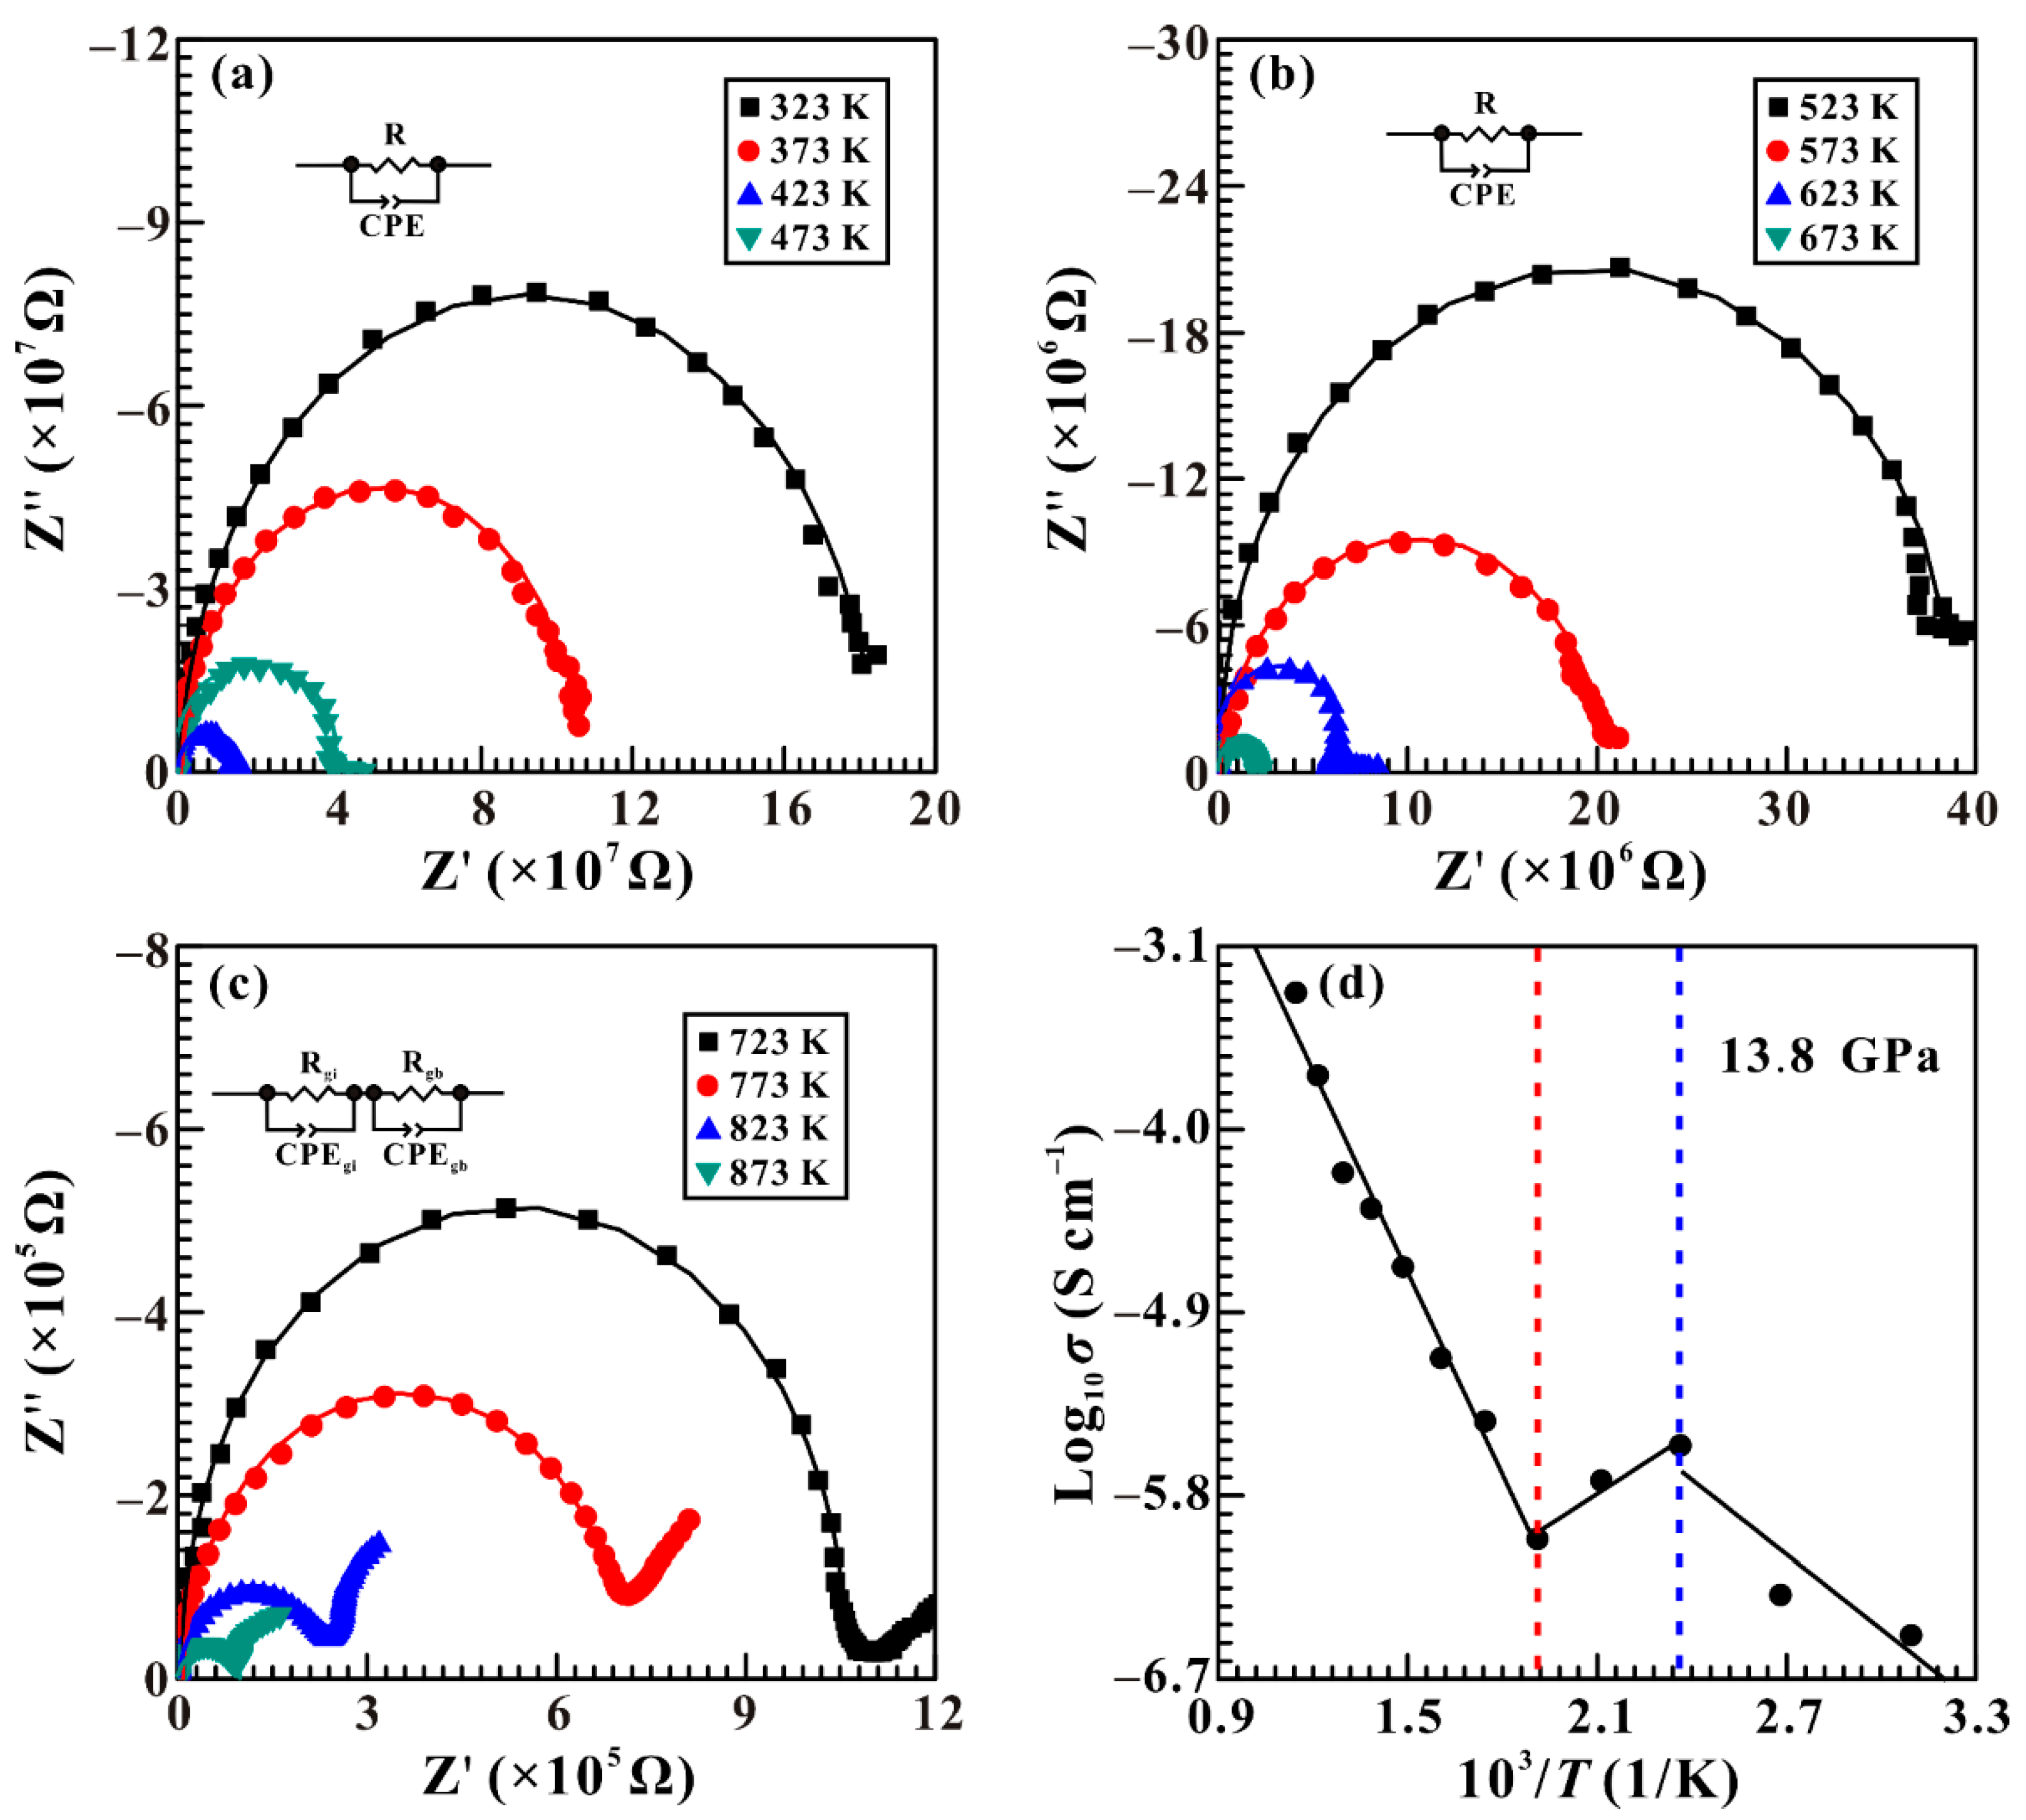
Figure 10.
Temperature–pressure phase diagram of calcite according to the current and previous experimental investigations in the conditions of temperatures up to 773 K and pressures up to 16.0 GPa at the depth range of 0–480 km. The red solid squares are based on our present electrical conductivity experimental results. The red solid line is the fitted phase transition boundary between CaCO3-III and CaCO3-VI phases. The black dashed lines are the phase transition boundaries of CaCO3-I to CaCO3-II phases and CaCO3-II to CaCO3-III phases through high-temperature and high-pressure Raman scattering experimental results, coming from Yuan et al. [10]. The olive dashed curve comes from Suito et al. [11], standing for the phase transition boundary from CaCO3-III phase to aragonite. The wine dot-dash line is the phase boundary from CaCO3-III phase to aragonite by Bayarjargal et al. [50]. The orange dotted line represents the CaCO3-II phase to aragonite boundary reported by Hess et al. [51]. The violet dot-dash line is the phase boundary between CaCO3-III and CaCO3-VI phases from Koch-Müller et al. [48]. The red, blue, and green areas represent the hot, cold, and very cold subducting slabs with the respective geothermal gradient values of 10 K/km, 5 K/km and 1.5 K/km.

Table 1.
Pressure coefficients of the Raman modes of CaCO3-I, CaCO3-II, CaCO3-III, and CaCO3-VI phases upon compression within the pressure range from 0.5–19.4 GPa at room temperature.
Table 1.
Pressure coefficients of the Raman modes of CaCO3-I, CaCO3-II, CaCO3-III, and CaCO3-VI phases upon compression within the pressure range from 0.5–19.4 GPa at room temperature.
| Pressure Range (GPa) | Mode (cm−1) | Pressure Coefficient (cm−1 GPa−1) | |
|---|---|---|---|
| CaCO3-I phase | 0.5–1.6 GPa | T | 2.07 |
| L | 1.83 | ||
| v4 | 11.51 | ||
| v1 | 16.14 | ||
| CaCO3-II phase | 1.6–2.2 GPa | M1 | 8.50 |
| M2 | 22.83 | ||
| M3 | 0.17 | ||
| M4 | 42.03 | ||
| v4 | 32.67 | ||
| v1 | 16.50 | ||
| CaCO3-III phase | 2.2–16.8 GPa | M5 | 2.00 |
| M1 | 1.38 | ||
| M2 | 1.02 | ||
| M3 | 1.61 | ||
| M6 | 2.36 | ||
| M7 | 2.28 | ||
| M8 | 3.89 | ||
| M9 | 5.09 | ||
| M10 | 0.87 | ||
| M4 | 1.19 | ||
| v4 | 1.21 | ||
| M11 | –0.39 | ||
| M12 | 1.46 | ||
| v1 | 1.84 | ||
| CaCO3-VI phase | 16.8–19.4 GPa | M5 | 0.15 |
| M1 | 0.50 | ||
| M2 | 0.46 | ||
| M3 | 0.76 | ||
| M6 | 1.08 | ||
| M13 | 2.81 | ||
| M7 | 2.31 | ||
| M8 | 1.62 | ||
| M9 | 1.08 | ||
| M10 | 0.65 | ||
| M4 | 0.77 | ||
| M11 | 0.88 | ||
| v1 | 0.57 |
Table 2.
Pressure coefficients of the Raman modes of CaCO3-I, CaCO3-II, CaCO3-III, and CaCO3-VI phases upon decompression within the pressure range from 18.3 GPa−1 atm at room temperature.
Table 2.
Pressure coefficients of the Raman modes of CaCO3-I, CaCO3-II, CaCO3-III, and CaCO3-VI phases upon decompression within the pressure range from 18.3 GPa−1 atm at room temperature.
| Pressure Range (GPa) | Mode (cm−1) | Pressure Coefficient (cm−1 GPa−1) | |
|---|---|---|---|
| CaCO3-VI phase | 18.3–5.4 GPa | M5 | 0.20 |
| M1 | 0.33 | ||
| M2 | 0.73 | ||
| M3 | 1.34 | ||
| M6 | 0.87 | ||
| M13 | 1.35 | ||
| M7 | 1.54 | ||
| M8 | 1.70 | ||
| M9 | 2.47 | ||
| M10 | 0.35 | ||
| M4 | 0.50 | ||
| M11 | 0.04 | ||
| v1 | 1.18 | ||
| CaCO3-III phase | 5.4–1.5 GPa | M5 | 1.63 |
| M1 | 1.33 | ||
| M2 | 1.23 | ||
| M3 | 2.87 | ||
| M6 | 4.73 | ||
| M7 | 6.37 | ||
| M8 | 4.83 | ||
| M9 | 8.87 | ||
| M10 | 2.30 | ||
| M4 | 3.27 | ||
| v4 | 3.30 | ||
| M11 | –0.70 | ||
| M12 | 2.23 | ||
| v1 | 3.27 | ||
| CaCO3-II phase | 1.5–0.4 GPa | M1 | 7.48 |
| M2 | 6.93 | ||
| M3 | 8.27 | ||
| M4 | 9.73 | ||
| v4 | 10.26 | ||
| v1 | 5.59 | ||
| CaCO3-I phase | 0.4 GPa−1 atm | T | 3.62 |
| L | 1.21 | ||
| v4 | 4.12 | ||
| v1 | 3.72 |
Table 3.
Pressure-induced structural transition phases in calcite between CaCO3-I and CaCO3-II phases, CaCO3-II and CaCO3-III phases, and CaCO3-III and CaCO3-VI phases at atmospheric condition.
Table 3.
Pressure-induced structural transition phases in calcite between CaCO3-I and CaCO3-II phases, CaCO3-II and CaCO3-III phases, and CaCO3-III and CaCO3-VI phases at atmospheric condition.
| Phase Transition | Pressure (GPa) | Method | Reference |
|---|---|---|---|
| CaCO3-I to CaCO3-II phases | 1.6 | Raman spectroscopy | This study |
| 1.6 | Raman spectroscopy | [9] | |
| 1.6 | Raman spectroscopy | [10] | |
| 1.4 | Raman spectroscopy | [11] | |
| 1.7 | Brillouin spectroscopy | [45] | |
| 1.5 | Synchrotron X-ray diffraction | [44] | |
| CaCO3-II to CaCO3-III phases | 2.3 | Electrical conductivity | This study |
| 2.2 | Raman spectroscopy | This study | |
| 2.0 | Raman spectroscopy | [9] | |
| 2.0 | Raman spectroscopy | [10] | |
| 2.0 | Raman spectroscopy | [12] | |
| 2.1 | Raman spectroscopy | [11] | |
| 2.2 | Brillouin spectroscopy | [45] | |
| 2.5 | Synchrotron X-ray diffraction | [44] | |
| CaCO3-III to CaCO3-VI phases | 15.5 | Electrical conductivity | This study |
| 16.8 | Raman spectroscopy | This study | |
| 16.0 | Raman spectroscopy | [12] | |
| 15.5 | Infrared spectroscopy | [39] | |
| 15.0 | Synchrotron X-ray diffraction | [44] |
Table 4.
The fitted parameters for the Arrhenius relation of the electrical conductivity of calcite. P is the pressure, T is the absolute temperature, σ0 is the pre-exponential factor, ΔH is the activation enthalpy, and R2 is the linear correction.
Table 4.
The fitted parameters for the Arrhenius relation of the electrical conductivity of calcite. P is the pressure, T is the absolute temperature, σ0 is the pre-exponential factor, ΔH is the activation enthalpy, and R2 is the linear correction.
| P (GPa) | T (K) | Phase | σ0 (S/cm) | ΔH (eV) | R2 |
|---|---|---|---|---|---|
| 10.5 | 323–573 | CaCO3-III | 5.89 × 101 | 5.48 ± 0.91 | 87.57 |
| 10.5 | 723–873 | CaCO3-VI | 2.04 × 10² | 10.26 ± 2.71 | 82.08 |
| 12.5 | 323–473 | CaCO3-III | 8.91 × 10⁻⁵ | 1.62 ± 0.27 | 92.07 |
| 12.5 | 623–873 | CaCO3-VI | 3.24 × 10⁻² | 5.90 ± 0.42 | 97.54 |
| 13.8 | 323–423 | CaCO3-III | 1.73 × 10⁻³ | 2.44 ± 1.01 | 70.46 |
| 13.8 | 523–873 | CaCO3-VI | 1.77 × 100 | 6.55 ± 0.36 | 97.92 |
Disclaimer/Publisher’s Note: The statements, opinions and data contained in all publications are solely those of the individual author(s) and contributor(s) and not of MDPI and/or the editor(s). MDPI and/or the editor(s) disclaim responsibility for any injury to people or property resulting from any ideas, methods, instructions or products referred to in the content. |
© 2023 by the authors. Licensee MDPI, Basel, Switzerland. This article is an open access article distributed under the terms and conditions of the Creative Commons Attribution (CC BY) license (https://creativecommons.org/licenses/by/4.0/).
Share and Cite
MDPI and ACS Style
Zhang, X.; Dai, L.; Hu, H.; Li, C. Pressure-Induced Reverse Structural Transition of Calcite at Temperatures up to 873 K and Pressures up to 19.7 GPa. Minerals 2023, 13, 188. https://doi.org/10.3390/min13020188
AMA Style
Zhang X, Dai L, Hu H, Li C. Pressure-Induced Reverse Structural Transition of Calcite at Temperatures up to 873 K and Pressures up to 19.7 GPa. Minerals. 2023; 13(2):188. https://doi.org/10.3390/min13020188
Chicago/Turabian StyleZhang, Xinyu, Lidong Dai, Haiying Hu, and Chuang Li. 2023. "Pressure-Induced Reverse Structural Transition of Calcite at Temperatures up to 873 K and Pressures up to 19.7 GPa" Minerals 13, no. 2: 188. https://doi.org/10.3390/min13020188
Note that from the first issue of 2016, this journal uses article numbers instead of page numbers. See further details here.