Article

Silica Polymorphs Formation in the Jänisjärvi Impact Structure: Tridymite, Cristobalite, Quartz, Trace Stishovite and Coesite

by
Daria A. Zamiatina
,
Dmitry A. Zamyatin
*,
Georgii B. Mikhalevskii
and
Nikolai S. Chebikin
The Zavaritsky Institute of Geology and Geochemistry, Ural Branch of the Russian Academy of Sciences, Ekaterinburg 620016, Russia
*
Author to whom correspondence should be addressed.
Minerals 2023, 13(5), 686; https://doi.org/10.3390/min13050686
Submission received: 31 March 2023 / Revised: 28 April 2023 / Accepted: 11 May 2023 / Published: 17 May 2023

Abstract

:
The study of silica polymorphs in impactites is important for determining the pressure and temperature of impact rock formation. Silica modifications in impact melt rocks of the Janisjärvi impact structure (Karelia, Russia) are presented by tridymite, cristobalite, quartz, trace stishovite and coesite. Silica modifications were characterized and studied by scanning electron microscopy (SEM), electron probe microanalysis (EPMA), and Raman and cathodoluminescent spectroscopy. Investigations were carried out in order to clarify polymorphs formation mechanisms and search for signs of the transition of certain structural modifications to others. For the first time, a description of tridymite with a ballen-like texture from impact melt rock is given. A sequence of silica modification and textural transformation in impact rocks after the impact event is suggested. We conclude that the pressure of 40 GPa and a temperature of more than 900 °C were achieved in the impact structure.

1. Introduction

Identification of silica polymorphs and textural features allows us to recognize the achieved pressures (P) and temperatures (T) at the impact event [1]. Cristobalite is known in two modifications—cubic high-temperature β-cristobalite and tetragonal low-temperature α-cristobalite [2]. β-cristobalite is stable at 1470–1727 °C, however, it is metastable at lower temperatures. The low-temperature polymorph modification α-cristobalite is formed at 170–270 °C [3]. Tridymite forms high-temperature hexagonal modification (HP) that is stable at 380–1450 °C [2]. Three orthorhombic modifications of tridymite OC → OS → OP arise at lower temperatures from 380 to 110 °C. Low-temperature modifications of tridymite are stable below 110 °C: monoclinic (MK), monoclinic with a superstructure (MX-1) and orthorhombic (pseudo-orthorhombic) (PO-10). Most terrestrial tridymite has been classified as pseudo-orthorhombic (PO) [3].
Cristobalite and tridymite are known in volcanic rocks [4,5,6,7,8,9], meteorites, as well as lunar and Martian rocks [10,11,12,13]. Cristobalite and tridymite have been found in diagenetic deposits [14,15].
Cristobalite is more common in impact rocks than tridymite [16,17,18,19,20]. Tridymite has been found only in the Popigai impact structure [17], and monoclinic tridymite has been found in the rocks of the Chesapeake Bay meteorite crater [21].
Ballen quartz has been previously described in many impact structures [19]. Ballen cristobalite is known from the crater Rees in Germany [18,19] and Popigai in Siberia [16,17]. Cristobalite with a ballen or “fish scale” texture is found in volcanic rocks, where it is formed as a result of vapor-phase deposition [7,22]. The formation of ballen is associated with the transformation of lechatelierite or diaplectic quartz glass to cristobalite and subsequent transition to α-quartz [19,23,24]. Its formation is also associated with the transformation of β- to α-cristobalite [3,19]. Ballen tridymite has never been described before.
Polymorphic modifications of silica in the Janisjärvi impact structure were reported in [25], where lines corresponding to coesite, stishovite and cristobalite were found using X-ray diffraction and infrared spectroscopy. However, the grain morphology was not described previously.
This study provides a detailed description of the paragenesis of tetragonal cristobalite and orthorhombic tridymite, as well as quartz paramorphoses after them, and for the first time reports the discovery of tridymite with a ballen-like texture in rocks of the Janisjärvi impact structure. This study will help to clarify the conditions of formation of the Janisjärvi impact structure. This work is the continuation of a previously published work devoted to the ballen quartz from the same samples [26].

2. Materials and Methods

The Jänisjärvi impact structure is located 25 km north of Lake Ladoga, Karelia, Russia. The diameter of the crater is 14 km. The age of the structure is 682 ± 4 Ma [27]. The target rocks are composed of Lower Proterozoic quartz-biotite schists (Figure 1a) of the Ladoga Series (Pälkjärvi and Naatselkä formation). Impactites are found on islands located in the center of the lake and on the western cape (Cape Leppiniemi). They are represented by impact melt rocks and suevites. Impact melt rocks consist of quartz, plagioclase, sanidine, garnet, staurolite, hypersthene, biotite, and cordierite [28,29,30]. Sample Jl-07 from Cape Leppiniemi impact melt rock is studied herein.
A polished thin section was made from sample Jl-07 for research. Diamond powders were used for mechanical polishing of a thin section. The final polishing of a thin section was carried out using a suspension of colloidal silica on a polishing machine with an active rotary-head from Struers for 2 h. The preparation and characterization of the sample were carried out at the Geoanalitik shared research facilities at the Zavaritsky Institute of Geology and Geochemistry of the Ural Branch of the Russian Academy of Sciences (Ekaterinburg). Optical microscopy was performed using an Olympus BX-51 microscope.
Chemical maps and electron backscattered diffraction (EBSD) data were obtained by a scanning electron microscope (SEM) TESCAN MIRA LMS equipped with Oxford Instruments X-Max80 and NordlysNano EBSD detectors. The chemical maps were recorded with an accelerating voltage of 20 kV and a probe current of 800 pA. The EBSD data were obtained with an accelerating voltage of 30 kV and a probe current of 10 nA. The data were processed by using Aztec v3.2 and Channel5 software.
A spectrometer Horiba H-CLUE iHR500 installed on the scanning electron microscope JEOL JSM-6390LV was used to measure the cathodoluminescence (CL) spectra in the range of 250–900 nm using diffraction grating of 150 L/mm at an accelerating voltage of 10 kV.
The chemical composition of mineral phases was obtained by using an electron probe microanalyzer Cameca SX100 (EPMA), with an accelerating voltage of 15 kV and a probe current of 40 nA. The microanalyzer was equipped with five wave-dispersive spectrometers and diffraction crystals with 2d of 25.745 Å (TAP crystal), 4.26 Å (LIF) and 8.75 Å (PET). Standard deviations were below 0.42, 0.14, 0.22, 0.20, 0.05, 0.70, 0.96, 0.14, 0.20 and 0.61 wt.% for Si, Na, Mg, K, Ca, Cr, Fe, Mn, Al and Ti, respectively. The detection limits for the elements were as follows: Si (0.07–0.42 wt.%), Na (0.03–0.09 wt.%), K (0.02–0.12 wt.%), Ca (0.02–0.03 wt.%), Mg (0.02–0.09 wt.%), Fe (0.11–0.48 wt.%), Mn (0.04–0.05 wt.%), Cr (0.06–0.35 wt.%), Ti (0.04–0.07 wt.%) and Al (0.02–0.14 wt.%).
Hyperspectral Raman maps and spectra were obtained using a Horiba LabRam HR800 Evolution spectrometer equipped with an Olympus BX-FM microscope with a 100x objective, using diffraction grating of 600 L/mm and an He–Ne laser excitation of 633 nm in the spectral range of 0–1200 cm−1. The Raman data were processed using LabSpec software. The obtained Raman spectra were compared with the corresponding spectra of minerals from the database RRUFF.info [32].

3. Results

3.1. Mineralogical Composition of Impact Melt Rocks

Impact melt from Cape Leppiniemi and Hoopesaari Island is represented by massive aphanitic dark green rocks (Figure 1b); these have lithoclasts up to 5%, as well as glass spherulites. The matrix consist of quartz, sanidine, plagioclase, cordierite, pyroxene, ilmenite, biotite, chlorite and muscovite. The melt rocks also contain garnet grains. In massive impact melt rocks, silica minerals are presented by irregular isometric grains of quartz and cristobalite; grains of tridymite with acicular sections located mainly in spherulites; as well as large segregations (up to 1 cm) of ballen quartz.
Here, we study sample Jl-07 from Cape Leppiniemi impact melt rocks with a massive texture, where the largest number of silica polymorphs with various morphologies was found. Sample Jl-07 has a dark greenish-gray color and a fluid microtexture (Figure 1c). According to X-Ray diffraction, sample Jl-07 consists of 31.7% sanidine, 17.5% tridymite, 17.0% cordierite, 10.4% cristobalite, 9.9% quartz, 9.7% albite, 0.5% ilmenite, 0.2% ferrihydrite and 0.2% titanite [33]. Following SEM-EDS and Raman spectroscopy, the rock is composed of a quartz–cristobalite–sanidine matrix, which contains cordierite phenocrysts. Sanidine is found in sheath-like and sheaf-like crystals, and it also forms micropegmatite textures with silica minerals. The rock is characterized by flow bands enriched in cordierite and quartz, or cordierite and sanidine. The diameter of cordierite phenocrysts are up to 1 mm with melted edges. Silica minerals (cristobalite, tridymite, quartz) fill the interstitial space between grains of other minerals and replace cordierite phenocrysts.

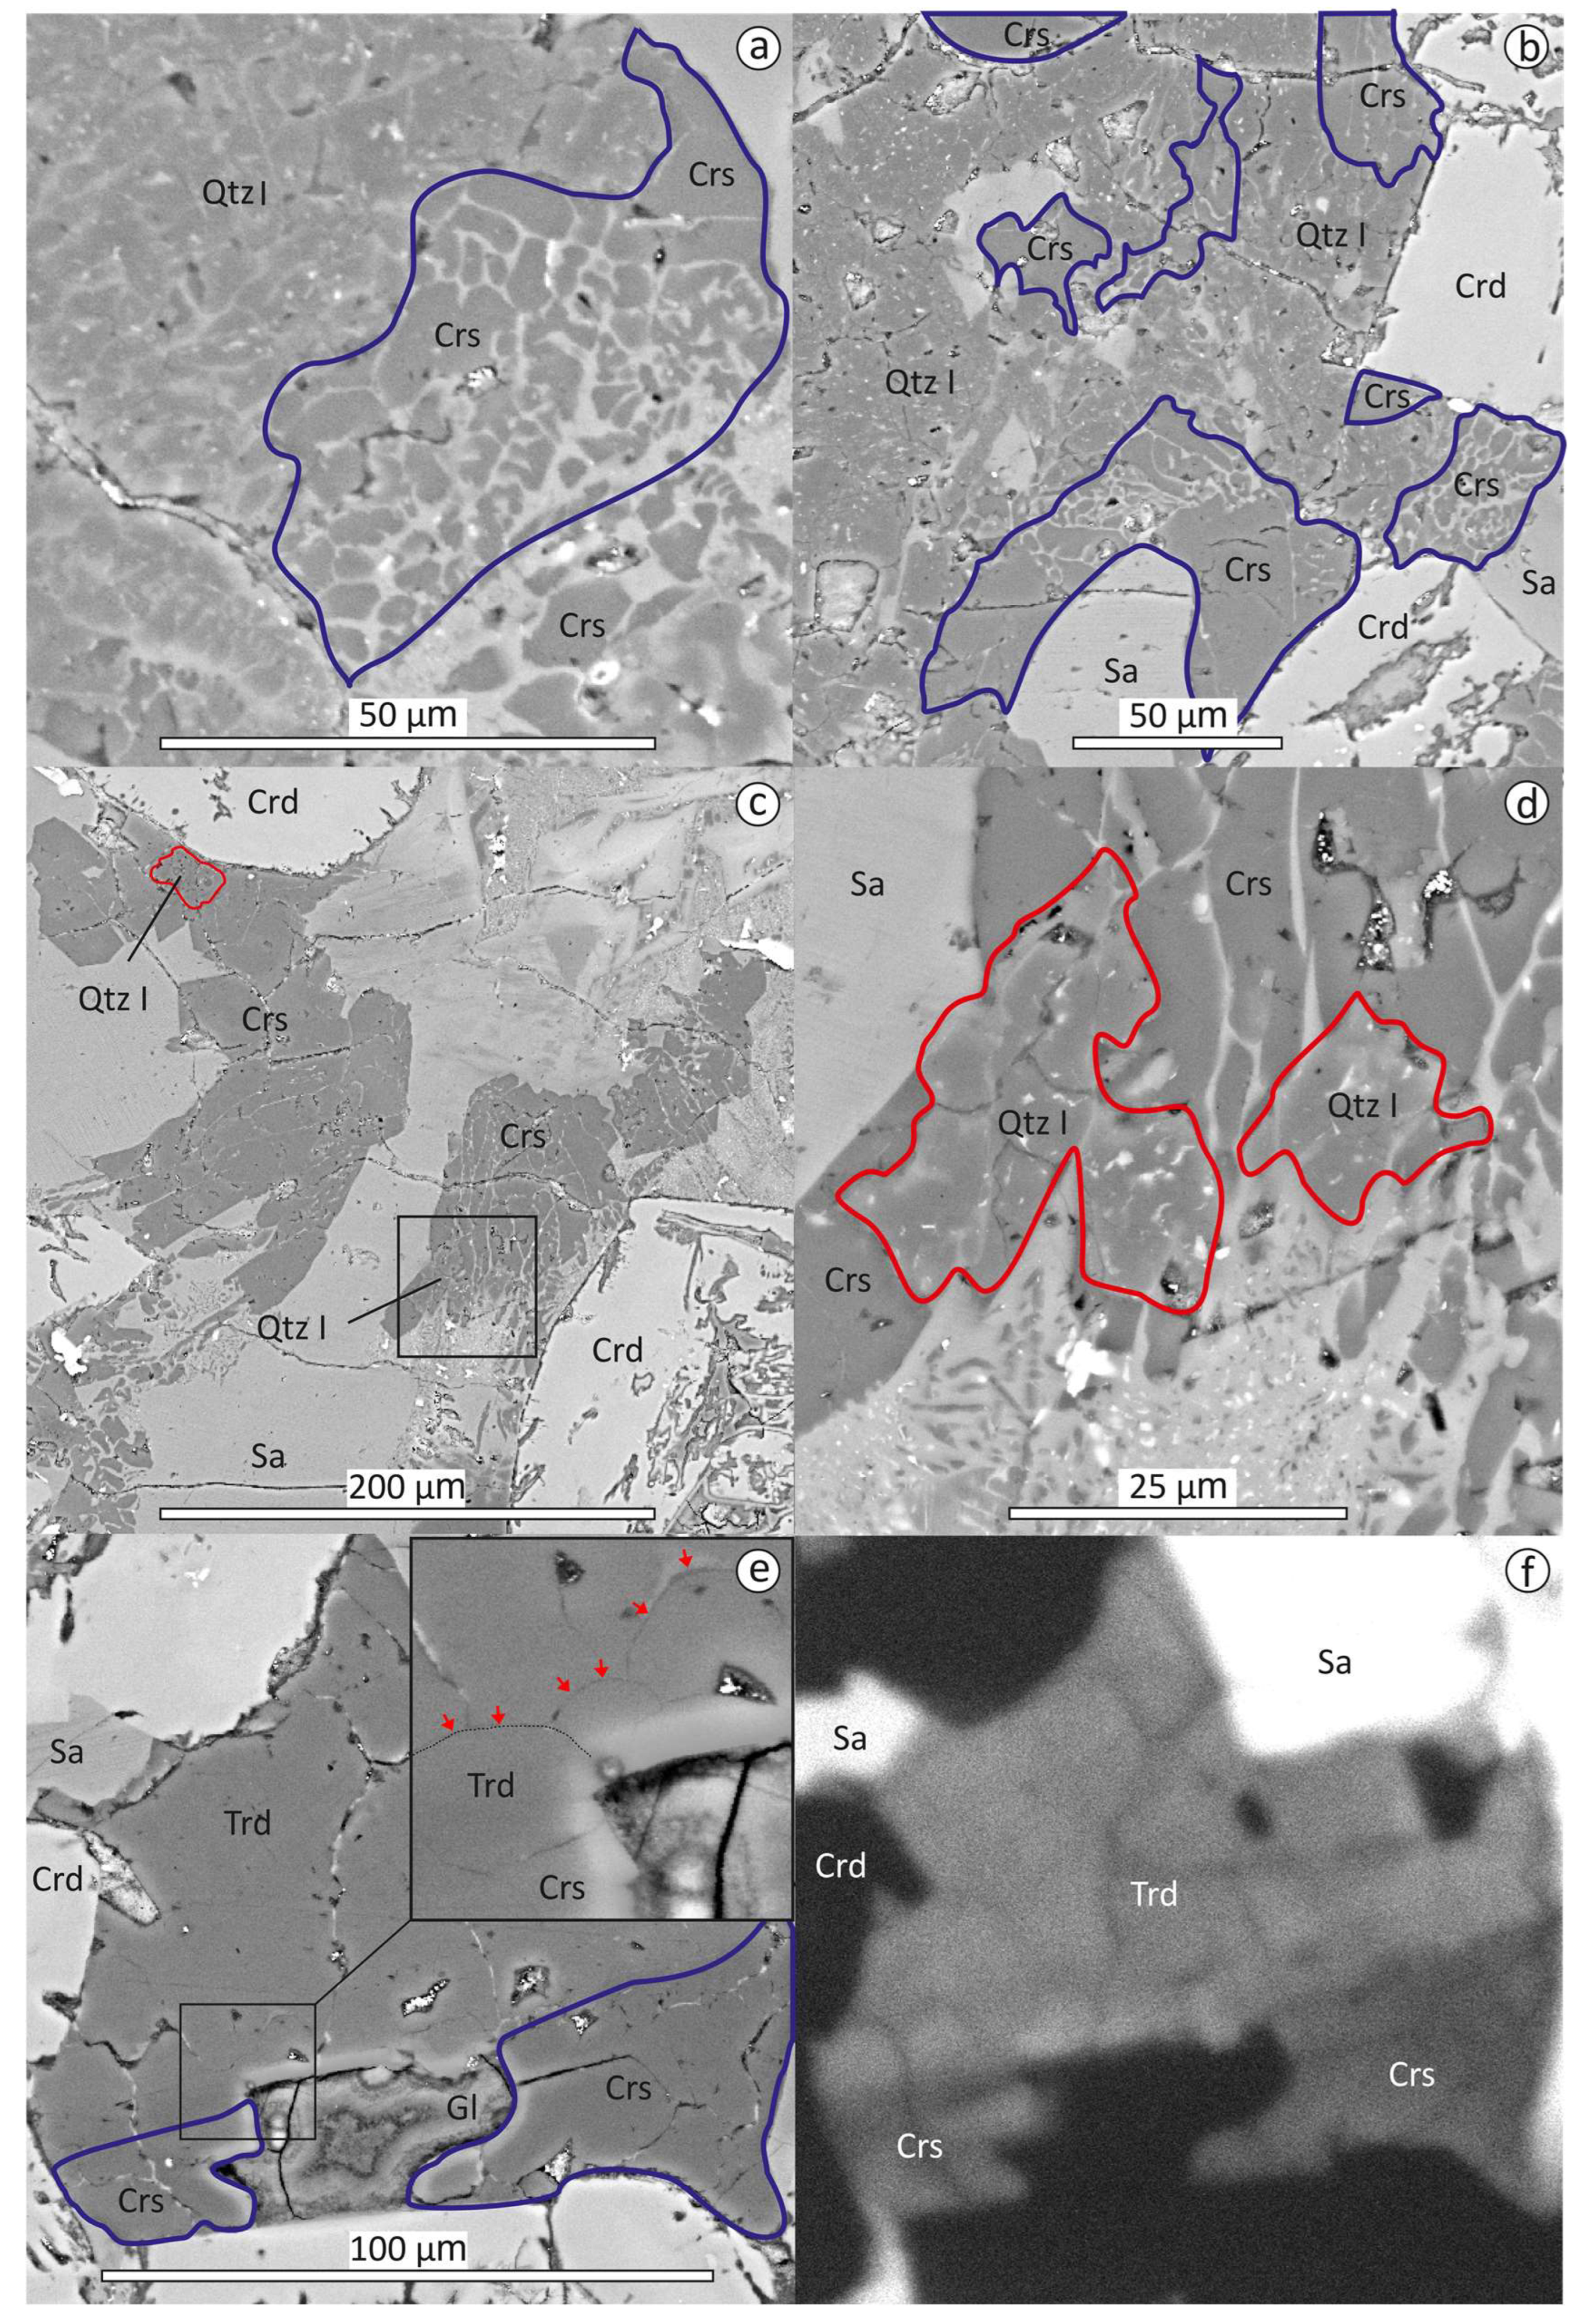
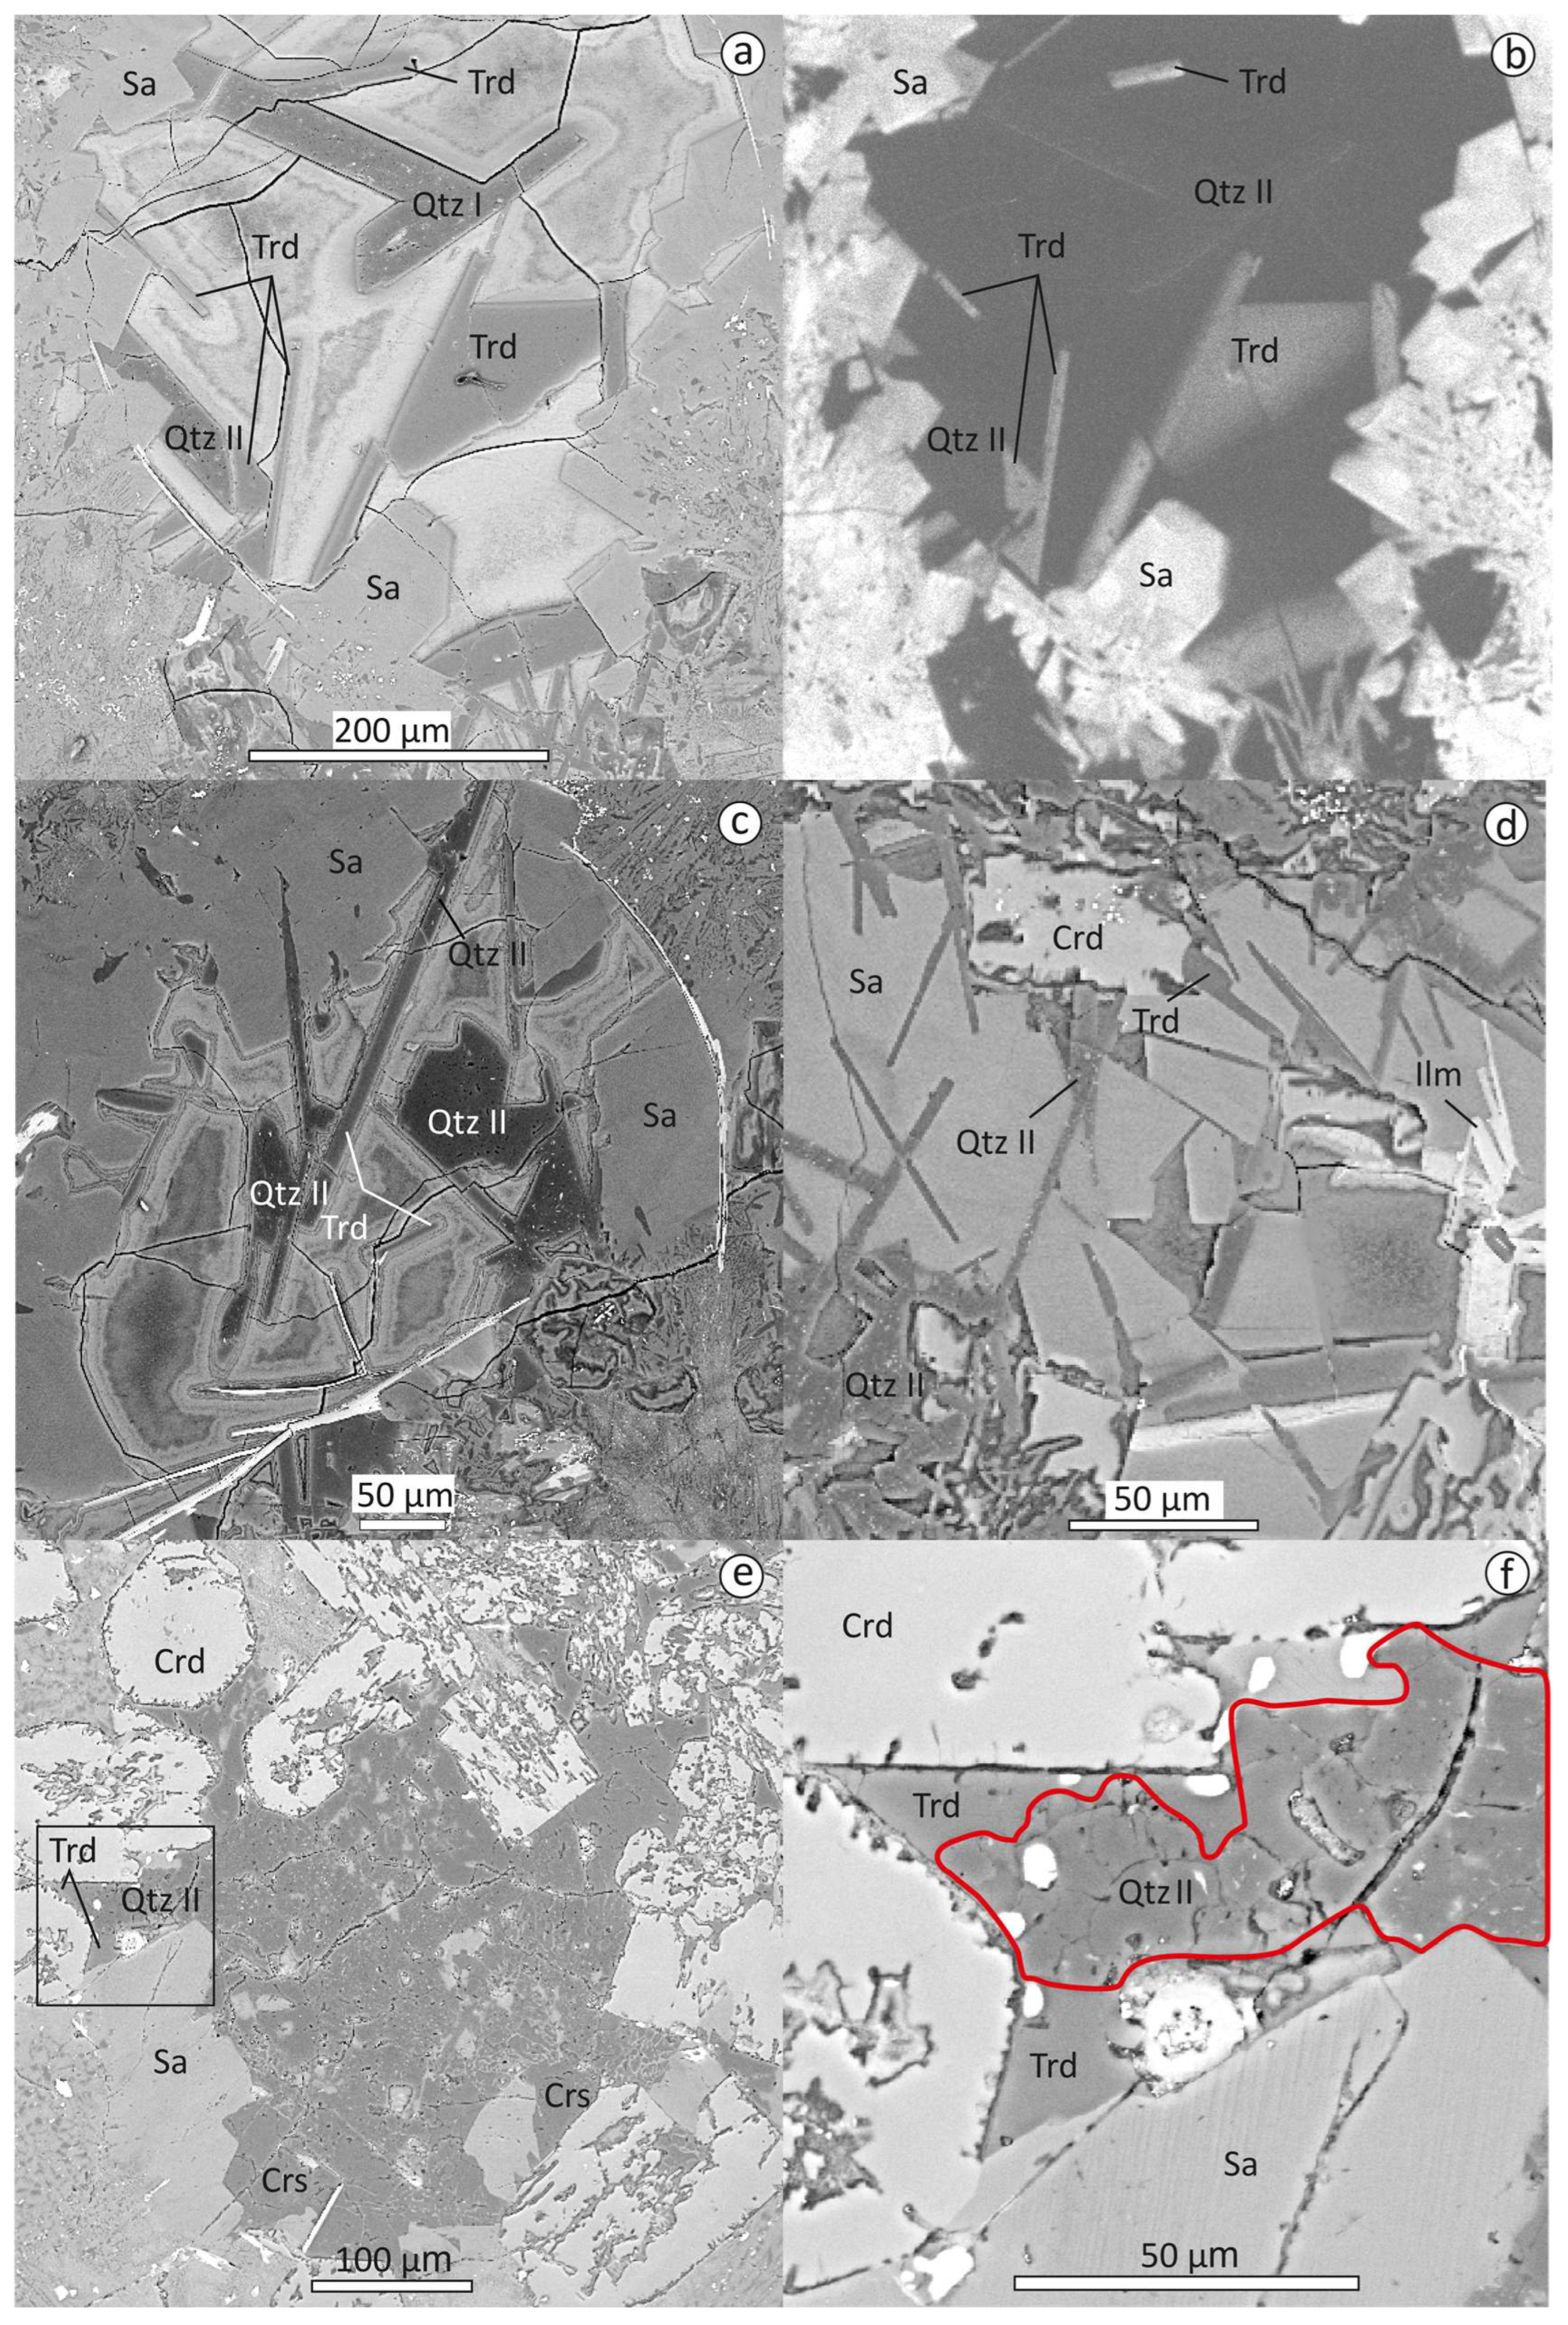
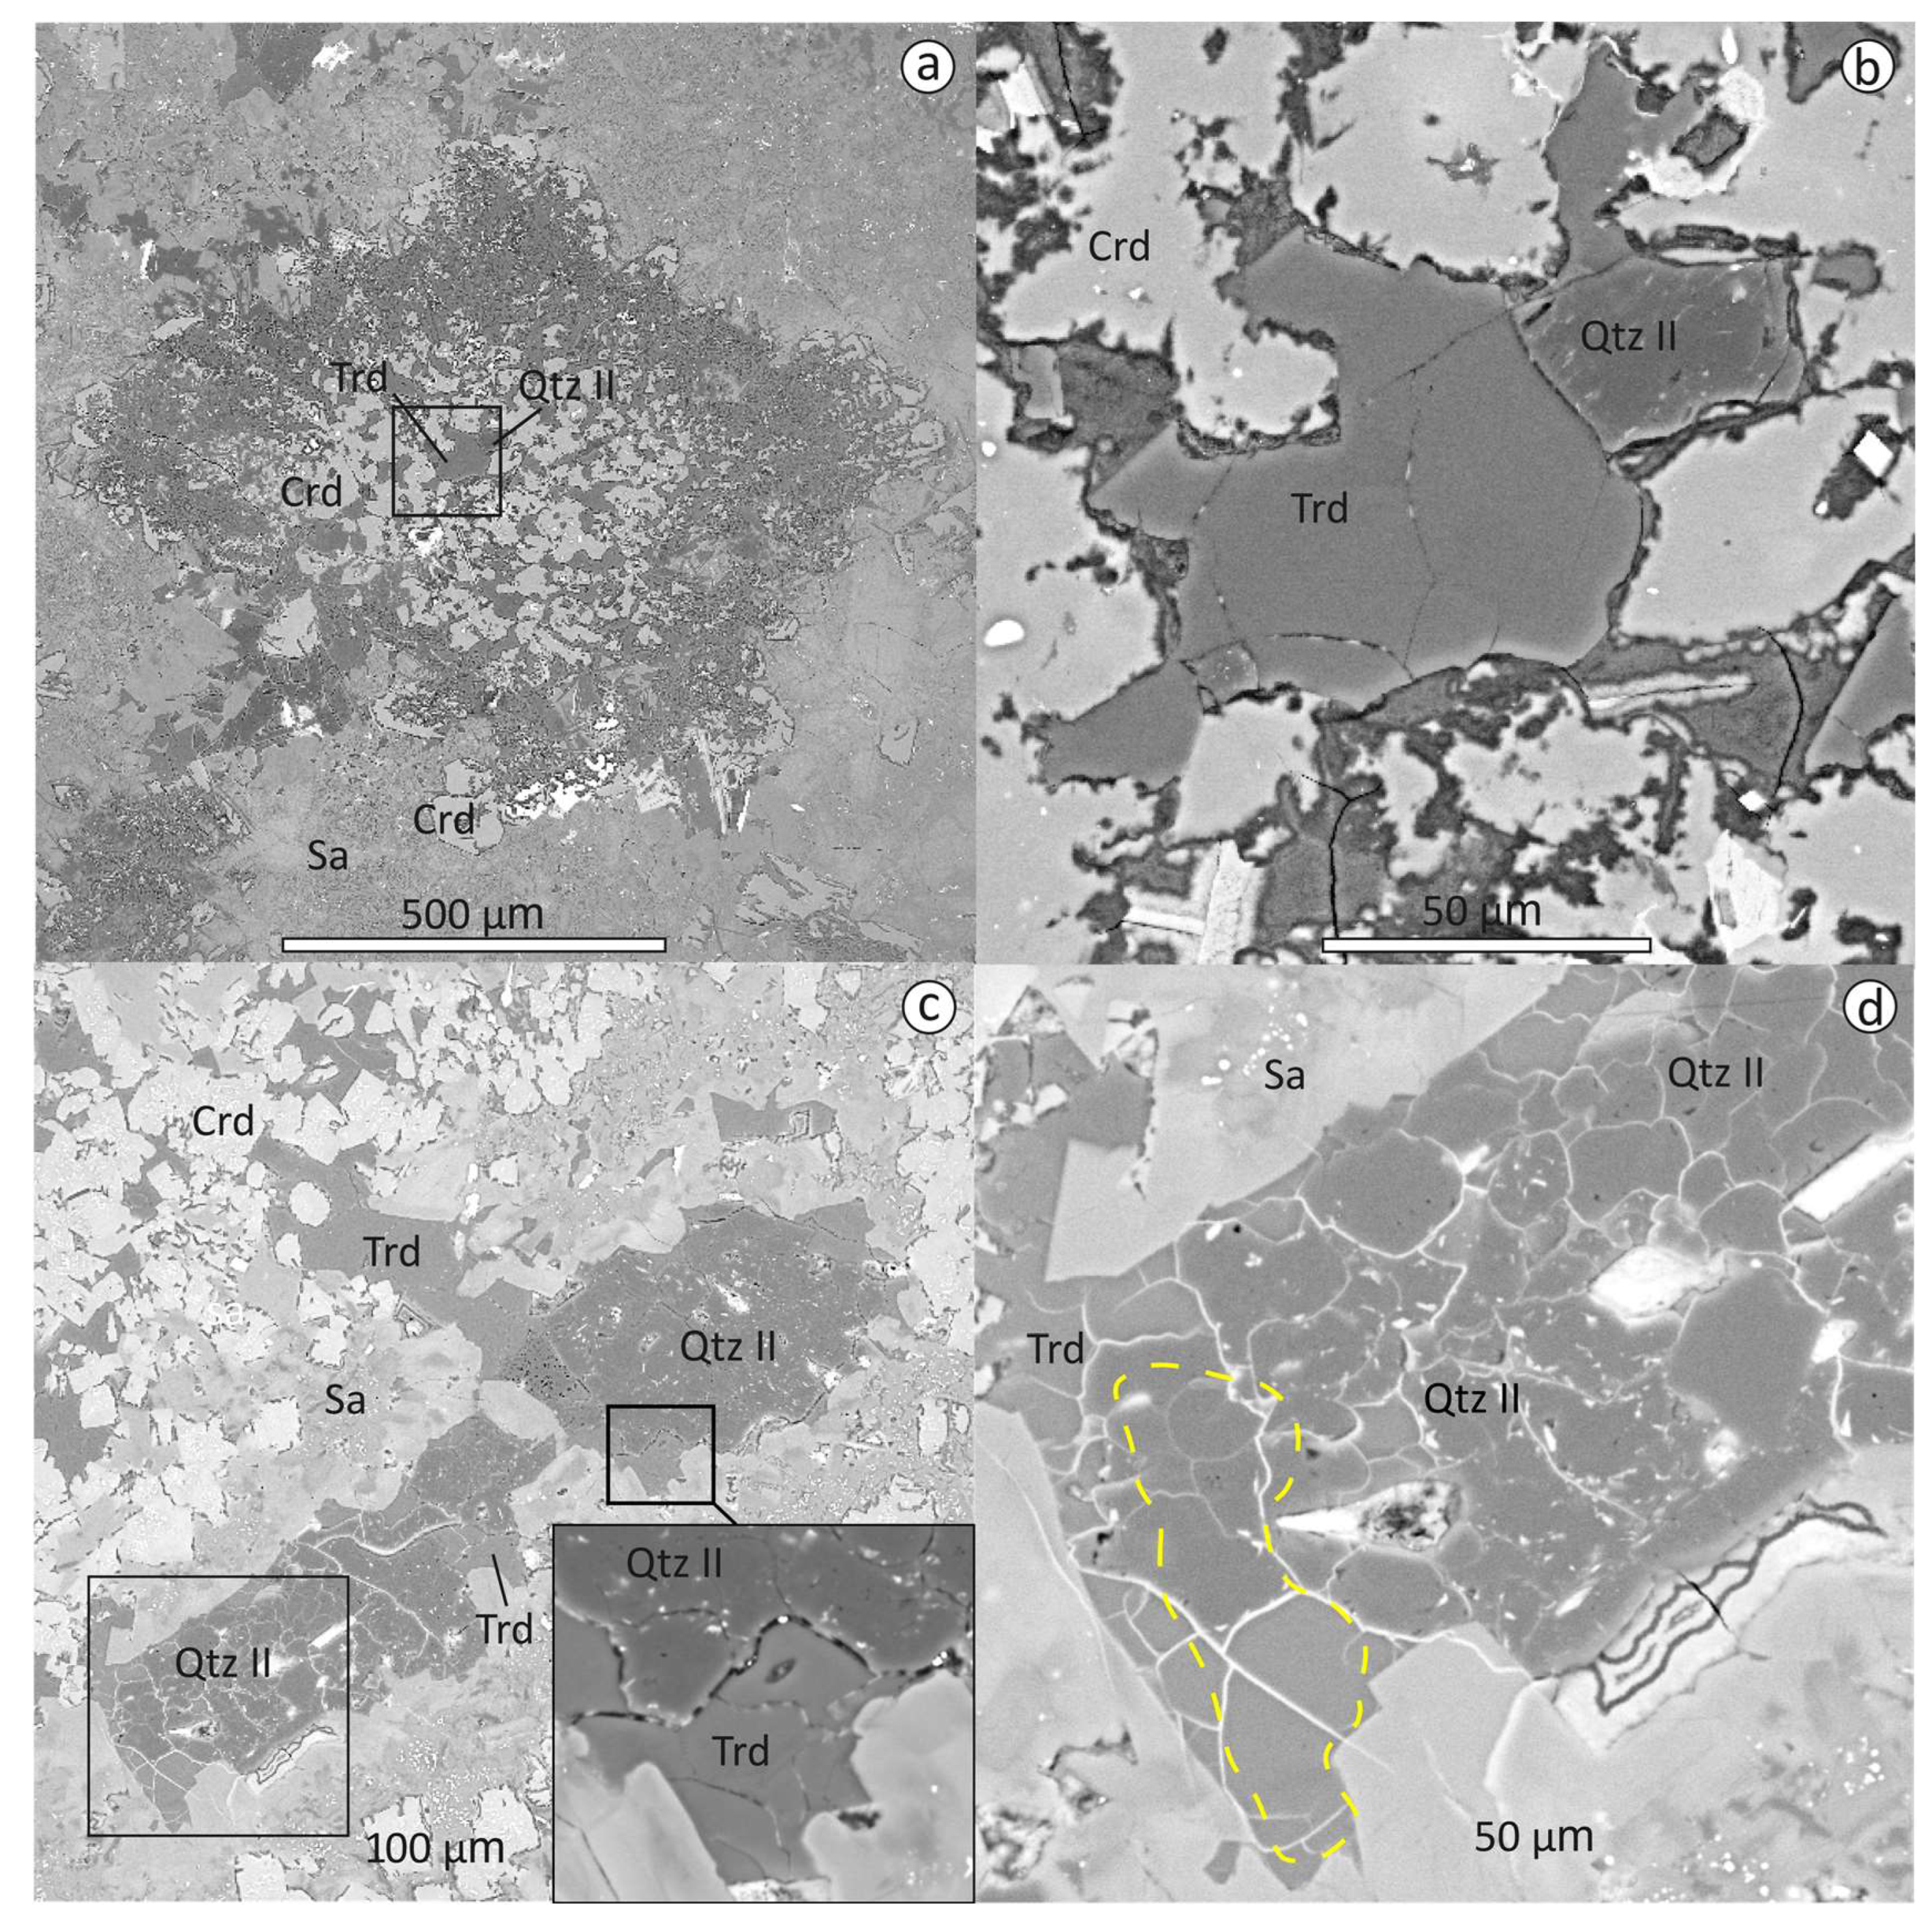
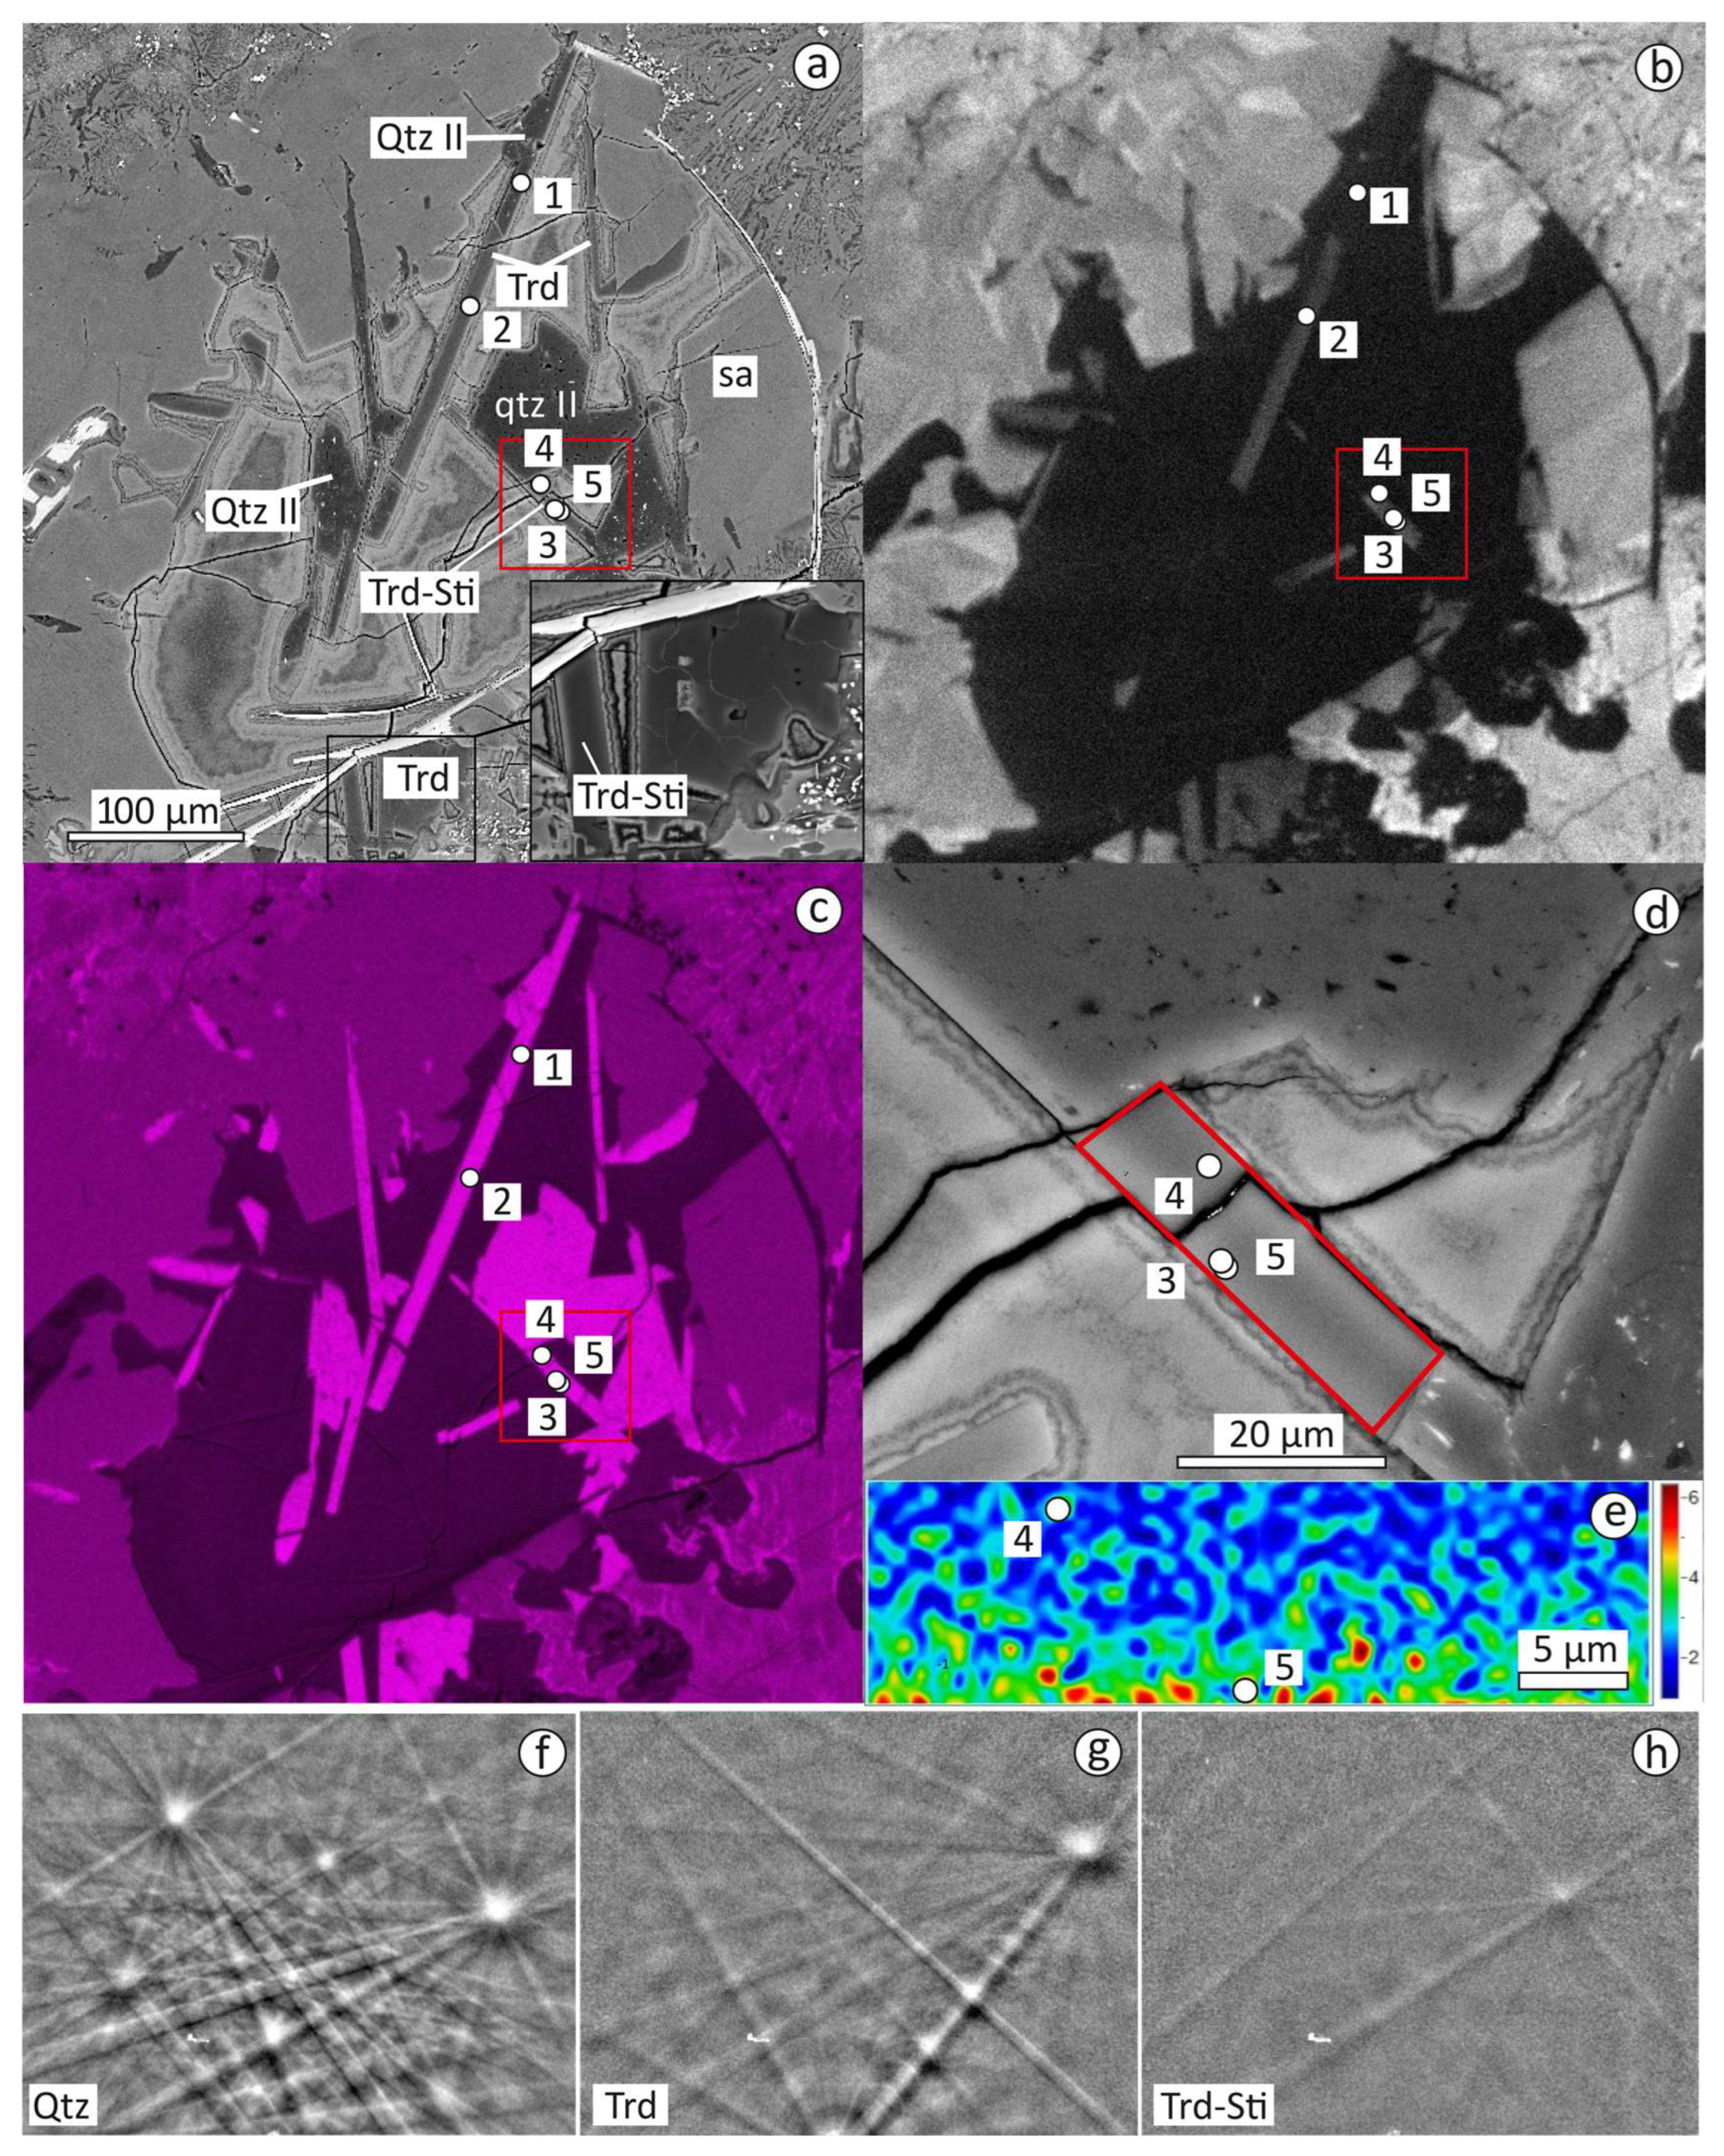
3.2. Textural Relationships of Tridymite, Cristabolite and Quartz

Cristobalite forms phenocrysts and micropegmatite intergrowths with sanidine (Figure 2a–d). It present in paragenesis with tridymite (Figure 2e,f). Cristobalite grains fractured and have an intergranular space filled with sanidine. In CL images, cristobalite appears darker than tridymite (Figure 2f).
Figure 2. BSE (ae) and CL (f) images of cristobalite occurrences with quartz (Qtz I) (cf) and tridymite (e,f). Qtz—quartz, Trd—tridymite, Sa—sanidine, Crd—cordierite, Gl—glass. The blue outline shows the boundaries of cristobalite (a,b,e), the red outline shows the boundaries of quartz (c,d). The black square in (e) shows the corresponding enlarged fragment. Red arrows point to boundary of ballen tridymite.
Minerals 13 00686 g002
Tridymite is present as acicular or lamellar grains formed in cavities or among sanidine (Figure 3a–d), and as irregular isometric grains filling the space between cordierite and sanidine, together with cristobalite (Figure 2e,f) or quartz (Figure 3e,f). Tridymite also forms grains with a ballen-like texture. Ballen tridymite is observed in thermally decomposed cordierite grains (Figure 4a,b), as well as in quartz-tridymite ballen aggregates (Figure 4c,d). The enlarged inset (Figure 2e) shows ballen-like aggregates of tridymite next to a glass fragment. Tridymite appears brighter than quartz in BSE and CL images (Figure 3a–c and Figure 4b,d).
Quartz replaces cristobalite and tridymite, and it inherits the texture of cristobalite (Qtz I) (Figure 2a,b) and tridymite (Qtz II) (Figure 3a–d). Quartz after cristobalite and tridymite in BSE does not look smooth and uniform. Quartz with ballen texture is also present (Figure 2d and Figure 3e,f). Quartz (Qtz I, Qtz II and ballen quartz) contains a large number of pores and mineral inclusions. Homogeneous quartz is also observed. Tridymite and cristobalite are usually preserved at the edges of the grains, while their central parts are represented by quartz (Figure 2a,b, Figure 3e,f and Figure 4c,d).
Figure 3. BSE images (a,cf) and CL images (b) of tridymite (Trd) with quartz (Qtz II). Black square in (e) shows the contour of the enlarged fragment (f). Qtz—quartz, Trd—tridymite, Sa—sanidine, Crd—cordierite, Ilm—ilmenite.
Minerals 13 00686 g003
Figure 4. BSE images of ballen tridymite (Trd) with ballen quartz (Qtz II). The black square (a,c) shows contours of enlarged fragments (b,d), respectively. Yellow dotted line (d) shows the EBSD mapping region (Figure 5). Qtz—quartz, Trd—tridymite, Sa—sanidine, Crd—cordierite.
Minerals 13 00686 g004

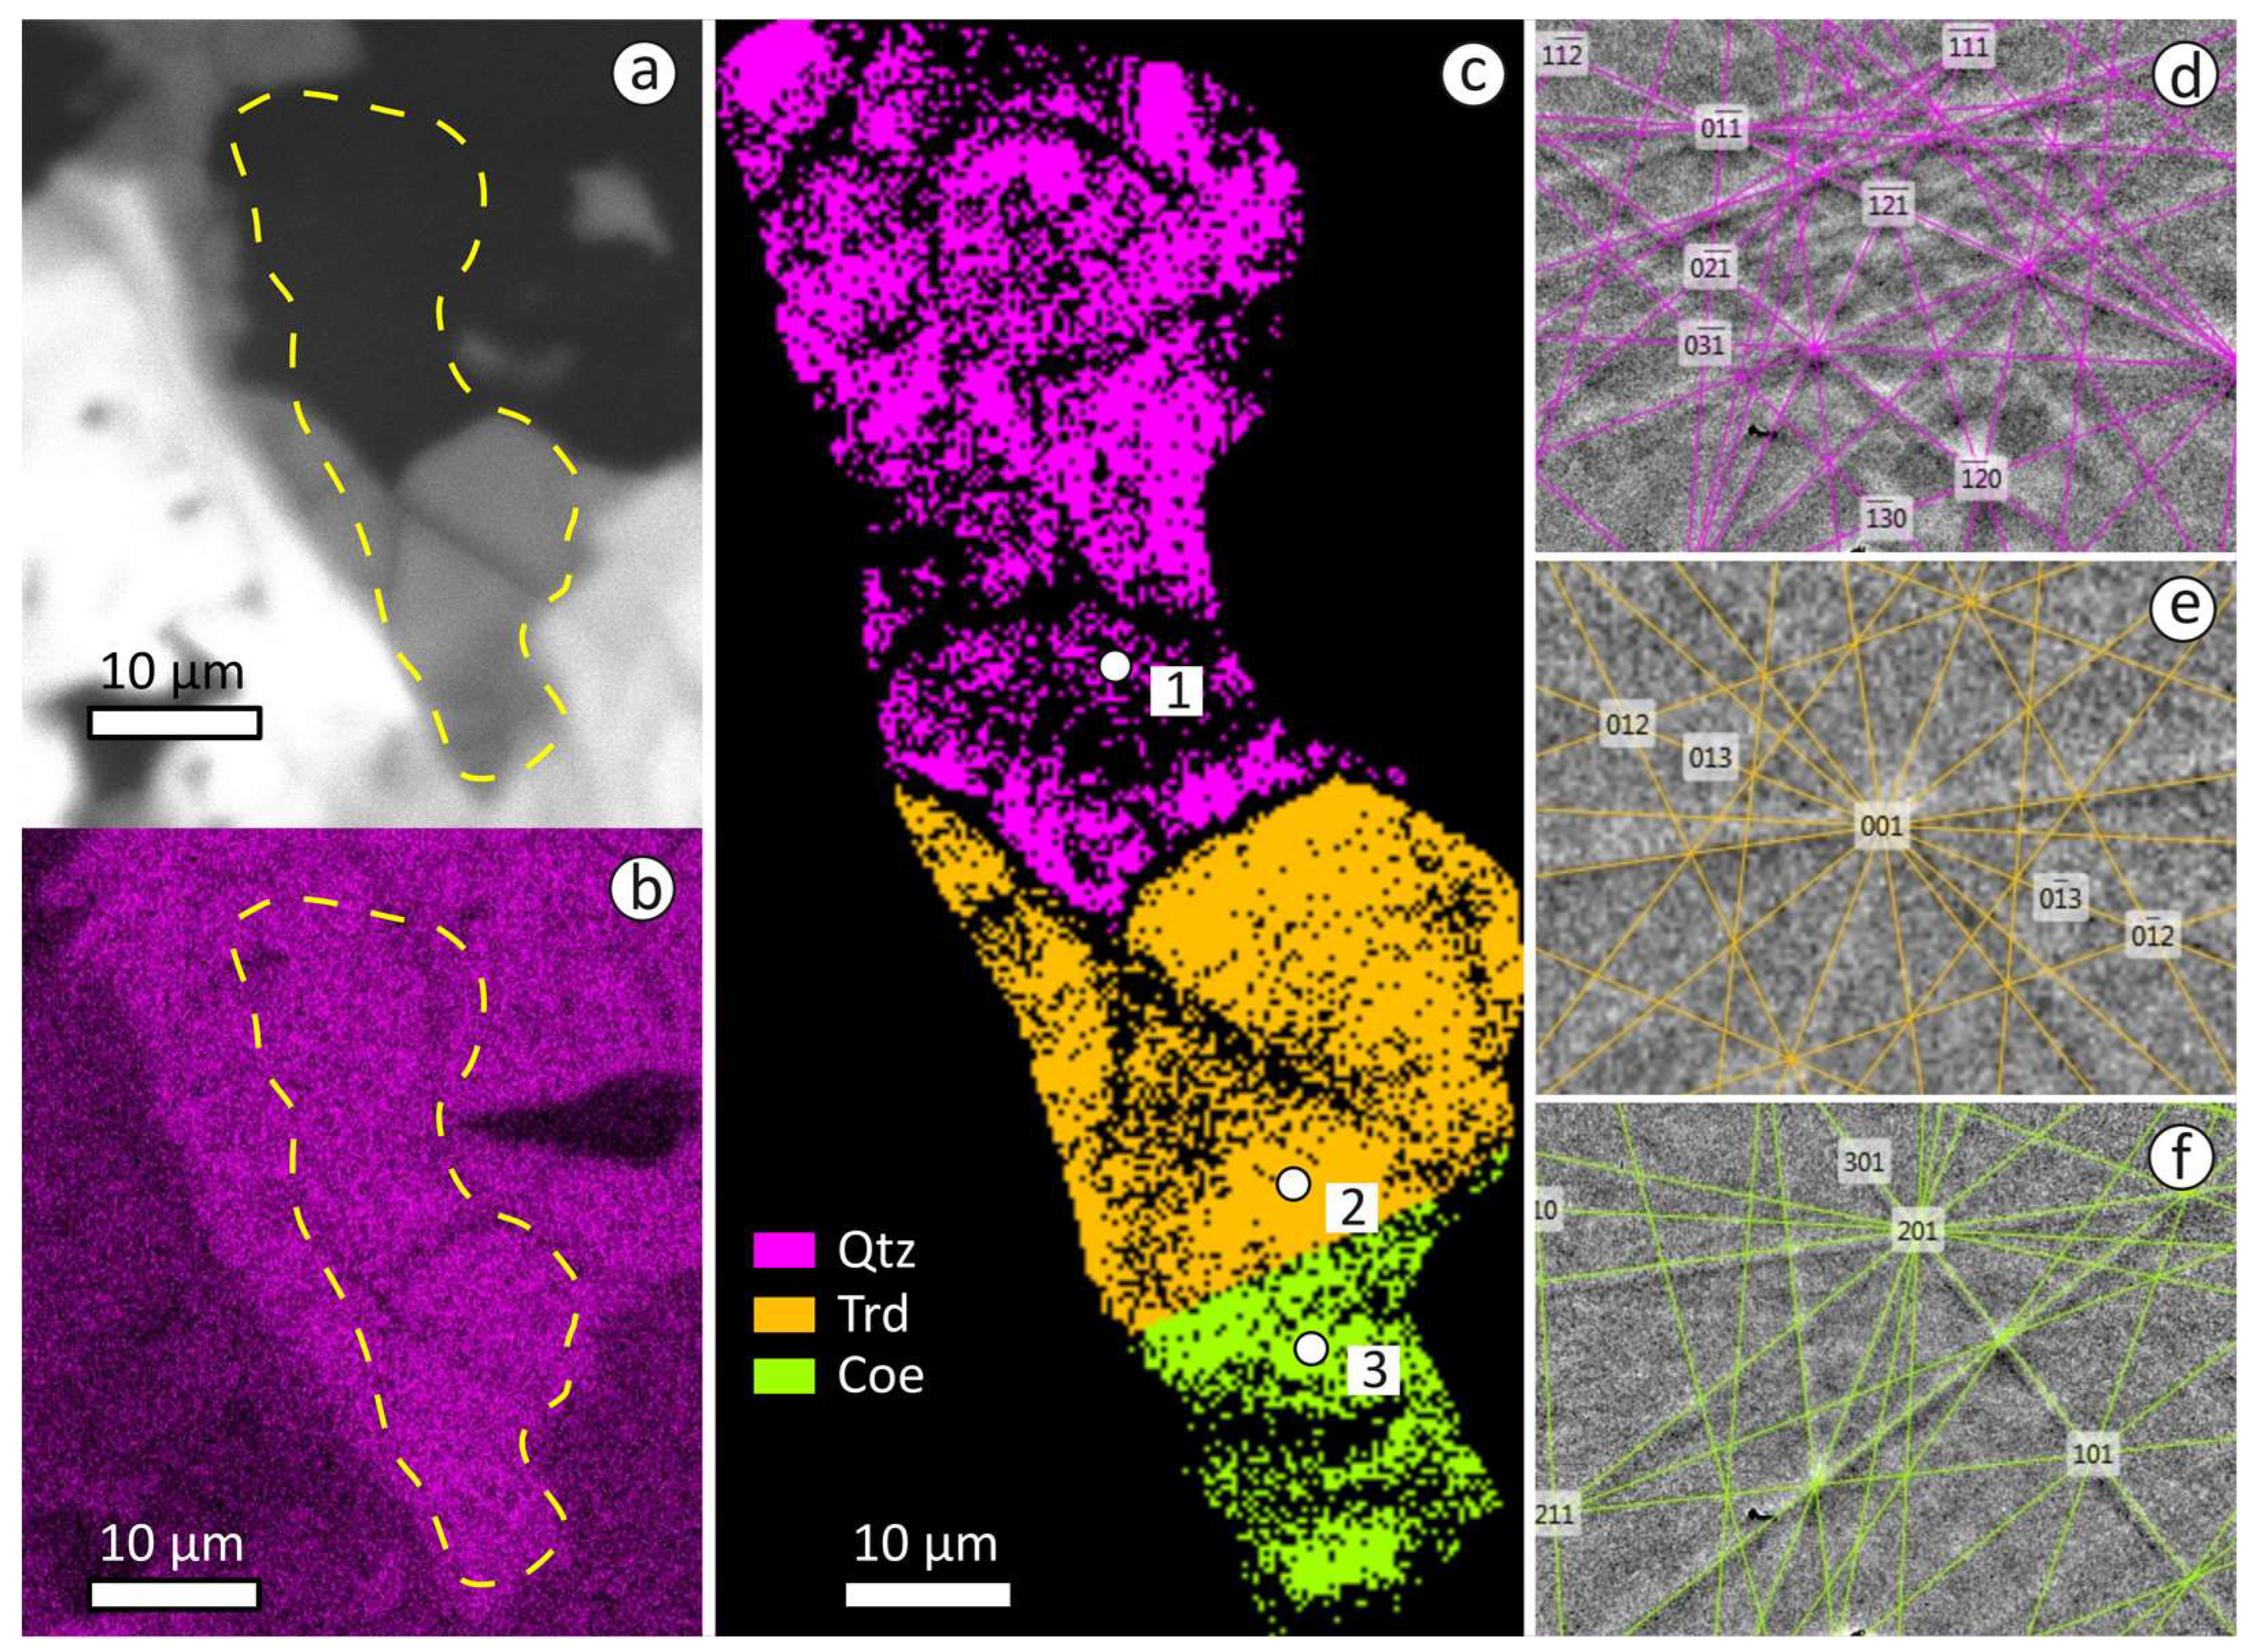
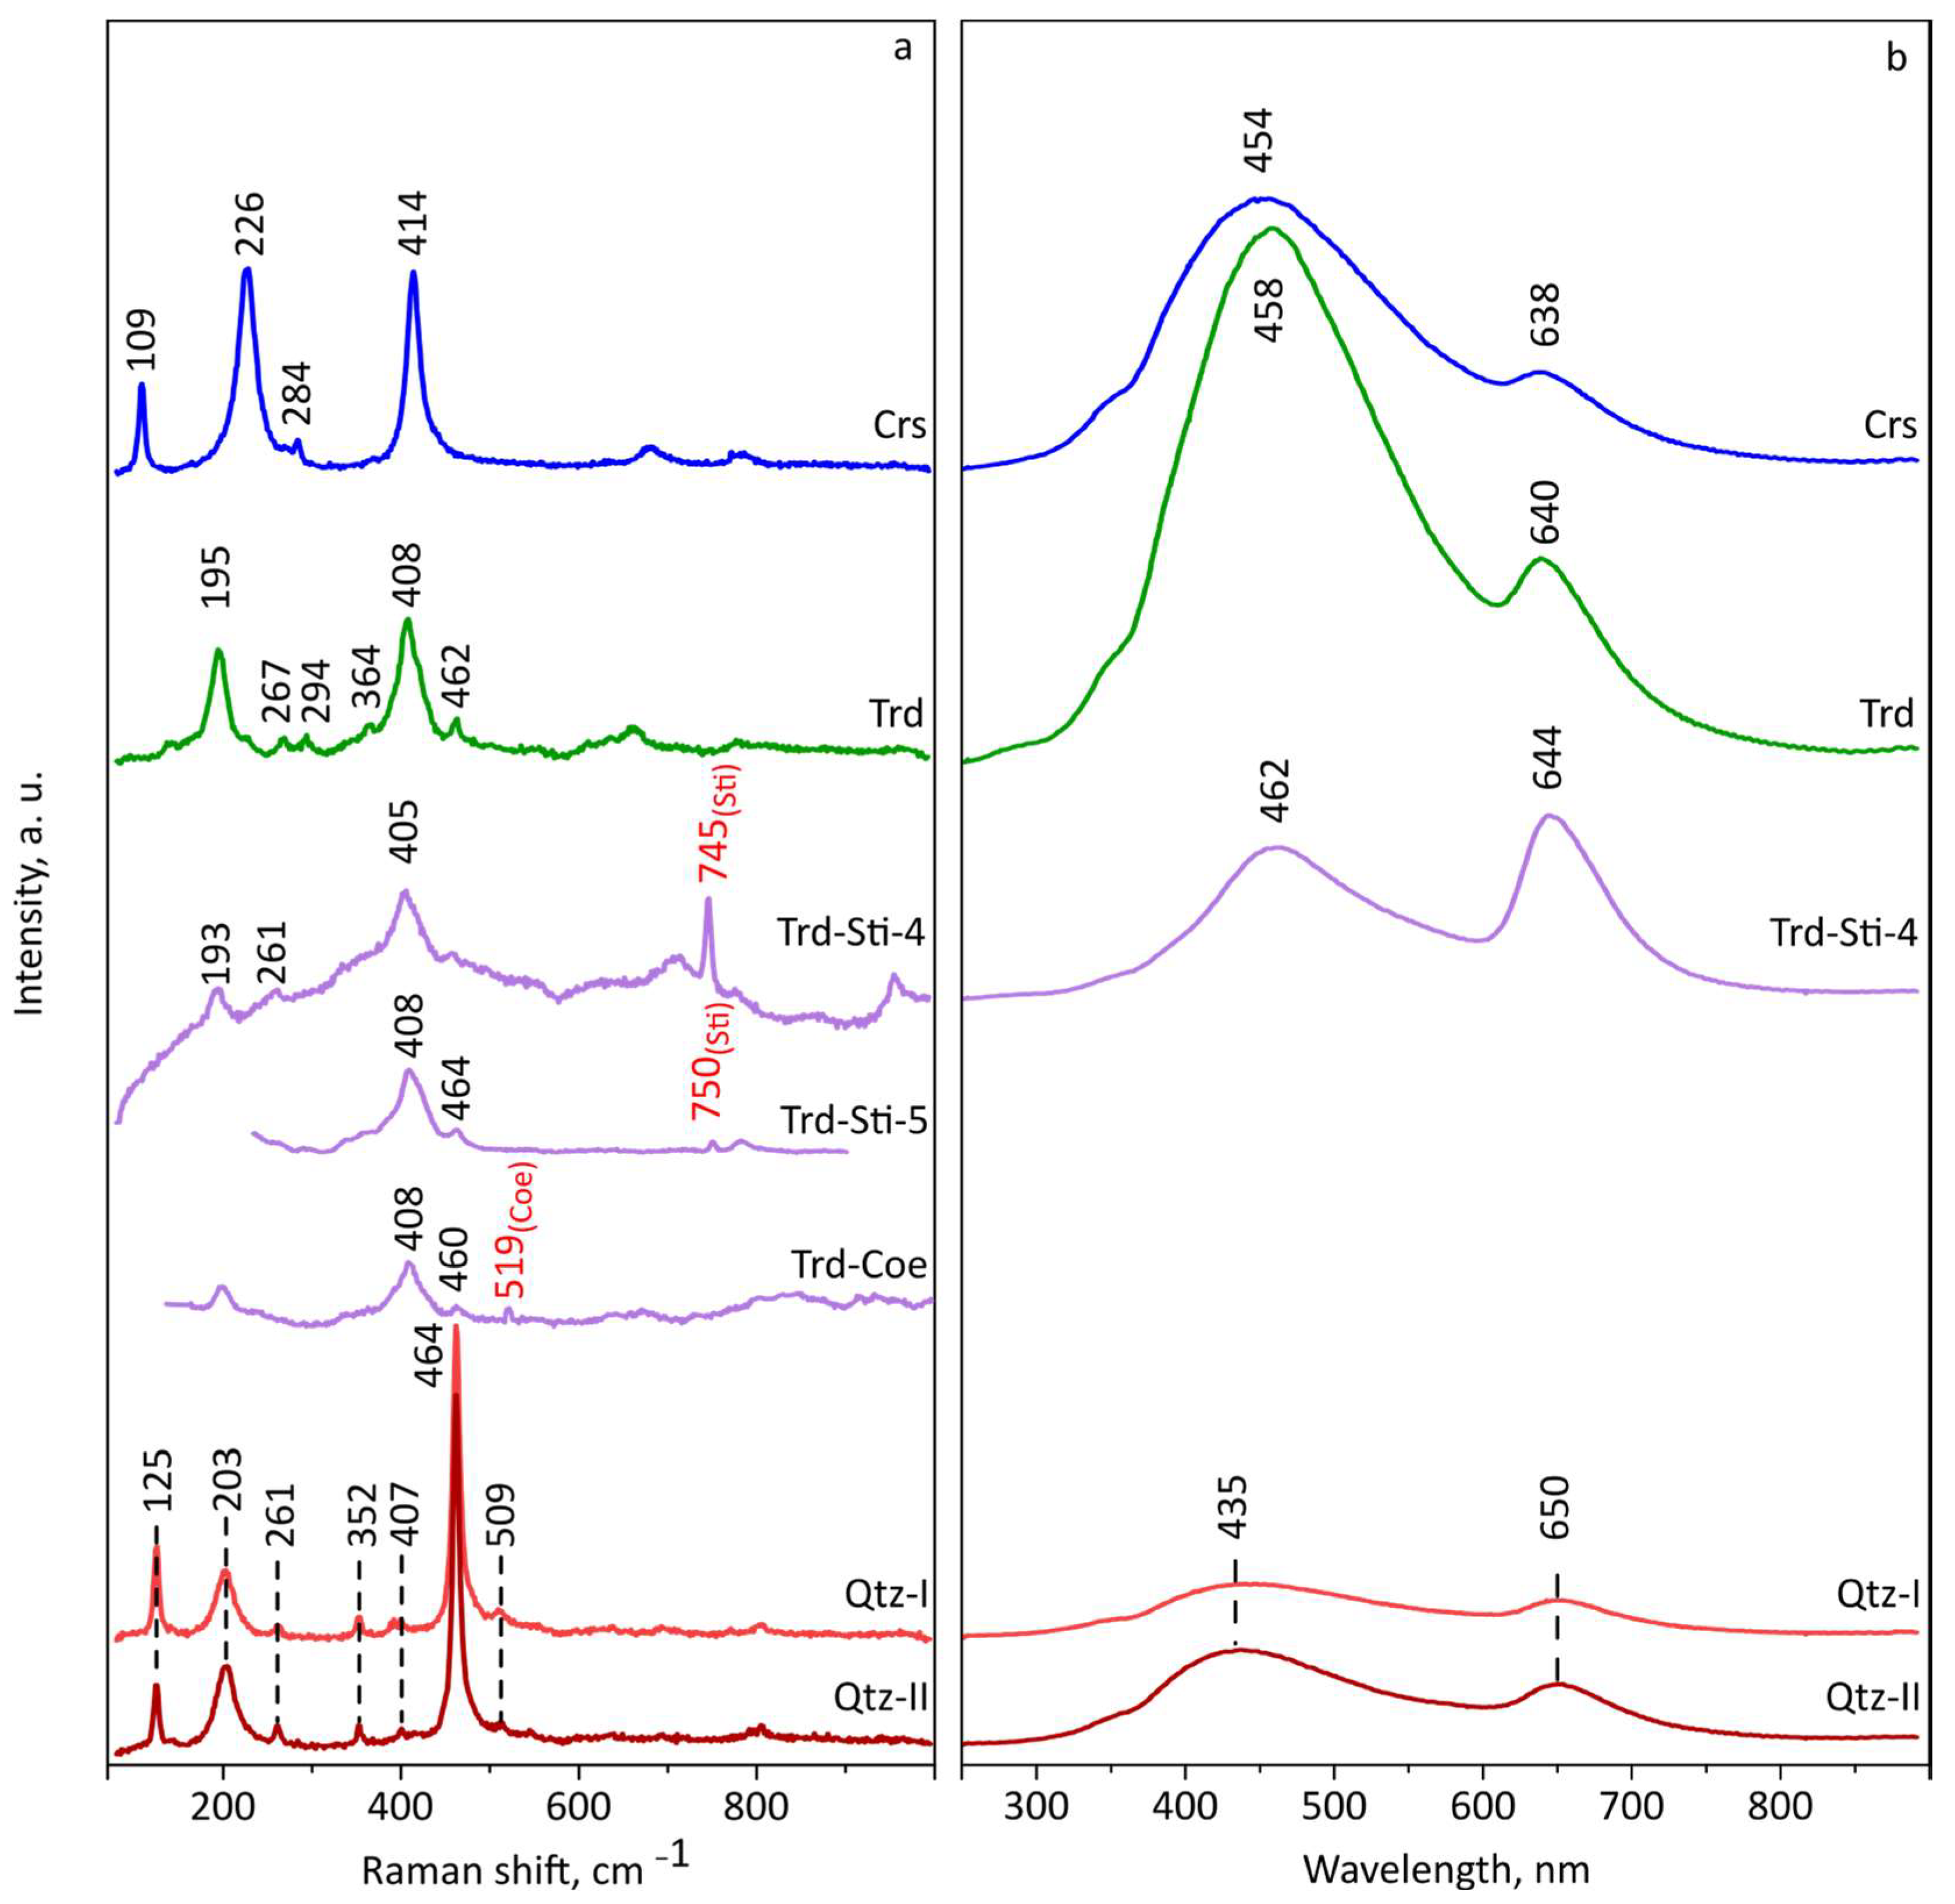
3.3. EPMA Data, Raman and CL Spectra of Tridymite, Cristobalite, Quartz, Traces of Stishovite and Coesite

The results of EPMA show that cristobalite (Figure 2c) contains up to 3.21 wt.% Al2O3, 0.51 wt.% FeO, 1.08 wt.% K2O, 0.52 wt.% Na2O, 0.19 wt.% CaO and 0.14 wt.% TiO2 (Table 1). Tridymite (Figure 2a) contains up to 1.38 wt.% Al2O3, 0.72 wt.% FeO, 0.17 wt.% Na2O and 0.12 wt.% TiO2. Quartz (Qtz I) coexisting with cristobalite (Figure 2d) contains up to 0.94 wt.% Al2O3, 0.86 wt.% FeO, 0.15 wt.% K2O, 0.14 wt.% Na2O, 0.17 wt.% CaO and 0.14 wt.% MgO. Quartz (Qtz II) coexisting with tridymite (Figure 2a) contains up to 1.62 wt.% Al2O3, 0.92 wt.% FeO, 0.42 wt.% K2O, 0.25 wt.% Na2O, 0.20 wt.% CaO and 0.30 wt.% MgO. Among the non-formula elements in cristobalite, tridymite and paramorphoses of quartz after cristobalite and tridymite, there are Al2O3, FeO and Na2O, and, to a lesser extent, K2O. At the same time, Al2O3 is the most abundant in cristobalite, and FeO is the highest in tridymite and in quartz paramorphoses after tridymite (Qtz II), while it appears sporadically in cristobalite. Na2O appears in all SiO2 polymorphs at an average of approximately 0.11 wt.%. CaO and MgO are present to a greater extent in cristobalite, while these almost undetectable in tridymite. Cristobalite and quartz demonstrate the deficiency of the totals up to 5%.
Raman spectra of cristobalite are represented by typical bands at 109, 226 and 414 cm−1 corresponding to α-cristobalite (Figure 6a). Raman bands of tridymite have average positions at 193–195, 261, 405–408 and 460–464 cm−1. These spectra correspond to α-tridymite (orthorhombic modification) [34]. Certain spectra of tridymite show only one band at 405–408 cm−1 instead of a doublet near 402 and 418 cm−1 (Figure 6a). This is probably due to band broadening or crystal structure orientation effects. According to the Raman spectroscopy data, spectra in quartz are represented by bands at 125, 203, 261, 352, 407, 464 and 509 cm−1 corresponding to α-quartz (Figure 6a).
In certain grains of tridymite, a stishovite Raman band at 746–751 cm−1 appears (Figure 7). BSE and CL imaging, as well as Si elemental mapping (Figure 7a–c), show that the tridymite grain contains no other mineral inclusions and is composed of silica. No silica modification besides stishovite exhibits Raman bands at 746–751 cm−1. Raman mapping of this grain shows that the intensity of the stishovite Raman band relative to the noise is higher in the lower part of the grain, and the tridymite Raman band is more intense in the upper part (Figure 7e). Tridymite is surrounded by glass (Figure 7c,d), which has been replaced by a mixture of chlorite (chamosite) and quartz, confirmed by the EDS analysis and Raman spectroscopy. Raman spectrum consists of multiple bands (129, 190, 209, 260, 431, 464, 545, 705 cm−1), where lines 129, 209, 260 and 464 cm−1 correspond to quartz, and 190, 545 and 705 cm−1 to chamosite. Spectrum of glass has no any Raman bands at ~751 cm−1. This means that Raman bands at 745 and 750 cm−1 of stishovite spectra 4 and 5 (Figure 6a) could not be appeared due to the surrounding minerals. For quartz, tridymite and tridymite with trace stishovite, the diffraction Kikuchi patterns were captured (Figure 7f–h). In contrast to the grains of quartz (Figure 7f) and tridymite (Figure 7g), where the diffraction patterns produce a good contrast, the grain of tridymite with stishovite (Figure 7h) exhibits a blurred Kikuchi pattern related to a weak recrystallization and/or a mixture of nanosized phases [35]. Tridymite with low crystallinity can contain a nanosized marticles of stishovite and silica glass.
The region of tridymite (Figure 6a) containing a weak Raman band at 519 cm−1 representing coesite was studied using SEM (Figure 5). Distribution EDS map (Figure 5b), CL images (Figure 5a) and BSE images (Figure 4d) showed at least three silica phases in this region. Quartz was uniquely identified at the top of the EBSD map (Figure 5d). The Kikuchi patterns at the bottom of the map were weak against the noise background and suggested coesite and tridymite presence (Figure 5e,f). Most likely, this is due to the low degree of crystallinity or mixed phase composition. Automated indexing of the diffraction Kikuchi patterns in the region showed the presence of tridymite and coesite with a significant amount of incorrect indexing. In order to improve the indexing of the Kikuchi patterns of coesite in this map, we created five crystallographic files of coesite with different lattice parameters. Parameters a, b and c were chosen in the regions from 6.60 to 7.10 Å, 11.80–12.40 Å and 6.80–7.20 Å, following the work described in [36]. The best correspondence of coesite in the EBSD map was matched the following parameters: a~6.80, b~12.30 and c~7.10 Å.
Panchromatic CL images show that tridymite and cristobalite had a high CL intensity (Figure 2, Figure 3, Figure 4 and Figure 7). In contrast, quartz with mineral inclusions looked dark in CL images. Grains of tridymite and cristobalite were heterogeneous in terms of luminescence brightness. The CL spectra of cristobalite (Figure 2c,d) were represented by two broad peaks at 454 (main) and 638 nm (Figure 6b). The CL spectra of quartz (Qtz I) coexisting with cristobalite exhibited peaks of lower intensity at 435 nm and 650 nm. The CL spectra of tridymite (Figure 4a,b) were represented by two broad peaks at 458 (major) and 640 (minor) nm, and coexisting quartz (Qtz II) exhibited CL emission lines at 435 nm and 650 nm.
The highest intensity of the CL spectra was observed in tridymite. We found no relationship between the intensity of the CL spectra and Al2O3 and FeO concentrations in tridymite, but the CL intensity decreased with the increase in Na2O content. The CL intensity in quartz and cristobalite decreased with an increase in the content of Na2O and Al2O3, while no relationship with the FeO content was found.
The CL spectra of the studied tridymite and cristobalite strongly varied in intensity and color of the glow, dominated by blue light (450–460 nm). Tridymite had a brighter blue luminescence. Tridymite including stishovite, had a high intensity peak of 644 nm in comparison with 462 nm. This feature can be used to distinguish tridymite from a stishovite phase by the color or spectra of cathodoluminescence.

4. Discussion

4.1. Tridymite, Cristabolite and Quartz Paramorphs Formation

Quartz retains the original form of the cristobalite or tridymite from which it replaced. Quartz paramorphs after cristobalite and tridymite contain abundant mineral inclusions and irregular voids (Figure 2a,b,d, Figure 3a,c,f and Figure 4b,d). The appearance of such texttural features were found in quartz after tridymite [21] and cristobalite [11]. Cristobalite, tridymite and quartz paramorphoses after cristobalite and tridymite contain significant amounts of the nonformula elements Al2O3, FeO and Na2O, and, to a lesser extent, K2O (Table 1). Quartz has a dense crystal structure with a low capacity for impurities, while cristobalite and tridymite have more open structures to include cations Al, Fe, Na, K and Ti [37]. Si4+ is usually replaced by Al3+ with the addition of Na+ or K+ in interstitial vacancies in tridymite and cristobalite [37]. Only a small number of impurity elements are included in the structure of quartz. The majority of these form micro and nanosize inclusions of other minerals, which is partially seen in BSE images (Figure 2, Figure 3 and Figure 4).
High-temperature modifications of cristobalite are stable at temperatures of 1470–1726 °C [2,38]. The presence of Na and K decreases the crystallization temperature compared to pure SiO2, while Na more effectively stabilizes cristobalite and tridymite [39]. In situ experimental measurements show, when heating quartz with the addition of K and Na that cristobalite is always formed first, and then tridymite develops afterwards [39]. The transformation of tridymite and cristobalite to quartz is accompanied by structural rearrangement and decrease in volume, which can contribute to formation of irregular voids and cracks in quartz. Microporosity can appear in the process of dissolution –reprecipitation in the presence of a liquid phase, when not only is the decrease in the volume of the crystal affected but also the solubility of the initial phases if the original crystal dimensions are preserved [40]. Firstly, if the product has a smaller molar volume than the parent, then some porosity must result. Secondly, the solubility of the more stable phase will be lower than that of a metastable phase. Thus, more solid will be dissolved than reprecipitated, resulting in a porosity [40].
The observed microporosity and high content of non-formula elements in quartz paramorphs may indicate a similar formation mechanism due to dissolution-reprecipitation. Mineral inclusions in quartz form because the latter has a low capacity for impurities.
Quartz cathodoluminescence is fairly well covered in the literature [41,42,43,44], while enough information has not yet been accumulated for cristobalite and tridymite. Due to structural differences, silica modifications exhibit different luminescence properties [45]. Both Qtz-I and Qtz-II show a luminescence of a blue-green color, with a predominance of blue glow. Blue radiation of ~450 nm in quartz is associated with oxygen vacancies (ODCs) (O-deficient centers). This band is manifested in quartz of igneous and metamorphic rocks [46]. An emission of ~650 nm is associated with non-bonded oxygen-hole centers (NBOHC) [43,44]. The intensity of this peak in Qtz-II is higher compared to Qtz-I, which may indicate a higher defect concentration.
The CL spectra of tridymite and cristobalite of lunar rocks are dominated by a broad band centered at ~500 nm [47]. The luminescence spectra of cristobalite and tridymite for volcanic rocks have peaks at 400 and 430 nm, both of which can be attributed to defects [AlO4/M+]0 [48]. For volcanic cristobalite, which is a product of chemical vapor deposition, the cathodoluminescence spectrum has a peak at 459 nm [49], characteristic of cristobalite. The latter spectra are closest to the spectra obtained for tridymite and cristobalite of the impactites from the Jänisjärvi impact structure (450–460 nm and 640 nm).

4.2. Traces of Stishovite and Coesite in Tridymite

The solid-state transformation of cristobalite and tridymite into quartz is energetically unfavorable, since it is associated with the decay and transformation of the Si–O framework, which requires a high-energy activation [50,51,52]. This requires the catalytic action of water, as well as maintaining high temperatures while cooling slowly [53], whereas rapid quenching is necessary for the preservation of tridymite and cristobalite [2]. Traces of stishovite and coesite were detected in weak Raman bands at 746–750 cm−1 and 519 cm−1, respectively, in the Raman spectrum of tridymite (Figure 6a). The Kikuchi patterns suggest a partially amorphous state of tridymite. This is consistent with the fact that stishovite and coesite usually form nanosized crystals or polycrystalline aggregates in silica glass, either in diaplectic glass or in shock veins or pockets [54]. In impactites, quartz melts under shock compression. Coesite and stishovite crystallized from the melt, forming tiny crystals upon rapid cooling [54]. The appearance of traces of stishovite in tridymite indicates a state between the onset (12–14 GPa) and completion (30–40 GPa) of the phase transition, when a mixture of low-pressure and high-pressure silica polymorphs is formed: quartz + amorphized quartz + stishovite [55,56].

4.3. Formation of Ballen Textures

In [26], quartz ballen aggregates were studied and various types of domains (A and B) were distinguished. No other minerals were found in ballen silica. Domain A regions have a porous structure and contain Al2O3 (up to 0.88 wt.%) and FeO (0.33 wt.%), while domain B regions are characterized by a microblock structure and a high content of Al2O3 (up to 4.56 wt.%), FeO (6.43 wt.%) and MgO (2.12 wt.%) in individual ballen. The formation mechanism of both domain types remains poorly understood. In the present study, it was found that, in addition to cristobalite and quartz, tridymite can also form ballen texture. The sample contained quartz–tridymite aggregates (Figure 4c,d), where tridymite was preserved in the marginal regions of the grains. Tridymite in contact with glass also has a ballen texture (Figure 2e). Quartz paramorphoses after tridymite had a ballen-like texture in certain regions (Figure 3f). According to [19], the formation of ballen texture in impactites can occur in two ways: (i) solid–solid transition from α-quartz to diaplectic quartz glass, then through β → α transition of cristobalite or quartz; (ii) solid–liquid transition from quartz to lechatelierite followed by nucleation and crystal growth at a high temperature.
Presumably, both of these mechanisms were involved in the formation of domains A and B in ballen quartz. Domain A regions are similar in texture and chemical composition to quartz paramorphoses after tridymite and cristobalite (Table 1) [26]. Their formation likely occurred through the transition to diaplectic quartz glass, and then through the transition of high-temperature modifications of tridymite and cristobalite to low-temperature ones. In contrast, the formation of domain B regions occurred during the melting of quartz together with inclusions of femic minerals and during crystallization by nucleation. At the same time, Al2O3, FeO and MgO were forced out into the intergranular space.

4.4. The Formation Sequence of Silica Polymorphs

Silica polymorphs in impact melt rock from the Janisjärvi structure are presented by tridymite, cristobalite, quartz, trace stishovite and coesite. A schematic representation of the sequence and conditions for the formation of silica polymorphs is shown in Figure 8. Below, we explain the mechanisms of silica polymorphs formation.
During shock compression, temperatures were high enough to melt quartz (A stage, Figure 8); at hot spots, coesite and stishovite locally crystallized from the melt (B stage, Figure 8). With a drop in pressure and maintaining high temperatures (more than 900 °C), cristobalite and tridymite were the main silica phases crystallized from the melt (C stage, Figure 8). It is assumed that cristobalite crystallized first, and tridymite probably appeared on cristobalite nuclei [39]. Coesite and stishovite transformed into tridymite, but upon rapid quenching, the phase transition was incompletely, and a mixture of tridymite with amorphous silica and stishovite/coesite was formed (C stage, Figure 8). Cristobalite and tridymite transformed to low-temperature modifications after the temperature had dropped below 270 °C. Since the temperature and rate of the β → α transition of cristobalite depend on the size, structure and composition of the crystal [3], it is assumed that the transition did not occur simultaneously. Sufficiently rapid cooling and low water content prevented the complete transformation of tridymite and cristobalite into quartz. (D stage, Figure 8).

5. Conclusions

The mineralogical composition of silica polymorphs (cristobalite, tridymite, quartz and trace stishovite and coesite) coexisting in impact melt rocks from the Janisjärvi impact structure has been studied as a continuation of a previously published work devoted to ballen quartz [26]. All silica polymorphs were found in samples from the Janisjärvi impact structure (quartz, tridymite, cristobalite, stishovite and coesite) using SEM-EBSD and Raman spectroscopy. The cathodoluminescence (CL) spectra of silica polymorphs differ significantly in the overall brightness and the intensity ratio of the two bands at positions 435–462 nm and 638–650 nm. Silica polymorphs can be expressly detected in panchromatic CL images by differing brightness.
The appearance of trace stishovite and coesite in tridymite suggests its formation at high pressures up to 40 GPa. The quenching of the tridymite with stishovite and coesite inclusions likely occurred between the beginning and the end of the phase transformation of stishovite and coesite to tridymite, during which a mixture of high-pressure and low-pressure silica phases appeared. Cristobalite crystallized at a temperature higher than 900 °C, which was facilitated by the presence of Na and K in the melt. Then, tridymite appeared in places of cristobalite location. Further, sufficiently rapid cooling and low water content prevented the complete transformation of tridymite and cristobalite into quartz.

Author Contributions

Conceptualization, D.A.Z. (Daria A. Zamiatina) and D.A.Z. (Dmitry A. Zamyatin); formal analysis, G.B.M. and N.S.C.; funding acquisition, D.A.Z. (Dmitry A. Zamyatin); investigation, D.A.Z. (Daria A. Zamiatina), D.A.Z. (Dmitry A. Zamyatin), G.B.M. and N.S.C.; methodology, D.A.Z. (Dmitry A. Zamyatin), G.B.M. and N.S.C.; project administration, D.A.Z. (Dmitry A. Zamyatin); supervision, D.A.Z. (Daria A. Zamiatina) and D.A.Z. (Dmitry A. Zamyatin); writing—original draft, D.A.Z. (Daria A. Zamiatina); writing—review and editing, D.A.Z. (Daria A. Zamiatina) and D.A.Z. (Dmitry A. Zamyatin). All authors have read and agreed to the published version of the manuscript.

Funding

The authors are grateful to government assignment No. AAAA-A19-119071090011-6 for IGG UB RAS, supported by the Ministry of Science and Higher Education of the Russian Federation. This study was carried out in IGG UB RAS, using the Geoanalitik shared research facilities. The re-equipment and comprehensive development of the Geoanalitik was supported by the Ministry of Science and Higher Education of the Russian Federation (Agreement No. 075-15-2021-680).

Data Availability Statement

Not applicable.

Acknowledgments

The authors are grateful to reviewers and editors for their constructive comments that improved this manuscript. The authors are grateful to V.A. Bulatov for help with the EPMA measurements.

Conflicts of Interest

The authors declare no conflict of interest.

References

  1. Stöffler, D.; Hamann, C.; Metzler, K. Shock metamorphism of planetary silicate rocks and sediments: Proposal for an updated classification system. Meteorit. Planet. Sci. 2018, 53, 5–49. [Google Scholar] [CrossRef]
  2. Heaney, P.J.; Prewitt, C.T.; Gibbs, G.V. (Eds.) Silica: Physical Behavior, Geochemistry, and Materials Applications; Walter de Gruyter GmbH & Co KG.: Washington, DC, USA, 2018; Volume 29, 605p. [Google Scholar]
  3. Damby, D.E.; Llewellin, E.W.; Horwell, C.J.; Williamson, B.J.; Najorka, J.; Cressey, G.; Carpenter, M. The α–β phase transition in volcanic cristobalite. J. Appl. Crystallogr. 2014, 47, 1205–1215. [Google Scholar] [CrossRef] [PubMed]
  4. Swanson, S.E.; Naney, M.T.; Westrich, H.R.; Eichelberger, J.C. Crystallization history of Obsidian dome, Inyo domes, California. Bull. Volcanol. 1989, 51, 161–176. [Google Scholar] [CrossRef]
  5. Martel, C.; Bourdier, J.-L.; Pichavant, M.; Traineau, H. Textures, water content and degassing of silica andesites from recept plinian and dome-forming eruption at Mount Pelee volcano (Martinique, Lesser Antilles arc). J. Volcanol. Geotherm. Res. 2000, 96, 91–206. [Google Scholar] [CrossRef]
  6. Watkins, J.; Manga, M.; Huber, C.; Martin, M. Diffusion-controlled spheru lite growth in obsidian inferred from H2O concentration profiles. Contrib. Mineral. Petrol. 2009, 157, 163–172. [Google Scholar] [CrossRef]
  7. Horwell, C.J.; Williamson, B.J.; Llewellin, E.W.; Damby, D.E.; Le Blond, J.S. The nature and formation of cristobalite at the Soufrière Hills volcano, Montserrat: Implications for the petrology and stability of silicic lava domes. Bull. Volcanol. 2013, 75, 696. [Google Scholar] [CrossRef]
  8. Davydova, V.O.; Shcherbakov, V.D.; Plechov, P.Y.; Koulakov, I.Y. Petrological evidence of rapid evolution of the magma plumbing system of Bezymianny volcano in Kamchatka before the December 20th, 2017 eruption. J. Volcanol. Geotherm. Res. 2022, 421, 107422. [Google Scholar] [CrossRef]
  9. Heled, Y.; Rowe, M.C.; Chambefort, I.; Wilson, C.J. Significance of tridymite distribution during cooling and vapor-phase alteration of ignimbrites. Am. Min. 2022, 107, 460–475. [Google Scholar] [CrossRef]
  10. Leroux, H.; Cordier, P. Magmatic cristobalite and quartz in the NWA 856 Martian meteorite. Meteorit. Planet. Sci. 2006, 41, 913–923. [Google Scholar] [CrossRef]
  11. Seddio, S.M.; Korotev, R.L.; Jolliff, B.L.; Wang, A. Silica polymorphs in lunar granite: Implications for granite petrogenesis on the Moon. Am. Min. 2015, 100, 1533–1543. [Google Scholar] [CrossRef]
  12. Kayama, M.; Nagaoka, H.; Niihara, T. Lunar and martian silica. Minerals 2018, 8, 267. [Google Scholar] [CrossRef]
  13. Payré, V.; Siebach, K.L.; Thorpe, M.T.; Antoshechkina, P.; Rampe, E.B. Tridymite in a lacustrine mudstone in Gale Crater, Mars: Evidence for an explosive silicic eruption during the Hesperian. Earth Planet. Sci. Lett. 2022, 594, 117694. [Google Scholar] [CrossRef]
  14. Shoval, S.; Champagnon, B.; Panczer, G. The quartz-cristobalite transforma tion in heated chert rock composed of micro and crypto-quartz by micro-Raman and FT-IR spectroscopic methods. J. Therm. Anal. 1997, 50, 203–213. [Google Scholar] [CrossRef]
  15. Smith, D.K. Opal, cristobalite, and tridymite: Non-crystallinity versus crystallinity, nomenclature of the silica minerals and bibliography. Powder Diffr. 1998, 13, 2–19. [Google Scholar] [CrossRef]
  16. Vishnevsky, S.; Montanari, A. Popigai impact structure (Arctic Siberia, Russia): Geology, petrology, geochemistry, and geochronology of glassbearing impactites. In Large Meteorite Impacts and Planetary Evolution II. Geological Society of America Special; Paper, 339; Dressler, B.O., Sharpton, V.L., Eds.; The Geological Society of America: Boulder, CO, USA, 1999; pp. 19–59. [Google Scholar]
  17. Whitehead, J.; Grieve, R.A.F.; Spray, J.G. Mineralogy and petrology of melt rocks from the Popigai impact structure, Siberia. Meteorit. Planet. Sci. 2002, 37, 623–647. [Google Scholar] [CrossRef]
  18. Osinski, G.R. Impact melt rocks from the Ries impact structure, Germany: An origin as impact melt flows? Earth Planet. Sci. Lett. 2004, 226, 529–543. [Google Scholar] [CrossRef]
  19. Ferrière, L.; Koeberl, C.; Reimold, W.U. Characterisation of ballen quartz and cristobalite in impact breccias: New observations and constraints on ballen formation. Eur. J. Mineral. 2009, 21, 203–217. [Google Scholar] [CrossRef]
  20. Trepmann, C.A.; Dellefant, F.; Kaliwoda, M.; Hess, K.U.; Schmahl, W.W.; Hölzl, S. Quartz and cristobalite ballen in impact melt rocks from the Ries impact structure, Germany, formed by dehydration of shock-generated amorphous phases. Meteorit. Planet. Sci. 2020, 55, 2360–2374. [Google Scholar] [CrossRef]
  21. Jackson, J.C.; Horton, J.W., Jr.; Chou, I.M.; Belkin, H.E. Monoclinic tridymite in clast-rich impact melt rock from the Chesapeake Bay impact structure. Am. Min. 2011, 96, 81–88. [Google Scholar] [CrossRef]
  22. Ivanova, D.A.; Shcherbakov, V.D.; Plechov, P.Y.; Nekrylov, N.A.; Davydova, V.O.; Turova, M.A.; Stepanov, O.V. Cristobalite in extrusive rocks of Bezymianny volcano. New Data Min. 2018, 52, 51–58. [Google Scholar]
  23. Carstens, H. Thermal history of impact melt rocks in the Fennoscandian shield. Contrib. Mineral. Petrol. 1975, 50, 145–155. [Google Scholar] [CrossRef]
  24. Bischoff, A.; Stöffler, D. Chemical and structural changes induced by thermal annealing of shocked feldspar inclusions in impact melt rocks from Lappajarvi crater, Finland. J. Geophys. Res. 1984, 89, 645–656. [Google Scholar] [CrossRef]
  25. Fel’dman, V.I.; Granovsky, L.B.; Sazaonova, L.V.; Nikishina, N.N.; Butenko, T.G.; Naumova, I.G. Some peculiarities of geochemistry of impactites of Janisjarvi, SW Karelia, and Kara, Polar Ural, astroblemes. In Proceedings of the Lunar and Planetary Science Conference, Houston, TX, USA, 19–23 March 1979. [Google Scholar]
  26. Zamiatina, D.A.; Zamyatin, D.A.; Mikhalevskii, G.B. Ballen Quartz in Jänisjärvi Impact Melt Rock with High Concentrations of Fe, Mg, and Al: EPMA, EDS, EBSD, CL, and Raman Spectroscopy. Minerals 2022, 12, 886. [Google Scholar] [CrossRef]
  27. Jourdan, F.; Renne, P.R.; Reimold, W.U. High-precision 40Ar/39Ar age of the Jänisjärvi impact structure (Russia). Earth Planet. Sci. Lett. 2008, 265, 438–449. [Google Scholar] [CrossRef]
  28. Masaitis, V.L. Impact structures of the northeast of Eurasia: The territories of Russia and neighboring countries. Meteorit. Planet. Sci. 1999, 34, 691–711. [Google Scholar] [CrossRef]
  29. Sazonova, L.V.; Feldman, V.I.; Shcherbovsky, E.Y. Features of the chemical composition and optical properties of the rock-forming minerals of the tagamites from Jänisjärvi astrobleme. Dokl. Akad. Nauk SSSR 1985, 281, 138–142. (In Russian) [Google Scholar]
  30. Fel’dman, V.I.; Sazonova, L.V.; Kozlov, E.A. Shock metamorphism of some rock-forming minerals: Experimental results and natural observations. J. Petrol. 2006, 14, 540–566. [Google Scholar] [CrossRef]
  31. Marakushev, A.A. (Ed.) Impactites; Moscow State University: Moscow, Russia, 1981; p. 240. [Google Scholar]
  32. Lafuente, B.; Downs, R.T.; Yang, H.; Stone, N. The Power of Databases: The RRUFF Project. In Highlights in Mineralogical Crystallography; De Gruyter, W., Ed.; Walter de Gruyter GmbH & Co KG: Berlin, Germany, 2015; pp. 1–30. [Google Scholar] [CrossRef]
  33. Maksimova, A.A.; Zamiatina, D.A.; Zamyatin, D.A.; Ryanskaya, A.D.; Chukin, A.V.; Oshtrakh, M.I. Impact melt rock from Jänisjärvi astrobleme: Study of the iron-bearing phases using Raman spectroscopy, X-ray diffraction, and Mössbauer spectroscopy. Meteorit. Planet. Sci. 2022, 57, 912–925. [Google Scholar] [CrossRef]
  34. Kingma, K.J.; Hemley, R.J. Raman spectroscopic study of microcrystalline silica. Am. Min. 1994, 79, 269–273. [Google Scholar]
  35. Zamyatin, D.A. Application of Raman Spectroscopy for Studying Shocked Zircon from Terrestrial and Lunar Impactites: A Systematic Review. Minerals 2022, 12, 969. [Google Scholar] [CrossRef]
  36. Wu, Y.; Huang, S.; Huang, H.; Wu, X.; Liu, H. Structural characteristics and elasticities of coesite and coesite-II at high pressure. New J. Phys. 2020, 22, 093044. [Google Scholar] [CrossRef]
  37. Papike, J.J.; Cameron, M. Crystal chemistry of silicate minerals of geophysical interest. Rev. Geophys. Space Phys. 1976, 14, 37–80. [Google Scholar] [CrossRef]
  38. Swamy, V.; Saxena, S.K.; Sundman, B.; Zhang, J. A thermodynamic assessment of silica phase diagram. J. Geophys. Res. Solid Earth 1994, 99, 11787–11794. [Google Scholar] [CrossRef]
  39. Dapiaggi, M.; Pagliari, L.; Pavese, A.; Sciascia, L.; Merli, M.; Francescon, F. The formation of silica high temperature polymorphs from quartz: Influence of grain size and mineralising agents. J. Eur. Ceram. Soc. 2015, 35, 4547–4555. [Google Scholar] [CrossRef]
  40. Putnis, A.; Putnis, C.V. The mechanism of reequilibration of solids in the presence of a fluid phase. J. Solid State Chem. 2007, 180, 1783–1786. [Google Scholar] [CrossRef]
  41. Götze, J.; Plötze, M.; Habermann, D. Origin, spectral characteristics and practical applications of the cathodoluminescence (CL) of quartz—A review. Mineral. Petrol. 2001, 71, 225–250. [Google Scholar] [CrossRef]
  42. Götze, J. Chemistry, textures and physical properties of quartz—Geological interpretation and technical application. Mineral. Mag. 2009, 73, 645–671. [Google Scholar] [CrossRef]
  43. Stevens-Kalceff, M. Cathodoluminescence microcharacterization of point defects in α-quartz. Miner. Mag. 2009, 73, 585–605. [Google Scholar] [CrossRef]
  44. Sittner, J.; Götze, J. Cathodoluminescence (CL) Characteristics of Quartz from Different Metamorphic Rocks within the Kaoko Belt (Namibia). Minerals 2018, 8, 190. [Google Scholar] [CrossRef]
  45. Gucsik, A. (Ed.) Cathodoluminescence and Its Application in the Planetary Sciences; Springer: Berlin/Heidelberg, Germany, 2009; p. 160. [Google Scholar] [CrossRef]
  46. Augustsson, C.; Reker, A. Cathodolumenescence spectra of quartz as provenance indicators revisited. J. Sediment. Res. 2012, 82, 559–570. [Google Scholar] [CrossRef]
  47. Sippel, R.F. Luminescence petrography of the Apollo 12 rocks and comparative features in terrestrial rocks and meteorites. In Lunar and Planetary Science Conference Proceedings; Pergamon Press: New York, NY, USA, 1971; Volume 2, p. 247. [Google Scholar]
  48. Kayama, M.; Nishido, H.; Ninagawa, K. Cathodoluminescence characterization of tridymite and cristobalite: Effects of electron irradiation and sample temperature. Am. Mineral. 2009, 94, 1018–1028. [Google Scholar] [CrossRef]
  49. Schipper, C.I.; Rickard, W.D.; Reddy, S.M.; Saxey, D.W.; Castro, J.M.; Fougerouse, D.; Lilly, K. Volcanic SiO2-cristobalite: A natural product of chemical vapor deposition. Am. Mineral. J. Earth Planet. Mater. 2020, 105, 510–524. [Google Scholar] [CrossRef]
  50. Deer, W.A.; Howie, R.A.; Wise, W.S.; Zussman, J. Rock-forming Minerals: Framework Silicates: Silica Minerals, Feldspathoids and the Zeolites, 4B; The Geological Society: London, UK, 2004; 982p. [Google Scholar]
  51. Lakshtanov, D.L.; Sinogeikin, S.V.; Bass, J.D. High-temperature phase transitions and elasticity of silica polymorphs. Phys. Chem. Miner. 2007, 34, 11–22. [Google Scholar] [CrossRef]
  52. Martel, C.; Pichavant, M.; Di Carlo, I.; Champallier, R.; Wille, G.; Castro, J.M.; Kushnir, A.R. Experimental constraints on the crystallization of silica phases in silicic magmas. J. Petrol. 2021, 62, egab004. [Google Scholar] [CrossRef]
  53. Mason, B. Lunar tridymite and cristobalite. Am. Min. 1972, 57, 1530–1535. [Google Scholar]
  54. Langenhorst, F.; Deutsch, A. Shock metamorphism of minerals. Elements 2012, 8, 31–36. [Google Scholar] [CrossRef]
  55. Stöffler, D.; Langenhorst, F. Shock metamorphism of quartz in nature and experiment: I. Basic observation and theory. Meteoritics 1994, 29, 155–181. [Google Scholar] [CrossRef]
  56. Stähle, V.; Altherr, R.; Koch, M.; Nasdala, L. Shock-induced growth and metastability of stishovite and coesite in lithic clasts from suevite of the Ries impact crater (Germany). Contrib. Mineral. Petrol. 2008, 155, 457–472. [Google Scholar] [CrossRef]
Figure 1. Schematic geological map with the geographical location in inset map of the Jänisjärvi structure (a), sample Jl-07 (b) and a BSE image of polished thin section of the sample (c). Crater position is marked with red circle; sampling location of Jl-07 is marked with red asterisks; 1—Pälkjärvi formation; 2–5—Naatselkä formation (2—undivided, 3—lower, 4—middle and 5—upper); 6—Early/Middle Proterozoic rocks; 7—gabbrodiabase; 8—impactites; 9—faults. Modified after [31]. Annotations in (c) describe the corresponding figures.
Minerals 13 00686 g001
Figure 5. CL image (a), EDS map of Si distribution (b), phase EBSD map (c) of quartz, tridymite and trace coesite; (df)—indexed Kikuchi patterns of quartz (1), tridymite (2) and coesite (3) marked in (c). Yellow dotted line shows the EBSD mapping region.
Minerals 13 00686 g005
Figure 6. Raman (a) and CL (b) spectra of cristobalite (Crs), tridymite (Trd), tridymite with traces of stishovite (Trd-Sti) and coesite (Trd-Coe) and α-quartz (Qtz I, Qtz II). Spectra of stishovite traces taken from point (4) and from region (5) shown in Figure 7.
Minerals 13 00686 g006
Figure 7. BSE (a) and CL (b) images and Si distribution EDS map (c) of tridymite, quartz and trace stishovite. Red square in (ac) shows the contour of the enlarged fragment (d); the red outline in (d) outlines the area where Raman mapping was performed (e); the color-coded map (e) shows the intensity of the stishovite Raman band (746–751 cm−1) relative to the noise, with annotations for the point (4) and area (5) corresponding to the Raman spectra (Figure 6a). (fh)—Kikuchi patterns corresponding to points 1 (quartz), 2 (tridymite) and 3 (tridymite with trace stishovite) on (a). Qtz—quartz, Trd—tridymite, Sa—sanidine, Sti—stishovite.
Minerals 13 00686 g007
Figure 8. Schematic diagram of the P-T trajectory of silica from the Janisjärvi impact structure. The P-T-diagram is modified after [38].
Minerals 13 00686 g008
Table 1. Chemical composition of cristobalite, tridymite and paramorphoses of quartz, as determined by EPMA.
MineralSiO2Al2O3FeOMgOCaONa2OK2OTiO2Total
Cristobalite93.971.470.510.120.100.120.05bdl96.43
94.911.23bdlbdlbdl0.150.07bdl96.55
95.621.190.410.080.070.060.05bdl97.54
95.361.070.13bdl0.040.13bdl0.1496.92
94.320.70bdlbdlbdl0.11bdl0.1295.44
93.411.38bdlbdl0.090.180.45bdl95.72
95.581.09bdlbdlbdl0.110.04bdl97.13
96.300.41bdlbdlbdl0.060.040.1297.07
91.353.21bdlbdl0.190.521.080.1396.55
94.261.42bdlbdl0.050.30bdlbdl96.22
Quartz after
cristobalite (Qtz I)
92.480.940.860.140.170.120.150.1094.97
94.990.60bdlbdlbdl0.140.10bdl96.00
Tridymite 98.880.380.35bdlbdl0.130.050.199.91
95.941.380.720.150.050.170.080.1198.60
99.450.460.47bdlbdl0.170.06bdl100.71
98.810.420.49bdlbdl0.120.05bdl100.00
99.010.470.43bdlbdl0.15bdlbdl100.23
98.820.410.41bdlbdl0.150.05bdl99.93
98.670.330.41bdlbdl0.13bdlbdl99.76
98.330.460.44bdlbdl0.060.04bdl99.42
98.050.330.49bdlbdl0.06bdl0.1299.08
96.610.430.35bdlbdlbdl0.05bdl97.66
98.010.490.41bdlbdl0.070.07bdl99.18
98.810.430.39bdl0.04bdl0.070.1199.89
99.440.400.34bdlbdl0.050.06bdl100.42
Quartz after
tridymite (Qtz II)
97.680.400.26bdlbdl0.090.09bdl98.82
96.710.500.35bdlbdl0.180.100.1298.01
97.430.680.920.070.090.160.05bdl99.50
95.161.620.890.300.090.250.42bdl98.78
97.790.390.33bdl0.050.160.06bdl98.88
96.530.830.480.12bdl0.180.07bdl98.34
96.030.740.440.090.090.100.050.1597.72
96.440.770.470.080.200.100.07bdl98.20
98.360.43bdlbdlbdl0.070.100.1099.30
Measured EPMA data, wt.%; bdl = below the detection limit.
Disclaimer/Publisher’s Note: The statements, opinions and data contained in all publications are solely those of the individual author(s) and contributor(s) and not of MDPI and/or the editor(s). MDPI and/or the editor(s) disclaim responsibility for any injury to people or property resulting from any ideas, methods, instructions or products referred to in the content.

