Article

Gas Barrier Properties of Multilayer Polymer–Clay Nanocomposite Films: A Multiscale Simulation Approach

1
Kintech Lab Ltd., 123298 Moscow, Russia
2
National Research Center “Kurchatov Institute”, 123182 Moscow, Russia
3
Institute of Organoelement Compounds RAS, 119991 Moscow, Russia
4
General Physics Department, Tver State University, Sadovy Str. 35, 170002 Tver, Russia
5
All Russian Institute for Scientific and Technical Information RAS, 125215 Moscow, Russia
*
Author to whom correspondence should be addressed.
Minerals 2023, 13(9), 1151; https://doi.org/10.3390/min13091151
Submission received: 5 August 2023 / Revised: 25 August 2023 / Accepted: 27 August 2023 / Published: 30 August 2023

Abstract

:
The paper discusses the development of a multiscale computational model for predicting the permeability of multilayer protective films consisting of multiple polymeric and hybrid layers containing clay minerals as fillers. The presented approach combines three levels of computation: continuous, full atomic, and quantitative structure–property correlations (QSPR). Oxygen and water are chosen as penetrant molecules. The main predictions are made using the continuum model, which takes into account the real scales of films and nanoparticles. It is shown that reliable predictions of the permeability coefficients can be obtained for oxygen molecules, which is not always possible for water. The latter requires the refinement of existing QSPR methods and interatomic interaction potentials for the atomistic level of calculations. Nevertheless, we show that the maximum effect on permeability reduction from the addition of clay fillers to the hybrid layer can be achieved by using nanoparticles with large aspect ratios and a high degree of orientational order. In addition, the use of the hybrid layer should be combined with the use of polymer layers with minimal oxygen and water permeability. The constructed model can be used to improve the properties of protective coatings for food and drug storage and to regulate the gas permeability of polymeric materials.

1. Introduction

Gas permeability is one of the most important properties in assessing the operational performance of packaging and protective materials designed to ensure long-term storage of food and pharmaceuticals [1,2,3,4,5,6,7,8,9,10,11,12,13,14]. The choice of polymers for these applications is explained by their high manufacturability and design flexibility, while products based on them have a lower weight that cannot be offered by glass and metal.
One of the main problems associated with the preservation of foods and drugs is their relatively rapid degradation when in contact with oxygen-containing molecules in the environment [5,8,10,15,16,17]. This is due to the fact that all organic materials (oils, lipids, sugars, and proteins) are susceptible to oxidation and many of them can bind to water. In turn, medicines contain biologically active molecules (enzymes, hormones, vitamins, antibiotics, etc.) that have many chemically active functional groups (-S-, -OH, -C(O)OH, -C(O)O-, -NH-, -NH2, -NO2, etc.). Therefore, the penetration of even a small amount of oxygen or water molecules into the packaging can significantly reduce the consumer properties of the products and gradually lead to their complete deterioration.
Recently, flexible multilayer films have been increasingly used in the production of packaging for fresh vegetables and meat, as well as bags and containers for the storage of young wine, drugs, medicines, etc. [4,7,9,11,13,18,19]. Commercial multilayer films typically consist of three to nine layers of different polymers with or without an aluminum interlayer. The outer layers consist of polymers with suitable mechanical properties, such as polyethylene terephthalate (PET), polypropylene (PP), and high-density polyethylene. The inner layer is the sealing layer, which provides a hermetic seal to protect the product. Copolymers consisting of ethylene are often used as sealants due to their low melting points [20,21]. These layers are typically bonded together with various types of adhesives. To ensure the long-term preservation of some drugs, the used packaging materials must have extremely low water vapor and oxygen permeabilities of less than 10−1 g/(m2∙day) and 10−1 cm3/(m2∙day), respectively. Furthermore, flexible coatings have to withstand repeated bending loads. Typically, thin aluminum interlayers are introduced to achieve the required ultra-low permeability [5,22].
Today, some biopolymer films are also being adapted with synthetic polymers to meet the current trends to reduce polymer waste and facilitate recycling [13,14,15,23,24]. At the same time, the use of aluminum layers increases the environmental impact and reduces the recyclability of such protective coatings.
To fulfill the requirements of environmental safety on the one hand and to ensure the barrier properties required on the other, it is proposed to use hybrid multilayer films that include pure polymers, clay-based polymer nanocomposites (Figure S1a), and continuous inorganic layers (see Figure S1b; note that “S” indicates any reference to the Supporting Materials file) [3,25,26,27,28]. In the first case, the permeability of the hybrid layer depends on the filler properties, its concentration, and the permeability of the matrix. In the second case, permeability is mainly defined by defects in the inorganic layer [29,30], such as pinholes (see Figure S1b). These can be caused by impurity particles on the substrate surface on which the barrier films are deposited. Experimental data show that the scale of these pinholes is (sub)micron, and their density for ultrabarrier films (whose permeability is approximately 10−6 cm3/(m2∙day)) should not exceed 100 pcs/cm2 [30]. In addition, defects in pure polymers and hybrid films can be induced by the crystallization of polymer molecules. This process causes the formation of grain boundaries and leads to a significant increase in the diffusion rate [3,31,32]. Inorganic coatings based on nanolaminates, in which the amorphous phase is stabilized, can be used as a way to suppress crystallization [33,34]. In addition, additional defects in inorganic layers can be caused by cracks when flexible coatings are bent [35,36] (see Figure S2). Therefore, hybrid protective layers based on polymer nanocomposites, as shown in Figure S1a, are more suitable for flexible barrier coatings because they are less subject to mechanical degradation. These coatings are chosen as the objects of our study.
Two types of clay–polymer nanocomposite films are possible, as shown in Figure 1: nanocomposites with a more or less random orientation of the clay fillers (Figure 1a), and systems with an enforced orientation order of the clay particles (Figure 1b). The first structure can be obtained by mixing polymer/clay in solution or melting followed by film formation. The second can be obtained, for example, by the layer-by-layer deposition method, where the substrate is sequentially treated with anionic and cationic aqueous solutions of polymers and clay particles [37], which eventually leads to the formation of the nanolaminate structure [38]. Experimental studies have shown that such materials have very low permeability. In particular, less than 0.005 cm3/(m2∙day) for oxygen has been demonstrated [37].
Therefore, further improvement of packaging materials requires research aimed at the simultaneous optimization of the structures of the hybrid protective layer and the protective multilayer film as a whole. In addition, there is a separate problem of selecting a suitable polymer for each layer of the film. These issues require long-term experimental studies that combine the efforts of large teams of chemists and engineers, as well as the use of various laboratory equipment. In this situation, the use of theoretical models describing mass transfer through multilayer hybrid polymeric media [6,39,40,41,42] can significantly reduce the overall duration of the development process. However, building adequate theoretical models is a nontrivial problem, since it is necessary to consider the structure of each polymer, the inorganic fillers, the entire barrier material, and the properties of the interactions of all components with the molecules of penetrating gases. In this case, the use of computer simulation is a compromise solution, since it can work with models that combine several theoretical methods. At the same time, for laboratory use conditions, ready software solutions are in great demand which allow predicting the properties of materials in automatic mode. Typically, available software packages allow for the study of monolayer films only [43,44,45,46].
The goal of the present study was to develop a computational technique for the rapid quantitative evaluation of oxygen and water vapor permeation through multilayer organic–inorganic barrier films. It is based on a multiscale modeling approach that combines several computational methods [47,48]. We developed a continuum model of a multilayer coating film consisting of several polymer layers and one polymer/clay nanocomposite layer. The model is parameterized using the quantitative structure–property correlation (QSPR) methods of Bicerano [49] and Askadskii [50]. For additional verification of these two methods, full-atom modeling methods based on molecular dynamics (MD) and Monte Carlo (MC) methods are used. They allow the study of the gas permeability of polymers, based only on the structure of the chemical components and a composition of the material with minimal external parametrization [51]. However, MD and MC are limited to relatively small systems on the nanometer scale. This fact reduces their applicability to the modeling of multilayer polymer films and nanocomposites. Therefore, we have paid special attention to exploring the possibility of using these methods to make predictions of water and oxygen permeability when using material samples of small size.
The article is organized as follows: Section 2 describes the hierarchy of levels of the model to determine the water vapor and oxygen permeability of the multilayer protective film. We give a detailed description of each level of modeling: continuum, QSPR, and full atomic based on MD and MC methods. In Section 3, we describe the results of calculating the transport properties of selected polymers using the full atomic approach and QSPR. Section 4 discusses the results obtained using the continuum model. Section 5 discusses the obtained results and the problems associated with the use of the selected methods. In the final, Section 6, a summary of the work and conclusions on the results obtained are given.

2. Model and Methods

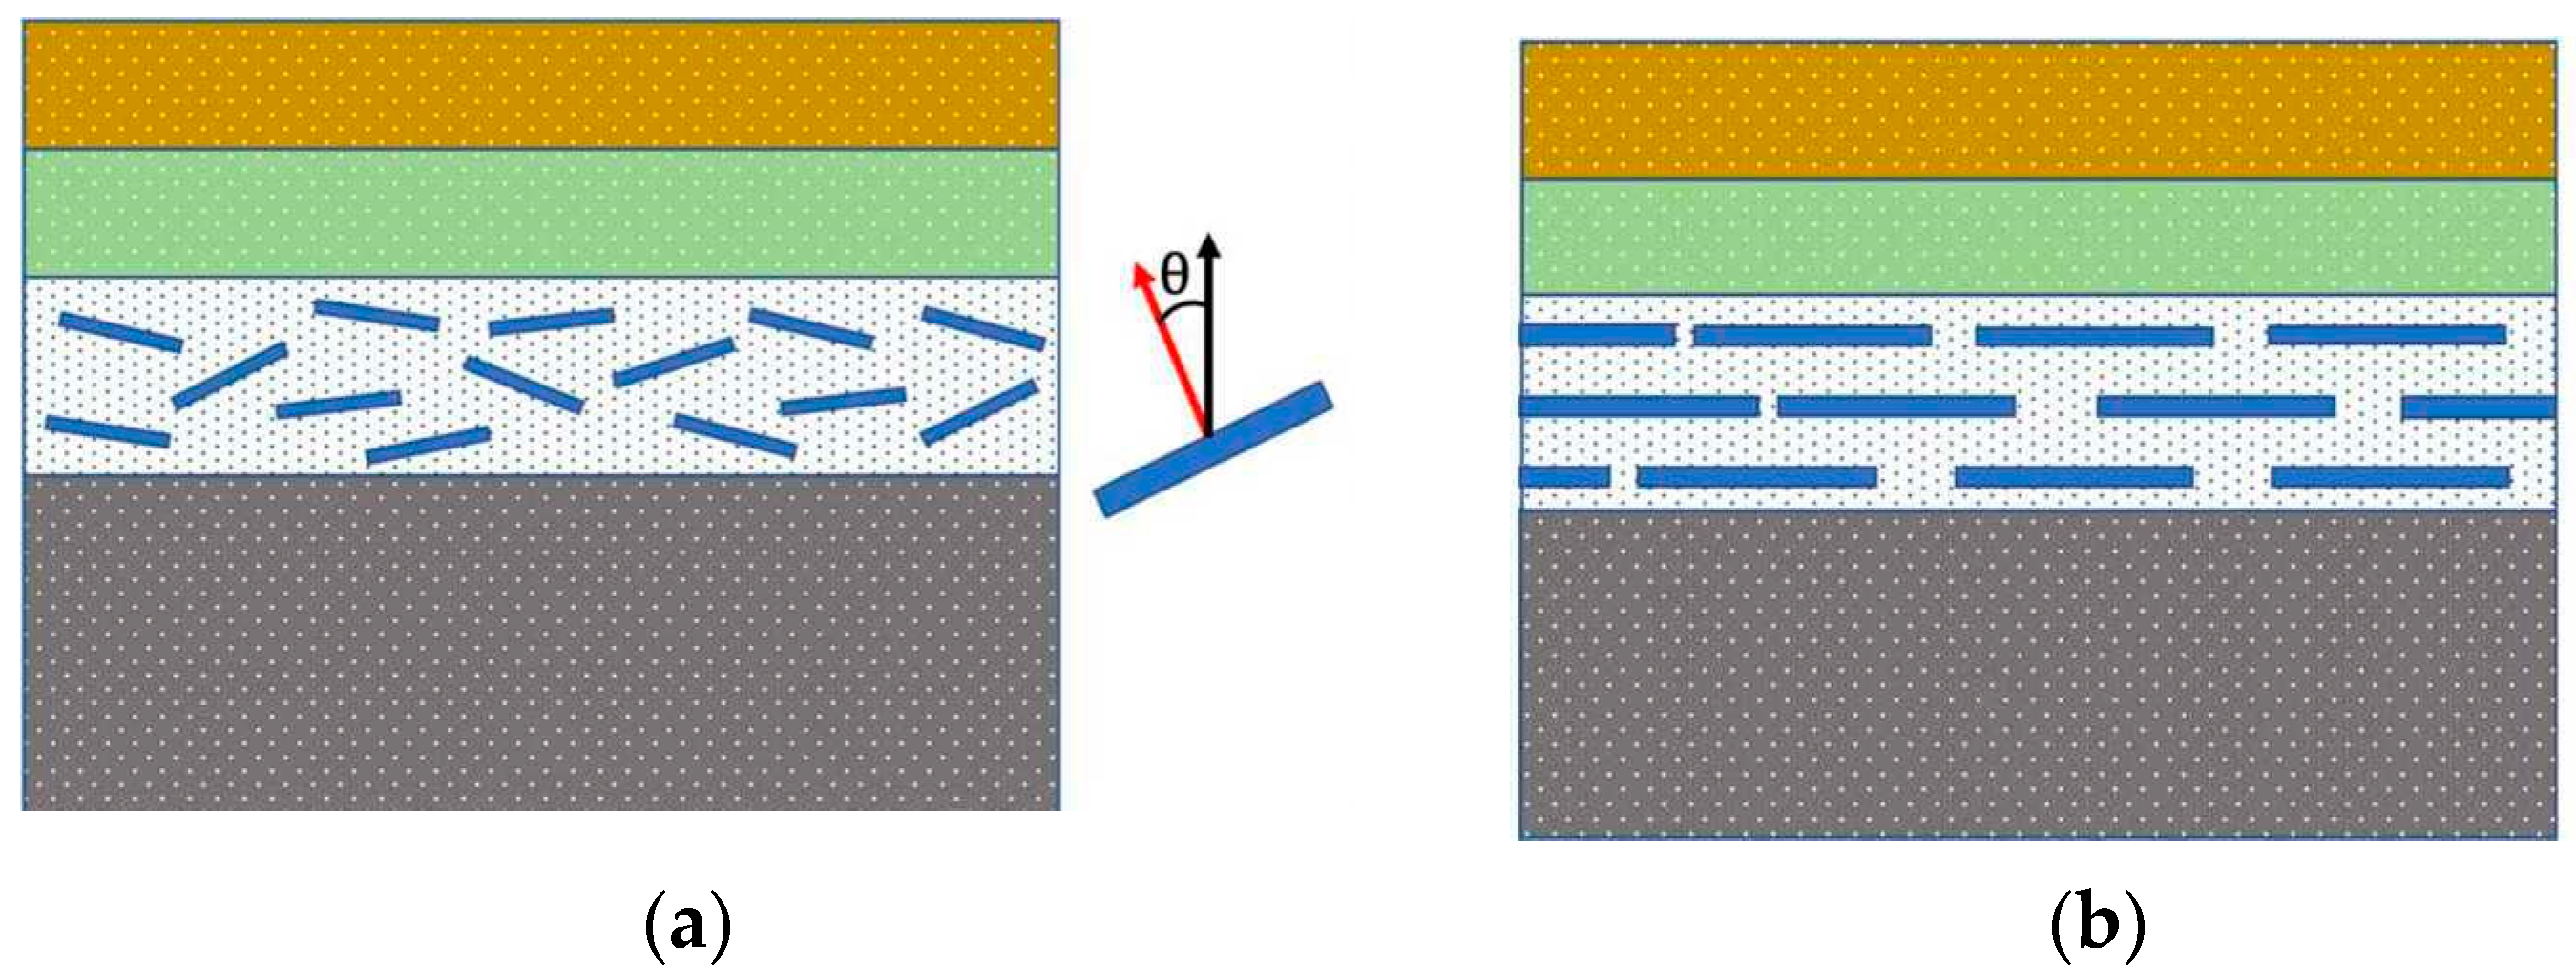
2.1. Multiscale Model Description

As mentioned above, a typical flexible barrier coating consists of several polymer layers, each providing specific functionality. The outer layer protects against mechanical damage and has hydrophobic properties. The substrate layer, which contains materials such as polyethylene terephthalate (PET), provides mechanical strength. All parts must be firmly bonded together, and special adhesive layers are used for this purpose.
The fastest predictions of the properties of multilayer polymer films can be made using continuum models, where each layer is considered as a nonporous membrane or as a continuous medium. The concept of dissolution and diffusion, which describes the phenomena of gas transport in each layer, was first formulated in [52,53,54,55]. According to this concept, the penetration of small molecules through a membrane consists of three stages: (1) gas adsorption on the surface of the material, (2) diffusion of the sorbed gas molecules through the volume of the l layer, and (3) desorption from the opposite surface (see Figure S1a). Thus, the transport properties of a multilayer barrier are determined by the sum of the reverse transport resistances of each layer. To use this model, it is necessary to know the properties of all the polymeric materials in the system, primarily their water vapor and oxygen permeabilities. In the case of a nanocomposite polymer layer with fillers, the permeability is determined by the distribution of filler particles in the layer and the diffusion of penetrant molecules through the polymer matrix. Therefore, we developed a continuum model that solves the diffusion problem of small gas molecules in the case of an arbitrary distribution of clay particles in a polymer matrix.
However, in some cases, data on the transport properties of penetrant molecules in a polymer layer may not be available, e.g., when new polymers are synthesized. To solve parameterization problems, we consider using the well-established quantitative structure–property relationship (QSPR) regression models of Bicerano and Askadskii [49,50]. These models allow us to make quick estimates based only on the chemical structure of the repeated polymer unit. They are also convenient for screening polymers by designing new variants of chemical structures. In addition, they are well described and have an open parameterization, which makes them portable and verifiable.
If the chemical structure of selected polymers is too different from that of the types of polymeric materials used to parameterize the QSPR models, these models may produce predictions with a large error. In such cases, atomistic methods based on molecular dynamics and Monte Carlo methods can be used to test the predictions for selected polymers. For our multilayer polymer coatings model, we used the implementation of these methods in our MULTICOMP package [48].
Thus, our model is a multiscale computational scheme based on the use of a hierarchy of three approaches: continuum, QSPR, and atomistic. Let us describe each of the modeling levels in detail.

2.2. Continuous Level

Methods to model the transport properties of multilayer hybrid films at the continuum level typically assume that permeability is determined by the product of solubility and diffusion (see Section S2). Inorganic additives to polymers are assumed to be impermeable barriers to permeating molecules that increase their diffusion path, i.e., decrease the permeability of the film.
The effect of diffusion barriers is determined by both the volume fraction of inorganic fillers and their shape and orientation. Thus, for the simple case of an impermeable layered filler orientated perpendicular to the flow, the effective diffusion coefficient decreases as (Nielsen’s model [56]):
D0/D = 1 + αφ,
where α and φ are the aspect ratio and volume fraction of the filler particles, and D0 and D are the diffusion coefficients in the pure polymer matrix and nanocomposite, respectively. In Nielsen’s model, permeability decreases linearly with increasing filler aspect ratio, which explains the widespread use of plate-like fillers, such as clay particles or graphene, in nanocomposite barrier films [57,58]. The Nielsen approximation is accurate in the dilute regime but may be inaccurate in the semi-dilute case where the volume fraction of the filler is small φ << 1 but its overlap is large αφ >> 1, as suggested by Cussler et al., who derived the following approximation for 2D geometry [59]:
D0/D = 1 + αφ/2σ + α2 φ2/4(1 − φ),
where σ is the aspect ratio of a slit between clay particles (ratio of the width of the slit to slit thickness). The stronger dependence of the effective diffusion coefficient on the overlap factor compared to that of Nielsen’s model is related to the reduced cross-sectional area between the clay plates. More complex expressions have been obtained for certain configurations of 2D layered fillers [59,60], but a general analytical solution cannot be obtained for an arbitrary configuration. Therefore, numerical simulation methods are used as a good compromise to analyze transport in more realistic configurations of inorganic fillers.
There are two main approaches for the numerical modeling of the transport properties of multilayer hybrid coatings at the continuum level: the deterministic method, based on the solution of partial differential equations, and the stochastic method, based on the Monte Carlo technique. The use of the first method is limited by the presence of fillers with a large aspect ratio or a large difference in the characteristic sizes in the system (for example, between the hole size in the inorganic layer and the thickness of the polymer layer). This leads to high computational costs and the need to use complex adaptive grids to solve the diffusion equation. Therefore, Monte Carlo methods are often used to analyze transport in complex configurations of inorganic layers. For example, they have been used to calculate diffusion in polymers with layered fillers [61]. Since this approach is well established, we use it in our continuum model to describe gas transport.
In our model, the protective coating film consists of alternating polymer and hybrid polymer/leather layers (see Figure 1). Each polymer material is characterized by its diffusion coefficient D of penetrant molecules and their solubility S, as well as the thickness of the layer. In addition, it is assumed that different filler particles do not intersect and do not stick out from the layer.
Now let us discuss the implementation of the chosen model. It is based on tracking the random motion of a molecule, taking into account the presence of impenetrable barriers. In the initial state, the molecule is located in the first polymer layer near the outer surface of the film, and then the molecule makes microsteps, i.e., random displacements whose value depends on the distance d to the nearest barrier:
d = ½ max (min (d), dmin).
The minimum step size dmin depends on the minimum geometric size in the system (e.g., the size of the hole or the thickness of the layered filler). After displacement, the total diffusion time increases by the value
Δt = d2/6 Di,
which is determined by the diffusion coefficient Di of a molecule in an i-th layer.
The probability of a molecule passing from one polymer layer to another is determined by the ratio of its solubilities:
wi,i+1 = min(Si+1/Si, 1),
where Si is the solubility of the current layer and Si+1 is the solubility of the layer into which the molecule is trying to penetrate.
The model gives the diffusion time τdiff of the molecule throughout the thickness of the multilayer coating. This time is then averaged over the number of attempts for a set of molecules. By comparing the average diffusion times in a multilayer system with inorganic fillers, <τdiff>, and without them, <τdiff>free, we can estimate the change in the permeability of the coating as:
P/Pfree= <τdiff>free/<τdiff>,
where Pfree is the permeability of the multilayer system without fillers and inorganic layers:
Pfree =(∑i 1/Pifree)−1,
and Pifree = SiDi is the permeability of the i-th layer of the multilayer system without fillers.
Therefore, to predict and optimize the protective properties of the barrier coating, it is necessary to determine the parameters of the transport properties (Si and Di) for each polymer layer. To solve this problem, we used quantitative structure–property correlations (QSPR) and atomistic modeling methods discussed in the following sections.

2.3. The Quantitative Structure–Property Correlations

For rapid evaluations of polymer permeability, we used the QSPR regression models of Bicerano and Askadskii [49,50]. These models are well known and tested and allow us to calculate many properties of polymeric materials (such as gas transport, Young’s modulus, etc.). Previously, we implemented Bicerano’s models to predict polymer properties in our MULTICOMP software package [48]. However, the Bicerano approach lacks a model corresponding to the permeability of polymers to water P(H2O). Therefore, we use the Bicerano model only to estimate the oxygen permeability P(O2). To estimate P(H2O), we selected the Askadskii model [62,63].
The structural formulas of the monomers are used as input information for the Askadskii and Bicerano models (see Figure S3). To prepare input data, the structures of the monomers are decomposed into predefined atoms (Askadskii) or structural fragments (Bicerano), and then their number is counted. The water vapor permeability in the Askadskii method is determined by the following expression:
P(H2O) = p0 exp (−ΔE∙1000/(R∙T∙VVdw)),
where p0 is a constant value equal to 3.002 (in Barrer units) for all polymers, ΔE is the activation energy, R is the gas constant, VVdw is the van der Waals volume, and T is the temperature. The value ΔE is calculated as the sum of the atomic and group contributions ΔEj:
ΔE = ∑nj∙ΔEj.
For the parameterization of the atomic and group contributions, we use the values presented in Table S1. Analysis of this table leads to the conclusion that the lowest permeability value may be obtained for aliphatic polymers (with a small positive contribution to the activation energy) and for polymers with the maximum number of chlorine atoms, which gives a negative contribution to the activation energy.
The Bicerano model [49] for predicting oxygen permeability includes the following expressions:
Log(PO2) = 8.515520 − 0.017622 v,
v = Ecoh/V − 196 V/VVdW + 110 Nrot/N − 57 NPer/N,
NPer= 2NC=C − 14 Nbb,ester + 5 X4′ − 7Nhheq,σ6Ncyanideeq,σ − 12 Nhb,ar.
These equations contain the following parameters: cohesion energy (Ecoh), molecular volume (V), number of rotating bonds (Nrot), number of non-hydrogen atoms (N), number of acyclic carbon–carbon double bonds (NC=C), number of ester groups in the main polymer chain (Nbb,ester), number of substituents in aromatic cycles in the main chain (X4′), the sum of Cl and Br atoms attached to sp3 carbon atoms (Nhheq,σ), the sum of cyanide groups attached to sp3 carbon atoms (Ncyanideeq,σ), and number of hydroxyl hydrogen atoms and aromatic cycles with hydrogen bonds (Nhb,ar). For the compounds studied, the calculation of P(O2) requires knowledge of the values of the parameters Ecoh, V, VVdW, Nrot, N, X4′, and Nhheq,σ. The other parameters are zero. The parameters Ecoh, V, and VVdW are estimated using the Bicerano method (implemented by us in the MULTICOMP package [48]). Nrot, N, X4′, and Nhheq,σ are estimated from 2D structural formulas (see description in Ref. [49]). We used atomistic modeling as a computational experiment to verify the results of predictions made using regression QSPR models.
It should be noted that these models are useful for analyzing polymer databases to screen for materials with optimal properties. This analysis can be extensive, using databases of known polymers, or intensive, based on virtually constructed polymer structures. We considered the second possibility (see Section S4) when selecting polymeric materials to parameterize our continual model. We wrote a special program for this purpose and took into account the resulting ambiguities when determining the uniqueness of the generated polymer structures using the InChIkey identifier (see Section S4.1) [64,65].

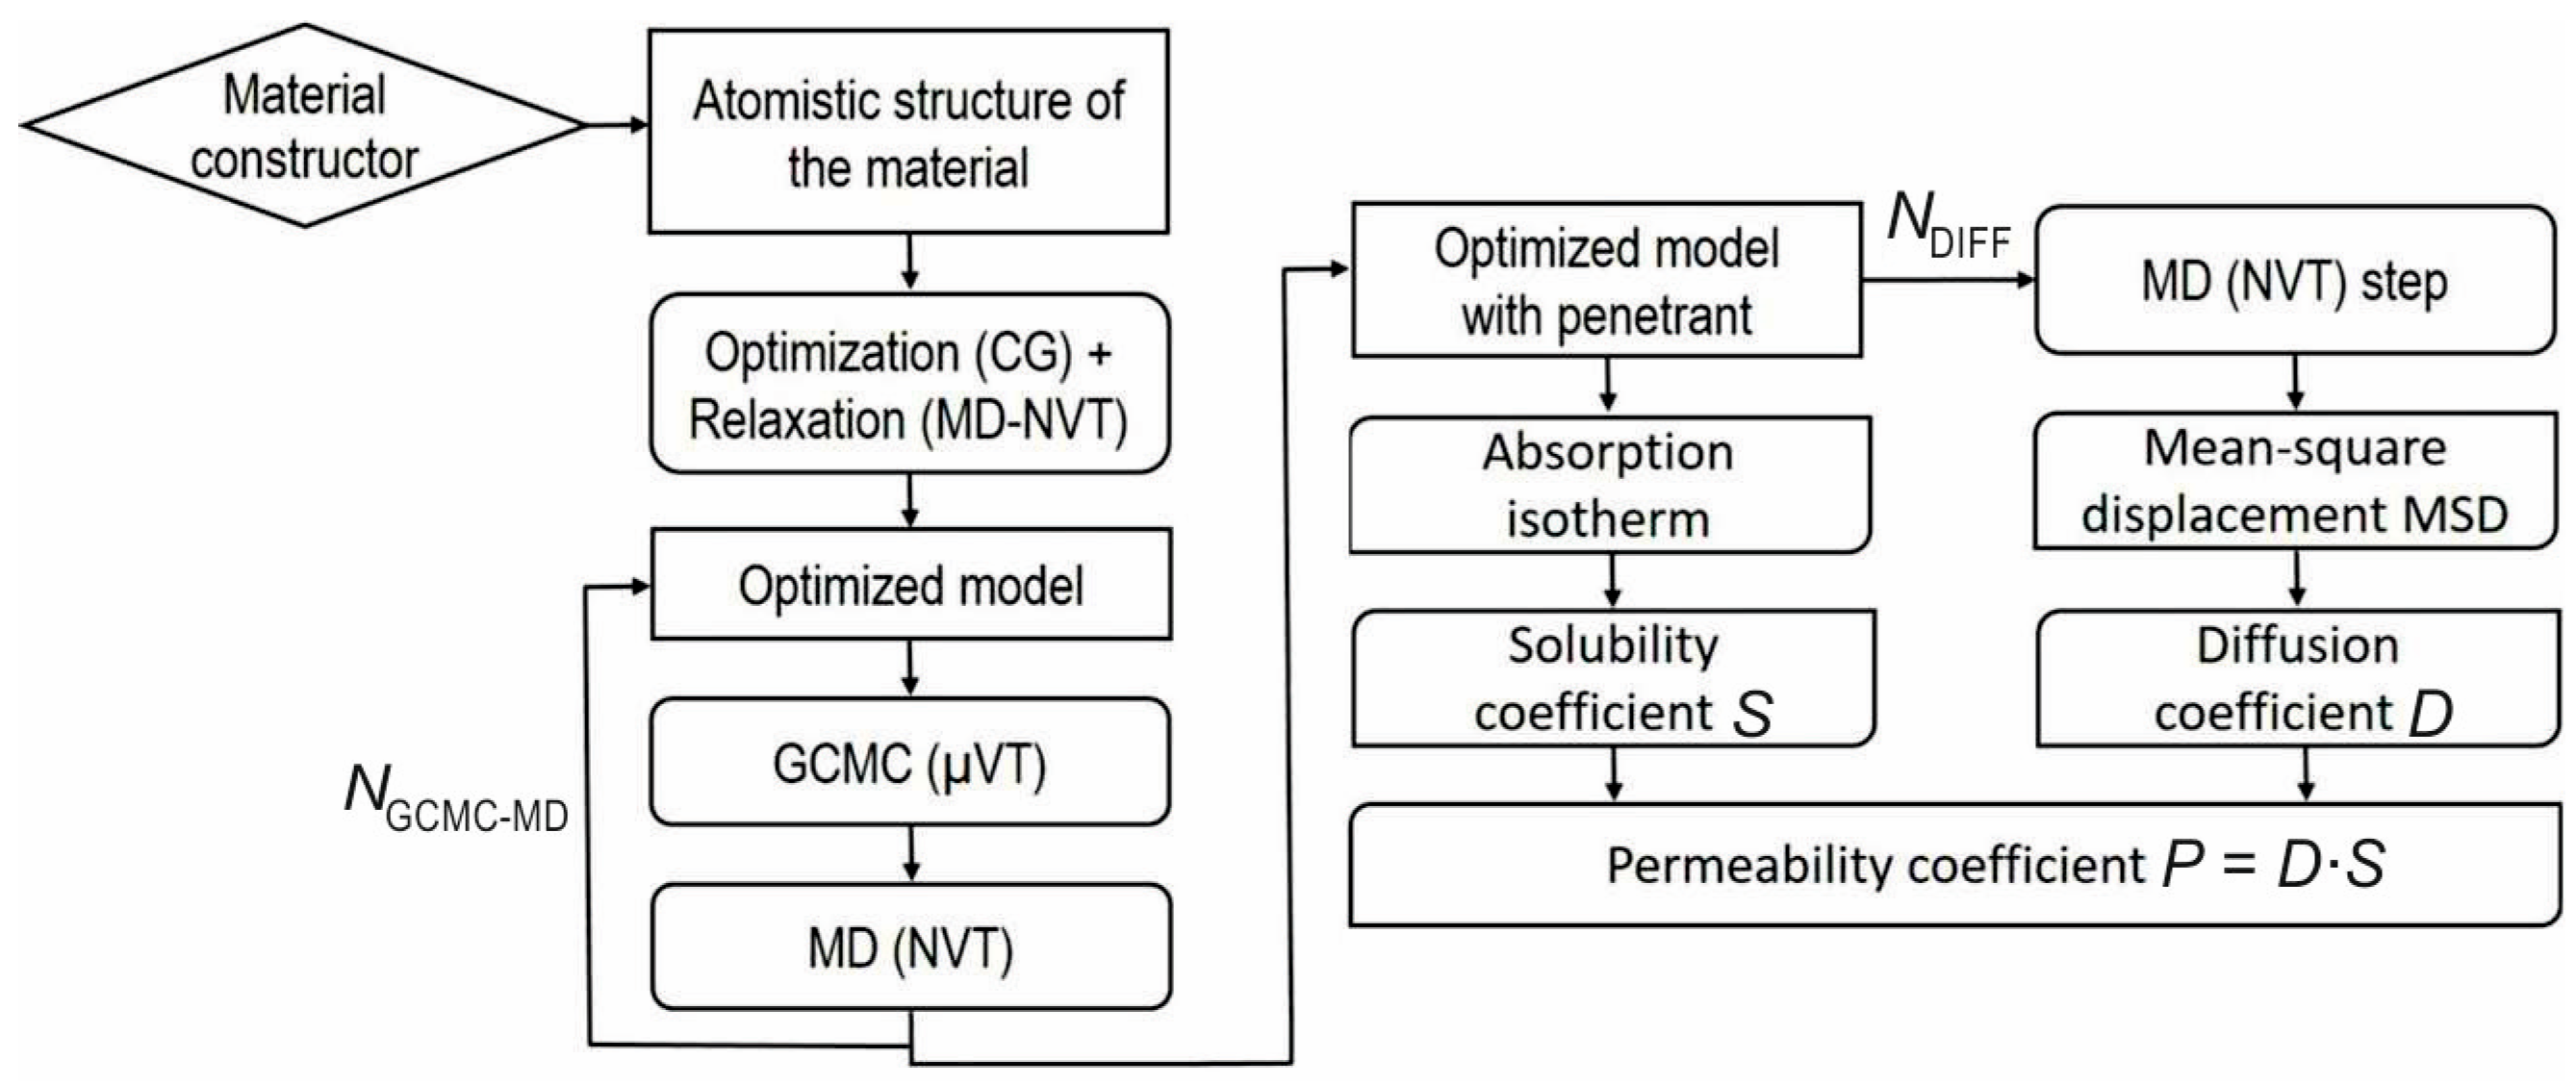
2.4. Full Atomic Level

One of the most widely used theoretical approaches to estimate the transport properties of polymeric materials is atomistic modeling based on a combination of molecular dynamics and Grand Canonical Monte Carlo (GCMC) [66,67,68,69,70]. The implementation of this scheme is shown in Figure 2.
In the first stage, samples of the polymeric materials to be studied are generated and optimized. The MD-GCMC procedure is then performed for the chosen number of NGCMCMD steps to obtain the optimized structure with penetrant molecules (in this study, for O2 and H2O).
In the GCMC method, the solubility coefficient is estimated by calculating an adsorption isotherm curve at fixed temperature and volume. The number of molecules in the ensemble can vary (only the chemical potential µ is fixed). The solubility coefficient is obtained by approximating the adsorption curve with a straight line (as the pressure tends to zero) and calculating the slope of the constructed straight line Ncell(p), where Ncell is the calculated equilibrium number of penetrant molecules in the simulation cell for a given injection pressure p.
For the resulting matrix + penetrant model, MD simulation is performed to calculate the mean square displacement (MSD) of the penetrating molecule. MSD allows the calculation of the diffusion coefficient D [66,67] using the Einstein formula:
D = ⅙ N lim(t→∞) d/dt(i = 1)N <(ri (t) − ri (0))2>,
where ri (t) is the position of the center of mass of a selected molecule at time t and N is the number of diffusing molecules. If the root-mean-square displacement curve can be approximated with a straight line with slope k, the equation given above can be simplified as follows:
D = k/6.
The resulting permeability coefficient P of the polymeric material is calculated as
P = DS.
The described combination of MD+GCMC and MD simulations is implemented using the LAMMPS code as part of a new “Permeability” module (developed specifically for this study) and included in our MULTICOMP package [48]. This module performs the two-step atomistic simulation (see Figure 2) that allows estimating the solubility coefficient S and the diffusion coefficient D for the selected structure of the solvent and the selected penetrant molecule, and uses them to calculate the permeability coefficient P using Equation (15). Unlike previous similar studies using the MD-GCMC method [66,71,72,73,74], the atoms in the polymer matrix and the penetrant molecules are not fixed during the MD-GCMC or MD simulation runs. This allows us to describe the structural changes due to the addition of penetrant molecules to the matrix.

3. Results of Full Atomistic Calculations

As a first step in the implementation of the designed multilevel simulation of protective films, we selected and performed a comparative study of the transport properties of several polymers at the atomistic level. The diffusion, solubility, and permeability coefficients were calculated. Oxygen (O2) and water (H2O) molecules were used as penetrants. The SPC/E model was used for water molecules [75]. Furthermore, the permeability coefficients were predicted using QSPR methods.
To select suitable polymers for our continuous model, we generated a series of polymers and screened them using QSPR methods, showing that organochlorine materials have the best barrier properties (see Section S4). However, such polymers do not meet environmental requirements, as they release toxic gases during degradation [76]. Other obtained polymers have higher vapor permeability values, which limits the possibility of improving the barrier properties of polymer films by modifying the chemical composition of the matrices. In this situation, it seems more promising to improve the barrier properties of polymer films by using hybrid layers with inorganic fillers, such as clays and standard polymer matrices. Therefore, the choice of polymeric materials was based on data on their availability and use in the composition of protective materials (see Section S4.2). As a result, we selected common plastics such as polyethylene terephthalate (PET), polyethylene (PE), and two fluorinated polymers: polyvinylidene fluoride (PVDF) and polytetrafluoroethylene (PTFE). A large amount of experimental data is also available for these materials.
Therefore, the calculation of the transport properties of PET, PE, PVDF, and PTFE serves on the one hand to parameterize our continual model, and on the other hand, the comparison with the experiment is used to verify the adequacy of the chosen methods.

3.1. Generation of Polymer Matrices

Polymer matrices were prepared using constructor modules (integrated into our previously developed MULTICOMP package [48]) and the Class II Polymer Consistent Force Field (PCFF) [77]. Polymer chains were constructed using the “Polymer Chain” module. The degree of polymerization of the chains was set to 33 for PE, PTFE, PVDF, and 11 for PET. The length of the polymer chains was chosen so that each chain contains approximately 200 atoms, as this value is sufficient to predict the transport properties of polymers [78]. The samples of matrices were then obtained from 10 polymer chains using the “Polymer/Composite Constructor” module. They were subjected to geometry and relaxation optimization to bring them to an equilibrium state (T = 300 K), and an additional 100 ps annealing step was used in the NVT ensemble with an Andersen/Behrendsen thermostat [79,80]. The models of the polymer chains and sample matrices are shown in Figure 3.
Density is an important parameter that can affect the accuracy of polymer permeability results. In our simulations, the density of each sample is assumed to be fixed. Therefore, when we build polymer samples, their final sizes correspond to the experimental density values. The densities and fractions of free volume in the obtained samples, calculated using the “Structure Properties” module of the MULTICOMP package, are given in Table 1. It can be seen from the table that among the selected polymers, PET has the smallest free volume, which should lead to low gas permeability.

3.2. Gas Permeability of Selected Polymers

The gas barrier properties of PET, PE, PVDF, and PTFE were calculated using the “Permeability” module integrated into the MULTICOMP package. All calculations were performed using the PCFF force field [77]. As a separate issue, we considered the sensitivity of our results to the choice of the valence force field. For this purpose, the solubility of oxygen and water molecules was calculated using VFF COMPASS [81] and DREIDING [82] (see Section S5).

3.2.1. Calculations of the Diffusion Coefficients

The diffusion coefficients for oxygen and water molecules were estimated from the slope of the lines approximating their MSDs calculated from the MD simulations (see Table 2). A total of 10–50 ns MD runs were performed for each material. The MSD dependencies obtained, shown in Figure 4, have strong fluctuations that can be related to the relatively small number of diffusion trajectories realized for a single molecule. This is limited by the size of the chosen polymer matrix structure (~2000 atoms in the simulation cell). However, we can state that all the dependencies reached the asymptotic regime within the computational time.
The observed trend (PTFE > PVDF > PE > PET) of the diffusion coefficients of both O2 and H2O molecules is determined by the characteristics of the interaction of dissolved molecules with polymers and the free volume values in the created samples. The results in Table 2 also allow us to conclude that our results are qualitatively in agreement with the experiment. In terms of quantitative agreement, the values obtained are in agreement with the experimental data within one order of magnitude. In general, all diffusion coefficients are higher, which can also be attributed to the limited number of available diffusion trajectories [83]. However, it should be noted that accuracy within one or two orders of magnitude is characteristic of experimental measurement of diffusion coefficients in polymers [84]. Comparison with previous theoretical studies also shows that our results are within orders of magnitude [85].
Table 2. Diffusion coefficients of oxygen and water molecules for PET, PE, PVDF, and PTFE.
D(O2) (cm2/s)D(H2O) (cm2/s)
MaterialCalculationExperiment [84]CalculationExperiment [84]
PET2.0 ± 0.4 × 10−83–80 × 10−92 ± 0.5 × 10−80.3–13 × 10−8
PE2.7 ± 0.7 × 10−70.2–12 × 10−73.8 ± 0.7 × 10−70.6–13 × 10−7
PVDF2.3 ± 0.4 × 10−71.7 × 10−72.5 ± 1.0 × 10−75–8 × 10⁻⁷
PTFE2.6 ± 0.4 × 10−61.5 × 10−72.6 ± 0.6 × 10−61.5–12 × 10−7
The small difference observed between the diffusion coefficients for the H2O and O2 molecules has also been confirmed experimentally [86] and theoretically [87,88]. Therefore, it can be concluded that the atomistic approach provides reliable qualitative and, within an order of magnitude, quantitative estimates for the diffusion coefficients of small molecules in polymers.

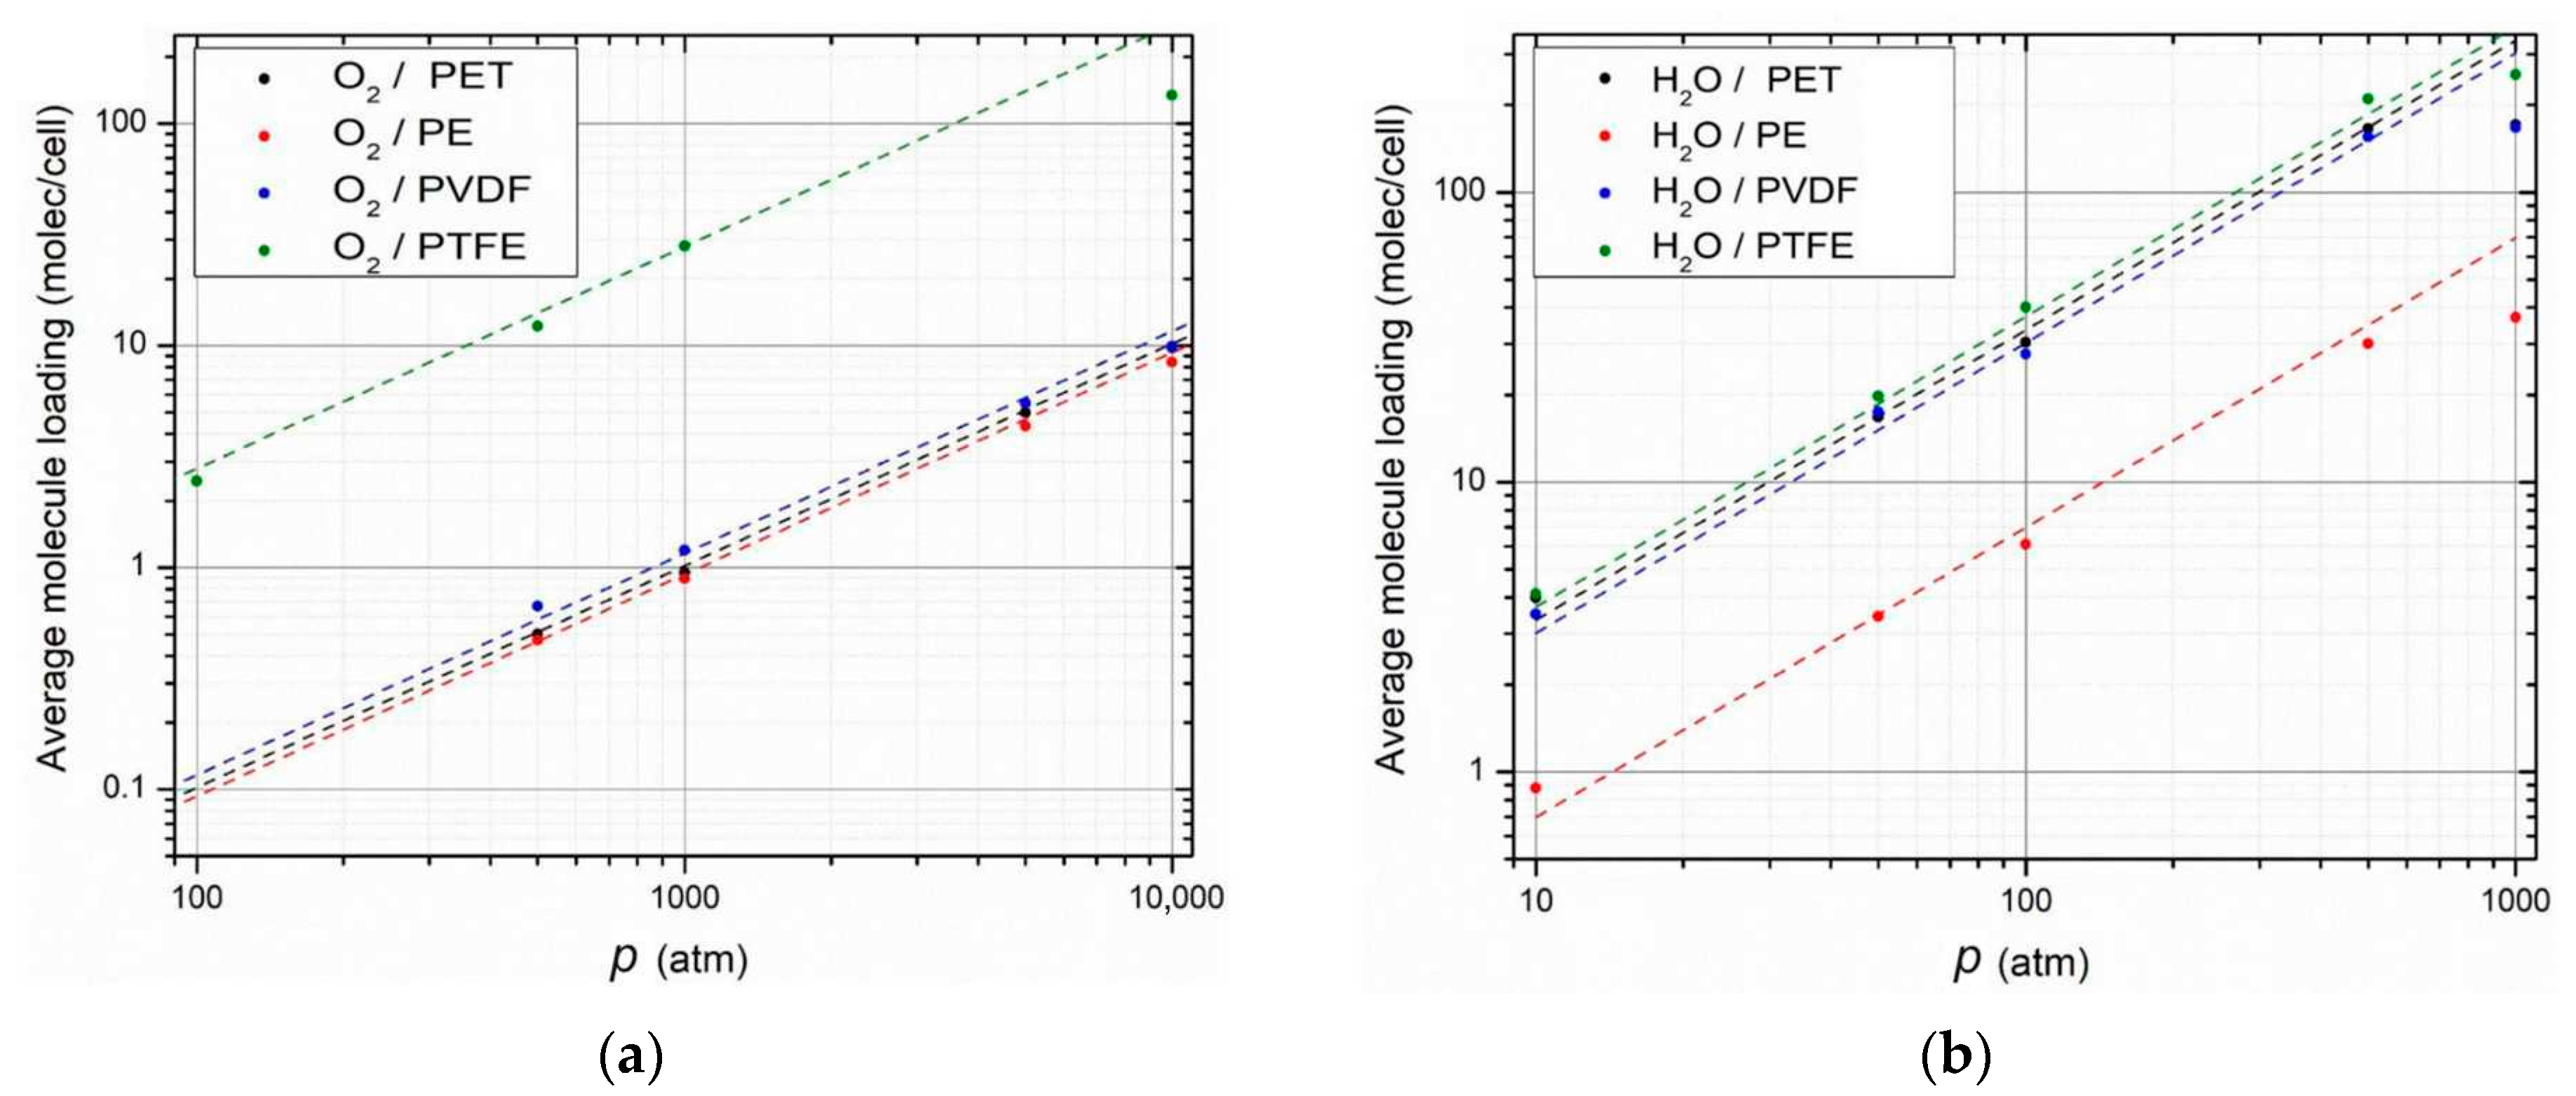
3.2.2. Calculations of the Solubility Coefficients

The combined GCMC/MD approach is used to estimate the solubility coefficient S. The MC method is used to model the H2O and O2 adsorption processes in the polymer matrix samples described above (see Section 3.1). Solute molecules can be created and destroyed with random probabilities, and the well-known Metropolis algorithm is used to accept or reject these configurational moves of a penetrant molecule [89]. The GCMC simulation is invoked every 100 times. The motion of the inserted molecules is described in the subsequent MD run, which is performed to obtain the optimized configuration of the matrix/penetrant solution. These steps are used to reach the equilibrium state at a given temperature and chemical potential. When the penetrant insertion pressure p is changed, and thus the chemical potential of the system, we can obtain the dependence for the equilibrium number of penetrant molecules in the polymer Ncell(p) and extract the solubility coefficient by linear approximation. The calculated Ncell(p) for oxygen and water molecules are shown in Figure 5, with each point averaged over 10 ns MD-GCMC runs. The experimental values [84] and estimated values of the solubility coefficients are given in Table 3.
It should be noted that in our calculations we consider relatively small matrices consisting of ~2000 atoms. This was done to minimize the required computational resources. For the system sizes used, the solubility of the order of S ~ 10−7 (cm3(GC)/(cm3Pa)) corresponds to only 1–10 molecules of the penetrant gas in the simulation cell (for the interval considered p). In the present study, we considered p ~ 10–1000 atm, because for this pressure interval, for the chosen system size, the dependence of Ncell(p) is linear so that Henry’s law can be applied for solubility estimation. At lower pressures, gas molecules occupy only a small number of the most accessible positions for dissolution (“adsorption sites”), so a strong penetrant–matrix interaction can lead to a large overestimation of the coefficient S. Furthermore, for pressures p below 1 atm, for the prepared material samples, only one or zero penetrant molecules are present in the simulation cells during the productive runs, making the calculated solubility values unreliable. As we increase the insertion pressure p above 103–104 atm, the molecules penetrate tiny pores with poor connectivity. Moreover, because of the decrease in distance between the penetrants, strong interactions occur between the dissolved molecules.
In the case of water, this can even lead to the formation of water clusters inside the polymer matrix at penetrant penetration pressures p ~ 500–1000 atm. Such phenomena are often observed in atomistic simulations with water molecules and can be attributed to the consideration of hydrogen bonding [89] and dipoles [90,91], which is expected for water molecules [92]. The formation of large water clusters can also affect the structure of the polymer matrix by inducing local polymer swelling. These two effects, among others [93], lead to noticeable nonlinearities in the dependence of Ncell(p) and can strongly bias the value of the solubility coefficient. Thus, the values of the solubility coefficient can be very sensitive to many parameters, especially those defining the interactions between the penetrant molecules and the polymer matrix. A detailed discussion of the sensitivity of the calculated solubility coefficients to the parameters of the chosen interatomic potentials is given in Section S5.
In summary, our calculations show that the obtained solubility coefficients for oxygen are almost one order of magnitude lower than the experimental values (except for PTFE, which is in very good agreement with the experiment; see Table 3). Overall, the resulting trend in the value of the solubility coefficient for fluorine-containing materials (obtained in Section 3.2.1, i.e., PTFE > PVDF > PE > PET) is qualitatively in agreement with both experiments. At the same time, as we can see, the solubility coefficients for water are typically higher than the experimental ones. We attribute the latter fact to the effects of the water–water interaction that leads to cluster formation and the observed overestimation of the solubility coefficient. Nevertheless, as for the diffusion coefficient estimates, we can conclude that the atomistic approach provides reliable qualitative and, within an order of magnitude, quantitative estimates for the solubility coefficients of small molecules in the selected polymerics.

3.2.3. Calculations of Permeability Coefficients

The diffusion and solubility coefficients obtained for the materials considered allow us to calculate the permeability coefficients using Equation (15). Their product and comparison with the experimental and QSPR results are summarized in Table 4. As can be seen, PET has the lowest value of the permeability coefficients, which correlates well with its smallest free volume (see Table 1). All permeability coefficients for oxygen molecules are in good agreement with the experimental data and qualitatively agree with the results of the Bicerano model. At the same time, the coefficients P(H2O) do not agree with the Askadskii model. Furthermore, the Askadskii model does not follow the trend observed experimentally for the selected materials. Such a strong discrepancy in our results may be related to the difficulty of correctly describing water/polymer interactions.
It is generally accepted that relatively small changes in the chemical nature of the polymer chain, which affect the abundance of available polar substituents, can have marked effects on water transport [94]. Although hydrocarbon polymers exhibit low water uptake and permeability, polar substituents on polymer chains can significantly increase water uptake by forming specific interactions with water molecules [95]. Unlike water, gases such as O2 interact very little or not at all with the absorbent, so the matrix structure does not undergo swelling strain or other rearrangements. Since the interactions between O2 molecules and O2/polymer are less complex, the coefficients of solubility, diffusion, and permeation are much easier to calculate with atomistic simulations [22]. A more accurate selection of the modeling parameters (system size, valence force field parameters, etc.) and the extension of the set of statistics will significantly increase the accuracy and, accordingly, the predictive capabilities of the developed model.
On the basis of these conclusions, the predictions of the QSPR models for oxygen and water permeability were selected for the parameterization of the continuous model. The QSPR results appear to be more reliable because the models were trained on a fairly large representative sample of polymers. Nevertheless, the full-atom approach proved to be a useful tool for semi-quantitative predictions, especially in the absence of representative experimental data.

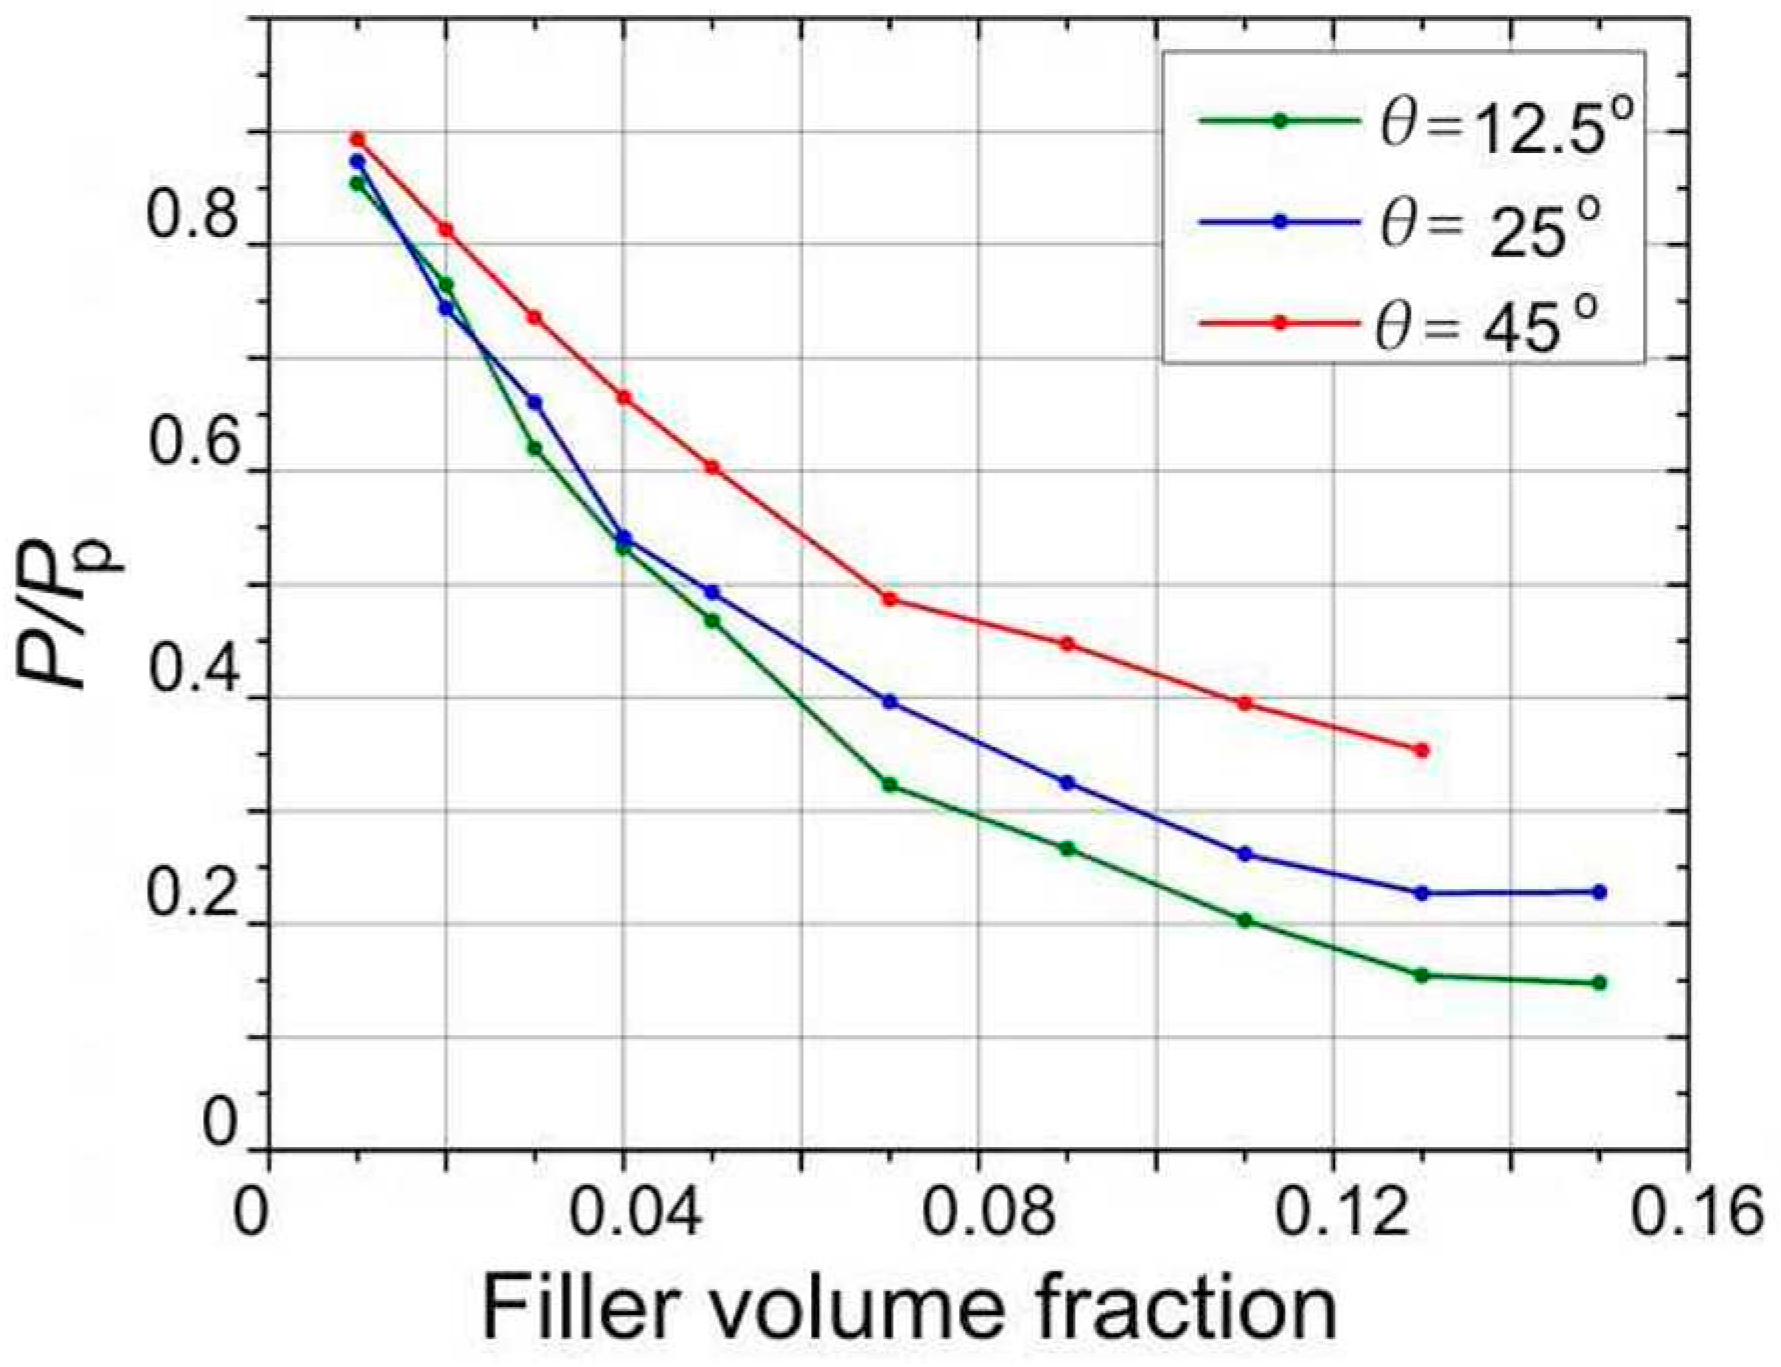
4. Results Based on the Continuous Model

This section presents the results of the analysis of the barrier properties of multilayer protective coatings using the model described in Section 2.2.
In the previous section, four polymers (PET, PE, PVDF, and PTFE) were selected and tested as components of a multilayer coating. As can be seen from the results obtained, they have relatively high water permeability values. Other polymer matrices (see Table S2) have slightly different vapor permeability values, which limits the ability to improve the barrier properties of polymer films by modifying their chemical structures. Therefore, it can be suggested that the main factor in improving the barrier properties of polymer films is the use of hybrid layers with inorganic fillers.
A four-layer stack, shown in Figure 1, is considered as a model of the flexible protective coating. It consists of a 30 μm polytetrafluoroethylene (PTFE) top layer, a 10 μm adhesive layer, a 60 µm polymer layer such as polyethylene (PE) with inorganic fillers, and a 60 µm substrate layer (PET) [96]. Polymer parameters calculated with the Bicerano and Askadskii methods (see Table 4) were used to parameterize this model. To investigate the effect of inorganic fillers on the permeability of hybrid coatings, calculations were performed with different filler volume contents and degrees of their orientational ordering. Inorganic fillers were given in the form of thin disks and were characterized by the aspect ratio α = 2R/H, where R is the radius and H is the thickness of the particle. The orientation of the fillers was characterized by the direction of the normal to the disk surface and was set to be uniform in a cone with an angle θmax relative to the normal to the film surface (the isotropic distribution of fillers corresponds to the angle θmax = π/2).
The lateral size of the system was chosen so that the inorganic layer contained at least hundreds of filler particles. The number of particles over which the diffusion time was averaged in the Monte Carlo method was 500, ensuring an error of less than 10% in the permeability calculations for a given filler distribution. Diffusion time calculations are averaged over three different filler configurations at a given filler volume fraction.
First, the effect of the orientational order of the clay particles on the permeability of the hybrid organic–inorganic layer was investigated. Figure 6 shows the dependence of the ratio of the permeability of the filled polymer layer to the permeability of the pure polymer on the filler volume fraction, φ, at different values of the angle θmax = 12.5°, 25°, and 45° with a fixed aspect ratio of the clay particle α = 60. As can be seen in Figure 6, the decrease in layer permeability is about 50% for φ = 5%, which is in good agreement with a large amount of experimental data (see, for example, the review [22]). A larger change in the permeability of the polymer layer containing disordered clay particles in some experiments [22] can be attributed to a change in the degree of crystallinity of the polymer matrix [97], which is not considered in this study. It can be seen that the calculated effect of a decrease in permeability has a linear dependence on low filler contents, which is consistent with the Nielsen model [56]. It should be noted that the value of the overlap parameter αφ, in this case, can be greater than one (αφ = 3 for φ = 5%), but the Nielsen linear model describes the numerical results satisfactorily. The difference from the nonlinear dependence in the analytical model of Cassler et al. [56] for 2D layered structures may be due to the three-dimensional nature of the nanocomposite structure and the shape of the filler particles in the form of disks used in our calculations.
Furthermore, Figure 6 shows that increasing the degree of orientational order of the layered filler significantly reduces the permeability of the nanocomposite and also allows the use of composites with a high filler volume fraction. Therefore, from a practical point of view, it is important to use a method to obtain a nanocomposite that allows one to obtain a high degree of orientational order of the filler. As a possible technique, layer-by-layer deposition of clay–polymer laminates can be used, as in [37,98,99].
Next, we investigate the variant of the protective coating that contains the hybrid layer of the clay–polymer laminate. The model structure used is shown in Figure 1b. It includes a 10 nm laminate layer and a 100 nm polymer PE layer.
The calculated permeability of a barrier layer with a clay/polymer laminate as a function of the number of bilayers is shown in Figure 7 for different sizes of clay particles (with R of 1, 3, 10, and 30 µm). The permeability of the barrier layer without the laminate was approximately 2.5 × 10⁻¹ (g/m2∙day). As can be seen, a layer of 30 bilayers of laminate for clay particles with R of 30 μm leads to a decrease in vapor permeability by more than 500 times, which is sufficient for use in protective coatings for the long-term storage of food and medicine. In addition, clay/polymer laminates can be used as organic/inorganic barrier layers between polymer layers. From the results obtained, it can be estimated that 10 polymer/clay bilayers (with 10 µm clay particles) provide a vapor permeability of 10−2 g/(m2∙day). This is in qualitative agreement with experimental data on the decrease in permeability of nanolaminate hybrid films [37].
Thus, to obtain the maximum permeability reduction effect from the addition of inorganic fillers to the polymer matrix, it is necessary to use filler particles with the highest aspect ratio and degree of their orientational order. The product of the aspect ratio of the disc-shaped filler and its volume fraction must exceed 10 to achieve a significant permeability reduction effect. This should be combined with the use of a polymer matrix with minimal oxygen and water permeability.

5. Discussion

Our study shows that the full atomistic methods allow us to semi-quantitatively describe the permeability of the polymers for oxygen molecules, which interact weakly with the polymer matrix. All obtained results are in reasonable agreement with the experiment and with the predictions of the Bicerano model. However, in the case of the water vapor permeability of polymers, our results show a strong dependence on the water/polymer model of interatomic potentials, which explains the observed discrepancy.
At the same time, the predictions of water permeability coefficients using the Askadskii method are not in good agreement with the experimental data. This can be explained both by the use of a limited amount of experimental data to fit the parameters of this regression scheme and by the presence of parameters that are not taken into account. These are the density and degree of crystallinity of the matrix, which depends on the preparation method, and the history of the material samples. The latter is difficult to account for in QSPR models since they correspond to an idealized (highly averaged) structure of polymer materials. Nevertheless, such models are in great demand for the explicit prediction of the properties of pure polymers, which is necessary for the parameterization of the various theoretical models. They can also be useful for rapid quantitative evaluations of the permeability properties of components of designed protective coatings in laboratory studies.
The analysis of the transport properties of hybrid films with layered inorganic fillers using our continuous model has shown that, in the case of the use of orientationally disordered fillers, their effect makes it possible to reduce the permeability of the polymer film several times. However, it is difficult to achieve better results because of the mutual overlapping of the filler particles. Therefore, it is more promising to use nanolaminate materials with orientationally ordered clay particles. In this case, our model predicts a strong decrease in the permeability of the protective multilayer film (up to two or three orders of magnitude), especially when nanoparticles with a high aspect ratio are used (of the order of 1000). This theoretical result is in reasonable agreement with the experimental data for nanolaminate systems [37].

6. Conclusions

In this work, a multiscale computational model was developed to predict the barrier properties of multilayer protective films consisting of alternating polymer and hybrid layers containing clay minerals as fillers. Oxygen and water molecules were used as penetrant molecules. The model combines three levels of calculation, namely continuum, all-atom, and QSPR. The use of the continuum level makes it possible to take into account both the actual scale of the structure of the protective film and the dimensions and aspect ratio of the clay particles, which is very difficult to do with all-atom MD and MC simulations. To quickly parameterize the continuum model, the possibilities of using calculation schemes based on QSPR and full-atom models were considered. They allow the estimation of the transport properties of polymer materials for gas molecules (i.e., diffusion, solubility, and permeability coefficients). In testing the full atomic calculation scheme that combines MD and GCMC methods, we focused on considering relatively small volumes of matter, because of the need to minimize computational costs in laboratory studies.
We can conclude that the full atomic level of simulations allows us to make reliable, qualitative, and, within an order of magnitude, quantitative estimates of the diffusion and solubility coefficients of oxygen for relatively small polymeric samples. This allows good predictions of the oxygen permeability of pure polymers in agreement with the results of the Bicerano model and experimental studies. At the same time, we obtained evidence that existing QSPR schemes need to be improved to better predict water vapor permeability. This can be achieved by extending and increasing the base of polymers used to train the QSPR methods. In the case of all-atom simulations, it is necessary to make a more accurate choice of the sizes of the polymer samples and to adjust the parameters of the valence force field responsible for describing the water/polymer interactions. This requires separate studies that were not included in the objectives of this work.
Nevertheless, using the parameterization obtained and the continuum model, we were able to demonstrate that the maximum effect on the reduction in permeability from the addition of clay fillers to the polymers is obtained when using minerals in which the filler particles have high aspect ratios. It is also desirable to ensure a high degree of orientational order. We have shown that the product of the aspect ratio of the disk-shaped filler and its volume fraction must be greater than 10 to obtain a noticeable effect in reducing permeability. In addition, this should be combined with the use of polymer matrices with minimal oxygen and water permeability.
The advantage of our computational approach is its relative universality. This applies to the use of any low-molecular-weight penetrants, both for the development of barrier coatings and for membranes. At the same time, it is a closed-loop approach, since it can work without the use of external parameterizations as all the necessary coefficients (diffusion, solubility, and permeability) can be obtained through express analysis based on QSPR methods, and direct full-atom molecular dynamics and Monte Carlo simulations. The latter is important when using newly developed polymeric materials.
The proposed computational scheme can be used to improve the properties of protective coatings for food and drug storage and may also be useful in regulating the gas permeability of new polymeric materials.

Supplementary Materials

The following supporting information can be downloaded at: https://www.mdpi.com/article/10.3390/min13091151/s1, Figure S1: The mechanism of gas permeation in hybrid multilayer thin films containing; Figure S2: Variation of stress F in the inorganic layer depending on its position in the film; Figure S3: Askandskii and Bicerano model input data illustration; Figure S4: Structures of repeating units used for the construction of various polymer monomers; Figure S5: Illustration of the problem of the determination of the uniqueness of the chemical structure of chemical compounds; Figure S6: Structures of polymeric materials discussed in the publication; Figure S7: Calculated dependencies of the number of equilibrium oxygen and water molecules on pressure when using different force fields; Table S1: Contributions of atoms and groups to the activation energy in the Askadskii model; Table S2: Properties of virtually generated polymers; Table S3: Calculated solubility coefficients for oxygen molecules in PET, PE, PVDF and PTFE; Table S4: Calculated solubility coefficients for water vapor in PET, PE, PVDF and PTFE.

Author Contributions

Conceptualization, A.K.; methodology, A.K., P.K., A.S. and S.T.; software, A.K., D.S., A.S. and S.T.; validation, A.S., D.S. and S.T.; formal analysis, A.K., P.K., A.S. and S.T.; investigation, A.K., P.K., A.S. and S.T.; writing—original draft preparation, P.K.; writing—review and editing, A.K., P.K., A.S. and S.T.; visualization, A.K., P.K. and A.S.; supervision, A.K. and B.P.; project administration, B.P. All authors have read and agreed to the published version of the manuscript.

Funding

This research received no external funding.

Data Availability Statement

All data are contained within the article and the Supplementary Materials.

Acknowledgments

This work was carried out using the computing resources of the federal collective usage center Complex for Simulation and Data Processing for Mega-science Facilities at NRC “Kurchatov Institute” (http://computing.kiae.ru/ (accessed on 29 August 2023)). P. Komarov’s investigations for this paper were supported by the Ministry of Science and Higher Education of the Russian Federation (contract no. 075-03-2023-642) and were carried out using the equipment of the shared research facilities of HPC computing resources at Lomonosov Moscow State University [100].

Conflicts of Interest

The authors declare no conflict of interest.

References

  1. Lange, J.; Wyser, Y. Recent Innovations in Barrier Technologies for Plastic Packaging? Packag. Technol. Sci. 2003, 16, 149–158. [Google Scholar] [CrossRef]
  2. Malykh, O.V.; Golub, A.Y.; Teplyakov, V.V. Polymeric Membrane Materials: New Aspects of Empirical Approaches to Prediction of Gas Permeability Parameters in Relation to Permanent Gases, Linear Lower Hydrocarbons and Some Toxic Gases. Adv. Colloid Interface Sci. 2011, 164, 89–99. [Google Scholar] [CrossRef] [PubMed]
  3. Kausar, A. A Review of High Performance Polymer Nanocomposites for Packaging Applications in Electronics and Food Industries. J. Plast. Film Sheeting 2020, 36, 94–112. [Google Scholar] [CrossRef]
  4. Pasquier, E.; Mattos, B.D.; Koivula, H.; Khakalo, A.; Belgacem, M.N.; Rojas, O.J.; Bras, J. Multilayers of Renewable Nanostructured Materials with High Oxygen and Water Vapor Barriers for Food Packaging. ACS Appl. Mater. Interfaces 2022, 14, 30236–30245. [Google Scholar] [CrossRef]
  5. Marsh, K.; Bugusu, B. Food Packaging—Roles, Materials, and Environmental Issues. J. Food Sci. 2007, 72, R39–R55. [Google Scholar] [CrossRef]
  6. Siracusa, V. Food Packaging Permeability Behaviour: A Report. Int. J. Polym. Sci. 2012, 2012, 302029. [Google Scholar] [CrossRef]
  7. Wagner, J.R., Jr. Multilayer Flexible Packaging, 2nd ed.; Elsevier: William Andrew, NY, USA, 2016. [Google Scholar] [CrossRef]
  8. Han, J.-W.; Ruiz-Garcia, L.; Qian, J.-P.; Yang, X.-T. Food Packaging: A Comprehensive Review and Future Trends. Compr. Rev. Food Sci. Food Saf. 2018, 17, 860–877. [Google Scholar] [CrossRef]
  9. Anukiruthika, T.; Sethupathy, P.; Wilson, A.; Kashampur, K.; Moses, J.A.; Anandharamakrishnan, C. Multilayer Packaging: Advances in Preparation Techniques and Emerging Food Applications. Compr. Rev. Food Sci. Food Saf. 2020, 19, 1156–1186. [Google Scholar] [CrossRef]
  10. Vasile, C.; Baican, M. Progresses in Food Packaging, Food Quality, and Safety-Controlled-Release Antioxidant And/or Antimicrobial Packaging. Molecules 2021, 26, 1263. [Google Scholar] [CrossRef]
  11. Bayer, I.S. Biopolymers in Multilayer Films for Long-lasting Protective Food Packaging: A Review. Sustainable Food Packaging Technology. In Sustainable Food Packaging Technology; Athanassiou, A., Ed.; Wiley: Weinheim, Germany, 2021; pp. 395–426. [Google Scholar] [CrossRef]
  12. Versino, F.; Ortega, F.; Monroy, Y.; Rivero, S.; López, O.V.; García, M.A. Sustainable and Bio-Based Food Packaging: A Review on Past and Current Design Innovations. Foods 2023, 12, 1057. [Google Scholar] [CrossRef]
  13. Avila, L.B.; Schnorr, C.; Silva, L.F.O.; Morais, M.M.; Moraes, C.C.; da Rosa, G.S.; Dotto, G.L.; Lima, É.C.; Naushad, M. Trends in Bioactive Multilayer Films: Perspectives in the Use of Polysaccharides, Proteins, and Carbohydrates with Natural Additives for Application in Food Packaging. Foods 2023, 12, 1692. [Google Scholar] [CrossRef] [PubMed]
  14. Grzebieniarz, W.; Biswas, D.; Roy, S.; Jamróz, E. Advances in Biopolymer-Based Multi-Layer Film Preparations and Food Packaging Applications. Food Packag. Shelf Life 2023, 35, 101033. [Google Scholar] [CrossRef]
  15. Attaran, S.A.; Hassan, A.; Wahit, M.U. Materials for Food Packaging Applications Based on Bio-Based Polymer Nanocomposites. J. Thermoplast. Compos. Mater. 2017, 30, 143–173. [Google Scholar] [CrossRef]
  16. Zabihzadeh Khajavi, M.; Ebrahimi, A.; Yousefi, M.; Ahmadi, S.; Farhoodi, M.; Mirza Alizadeh, A.; Taslikh, M. Strategies for Producing Improved Oxygen Barrier Materials Appropriate for the Food Packaging Sector. Food Eng. Rev. 2020, 12, 346–363. [Google Scholar] [CrossRef]
  17. Viana Batista, R.; Gonçalves Wanzeller, W.; Lim, L.-T.; Quast, E.; Zanella Pinto, V.; Machado de Menezes, V. Food Packaging and Its Oxygen Transfer Models in Active Multilayer Structures: A Theoretical Review. J. Plast. Film Sheeting 2022, 38, 458–488. [Google Scholar] [CrossRef]
  18. Kopacic, S.; Walzl, A.; Zankel, A.; Leitner, E.; Bauer, W. Alginate and Chitosan as a Functional Barrier for Paper-Based Packaging Materials. Coat. World 2018, 8, 235. [Google Scholar] [CrossRef]
  19. Bekhta, P.; Lyutyy, P.; Hiziroglu, S.; Ortynska, G. Properties of Composite Panels Made from Tetra-Pak and Polyethylene Waste Material. J. Polym. Environ. 2016, 24, 159–165. [Google Scholar] [CrossRef]
  20. Mueller, K.; Schoenweitz, C.; Langowski, H.-C. Thin Laminate Films for Barrier Packaging Application—Influence of Down Gauging and Substrate Surface Properties on the Permeation Properties. Packag. Technol. Sci. 2012, 25, 137–148. [Google Scholar] [CrossRef]
  21. Fereydoon, M.; Ebnesajjad, S. Development of high-barrier film for food packaging. In Plastic Films in Food Packaging; Ebnesajjad, S., Ed.; William Andrew Publishing: Oxford, UK, 2013; Chapter 5; pp. 71–92. [Google Scholar] [CrossRef]
  22. Sangaj, N.S.; Malshe, V.C. Permeability of Polymers in Protective Organic Coatings. Prog. Org. Coat. 2004, 50, 28–39. [Google Scholar] [CrossRef]
  23. Chung, D.; Papadakis, S.E.; Yam, K.L. Simple Models for Evaluating Effects of Small Leaks on the Gas Barrier Properties of Food Packages. Packag. Technol. Sci. 2003, 16, 77–86. [Google Scholar] [CrossRef]
  24. Agarwal, A.; Shaida, B.; Rastogi, M.; Singh, N.B. Food Packaging Materials with Special Reference to Biopolymers-Properties and Applications. Chem. Afr. 2022, 6, 117–144. [Google Scholar] [CrossRef]
  25. Lewis, J.S.; Weaver, M.S. Thin-Film Permeation-Barrier Technology for Flexible Organic Light-Emitting Devices. IEEE J. Sel. Top. Quantum Electron. 2004, 10, 45–57. [Google Scholar] [CrossRef]
  26. Li, Y.; Xiong, Y.; Yang, H.; Cao, K.; Chen, R. Thin Film Encapsulation for the Organic Light-Emitting Diodes Display via Atomic Layer Deposition. J. Mater. Res. 2020, 35, 681–700. [Google Scholar] [CrossRef]
  27. Lewis, J. Material Challenge for Flexible Organic Devices. Mater. Today 2006, 9, 38–45. [Google Scholar] [CrossRef]
  28. Röhrl, M.; Timmins, R.L.; Rosenfeldt, S.; Schuchardt, D.D.; Uhlig, F.; Nürmberger, S.; Breu, J. Stretchable Clay Nanocomposite Barrier Film for Flexible Packaging. ACS Appl. Mater. Interfaces 2023, 15, 22524–22531. [Google Scholar] [CrossRef] [PubMed]
  29. Kim, N.; Potscavage, W.J., Jr.; Sundaramoothi, A.; Henderson, C.; Kippelen, B.; Graham, S. A Correlation Study between Barrier Film Performance and Shelf Lifetime of Encapsulated Organic Solar Cells. Sol. Energy Mater. Sol. Cells 2012, 101, 140–146. [Google Scholar] [CrossRef]
  30. Lee, S.; Han, J.-H.; Lee, S.-H.; Baek, G.-H.; Park, J.-S. Review of Organic/inorganic Thin Film Encapsulation by Atomic Layer Deposition for a Flexible OLED Display. JOM 2019, 71, 197–211. [Google Scholar] [CrossRef]
  31. Miikkulainen, V.; Leskelä, M.; Ritala, M.; Puurunen, R.L. Crystallinity of Inorganic Films Grown by Atomic Layer Deposition: Overview and General Trends. J. Appl. Phys. 2013, 113, 021301. [Google Scholar] [CrossRef]
  32. LeBaron, P. Polymer-Layered Silicate Nanocomposites: An Overview. Appl. Clay Sci. 1999, 15, 11–29. [Google Scholar] [CrossRef]
  33. Meyer, J.; Schneidenbach, D.; Winkler, T.; Hamwi, S.; Weimann, T.; Hinze, P.; Ammermann, S.; Johannes, H.-H.; Riedl, T.; Kowalsky, W. Reliable Thin Film Encapsulation for Organic Light Emitting Diodes Grown by Low-Temperature Atomic Layer Deposition. Appl. Phys. Lett. 2009, 94, 233305. [Google Scholar] [CrossRef]
  34. Chou, C.-T.; Yu, P.-W.; Tseng, M.-H.; Hsu, C.-C.; Shyue, J.-J.; Wang, C.-C.; Tsai, F.-Y. Transparent Conductive Gas-Permeation Barriers on Plastics by Atomic Layer Deposition. Adv. Mater. 2013, 25, 1750–1754. [Google Scholar] [CrossRef]
  35. Jen, S.-H.; Bertrand, J.A.; George, S.M. Critical Tensile and Compressive Strains for Cracking of Al2O3 Films Grown by Atomic Layer Deposition. J. Appl. Phys. 2011, 109, 084305. [Google Scholar] [CrossRef]
  36. Kim, N.; Graham, S. Development of Highly Flexible and Ultra-Low Permeation Rate Thin-Film Barrier Structure for Organic Electronics. Thin Solid Films 2013, 547, 57–62. [Google Scholar] [CrossRef]
  37. Priolo, M.A.; Gamboa, D.; Holder, K.M.; Grunlan, J.C. Super Gas Barrier of Transparent Polymer-Clay Multilayer Ultrathin Films. Nano Lett. 2010, 10, 4970–4974. [Google Scholar] [CrossRef]
  38. Song, Y.; Tzeng, P.; Grunlan, J.C. Super Oxygen and Improved Water Vapor Barrier of Polypropylene Film with Polyelectrolyte Multilayer Nanocoatings. Macromol. Rapid Commun. 2016, 37, 963–968. [Google Scholar] [CrossRef]
  39. Moisan, J.Y. Effects of Oxygen Permeation and Stablliser Migration on Polymer Degradation. In Polymer Permeability; Comyn, J., Ed.; Springer: Dordrecht, The Netherlands, 2008; pp. 119–176. [Google Scholar] [CrossRef]
  40. Carcia, P.F. 4.19 Thin-Film Diffusion Barriers for Electronic Applications. In Comprehensive Materials Processing; Hashmi, S., Batalha, G.F., Van Tyne, C.J., Yilbas, B., Eds.; Elsevier: Oxford, UK, 2014; Volume 4, pp. 463–498. [Google Scholar] [CrossRef]
  41. Solovyov, S.E.; Goldman, A.Y. Permeability of Multi-Layer Structures. E-polymers 2004, 4, 023. [Google Scholar] [CrossRef]
  42. Liu, G.; Li, B.; Hu, K.; van Genuchten, M.T. Simulating the Gas Diffusion Coefficient in Macropore Network Images: Influence of Soil Pore Morphology. Soil Sci. Soc. Am. J. 2006, 70, 1252–1261. [Google Scholar] [CrossRef]
  43. Van Bree, I.; De Meulenaer, B.; Samapundo, S.; Vermeulen, A.; Ragaert, P.; Maes, K.C.; De Baets, B.; Devlieghere, F. Predicting the Headspace Oxygen Level due to Oxygen Permeation across Multilayer Polymer Packaging Materials: A Practical Software Simulation Tool. Innov. Food Sci. Emerg. Technol. 2010, 11, 511–519. [Google Scholar] [CrossRef]
  44. Mueller, K.; Weisser, H. Numerical Simulation of Permeation through Vacuum-Coated Laminate Films. Packag. Technol. Sci. 2002, 15, 29–36. [Google Scholar] [CrossRef]
  45. Bhunia, K.; Dhawan, S.; Sablani, S.S. Modeling the Oxygen Diffusion of Nanocomposite-Based Food Packaging Films. J. Food Sci. 2012, 77, N29–N38. [Google Scholar] [CrossRef]
  46. COMSOL. Available online: https://www.comsol.com/ (accessed on 18 July 2023).
  47. Vogiatzis, G.G.; Theodorou, D.N. Multiscale Molecular Simulations of Polymer-Matrix Nanocomposites: Or What Molecular Simulations Have Taught Us about the Fascinating Nanoworld. Arch. Comput. Methods Eng. 2018, 25, 591–645. [Google Scholar] [CrossRef] [PubMed]
  48. Akhukov, M.A.; Chorkov, V.A.; Gavrilov, A.A.; Guseva, D.V.; Khalatur, P.G.; Khokhlov, A.R.; Kniznik, A.A.; Komarov, P.V.; Okun, M.V.; Potapkin, B.V.; et al. MULTICOMP Package for Multilevel Simulation of Polymer Nanocomposites. Comput. Mater. Sci. 2023, 216, 111832. [Google Scholar] [CrossRef]
  49. Bicerano, J. Prediction of Polymer Properties, 3rd ed.; Marcel Dekker: New York, NY, USA, 2009. [Google Scholar]
  50. Askadskii, A.A. Computational Materials Science of Polymers; Cambridge Int Science Publishing: Cambridge, UK, 2003. [Google Scholar]
  51. Liu, Q.L.; Huang, Y. Transport Behavior of Oxygen and Nitrogen through Organasilicon-Containing Polystyrenes by Molecular Simulation. J. Phys. Chem. B 2006, 110, 17375–17382. [Google Scholar] [CrossRef] [PubMed]
  52. Graham, T. XVIII. On the Absorption and Dialytic Separation of Gases by Colloid Septa. Philos. Trans. R. Soc. Lond. 1866, 156, 399–439. [Google Scholar] [CrossRef]
  53. Mitchell, J.K. On the Penetrativeness of Fluids. J. Memb. Sci. 1995, 100, 11–16. [Google Scholar] [CrossRef]
  54. Lian, S.; Zhang, J.; Wang, J.; Xu, C.; Swart, H.C.; Terblans, J.J. A Model for Adsorption and Diffusion in Water Vapor Barrier Films. Phys. Status Solidi B Basic Res. 2021, 258, 2000609. [Google Scholar] [CrossRef]
  55. Seo, S.-W.; Chae, H.; Joon Seo, S.; Kyoon Chung, H.; Min Cho, S. Extremely Bendable Thin-Film Encapsulation of Organic Light-Emitting Diodes. Appl. Phys. Lett. 2013, 102, 161908. [Google Scholar] [CrossRef]
  56. Nielsen, L.E. Models for the Permeability of Filled Polymer Systems. J. Macromol. Sci. Rev. Macromol. Chem. Phys. 1967, 1, 929–942. [Google Scholar] [CrossRef]
  57. Cui, Y.; Kumar, S.; Rao Kona, B.; van Houcke, D. Gas Barrier Properties of Polymer/clay Nanocomposites. RSC Adv. 2015, 5, 63669–63690. [Google Scholar] [CrossRef]
  58. Cui, Y.; Kundalwal, S.I.; Kumar, S. Gas Barrier Performance of Graphene/polymer Nanocomposites. Carbon 2016, 98, 313–333. [Google Scholar] [CrossRef]
  59. Wakeham, W.A.; Mason, E.A. Diffusion through Multiperforate Laminae. Ind. Eng. Chem. Fundam. 1979, 18, 301–305. [Google Scholar] [CrossRef]
  60. Aris, R. On a Problem in Hindered Diffusion. Arch. Ration. Mech. Anal. 1986, 95, 83–91. [Google Scholar] [CrossRef]
  61. Falla, W.R.; Mulski, M.; Cussler, E.L. Estimating Diffusion through Flake-Filled Membranes. J. Memb. Sci. 1996, 119, 129–138. [Google Scholar] [CrossRef]
  62. Askadskii, A.A.; Afanas’ev, E.S.; Matseevich, T.A.; Popova, M.N.; Kovriga, O.V.; Kondrashchenko, V.I. The Calculation Scheme for Estimation of the Water Permeability through Polymers and Copolymers. Polym. Sci. Series A 2015, 57, 924–945. [Google Scholar] [CrossRef]
  63. Matseevich, T.A.; Zhdanova, T.V.; Matseevich, A.V.; Askadskii, A.A. Relationship between Water Permeability and Physical Characteristics of Polyolefins, Vinyl Polymers, and Polycarbonates. IOP Conf. Ser. Mater. Sci. Eng. 2021, 1015, 012065. [Google Scholar] [CrossRef]
  64. InChI Trust. Available online: https://www.inchi-trust.org/ (accessed on 18 July 2023).
  65. InChI Encoding of Polymers Current Results and Further Tasks. Available online: https://www.inchi-trust.org/wp/wp-content/uploads/2017/11/23.-InChI-Polymer-Yerin-201708.pdf (accessed on 18 July 2023).
  66. Cozmuta, I.; Blanco, M.; Goddard, W.A., 3rd. Gas Sorption and Barrier Properties of Polymeric Membranes from Molecular Dynamics and Monte Carlo Simulations. J. Phys. Chem. B 2007, 111, 3151–3166. [Google Scholar] [CrossRef] [PubMed]
  67. Meunier, M. Diffusion Coefficients of Small Gas Molecules in Amorphous Cis-1,4-Polybutadiene Estimated by Molecular Dynamics Simulations. J. Chem. Phys. 2005, 123, 134906. [Google Scholar] [CrossRef]
  68. Zhao, L.; Zhai, D.; Liu, B.; Liu, Z.; Xu, C.; Wei, W.; Chen, Y.; Gao, J. Grand Canonical Monte Carlo Simulations for Energy Gases on PIM-1 Polymer and Silicalite-1. Chem. Eng. Sci. 2012, 68, 101–107. [Google Scholar] [CrossRef]
  69. Neyertz, S.; Brown, D. Single- and Mixed-Gas Sorption in Large-Scale Molecular Models of Glassy Bulk Polymers. Competitive Sorption of a Binary CH4/N2 and a Ternary CH4/N2/CO2 Mixture in a Polyimide Membrane. J. Memb. Sci. 2020, 614, 118478. [Google Scholar] [CrossRef]
  70. Tocci, E.; Caravella, A.; Rizzuto, C.; Barbieri, G.; Moo Lee, Y.; Drioli, E. CHAPTER 1. Modelling of Gas Separation in Thermally Rearranged Polymeric Membranes. In Membrane Engineering for the Treatment of Gases: Gas-Separation Issues with Membranes; Drioli, E., Barbieri, G., Brunetty, A., Eds.; Royal Society of Chemistry: Cambridge, UK, 2017; pp. 1–27. [Google Scholar] [CrossRef]
  71. Sava, D.F.; Rodriguez, M.A.; Chapman, K.W.; Chupas, P.J.; Greathouse, J.A.; Crozier, P.S.; Nenoff, T.M. Capture of Volatile Iodine, a Gaseous Fission Product, by Zeolitic Imidazolate Framework-8. J. Am. Chem. Soc. 2011, 133, 12398–12401. [Google Scholar] [CrossRef]
  72. Sava, D.F.; Chapman, K.W.; Rodriguez, M.A.; Greathouse, J.A.; Crozier, P.S.; Zhao, H.; Chupas, P.J.; Nenoff, T.M. Competitive I2 Sorption by Cu-BTC from Humid Gas Streams. Chem. Mater. 2013, 25, 2591–2596. [Google Scholar] [CrossRef]
  73. Zhou, W.; Zhang, Z.; Wang, H.; Yang, X. Molecular Investigation of CO/CH Competitive Adsorption and Confinement in Realistic Shale Kerogen. Nanomaterials 2019, 9, 1646. [Google Scholar] [CrossRef] [PubMed]
  74. Li, J.; Wang, Y.; Chen, Z.; Rahman, S.S. Insights into the Molecular Competitive Adsorption Mechanism of CH/CO in a Kerogen Matrix in the Presence of Moisture, Salinity, and Ethane. Langmuir 2021, 37, 12732–12745. [Google Scholar] [CrossRef] [PubMed]
  75. Berendsen, H.J.C.; Grigera, J.R.; Straatsma, T.P. The Missing Term in Effective Pair Potentials. J. Phys. Chem. 1987, 91, 6269–6271. [Google Scholar] [CrossRef]
  76. Ge, X.; Starnes, W.H., Jr. Potential Synthesis of poly(1,2-Dichloroethylene) via a Ring-Opening Metathesis Polymerization. J. Vinyl Addit. Technol. 2011, 17, 120–124. [Google Scholar] [CrossRef]
  77. Sun, H. Ab Initio Calculations and Force Field Development for Computer Simulation of Polysilanes. Macromolecules 1995, 28, 701–712. [Google Scholar] [CrossRef]
  78. Yampolskii, Y.; Shishatskii, S.; Alentiev, A.; Loza, K. Group Contribution Method for Transport Property Predictions of Glassy Polymers: Focus on Polyimides and Polynorbornenes. J. Memb. Sci. 1998, 149, 203–220. [Google Scholar] [CrossRef]
  79. Andersen, H.C. Molecular Dynamics Simulations at Constant Pressure And/or Temperature. J. Chem. Phys. 1980, 72, 2384–2393. [Google Scholar] [CrossRef]
  80. Berendsen, H.J.C.; Postma, J.P.M.; van Gunsteren, W.F.; DiNola, A.; Haak, J.R. Molecular Dynamics with Coupling to an External Bath. J. Chem. Phys. 1984, 81, 3684–3690. [Google Scholar] [CrossRef]
  81. Sun, H. COMPASS: An Ab Initio Force-Field Optimized for Condensed-Phase ApplicationsOverview with Details on Alkane and Benzene Compounds. J. Phys. Chem. B 1998, 102, 7338–7364. [Google Scholar] [CrossRef]
  82. Mayo, S.L.; Olafson, B.D.; Goddard, W.A. DREIDING: A Generic Force Field for Molecular Simulations. J. Phys. Chem. 1990, 94, 8897–8909. [Google Scholar] [CrossRef]
  83. Celebi, A.T.; Jamali, S.H.; Bardow, A.; Vlugt, T.J.H.; Moultos, O.A. Finite-Size Effects of Diffusion Coefficients Computed from Molecular Dynamics: A Review of What We Have Learned so Far. Mol. Simul. 2021, 47, 831–845. [Google Scholar] [CrossRef]
  84. NIMS Materials Database (MatNavi). Available online: https://mits.nims.go.jp/en/ (accessed on 3 July 2023).
  85. Lightfoot, J.C.; Buchard, A.; Castro-Dominguez, B.; Parker, S.C. Comparative Study of Oxygen Diffusion in Polyethylene Terephthalate and Polyethylene Furanoate Using Molecular Modeling: Computational Insights into the Mechanism for Gas Transport in Bulk Polymer Systems. Macromolecules 2022, 55, 498–510. [Google Scholar] [CrossRef]
  86. Berens, A.R.; Hopfenberg, H.B. Diffusion of Organic Vapors at Low Concentrations in Glassy PVC, Polystyrene, and PMMA. J. Memb. Sci. 1982, 10, 283–303. [Google Scholar] [CrossRef]
  87. Börjesson, A.; Erdtman, E.; Ahlström, P.; Berlin, M.; Andersson, T.; Bolton, K. Molecular Modelling of Oxygen and Water Permeation in Polyethylene. Polymer 2013, 54, 2988–2998. [Google Scholar] [CrossRef]
  88. Lu, C.; Ni, S.; Chen, W.; Liao, J.; Zhang, C. A Molecular Modeling Study on Small Molecule Gas Transportation in Poly (chloro-P-Xylylene). Comput. Mater. Sci. 2010, 49, S65–S69. [Google Scholar] [CrossRef]
  89. Tung, K.-L.; Lu, K.-T.; Ruaan, R.-C.; Lai, J.-Y. MD and MC Simulation Analyses on the Effect of Solvent Types on Accessible Free Volume and Gas Sorption in PMMA Membranes. Desalination 2006, 192, 391–400. [Google Scholar] [CrossRef]
  90. Teleman, O.; Jönsson, B.; Engström, S. A Molecular Dynamics Simulation of a Water Model with Intramolecular Degrees of Freedom. Mol. Phys. 1987, 60, 193–203. [Google Scholar] [CrossRef]
  91. Kulasinski, K.; Guyer, R.; Keten, S.; Derome, D.; Carmeliet, J. Impact of Moisture Adsorption on Structure and Physical Properties of Amorphous Biopolymers. Macromolecules 2015, 48, 2793–2800. [Google Scholar] [CrossRef]
  92. Chen, M.; Zhang, C.; Shomali, A.; Coasne, B.; Carmeliet, J.; Derome, D. Wood–moisture Relationships Studied with Molecular Simulations: Methodological Guidelines. Forests 2019, 10, 628. [Google Scholar] [CrossRef]
  93. Thomas, N.L. The Barrier Properties of Paint Coatings. Prog. Org. Coat. 1991, 19, 101–121. [Google Scholar] [CrossRef]
  94. Rogers, C.E. Permeation of Gases and Vapours in Polymers. In Polymer Permeability; Springer: Dordrecht, The Netherlands, 1985; pp. 11–73. [Google Scholar] [CrossRef]
  95. Rogers, C.E. Permeability and Chemical Resistance. In Engineering Design for Plastics; Baer, E., Ed.; Reinhold Publ. Corp.: New York, NY, USA, 1964; pp. 608–688. [Google Scholar]
  96. Rovera, C.; Ghaani, M.; Farris, S. Nano-Inspired Oxygen Barrier Coatings for Food Packaging Applications: An Overview. Trends Food Sci. Technol. 2020, 97, 210–220. [Google Scholar] [CrossRef]
  97. Ammala, A.; Pas, S.J.; Lawrence, K.A.; Stark, R.; Webb, R.I.; Hill, A.J. Poly(m-xylene adipamide)-montmorillonite nanocomposites: Effect of organo-modifier structure on free volume and oxygen barrier properties. J. Mater. Chem. 2008, 18, 911–916. [Google Scholar] [CrossRef]
  98. Rajasekar, R.; Kim, N.H.; Jung, D.; Kuila, T.; Lim, J.K.; Park, M.J.; Lee, J.H. Electrostatically Assembled Layer-by-Layer Composites Containing Graphene Oxide for Enhanced Hydrogen Gas Barrier Application. Compos. Sci. Technol. 2013, 89, 167–174. [Google Scholar] [CrossRef]
  99. Choi, J.H.; Park, Y.W.; Park, T.H.; Song, E.H.; Lee, H.J.; Kim, H.; Shin, S.J.; Fai, V.L.C.; Ju, B.-K. Fuzzy Nanoassembly of Polyelectrolyte and Layered Clay Multicomposite toward a Reliable Gas Barrier. Langmuir 2012, 28, 6826–6831. [Google Scholar] [CrossRef]
  100. Voevodin, V.V.; Antonov, A.S.; Nikitenko, D.A.; Shvets, P.A.; Sobolev, S.I.; Sidorov, I.Y.; Stefanov, K.S.; Voevodin, V.V.; Zhumatiy, S.A. Supercomputer Lomonosov-2: Large Scale, Deep Monitoring and Fine Analytics for the User Community. Supercomput. Front. Innov. 2019, 6, 4–11. [Google Scholar]
Figure 1. Models of a barrier layer based on hybrid organic–inorganic multilayer films: (a) orientationally disordered filler particles and (b) laminate structure with orientationally ordered filler particles. Different colors of the layers schematically show the use of different materials for the formation of the multilayer protective films.
Minerals 13 01151 g001
Figure 2. General scheme for calculating permeability using combined MD and GCMC modeling.
Minerals 13 01151 g002
Figure 3. Chain models of selected polymers (a) polyethylene (PE), (b) polyvinylidene fluoride (PVDF), (c) polytetrafluoroethylene (PTFE), (d) polyethylene terephthalate (PET), and material samples built on their basis. The grey and blue colors in the simulation cells show the outer and inner sides of the Connolly surfaces constructed by rolling a test ball of radius 1A.
Minerals 13 01151 g003
Figure 4. Calculated MSD curves obtained for (a) oxygen and (b) water molecules for PET, PE, PVDF, and PTFE at 300 K. Each curve is the result of averaging 10 MD runs. Dashed lines show the value of the diffusion coefficient estimated by a linear approximation.
Minerals 13 01151 g004
Figure 5. Calculated dependencies of the number of (a) oxygen and (b) water molecules in the simulation cell Ncell(p) for the selected polymer materials PET, PE, PVDF, and PTFE obtained using the PCFF force field.
Minerals 13 01151 g005
Figure 6. The calculated dependence of the ratio of the permeability of the polymer layer with fillers P to the permeability of a pure polymer layer Pp on the filler volume fraction with the aspect ratio of α = 60 at different values of the angle θmax = 12.5°, 25°, and 45°.
Minerals 13 01151 g006
Figure 7. Vapor permeability of the modified protective coating with a clay–polymer laminate layer as a function of the number of laminate bilayers for clay particle sizes of 1, 3, 10, and 30 µm.
Minerals 13 01151 g007
Table 1. Densities and free volume fractions for PET, PE, PVDF, and PTFE.
Material
PropertyPETPEPVDFPTFE
Density (g/cm3)1.4 ± 0.050.9 ± 0.051.8 ± 0.12.1 ± 0.1
Free volume
fraction
0.13 ± 0.050.30 ± 0.050.23 ± 0.09<0.25
Table 3. Solubility coefficients of oxygen and water molecules for PET, PE, PVDF, and PTFE.
S(O2) (cm3(STP)/(cm3Pa))S(H2O) (cm3(STP)/(cm3Pa))
MaterialCalculationExperiment [84]CalculationExperiment [84]
PET2.2 ± 0.8 × 10−86–10 × 10−77.2 ± 0.7 × 10−63–8 × 10⁻⁹
PE2.0 ± 1.0 × 10−82–5 × 10−71.5 ± 2 × 10−65.8 × 10−8
PVDF2.5 ± 1.5 × 10−83.6 × 10−76.5 ± 0.6 × 10⁻⁶
PTFE6.0 ± 1.0 × 10−76–9 × 10−78 ± 1.5 × 10⁻⁶
Table 4. Permeability coefficients of oxygen and water molecules for PET, PE, PVDF, and PTFE.
P(O2) (Barrer)P(H2O) (Barrer)
MaterialMD-GCMC
Simulations
Bicerano ModelExperiment [39,84]MD-GCMC
Simulations
Askadskii ModelExperiment [39,84]
PET0.01–0.020.040.013–51–287100–1300
PE0.2–0.64.470.04–52–126020–75
PVDF0.07–0.28.910.02–1.88–30193
PTFE17–227.652.5–610–503283–8
Disclaimer/Publisher’s Note: The statements, opinions and data contained in all publications are solely those of the individual author(s) and contributor(s) and not of MDPI and/or the editor(s). MDPI and/or the editor(s) disclaim responsibility for any injury to people or property resulting from any ideas, methods, instructions or products referred to in the content.

