
Genesis of the Mahour Base Metal Deposit, Iran: Constraints from Fluid Inclusions and Sulfur Isotopes


1
Department of Economic Geology, Tarbiat Modares University, Tehran 14115-175, Iran
2
Departament d’Enginyeria Minera, Industrial i TIC, Universitat Politècnica de Catalunya, 08242 Barcelona, Spain
*
Author to whom correspondence should be addressed.
Minerals 2024, 14(4), 435; https://doi.org/10.3390/min14040435
Submission received: 5 March 2024
/
Revised: 12 April 2024
/
Accepted: 19 April 2024
/
Published: 22 April 2024
(This article belongs to the Special Issue New Insights into Porphyry, Epithermal, and Skarn Deposits)
Abstract
:The Mahour base metal deposit is located northeast of Badroud in the middle of the Urumieh–Dokhtar magmatic arc in the Isfahan province of Iran. The main host rocks to the ores are Eocene volcanic and volcaniclastic rocks. Hypogene ore minerals constituting the main ore body are galena, sphalerite, pyrite, and chalcopyrite. In addition to gangue quartz, a variety of supergene minerals comprising gypsum, goethite, hematite, “limonite”, malachite, azurite, covellite, and chalcocite are also present; gangue minerals are quartz, barite, calcite, sericite, and chlorite. Silicification, intermediate argillic, and propylitic are the main wall-rock alteration types. The presence of fluid inclusions with different vapor/liquid ratios in quartz and sphalerite could indicate a boiling process. The primary liquid-rich fluid inclusions suggest that the homogenization temperature was between 107 and 298 °C from fluids with salinities from 1.5 to 13.7 wt.% NaCl equiv. These data suggest that the ore-forming fluids were magmatic with a contribution from meteoric waters. The δ34S values of sulfides range from 1.9 to 3.4‰, those of barite range from 12.1 to 13.2‰, and those of gypsum range from 4.3 to 5.6‰. These data suggest that sulfur was mostly of magmatic origin with a minor contribution from sedimentary rocks. Our data suggest that the boiling of fluids formed an intermediate-sulfidation style of epithermal mineralization for the Mahour deposit.
1. Introduction
The Urumieh–Dokhtar magmatic arc (UDMA), as a part of the Tethyan belt, is regarded as an important metallogenic province in Iran [1,2]. Based on geological and geodynamic models, most Iranian deposits formed in connection with related magmatism or calc-alkaline volcanic arcs of this belt [3]. They occurred during the stages of opening, subduction, and closure of the Neotethys Ocean, as well as the post-collisional processes. Considering the geodynamic location, this magmatic belt hosts important types of metal mineralization (e.g., copper-molybdenum porphyry deposits of Sar Cheshmeh, Meiduk, Sungun, Panj Kuh, Darreh Zereshk, and Ali-Abad) [4,5,6,7,8] and also epithermal gold deposits at Hizehjan, Masjeddaghi, Zaylik, and Safikhanlou [9,10,11], Chah Zard [12,13,14,15], as well as Bazman [16]. The Mahour epithermal base metal deposit is located 40 km northeast of Badroud, a suburb of the city of Natanz in the Isfahan province of central Iran (Figure 1). Geological studies, the structure and texture of minerals, mineralogy, and alteration and geochemical investigations (including fluid inclusion studies and sulfur isotope analyses) provide the formation model and type of mineralization for the Mahour deposit and also aim at shedding light on the genesis of the base metal deposits in the middle of the UDMA.
2. Regional Geology
The Iranian Plateau is situated in the middle of the Alpine-Himalayan orogenic and metallogenic belt. The formation of the Iranian Plateau took place during the complex processes of the collision event that followed the separation of continental blocks from the northern margins of Gondwana and their addition to the southern margin of Eurasia [17,18]. The formation and evolution of the Iranian Plateau are related to the opening and closure of two large oceans, Paleo-Tethys and Neotethys. The Paleo-Tethys Ocean opened in the Precambrian and caused the separation of the Iran plate from Eurasia. This ocean closed during the Late Triassic. The Neotethys Ocean between the Iranian and Arabian plates opened during the Permian and lasted from the upper Mesozoic to the lower Cenozoic. The closure time of the Neotethys Ocean is considered to last from the Upper Cretaceous to the Miocene [17,19]. The UDMA formed in connection with the subduction of the Neotethys lithosphere under Central Iran and the collision of the Arabian and Iranian plates [18,19].
The Mahour base metal deposit, along with several other deposits, occurs in the Saveh–Yazd magmatic arc in the middle of the UDMA (Figure 1) [20]. The oldest rocks identified in this arc include Infracambrian to Paleozoic sedimentary rocks covered by volcanic rocks or intruded by Cenozoic intrusive masses. Cenozoic magmatism is divided into two phases: 1. Paleogene intense volcanism, followed by mafic to felsic intrusions from Oligocene to Miocene [21]; 2. late Miocene to Quaternary adakitic magmatism. Paleogene magmatism happened during the Eocene and seemed to be associated with the Neotethys subduction [22]. It seems that Neogene magmatism was related to slab break-off and thermal re-equilibration in a post-collisional environment. The Mahour deposit is located in the middle of this magmatic arc and is hosted by Paleogene volcanics.
The Mahour area is a small part of the 1:100,000 geological sheet of Kuh-e-Latif [23]. The area is structurally located at the intersection of Central Iran and the UDMA zone. According to the diversity in the composition of rocks and deposits, the rocks of the area are mainly of Eocene igneous units, including granite, granodiorite, andesite, trachy-andesite, and many pyroclastic units. Sedimentary rocks mostly include marls, shales, and limestones, and are characterized by flat and low topography. The range of Eocene volcanic rocks of the northern margin is mostly composed of Eocene igneous rocks that are alternately placed on the sedimentary units, where numerous intrusive masses from granodiorite to granite and all kinds of acidic igneous rocks are observed. The strata in the studied area comprise a volcano-sedimentary sequence from the Precambrian to the present.
3. Geological Features of the Mahour Deposit
3.1. Ore Deposit Geology
Based on field and laboratory studies, the outcropped units in the Mahour deposit are volcanic and volcaniclastic rocks of the Eocene age. In the following, these rocks will be introduced. A green tuff unit (Et1) contains interlayers of andesite basalt lavas. Nearly half of the rock outcrops have covered the map area, which has a relatively gentle morphology and is composed of green to light gray tuffs with interlayers of basaltic andesite lavas with dark gray to black coloration (Ean1). This rock unit is under the influence of argillic alteration in most parts and has undergone sericitic alteration locally (Figure 2A). Andesite to andesitic basalt units (Ean1), with dark gray to black outcrops, are exposed as interlayers inside the Ead1 unit. This rock unit, with a general N–S direction and a thickness of less than 10 m, can be seen in the middle and eastern parts of the 1:1000 map of the mining area. The freshly broken and non-weathered surface of the rock is red to dark gray and has a porphyritic texture that is more or less associated with the carbonate and sericite alteration types (Figure 2B). The andesite tuff unit (Eant), with a gray-green color, covers a limited area in the SW of the mountain range. This unit has a moderate to relatively rough morphology and is corroded and weathered in surface outcrops. The contact of this unit is faulted with the andesite-andesitic basalt lava unit (Et1) (Figure 2C). The crystal tuff unit (Et2), with gray to light green outcrop, occurs in the north of the map. This unit has a hilly morphology and is mainly composed of crystal tuff, but in some places, it is accompanied by interlayers of red andesitic lavas, which are 2 to 10 m thick. This unit has a faulted contact with an andesite-andesitic basalt lava unit (Et1). The northeastern part of the unit has undergone propylitic alteration (Figure 2D). The andesite to hornblende andesite unit (Ean2) covers limited outcrops of rock units in the area and is exposed as interlayers in the Et2 unit and the north of the mountain range. The contact between this unit and the Et2 unit is normal (Figure 2E). The trachy-andesite lava unit is marked as Eta on the map (Figure 1). This unit, with black outcrop, varnished, broken, gray in color, and with a high and rocky morphology, has formed a small outcrop in the western part of the studied area. The unit has undergone argillic alteration and sericite carbonate alteration in some parts. The presence of carbonate and sericite makes the surface of outcrops of this unit light-colored (Figure 2F).
3.2. Mineralized Veins
Mineralization at the Mahour deposit, which is hosted by volcanic and volcaniclastic rocks of Eocene age, comprises NW–SE-trending quartz-sulfide veins (Figure 1). The main outcrops of mineralization in the Mahour area are three mineralized quartz veins, and the green tuff unit (ET1 unit) and the andesite tuff unit (Eant unit). These three veins are named 1, 2, and 3 according to the importance and dimensions of mineralization. Vein No. 1 is the main and largest siliceous vein exposed in the studied area. This vein, about 30 m long and 1 m thick, trends N145 and dips 75° NE in the green tuff unit (ET1). Ore paragenesis in the vein includes chalcopyrite, pyrite, galena, and sphalerite. Chalcopyrite was replaced by malachite and azurite under the influence of supergene processes. Based on the textural relationships, it seems that the siliceous zone is cut by the barite vein. This vein is associated with the surrounding siliceous alteration. The main alteration in these veins is siliceous-sulfide alteration, and it is accompanied by argillic alteration in the surroundings. This quartz vein is accompanied by significant amounts of copper, lead, and zinc (Figure 3A). Quartz vein No. 2 with an NW–SE direction (N110), a length of about 15 m, and an average thickness of 0.5 m, is hosted by the green tuff unit (ET1). Metal mineralization in the quartz vein includes chalcopyrite, pyrite, galena, and sphalerite. This vein is surrounded by silicic alteration, quartz veins, as well as argillic alteration. In addition to copper, lead, and zinc, this silica vein is also associated with high gold and silver contents (Figure 3B,C). Vein No. 3, with a length of 2 m and a thickness of less than 0.5 m, trends N130. The paragenesis of this vein consists of hematite, pyrite, galena, malachite, azurite, and secondary and amorphous oxide-hydroxides (Figure 3D,E). This quartz vein, like veins No. 1 and 2, apart from Cu, Pb, and Zn, is associated with significant Au and Ag contents.
3.3. Ore Mineralogy
The ore minerals at Mahour are galena, sphalerite, pyrite, and chalcopyrite. Supergene minerals include gypsum, goethite, hematite, “limonite”, malachite, azurite, covellite, and chalcocite. Pyrite is one of the most common and early-formed sulfide minerals that occurs in all mineral deposits [24], as is the case in the Mahour deposit, which can occur in all stages of mineralization. Pyrite is present in the form of subhedral to cubic crystals and is usually together with chalcopyrite. According to mineralogical studies, pyrite is seen in two generations. The first generation includes microcrystalline to medium-grained pyrite (20–60 μm) and euhedral to subhedral crystals, which appear disseminated in the pyroclastic units (Figure 4A). In the second generation, pyrite is present in a subhedral to anhedral form along with galena, sphalerite, and chalcopyrite, as inclusion and open space filling (Figure 4B). Chalcopyrite is the main and most abundant mineral in the region, which is mainly seen as massive crystals and in connection with sphalerite, galena, and sulfosalts in sulfide-bearing quartz veins and also in the space between parts of hydrothermal breccias. This mineral has often been seen as massive to subhedral crystals. In some places, chalcopyrite has replaced pyrite from the margins or along the fractures. In some parts, chalcopyrite encrusts euhedral pyrite crystals or pyrite complexes, indicating the formation of chalcopyrite after pyrite (Figure 4C). It has also been replaced by secondary minerals such as chalcocite, covellite, and goethite or sulfosalts (Figure 4D). Galena is the most abundant sulfide mineral in the Mahour area. It is also seen as euhedral crystals in the joints and fractures in the green-to-gray andesite to the andesite-basalt host rock (Figure 4E). Galena is replaced by sphalerite (Figure 4F). Sphalerite is observed in association with chalcopyrite and galena. It exists in an anhedral to subhedral form and, in microscopic sections, it is mostly seen as large crystals (up to several millimeters) (Figure 4F), and occasionally, they have been replaced by secondary minerals such as chalcocite, covellite, and digenite from the margin and along the fractures. On a textural basis, sphalerite and sulfosalts formed simultaneously (Figure 5).
Gangue minerals include quartz, barite, calcite, sericite, and chlorite. The most abundant gangue mineral at the Mahour deposit is quartz, which occurs in different time stages. It is observed with the comb (Figure 6A), open space filling (Figure 6B), mosaic (Figure 6C,D), and plumose textures (Figure 6E), as well as vein-veinlets (Figure 6F).
4. Analytical Methods
4.1. Fluid Inclusions
Fluid inclusion microthermometry was performed using the criteria of [25]. Fifteen samples of mineralized veins and breccias were selected from veins No. 1, 2, and 3 of the Mahour deposit for fluid inclusion studies. The measurements were carried out on 15 doubly polished sections (∼150 μm) of sphalerite. Fluid inclusions in the quartz grains were too small for microthermometric study. The size of the inclusions in the quartz grains was smaller than 3 μm, occurring as monophase liquid/vapor-rich inclusions. Therefore, the focus of this study is on the sphalerite samples. Petrographic and microthermometric studies of fluid inclusions were conducted at Tarbiat Modares University using the Linkam system with a TMS 94 thermal controller. Microscopic and petrographic studies were carried out using a Leitz microscope, and due to the small size of the fluid inclusions, an objective lens of 100X magnification was used. The working accuracy of the device in the freezing and heating stages is ±2 °C, and the temperature range of the device is between −180 and +600 °C. A total of 100 fluid inclusions were heated up to the homogenization temperature (Th). Salinity was calculated from the last ice-melting temperatures using the equation of [26] for the H2O–NaCl binary system.
4.2. Sulfur Isotopes
The samples chosen for sulfur isotope analysis were taken from mineralized breccias and quartz veins. Sulfur isotopes (n = 9) were measured using a Delta C Finnigan MAT mass spectrometer at the Centres Científics i Tecnològics of the Universitat de Barcelona, Spain. Results are reported as δ34S ‰ deviations from the Vienna Canyon Diablo Troilite (V-CDT) standard. The analytical precision is ±0.1‰ (1σ).
5. Results
5.1. Fluid Inclusion Studies
5.1.1. Types and Features of Fluid Inclusions
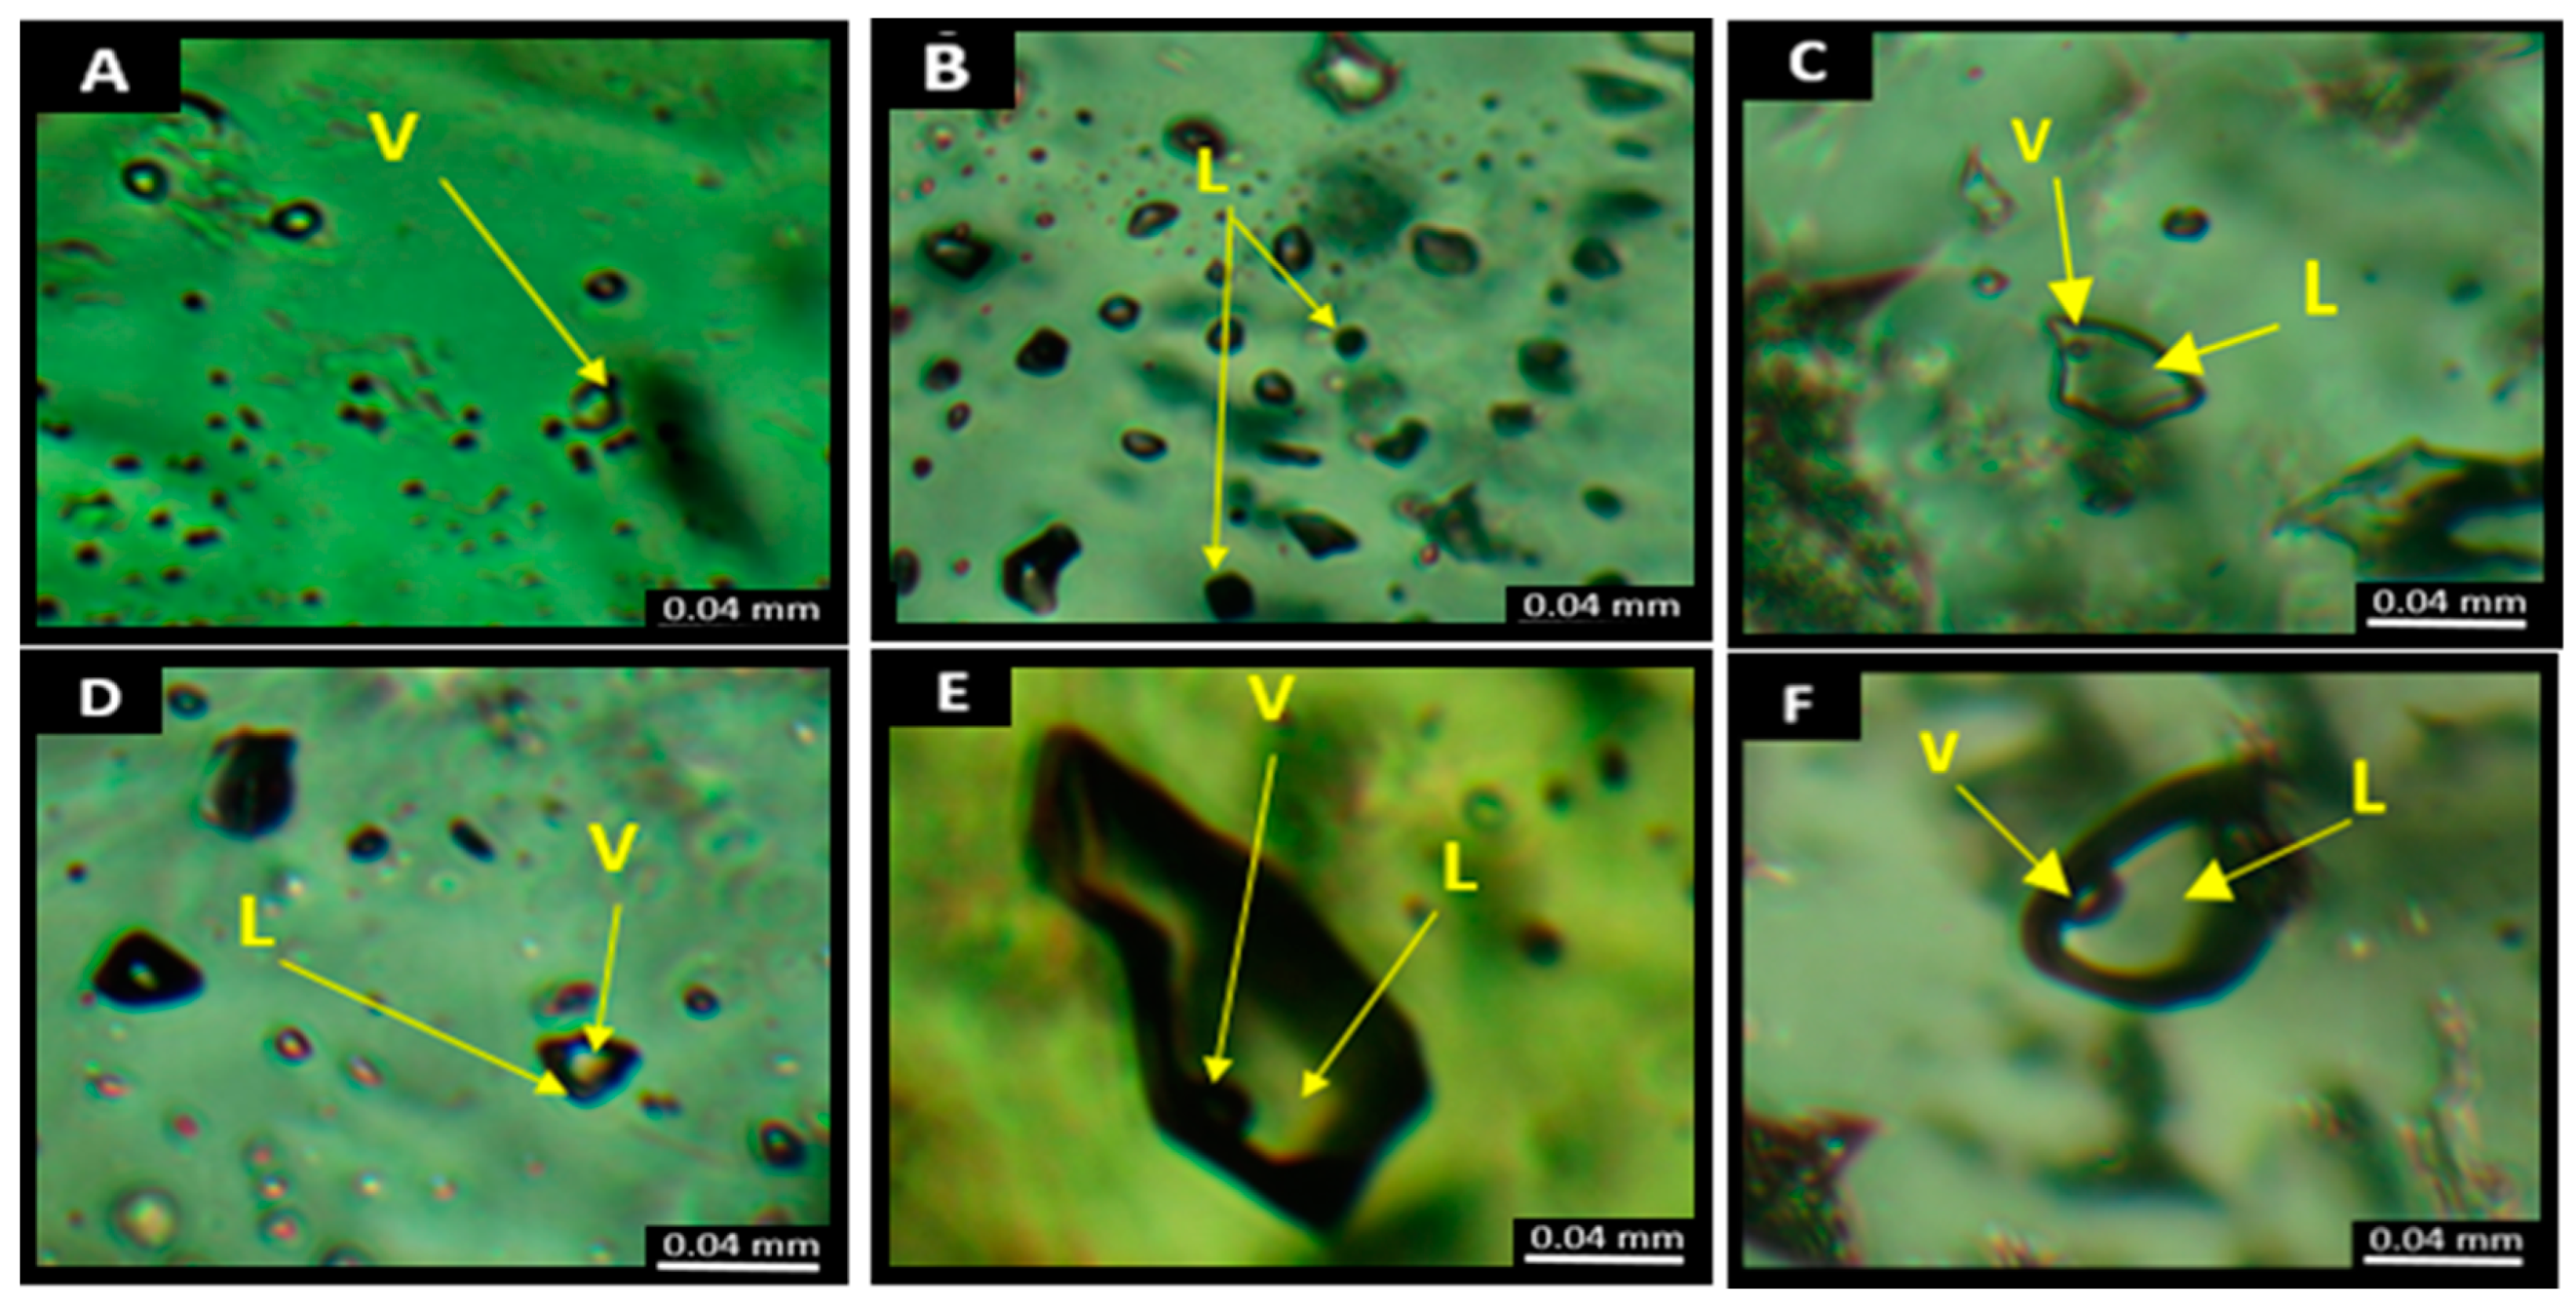
Fluid inclusions consist of solid, liquid, and gas phases and are divided into primary, secondary, and pseudo-secondary groups according to the time of formation [27]. Measurements were carried out only on primary inclusions [25,27,28]. The fluid inclusions in sphalerite were light-colored and 6 to 22 µm in size (Figure 7). Some inclusions show necking-down. Based on their phase relationships, four types of fluid inclusions are found at Mahour:
1. Vapor (V) fluid inclusions (Figure 7A). In the freezing experiments, neither liquid CO2 nor CH4 was observed; 2. Liquid (L) fluid inclusions (Figure 7B); 3. Two-phase vapor-rich VL fluid inclusions (Figure 7D); 4. Two-phase liquid-rich LV fluid inclusions (Figure 7C,E,F), which are the most dominant.
5.1.2. Microthermometry
The L and V inclusions were not studied and the VL inclusions, which were heterogeneously trapped, were not considered either. Most of the VL inclusions had variable Th values. Only the data obtained from microthermometry of LV inclusions with uniform L/V ratios were used. The mean values of fluid inclusion assemblages (FIAs), not those of individual fluid inclusions, are used. The microthermometric measurements were carried out for sphalerite only. The double-polished sections of the fluid inclusions were also prepared from the barite vein and the silica vein, but due to the small size of the inclusions, they could not be measured. The summary of microthermometric data is presented in Table 1.
These inclusions have Tm-ice ranging between −15 and −0.1 °C showing salinities of 1.5–13.7 (avg. 6.97) wt.% NaCl equiv. The values of Th for LV inclusions (to liquid state) range between 107.5 and 298.1 °C (avg. 160 °C).
5.2. Sulfur Isotope Studies
6. Discussion
6.1. Boiling Evidence
Genetically, various mineralogical, textural, and fluid inclusion characteristics are associated with boiling in epithermal systems. The best criterion for detecting boiling in epithermal mineralization is the existence of FIAs comprising LV and VL liquid inclusions (e.g., [30,31,32,33,34]). The presence of adularia, lamellar calcite, as well as plumose and banded colloform/crustiform quartz, imply boiling (e.g., [34,35,36,37,38,39]). According to [27], the association and simultaneity of gas-rich and liquid-rich fluid inclusions, necking-down in petrographic studies of vapor-rich fluid inclusions indicate their entrapment during boiling. Therefore, based on the available evidence, it seems that boiling in the hydrothermal system played the most important role in the mineralization of the Mahour deposit. One of the important shreds of evidence for boiling is the contemporaneous trapping of the fluid inclusions (e.g., [40,41]). The presence of plumose- and colloform-banded textures in the quartz veins at Mahour is also consistent with the possibility of boiling.
6.2. Source of Ore-Forming Fluids and Materials
Regarding the source and evolution of ore-forming fluids, stable isotope compositions can provide useful information (e.g., [27,42,43,44,45,46,47,48,49,50]). The δ34S values for sulfides from the Mahour deposit have a tight range, from 1.9 to 3.4‰, averaging 2.8‰ (Table 2), which is indicative that they came from a homogeneous source. The highest values of δ34S can be related to the involvement of heavy sulfur contained in sulfate of seawater origin that probably came from sediments that entered the magma production area during subduction [51]. Therefore, it seems that the isotopic composition of sulfur in the studied area is in good agreement with sulfur derived from mantle magma, where contamination with sedimentary rocks has been effective.
The isotopic composition of gypsum is similar to that of sulfides, which is explained by the fact that these were formed from sulfide oxidation. The formation of sulfate from the oxidation of sulfide does not produce isotopic fractionation, or it is very low [52,53]. The δ34S values of barite, which coexists in veins with other sulfides, are between +13.2 and +21.1‰, implying a fractionation with sulfides of about +10‰. These fractionations are greater than those that occur when sulfide is formed by the oxidation of sulfate. Similar fractionations have been found in other epithermal deposits, such as the Cobre–Babilonia deposit in Mexico [54], with values that are justified by a contribution of the sulfate present in the sedimentary rocks. This argument would also apply to the Mahour deposit.
6.3. Evolution of the Ore-Forming Fluids
The sulfur isotope data suggest that the ore-forming fluids at the Mahour deposit were possibly initiated from late Eocene magmatism. The scenario is similar for many other occurrences of epithermal mineralizations elsewhere (e.g., [32,55,56,57,58,59]), in which magmatic fluids are the main sources of metals.
The total Th for fluid inclusions from Mahour varies between 298 and 107 °C (avg. ca. 160 °C). This temperature range corresponds well with the temperature of epithermal environments (Figure 9). Based on the curve of Th versus salinity of the fluid inclusion data from the Mahour deposit, the trends indicate a combination of dilution with meteoric waters and cooling due to decreasing depth, accompanied by boiling in the later stages (Figure 10). The vapor-rich inclusions coexisting with liquid-rich inclusions and the occurrence of hydrothermal breccias at the Mahour ore deposit suggest that the ore-forming fluids boiled at the site of trapping during mineral deposition.
Based on the presented diagram for salinity and Th, which separates the types of mineralization systems, the analyzed fluid inclusions from the Mahour deposit are in the range of epithermal systems in terms of temperature and salinity (Figure 11). The salinity data obtained from this study (1.5–13.7 wt.% NaCl equiv.) suggest that boiling could have taken place during the evolution of mineralizing fluids.
6.4. Trapping Pressure
When the information obtained on the Th of the fluid inclusion is combined with the salinity data, the fluid density can be determined regardless of the trapping conditions. According to the diagram of Figure 12 [45], fluids with an average salinity of 6.97 wt.% NaCl equiv. and an average Th of 160 °C have an approximate density of 1.06 g/cm3 (using the salinity vs. homogenization temperature diagram of [63]) and a pressure of less than 50 bars (Figure 12).
6.5. Sulfidation State
The classification by [35] divides epithermal deposits into three categories: low-, intermediate-, and high-sulfidation. Based on the tectonic setting, paragenetic sequence, vein-veinlet ore textures, and alteration types, Mahour can be considered to exhibit volcanic-hosted epithermal mineralization. Sulfides and sulfosalts observed at the Mahour deposit include pyrite, tennantite-tetrahedrite, chalcopyrite, galena, and sphalerite. Quartz, barite, calcite, sericite, and chlorite are the gangue minerals. The salinity in the veins, colloform/crustiform, comb, plumose, and cockade ore textures, as well as alteration types at Mahour, are similar to those of intermediate-sulfidation epithermal mineralization (e.g., [37]).
6.6. Ore Genesis
Three stages have been identified for the geological evolution of the Mahour area, from which, stages 2 and 3 are related to the ore genesis at the Mahour deposit:
1. The first stage is associated with the formation of Eocene volcano-sedimentary sequences in the Mahour area (Figure 13A). On a regional scale, the formation of this unit can be associated with the oblique Neotethys Ocean subduction under the Central Iranian plate [8,19,64,65,66,67,68]. The large volume of volcanism in the UDMA is the result of the subduction zone prevailing in the margin of the Central Iran plate during the Eocene.
2. The second stage is associated with the emplacement of intrusive masses in the volcano-sedimentary facies and the development of hydrothermal and ore-forming processes in the form of vein–veinlet occurrences and fractures filled with quartz veins at the Mahour deposit (Figure 13B). The penetration of intrusive masses caused the circulation of fluids and their concentration in areas with high permeability in the Eocene volcanic sequences. The co-existence of gas-rich and liquid-rich fluid inclusions suggests a boiling mechanism in epithermal base metal deposits. Due to the boiling, hydrothermal fractures formed and increased the permeability and, consequently, the concentration of fluids containing base metals, silver, and the rest of mineralization at the Mahour deposit. The occurrence of boiling is one of the main mechanisms leading to the instability and deposition of sulfide complexes carrying metals; increasing pH and H2S, according to [69]; as well as reducing temperature, pressure, and the boiling process, which causes the rapid separation of volatile substances (CO2, H2S, SO2, CH4) from the liquid phase to the vapor phase, leading to precipitation. According to the mentioned materials and evidence, it seems that the mineralization of base metals in the Mahour deposit is related to magmatic fluids that formed during the boiling process. In the epithermal deposits of base metals in Mexico, boiling is also regarded as the principal process of ore mineralization due to the temporal and spatial relationship of mineralization [70].
3. In the third stage, as a result of the erosion of the upper units, the mineralized part is exposed on the surface and is affected by the supergene and weathering processes, which involve the formation of minerals such as malachite, azurite, and iron hydroxide compounds (Figure 13C).
7. Conclusions
Mahour can be considered an intermediate-sulfidation epithermal deposit due to the following reasons:
- (1)
- The Eocene volcanic units (green tuff and andesite tuff units) host the deposit. Based on geochemical and petrological studies, the above units have a calc-alkaline composition and a shear and vein-veinlet structure.
- (2)
- Mineralization at the deposit is in the form of sulfides and sulfosalts, including galena, Fe-poor sphalerite, pyrite, chalcopyrite, and tetrahedrite-tennantite.
- (3)
- The alteration types observed at the deposit include carbonate-sericite, argillic, silicic-sulfide, and propylitic with a significant association to the mineralized part.
- (4)
- Studies of sulfur isotopes and fluid inclusions suggest that the Mahour deposit could have formed mainly from magmatic fluids.
- (5)
- The presence of fluid inclusions rich in L and V phases and the coexistence of high-salinity along with low-salinity fluids suggest a boiling mechanism in the Mahour deposit.
Author Contributions
Conceptualization, Z.M. and M.G.; methodology, M.G. and H.-A.T.; software, Z.M.; validation, M.G., H.-A.T. and P.A.; formal analysis, Z.M. and P.A.; investigation, Z.M.; resources, M.G.; data curation, Z.M.; writing—original draft preparation, Z.M.; writing—review and editing, M.G., H.-A.T. and P.A.; visualization, Z.M.; supervision, M.G. and H.-A.T.; project administration, M.G.; funding acquisition, M.G. and P.A. All authors have read and agreed to the published version of the manuscript.
Funding
Financial support was provided by Tarbiat Modares University Research Council (grant no. 9750121012), the AGAUR and the Universitat Politècnica de Catalunya through the Consolidated Research Group SGR 01041 (RIIS).
Data Availability Statement
The original contributions presented in the study are included in the article, further inquiries can be directed to the corresponding author.
Acknowledgments
This paper is part of the first author’s M.Sc. thesis at Tarbiat Modares University (TMU), Tehran, Iran. This research was made possible with the help of the TMU Research Council. The authors would like to thank the three anonymous reviewers for their constructive reviews of the manuscript.
Conflicts of Interest
The authors declare no conflicts of interest.
References
- Persian Gold Company. Annual Report and Accounts; Persian Gold Company: Tehran, Iran, 2007; 40p. [Google Scholar]
- Persian Gold Company. Interim Results for the Six-Month Exploration in Iran; Persian Gold Company: Tehran, Iran, 2008; 8p. [Google Scholar]
- Richards, J.P.; Sholeh, A. The Tethyan Tectonic History and Cu-Au Metallogeny of Iran. In 2016 Tectonics and Metallogeny of the Tethyan Orogenic Belt; Richards, J.P., Ed., SEG Special Publication: Houston, TX, USA, 2016; Volume 19, pp. 193–212. [Google Scholar]
- Hezarkhani, A.; Williams-Jones, A.E. Controls of alteration and mineralization in the Sungun porphyry copper deposit, Iran: Evidence from fluid inclusions and stable isotopes. Econ. Geol. 1998, 93, 651–670. [Google Scholar] [CrossRef]
- Hedenquist, J.W.; Daneshfar, B. Strategic prospectivity review of mineral potential: Middle East region. Rep. Met. Min. Agency Jpn. 2001. 68p. [Google Scholar]
- Zarasvandi, A.; Liaghat, S.; Zentilli, K. Geology of the Darreh-Zerreshk and Ali-Abad porphyry copper deposits, central Iran. Intl. Geol. Rev. 2005, 47, 620–646. [Google Scholar] [CrossRef]
- Zarasvandi, A.; Liaghat, S.; Zentilli, K. Porphyry copper deposits of the Urumieh-Dokhtar magmatic arc, Iran. In Super Porphyry Copper and Gold Deposits: A Global Perspective; Porter, T.M., Ed.; PGC Publishing: Adelaide, Australia, 2005; pp. 441–452. [Google Scholar]
- Shafiei, B.; Haschke, M.; Shahabpour, J. Recycling of orogenic arc crust triggers porphyry Cu mineralization in Kerman Cenozoic arc rocks, southeastern Iran. Miner. Depos. 2009, 44, 265–283. [Google Scholar] [CrossRef]
- Ebrahimi, S.; Alirezaei, S.; Pan, Y. Various epithermal precious metal systems in the Urumieh-Dokhtar magmatic assemblage, Iran. In Proceedings of the Goldschmidt Conference, Davos, Switzerland, 21–26 June 2009. [Google Scholar]
- Ebrahimi, S.; Alirezaei, S.; Pan, Y. Geological Setting, Alteration, and Fluid Inclusion Characteristics of Zaglic and Safikhanloo Epithermal Gold Prospects, NW Iran; Granite-Related Ore Deposits; Sial, A.N., Bettencourt, J.S., De Campos, C.P., Ferreira, V.P., Eds.; Special Publications; Geological Society: London, UK, 2011; Volume 350, pp. 133–147. [Google Scholar]
- Jamali, H.; Dilek, Y.; Daliran, F.; Yaghubpur, A.; Mehrabi, B. Metallogeny and tectonic evolution of the Cenozoic Ahar–Arasbaran volcanic belt, northern Iran. Intl. Geol. Rev. 2010, 52, 608–630. [Google Scholar] [CrossRef]
- Ghaderi, M.; Kouhestani, H. Chah Zard deposit: The first report of Ag-Au epithermal mineralization with brecciated host in Iran. In Proceedings of the 7th Annual Meeting of Asia Oceania Geosciences Society (AOGS), Hyderabad, India, 5–9 July 2010. [Google Scholar]
- Kouhestani, H.; Ghaderi, M.; Zaw, K. Chah Zard, a breccia-hosted epithermal silver-gold deposit in the Tethyan belt of Iran. In Proceedings of the 24th Victorian Universities Earth & Environmental Sciences Conference (VUEES), Melbourne, Australia, 5 November 2010. [Google Scholar]
- Ghaderi, M.; Kouhestani, H.; Zaw, K.; Meffre, S. U–Pb geochronology and Pb isotope characteristics of Chah Zard Ag–Au epithermal deposit, west-central Iran. In Proceedings of the 11th International Multidisciplinary Scientific Geo-Conference and EXPO (SGEM), Albena, Bulgaria, 19–25 June 2011; pp. 1039–1046. [Google Scholar]
- Ghaderi, M.; Kouhestani, H.; Zaw, K.; Meffre, S. Geochemistry and geochronology study on Chah Zard deposit: A breccia-hosted Ag-Au epithermal mineralization in Iran. In Proceedings of the 8th Annual Meeting of Asia Oceania Geosciences Society (AOGS), Taipei, Taiwan, 8–12 August 2011. [Google Scholar]
- Daliran, F.; Paar, W.; Neubauer, F.; Rashidi, B. New Discovery of epithermal gold at Chahnali prospect, Bazman volcano, SE-Iran. In Proceedings of the Mineral Deposit Research: Meeting the Global Challenge: Proceedings of the Eighth Biennial SGA Meeting, Beijing, China, 18–21 August 2005; pp. 917–919. [Google Scholar]
- Stocklin, J. Possible ancient continental margins in Iran. In Geology of Continental Margins; Bark, G.D., Drake, C.L., Eds.; Springer-Verlag: New York, NY, USA, 1974; pp. 873–887. [Google Scholar]
- Berberian, M.; King, G.C.P. Toward a paleogeography and tectonic evolution of Iran. Can. J. Earth Sci. 1981, 18, 210–265. [Google Scholar] [CrossRef]
- Agard, P.; Omrani, J.; Jolivet, L.; Whitechurch, H.; Vrielynck, B.; Spakman, W.; Monié, P.; Meyer, B.; Wortel, R. Zagros orogeny: A subduction-dominated process. Geol. Mag. 2011, 148, 692–725. [Google Scholar] [CrossRef]
- Aghazadeh, M.; Badrzadeh, Z.; Castro, A. Petrogenesis and U-Pb SHRIMP dating of Tarom plutons. J. Geosci. 2015, 24, 3–20, (In Persian with English abstract). [Google Scholar]
- Berberian, F.; Berberian, M. Tectono-plutonic episodes in Iran. In Zagros Hindukosh, Himalaya Geodynamic Evolution; American Geophysical Union: Washington, DC, USA, 1981; pp. 5–32. [Google Scholar]
- Omrani, J.; Agard, P.; Whitechurch, H.; Benoit, M.; Prouteau, G.; Jolivet, L. Arc-magmatism and subduction history beneath the Zagros Mountains, Iran: A new report of adakites and geodynamic consequences. Lithos 2008, 106, 380–398. [Google Scholar] [CrossRef]
- Babakhani, A.R.; Charkoski, M. Geological 1:100,000 Map of Kuh-e-Latif; Geological Survey of Iran: Tehran, Iran, 1990. [Google Scholar]
- Yilmaz, H.; Oyman, T.; Sonmez, F.N.; Arehart, G.B.; Billor, Z. Intermediate sulfidation epithermal gold-base metal deposits in Tertiary subaerial volcanic rocks, Sahinli/Tespih Dere (Lapseki/western Turkey). Ore Geol. Rev. 2010, 37, 236–258. [Google Scholar] [CrossRef]
- Goldstein, R.H.; Reynolds, T.J. Systematics of Fluid Inclusions in Diagenetic Minerals; Society for Sedimentary Geology (SEPM): Tulsa, OK, USA, 1994. [Google Scholar]
- Hall, D.L.; Sterner, S.M.; Bodnar, R.J. Freezing point depression of NaCl–KCl–H2O solutions. Econ. Geol. 1988, 83, 197–202. [Google Scholar] [CrossRef]
- Roedder, E. Fluid inclusions. In Reviews in Mineralogy; Mineralogical Society of America: Chantilly, VA, USA, 1984; Volume 12, 644p. [Google Scholar]
- Goldstein, R.H. Petrographic analysis of fluid inclusions. In Fluid Inclusions: Analysis and Interpretation; Short Course; Samson, I., Anderson, A., Marshall, D., Eds.; Mineralogical Association of Canada: Vancouver, BC, Canada, 2003; pp. 9–53. [Google Scholar]
- Hoefs, J. Stable Isotope Geochemistry, 9th ed.; Springer: Berlin/Heidelberg, Germany, 2021. [Google Scholar]
- Bodnar, R.J.; Burnham, C.W.; Sterner, S.M. Synthetic fluid inclusions in natural quartz. III. Determination of phase equilibrium properties in the system H2O–NaCl to 1000 °C and 1500 bars. Geochim. Cosmochim. Acta 1985, 49, 1861–1873. [Google Scholar] [CrossRef]
- White, N.C.; Hedenquist, J.W. Epithermal gold deposits: Styles, characteristics and exploration. SEG Newslet. 1995, 1–13. [Google Scholar] [CrossRef]
- Simmons, S.F.; White, N.C.; John, D.A. Geological characteristics of epithermal precious and base metal deposits. In Economic Geology 100th Anniversary Volume; Society of Economic Geologists: Denver, CO, USA, 2005; pp. 485–522. [Google Scholar]
- Prokofiev, V.Y.; Garofalo, P.S.; Bortnikov, N.S.; Kovalenker, V.A.; Zorina, L.D.; Grichuk, D.V.; Selektor, S.L. Fluid inclusion constraints on the genesis of gold in the Darasun district (eastern Transbaikalia), Russia. Econ. Geol. 2010, 105, 395–416. [Google Scholar] [CrossRef]
- Moncada, D.; Baker, D.; Bodnar, R.J. Mineralogical, petrographic and fluid inclusion evidence for the link between boiling and epithermal Ag-Au mineralization in the La Luz area, Guanajuato mining district, México. Ore Geol. Rev. 2017, 89, 143–170. [Google Scholar] [CrossRef]
- White, N.C.; Hedenquist, J.W. Epithermal environments and styles of mineralization: Variations and their causes, and guidelines for exploration. J. Geochem. Explor. 1990, 36, 445–474. [Google Scholar] [CrossRef]
- Simmons, S.F.; Christenson, B.W. Origin of calcite in a boiling geothermal system. Am. J. Sci. 1994, 294, 361–400. [Google Scholar] [CrossRef]
- Hedenquist, J.W.; Arribas, A.R.; Gonzalez-Urien, E. Exploration for epithermal gold deposits. Rev. Econ. Geol. 2000, 13, 245–277. [Google Scholar]
- Simmons, S.F.; Browne, P.R.L. Hydrothermal minerals and precious metals in the Broadlands-Ohaaki geothermal system: Implications for understanding low-sulfidation epithermal environments. Econ. Geol. 2000, 95, 971–1000. [Google Scholar] [CrossRef]
- Moncada, D.; Mutchler, S.; Nieto, A.; Reynolds, T.J.; Rimstidt, J.D.; Bodnar, R.J. Mineral textures and fluid inclusion petrography of the epithermal Ag–Au deposit. J. Geochem. Explor. 2012, 114, 20–35. [Google Scholar] [CrossRef]
- Ramboz, C.; Pichavant, M.; Weisbrod, A. Fluid immiscibility in natural processes use and misuse of fluid inclusion data: II. Interpretation of fluid inclusion data in terms of immiscibility. Chem. Geol. 1982, 37, 29–48. [Google Scholar] [CrossRef]
- Ouyang, H.; Wu, X.; Mao, J.W.; Su, H.; Santosh, M.; Zhou, Z.; Li, C. The nature and timing of ore formation in the Budunhua copper deposit, southern Great Xing’an Range: Evidence from geology, fluid inclusions, and U-Pb and Re-Os geochronology. Ore Geol. Rev. 2014, 63, 238–251. [Google Scholar] [CrossRef]
- Rye, R.O.; Ohmoto, H. Sulfur and carbon isotopes and ore genesis: A review. Econ. Geol. 1974, 69, 826–842. [Google Scholar] [CrossRef]
- Taylor, H.P. The application of oxygen and hydrogen isotope studies to problems of hydrothermal alteration and ore deposition. Econ. Geol. 1974, 69, 843–883. [Google Scholar] [CrossRef]
- Ohmoto, H.; Rye, R.O. Isotopes of sulfur and carbon. In Geochemistry of Hydrothermal Ore Deposits; Barnes, H.L., Ed.; John Wiley and Sons: New York, NY, USA, 1979; pp. 509–567. [Google Scholar]
- Shepherd, T.J.; Ranbin, A.H.; Alderton, D.H.M. A Practical Guide to Fluid Inclusion Studies; Blackie: Glasgow, UK, 1985; 223p. [Google Scholar]
- Faure, K. δD values of fluid inclusion water in quartz and calcite ejecta from active geothermal systems: Do values reflect those of original hydrothermal water? Econ. Geol. 2003, 98, 657–660. [Google Scholar] [CrossRef]
- Li, Q.; Zhang, Z.X.; Geng, X.X.; Li, C.; Liu, F.; Chai, F.M.; Yang, F.Q. Geology and geochemistry of the Qiaoxiahala Fe–Cu–Au deposit, Junggar region, northwest China. Ore Geol. Rev. 2014, 57, 462–481. [Google Scholar] [CrossRef]
- Jiang, H.; Han, J.; Chen, H.; Zheng, Y.; Zhang, W.; Lu, W.; Deng, G.; Tan, Z. Hydrothermal alteration, fluid inclusions and stable isotope characteristics of the Shaquanzi Fe–Cu deposit, Eastern Tianshan: Implications for deposit type and metallogenesis. Ore Geol. Rev. 2018, 100, 385–400. [Google Scholar] [CrossRef]
- Li, S.N.; Ni, P.; Bao, T.; Li, C.Z.; Xiang, H.L.; Wang, G.G.; Huang, B.; Chi, Z.; Dai, B.Z.; Ding, J.Y. Geology, fluid inclusion, and stable isotope systematics of the Dongyang epithermal gold deposit, Fujian Province, southeast China: Implications for ore genesis and mineral exploration. J. Geochem. Explor. 2018, 195, 16–30. [Google Scholar] [CrossRef]
- Li, S.N.; Ni, P.; Bao, T.; Xiang, H.L.; Chi, Z.; Wang, G.G.; Bao, H.; Ding, J.Y.; Dai, B.Z. Genesis of the Ancun epithermal gold deposit, southeast China: Evidence from fluid inclusion and stable isotope data. J. Geochem. Explor. 2018, 195, 157–177. [Google Scholar] [CrossRef]
- Sasaki, A.; Ishihara, S. Sulfur isotopic composition of the magnetite-series and ilmenite-series granitoids in Japan. Contrib. Mineral. Petrol. 1979, 68, 107–115. [Google Scholar] [CrossRef]
- Taylor, B.E.; Wheeler, M.C.; Nordstrom, D.K. Stable isotope geochemistry of acid mine drainage: Experimental oxidation of pyrite. Geochim. Cosmochim. Acta 1984, 48, 2669–2678. [Google Scholar] [CrossRef]
- Balci, N.; Shanks III, W.C.; Mayer, B.; Mandernack, K.W. Oxygen and sulfur isotope systematics of sulfate produced by bacterial and abiotic oxidation of pyrite. Geochim. Cosmochim. Acta 2007, 71, 3796–3811. [Google Scholar] [CrossRef]
- Camprubí, A.; González-Partida, E.; Torres-Tafolla, E. Fluid inclusion and stable isotope study of the Cobre–Babilonia polymetallic epithermal vein system, Taxco district, Guerrero, Mexico. J. Geochem. Explor. 2006, 89, 33–38. [Google Scholar] [CrossRef]
- Vidal, C.P.; Guido, D.M.; Jovic, S.M.; Bodnar, R.J.; Moncada, D.; Melgarejo, J.C.; Hames, W. The Marianas-San Marcos vein system: Characteristics of a shallow low-sulfidation epithermal Au-Ag deposit in the Cerro Negro district, Deseado Massif, Patagonia, Argentina. Miner. Depos. 2016, 51, 725–748. [Google Scholar] [CrossRef]
- Xie, Y.; Li, L.; Wang, B.; Li, G.; Liud, H.; Li, Y.; Dong, S.; Zhou, J. Genesis of the Zhaxikang epithermal Pb-Zn-Sb deposit in southern Tibet, China: Evidence for a magmatic link. Ore Geol. Rev. 2017, 80, 891–909. [Google Scholar] [CrossRef]
- Zhong, J.; Chen, Y.J.; Qi, J.P.; Chen, J.; Dai, M.C.; Li, J. Geology, fluid inclusion and stable isotope study of the Yueyang Ag-Au-Cu deposit, Zijinshan orefield, Fujian Province, China. Ore Geol. Rev. 2017, 86, 254–270. [Google Scholar] [CrossRef]
- Zhong, J.; Pirajno, F.; Chen, Y.J. Epithermal deposits in South China: Geology, geochemistry, geochronology and tectonic setting. Gondwana Res. 2017, 42, 193–219. [Google Scholar] [CrossRef]
- Zhang, C.; Wang, E.; Bi, Z.; Han, R.; Shao, J.; Liu, B.; Chen, J.; Zeng, N. Geochronology and isotope geochemistry studies of an epithermal gold deposit in the northern Lesser Khingan Range, NE China: The Gaosongshan example. Ore Geol. Rev. 2019, 105, 356–374. [Google Scholar] [CrossRef]
- Hedenquist, J.W.; Arribas, A.; Reynolds, T.J. Evolution of an intrusion-centered hydrothermal system, Far Southeast-Lepanto porphyry and epithermal Cu–Au deposits, Philippines. Econ. Geol. 1998, 93, 373–404. [Google Scholar] [CrossRef]
- Naden, J.; Killias, S.P.; Darbyshire, D.P.F. Active geothermal system with entrained seawater as modern analogs for transitional volcanic-hosted massive sulfide and continental magmato-hydrothermal mineralization: The example of Milos Island, Greece. Geology 2005, 33, 541–544. [Google Scholar] [CrossRef]
- Lattanzi, P. Applications of fluid inclusions in the study and exploration of mineral deposits. Eur. J. Mineral. 1991, 3, 689–697. [Google Scholar] [CrossRef]
- Wilkinson, J.J. Fluid inclusions in hydrothermal ore deposits. Lithos 2001, 55, 229–279. [Google Scholar] [CrossRef]
- Glennie, K.W. Cretaceous tectonic evolution of Arabia’s eastern plate margin: A tale of two oceans. In Middle East Models of Jurassic/Cretaceous Carbonate Systems; Alsharan, A.S., Scott, R.W., Eds.; Society for Sedimentary Geology, Special Publication: : Houston, TX, USA, 2000; Volume 69, pp. 9–20. [Google Scholar]
- Babaei, A.; Arvin, M.; Babaie, H.A. An oblique convergence and rotation model for the emplacement of the Baft ophiolitic mélange in Iran. Ofioliti 2001, 26, 401–408. [Google Scholar]
- Mohajjel, M.; Fergusson, C.L.; Sahandi, M.R. Cretaceous-Tertiary convergence and continental collision Sanandaj-Sirjan zone western Iran. J. Asian Earth Sci. 2003, 21, 397–412. [Google Scholar] [CrossRef]
- Agard, P.; Omrani, J.; Jolivet, L.; Mouthereau, F. Convergence history across Zagros (Iran): Constraints from collisional and earlier deformation. Intl. J. Earth Sci. 2005, 94, 401–419. [Google Scholar] [CrossRef]
- Richards, J.P.; Wilkinson, D.; Ulrich, T. The Tethyan tectonic history and Cu-Au metallogeny of Iran; SEG Special Publication: Houston, TX, USA, 2006; Volume 19, pp. 1455–1496. [Google Scholar]
- Pirajno, F. Hydrothermal Mineral Deposits; Springer-Verlag: Berlin/Heidelberg, Germany, 1992; 709p. [Google Scholar]
- Camprubí, A.; Albinson, T. Epithermal Deposits in México: Update of Current Knowledge, and an Empirical Reclassification; Special Paper; Geological Society of America: Boulder, CO, USA, 2007; Volume 422, pp. 14–39. [Google Scholar]
Figure 1.
(A). Structural zones of Iran showing the location of the study area. (B). Geological map of the Mahour area. (C). The A–B profile.
Figure 1.
(A). Structural zones of Iran showing the location of the study area. (B). Geological map of the Mahour area. (C). The A–B profile.
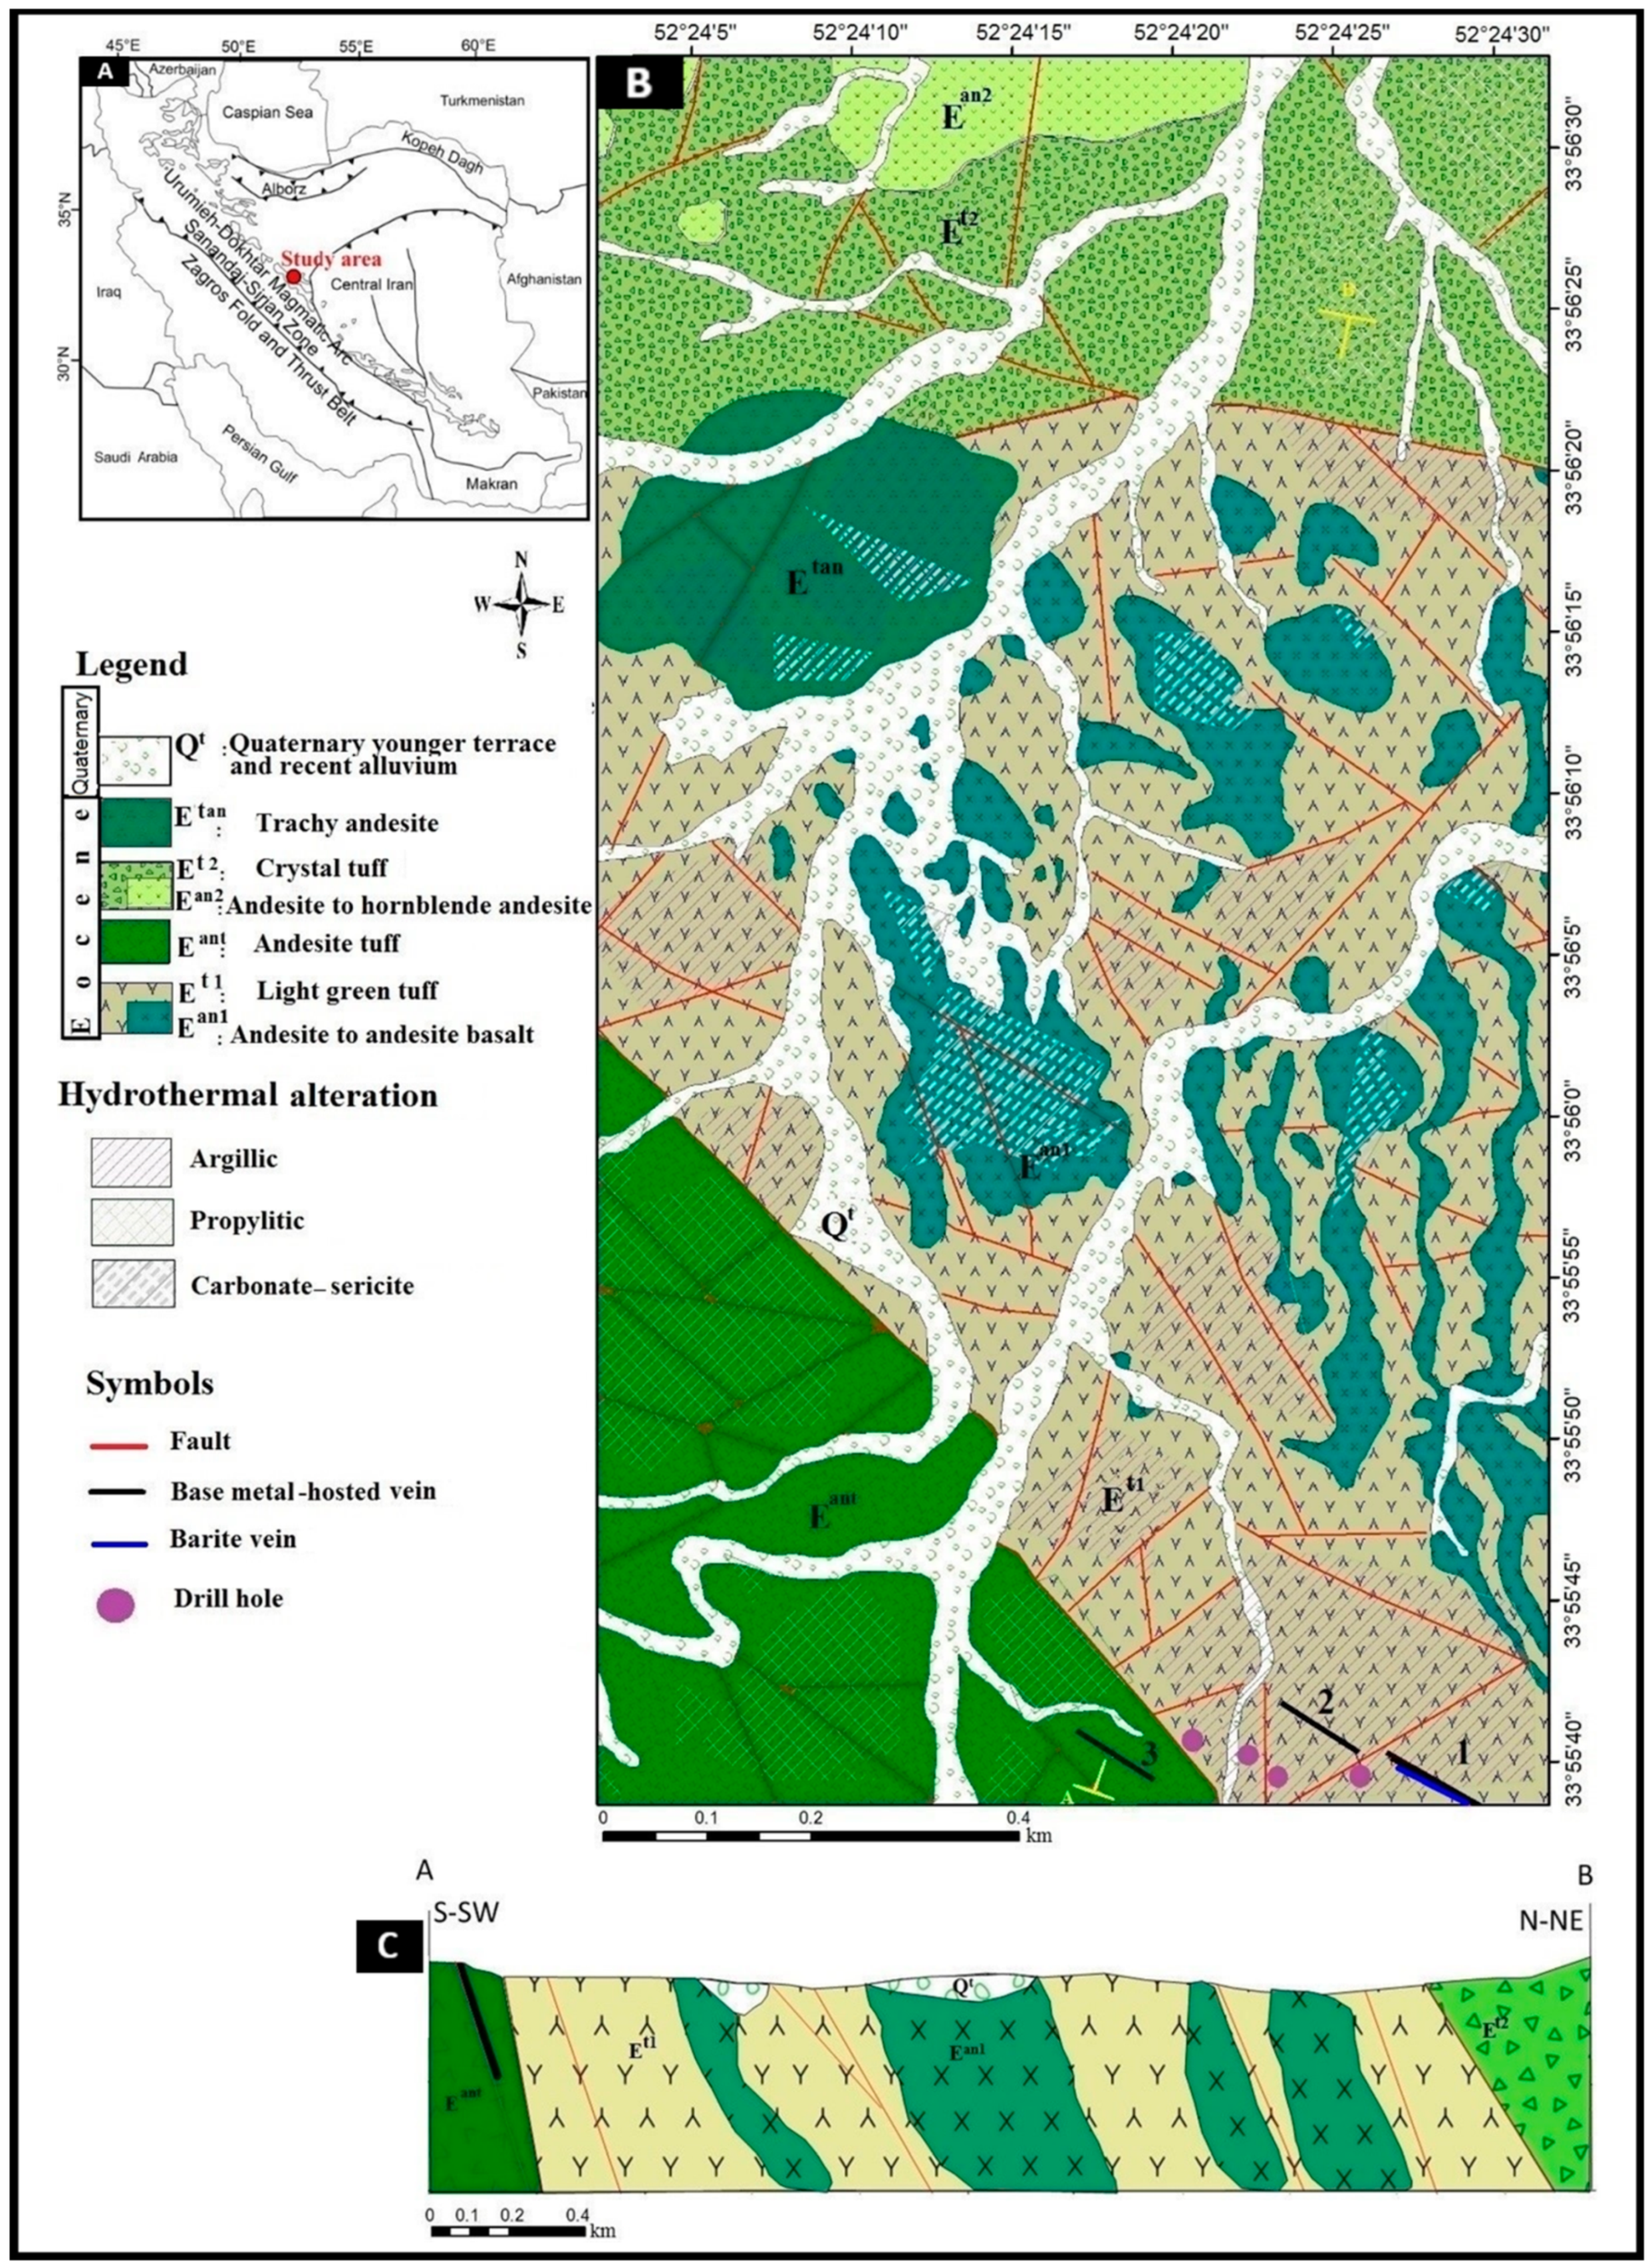
Figure 2.
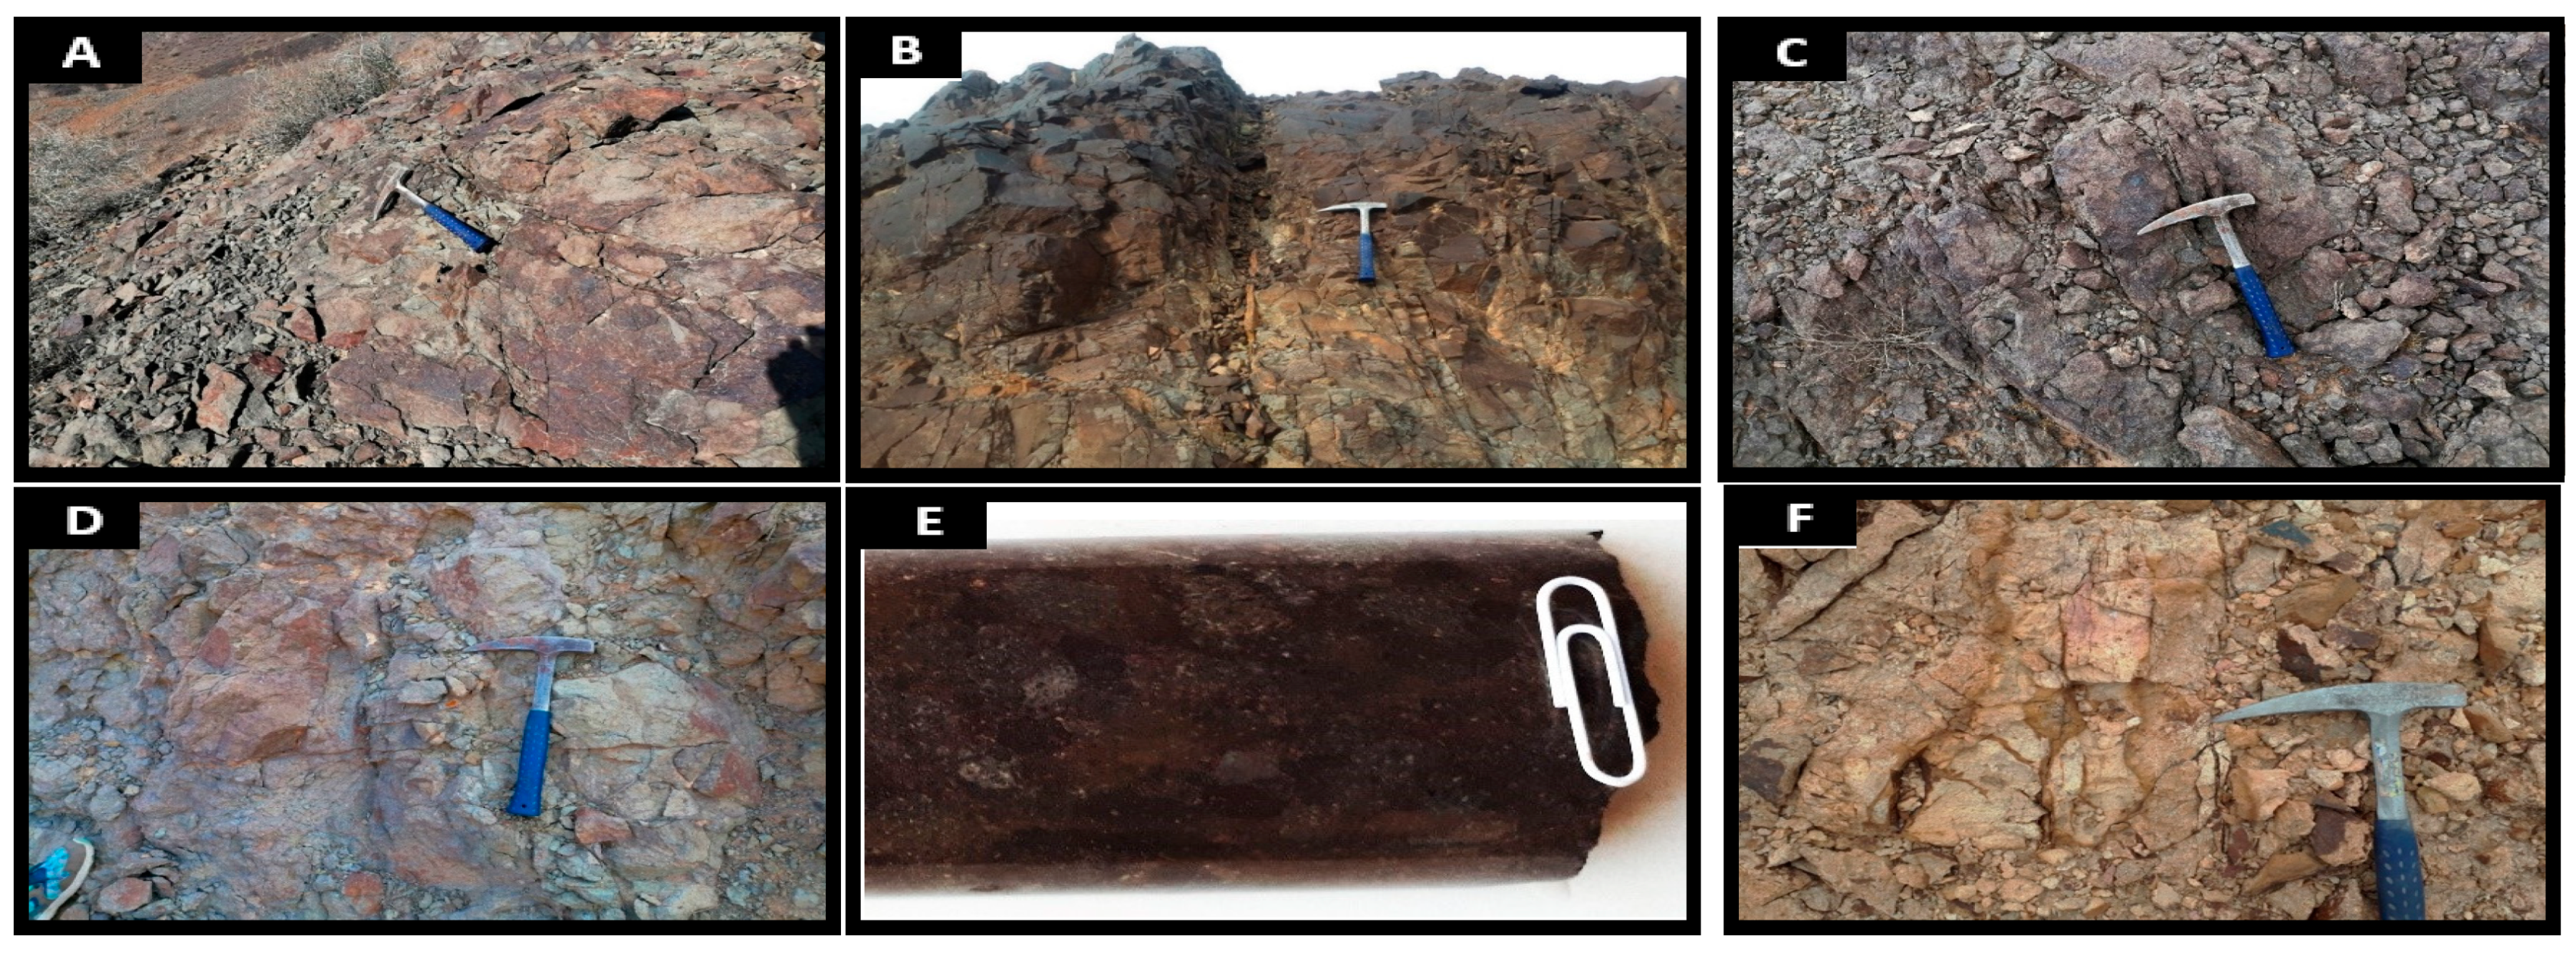
Outcropped rock units at the Mahour deposit. (A) View of green tuff (Et1) rock unit. (B) Close-up view of green tuff (Et1) unit outcrop with black coloration. (C) View of the andesite tuff (Eant) unit outcrop. (D) The crystal tuff (Et2) unit with gray to light green outcrop color. (E) A hand specimen of the andesite to hornblende andesite (Ean2) unit was extracted from the drilling core. (F) View of the trachy-andesite lava (ETa) unit, white to light gray with red spots.
Figure 2.
Outcropped rock units at the Mahour deposit. (A) View of green tuff (Et1) rock unit. (B) Close-up view of green tuff (Et1) unit outcrop with black coloration. (C) View of the andesite tuff (Eant) unit outcrop. (D) The crystal tuff (Et2) unit with gray to light green outcrop color. (E) A hand specimen of the andesite to hornblende andesite (Ean2) unit was extracted from the drilling core. (F) View of the trachy-andesite lava (ETa) unit, white to light gray with red spots.

Figure 3.
A view of quartz-sulfide veins at Mahour deposit. (A). Overview of quartz-sulfide vein No. 1. (B). Distant view of quartz-sulfide vein No. 2. (C). Quartz-sulfide vein No. 2. (D). Perspective view of quartz-sulfide veins No. 3. (E). Quartz-sulfide vein No. 3. (F). A view of the quartz and barite veins. (G). A closer view of the barite vein.

Figure 4.
Ore minerals and their textures (reflected light). (A). First-generation pyrite (Py1) as euhedral crystals. (B). Second-generation pyrite (Py2) with chalcopyrite (Ccp). (C). First-generation pyrite together with chalcopyrite. (D). Chalcopyrite replaced by chalcocite (Cc) and covellite (Cv) from the margins. (E). Galena (Gn). (F). Galena replaced by chalcopyrite and sphalerite (Sph).
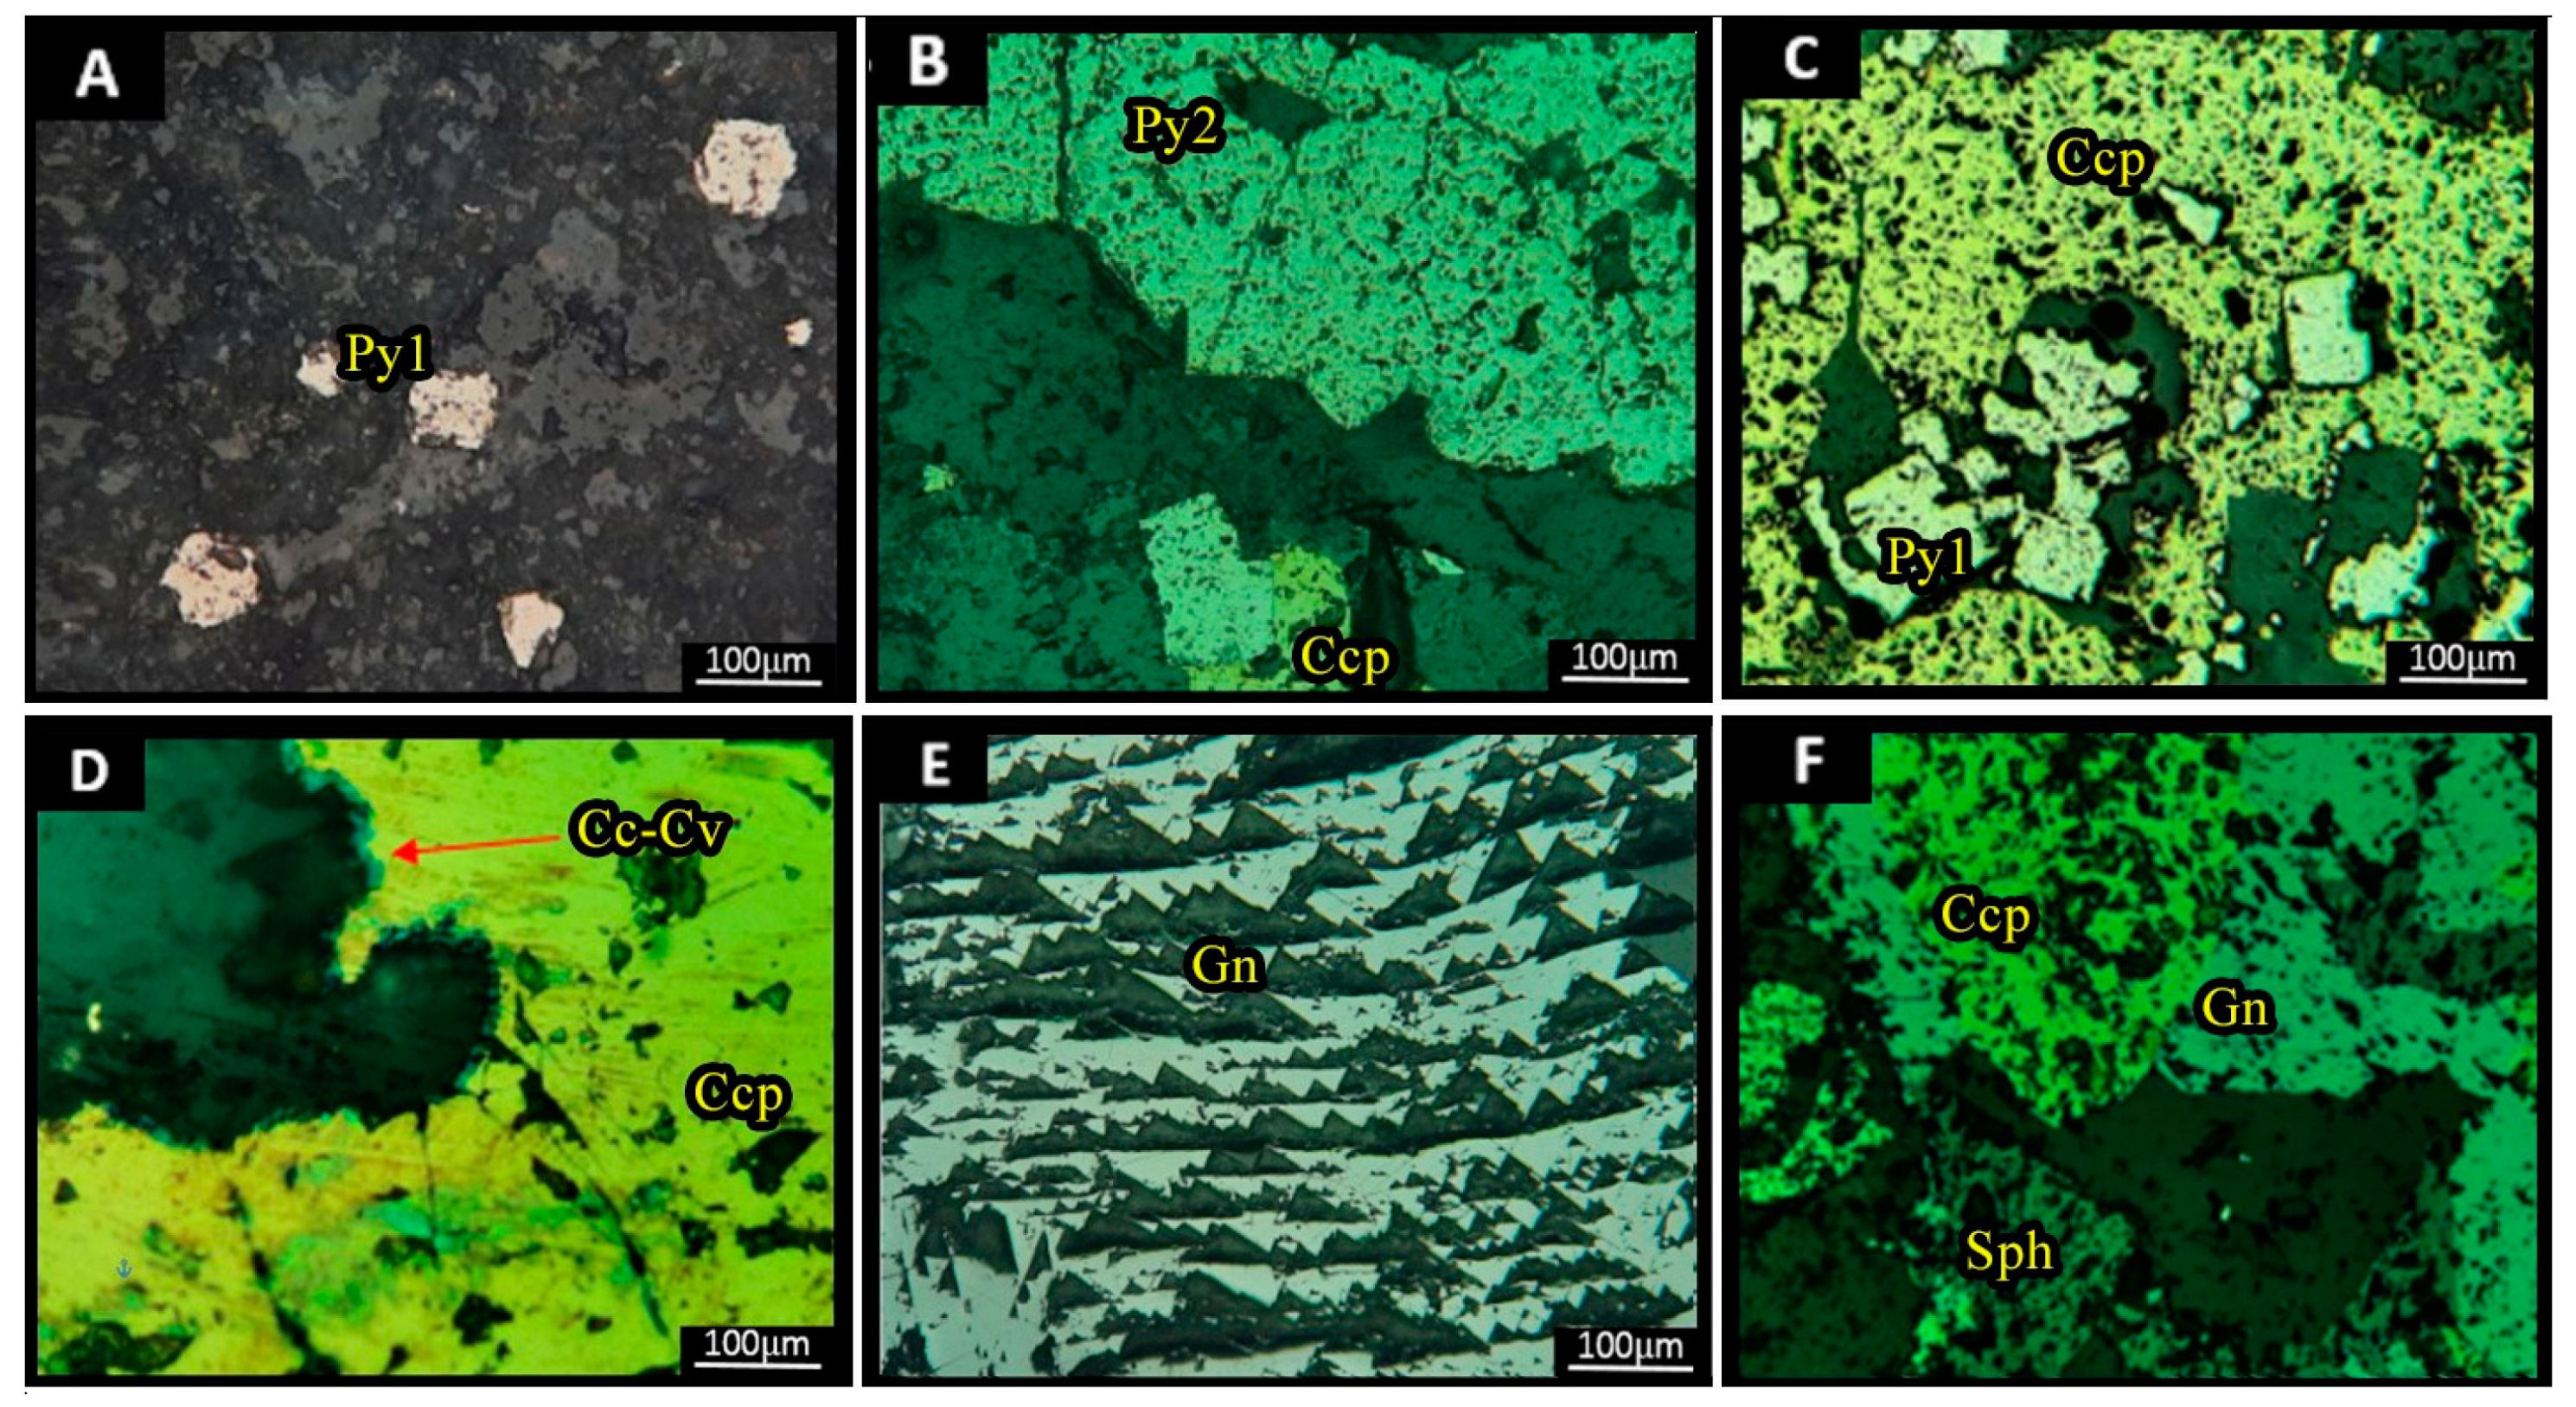
Figure 5.
Paragenetic sequence of minerals for the Mahour epithermal base metal deposit.

Figure 6.
Photomicrographs (transmitted polarized light, crossed nicols, XPL) showing textures for quartz (Qz) in the Mahour epithermal base metal deposit. (A). Comb-structured quartz. (B). Open space filling texture. (C,D). Mosaic texture. (E). Plumose texture. (F). Vein-veinlet quartz texture.
Figure 6.
Photomicrographs (transmitted polarized light, crossed nicols, XPL) showing textures for quartz (Qz) in the Mahour epithermal base metal deposit. (A). Comb-structured quartz. (B). Open space filling texture. (C,D). Mosaic texture. (E). Plumose texture. (F). Vein-veinlet quartz texture.

Figure 7.
Photomicrographs (at room temperature, plane-polarized light) of fluid inclusion types from Mahour epithermal base metal deposit, showing representative primary FIAs and variable L/V ratio as a piece of evidence for boiling. (A). Vapor-phase (V) inclusions. (B). Liquid-phase (L) inclusions. (D). Vapor-rich, two-phase (VL) inclusions. (C,E,F). Liquid-rich two-phase (LV) inclusions.

Figure 8.
δ34S of sulfides from the Mahour deposit compared to values of the main geological reservoirs [29].
Figure 8.
δ34S of sulfides from the Mahour deposit compared to values of the main geological reservoirs [29].
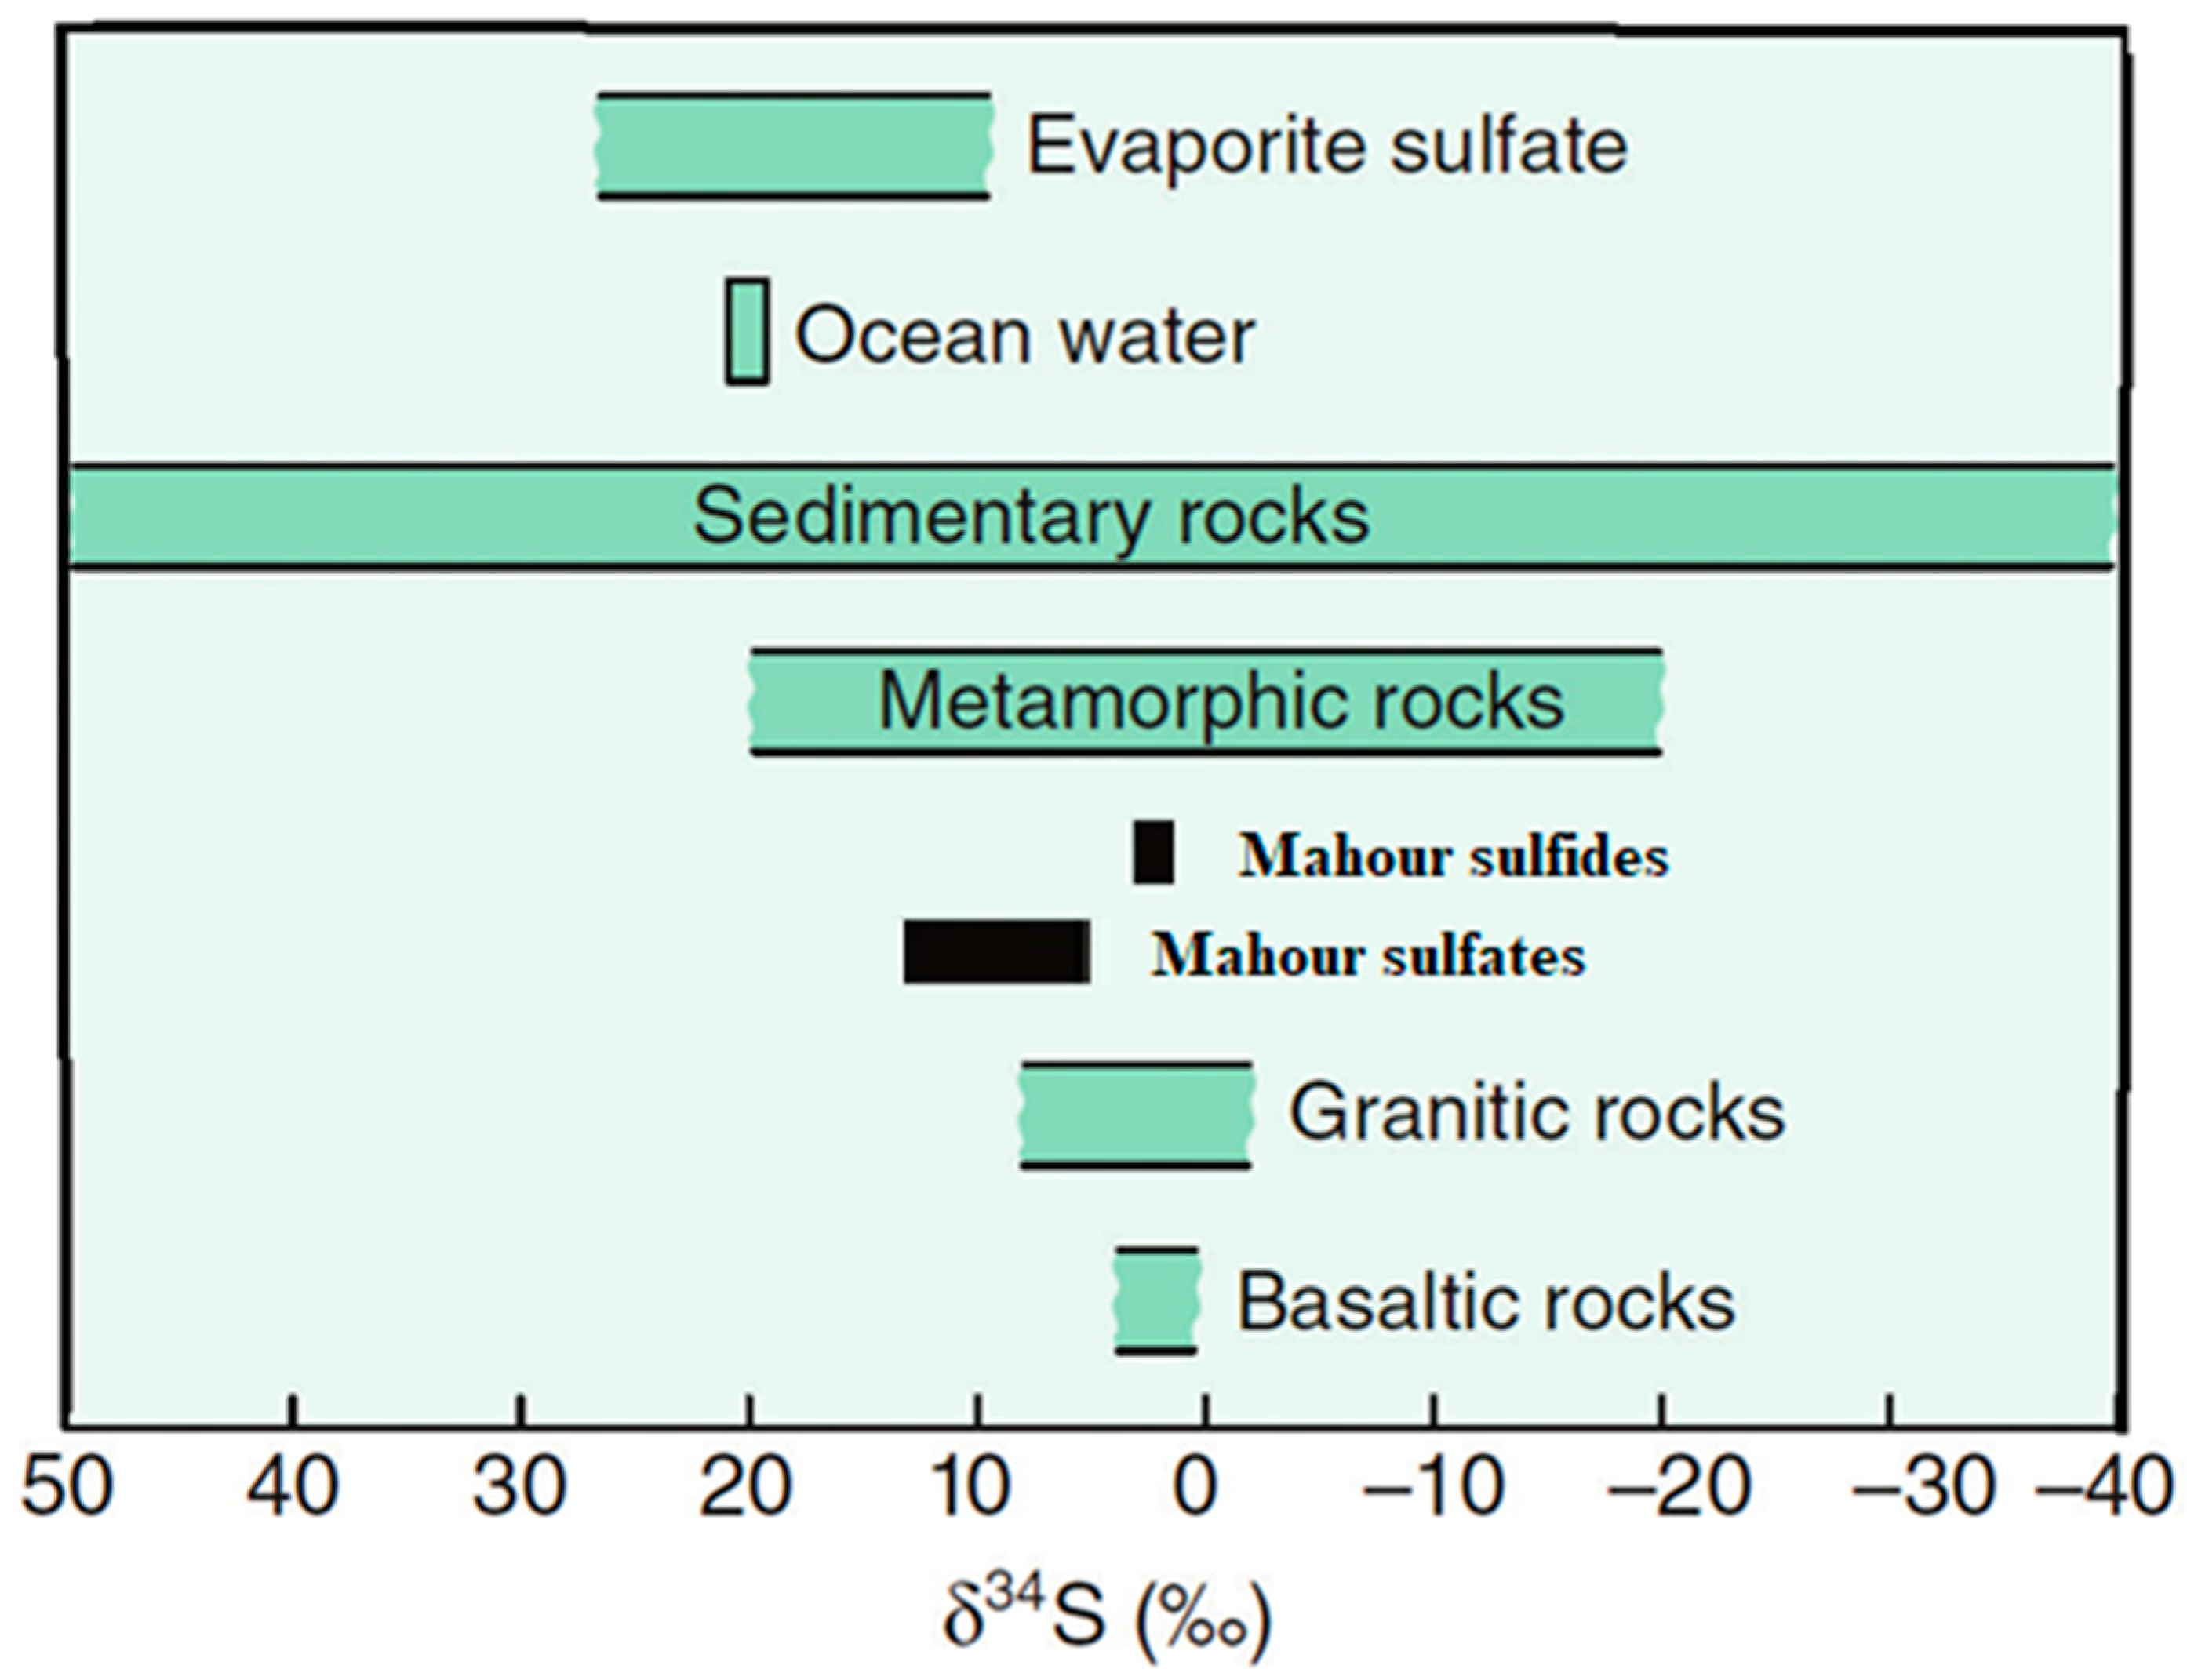
Figure 9.
Total homogenization temperatures vs. equivalent salinity diagram at the Mahour deposit. This temperature range corresponds well with the temperature of epithermal environments, according to (e.g., [60,61,62]).
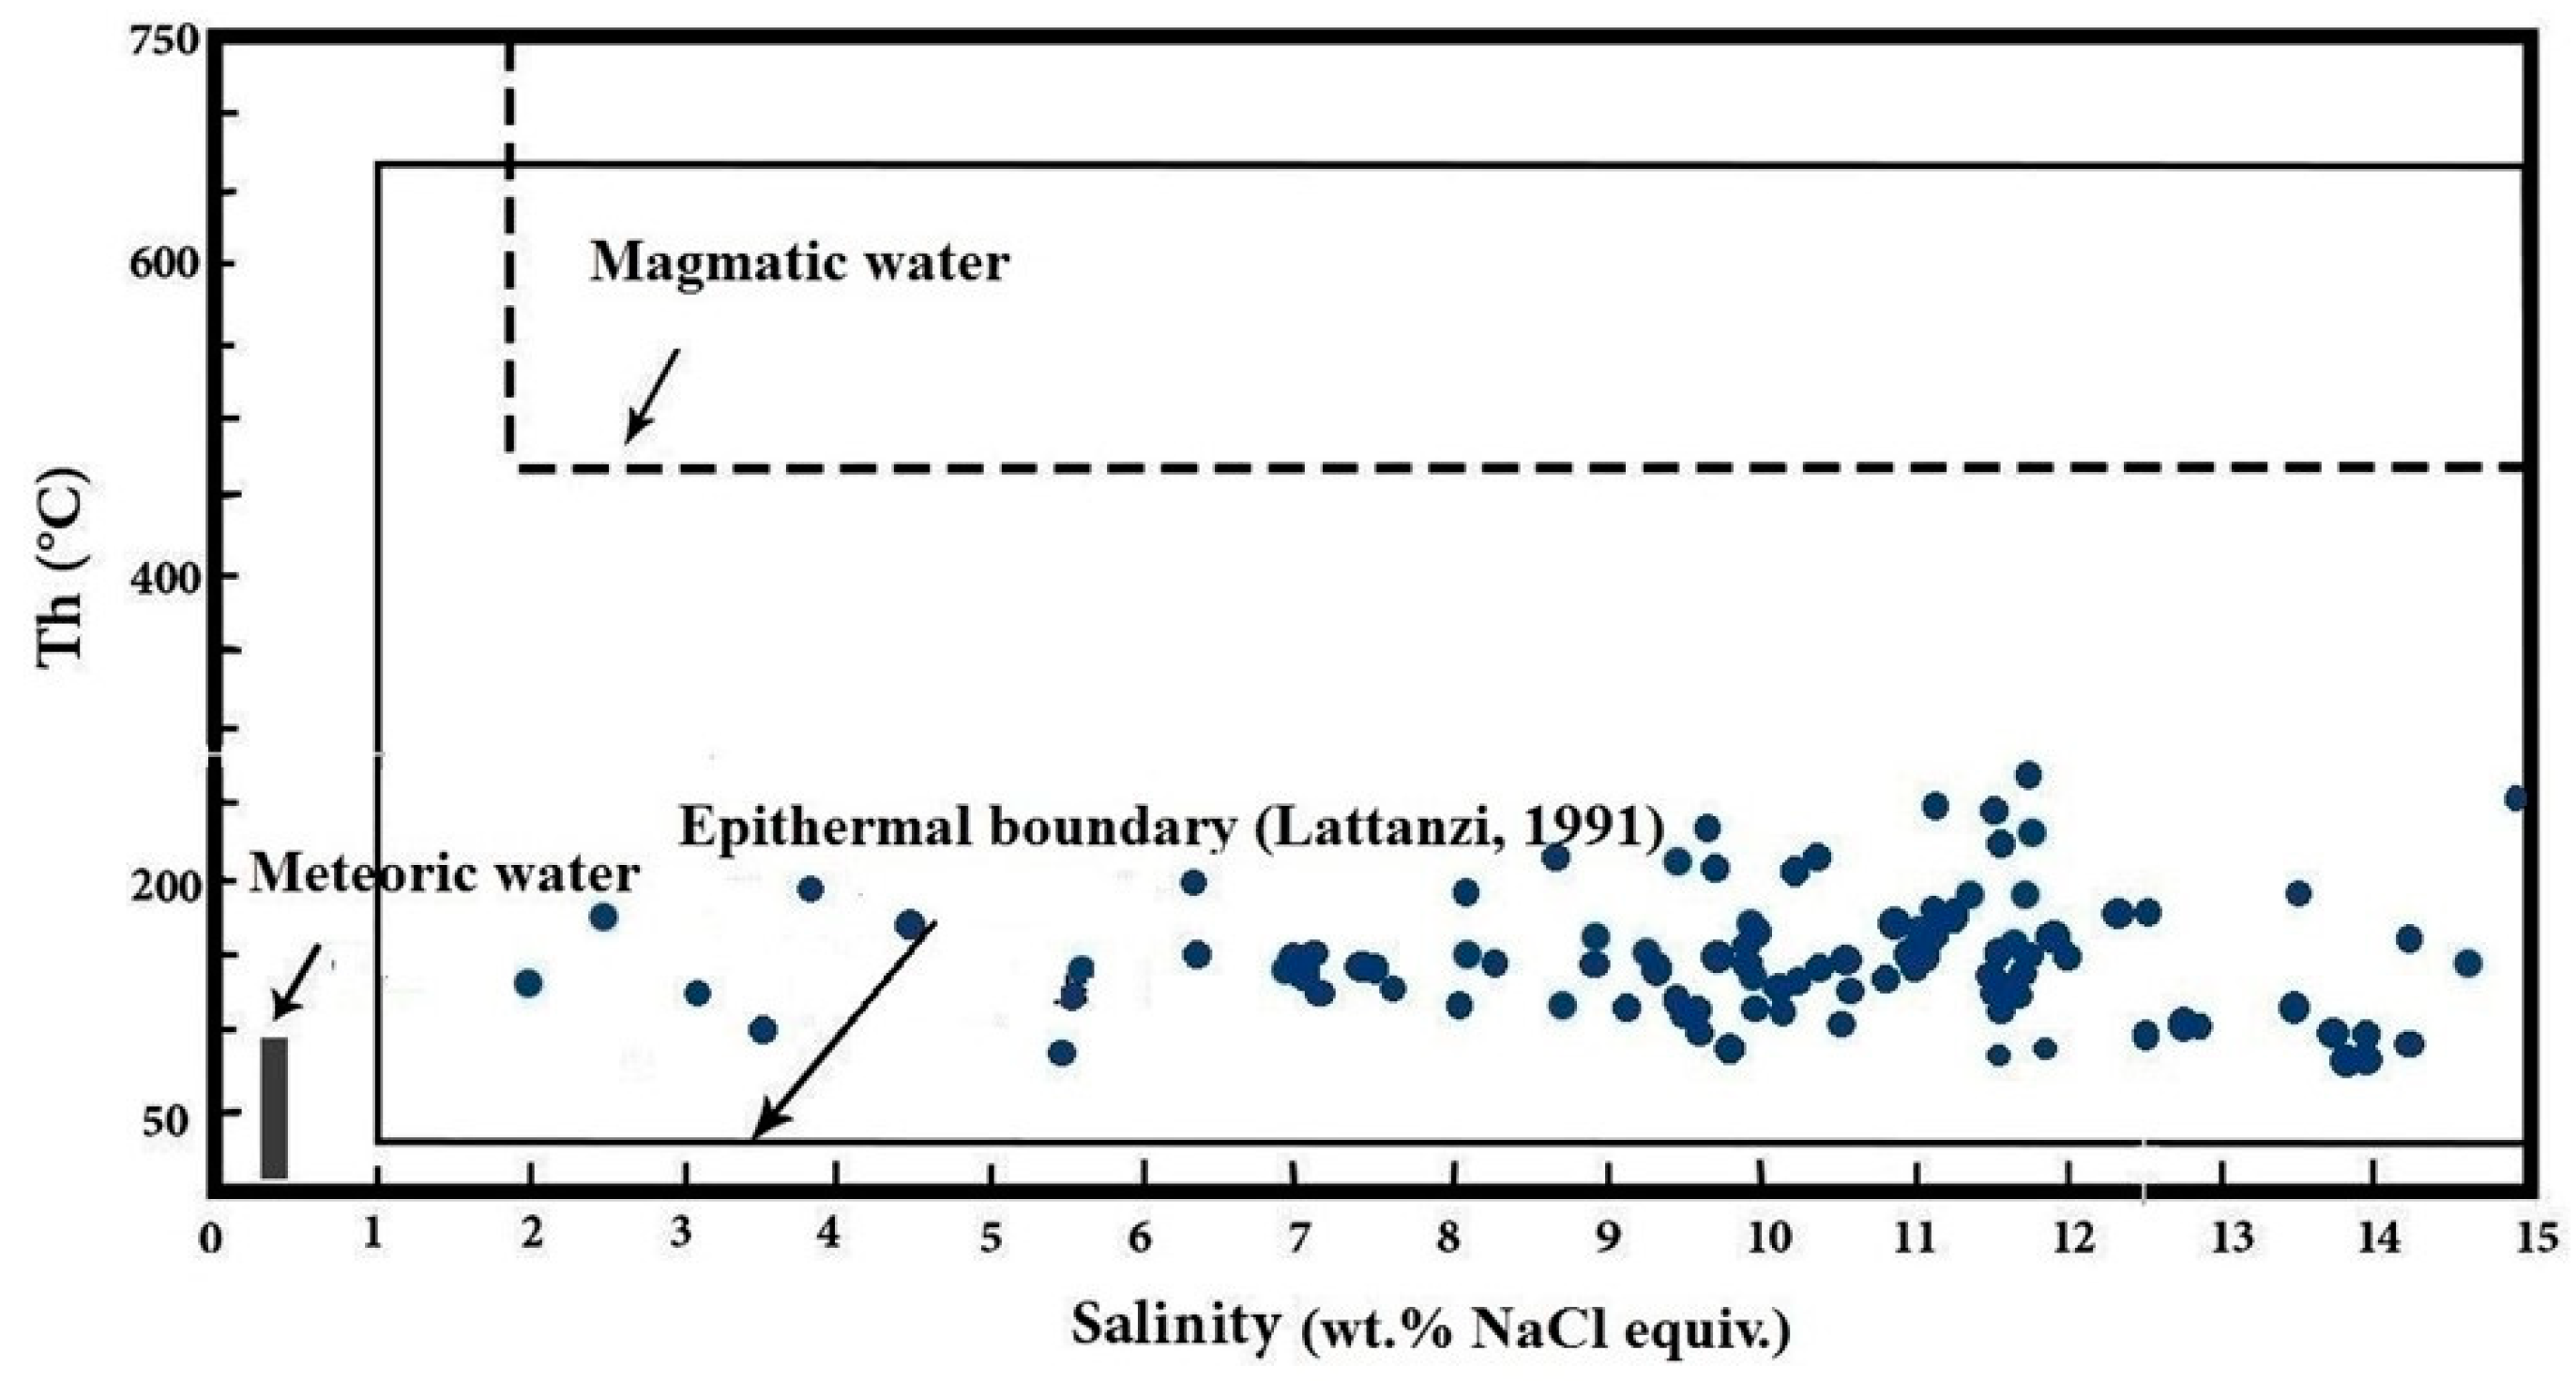
Figure 10.
(A). Schematic diagram showing the trend of homogenization temperature versus salinity of the fluid inclusions during various processes of fluid evolution [63], and (B). Homogenization temperature vs. salinity for fluids from the Mahour deposit [45]. Process 1 shows the decrease in temperature due to cooling or the decrease in lithostatic pressure (decrease in depth), while process 2 corresponds to the decrease in temperature and the increase in fluid salinity due to boiling.
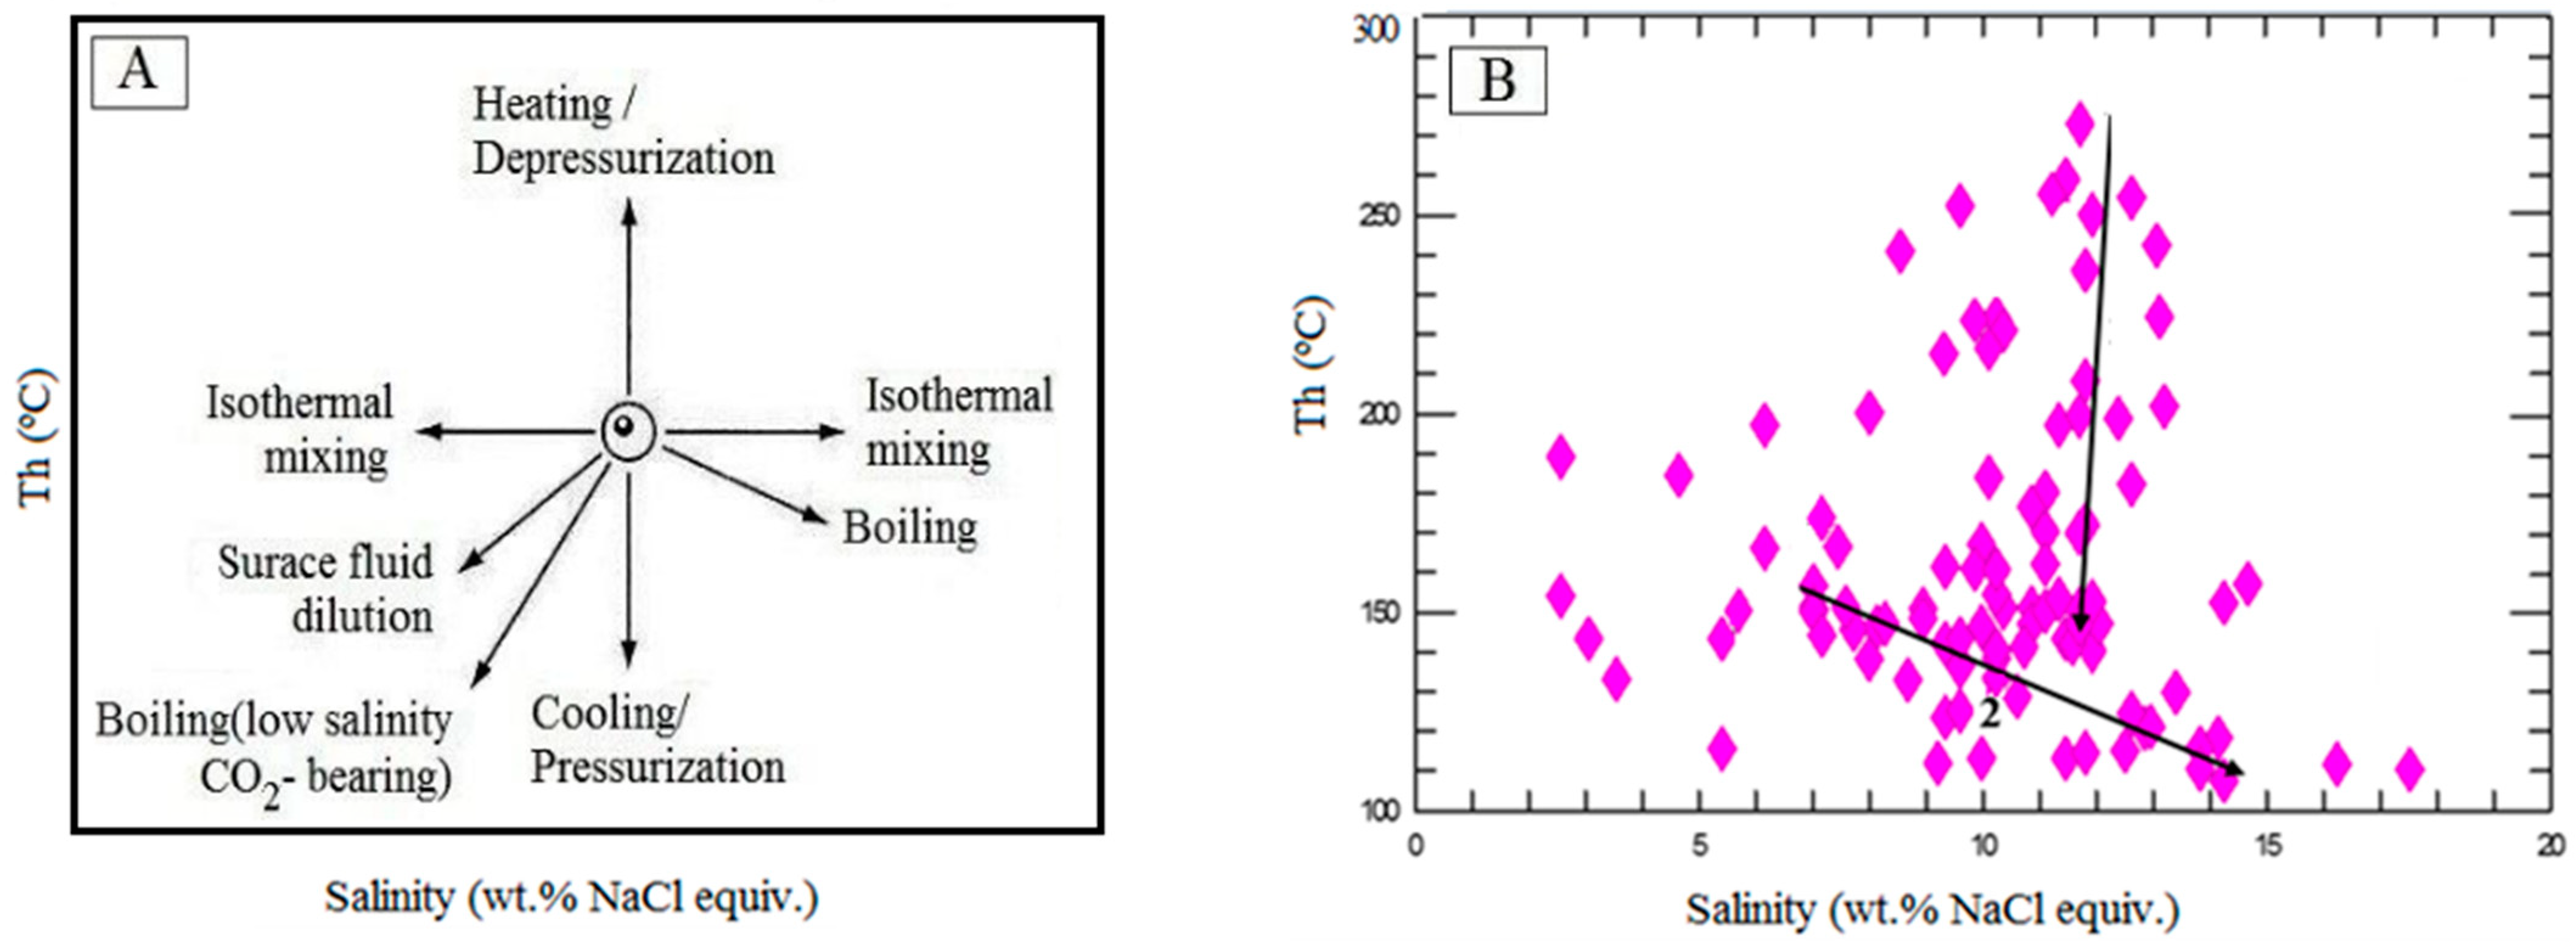
Figure 11.
Final homogenization vs. salinity diagram [63] for fluid data from the Mahour deposit.
Figure 11.
Final homogenization vs. salinity diagram [63] for fluid data from the Mahour deposit.

Figure 12.
Homogenization temperature vs. density to determine pressure concerning salinity of fluid inclusions [45].
Figure 12.
Homogenization temperature vs. density to determine pressure concerning salinity of fluid inclusions [45].
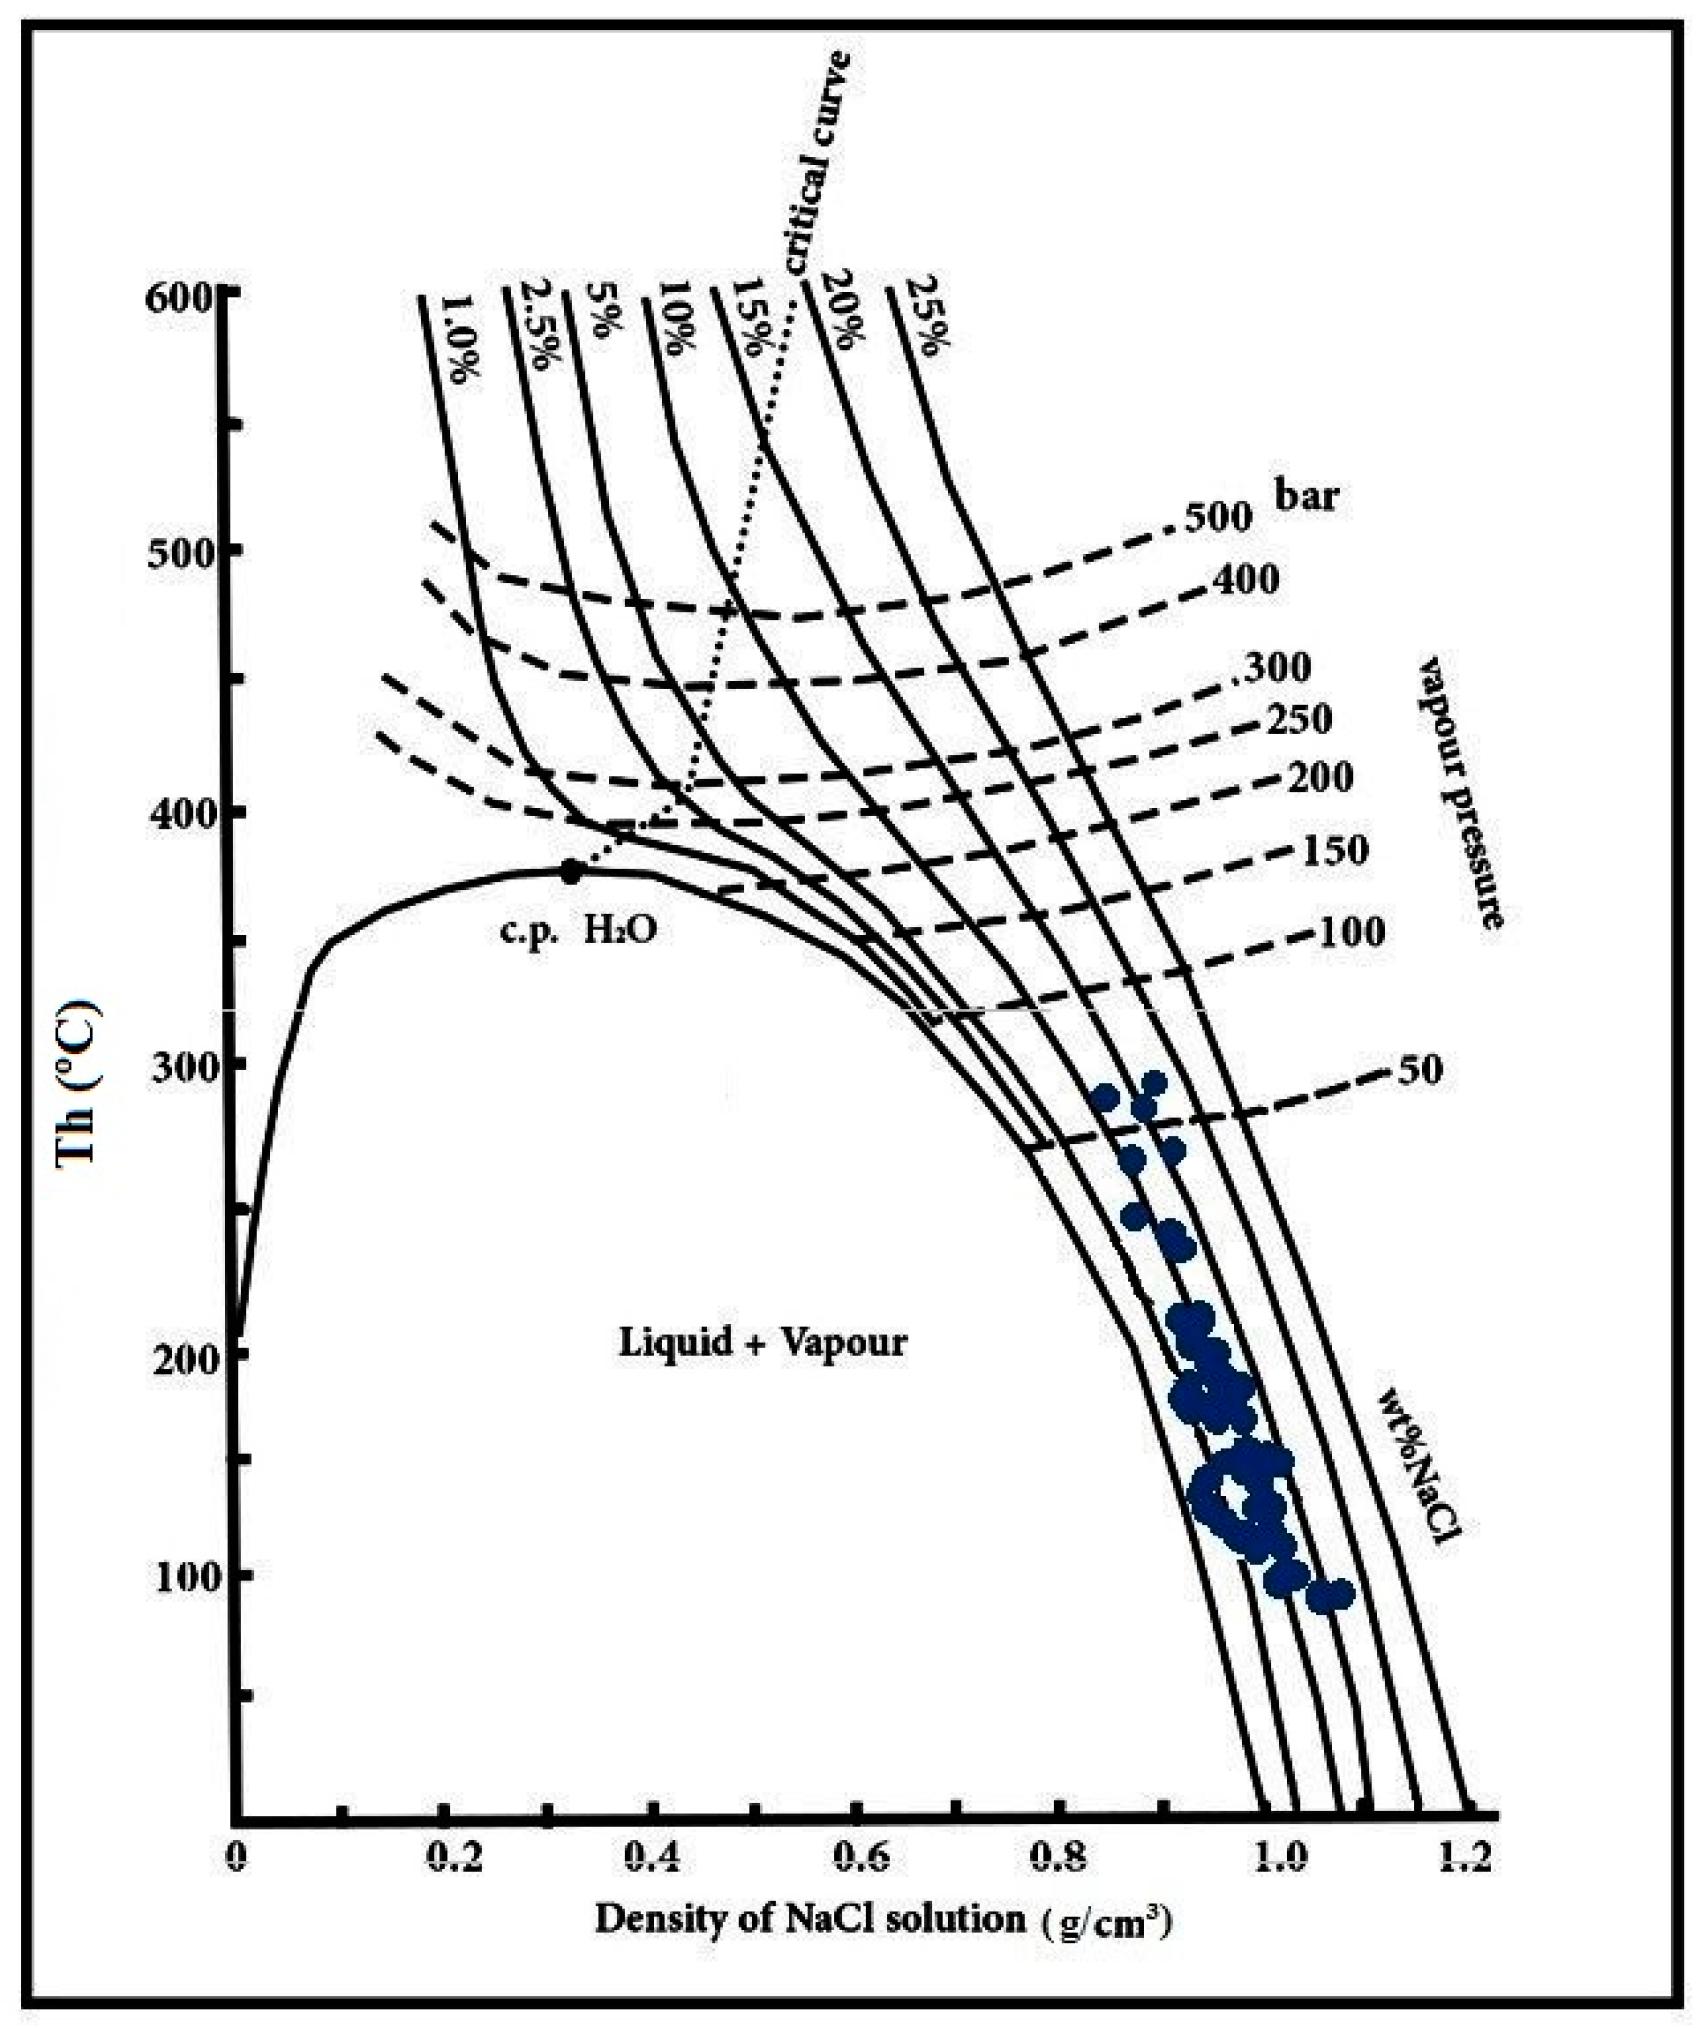
Figure 13.
Schematic model showing the stages of formation of volcano-sedimentary sequences and subvolcanic intrusive masses and how mineralization formed in the area of the Mahour deposit. (A). Formation of Eocene volcano-sedimentary sequences. (B). The emplacement of intrusive masses in the volcano-sedimentary facies and the development of hydrothermal and ore-forming processes in the form of vein-veinlet occurrences and fractures. (C). Formation of minerals such as malachite, azurite, and iron hydroxide compounds affected by supergene and weathering processes


Table 1.
Microthermometric data summary for LV fluid inclusions in sphalerite samples from the Mahour epithermal base metal deposit.
Table 1.
Microthermometric data summary for LV fluid inclusions in sphalerite samples from the Mahour epithermal base metal deposit.
| Mineral | Inclusion Type | Tm-Ice (°C) | Th (Total) Range (°C) | Salinity (wt.% NaCl equiv.) |
|---|---|---|---|---|
| Sphalerite (n = 100) | LV | −0.1 to −15 | 107.5–298.1 (160) | 1.5–13.7 (6.97) |
The digits between the parentheses are the mean values. Tm-ice = final ice-melting temperature, Th (total) = total homogenization temperature.
Table 2.
Sulfur stable isotope data for samples from the Mahour deposit.
| Sample | Mineral | δ34S Sulfide (‰) |
|---|---|---|
| Mac.B1 | Barite | 12.9 |
| Mac.B2 | Barite | 13.2 |
| Mac.B3 | Barite | 12.1 |
| Mac.B4 | Barite | 12.6 |
| Mac.B5 | Barite | 12.3 |
| Galena | 3.0 | |
| Mac.CGS | Chalcopyrite | 3.4 |
| Sphalerite | 3.4 | |
| Mac.C1 | Chalcopyrite | 1.9 |
| Mac.C2 | Chalcopyrite | 1.9 |
| Mac.G1 | Galena | 2.5 |
| Galena | 3.0 | |
| Mac.GG | Sphalerite | 3.3 |
| Galena | 2.6 | |
| Mac.SG | Sphalerite | 3.0 |
| Mac.Gy1 | Gypsum | 5.6 |
| Mac.Gy2 | Gypsum | 4.3 |
| Galena | 2.8 | |
| Mac.GS | Sphalerite | 3.1 |
| Sphalerite | 3.2 |
Disclaimer/Publisher’s Note: The statements, opinions and data contained in all publications are solely those of the individual author(s) and contributor(s) and not of MDPI and/or the editor(s). MDPI and/or the editor(s) disclaim responsibility for any injury to people or property resulting from any ideas, methods, instructions or products referred to in the content. |
© 2024 by the authors. Licensee MDPI, Basel, Switzerland. This article is an open access article distributed under the terms and conditions of the Creative Commons Attribution (CC BY) license (https://creativecommons.org/licenses/by/4.0/).
Share and Cite
MDPI and ACS Style
Moradiani, Z.; Ghaderi, M.; Tajeddin, H.-A.; Alfonso, P. Genesis of the Mahour Base Metal Deposit, Iran: Constraints from Fluid Inclusions and Sulfur Isotopes. Minerals 2024, 14, 435. https://doi.org/10.3390/min14040435
AMA Style
Moradiani Z, Ghaderi M, Tajeddin H-A, Alfonso P. Genesis of the Mahour Base Metal Deposit, Iran: Constraints from Fluid Inclusions and Sulfur Isotopes. Minerals. 2024; 14(4):435. https://doi.org/10.3390/min14040435
Chicago/Turabian StyleMoradiani, Zahra, Majid Ghaderi, Hossein-Ali Tajeddin, and Pura Alfonso. 2024. "Genesis of the Mahour Base Metal Deposit, Iran: Constraints from Fluid Inclusions and Sulfur Isotopes" Minerals 14, no. 4: 435. https://doi.org/10.3390/min14040435
Note that from the first issue of 2016, this journal uses article numbers instead of page numbers. See further details here.