
Mechanical Characteristics and Macro–Microscopic Response Mechanisms of Cemented Paste Backfill under Different Curing Temperatures

1
School of Civil and Resources Engineering, University of Science and Technology Beijing, Beijing 100083, China
2
State Key Laboratory of High-Efficient Mining and Safety of Metal Mines of Ministry of Education, University of Science and Technology Beijing, Beijing 100083, China
3
Robert M. Buchan Department of Mining, Queen’s University, Kingston, ON K7L3N6, Canada
*
Authors to whom correspondence should be addressed.
Minerals 2024, 14(4), 433; https://doi.org/10.3390/min14040433
Submission received: 18 February 2024
/
Revised: 5 April 2024
/
Accepted: 19 April 2024
/
Published: 22 April 2024
(This article belongs to the Special Issue Backfilling Materials for Underground Mining, Volume III)
Abstract
:Macroscopic and microscopic properties of cemented paste backfill (CPB) were studied through uniaxial compressive testing, acoustic emission (AE) monitoring, and microscopic feature analysis. The research shows that the uniaxial compressive strength (UCS) and elastic modulus have an exponential function type positive correlation with the increase in curing time and a polynomial function type with the rise of curing temperature; the mechanical parameters reach the maximum when the curing temperature is 40 °C. Increasing the curing time and curing temperature can promote the transition from shear crack to tensile crack. Increasing the curing time and raising the curing temperature both promote the transition of shear crack to tensile crack in the CPB. Overall, the crack mode is a combination of tensile and shear crack. At room temperature, the shear cracks dominates in the initial stage, but the proportion of the shear cracks decreases as the pressure increases in uniaxial compression test. At a curing temperature of 60 °C, the crack mode transitions to a tensile-shear mixed crack, with tension becoming the dominant crack mode. Microscopic analysis suggests an excellent linear correlation between the pore fractal dimension, UCS, and elastic modulus. When the pore fractal dimension decreases, the mechanical parameters also decrease. The pore fractal dimension can effectively characterize the macroscopic mechanical properties. Finally, the curing temperature is divided into two stages, with 40 °C as the dividing line for analysis. In the first stage, the increase in curing temperature effectively improved the mechanical parameters; in the second stage, the excessively high hydration reaction rate weakened the mechanical parameters.
1. Introduction
With the depletion of shallow mineral resources on the Earth’s surface, deep resource mining has become an inevitable trend for development [1,2]. China started deep mining metal ores relatively late, but its development rate has been fast [2,3]. Before the 20th century, China had only two metal mines with mining depths close to one kilometer: Tongling Dongguashan Copper Mine in Anhui Province, and Hongtoushan Copper Mine in Liaoning Province. However, in the 21st century, metal mining has experienced rapid development, and currently China has 16 metal mines with mining depths reaching 1000 m. It is anticipated that within the next ten years, more than one-third of metal mines in China will have mining depths reaching or exceeding one kilometer. In a relatively short period, the number of deep underground mines in China is expected to surpass that of any other country, making China the world’s leading nation in deep mining operations [4,5,6].
With the continuous increase in mining depth, the temperature of the rock has become a severe constraint on safe mining. The safe and efficient mining of deep metal mines, therefore, is a significant concern [7]. Facing the challenges of deep mining, mining with backfill has become popular due to its advantages, such as minimizing ore dilution and depletion, utilizing a wide range of materials at low cost, effectively managing solid waste like tailings, controlling subsidence in goaf areas, and managing ground pressure in mining areas [8,9,10]. In the backfill mining method, cement paste backfill (CPB) is a crucial and permanent component within the underground mining area. Its mechanical properties and stability are paramount for controlling ground pressure during the extraction process and maintaining the long-term stability of the underground mining structure. Indeed, the mechanical properties of CPB are not only influenced by its material composition, but also by the external environmental temperature [11,12]. The external ambient temperature notably influences the hydration reaction rate, hydration products, and internal pore structure of the CPB, consequently altering the overall structure and physical-mechanical properties. As a result, it affects the formation of early and long-term strength, which is vital in ensuring the stability of underground mining areas. To control deep-seated high-stress mining disasters and ensure safe production, mines often designed for higher cement-to-sand ratios and strength values. Backfill mining in low-value or low-grade deep underground mines can be a significant challenge due to the high costs associated with backfilling operations, which can cause bottlenecks and practical difficulties [13,14]. Therefore, gaining a deeper understanding of the macroscopic mechanical characteristics and formation mechanisms of CPB under high-temperature conditions in deep mines is crucial. This understanding can help design scientifically and rationally optimized mixture parameters, providing a theoretical basis and scientific support for successfully applying backfilling methods in deep mining operations.
Many scholars have considered the influence of temperature on the mechanical characteristics of CPB. As a result, a considerable amount of fruitful research has been conducted. These studies can be categorized into three main research methods: basic experimental methods [15,16,17], theoretical analysis methods, and numerical simulation methods [18,19]. Fall et al. [20,21,22] studied the mechanical characteristics of CPB at curing temperatures of 2, 20, 35, and 50 °C. They found that the curing temperature significantly impacts the mechanical performance of the CPB. Increasing the curing temperature resulted in a noticeable overall increase in strength. Han et al. [23] conducted a study by setting curing temperatures at 5, 10, 16, and 20 °C. The research concluded that the UCS of the CPB decreases with decreasing curing temperature. When the temperature is below 10 °C, it significantly influences the early strength of the CPB. Wu et al. [24] conducted a study and found that an increase in initial temperature leads to an improvement in the hydration degree of the CPB, thereby enhancing its compressive strength. However, the influence of the initial temperature on the elastic modulus was found to be insignificant. Chen et al. [25,26] investigated the effect of curing temperature on CPB. Through microscopic structural analysis, they concluded that both curing stress and curing temperature affect the rate of cement hydration reaction. Xu et al. [27] and Iarley et al. [28] studied the impact of initial temperature on the compressive strength, microstructural properties, and failure mode of fiber-reinforced CPB. They found that higher curing temperatures promote the hydration reaction of cement, resulting in the generation and precipitation of a significant amount of hydration products. This leads to a refinement of the pore structure and an improvement in the strength of the CPB. The studies above all indicate that curing temperature positively affects the mechanical characteristics of CPB. However, the existing research conclusions are rather general, and the difference analysis of the mechanical properties and hydration products of CPB under the condition of continuous change of curing temperature has not been formed. At present, the research has not effectively linked the synergistic development and evolution of internal hydration development, hydration product growth changes, and macroscopic mechanical properties changes caused by the change of curing temperature of CPB; the formation mechanism of mechanical properties under the effect of temperature also needs to be further studied.
Based on this, the effects of curing temperature and curing time on the UCS, elastic modulus, and stress–strain curve of the CPB were investigated. Subsequently, an acoustic emission (AE) analysis was conducted to analyze the characteristic parameters of AE and spatial-temporal evolution during the failure process of the CPB. The average frequency (AF) and rise angle (RA) were utilized to study the damage evolution characteristics of the CPB under different curing conditions. Lastly, the characterization of hydration products was performed using compressional wave velocity, nuclear magnetic resonance (NMR), scanning electron microscopy (SEM), and other techniques.
2. Materials and Methods
2.1. Materials
CPB was mainly composed of cementitious materials, tailings, and mixing water, which were proportionally mixed. The cementitious material used in the experiment was 42.5R ordinary Portland cement. The tailings were obtained from the waste of a gold mine in Shandong Gold Group. After drying and grinding, the tailings used in the experiment were obtained. The mixing water was tap water from the laboratory.
Before the experiment, a study was conducted to examine the physical properties of each material. The experiment involved using an LS-POP laser particle size analyzer to analyze the particle size of the materials. X-ray diffractometry was employed for material phase analysis, and EVO18 tungsten filament scanning electron microscopy was used to analyze the shape of the materials. The chemical composition of the materials was analyzed using an X-ray fluorescence spectrometer.
Figure 1 presents the particle size distribution curves for the tailings and cement. The tailings were observed to have a cumulative 50% particle size of 332.66μm, classifying them as coarse tailings according to the Landriault tailings classification system. The calculated coefficient of curvature for the tailings was 1.59, and the uniformity coefficient was 5.91, indicating a relatively good continuity in particle grading. Additionally, further testing reveals that the specific surface area of the tailings was 57.764 m3/kg, with a density of 2340 kg/m3.
The ordinary Portland cement had a cumulative 50% particle size of 7.86 μm and a maximum particle size of 35μm. It possessed a specific surface area of 350 m3/kg and a 3100 kg/m3 density. The initial setting time was 150 min, and the final setting time was 212 min. The flexural strength after three days (σt-3d) was 5.2 MPa, and the compressive strength after three days (σc-3d) was 27.6 MPa.
Figure 2 illustrates the X-ray diffraction (XRD) patterns and microstructure images of the tailings and cement. The XRD analysis revealed that the predominant crystalline minerals in the tailings were low-reactivity substances such as quartz and corundum. These minerals exhibited irregular particle shapes and varying sizes. In contrast, the cement composition primarily consisted of tricalcium silicate (C3S), dicalcium silicate (C2S), tricalcium aluminate (C3A), tetracalcium aluminoferrite (C4AF), and minor amounts of gypsum. The cement particles also exhibited irregular shapes with varying sizes. During the hydration process, the cement particles readily interacted with water, resulting in the formation of hydrated calcium silicate gel (C-S-H) and calcium hydroxide (Ca(OH)2) crystals. As a result, cement served as a suitable binder material for the preparation of CPB.
Table 1 presents the major chemical compositions of the tailings and cement. It was observed that the tailings primarily consisted of silica (SiO2) and alumina (Al2O3), accounting for 71.16% and 13.40%, respectively. The analysis results were consistent with the XRD test results. The calculated alkalinity coefficient M0 = (CaO + MgO)/(SiO2 + Al2O3) = 0.05 < 1, indicating an acidic nature of the tailings. Moreover, the activity index Ma = Al2O3/SiO2 = 0.19 indicates low reactivity and is unfavorable for activating cementitious materials.
The main components of cement are CaO and SiO2, with contents of 64.90% and 22.40%, respectively. The mass ratio of each phase was calculated using Bogue equations, yielding the following results: C3S accounts for 53.83%, C2S accounts for 23.62%, C3A accounts for 6.55%, C4AF accounts for 9.77%, and CaSO4 accounts for 3.09%.
2.2. Experimental Equipment and Test Method
The experiment utilized a YAW-600 computer-controlled electro-hydraulic servo-controlled testing machine for uniaxial compression testing of CPB, as shown in Figure 3. During the compression process, the DS5 complete information AE analyzer was used for AE monitoring and localization experiments. The pressure machine applied a uniform loading rate of 0.5 mm/min. A digital camera was used to capture real-time images of the CPB surface to observe crack propagation and analyze the failure mode more effectively. After the test, peak strength and axial deformation were recorded, and the stress–strain curve throughout the shearing was obtained.
The DS5 complete information AE analyzer was used to achieve real-time localization of AE events in the CPB by employing at least four sensors. Its main working principle was as follows. During the CPB failure process, the sensors received the strain energy released in the form of elastic waves. The sensors converted the surface vibrations of the CPB caused by the elastic waves into voltage signals. After being amplified by an amplifier, the signals were transmitted to the AE acquisition unit for signal processing. Finally, the AE waveform information was displayed by the computer-based AE processing system [29,30]. Six sensors were used for AE monitoring. The sensors were arranged in a cross pattern at the specimen’s top, middle, and bottom positions. Vaseline was a coupling agent to reduce signal attenuation in AE monitoring. The AE monitoring system was set with an amplifier gain of 60 dB, corresponding to a magnification factor of 1000. The AE trigger threshold was set at 35 mV. A sampling frequency of 1 MHz was selected, allowing the acquisition of AE signals at a rate of 1 MHz per second.
During the experiment, a fixed cement-to-sand ratio of 1:6 and a concentration of 70% were maintained. Standard cylindrical specimens with a diameter of Φ50 mm × H100 mm were prepared following the procedure depicted in Figure 4. The sampling principle of “dry mixing followed by wet mixing” [31,32] was employed. Firstly, the cement and sand were mixed in the proper proportions and thoroughly stirred. Then, an appropriate amount of water was added. A JJ-5 cement mortar mixer was used, with low-speed stirring for 2 min and high-speed stirring for 8 min. After achieving a uniform mixture, it was poured into the mold to prepare the standard specimens. After 48 h of curing inside the curing box, the specimens were de-molded, and the ends were polished to ensure a surface roughness of less than 0.02 mm. The curing box temperature was varied for the experiment at 20, 30, 40, 50, and 60 °C, with a controlled temperature deviation of ±1 °C at each temperature. The curing times were set at 3, 7, 14, and 28 days. Three specimens were prepared for each set of conditions, and the average value of the experimental results was used for final analysis and research. With this arrangement, the experimental errors were reduced.
To investigate the characteristics of hydration products in CPB under different curing conditions, the hydration process of CPB was characterized at the microscale. Building upon the foundation of mechanical testing, various techniques, including compressional wave velocity measurements, NMR, SEM, TGA, and FT-IR, were employed to study the hydration product characteristics of CPB at different curing times and temperatures. These characterization methods provided valuable insights into the hydration process of CPB and contributed to a comprehensive understanding of its properties under different curing conditions.
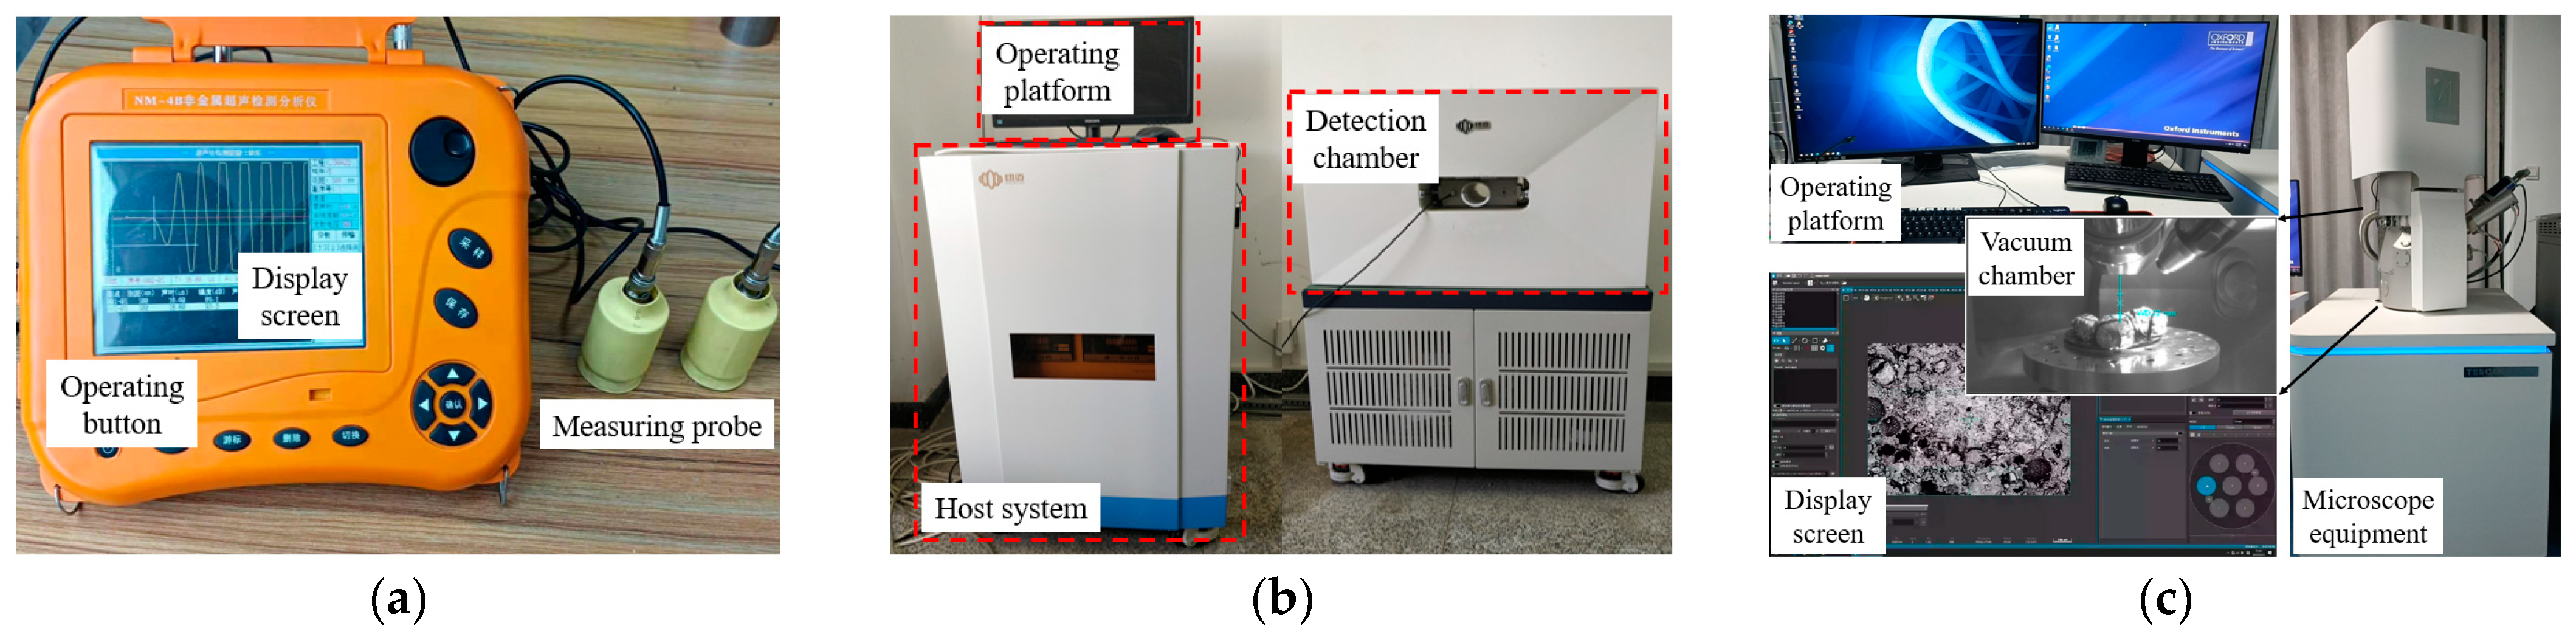
After reaching the designated curing time, the CPB specimens were carefully retrieved from the curing box and gently wiped to remove any surface moisture. The specimens were tightly wrapped in cling film with the aim of preventing moisture evaporation during testing. Prior to conducting mechanical experiments, a non-metallic ultrasonic testing analyzer was employed to measure the longitudinal wave velocity, providing valuable insights into the internal compaction of the CPB. Furthermore, an NMR analyzer was utilized to analyze the surface relaxation and free relaxation characteristics of hydrogen atoms within the CPB. These data were then used to study the porosity of the specimens through inversion techniques. Following the mechanical experiments, small 1 cm3 sections of the CPB were selected for sample preparation for SEM. The specimens were securely affixed to conductive iron plates using a conductive adhesive and coated with a carbon film to ensure optimal conductivity. This enabled the observation of the microstructural distribution features of the CPB. The experimental setup is depicted in Figure 5.
The massive CPB was selected and ground into powder, and a thermogravimetric experiment was carried out with a thermogravimetric analyzer. The heating rate was set at 10 °C/min, and the temperature range was from room to 900 °C. A PerkinElmer Frontier infrared spectrometer was used to conduct Fourier transform infrared spectroscopy experiments of CPB at different curing temperatures to further analyze the reaction process of hydration products.
3. Results and Discussion
3.1. Macroscopic Mechanical Characteristics Analysis
3.1.1. Mechanical Characteristic
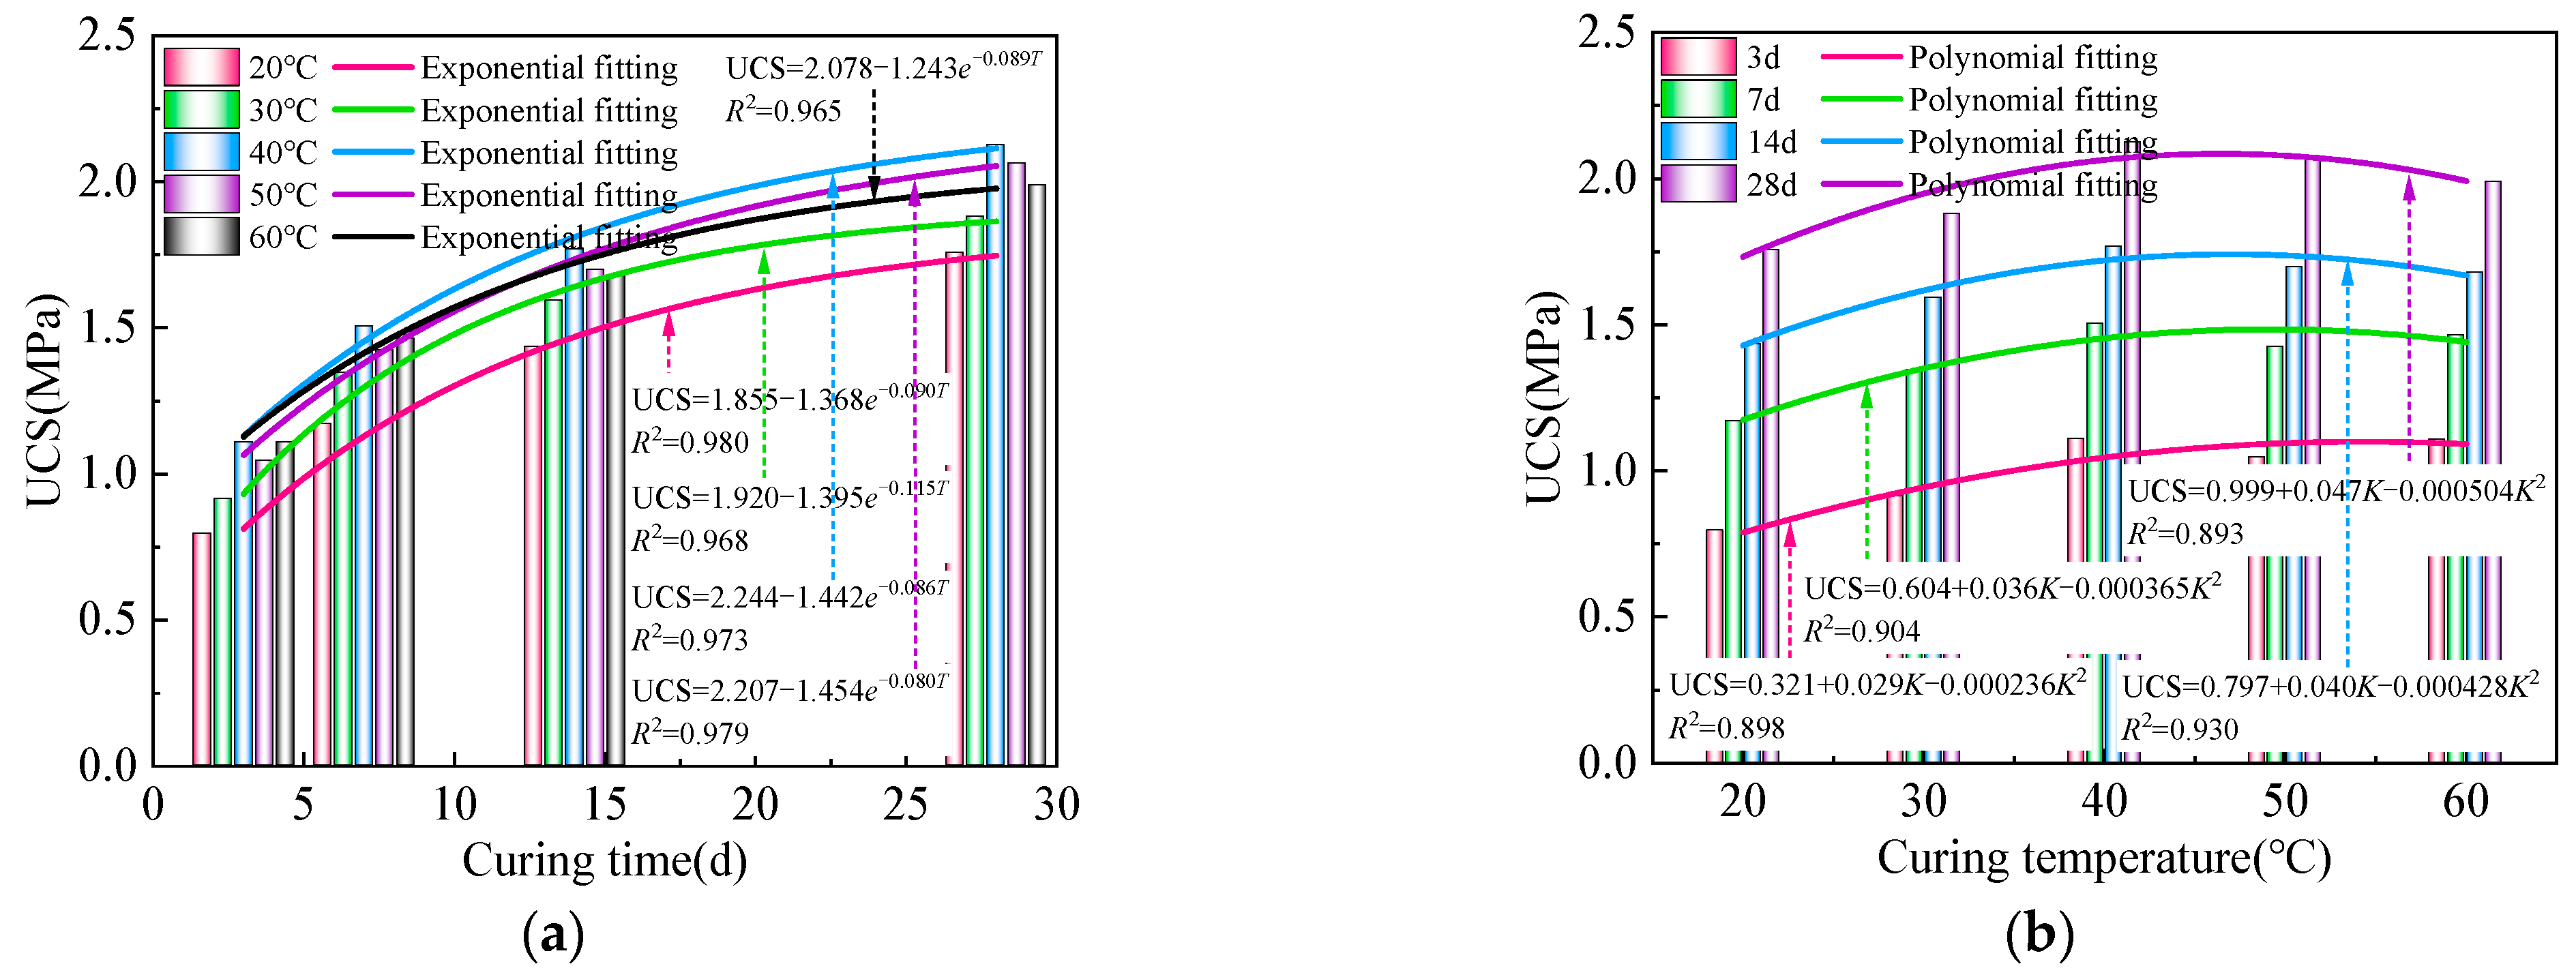
Figure 6a. shows the variation pattern of UCS of CPB under different curing time conditions. With the increase in curing time, the UCS of CPB tends to increase gradually, but the rate of increase decreases. The UCS increases rapidly in the early stage (within 7 days) and then gradually levels off in the later stage. For the specimen with a curing temperature of 20 °C, the UCS was 0.795 MPa at a curing time of 3 d. The strength increased to 1.170 MPa at 7 d, with an average growth rate of 0.093 MPa/d. By 14 d, the strength increased to 1.434 MPa, with an average growth rate of 0.058 MPa/d. By 28 d, the strength reached 1.757 MPa, with an average growth rate of 0.038 MPa/d. Similarly, at a curing temperature of 30 °C, compared to the compressive strength of the CPB at curing times of 3 d, the average growth rates at curing times of 7 d, 14 d, and 28 d were 0.108 MPa/d, 0.062 MPa/d, and 0.039 MPa/d, respectively. This trend of decreasing average growth rates with increasing curing time was observed for CPB cured at temperatures of 40 °C, 50 °C, and 60 °C. To assess the correlation between the UCS of the CPB and the curing time, an exponential function y = aebx + c was used for fitting. The correlation coefficients were all greater than 0.95, indicating that the exponential function can effectively represent the correlation between the UCS and the curing time.
Figure 6b shows the variation pattern of UCS of CPB under different curing temperature conditions. At a curing age of 3 d, the UCS of the specimen was 0.795 MPa at a curing temperature of 20 °C. Increasing the curing temperature to 30 °C increased UCS to 0.913 MPa, representing a relative increase of 14.8%. Further raising the curing temperature to 40 °C led to a UCS of 1.108 MPa, showing a relative increase of 39.4%. At a curing temperature of 50 °C, the UCS reached 1.045 MPa, indicating a relative increase of 31.4%. Finally, when the curing temperature was increased to 60 °C, the UCS reached 1.107 MPa, showing a relative increase of 39.2%. Similarly, at a curing age of 7 d, the UCS increased by 15.0%, 28.5%, 21.7%, and 25.0% when the curing temperature increased from 20 °C to 30 °C, 40 °C, 50 °C, and 60 °C, respectively. At curing times of 14 d and 28 d, the same pattern was observed. With the increase in curing temperature, the strength of the CPB exhibits a characteristic pattern of initially increasing and then decreasing. The maximum strength of the CPB was achieved at a curing temperature of 40 °C. Raising the curing temperature can increase the strength of the CPB, but a temperature that is too high can inhibit the effect. Taking into account the correlation between the UCS of the CPB and the curing temperature, a polynomial function y = ax2 + bx + c was employed to fit their relationship. This demonstrates that the polynomial function was well-suited for representing the correlation between the UCS and the curing temperature.
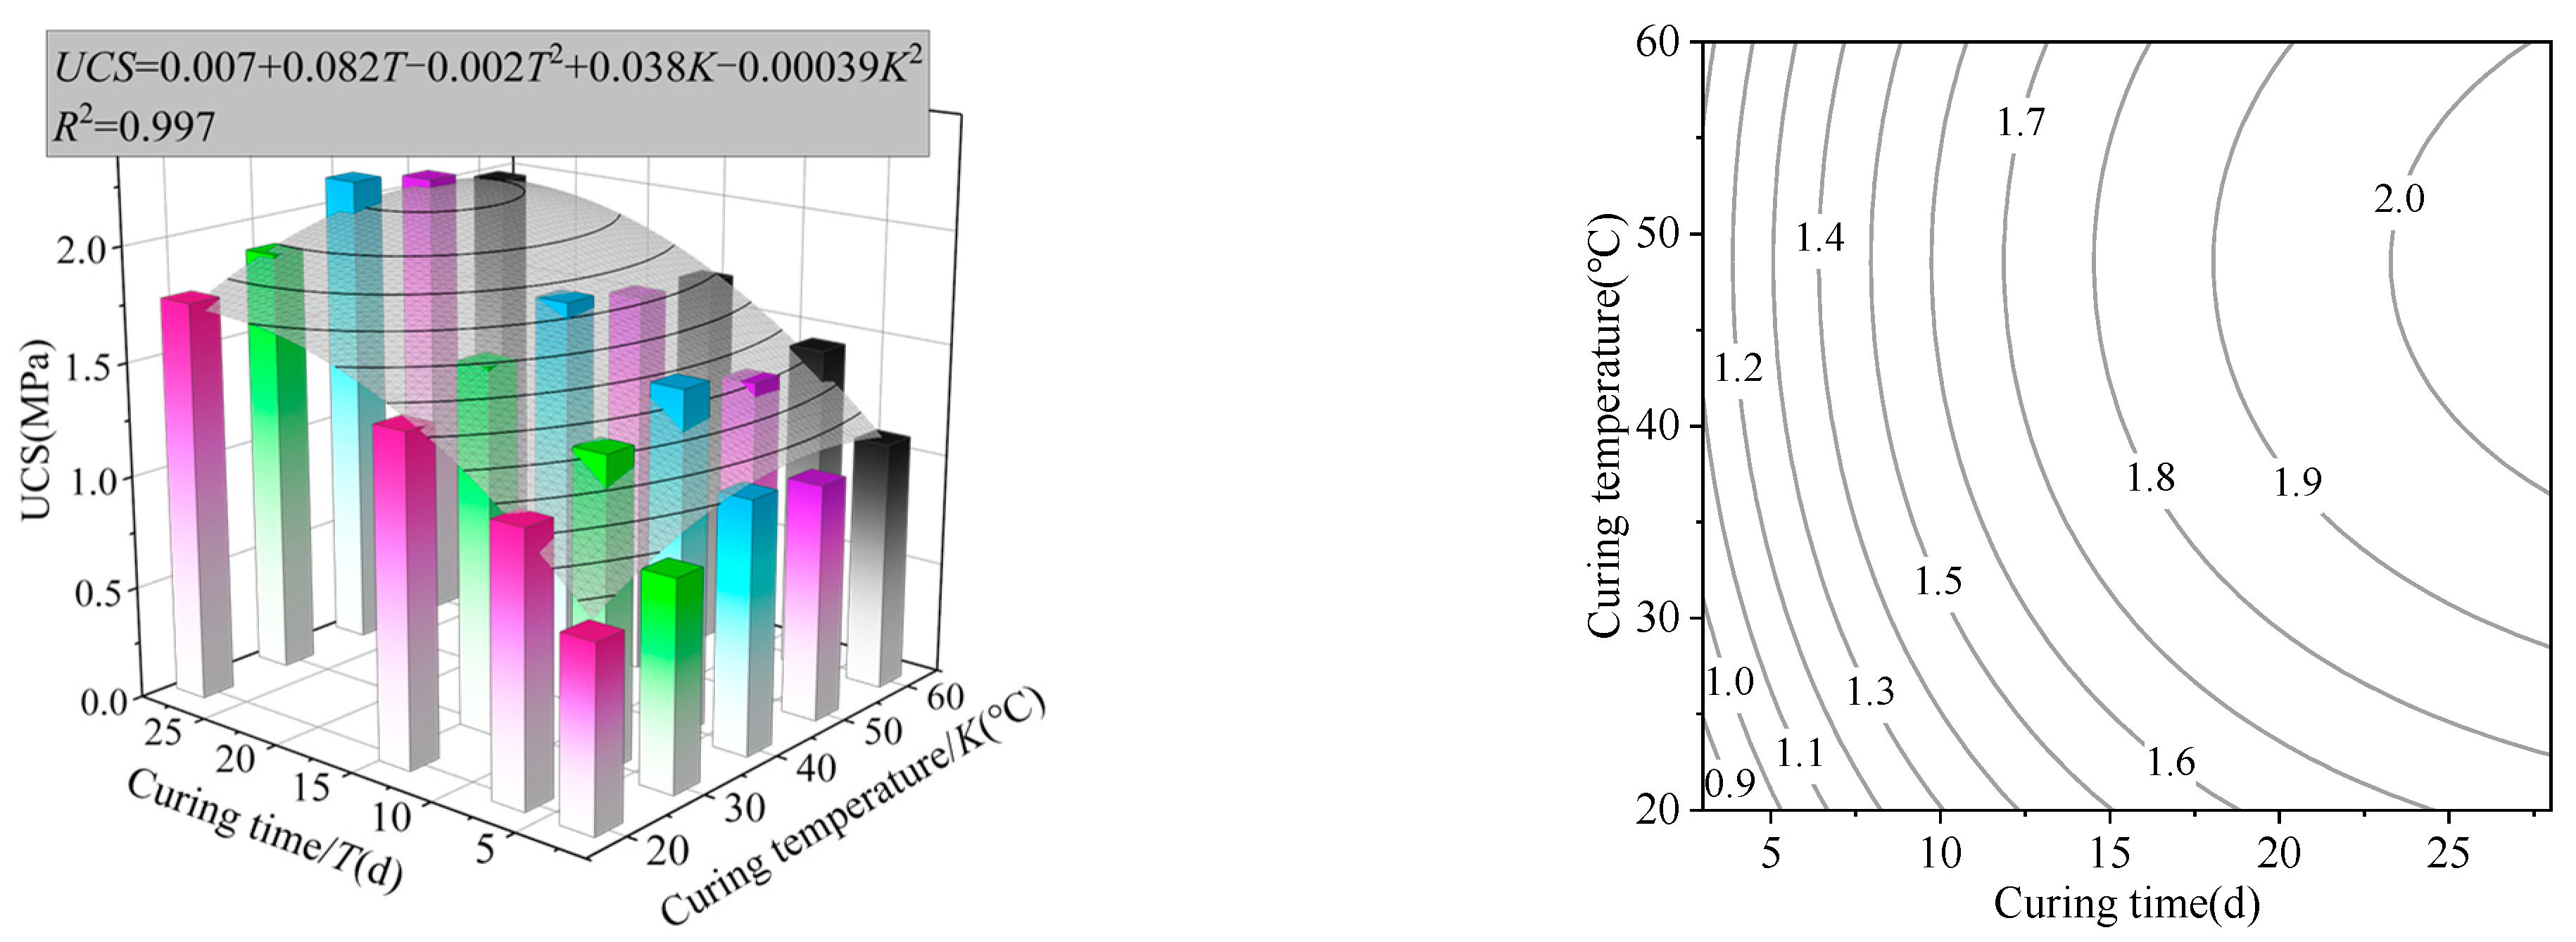
Considering the effects of curing time and curing temperature on the UCS, the three-dimensional UCS diagram and contour map were drawn as shown in Figure 7. The uniaxial compressive strength increases with the increase of curing time. It shows a trend of first increasing and then decreasing with increasing curing temperature. The contour lines in this figure show that when the curing time is relatively low, the contour lines are almost perpendicular to the curing time, indicating that during the early maintenance of the CPB, the curing time significantly impacts strength. At the same time, the influence of temperature is relatively minor. This indicates that the initial development stage of CPB strength is more sensitive to curing time.
In the later stages of the strength growth of the CPB, the sensitivity to curing temperature gradually increases. By the time it reaches 28 d, the contour lines have formed a triangular trend approximately at a 45° angle. This indicates that curing temperature plays an essential role in the strength variation of the UCS during the later stages. Moreover, as the curing time increases, the spacing between contour lines also gradually increases. This indicates that both the curing time and curing temperature exhibit a decreasing overall sensitivity to the strength. On the other hand, the apex of the triangular contour lines in the graph was located between 40 and 50 °C. This indicates that the UCS can reach its maximum value within this range.
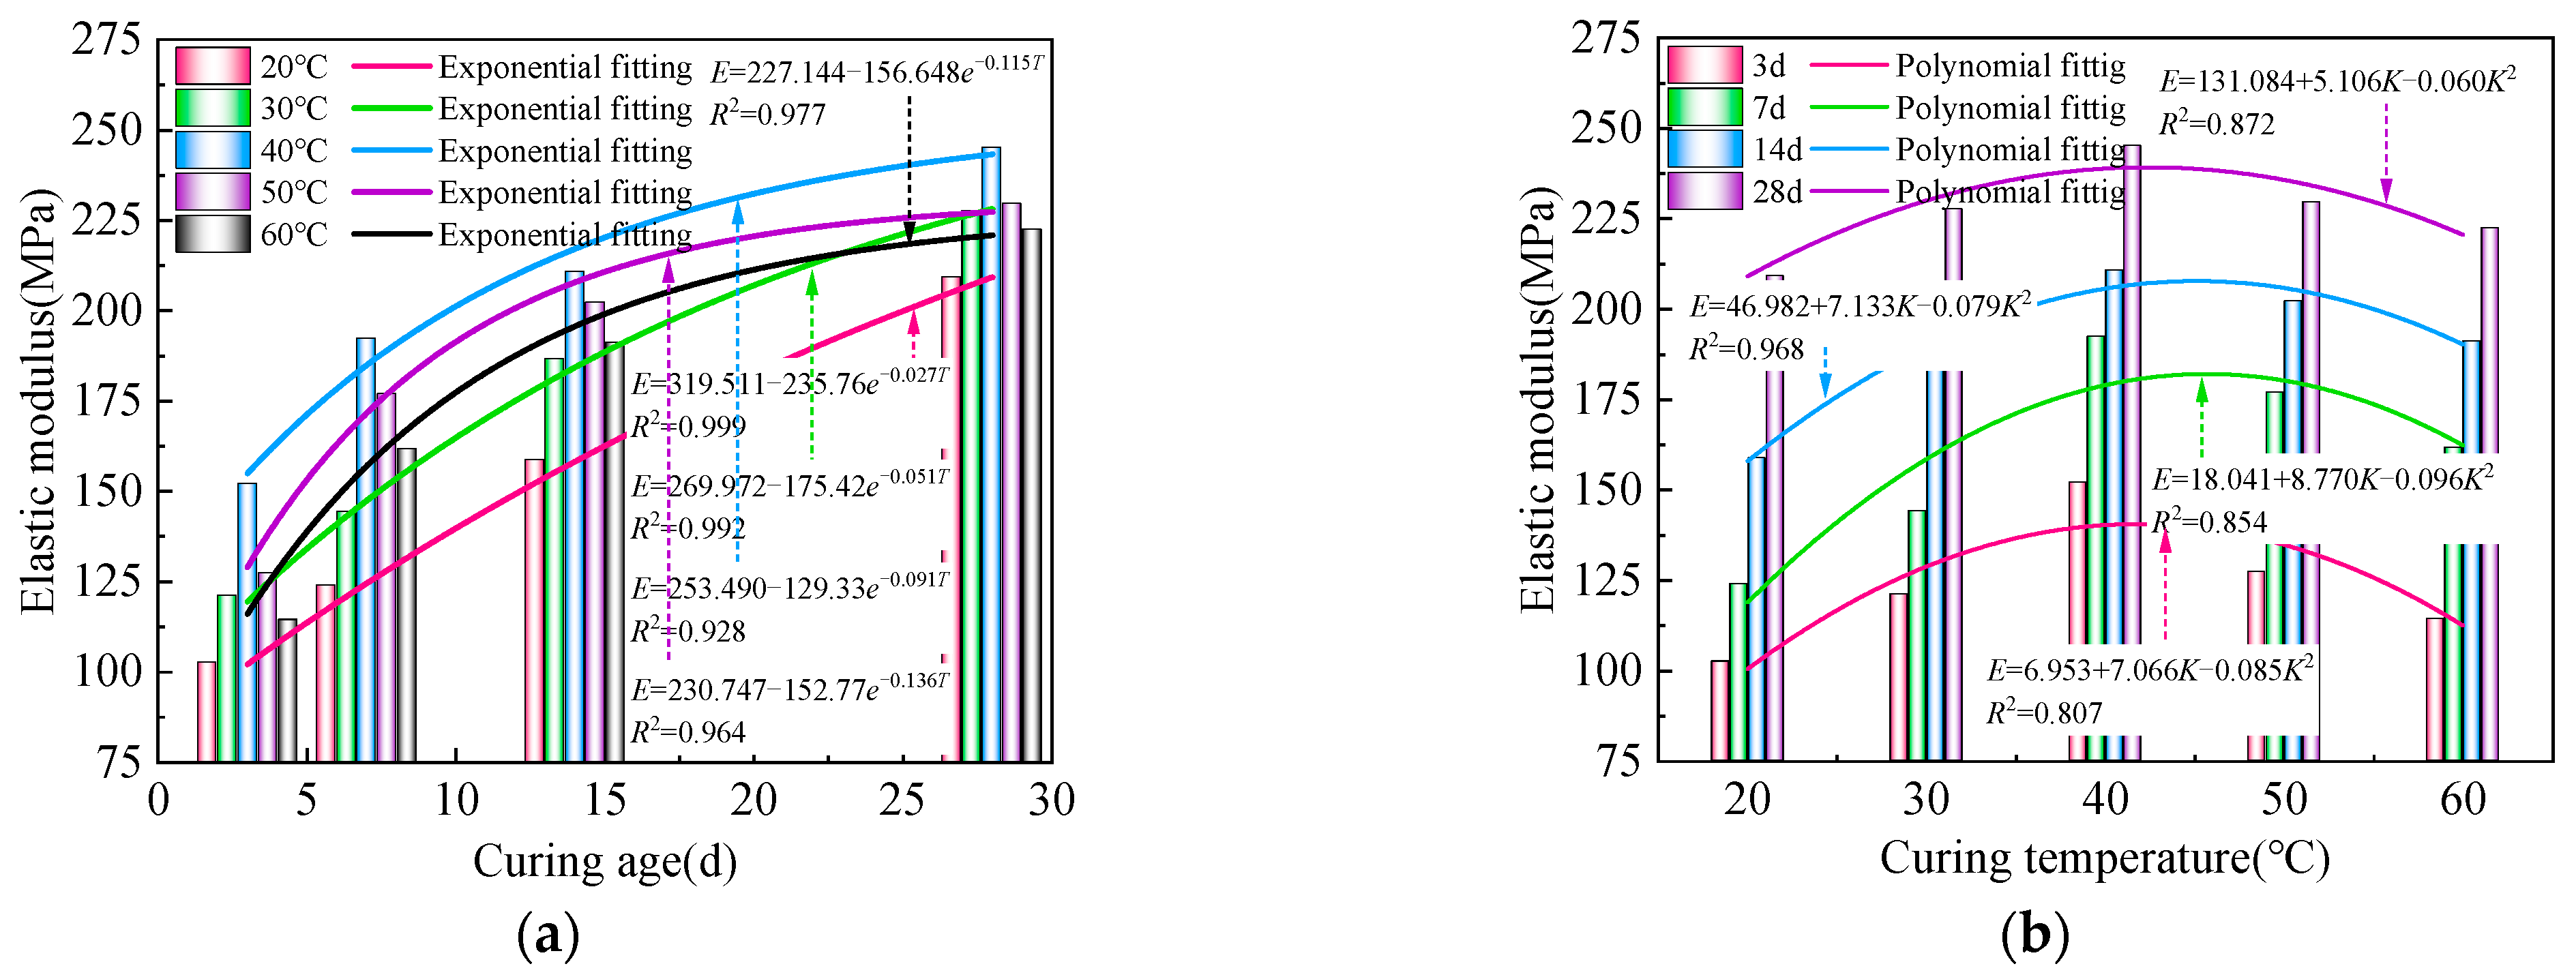
The elastic modulus is a crucial indicator for measuring a specimen’s elastic deformation extent. A higher value indicates that a more significant amount of stress is required for the specimen to undergo deformation, implying a higher level of stiffness. Figure 8a illustrates the variation of the elastic modulus of CPB under different curing time conditions. The elastic modulus increases with an increase in the curing time. Specifically, for specimens cured at a temperature of 20 °C, compared to the elastic modulus cured for 3 d, the average growth rates of the elastic modulus at curing times of 7 d, 14 d, and 28 d were 5.35 MPa/d, 5.11 MPa/d, and 4.27 MPa/d, respectively. For specimens with a cured temperature of 40 °C, compared to the elastic modulus cured for 3 d, the average growth rates of the elastic modulus at curing times of 7 d, 14 d, and 28 d were 10.11 MPa/d, 5.35 MPa/d, and 3.73 MPa/d, respectively. Similar trends are observed at curing temperatures of 30 °C, 50 °C, and 60 °C. As the curing time increases, the average growth rate of the elastic modulus gradually decreases. The variation pattern of the elastic modulus exhibits characteristics similar to those of the UCS. The exponential function y = aebx + c was employed to fit the correlation between the elastic modulus and the curing time. The high correlation coefficients indicate a robust fitting performance, indicating that the exponential function effectively captures the relationship between the elastic modulus and the curing time.
Figure 8b illustrates the variation pattern of the elastic modulus of the CPB under different curing temperature conditions. At a curing time of 3 d, when the curing temperature increased from 20 °C to 60 °C, the UCS increased by 18.1%, 48.2%, 24.1%, and 11.5%, respectively. At a curing time of 14 d, when the curing temperature increased from 20 °C to 60 °C, the UCS increased by 17.6%, 32.8%, 27.4%, and 20.4%, respectively. At curing times of 7 d and 28 d, similar trends are observed. With increased curing temperature, the elastic modulus exhibits a pattern of initial increase followed by a decrease. At a curing temperature of 40 °C, the elastic modulus reaches its maximum value. The curing temperature corresponding to the maximum value of elastic modulus is consistent with the maximum value of UCS, and the two parameters have the same variation law. When considering the correlation between the elastic modulus and the curing temperature, a polynomial function y = ax2 + bx + c was employed to fit their relationship. These high correlation coefficients demonstrate strong fitting performance, indicating that the polynomial function effectively represents the correlation between the elastic modulus and the curing temperature.
Similarly, considering the combined effect of curing time and curing temperature on the elastic modulus of the CPB, the three-dimensional elastic modulus diagram and contour map were drawn, as shown in Figure 9.
The elastic modulus follows a similar pattern to the UCS. It increases with the prolongation of the curing time, and initially rises and then declines with the increase in curing temperature. Observing the contour lines in the figure, it was evident that during the initial stages of the curing process, the elastic modulus was more responsive to changes in curing time. As the curing time increases, the elastic modulus also increases. Conversely, during the later stages, the influence of curing temperature becomes more pronounced, resulting in an initial increase and subsequent decrease in the elastic modulus as the curing temperature rises. The contour lines gradually form a triangular shape in the figure, with the apex around 40 °C. This indicates that the CPB exhibits its maximum elastic modulus at approximately 40 °C. Moreover, both curing time and curing temperature exhibit diminishing effects on the sensitivity of the CPB’s strength over time.
Figure 10 characterizes the relationship between UCS and elastic modulus at different curing temperatures, and shows a correlation fitting analysis. It can be seen that under different conditions, the UCS and elastic modulus have a consistent change law, and both increase with an increase in curing time, and show a trend of first increasing and then decreasing with the increase of curing temperature. The results showed that the correlation coefficient between the UCS and the elastic modulus was 0.937, which followed the linear regression equation UCS = −0.01685 + 0.00863E, and had a good correlation.
3.1.2. Stress–Strain Curves
Based on the data from uniaxial compression tests, Figure 11 illustrates the complete stress–strain curves under different curing conditions. Notably, the stress–strain curves exhibit distinct patterns as they evolve under various curing temperatures. Under uniaxial compression conditions, the specimens exhibit four stages similar to those observed in rocks: compaction stage, linear elastic stage, crack propagation stage, and failure stage. With the increase in curing time, the strength of the CPB gradually increases when it undergoes failure, while the corresponding axial strain decreases gradually. This is mainly due to the increased strength, which leads to the accumulation of more energy during the failure of the CPB. As the strain decreases, the overall strength increases, and the rate of strength reduction after the peak accelerates. This indicates that increasing the curing time enhances the brittleness of the CPB.
Observing Figure 11f, it can be noted that an increase in the curing temperature causes the stress–strain curve to shift forward during the compaction stage. Higher temperatures lead to a more pronounced linear increase in the stress–strain curve, indicating a more prominent linear elastic behavior. During the failure process, the varying degrees of the hydration reaction result in differences in strength. When the curing temperature exceeds 40 °C, the excessively high temperature accelerates the hydration reaction, impeding the complete hydration of the cementitious material. As a result, the stress–strain curve exhibits a faster initial growth rate, but lower strength.
3.2. Analysis of AE Results
3.2.1. AE Characteristic
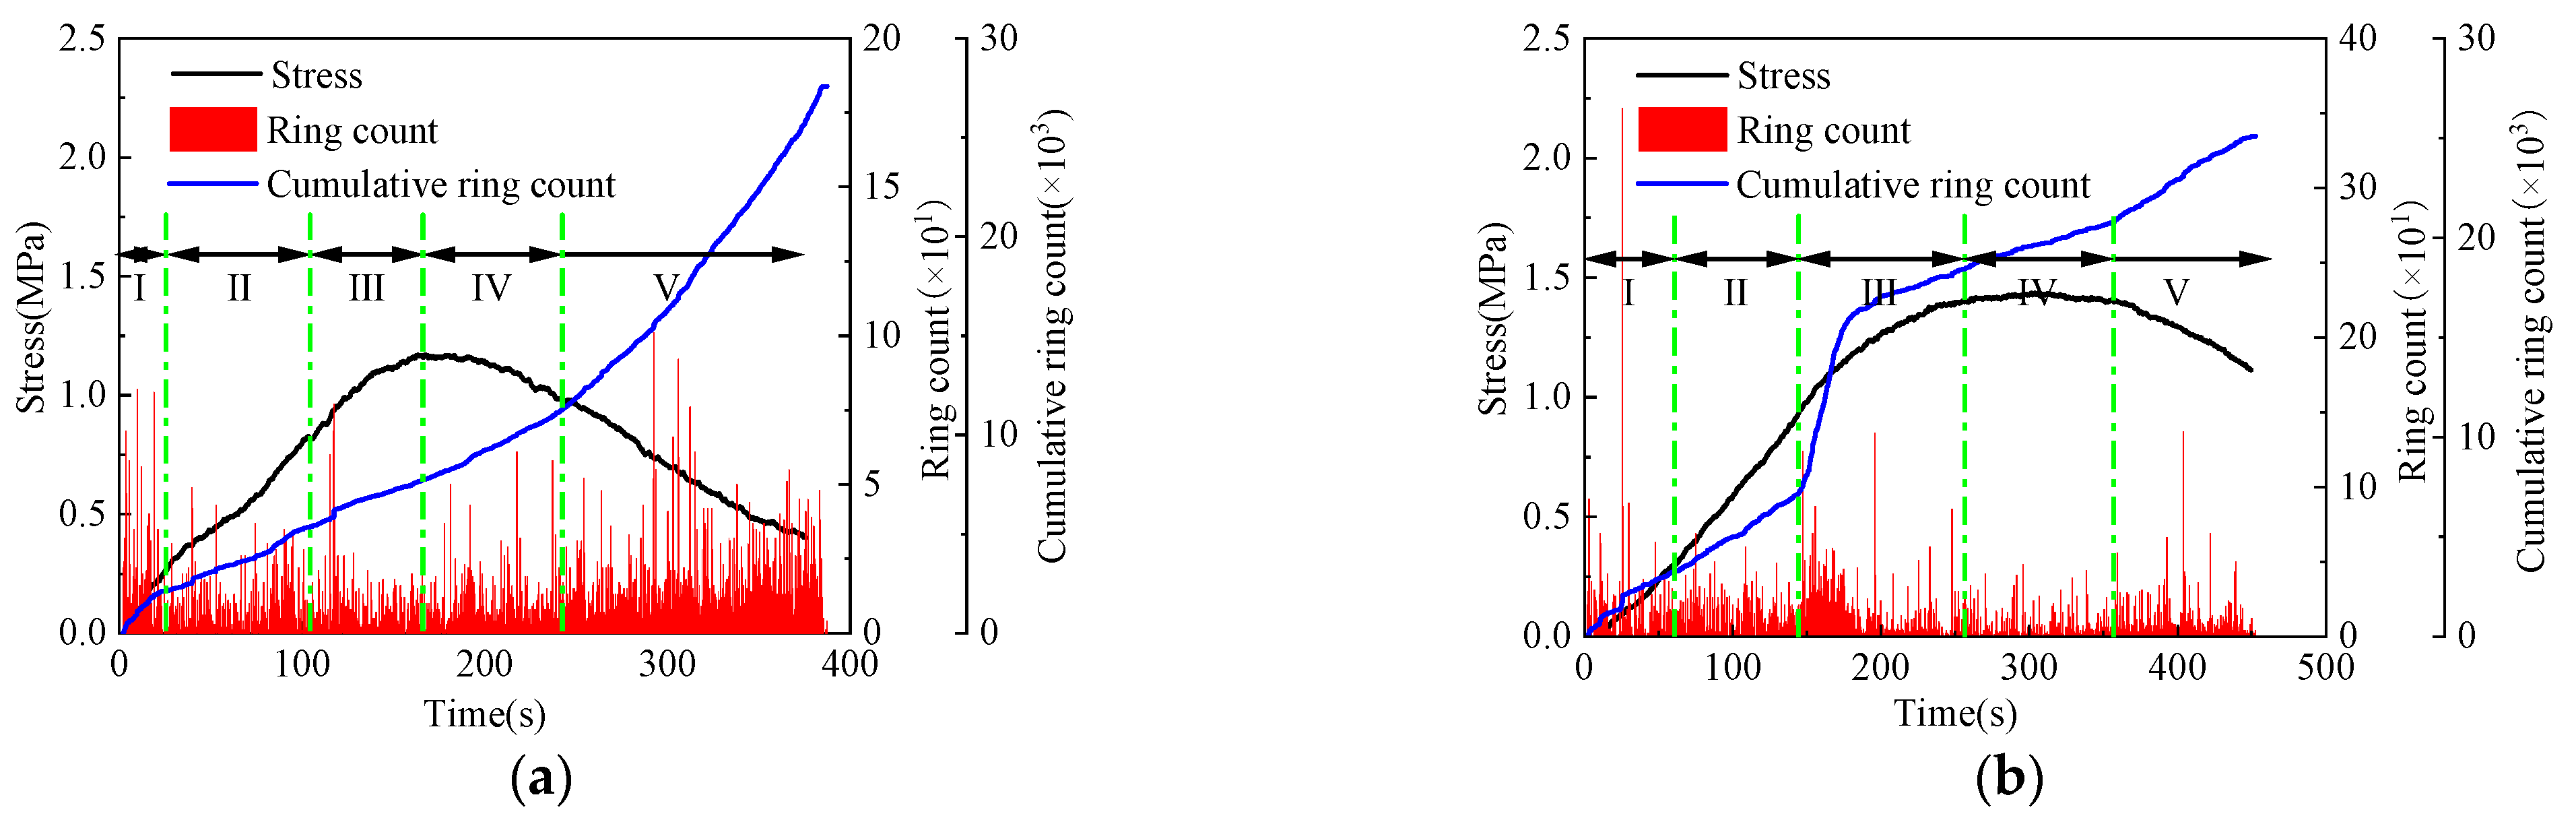
The count of AE events can effectively reflect the activity of material damage [33,34,35]. Therefore, considering the AE event count (including cumulative count) as a characteristic parameter, the damage and failure characteristics under different curing conditions are revealed. Taking the curing conditions of 20 °C—7 d and 60 °C—7 d as examples, the time–stress–AE event count curve is depicted in Figure 12. The AE event count (cumulative count) under different curing conditions during the uniaxial compression test showed similar variation characteristics. Based on the evolution of AE event count over time, the uniaxial compression test was divided into five stages: stage I—initial active stage, stage II—pre-peak quiet stage, stage III—pre-peak active stage, stage IV—post-peak quiet stage, and stage V—post-peak active stage, exhibiting a pattern of “active→quiet→active→quiet→active” variation.
The initial active stage corresponds to the compaction stage of the stress–strain curve. During this stage, the internal pores and cracks close under the applied pressure, releasing significant energy due to inter-particle friction. This generates significant disturbances near the initial crack, leading to a higher AE event count during this stage. As the pressure increases, the CPB exhibits a more stable development, resulting in a quieter AE event count. This stage corresponds to the linear elastic stage of the stress–strain curve and represents a stable development phase, leading to a linear increase in the cumulative AE event count.
When the stress–strain curve shows ductile failure, the internal cracks gradually propagate, resulting in significant damage to the specimen within a short time. During this stage, the AE event count accumulates rapidly, indicating a high activity level. As the specimen approaches failure, the AE activity intensifies. After the specimen fails and macroscopic cracks form, losing load-bearing capacity, the AE event count returns to low levels. However, it quickly increases again, indicating a more significant extent of damage occurring under compression after failure. In the post-peak stage, the AE event count exhibits a “quiet→active” behavior pattern.
Comparing the cumulative ring count at different curing times for the CPB at each stage (Figure 13a), it can be observed that the cumulative ring count increases with the increase in curing time. As a result of the increased strength of the CPB, a relatively larger number of microcracks were generated during the process of failure, leading to an increased friction effect between the internal particles. Therefore, the cumulative ring counts detected by AE before failure increased with the increase in the curing time, showing an increasing trend in all stages. However, in Stage IV, the cumulative ring counts showed a decreasing trend. This result was mainly due to the incomplete hydration reaction of the CPB under low curing time, resulting in higher ductility. This can also be observed from the stress–strain curve, which showed a slow and gradual change after failure without a rapid decrease. On the other hand, under high curing time, the specimens gradually transformed from ductile to brittle, and after failure, a significant decrease in ring counts occurred within a short period. Stage V was related to the loading time after failure and had a larger error, so it was not explicitly analyzed. Based on the cumulative ring counts of the first four stages, the ring count proportions for each stage were calculated. With the increase in curing time, due to the increased strength, the brittleness of the CPB was enhanced, resulting in an increased proportion of ring counts before the peak and a decreased proportion of ringing counts after the peak.
Similarly, when comparing the ring counts under different curing temperatures (Figure 13b), it was observed that with the increase in curing temperature, the cumulative ring counts in Stage I, Stage II, and Stage III initially increased and then decreased. This trend was consistent with the changes in strength. As the strength increased, more ring counts were accumulated before the peak in Stage IV, while the cumulative ring counts after the peak decreased. The proportions of ring counts in each stage followed the same pattern.
3.2.2. AE Spatiotemporal Localization
The utilization of AE event localization was a crucial method for studying the process of material failure and instability. Researchers could analyze the spatiotemporal evolution characteristics during the fracture process by applying AE localization techniques. This enabled them to describe the three-dimensional distribution of cracks within the CPB. Combining this information with an examination of the material’s failure morphology could provide a comprehensive understanding of its damage and failure evolution characteristics. AE event localization played a significant role in unraveling the complex nature of material failure and instability. The Geiger localization algorithm was employed in this study for AE event localization. It involved a limited number of iterations using the monitored data to determine the final localization results.
Using a curing time 7d as an example, Figure 14. depicts AE’s damage morphology and spatial distribution under different curing temperature conditions. The comparison between the three-dimensional localization map of AE and the actual fracture pattern demonstrates a close agreement, indicating a reliable representation of the actual damage process. Overall, the CPB exhibits a mixed failure pattern of tension and shear. With increasing curing temperature, the failure mechanism transitions from gradual and ductile to sudden and brittle mode. At a curing temperature of 20 °C, more AE events are detected during specimen failure and are more widely distributed throughout the specimen. However, at a curing temperature of 60 °C, localized AE events decrease, and they tend to concentrate in specific areas.
Under high-temperature curing conditions, the hydration products formed a relatively stable internal structure. Stress concentration phenomena mainly occurred in localized areas under pressure, and regional damage was the leading cause of overall instability in the CPB. On the other hand, under low-temperature curing conditions, the formation of hydration products was slower, and the overall compactness of the hydration products was relatively weak. Macroscopically, the strength was lower, and more dispersed damage phenomena occurred under pressure.
To further explore the spatiotemporal evolution characteristics of the CPB during the failure process, we conducted a study focusing on the 40 °C—7 d, 40 °C—14 d condition. The objective was to capture the dynamic changes of crack initiation, propagation, and other related phenomena by analyzing the AE data. The results are illustrated in Figure 15 and Figure 16.
During Stage I, the primary occurrence was the compaction and closure of internal microcracks, resulting in a dispersed and disordered distribution pattern in the AE localization map. As we entered Stage II, the number of AE events gradually increased, and their locations became more concentrated in localized areas, indicating the presence of initial cracks and their slow expansion. With the continuous increase of axial stress, concentrated AE events became more pronounced, accumulating rapidly along the main fracture zone and forming a more prominent rupture surface. Stages IV and V represented the post-failure stages, where AE events accumulated around the rupture surface, indicating the formation of significant cracks after the instability. In the overall process, the AE events were first observed near the end positions and gradually propagated toward the center, resulting in cracks due to shear and tensile effects.
Upon comparing the spatiotemporal distribution characteristics of AE in CPB under different curing times at a curing temperature of 40 °C, it can be observed that as the curing time increased, the hydration reaction became more thorough, resulting in stronger hydration products. This gradual improvement in hydration led to an increase in the strength. This was particularly evident in Stage I, where the dispersity of AE events significantly decreased, and the main failure zone appeared relatively early. In contrast, fewer acoustic emission events were generated in the surrounding areas. Research indicates that when the hydration reaction was fully developed, it effectively enhanced the compactness and integrity, reducing their internal porosity and significantly improving their strength.
3.2.3. AE Damage Evolution
The damage and failure evolution characteristics were evaluated based on the AE test results to characterize the failure mode accurately. In the waveform, the AF and the RA parameter indicators were used to qualitatively analyze the material’s failure mechanism. Equation (1) gives the calculation formulas for these two indicators. Generally, AE events associated with a tensile cracks are characterized by larger AF and smaller RA, while smaller AF and larger RA characterize AE events associated with shear cracks.
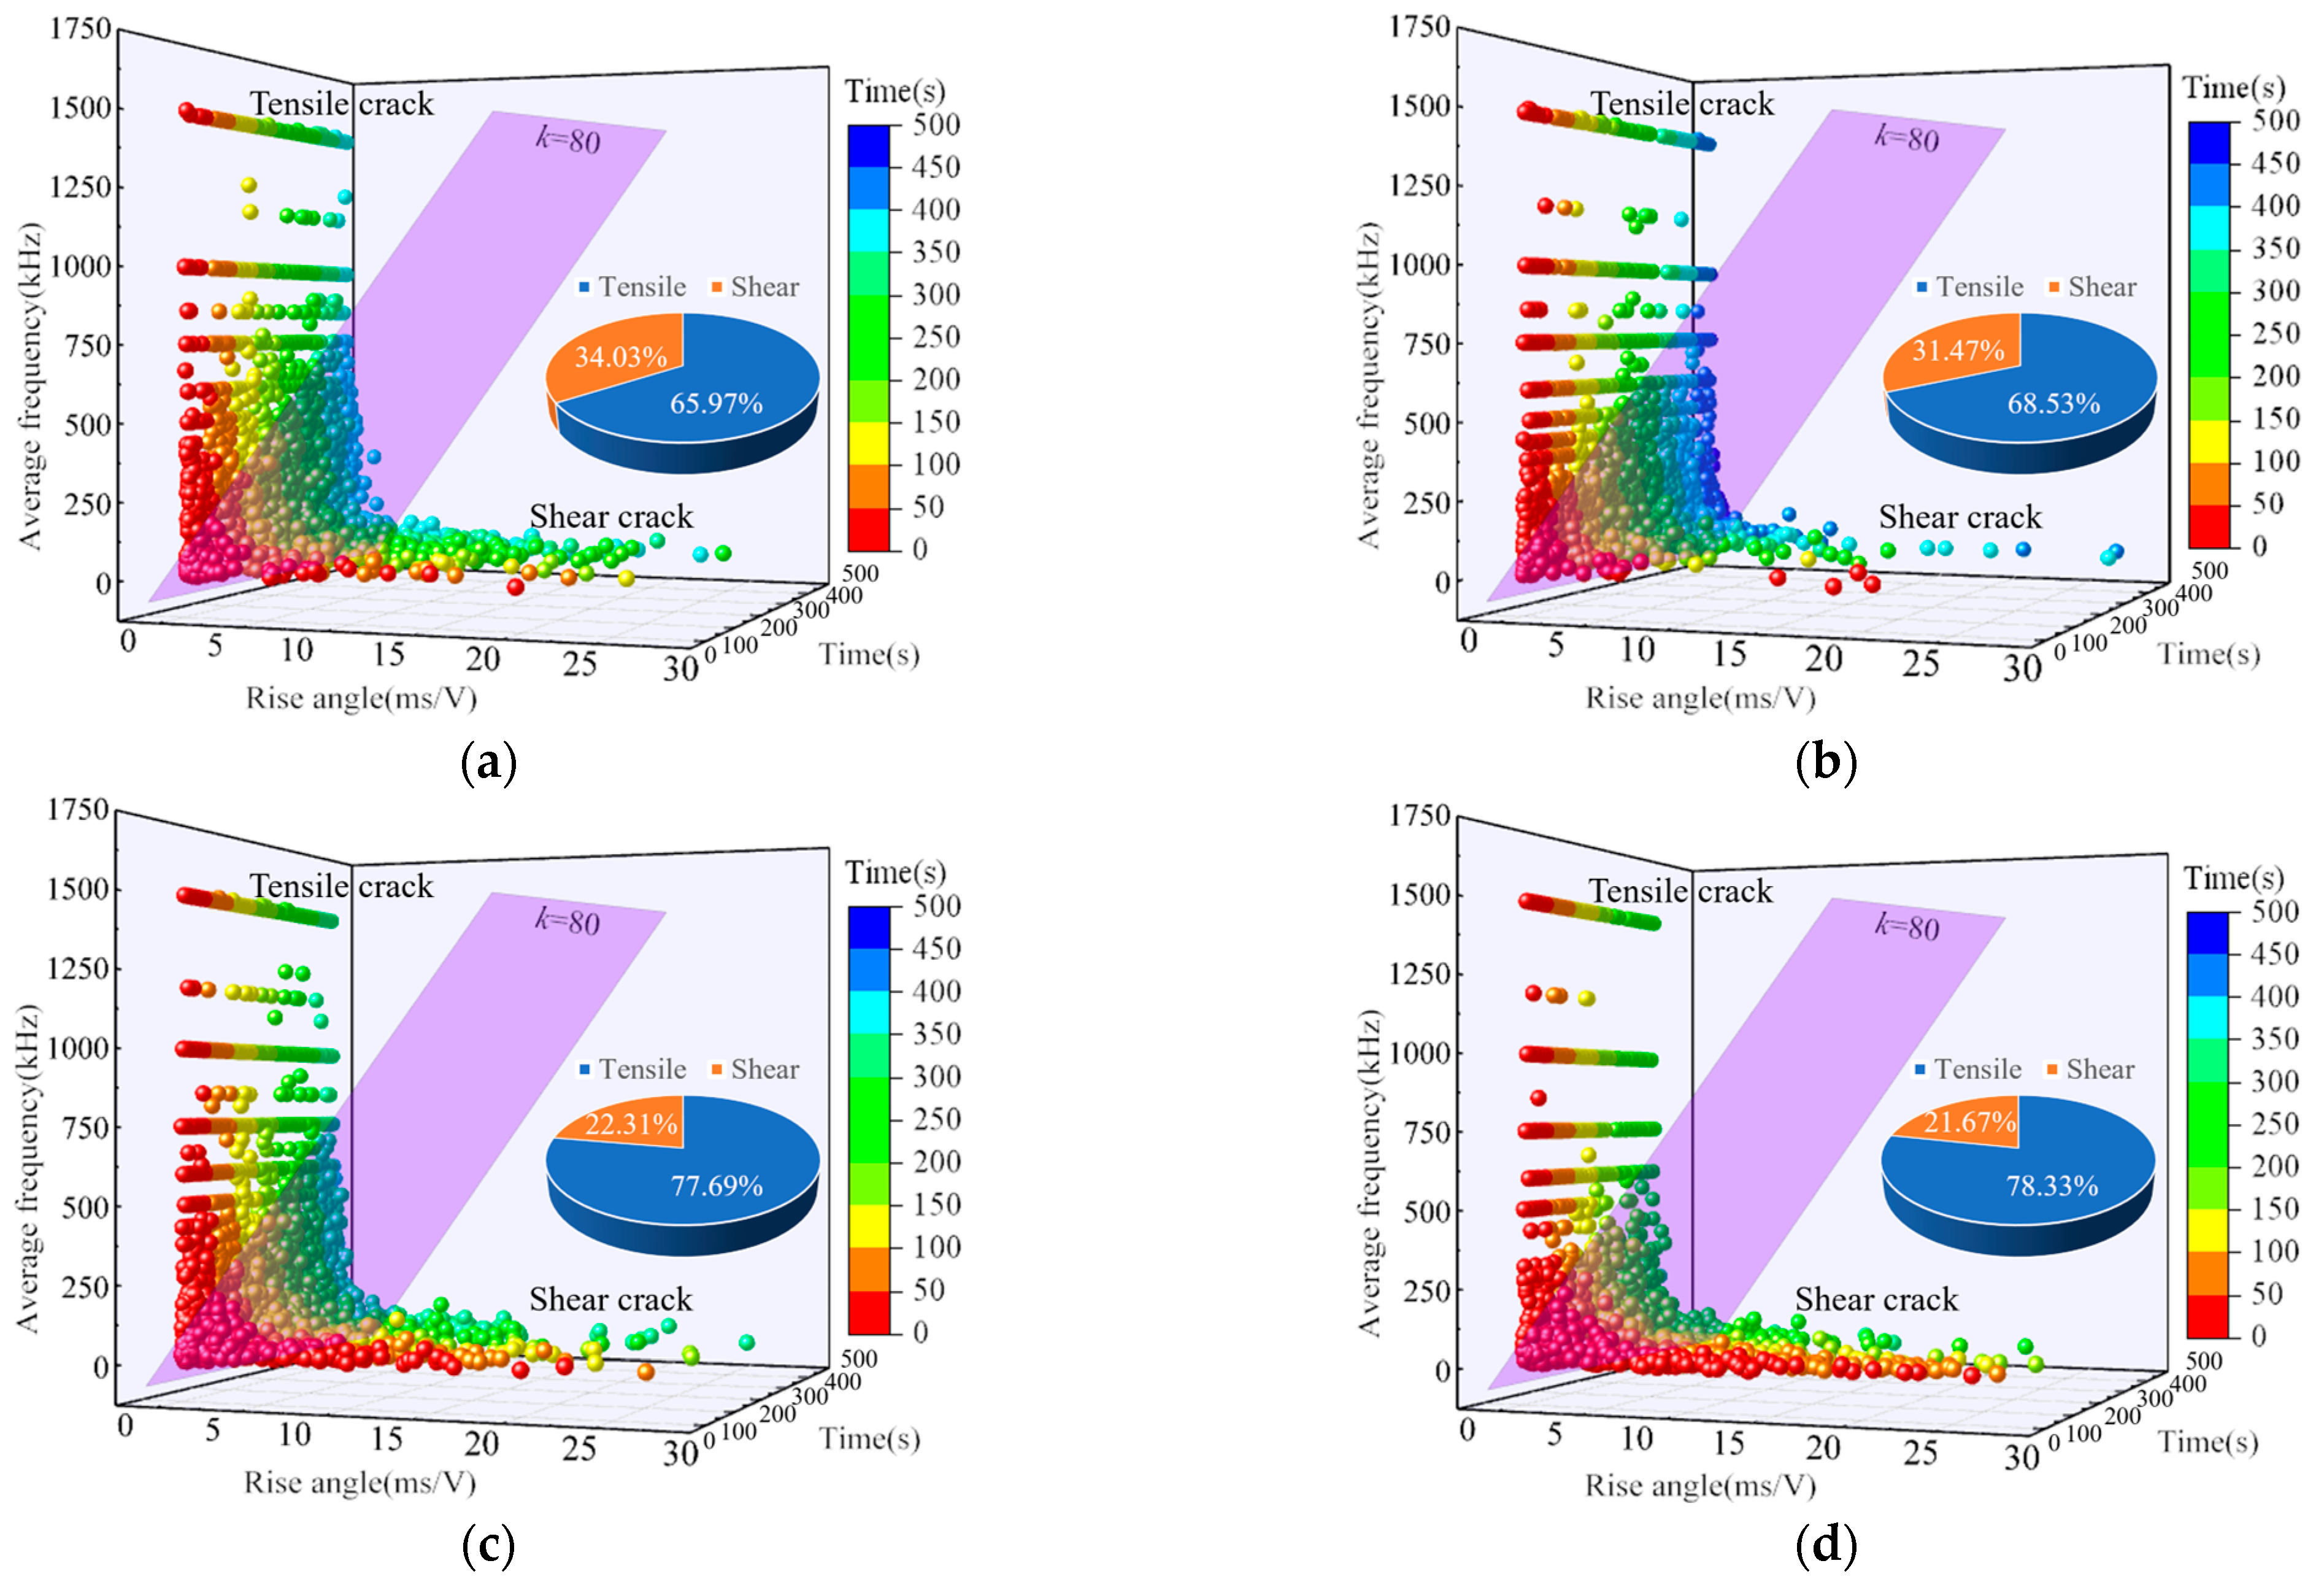
In the recommended standards by the Japan Concrete Association, the ratio of AF to RA was defined as the k value. Therefore, it was considered that AE events with AF/RA > k corresponded to tensile cracks, while AE events with AF/RA < k corresponded to shear cracks [36]. Based on the studies conducted by Ohno et al. [37], Aldahdooh et al. [38], and other scholars, a k value of 80 was chosen as the classification threshold for crack types. This threshold yielded highly accurate results, approaching the discriminative results obtained from the moment tensor method [39,40]. Therefore, this study was based on a k value of 80 to analyze the crack mechanisms of the CPB.
In the case of a curing temperature of 60 °C and a curing time of 7 days, three-dimensional AF–RA–time relationships were constructed, as illustrated in Figure 17 and Figure 18. It can be observed that the crack process under different curing conditions was characterized by a mixed mode of tensile and shear cracks, with tensile cracks being dominant and shear cracks being secondary, consistent with the analysis mentioned above. From the initial compression stage, shear and tensile cracks coexisted within the timeframe. However, due to the limited damage generated during the initial stage, shear cracks accounted for a relatively larger proportion. As the compression time increased, tensile cracks rapidly accumulated. In the figure, it could be observed that data points were densely clustered near the z-axis, indicating extensive accumulation of tensile cracks, while sporadic occurrences and growth were observed along the x-axis. Tensile cracks gradually became the predominant crack mode as the loading proceeded.
The maintenance curing temperature was kept constant at 60 °C. With increased curing time, the proportion of shear cracks gradually decreased while the proportion of tensile cracks increased. Similarly, with a fixed curing time of 7 days, an increase in the curing temperature led to a gradual decrease in the proportion of shear cracks and an increase in the proportion of tensile cracks. This indicates that both increasing the curing time and raising the curing temperature can promote the transition from shear cracks to tensile cracks.
The data for tensile and shear cracks were analyzed statistically to conduct a damage analysis of the crack characteristics. The shear cracks ratio was used as the basis for analysis. A diagram illustrating the shear cracks ratio at different curing temperatures is presented in Figure 19. At a curing time of 3 d, the shear cracks ratios decreased with increasing axial stress under different curing temperatures. During the initial compaction stage, when the curing temperature was 20 °C, the shear cracks ratio accounted for 71.62%. However, when the curing temperature increased to 60 °C, the shear cracks ratio decreased to 33.49%. The main reason for this was that the elevated curing temperature accelerated the hydration reaction within the CPB, leading to the formation of stable hydration products that required significantly higher force for shear cracks compared to tensile cracks. Consequently, the ratio of tensile cracks gradually increased. After the CPB experienced the ultimate cracks, the shear cracks proportion decreased to 37.10% at a curing temperature of 20 °C and 15.92% at a curing temperature of 60 °C. Ultimately, a composite cracks form dominated by tensile cracks was formed.
At a curing time of 7 d, the shear failure ratios decreased with increasing curing temperature, following a similar trend observed at a curing time of 3 d. The difference lies in response to increasing axial stress, where the shear failure ratio showed a slowly increasing trend. After failure, the shear failure ratios were 34.03% for the curing temperature at 20 °C and 16.67% for the curing temperature at 60 °C. Ultimately, the dominant failure mode remained a composite form primarily characterized by tensile failure. Similar trends in the shear failure ratios were observed at a curing time of 14 d and 28 d, resembling those at a curing time of 3 d.
The CPB exhibited a combined crack mode of tension and shear. As the curing temperature increased, the influence of tensile crack became more significant. At a curing temperature of 20 °C, shear cracks predominantly occurred in the early stages under pressure, while the proportion of shear cracks gradually decreased with increasing pressure. However, at a curing temperature of 60 °C, the CPB predominantly experienced tensile cracks with a mixed mode of tension and shear from the beginning of compression.
3.3. Analysis of Hydration Products
3.3.1. Compressional Wave Velocity
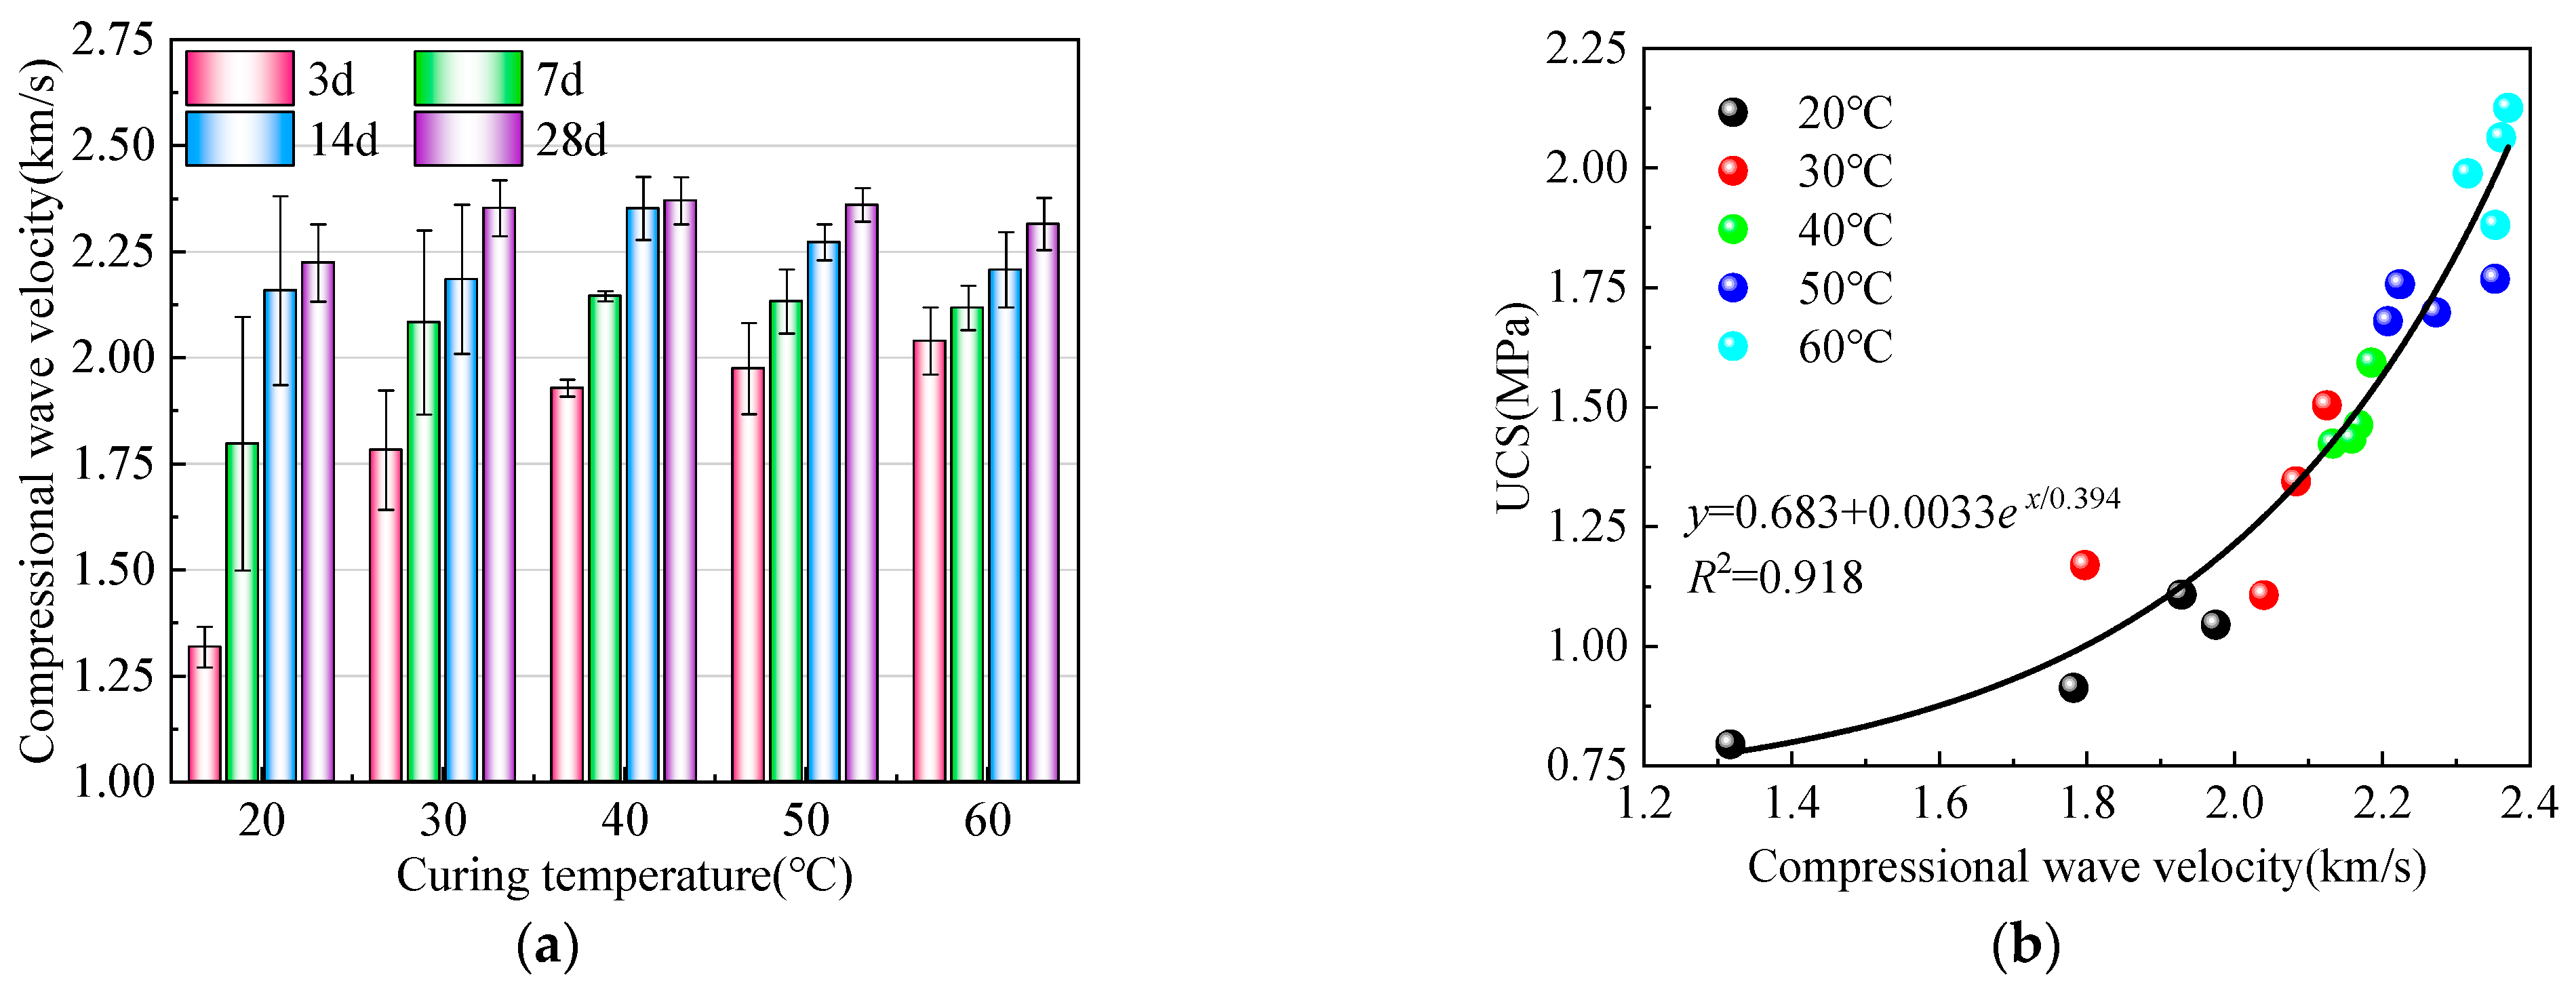
The experimental results are shown in Figure 20. We obtained the variations of compressional wave velocity under different curing conditions. The compressional wave velocity of the CPB followed a similar trend to its strength. The compressional wave velocity increases with the increase in the curing time. Additionally, it exhibits a pattern of initially increasing and then decreasing with increased curing temperature. For example, at a curing temperature of 20 °C, the compressional wave velocity increases from 1.32 km/s to 2.16 km/s with increasing curing time. At a curing time of 28 d, the compressional wave velocity at curing temperatures ranging from 20 °C to 60 °C was as follows: 2.16 km/s, 2.18 km/s, 2.35 km/s, 2.27 km/s, and 2.21 km/s.
The main reason was that as the curing time increased, the degree of hydration reaction inside the CPB deepened. A sufficient hydration reaction resulted in denser hydration products, which enhanced the strength and reduced the internal porosity and permeability. As a result, the compressional wave velocity increased. With the increase in curing temperature, the hydration reaction rate accelerated. A higher reaction rate promoted the complete formation of hydration products, thus improving the overall strength. However, when the hydration reaction rate became too fast, the particles within the cementitious material may not have had enough time to react and became encapsulated by rapidly formed hydration products, impeding further reaction development. As a result, there was a phenomenon where the compressional wave velocity decreased at higher temperatures.
Figure 20a shows that as the curing temperature increased, the difference in compressional wave velocity among different curing times (from 3 d to 28 d) gradually decreased. For instance, at a curing temperature of 20 °C, the increase in porosity was 0.84 km/s. At 40 °C it was 0.42 km/s, and at 60 °C it was 0.17 km/s. This finding further confirmed that the hydration reaction rate accelerated with increased curing temperature. Under normal temperature conditions, the strength exhibited a prolonged and continuous growth trend, increasing compressional wave velocity. Conversely, under high-temperature conditions, the early strength experienced significant improvement. At the same time, the growth rate became slower in the later stages, leading to a gradual increase in compressional wave velocity.
The compressional wave velocity reflected the internal structural state and established an effective correspondence with the macroscopic strength. Therefore, the correspondence between the compressional wave velocity and the UCS was considered, and a mathematical regression relationship was established, as shown in Figure 20b. It could be observed that an excellent exponential fitting relationship existed between the compressional wave velocity and the UCS. The correlation coefficient reached 0.918. A strong positive correlation between the two variables indicated that the strength also increased as the compressional wave velocity increased.
3.3.2. Porosity Characteristics
Pore characteristics are an important component of the microstructure of the CPB, and they play a significant role in determining the properties, such as strength and permeability. Analyzing the correlation between the distribution of microscopic pores and macroscopic strength can give a more comprehensive understanding of the mechanisms underlying the variations.
The analysis of the microstructure considering pore characteristics involves categorizing pore structures into four levels based on pore size: non-damaging pores (<20 nm), less-damaging pores (20–50 nm), damaging pores (50–200 nm), and multi-damaging pores (>200 nm) [41,42]. Based on the low-field NMR tests, the pore size distribution of CPB under different curing conditions is depicted in Figure 21. It was observed that with the increase in curing time, the pore distribution curve gradually shifted to the right, and the curve width decreased. The porosity showed a decreasing trend. Taking the curing temperature of 20 °C as an example, the porosity was 23.98% at a curing time of 3 d, and it decreased to 18.20% when the curing time increased to 28 d. The main reason for this was the sufficient development of hydration reactions, which enhanced the compactness between hydration products and reduced the overall porosity.
With the increase in curing temperature, the pore distribution curve also shifted to the right, and the porosity decreased and then increased. Taking a curing time of 3 d as an example, the porosity at curing temperatures of 20 °C, 30 °C, 40 °C, 50 °C, and 60 °C was 23.98%, 20.94%, 19.47%, 20.88%, and 21.12%, respectively. This was because the higher temperature accelerated the hydration reaction rate, forming hydration products that filled the voids between aggregate particles, thus reducing the inter-particle pore structure. However, excessively high temperatures reduced the degree of hydration reaction, resulting in a counterproductive effect and weakening the strength by hindering the complete formation of hydration products.
Based on the pore distribution graph, the pore characteristics under different curing conditions were divided into different pore types for analysis, as shown in Figure 22. The presence of damaging pores and multi-damaging pores was the main reason for the weakening of strength. The development of multi-damaging pores follows a similar pattern at different curing times. Among the different curing temperatures, the proportion of multi-damaging pores was the lowest at 40 °C, indicating that at 40 °C, the hydration reaction could progress more fully. This led to the generation of hydration products that effectively filled the voids between the tailings particles, resulting in more structure. The decrease in multi-damaging pores had a positive effect on improving the overall strength.
3.3.3. Microscopic Structure
An analysis of the hydration process was conducted to accurately describe the microstructure of the CPB. SEM analysis was performed to obtain the micrographs under different curing conditions, as shown in Figure 23. Specimens at different curing temperatures and curing times of 3 d and 14 d were selected for analysis. The chosen magnification for the SEM images was 5000 times.
In different curing times, as the curing time increased, the microstructure became denser, and the cohesion between hydration products became more compact. At a curing time of 3 d, the flocculent C-S-H gel produced by the hydration reaction exhibited localized distribution, primarily adhering to the surface of tailings particles. A small amount of flaky Ca(OH)2 and acicular ettringite were formed, and the connectivity between hydration products was poor, resulting in numerous internal pores within the CPB. However, as the curing time increased to 14 d, the degree of hydration reaction deepened. The formation of C-S-H gel, Ca(OH)2, and ettringite increased, enhancing the connectivity within the CPB. The C-S-H gel effectively encapsulated the tailings particles, and the arrangement of ettringite and gel became intricate and complex. This arrangement of hydration products established a more integrated connectivity within the CPB, and the pores between particles were filled, gradually reducing pore volume and further increasing the overall strength. The increase in curing time significantly influenced the degree of hydration reaction and the improvement of macroscopic mechanical strength.
Observing at the same curing time, the hydration reaction rate gradually accelerated as the curing temperature increased, and the complexity of hydration product formation increased. Taking a curing time of 3 d as an example, at a curing temperature of 20 °C, the hydration products were mainly flocculent C-S-H gel, and the amount of generated hydration products was relatively low, resulting in larger inter-particle pores. However, as the curing temperature increased, the amount of C-S-H gel gradually increased, accompanied by an increase in Ca(OH)2 and ettringite formation. This led to an increase in the compactness of the microstructure and a decrease in pore volume. At a curing temperature of 50 °C, the content of acicular ettringite increased, and the distribution of pores increased compared to 40 °C. In the microscopic image, tailings particles could still be observed, indicating that some regions had not produced C-S-H gel. The main reason for this phenomenon was that the rapid hydration rate decreased the hydration degree. Some cementitious materials were surrounded by rapidly formed hydration products, preventing further hydration reactions. The excessively high hydration rate reduced the microstructure’s compactness, thereby affecting the strength increase at the macroscopic level.
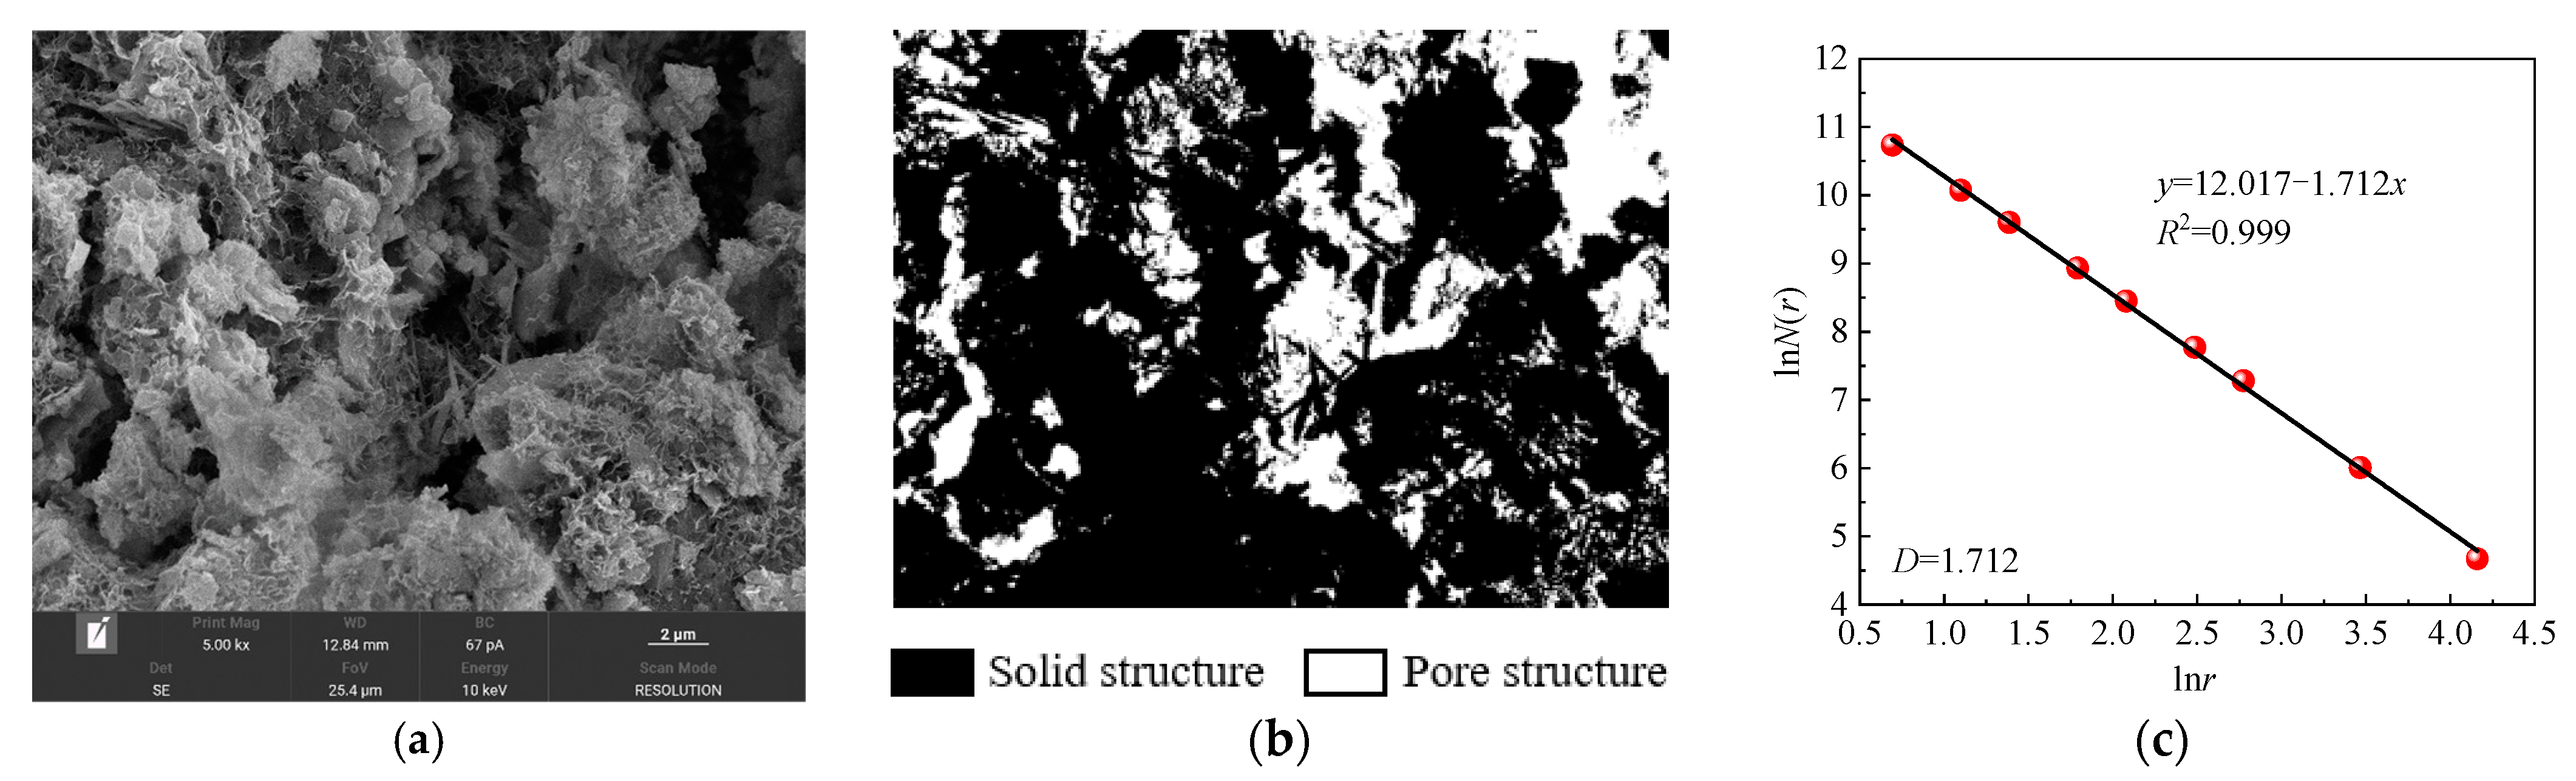
To further accurately reveal the changing characteristics of the microscopic structure, the SEM original images were subjected to binarization processing, and fractal theory was employed for quantitative characterization of the pore microstructure [43,44]. Fractal theory, established and developed by Mandelbrot, was a discipline that studies irregular phenomena in nature and their inherent laws. There are various methods for representing fractal dimensions, with the most widely used being self-similarity fractals.
where r represents the side length of the square; N(r) represents the number of grid cells for a square with side length r; F(r) represents any non-empty bounded subset; D represents the fractal dimension. The most commonly used method for calculating fractal dimension is the box-counting method. The main idea is to cover the study area with equal-sized small squares with an r length. By counting the number of squares N(r) where the pores intersect, we can change the size of the squares. Finally, a plot is made in the ln(r)—ln(N(r)) coordinate system, and the slope is determined using the least squares method. The absolute value of the slope represents the fractal dimension D. Taking the curing condition of 40 °C—3 d as an example, the calculation process for the fractal dimension of pore distribution is shown in Figure 24. It was observed that the correlation coefficient of the fitted curve was 0.999, indicating that the pore distribution under this condition exhibited significant fractal characteristics.
The pore fractal dimensions of the CPB under different curing conditions were calculated, and the results are shown in Table 2. It can be observed that the pore fractal dimensions ranged from 1.5 to 1.9. With an increase in curing time, the pore fractal dimensions gradually decreased. Similarly, with increased curing temperature, the pore fractal dimensions exhibited a decreasing trend followed by an increasing trend. The minimum pore fractal dimension was observed at a curing temperature of 40 °C.
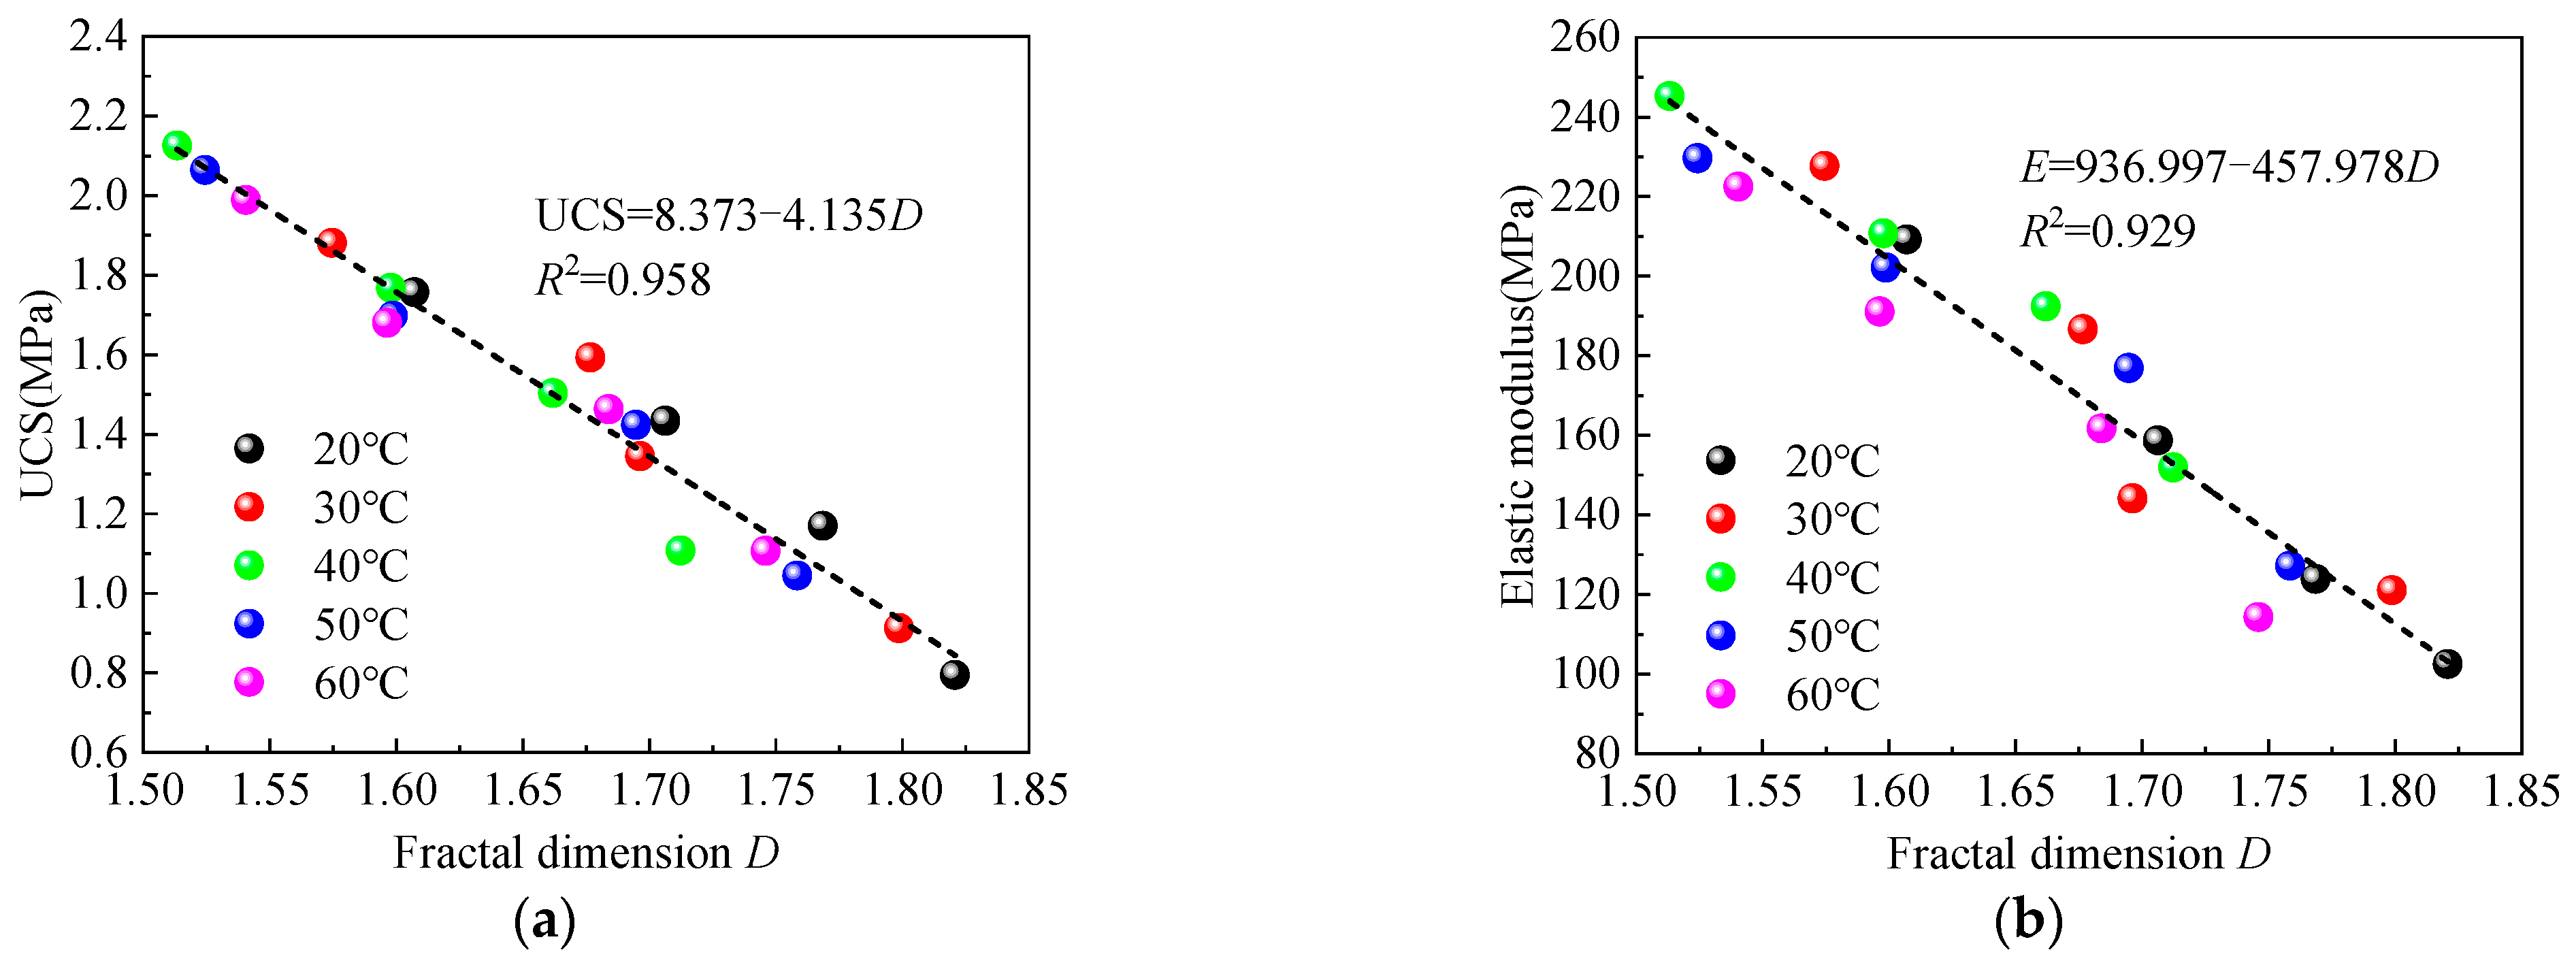
The pore fractal dimension reflected the microstructural changes of the CPB and was considered the main factor explaining its macroscopic mechanical characteristics. By considering the macro–micro characteristics, a fitting relationship was constructed between the mechanical parameters and the pore fractal dimension, as shown in Figure 25. The pore fractal dimension was found to have a good linear correlation with the UCS and elastic modulus. When the pore fractal dimension decreased, it indicated a higher level of micro-compactness, more thorough filling between the pores, and a higher degree of completion of the hydration reaction. This resulted in a reduction in porosity and an improvement in the macroscopic mechanical parameters. Conversely, when the pore fractal dimension increased, it indicated the presence of more internal pores, and the formation of a stable, dense structure between the hydration products was incomplete. As a result, the overall mechanical parameters were decreased. This conclusion aligned with the evolutionary pattern of pore characteristics. Therefore, the pore fractal dimension effectively characterized the macroscopic mechanical properties of the CPB.
3.4. Macro–Microscopic Response Mechanism
Considering the interrelationship between the macro and micro aspects of the CPB under various curing conditions, we examined the response of macroscopic, AE, and microscopic parameters at a curing time of 7 d. This analysis was conducted for different curing temperatures, as depicted in Figure 26.
According to the overall characteristics of the CPB, it could be divided into two stages to analyze the influence of curing temperature. The first stage was when the curing temperature was below 40 °C. As the curing temperature increased, the dissolution rate of cement particles increased, accelerating the hydration reaction rate. Sufficient reaction time it was allowed water to fully and completely dissolve cement particles, resulting in the formation of hydration products such as C-S-H gel, Ca(OH)2, and ettringite, which filled the gaps between the tailings particles and formed the overall framework of the CPB. With an improvement in the overall compactness, the amount of C-S-H gel generated increased, and the arrangement of microstructures became more intricate, gradually reducing the internal porosity and the proportion of multi-damaging pores in the CPB. This led to an increase in the measured compressional wave velocity.
Additionally, as the curing temperature increased, the hydration reaction became more thorough, leading to enhanced self-desiccation properties. Consequently, a transition from ductility to brittleness occurred. The number of AE signals detected during the compression process gradually increased, indicating a more significant influence of tensile crack on the CPB. The changes in micro-level hydration reactions resulted in a gradual increase in uniaxial compressive strength and elastic modulus at the macroscopic level.
The second stage was when the curing temperature exceeded 40 °C. Further increasing the curing temperature would have further accelerated the hydration reaction rate. However, when the dissolution rate of cement particles became excessively high, the cement particles may not have had enough time to come into contact with water before being covered by hydration products. This would have resulted in the formation of a dense gel that hindered the progress of hydration reactions and reduced the overall generation of hydration products. The rapid hydration reactions would have caused poorer filling quality of hydration products between the tailings particles. This could have been observed in microscopic electron microscope images, where some tailings particles were exposed on the surface without forming a cohesive framework with hydration products. This phenomenon would have increased the overall porosity and the proportion of multi-damaging pores in the CPB, thereby reducing the measured compressional wave velocity and weakening the UCS and elastic modulus at the macroscopic level. Similar to the first stage, with the increase in temperature, the self-drying property of the CPB would have been enhanced, and the overall tendency towards tensile crack would have increased.
4. Conclusions
This study conducted a comprehensive analysis of the mechanical failure characteristics and hydration mechanism of CPB under various curing conditions through macroscopic mechanical experiments, AE monitoring experiments, and microscopic experiments. Based on the experimental findings, the following key conclusions have been drawn:
- (1)
- The UCS and elastic modulus significantly correlate with the curing time, exhibiting an exponential growth pattern represented by the function y = aebx + c. As the curing time increases, the mechanical parameters show a positive and proportional increase. Similarly, the impact of curing temperature follows a polynomial function, described by the equation y = ax2 + bx + c. Notably, the mechanical properties peak at a curing temperature of 40 °C.
- (2)
- In the uniaxial compression test, increased curing time and curing temperature facilitated the transition of shear cracks to tensile cracks. The predominant crack mode observed was a combination of tension and shear. With the increase in curing temperature, the impact of the tensile cracks became more pronounced.
- (3)
- The fractal dimension of the pores exhibited a strong linear correlation with the UCS and elastic modulus. When the pore fractal dimension decreases, it indicates that the microscopic compactness is stronger and the porosity is reduced, so the mechanical parameters are improved. The fractal dimension of the pores provided a reliable representation of the macroscopic mechanical properties.
- (4)
- Dividing the analysis into two stages based on a curing temperature of 40 °C, the first stage shows that an increase in curing temperature effectively enhances the compactness, improving the mechanical parameters. In the second stage, the excessively high rate of hydration reaction results in a deterioration of the filling quality of hydration products between the tailings particles, causing a weakening effect on the mechanical parameters.
Author Contributions
C.Z.: Investigation, Formal analysis, Validation, Writing—original draft. A.T.: Supervision, Writing—review and editing. C.D.: Supervision, Writing—review and editing. W.X.: Investigation, Formal analysis, Writing—review and editing. Y.T.: Investigation, Writing—review and editing. All authors have read and agreed to the published version of the manuscript.
Funding
This study was financially supported by the National Natural Science Foundation of China (No. 52274110 and No. 52274109), and China Scholarship Council (No. CSC202206460042).
Data Availability Statement
Data are contained within the article.
Acknowledgments
The authors are grateful to the journal editor and the anonymous reviewers for their constructive comments.
Conflicts of Interest
The authors declare that they have no known competing financial interests or personal relationships that could have appeared to influence the work reported in this paper.
References
- Nguyen, N.M.; Pham, D.T. Tendencies of mining technology development in relation to deep mines. Min. Sci. Technol. 2019, 4, 16–22. [Google Scholar] [CrossRef]
- He, Z.Q.; Xie, H.P.; Gao, M.Z.; Chen, L.; Yu, B.; Hu, Y.Q.; Yang, J.P. Design and verification of a deep rock corer with retaining the in situ temperature. Adv. Civ. Eng. 2020, 2020, 8894286. [Google Scholar] [CrossRef]
- Li, P.; Cai, M.F. Challenges and new insights for exploitation of deep underground metal mineral resources. Trans. Nonferrous Met. Soc. China 2021, 31, 3478–3505. [Google Scholar] [CrossRef]
- Cai, M.F.; Li, P.; Tan, W.H.; Ren, F. Key engineering technologies to achieve green, intelligent, and sustainable development of deep metal mines in China. Engineering 2021, 7, 1513–1517. [Google Scholar] [CrossRef]
- Li, J.G.; Zhan, K. Intelligent mining technology for an underground metal mine based on unmanned equipment. Engineering 2018, 4, 381–391. [Google Scholar] [CrossRef]
- Yin, S.H.; Shao, Y.J.; Wu, A.X.; Wang, H.J.; Liu, X.H.; Wang, Y. A systematic review of paste technology in metal mines for cleaner production in China. J. Clean. Prod. 2020, 247, 119590. [Google Scholar] [CrossRef]
- Sasmito, A.P.; Kurnia, J.C.; Birgersson, E.; Mujumdar, A.S. Computational evaluation of thermal management strategies in an underground mine. Appl. Therm. Eng. 2015, 90, 1144–1150. [Google Scholar] [CrossRef]
- Qi, C.C.; Fourie, A. Cemented paste backfill for mineral tailings management: Review and future perspectives. Miner. Eng. 2019, 144, 106025. [Google Scholar] [CrossRef]
- Rankine, R.M.; Sivakugan, N. Geotechnical properties of cemented paste backfill from Cannington Mine, Australia. Geotech. Geol. Eng. 2007, 25, 383–393. [Google Scholar] [CrossRef]
- Zhang, C.; Fu, J.X.; Song, W.D.; Kang, M.C.; Li, T.; Wang, N.W. Analysis on mechanical behavior and failure characteristics of layered cemented paste backfill(LCPB) under triaxial compression. Constr. Build. Mater. 2022, 324, 126631. [Google Scholar] [CrossRef]
- Fall, M.; Pokharel, M. Coupled effects of sulphate and temperature on the strength development of cemented tailings backfills: Portland cement-paste backfill. Cem. Concr. Compos. 2010, 32, 819–828. [Google Scholar] [CrossRef]
- Fall, M.; Samb, S.S. Effect of high temperature on strength and microstructural properties of cemented paste backfill. Fire Saf. J. 2009, 44, 642–651. [Google Scholar] [CrossRef]
- Zhang, C.; Fu, J.X.; Song, W.D.; Du, C.F.; Fu, H.T. High-volume ultrafine fly ash-cement slurry mechanical properties and strength development model establishment. Constr. Build. Mater. 2021, 277, 122350. [Google Scholar] [CrossRef]
- Sari, M.; Yilmaz, E.; Kasap, T. Long-term ageing characteristics of cemented paste backfill: Usability of sand as a partial substitute of hazardous tailings. J. Clean. Prod. 2023, 401, 136723. [Google Scholar] [CrossRef]
- Zhao, Y.; Taheri, A.; Karakus, M.; Deng, A.; Guo, L. The Effect of Curing under Applied Stress on the Mechanical Performance of Cement Paste Backfill. Minerals 2021, 11, 1107. [Google Scholar] [CrossRef]
- Zhao, Y.; Taheri, A.; Soltani, A.; Karakus, M.; Deng, A. Strength Development and Strain Localization Behavior of Cemented Paste Backfills Using Portland Cement and Fly Ash. Materials 2019, 12, 3282. [Google Scholar] [CrossRef] [PubMed]
- Zhang, J.; Deng, H.; Taheri, A.; Deng, J.; Ke, B. Effects of Superplasticizer on the Hydration, Consistency, and Strength Development of Cemented Paste Backfill. Minerals 2018, 8, 381. [Google Scholar] [CrossRef]
- Cui, L.; Fall, M. Multiphysics modeling and simulation of strength development and distribution in cemented tailings backfill structures. Int. J. Concr. Struct. Mater. 2018, 12, 25. [Google Scholar] [CrossRef]
- Liu, Q.S.; Liu, D.F.; Tian, Y.C.; Liu, X.Y. Numerical simulation of stress-strain behaviour of cemented paste backfill in triaxial compression. Eng. Geol. 2017, 231, 165–175. [Google Scholar] [CrossRef]
- Fall, M.; Célestin, J.C.; Pokharel, M.; Touré, M. A contribution to understanding the effects of curing temperature on the mechanical properties of mine cemented tailings backfill. Eng. Geol. 2010, 114, 397–413. [Google Scholar] [CrossRef]
- Pokharel, M.; Fall, M. Coupled thermochemical effects on the strength development of slag-paste backfill materials. J. Mater. Civ. Eng. 2011, 23, 511–525. [Google Scholar] [CrossRef]
- Bull, A.J.; Fall, M. Curing temperature dependency of the release of arsenic from cemented paste backfill made with Portland cement. J. Environ. Manag. 2020, 269, 110772. [Google Scholar] [CrossRef]
- Han, B.; Zhang, S.Y.; Sun, W. Impact of temperature on the strength development of the tailing-waste rock backfill of a gold mine. Adv. Civ. Eng. 2019, 2019, 4379606. [Google Scholar] [CrossRef]
- Wu, A.X.; Wang, Y.; Zhou, B.; Shen, J. Effect of initial backfill temperature on the deformation behavior of early age cemented paste backfill that contains sodium silicate. Adv. Mater. Sci. Eng. 2016, 2016, 8481090. [Google Scholar] [CrossRef]
- Chen, S.M.; Wu, A.X.; Wang, Y.M.; Wang, W. Coupled effects of curing stress and curing temperature on mechanical and physical properties of cemented paste backfill. Constr. Build. Mater. 2021, 273, 121746. [Google Scholar] [CrossRef]
- Chen, S.M.; Yilmaz, E.; Xiang, Z.G.; Wang, Y.M. Curing conditions effect on pore structure, compressive strength and elastic modulus of cementitious tailings backfills. Powder Technol. 2023, 422, 118458. [Google Scholar] [CrossRef]
- Xu, W.B.; Li, Q.L.; Zhang, Y.L. Influence of temperature on compressive strength, microstructure properties and failure pattern of fiber-reinforced cemented tailings backfill. Constr. Build. Mater. 2019, 222, 776–785. [Google Scholar] [CrossRef]
- Libos, I.L.S.; Cui, L.; Liu, X.R. Effect of curing temperature on time-dependent shear behavior and properties of polypropylene fiber-reinforced cemented paste backfill. Constr. Build. Mater. 2021, 311, 125302. [Google Scholar] [CrossRef]
- Jia, Z.Q.; Xie, H.P.; Zhang, R.; Li, C.; Wang, M.; Gao, M.; Zhang, Z.; Zhang, Z. Acoustic emission characteristics and damage evolution of coal at different depths under triaxial compression. Rock Mech. Rock Eng. 2020, 53, 2063–2076. [Google Scholar] [CrossRef]
- Li, Q.G.; Qian, Y.N.; Hu, Q.T.; Jiang, Z.Z.; Xu, Y.C.; Shang, X.Y.; Ling, F.P.; Liu, R.H.; Li, W.X. Acoustic emission response mechanism of hydraulic fracturing in different coal and rock: A laboratory study. Rock Mech. Rock Eng. 2022, 55, 4657–4672. [Google Scholar] [CrossRef]
- Xue, G.L.; Yilmaz, E. Strength, acoustic, and fractal behavior of fiber reinforced cemented tailings backfill subjected to triaxial compression loads. Constr. Build. Mater. 2022, 338, 127667. [Google Scholar] [CrossRef]
- Xue, G.L.; Yilmaz, E.; Song, W.D.; Cao, S. Fiber length effect on strength properties of polypropylene fiber reinforced cemented tailings backfill specimens with different sizes. Constr. Build. Mater. 2020, 241, 118113. [Google Scholar] [CrossRef]
- Zhou, Y.; Yin, S.H.; Zhao, K.; Wang, L.; Liu, L. Understanding the static rate dependence of early fracture behavior of cemented paste backfill using digital image correlation and acoustic emission techniques. Eng. Fract. Mech. 2023, 283, 109209. [Google Scholar] [CrossRef]
- Wang, J.; Fu, J.X.; Song, W.D.; Zhang, Y.F. Mechanical properties, damage evolution, and constitutive model of rock-encased backfill under uniaxial compression. Constr. Build. Mater. 2021, 285, 122898. [Google Scholar] [CrossRef]
- Wang, J.; Fu, J.X.; Song, W.D.; Zhang, Y.F.; Wang, Y. Mechanical behavior, acoustic emission properties and damage evolution of cemented paste backfill considering structural feature. Constr. Build. Mater. 2020, 261, 119958. [Google Scholar] [CrossRef]
- JCMS-III B5706; Monitoring Method for Active Cracks in Concrete by Acoustic Emission. Federation of Construction Material Industries: Tokyo, Japan, 2003.
- Ohno, K.; Ohtsu, M. Crack classification in concrete based on acoustic emission. Constr. Build. Mater. 2010, 24, 2339–2346. [Google Scholar] [CrossRef]
- Aldahdooh, M.A.A.; Bunnori, N.M. Crack classification in reinforced concrete beams with varying thicknesses by mean of acoustic emission signal features. Constr. Build. Mater. 2013, 45, 282–288. [Google Scholar] [CrossRef]
- Soulioti, D.; Barkoula, N.M.; Paipetis, A.; Matikas, T.E.; Shiotani, T.; Aggelis, D.G. Acoustic emission behavior of steel fibre reinforced concrete under bending. Constr. Build. Mater. 2009, 23, 3532–3536. [Google Scholar] [CrossRef]
- Ohtsu, M. Simplified moment tensor analysis and unified decomposition of acoustic emission source: Application to in situ hydrofracturing test. J. Geophys. Res. Solid Earth 1991, 96, 6211–6221. [Google Scholar] [CrossRef]
- Liu, L.; Fang, Z.Y.; Qi, C.C.; Zhang, B.; Guo, L.; Song, K.I. Experimental investigation on the relationship between pore characteristics and unconfined compressive strength of cemented paste backfill. Constr. Build. Mater. 2018, 179, 254–264. [Google Scholar] [CrossRef]
- Saedi, A.; Jamshidi-Zanjani, A.; Mohseni, M.; Darban, A.K.; Nejati, H. Mechanical activation of lead-zinc mine tailings as a substitution for cement in concrete construction. Constr. Build. Mater. 2023, 364, 129973. [Google Scholar] [CrossRef]
- Zhao, K.; Yu, X.; Zhu, S.T.; Yan, Y.; Zhou, Y.; He, Z.; Song, Y.; Huang, M. Acoustic emission fractal characteristics and mechanical damage mechanism of cemented paste backfill prepared with tantalum niobium mine tailings. Constr. Build. Mater. 2020, 258, 119720. [Google Scholar] [CrossRef]
- Wang, J.; Zhang, C.; Fu, J.X.; Song, W.; Zhang, Y. Effect of water saturation on mechanical characteristics and damage behavior of cemented paste backfill. J. Mater. Res. Technol. 2021, 15, 6624–6639. [Google Scholar] [CrossRef]
Figure 1.
Particle size distribution characteristics of materials: (a) tailings; and (b) cement.

Figure 2.
XRD analysis spectra and SEM microstructures of the material: (a) tailings; and (b) cement.
Figure 2.
XRD analysis spectra and SEM microstructures of the material: (a) tailings; and (b) cement.

Figure 3.
Experimental hydraulic press and AE equipment schematic diagram: (a) YAW-600 hydraulic press; and (b) AE Equipment.
Figure 3.
Experimental hydraulic press and AE equipment schematic diagram: (a) YAW-600 hydraulic press; and (b) AE Equipment.

Figure 4.
The manufacturing process of CPB with different temperature gradients.

Figure 5.
Main experimental equipment: (a) non-metallic ultrasonic testing analyzer; (b) NMR analyzer; and (c) field emission SEM equipment diagram.
Figure 5.
Main experimental equipment: (a) non-metallic ultrasonic testing analyzer; (b) NMR analyzer; and (c) field emission SEM equipment diagram.

Figure 6.
Variation patterns of UCS of specimens: (a) in relation to curing time; and (b) in relation to curing temperature.
Figure 6.
Variation patterns of UCS of specimens: (a) in relation to curing time; and (b) in relation to curing temperature.

Figure 7.
Curing time–curing temperature–UCS relationship.

Figure 8.
Variation patterns of elastic modulus of specimens: (a) in relation to curing time; and (b) in relation to curing temperature.
Figure 8.
Variation patterns of elastic modulus of specimens: (a) in relation to curing time; and (b) in relation to curing temperature.

Figure 9.
Curing time–curing temperature–elastic modulus relationship.

Figure 10.
Relationship between UCS and elastic modulus.

Figure 11.
Stress–strain curves of CPB under different curing conditions: (a) 20 °C; (b) 30 °C; (c) 40 °C; (d) 50 °C; (e) 60 °C; and (f) 28 d.
Figure 11.
Stress–strain curves of CPB under different curing conditions: (a) 20 °C; (b) 30 °C; (c) 40 °C; (d) 50 °C; (e) 60 °C; and (f) 28 d.


Figure 12.
Variation characteristics of ringing count of CPB: (a) 20 °C—7 d; and (b) 60 °C—7 d.

Figure 13.
Accumulated ringing statistics and ringing activities in each stage: (a) curing temperature: 60 °C; and (b) curing time: 7 d.
Figure 13.
Accumulated ringing statistics and ringing activities in each stage: (a) curing temperature: 60 °C; and (b) curing time: 7 d.

Figure 14.
The failure morphology and AE location of the CPB with a curing time of 7 d: (a) 20 °C; (b) 30 °C; (c) 40 °C; (d) 50 °C; and (e) 60 °C.
Figure 14.
The failure morphology and AE location of the CPB with a curing time of 7 d: (a) 20 °C; (b) 30 °C; (c) 40 °C; (d) 50 °C; and (e) 60 °C.

Figure 15.
Temporal and spatial evolution characteristics of AE events in 40 °C—7 d: (a) Stage-I; (b) Stage-II; (c) Stage-III; (d) Stage-IV; (e) Stage-V.
Figure 15.
Temporal and spatial evolution characteristics of AE events in 40 °C—7 d: (a) Stage-I; (b) Stage-II; (c) Stage-III; (d) Stage-IV; (e) Stage-V.

Figure 16.
Temporal and spatial evolution characteristics of AE events in 40 °C—14 d: (a) Stage-I; (b) Stage-II; (c) Stage-III; (d) Stage-IV; and (e) Stage-V.
Figure 16.
Temporal and spatial evolution characteristics of AE events in 40 °C—14 d: (a) Stage-I; (b) Stage-II; (c) Stage-III; (d) Stage-IV; and (e) Stage-V.

Figure 17.
RA-AF-time relationship of CPB at a curing temperature of 60 °C: (a) 60 °C—3 d; (b) 60 °C—7 d; (c) 60 °C—14 d; and (d) 60 °C—28 d.
Figure 17.
RA-AF-time relationship of CPB at a curing temperature of 60 °C: (a) 60 °C—3 d; (b) 60 °C—7 d; (c) 60 °C—14 d; and (d) 60 °C—28 d.


Figure 18.
RA-AF-time relationship of CPB at a curing time of 7 d: (a) 20 °C—7 d; (b) 30 °C—7 d; (c) 40 °C—7 d; and (d) 50 °C—7 d.
Figure 18.
RA-AF-time relationship of CPB at a curing time of 7 d: (a) 20 °C—7 d; (b) 30 °C—7 d; (c) 40 °C—7 d; and (d) 50 °C—7 d.

Figure 19.
Analysis of shear failure ratio of CPB at different curing temperatures: (a) 3 d; (b) 7 d; (c) 14 d; and (d) 28 d.
Figure 19.
Analysis of shear failure ratio of CPB at different curing temperatures: (a) 3 d; (b) 7 d; (c) 14 d; and (d) 28 d.

Figure 20.
Analysis of the variation of compressional wave velocity: (a) curing temperature—compressional wave velocity; and (b) compressional wave velocity—UCS.
Figure 20.
Analysis of the variation of compressional wave velocity: (a) curing temperature—compressional wave velocity; and (b) compressional wave velocity—UCS.

Figure 21.
Inversion analysis of the T2 spectrum of CPB at different curing temperatures: (a) 3 d; (b) 7 d; (c) 14 d; and (d) 28 d.
Figure 21.
Inversion analysis of the T2 spectrum of CPB at different curing temperatures: (a) 3 d; (b) 7 d; (c) 14 d; and (d) 28 d.

Figure 22.
Distribution of pore volume percentage at different curing temperatures: (a) 3 d; (b) 7 d; (c) 14 d; and (d) 28 d.
Figure 22.
Distribution of pore volume percentage at different curing temperatures: (a) 3 d; (b) 7 d; (c) 14 d; and (d) 28 d.

Figure 23.
SEM analysis images: (a) curing time 3 d; and (b) curing time 14 d.

Figure 24.
Calculation of fractal dimension of pores in SEM image of 40 °C-3 d CPB: (a) SEM original image; (b) binarized image; (c) fractal dimension calculation.
Figure 24.
Calculation of fractal dimension of pores in SEM image of 40 °C-3 d CPB: (a) SEM original image; (b) binarized image; (c) fractal dimension calculation.

Figure 25.
The fitting relationship between the mechanical parameters of the CPB and the fractal dimension: (a) UCS and the fractal dimension; (b) elastic modulus and the fractal dimension.
Figure 25.
The fitting relationship between the mechanical parameters of the CPB and the fractal dimension: (a) UCS and the fractal dimension; (b) elastic modulus and the fractal dimension.

Figure 26.
Macroscopic-AE-microscopic parameter response analysis of CPB (curing time 7 d).


Table 1.
Chemical composition analysis of materials (%).
| Material | SiO2 | Al2O3 | K2O | CaO | Fe2O3 | Na2O | TiO2 | MgO | SO3 | Others |
|---|---|---|---|---|---|---|---|---|---|---|
| Tailings | 71.16 | 13.40 | 5.54 | 3.70 | 2.04 | 1.94 | 0.59 | 0.55 | 0.26 | 0.82 |
| Cement | 22.40 | 4.52 | 0.44 | 64.90 | 3.21 | 0.03 | 0.56 | 1.08 | 1.82 | 1.04 |
Table 2.
Summary table of pore fractal dimension results.
| Curing Time | 3 d | 7 d | 14 d | 28 d |
|---|---|---|---|---|
| 20 °C | 1.821 | 1.769 | 1.706 | 1.607 |
| 30 °C | 1.799 | 1.696 | 1.677 | 1.575 |
| 40 °C | 1.712 | 1.662 | 1.598 | 1.513 |
| 50 °C | 1.758 | 1.695 | 1.599 | 1.524 |
| 60 °C | 1.746 | 1.684 | 1.596 | 1.540 |
Disclaimer/Publisher’s Note: The statements, opinions and data contained in all publications are solely those of the individual author(s) and contributor(s) and not of MDPI and/or the editor(s). MDPI and/or the editor(s) disclaim responsibility for any injury to people or property resulting from any ideas, methods, instructions or products referred to in the content. |
© 2024 by the authors. Licensee MDPI, Basel, Switzerland. This article is an open access article distributed under the terms and conditions of the Creative Commons Attribution (CC BY) license (https://creativecommons.org/licenses/by/4.0/).
Share and Cite
MDPI and ACS Style
Zhang, C.; Taheri, A.; Du, C.; Xia, W.; Tan, Y. Mechanical Characteristics and Macro–Microscopic Response Mechanisms of Cemented Paste Backfill under Different Curing Temperatures. Minerals 2024, 14, 433. https://doi.org/10.3390/min14040433
AMA Style
Zhang C, Taheri A, Du C, Xia W, Tan Y. Mechanical Characteristics and Macro–Microscopic Response Mechanisms of Cemented Paste Backfill under Different Curing Temperatures. Minerals. 2024; 14(4):433. https://doi.org/10.3390/min14040433
Chicago/Turabian StyleZhang, Chao, Abbas Taheri, Cuifeng Du, Wenhao Xia, and Yuye Tan. 2024. "Mechanical Characteristics and Macro–Microscopic Response Mechanisms of Cemented Paste Backfill under Different Curing Temperatures" Minerals 14, no. 4: 433. https://doi.org/10.3390/min14040433
Note that from the first issue of 2016, this journal uses article numbers instead of page numbers. See further details here.