
Mantle Sources and Geochemical Evolution of the Picture Gorge Basalt, Columbia River Basalt Group

1
College of Earth, Ocean, and Atmospheric Sciences, Oregon State University, Corvallis, OR 97331, USA
2
Department of Geology, Portland State University, P.O. Box 751, Portland, OR 97207, USA
3
Earth and Planets Laboratory, Carnegie Institution for Science, 5241 Broad Branch Road NW, Washington, DC 20015, USA
4
Department of Geological Sciences, University of Oregon, Eugene, OR 97403, USA
*
Author to whom correspondence should be addressed.
Minerals 2024, 14(5), 440; https://doi.org/10.3390/min14050440
Submission received: 6 November 2023
/
Revised: 20 March 2024
/
Accepted: 25 March 2024
/
Published: 23 April 2024
(This article belongs to the Special Issue Large Igneous Provinces: Research Frontiers)
Abstract
:The Columbia River Basalt Group (CRBG) is the youngest continental flood basalt province, proposed to be sourced from the deep-seated plume that currently resides underneath Yellowstone National Park. If so, the earliest erupted basalts from this province, such as those in the Picture Gorge Basalt (PGB), aid in understanding and modeling plume impingement and the subsequent evolution of basaltic volcanism. Using geochemical and isotopic data, this study explores potential mantle sources and magma evolution of the PGB. Long known geochemical signatures of the PGB include overall large ion lithophile element (LILE) enrichment and relative depletion of high field strength elements (HFSE) typical of other CRBG main-phase units. Basaltic samples of the PGB have 87Sr/86Sr ratios on the low end of the range displayed by other CRBG lavas and mantle-like δ18O values. The relatively strong enrichment of LILE and depletion of HFSE coupled with depleted isotopic signatures suggest a metasomatized upper mantle as the most likely magmatic source for the PGB. Previous geochemical modeling of the PGB utilized the composition of two high-MgO primitive dikes exposed in the northern portion of the Monument Dike swarm as parental melt. However, fractionation of these dike compositions cannot generate the compositional variability illustrated by basaltic lavas and dikes of the PGB. This study identifies a second potential parental PGB composition best represented by basaltic flows in the extended spatial distribution of the PGB. This composition also better reflects the lowest stratigraphic flows identified in the previously mapped extent of the PGB. Age data reveal that PGB lavas erupted first and throughout eruptions of main-phase CRBG units (Steens, Imnaha, Grande Ronde Basalt). Combining geochemical signals with these age data indicates cyclical patterns in the amounts of contributing mantle components. Eruption of PGB material occurred in two pulses, demonstrated by a ~0.4 Ma temporal gap in reported ages, 16.62 to 16.23 Ma. Coupling ages with observed geochemical signals, including relative elemental abundances of LILE, indicates increased influence of a more primitive, potentially plume-like source with time.
1. Introduction
The Columbia River Basalt Group (CRBG) of the Pacific Northwest, USA, is the world’s youngest and least volumetric flood basalt (Figure 1). The CRBG can be subdivided into four main-phase formations, which include the Steens, Imnaha, Grande Ronde, and Picture Gorge Basalts (PGB) [1,2]. Of these formations, the PGB is the least volumetrically extensive and exhibits geochemical signatures that suggest that it represents a separate magmatic system potentially resulting from lithospheric thinning in a back-arc tectonic setting [3,4,5,6]. The PGB is the earliest main-phase unit of the CRBG [7], followed by the Steens Basalt [8]. Thus, a detailed reexamination of PGB geochemistry and magma petrogenesis provides insight into mantle source components and their temporal and/or spatial boundaries. Examining the spatial, temporal, and geochemical similarities between PGB and other CRBG main-phase units like the Steens Basalt, this study assesses the mantle sources and their respective contributions to the petrogenesis of the PGB.
Through the decades of research on the CRBG flood lavas, numerous origins and source materials have been proposed by many workers to contribute to the geochemical diversity exhibited by the basalts [3,4,5,10,11,12,13,14,15]. These source components include a mantle plume, a subcontinental lithospheric mantle that is variably metasomatized by prior subduction zone processes, and various crustal lithologies within the North American plate. Many workers agree that a mantle plume is ultimately responsible for the CRBG [16] and the Snake River Plain–Yellowstone hotspot track [17] to the east, although different non-plume models have been proposed. Examples of some of these models invoke a rapid increase in back-arc extension caused by steepening of the subducting oceanic plate to the west [18,19], a northward opening tear in the descending slab [20], peeling off of the Farallon plate [13], and a similar model of peeling off of the Farallon plate with the added component of lithospheric foundering at the root of the Wallowa Mountains in northeastern Oregon [12].
1.1. Geochemical Relationships between Main-Phase CRBG Formations
Endmember compositions within main-phase formations of the CRBG reflect the contribution of multiple mantle source components, as interpreted by trace element and isotopic data [3,4,5,10,13,21]. In isotopic space, the Grande Ronde Basalts and Imnaha Basalts define their own trend, while the PGB and the Steens Basalt share other distinct geochemical and isotopic traits [3,5,6,21]. Partial melting processes within the various source regions likely also contribute to some of the observed similarities and differences in trace element contents [21]. The Grande Ronde Basalts form a trend emanating from the Imnaha Basalts in isotopic space and could represent crustally contaminated Imnaha Basalts [3,5,10]. The “endmember” identified within the Imnaha Basalts was originally interpreted as re-enriched mantle, possibly the result of added sediment to a depleted mantle component [3]. This mantle source was defined as “C2” by Carlson (1984) [3] and later named the “Imnaha Component” by Wolff et al. (2008) [5], who suggested it to best represent the plume source, although there are no identified OIB with Pb isotopic compositions like C2.
The Steens Basalt is modeled as the result of a depleted mantle component (C1 of Carlson, 1984 [3]) mixing with the Imnaha component [18] or plume source [5]. Within lavas of the Steens Basalt, the proportion of depleted mantle decreases with time, moving stratigraphically upwards through the lower to the upper Steens Basalt [15]. Lower Steens lavas reflect a higher contribution of a depleted mantle component than do upper Steens lavas, suggesting that the proportion of the Imnaha component in the Steens Basalt increases with time. This is evidenced in isotopic space by 87Sr/86Sr versus 206Pb/204Pb, where the upper Steens Basalt plots closer to the defined Imnaha Component than the lower Steens Basalt [5,6]. This observation also applies to the lower Imnaha Basalts; the depleted mantle component is most prevalent in the earliest erupted Imnaha lavas [2,6,15].
The PGB shares the most geochemical characteristics with the Steens Basalt and the American Bar subtype of the Imnaha Basalts (Figure 2). Similar to the Steens Basalt, PGB magmas are interpreted as being derived from a depleted mantle source, but one that was significantly influenced by prior subduction [4,21]. The observed enrichment of LILE relative to HFSE is one of the more characteristic geochemical signatures in PGB lavas and dikes. This feature has been interpreted as evidence for a fluid-fluxed mantle component (Figure 3) [3,4,5,6,10,21,22,23]. In the context of the entire flood basalt province, it has been suggested that the PGB reflects a subduction overprinted back-arc mantle less influenced by plume magmatism compared to the rest of the CRBG [5].
1.2. Petrogenetic Significance of Picture Gorge Basalt Stratigraphy
The PGB is best exemplified by the type locality at Picture Gorge, where 18 basaltic lava flows are exposed in a continuous stratigraphic section. These lavas erupted from north-northwest trending dikes of the Monument Dike swarm [2,4,23] and can be subdivided based on plagioclase modal abundance; major element concentrations, specifically TiO2 and MgO; and magnetic orientation (Figure 4) [2,22,23,25,26,27,28]. The previous stratigraphic terminology used to describe these PGB subdivisions is inconsistent and resulted in application of stratigraphic nomenclature that does not abide by the Stratigraphic Code of North America (North American Commission on Stratigraphic Nomenclature, 2005) [29]. Here, we use the term “subunit” to reference these three previously mentioned subdivisions. the Twickenham, Monument Mountain, and Dayville Basalts, and “chemical type” to reference the further subdivisions of these subunits into 17 groupings of lava flows in addition to a distinct composition classified as high-MgO dikes (referred to as “members” by Bailey, 1989) [23].
The high-MgO dikes, identified as potential parental material [23], are enriched in Ba, K, and Rb relative to elements of similar incompatibility, suggesting some crustal contamination or slab-derived fluids fluxing the source. This enrichment in large ion lithophile elements (LILE) is also observed in the Twickenham Basalt subunit and in the Monument Mountain Basalt subunit but to a lesser degree [23]. A decrease in eruptive activity followed extrusion of Monument Mountain lavas, as the subsequent Dayville Basalt is characterized by lava flows that are both spatially limited and compositionally diverse. Overall, the Twickenham and Monument Mountain Basalts exhibit minor compositional variation, which cannot be the result of closed-system fractionation [23], and the younger Dayville Basalt forms its own evolutionary trend characterized by lava flows that are grouped into ten chemical types that are highly variable in their geochemical signatures (Figure 4).
2. Methods
2.1. Major and Trace Element Concentrations
Major and trace element data were acquired at the Peter Hooper GeoAnalytical Lab at Washington State University (WSU) using a Thermo-ARL Advant’XP automated X-ray fluorescence spectrometer (XRF) (Waltham, MA, USA) and an Agilent 7700 inductively coupled plasma mass spectrometer (ICP-MS) (Santa Clara, CA, USA). For sample preparation, basaltic samples were crushed into chips using the Braun Chipmunk at WSU and following sample preparation as outlined in Johnson et al. (1999) [33]. Then, chips exhibiting weathered surfaces were removed to reduce the influence of alteration on the resulting data. Rock chips were further crushed into a powder in a tungsten carbide swing mill. The sample powder was then combined with dilithium tetraborate (Li2B4O7) in a ratio of 2:1, dilithium tetraborate to sample. The sample was fused into a bead in an oven at a temperature of 1000 °C. The beads were reground into powder, and one gram of powder was separated in order to make the ICP-MS bead. Two beads per sample were then made, again at 1000 °C, one for XRF and one for ICP-MS analysis. The XRF bead was analyzed in the XRF instrument, and the ICP-MS bead was dissolved for final analysis. All major and trace element geochemical data for our PGB samples are compiled in Table S2. and Mg# is plotted against a variety of these geochemical parameter for visualization through geochemical evolution in Figure S4.
2.2. Radiogenic Isotope Analyses
Sample preparation and analysis for Sr, Nd, Pb, and Hf were performed at the Carnegie Institution for Science, Earth and Planets Laboratory (EPL) in Washington D.C. Sample preparation and analyses were conducted in 2017 and 2018 during two separate laboratory visits. During both visits, over 10 g of fresh rock chips from each sample were powdered in an agate ceramic bowl to avoid contamination of metals (i.e., Ta from WC grinding bowls). Once the sample was powdered, approximately 50 mg was weighed and dissolved in ~2 mL of concentrated HNO3 and 4 mL concentrated HF. The mixture in a Savillex Teflon vial was capped and heated on a 90 °C hotplate for ~12–18 h. Samples were heated longer (i.e., 18 h) during the 2017 sample preparation as the result of a laboratory closure. Each sample solution was then evaporated, redissolved twice in 1 mL of concentrated HNO3, and dissolved again in 4 mL of 4M HCl. Finally, samples were evaporated, dried two more times with 0.5 mL 0.5 N HBr, and redissolved in 3 mL of 0.5 N HBr. Following these acid digestions, elements of interest (Sr, Nd, Hf, and Pb) were separated and purified via column chromatography following the procedures described below.
Lead was separated first by loading the samples (in 3 mL 0.5 N HBr) on 0.04 mL Teflon columns with AG1-X8 100–200 mesh anion exchange resin following the methodology of Carlson et al. (2006) [34]. Following elution of the majority of the elements using 0.5 N HBr, the Pb fraction was collected in 1.5 mL HNO3, dried on a hotplate, and, after adding 1 mL 0.5 N HBr, loaded onto the columns a second time for purification. The final Pb fraction was collected in 1.5 mL 0.5 N HNO3. The remaining sample in 0.5 N HBr was then dried, oxidized with 0.5 mL of concentrated HNO3, evaporated again, redissolved in 5 mL of 0.1 N HF-1 N HCl, and heated for approximately one hour at 80 °C. Next, samples were centrifuged to remove any precipitates and loaded on AG 50 W × 8 resin (200–400 mesh), 20 cm height × 6 mm ID.
The high field strength elements, including hafnium, were separated next by collecting the initial solution and an additional 5 mL of 0.1 N HF-1 N HCl following a procedure modified from Patchett and Tatsumoto (1980) [35]. The eluant was then switched to 2.5 N HCl with 30 mL eluted until the Sr cut was collected in an additional 14 mL of 2.5 N HCl. Switching to 4 N HCl, the light REE was collected in 16 mL after eluting and discarding 12 mL.
Hafnium was purified on 0.6 × 10 cm columns using Eichrom LN 100–150 μm resin. The sample was loaded in 5 mL of 2.5 N HCl and rinsed with 10 mL 2.5 N HCl, 10 mL 6 N HCl, 4 mL of Milli-Q (MQ) water, 60 mL of 0.09 N citric acid-0.45 N HNO3-1 wt. % H2O2, 5 mL of 0.09 N citric acid-0.45 N HNO3, and 20 mL of 6 N HCL-0.06 N HF. The final Hf sample was collected in 8 mL of 6 N HCl-0.4N HF. Strontium was purified on 0.25 mL Teflon columns with Eichrom Sr resin. The purified Sr sample was collected in 2 mL of 0.05M HNO3. Neodymium was separated from the other REE following the procedure of Garcon et al. (2018) [36] on columns with 10–50 μm LN spec resin and collected in 9 mL of 0.173N HCl.
Isotopic compositions for Sr and Nd were measured via thermal ionization mass spectrometry (TIMS) on the Thermo-Fisher Triton. Sr was run on single Re filaments loaded in a Ta2O5 powder in dilute H3PO4-HF. Each 87Sr/86Sr ratio reported in Table 2 is the average of 279–290 ratios obtained using 8 s integrations with a signal size from 5 to 20 × 10−11 A of 88Sr. Mass fractionation was corrected to 86Sr/88Sr = 0.1194 using exponential mass dependency and reported relative to a value of 0.71025 for the NBS987 Sr standard. The Sr standard NBS987 was measured multiple times during the 2017 and 2018 analytical sessions and averaged 0.710240 ± 0.0000027 (n = 3) in 2017 and 0.710249 ± 0.000003 (n = 3) in 2018, where uncertainty is 2σ. For all but one sample, the individual run uncertainty on 87Sr/86Sr was 0.000003. Uncertainties for all samples are reported in Figure S5.
Each 143Nd/144Nd ratio reported in Table 2 is the average of 199–203 ratios (in 2017) or 233–279 (in 2018) statically obtained using 8 s integrations with a signal size from 1–3 × 10⁻¹¹ A of 144Nd. Mass fractionation was corrected using exponential mass dependency and 146Nd/144Nd = 0.7219. The Nd standard JNdi was measured multiple times during the 2017 analytical sessions and averaged 0.5121117 ± 0.0000023 (n = 3), where uncertainty is 2σ. During the 2018 analytical sessions, the data for JNdi averaged 0.5120940 ± 0.0000017 (n = 3), where uncertainty is 2σ. The difference in values measured for the standard reflects the aging of the Faraday cups, with the lower value obtained on fresher cups. Data for the samples are adjusted to a JNdi value of 0.512115 [37] based on the average value determined for JNdi during the separate analytical sessions.
Isotopic compositions for Pb and Hf were measured on the Nu HR multicollector ICP-MS and Nu Plasma II multicollector ICP-MS. Each Pb ratio reported in Table 2 is the average of 41–50 ratios. Samples that yielded 208Pb signals below 100 mv were not reported. Mass fractionation during the 2017 analyses was corrected to 205Tl/203Tl = 2.417 and then adjusted for the difference between the NBS981 Pb standards measured every 4 samples and the reported value for the standard [38]. Mass fractionation during the 2018 analyses was corrected to 205Tl/203Tl = 2.410 and then adjusted for the difference between the NBS981 Pb standards measured every 4 samples and the reported value for the standard [38]. Average values for NBS981 obtained during 2017 analytical sessions for n = 7 measurements were 208Pb/204Pb = 36.714 ± 0.006, 207Pb/204Pb = 15.497 ± 0.003, and 206Pb/204Pb = 16.941 ± 0.003, where uncertainty is 2σ. Average values for NBS981 obtained during 2018 analytical sessions for n = 6 measurements were 208Pb/204Pb = 36.703 ± 0.028, 207Pb/204Pb = 15.495 ± 0.011, and 206Pb/204Pb = 16.938 ± 0.012, where uncertainty is 2σ. Uncertainties for all samples are provided in Figure S5.
Hafnium isotopic compositions were measured by introducing samples into the plasma in 0.08N HNO3-0.06 N HF via a Teflon nebulizer. Each ratio reported in Table 2 is the average of 52–80 ratios, and the signal size of 178Hf ranged from 3 to 8 × 10⁻¹¹ A. Mass fractionation was corrected to 179Hf/177Hf = 0.7325. The average of JMC475 obtained during the 2017 analytical sessions for n = 3 measurements was 176Hf/177Hf = 0.282148 ± 0.000002 (2σ). The average of JMC475 obtained during the 2018 analytical sessions for n = 13 measurements was 176Hf/177Hf = 0.282144 ± 0.000002 (2σ). Reported 176Hf/177Hf ratios were adjusted based on the average value determined for JNdi during the separate analytical sessions corrected to a JMC475 value of 0.282160. Values for εHf and εNd are calculated using the average chondrite parameters from Bouvier et al. (2008) [39] of 176Hf/177Hf = 0.282785 and 143Nd/144Nd = 0.512630. All Sr, Nd, Hf, Pb isotope uncertainty and isobaric interferences for our PGB samples are compiled in Table S3.
2.3. Oxygen Isotope Analyses
In order to better quantify crustal contamination, δ18O values are revisited with modern techniques applied to both plagioclase mineral separates and basaltic groundmass that was exposed to multiple acid leachings to remove excess alteration. Basaltic groundmass and plagioclase separates were analyzed from 16 basaltic flows. The samples were crushed, sieved to grain sizes between 180 and 150 or 250 µm, magnetically separated via Franz, and leached in acid. Samples were prepared at Oregon State University following procedures for 40Ar/39Ar dating, and the remaining groundmass and mineral separates were used for oxygen isotope analysis. Oxygen isotopic compositions were then measured at the University of Oregon via an integrated CO2 laser fluorination MAT 253 isotope ratio mass spectrometer (IRMS) system [40,41]. The range of material analyzed from each sample was 1.2 to 1.6 mg. During the analytical session, the Gore Mountain Garnet standard (UOG, accepted δ18O = 6.52‰) was measured multiple times (n = 7) to correct for instrumental drift [41]. Analytical precision of UOG analyses from the session was 0.06% (2σ) and is reported in Table S4.
2.4. MELTS Calculations
MELTS calculations were conducted using version rhyoliteMELTS v1.2x with two distinct primitive compositions identified as PGB [5,7,23]. This version of MELTS is intended for modeling crystallization over 0–20 kb using bulk compositions that correspond to natural magmas; the melt is interpreted to contain dissolved H2O, but the magma is not quartz saturated [42,43]. Compositions were modeled at 6 different pressures (2, 3, 4, 7, 8, and 9 kb) with 0.1 and 0.5 wt. % water. For each experiment, the pressure stayed constant, and the temperature decreased to 100 degrees C below the wet liquidus temperature, as calculated by MELTS. Utilized partition coefficients are compiled in Table S1, and the results of each individual model are summarized in Table S5.
3. Results
3.1. PGB Composition
3.1.1. Major and Trace Element Compositions
Newly identified basaltic lavas and dikes of PGB composition extend across a wide swath of eastern Oregon. Along with PGB samples from the type locality and the original distribution area described by Bailey (1989) [23], PGB samples from these newly identified areas have relatively primitive to evolved (MgO ~4–9 wt. %) compositions with flat to slightly negatively sloping patterns on mantle-normalized incompatible trace element diagrams, but with troughs (HFSE) and spikes (Ba, K, Pb) typically associated with volcanic arc-related lavas of the Pacific Northwest (Figure 3). Samples of PGB composition exhibit relative depletions in many incompatible elements (i.e., La, Nb, Rb, Hf, Th), overall elevated large ion lithophile element (LILE) to high field strength element (HFSE) ratios, and less LREE enrichment on a mantle-normalized trace element diagram (Figure 2 and Figure 3) relative to other CRBG units.
To gauge fractionation and assess the geochemical variation of the PGB, major and trace elements are plotted against Mg# (molar Mg# = (Mg/(Mg + Fe) × 100)) (Figures S1–S3). Observed trends in both major and trace element space define broad bands on most such geochemical plots. Major element concentrations exhibit larger variability between Mg# 65–45 (i.e., Al2O3, MnO, P2O5, and FeO*), and both FeO* and MgO exhibit a slight inflection at Mg# of 45, which could be due to crystallization of ilmenite and magnetite.
At the high Mg# end of the compositional arrays, several elements (e.g., Si, Al, Fe, Ca, Ni, Cu, LREE, Pb), and Sr in particular, show a wide range in concentration, suggesting that the primary magmas for the PGB are compositionally variable (Figures S1–S3). Some basalts are characterized by Mg# > 60 and could represent potential parental magmas. The high Mg# PGB samples are best represented by samples of the high-MgO dikes and lava flows exposed along Rattlesnake Road in the southeastern region of the PGB extended distribution (Figure 1, Table 1). Although other samples could have been chosen, samples of Rattlesnake Road were selected as representatives of the parental magma because there are four analyses from this location and their classification as PGB has been further confirmed by the Oregon Department of Geology and Mineral Industries (DOGAMI) (R. A. Houston et al., 2017) [44]. Overall, these high Mg# samples reflect two groups of primitive compositions observed within the PGB, referred to as the high-MgO dike (HMD) and the Rattlesnake Road (RR) groups (Table 1).
3.1.2. Radiogenic and Oxygen Isotope Compositions
Isotopically, PBG lavas have the lowest 87Sr/86Sr ratios of all main-phase CRBG units, and the most primitive PGB dikes contain the lowest 87Sr/86Sr ratios observed within PGB [45]. New radiogenic isotope data are reported for 16 sampled basaltic lavas and dikes of the PGB. Samples from within and outside of the previously mapped extent have 87Sr/86Sr ratios from 0.70341 to 0.70376 and 143Nd/144Nd ratios from 0.51299 to 0.51289 (Figure 5). The only exceptions are samples of PGB lavas from Pole Creek in the Malheur Gorge. These samples have higher 87Sr/86Sr ratios > 0.7039 and lower 143Nd/144Nd ratios < 0.5129 than the rest of the PGB but resemble the PGB in major and trace element concentrations.
Combining isotopic data with trace element data, samples of the identified primitive groups (HMD and RR) are evaluated to see if they share isotopic similarities. The HMD group is best characterized by three samples in trace element and isotopic space (sample ID: MMB-D69A, MMB-D69B, and MMB-D70A). The RR group is characterized by three samples (CAH16-241A, DM255B, and CAH15-007). Because RR group sample CAH16-241A does not have isotopic data, it is substituted with a similar basaltic lava along Rattlesnake Road (CAH16-242A) that does (Figure 6D–F). Considering trace element and radiogenic isotope data together, samples of the RR group exhibit lower Y/P2O5 and higher LREE concentrations at lower 143Nd/144Nd values (Figure 6B). Samples of each group show variable 87Sr/86Sr ratios relative to other isotope ratios (i.e., 143Nd/144Nd or 206Pb/204Pb, Figure 7C,D). Within the RR group, 87Sr/86Sr values are >0.7035, and 143Nd/144Nd values are <0.51293. In the HMD group, 87Sr/86Sr values are <0.7034, and 143Nd/144Nd values are >0.51298 (Figure 7).
Oxygen isotope data for the PGB yield δ18O values ranging from 5.28 to 6.68 ‰ in groundmass and 5.32 to 5.92‰ in plagioclase (Table 2). At 49–53 wt. % SiO2, plagioclase δ18O values straddle the boundary of the δ18O melt; such thatδ18O plagioclase = δ18O melt at ~53 wt. % SiO2, which is 0.13‰ lighter at 49 wt. % SiO2 and 0.1‰ heavier at 56 wt. % SiO2 [40]. When compared with previous work, these data demonstrate a larger range of values from groundmass and a similar overall trend of increasing δ18O values for younger samples (Figure 13). This trend is observed with the earlier 87Sr/86Sr isotopic data, where PGB flows lower in the stratigraphy had lower ratios and higher stratigraphic flows had slightly higher ratios. Comparing 87Sr/86Sr data with δ18O values collected as part of this study, there is a clear linear correlation (R2 = 0.92) (Figure 5D).
3.2. Distinguishing Basaltic Lavas and Dikes of the PGB
Samples of PGB are distinguished from other main-phase CRBG formations (Grande Ronde, Imnaha, and Steens Basalts) by specific geochemical parameters. Relative to the Grande Ronde Basalt, the PGB is easy to differentiate, as it contains higher MgO (mostly > 4 wt. %) and lower concentrations of SiO2 (mostly < 53 wt. %) and generally lower incompatible trace element contents, for example, La, Y, and Hf (Figure 2). Compared to the Imnaha Basalts, which can be subdivided into two subtypes, Rock Creek (<51% wt. % SiO2) and American Bar (>51% wt. % SiO2, cf. Hooper, 1974 [46]), the PGB exhibits a comparable SiO2 range (48.5 to 53 wt. %) but with lower concentrations of various incompatible elements (i.e., Th, Hf, La) at a similar SiO2 content (Figure 2).
A more complicated goal is distinguishing the PGB near the northern extent of the Steens Basalt, as both the PGB and the Steens Basalt are coarsely plagioclase-phyric and contain similar SiO2 ranges. However, they are easily differentiated using Zr/Y ratios—at low SiO2, the PGB samples have Zr/Y < 4, and at high SiO2, the PGB samples have Zr/Y < 4.5, while samples of the Steens Basalt have ratios > 4 and > 4.5, respectively (Figure 2). Additionally, PGB samples have lower concentrations of LREE, TiO2, and Hf at a given SiO2 value (Figure 2).
3.3. Parental Magmas and Implications for Mantle Sources
Samples of each endmember (i.e., RR and HMD) represent some of the most primitive basalts identified within the PGB (Mg# > 57). The samples defining the HMD endmember plot closer to the C1 depleted mantle component of Carlson (1984) [3], while the samples defining the RR endmember exhibit a more enriched composition (Figure 7C,D). Magmatically evolved PGB samples are also consistent with a petrogenetic model involving two different mantle sources, as compositional variability at a given Mg# cannot be explained by fractionation or contamination alone, as documented in the following discussion.
The two defined primitive groups (HMD and RR) represent PGB endmember compositions and are distinct in both trace element and isotopic spaces with minimal overlapping attributes (Figure 7). Isotopic data suggest that the PGB samples define two populations of 87Sr/86Sr values, demonstrated by samples representative of both the RR and HMD endmembers. Plots of major and trace element data similarly suggest that samples of both endmember groups show distinct compositional differences. However, sample CAH15-007 plots closer to the HMD endmember array in most major and trace element spaces, and in isotopic geochemical space, this sample clusters with the RR endmember array (Figure 7). These relatively small enrichments in 87Sr/86Sr could be the result of crustal contamination or reflect larger contributions over time from a less-depleted magmatic source (i.e., with less conspicuous HFSE depletions and LILE enrichments).
Distinct geochemical and isotopic traits distinguish the RR endmember group from the HMD endmember group, suggesting that they were sourced from two different primitive compositions. Compared with other isotopic ratios such as 143Nd/144Nd or 206Pb/204Pb (Figure 7C,D), samples of each exhibit a wider range of 87Sr/86Sr ratios. For example, 87Sr/86Sr ratios range between 0.7030 and 0.7034 in the HMD endmember and 0.7035–7038 in the RR endmember. This variability is not observed in 143Nd/144Nd ratios, as the ratio is comparable between endmembers (HMD ~0.5130, RR 0.5129). This could be because Sr is a more fluid mobile element compared to Nd, so minor subduction metasomatism of a mantle source would be likely to result in more variability in Sr isotopic composition (compared to Nd). Higher LREE concentrations and Zr/Y values at higher 87Sr/86Sr ratios (i.e., >0.7035) in RR endmember samples suggest that some PGB parental magmas already contained slightly elevated ratios (Figure 7).
3.4. Fractionation Models to Account for PGB Geochemical Variability
Given the observed range of compositions even at the high MgO end of the PGB data, we take two endmembers from this dispersion as starting points for modeling the fractionation processes that resulted in the trends towards lower MgO contents. The data array from the RR endmember contains geochemical signatures similar to the earliest PGB subunit, the Twickenham Basalt (Figure 8B), while the data array from the HMD endmember is from high-MgO dikes that are independent of the three previously defined PGB subunits [23,47]. Comparing the three PGB subunits, there is one evolutionary trend for the Twickenham and Monument Mountain Basalts and another for the Dayville Basalts, which are anchored by the high-MgO dikes (Figure 4 and Figure 8). Select trace and major elements distinguish the geochemical evolution of each, such as P2O5 (wt. %) for similar Y (ppm) concentrations. This is useful to consider as a ratio (i.e., Y/P2O5), as Y has a close correlation with magmatic evolution (Figure 6, Figure 8 and Figure 9). Although Ti and P contents are effective at distinguishing various CRB units, the specific petrogenetic processes responsible for their relative differences remain unclear.
Identified primitive endmembers (HMD and RR) are used as parent compositions for fractionation models in MELTS. These compositions include a sample from the high-MgO dikes (HMD sample ID: MMB D70A, [5]) and a sample from a lava flow located along Rattlesnake Road (RR sample ID: CAH16-241A, this study) (Figure 1, Table 1). Using these two PGB compositions, a total of 24 MELTS models were conducted under variable crustal pressures (2–4 kb and 7–9 kb) and water contents (0.1 and 0.5 wt. % H2O). During each model, pressure is held constant, and temperature is lowered to 100 degrees below the calculated liquidus in increments of 2–5 degrees C. Model outputs include crystallizing mineral phases and their modal abundance, major element concentrations, and select trace element concentrations calculated using bulk partition coefficients (Di). Select trace elements include Y, La, Ba, Th, Sc, and Cr, where the behavior of each element in the magma is dictated by a bulk partition (or distribution) coefficient (Di). Utilized partition coefficients are summarized in Table S1, and MELTS modeling results are summarized in Table S5.
Model fractionation trends for the HMD endmember composition yielded results between ~75%–82% crystallization at all pressures with 0.1 wt. % H2O and varied between ~54%–67% when the starting composition contained 0.5 wt. % H2O. For models conducted under low pressures (2–4 kb), plagioclase and spinel are the first crystallizing phases, followed by olivine and clinopyroxene. At higher pressures (7–9 kb), clinopyroxene and spinel crystallize first, followed by plagioclase. Olivine is only a crystallizing phase under low pressure conditions (i.e., 2–4 kb), and spinel is a minor phase (<1%) under low pressure conditions and ranges from 1%–2.3% with higher pressure. High- and low-Ca clinopyroxene crystallize during each model, except at 2 and 9 kb at 0.5 wt. % H2O. The high-Ca clinopyroxene (~17 wt. %) crystallizes just a bit earlier than the low-Ca clinopyroxene (~4–7 wt. %). Considering both clinopyroxene populations, the modal abundance of clinopyroxene is similar (~ 48–49) for models run at higher pressures (7–9 kb). Model results also indicate increases in the modal abundance of the earlier formed high-Ca clinopyroxene with increasing pressure, where the later formed and lower-Ca clinopyroxene decreases with increasing pressure. At low pressures (2–4 kb), the modal abundance of both clinopyroxene populations is much more variable and increases with pressure (i.e., 2–3 kb and 3–4 kb).
Modeling results of the 100 °C decrease in temperature using the RR endmember composition indicate maximum fractionation degrees between 74% and 80% at lower pressures (2–4 kb) and 52%–62% at higher pressures (7–9 kb) with 0.1 wt. % H2O. When the melt contained 0.5 wt. % H2O, maximum fractionation degrees varied between 58% and 63% at lower pressures (2–4 kb) and 35–45% at higher pressures (7–9 kb) (Table S5). Mineral phases typically crystallized in the following sequence: orthopyroxene, followed by spinel, plagioclase, and clinopyroxene. Similar to the results using the HMD endmember, fractionation of the RR endmember composition predicts two populations of clinopyroxene, a high (>15 wt. %) and a low (<10 wt. %) Ca clinopyroxene. Both the high- and low-Ca populations of clinopyroxene crystallize with every model. For all modeled conditions, the modal abundance of clinopyroxene (both high and low Ca) remains similar, and plagioclase decreases with increasing pressure, and only under low pressure (2 kb) and wet (0.5 wt. % H2O) conditions will model results predict olivine as a crystallizing phase (Table S5).
Orthopyroxene is an early crystallizing phase predicted in each model using the RR endmember composition (likely due to the elevated SiO2 content) but never crystallizes during models conducted with the HMD composition (Table S5). Using the predicted modal abundance of crystallizing phases in MELTS with calculated bulk partition coefficients, concentrations for select trace elements were calculated from each model output. Trace element concentrations calculated from each model border the observed concentrations of Th, Ba, and La and could result from mixing of the magmas along the two differentiation trends. Predicted concentrations of Sc and Cr do not reflect the majority of observed PGB compositions (Figure 9 and Figure S2). Finally, the most conspicuous differences between these two primitive PGB endmembers is the enrichment of light rare earth elements (LREE) in the RR endmember composition relative to the HMD endmember composition (Figure S2). These endmembers may reflect differences in source compositions (e.g., amount of subduction metasomatism) or simply the relative depth and degree of melting.
3.5. Evaluating Crustal Contamination
To determine if assimilation of crustal material is playing a role in the petrogenesis of PGB lavas and dikes across its distribution area, K/P and K/Ti are plotted against Mg# (Figure 10). Typically, crustal contamination is evaluated via isotopic compositions, but here, the potential crustal endmembers from the young, accreted terranes are not isotopically distinct enough to have much effect on Sr and Nd isotopic compositions if assimilated. Regardless of age, felsic rocks have much higher K/P and K/Ti than mantle melts (even after crustal fractionation), so felsic crustal additions would show up in these elements no matter how old the crust is that was assimilated. Both ratios K/P and K/Ti will be modified if felsic material is assimilated, as K is concentrated in felsic material, while P and Ti are progressively depleted because of apatite and ilmenite fractionation, respectively. Additionally, if felsic crustal melts were assimilated, this should also be visible in other geochemical parameters such as SiO2, numerous incompatible elements (i.e., Rb, Nb, La, etc.), and radiogenic and oxygen isotopic data. Incompatible elements and isotopic data exhibit no clear evidence of assimilated granitic material.
The crustal section through which PGB magmas erupted consists of a series of accreted Paleozoic-Mesozoic oceanic volcanic arcs [50]. Although there is a range of compositions present in this crustal basement, we use the composition of the Izee metasediments as a representative of the potential crustal contaminant in the area of the PGB eruptions. Compositions of Izee metasediments relative to all PGB samples are plotted on Ba/Th versus La/Sm (normalized), which is often used to help unravel influences of oceanic crust compared with added sediment (Figure 11) [51]. The addition of such sediment into a magma is important to evaluate, as a volumetrically minor amount of sediment (~2%–3%) can dramatically alter the abundances of the most incompatible elements of an erupting basalt [51]. To investigate whether metasediments sourced from the Izee formation could yield the observed PGB geochemical signatures, we utilize a simple mixing model.
Models were done with the following mixing calculation:
m = xA + B(1 − x)
Different mixing compositions were investigated at 2, 5, 10, 15, and 20% (x), where (A) is a primitive PGB composition (i.e., HMD or RR), (B) is the average bulk composition for Izee metasediments, and (m) is the resulting contaminated PGB composition. The objective was to determine if assimilation of Izee metasediments (B) could yield observed PGB compositions (Figure 12). Results of this modeling indicate that contamination of PGB by Izee argillitic material would not sufficiently modify concentrations of many HREE, such as Tb, Dy, Yb, and Lu. Elevated HREE of average PGB is more likely to reflect their extensive amount of fractionation. Patterns for all PGB compositions do not reflect as large a depletion (i.e., deep trough) in Nb and Ta concentrations on a mantle normalized trace element diagram compared to the metasediments (Figure 12). One of the most prominent compositional changes of metasediment contribution is in K concentrations, but observed concentrations show no significant evidence that sediment assimilation is a dominant process over magmatic evolution (Figure 10). Concentrations of HREE and HFSE in PGB samples could not be produced from assimilation of Izee metasedimentary material; thus, additional processes need to be invoked to produce the observed compositional array in PGB rocks.
4. Discussion
4.1. Evidence of a Contaminated Mantle?
Lava flows and dikes of the PGB contain the lowest 87Sr/86Sr ratios of any main-phase formations of the CRBG (Figure 6 and Figure 7), and oxygen isotopes are near the mantle range at ~5.8 ± 0.2‰. When combined with elevated concentrations of Ba and overall high LILE/HFSE ratios, these characteristics have been used to argue sourcing from a back-arc-type mantle [3,6]. Previous petrogenetic modeling suggests that low 87Sr/86Sr ratios (<0.7030–0.7034) are characteristic of early and less-modified PGB lavas, and any relative increase in 87Sr/86Sr ratios was attributed to crustal contamination [3,4,5,6]. Relative to the existing PGB stratigraphy, low 87Sr/86Sr ratios (<0.7032) are observed in only three PGB samples: a Twickenham Basalt flow, a Dayville Basalt flow, and a high-MgO dike [5,23,45]. Higher 87Sr/86Sr ratios are observed in some of the lavas of the youngest PGB subunit, the Dayville Basalt; however, 87Sr/86Sr ratios in the Dayville Basalt range from 0.703087 to 0.703713, almost the full range of the entire PGB [5,23]. By contrast, a sample with relatively elevated 87Sr/86Sr (0.703691) of this study (CAH15-007, RR endmember) is among the most primitive PGB samples in terms of elemental composition (Figure 6). Another relatively primitive PGB sample (DM255B, Mg# 57.4) also has a relatively elevated 87Sr/86Sr ratio of 0.703757. This sample location at Dooley Mountain represents the northeastern extent of the added PGB distribution and clusters with other samples of the RR endmember in isotopic space (Figure 6).
The previous reported δ18O values from groundmass for the PGB ranged from 5.6 to 6.1‰, where stratigraphically lower basalts of the PGB have the lowest δ18O values, identical to the canonical mantle range of 5.7–5.8‰, and stratigraphically higher lavas have slightly elevated δ18O, up to 6.1 ‰ [4] (Figure 13). This study notes higher δ18O values in samples with younger ages, in agreement with observed increases with stratigraphy from earlier studies (i.e., Brandon et al., 1993 [4]) (Figure 13). Increases in δ18O values through time could be generated by prolonged volcanism through the same area gradually increasing the amount of crustal assimilation that was occurring—supported by the observed correlation between δ18O and 87Sr/86Sr (Figure 5D). Fractionation of mafic phases (i.e., olivine, clinopyroxene, and plagioclase) from a basaltic magma should minimally (~0.2‰) increase δ18O, assuming a starting composition of 5.7–5.8‰ in the basalt [40]. During magmatic evolution, δ18O increases and becomes isotopically heavier in minerals with more covalent bonds, yielding lower δ18O in more mafic phases and higher δ18O in the remaining melt [40]. However, δ18O ratios also increase as a result of crustal contamination, as most continental rocks have δ18O ratios > 6‰. Observed increases in δ18O values in more primitive PGB lavas are, then, more likely a result of contamination rather than fractional crystallization (Figure 13).
Assuming that these higher PGB groundmass δ18O values (6.12 and 6.68‰) are representative of both RR endmember samples (i.e., CAH15-007, DM255B in Table 2), the question becomes if this contamination occurred in the source or later as the magma traversed the crust. The most elevated δ18O signatures are from two primitive samples of the RR group (CAH15-007 and DM255B, respectively). Both samples are groundmass separates but have undergone acid leaching following 40Ar/39Ar procedures to remove excess alteration, which could lead to misleading (i.e., elevated) values. This observation is unique relative to other CRBG units, which often have elevated δ18O with lower MgO content (i.e., Grande Ronde Basalt). The range in δ18O in Grande Ronde is too big for magmatic fractionation, so this correlation between δ18O and MgO is likely reflective of combined fractionation-assimilation [54].
Addition of sediment to magma during crustal contamination affects the Sr isotope ratio of the contaminated magma less than addition of “sediment” to the mantle through subduction zone processes because of the much higher Sr content of a basaltic magma compared to its peridotitic source in the mantle [55]. There are no 87Sr/86Sr data for Izee material, but Nd isotopic data yield εNd values between −4 and 0, suggesting arc material that is compositionally evolved [56,57] with 87Sr/86Sr between 0.7045–0.707 based on the mantle correlation of Sr and Nd isotopic composition. δ18O values for Izee samples are also approximated to be > 9, as is common for most clays and clastic material [40].
To help determine if crustal contamination originated from melting a contaminated mantle source or during fractionation of primary magmas in the crust, δ18O and 87Sr/86Sr are plotted against one another, following James (1981) [55] (Figure 14). It is difficult to draw a definitive conclusion, as the crustal composition is not precisely known, but this does suggest that crustal contamination plays a role in petrogenesis of PGB magmas. Observations of PGB isotopic data suggest that source contamination with metasediment primarily increases 87Sr/86Sr prior to influencing δ18O values. By contrast, crustal contamination of the magma increases both 87Sr/86Sr and δ18O. PGB data are offset from mantle values in 87Sr/86Sr at mantle δ18O (source contamination) but show a trend of steeply increasing δ18O, with minor changes in 87Sr/86Sr (crustal contamination) likely reflecting assimilation of a high-δ18O mafic source. Samples of the HMD endmember may represent source contamination of a depleted mantle, whereas the RR endmember may represent a more enriched composition that experienced subsequent contamination.
4.2. PGB Magmas: Source Lithologies and Modification
Source lithologies for PGB lavas and dikes are interpreted to vary between pyroxenite to peridotite based on variable degrees of trace element enrichment and depletion, compared to Ni concentration within olivine phenocrysts [58]. The Ni content in the bulk rock can be skewed as a result of olivine accumulation. However, geochemical data combined with petrographic observations suggest that Ni content in PGB lavas is not driven by olivine accumulation, as our PGB samples that fall along the high-Ni trend are olivine poor (e.g., Soderberg and Wolff, 2023 [58], their Figure 7).
Distinguishing processes that result in incompatible element enrichment can be difficult, especially when the processes of interest have comparable geochemical consequences. Melting a sediment metasomatized mantle or adding sediment to a melt can yield comparable geochemical and isotopic characteristics in the resulting basaltic magma (Figure 9B). Both LILE and LREE can be enriched as a result of slab fluxing in the mantle or addition of sediment in the crust, and both modification scenarios have to be considered. Samples of both primitive PGB endmembers (HMD and RR) contain elevated Ba/Nb ratios (i.e., ~60) compared to MORB and OIB (Figure 9B). With respect to the RR endmember, all four sampled basaltic lavas from along Rattlesnake Road were candidates to represent a parental PGB composition (Mg# 58–59) for modeling in MELTS. However, these four lavas contain highly variable Ba/Nb ratios, ranging from 39 to 100, almost the full range observed in all PGB samples and providing evidence that PGB primary magmas must have been derived from compositionally distinct sources. The variability in Ba/Nb values within the same inferred mantle source (RR endmember) suggests that this source itself varied spatially and that it is more likely a source characteristic than the result of crustal contamination of the magmas while in the crust.
The data require a range in compositions of the primary magmas for the PGB, as shown in a variety of trace element plots (e.g., Ce/P, Ba/Nb). Simply put, magmatic differentiation alone cannot explain the huge range in the data for these ratios, and we demonstrate the minimal consequences of crustal contamination. Taken together, this suggests there must have been a wide range in primary PGB magmas derived from compositionally distinct sources.
The limited degree of crustal contamination could result from the rapid ascent rate of PGB magmas [4]. Earlier modeling tried to calculate the amount of contamination using an isotopic component that represents the crust in the Blue Mountains Province (Paleozoic accreted terranes) and a redefined C1-depleted mantle [3,4,23]. To achieve observed radiogenic Sr and δ18O values, Brandon et al. (1993) [4] estimated 8%–21% crustal contamination, which was consistent with the estimate of Carlson (1984) [3]. Although the bulk of these rocks provide little isotopic leverage in composition when compared to the CRBG, if the LILE enrichment in PGB lavas is a result of sediment input, metasedimentary Izee rocks are the most representative composition.
Trace element modeling suggests that crustal contamination with Izee metasedimentary material could not yield the observed compositional patterns in some incompatible elements in samples of the PGB, such as Nb, Ta, and some HREEs (Figure 13). Observed Zr/Y ratios in PGB lavas and dikes are highly variable, ranging from ~2 to 4.5 (Figure 9C). Both Zr and Y are similarly incompatible with partition coefficients that make them difficult to decouple during magmatic evolution. Variable Zr/Y values at high MgO suggests more than one contributing mantle source, as these ratios distinguish both primitive PGB endmembers (Zr/Y > 2.5 in RR, Zr/Y < 2.5 in HMD) (Figure 9C). If changes in Zr/Y primarily reflect compositional variability in the mantle source, the RR endmember is more heterogeneous. This is because samples defining the RR group exhibit a larger range in Zr/Y ratios than samples of the HMD group, similar to the variability of Ba/Nb ratios mentioned above (Figure 9B). Alternatively, these Izee sediments may not serve as the most compositionally representative material assimilated by PGB magmas.
High Mg basalts of the PGB contain Sc concentrations between 30 and 40 ppm; meanwhile, more evolved PGB samples contain Sc concentrations between 40 and 50 ppm (Figure 9A). The results of every MELTS model do not predict an increase in Sc but rather a decrease with magmatic evolution, suggesting that the modeling input parameters were not representative of the magmatic conditions at which differentiation occurred. Even under initial conditions that were highly saturated in H2O (3.0 wt. %), MELTS modeling still did not account for the observed increase in Sc concentrations (Figure 9A). This, combined with higher-than-predicted Cr concentrations, suggests that fractionation of clinopyroxene was not a dominating process in the formation of PGB basalts. Instead, the elevated concentrations of both Sc and Cr trace elements indicate that crystallization of clinopyroxene and potentially orthopyroxene was delayed or suppressed—and MELTS may be overestimating the importance of pyroxene crystallization (Figure 9). The arrival of clinopyroxene on the liquidus can be delayed when fractionation occurs at lower pressures [59]. In order for Sc content to steadily rise, it needs to remain incompatible, and that could possibly be achieved by either significant crystallization of olivine and plagioclase over pyroxene or episodic magmatic recharge at low pressures (< 3 kb) that may buffer basalt magmas at conditions prior to pyroxene crystallization (and may also explain highly variable Cr/Ni ratios among PGB magmas).
4.3. Petrogenetic Relationships to Other CRBG Formations
Of the CRGB formations, PGB shares the most geochemical and isotopic characteristics with the Steens Basalt, with comparable 87Sr/86Sr ratios (0.7035–0.7038). While observed δ18O values in PGB samples are not anomalously low, they are slightly lower than in the Steens Basalt. Reported δ18O values for the Steens Basalt range between 5.91 and 6.75‰ (n = 17), excluding one outlier at 8.5‰ [8]. The majority of reported δ18O values for PGB range between 5.28 and 5.99‰ (n = 17 of 19, Table 2) with two values > 6‰, which is generally representative of the mantle. Within basaltic lavas and dikes of the CRBG, δ18O values below ~5.9‰ are proposed to result from hydrothermal alteration by heated groundwater [54]. Since a portion of δ18O values in PGB are consistently below the average mantle, which differs from other CRBG formations, an alternative consideration could be exposure to hydrothermal processes. However, this interpretation seems unlikely given the correlation of δ18O values to 87Sr/86Sr, the minor depletion of δ18O values, and the large spatial extent and age range of analyzed PGB samples. We also note that Sr could be very sensitive to hydrothermal alteration, which may explain the range of 87Sr/86Sr at more or less constant 143Nd/144Nd.
4.4. Two Temporal Pulses of Magmatism
Eruptive activity for the PGB spans ~1.4 Ma, as evidenced by numerous high-precision ArAr dates from samples dispersed across a wide region in eastern Oregon. These ages demonstrate that lavas and dikes of the PGB were emplaced during two discrete intervals, a temporal pattern that this research has also identified in main-phase CRBG (Figure 15). Within the PGB, it is inconclusive whether there are clear geochemical trends with time. However, younger ages are often correlated with lower Sc (ppm) concentrations, which may suggest increasing pressure during crystallization and more pyroxene fractionation relative to olivine (Figure 15).
Two of the youngest reported PGB ages represent primitive samples used to characterize the RR group within radiogenic isotope space (samples CAH15-007 and DM255B) (Table 1, Figure 7). These samples erupted during the second and later pulse of PGB activity with 40Ar/39Ar ages between 16.22 and 15.76 Ma and contain the lowest TiO2 values of any of the dated samples (0.91 and 0.99 wt. %, respectively). While these two samples are the only dated samples within either identified endmember (RR or HMD), the other primitive samples that comprise the RR endmember have stratigraphic age control. Multiple basaltic lava flows along Rattlesnake Road both underlie and overlie the rhyolitic Dinner Creek Tuff unit 2, dated at ~15.5 Ma [61]. The exposures here are faulted, but the section overlies the Dinner Creek Tuff unit 1 and underlies unit 3, dated at 16.16 and 15.5, respectively [61]. This stratigraphic relationship constrains eruptive age and suggests that these lavas were emplaced between 15.5 and 16.16 Ma. These basaltic lavas along Rattlesnake Road erupted during the later pulse of PGB volcanism and contain low TiO2 concentrations (~0.92–1.11 wt. %). In addition to samples of the RR endmember, HMD endmember samples contain the lowest TiO2 concentrations of any analyzed PGB lava or dike, between 0.72 and 0.77 (wt. %). If these basaltic lavas and dikes do represent two parental components for the PGB, they were not emplaced until the second pulse of PGB eruptive activity (Figure 15).
4.5. PGB Endmember Compositions: Trust but Verify
The modeled HMD endmember composition is sourced from two dikes mapped in the Monument Dike swarm, originally interpreted as compositionally dissimilar to any CRBG geochemical subunit (samples D-16 and D-17 [47]). Although there are no published data, earlier studies also reported basaltic lavas of a similar high-MgO (and low TiO2) composition in Flat Creek, approximately 20 km southeast of the type locality at Picture Gorge [2,62] (D. Swanson, 201—personal comm.) (Figure 1). Both sample locations (D-16/-17 and Flat Creek) were targeted as part of this study to gain a context of sample exposures, field relationships, and textures. Multiple dikes were sampled at the mapped location of D-16/-17, along with basaltic outcrops exposed at the Flat Creek section. However, none of the basaltic samples collected from either site (D-16/-17 dikes, Flat Creek exposures) contained elevated MgO and depleted TiO2 (the geochemical composition that characterizes the high-MgO dikes). Thus, our field reconnaissance could not confirm the presence of any basaltic exposure with HMD composition as suggested by earlier workers [2,47,62] (D. Swanson, 201—personal comm.) While these high-MgO dikes are similar in their location and orientation to known PGB dikes of the Monument swarm, they are spatially and geochemically localized—with few samples existing between them and the rest of the PGB in geochemical parameter space (Figure 6, Figure 7 and Figure 8). Thus, although additional samples have been identified with similar compositions, we question whether these high MgO dikes represent a significant and volumetrically dominant parental magma of the PGB.
5. Conclusions
Geochemical compositions of the PGB and Steens Basalt were influenced by mantle contributions from a subduction-related component, likely from prior slab-sourced fluid fluxing [3,4,5,18]. In context to the PGB, this mantle source must be spatially widespread and variable in its relative contribution, as lavas and dikes with PGB composition identified as far east as Lake Owyhee and as far south as Hart Mountain, Oregon.
Samples of PGB composition exposed in both the original and extended distributions exhibit petrochemical diversity that trends toward two primitive endmembers in geochemical and isotopic spaces. MELTS modeling of both endmember compositions (HMD and RR) demonstrates that PGB geochemical variability cannot be attributed to fractionation processes alone. Evolution of the RR composition can account for a larger portion of the observed PGB trace element concentrations compared to the HMD composition, supporting the observation that samples of the HMD endmember are spatially localized and limited—and may represent a different basaltic suite.
Each group displays distinct trends with magmatic evolution, as seen in major and trace element compositional arrays. The HMD group is more sensitive to pressure fluctuations during fractionation, as exhibited by larger compositional changes between MELTS models conducted at different pressures. Predicted crystallizing phases are also dissimilar; olivine crystallizes from the HMD endmember composition but not from the RR endmember composition, while orthopyroxene crystallizes from the RR endmember composition but not from the HMD endmember composition. Results of trace element modeling is inconsistent with increasing concentrations of Sc and Cr (ppm) with magmatic evolution of natural samples. This could suggest suppression of clinopyroxene (or possibly orthopyroxene) fractionation and the continuous recharging of a Sc-enriched melt.
Differences in partial melting, compositionally distinct sources, fractional crystallization, and crustal contamination all play into creating compositional diversity in basalts. The geochemical diversity of PGB magmas cannot be solely attributed to magmatic fractionation, requiring some modification via crustal contamination. Modeling potential crustal contamination to produce the average composition for the PGB or the HMD endmember group, bulk assimilation of compositions like Izee metasedimentary rocks does not result in compositions similar to the PGB. More specifically, Izee rocks exhibit large relative depletions in trace elements such as Nb, Ta, and some HREEs. Mixing models indicate that the assimilating material could not have such significant depletions in these elements to produce average PGB compositional patterns on a mantle-normalized trace element diagram if the contamination occurred in the crust. Crustally derived material, however, does play a role in the generation of PGB, clearly indicated by the observed positive correlation of δ18O versus 87Sr/86Sr and enrichment of various LILEs. Considering additional mantle, magmatic, and surficial processes that influence these geochemical traits, the degree of contamination is likely < 10%, given that the majority of the PGB contains δ18O values below 6‰.
Combining geochemical traits, MELTS modeling results, and reported ages for the PGB, which range from 15.76 to 17.23 Ma, indicates that the most primitive PGB samples erupted during the later episode of PGB volcanic activity. A trend in composition over this time scale more likely reflects changing source compositions or conditions/degree of partial melting—also supported by decreases in TiO2 (wt. %) with time, the opposite of what would be expected with magmatic evolution. On the other hand, a fluid-fluxed mantle component is present in both temporal periods of PGB volcanic activity and may become more significant over time within each eruptive pulse of volcanism.
Supplementary Materials
The following supporting information can be downloaded at https://www.mdpi.com/article/10.3390/min14050440/s1: Table S1. Partition Coefficients Used in Trace Element Calculations [63,64,65,66,67]. Table S2. XRF and ICP-MS Data: Geochemical table with sample locations. Table S3. Sr, Nd, Hf, Pb Isotope Uncertainty and Isobaric Interferences. Table S4. Oxygen Isotope Summary Table. Table S5. Summary Table of MELTS Modeling Results Trace Element Calculations. Figure S1. MELTS modeling results for major elements versus Mg# for both RR and HMD endmember compositions. Figure S2. MELTS modeling results for selected trace elements versus Mg# for both RR and HMD endmember compositions. Figure S3. MELTS modeling results for major and trace element ratios versus Mg# for both RR and HMD endmember compositions. Figure S4. Major and Trace Elements versus Mg# Plots. Figure S5. Onuma Diagrams [68].
Author Contributions
Conceptualization, E.B.C. and M.J.S.; methodology, E.B.C., M.J.S., R.W.C. and I.N.B.; software, E.B.C.; validation, E.B.C., M.J.S., R.W.C. and I.N.B.; formal analysis, E.B.C., M.J.S. and R.W.C.; investigation, E.B.C. and M.J.S.; resources, E.B.C., M.J.S., R.W.C. and I.N.B.; data curation, E.B.C., M.J.S., R.W.C. and I.N.B.; writing—original draft preparation, E.B.C., M.J.S. and R.W.C.; writing—review and editing, E.B.C., M.J.S., R.W.C. and I.N.B.; visualization, E.B.C.; supervision, M.J.S. and R.W.C.; project administration, E.B.C.; funding acquisition, E.B.C., M.J.S. All authors have read and agreed to the published version of the manuscript.
Funding
This work was nominally supported through NSF-EAR grant #1220676 to Streck and Geological Society of America, Evolving Earth Foundation, and internal Portland State University graduate student research grants to Cahoon.
Data Availability Statement
Data are contained within the article and Supplementary Materials.
Acknowledgments
We acknowledge and appreciate the reviewers who helped improve the content and quality of this manuscript.
Conflicts of Interest
The authors declare no conflicts of interest.
References
- Camp, V.E.; Ross, M.E.; Duncan, R.A.; Jarboe, N.A.; Coe, R.S.; Hanan, B.B.; Johnson, J.A. The Steens Basalt: Earliest Lavas of the Columbia River Basalt Group. Spec. Pap. Geol. Soc. Am. 2013, 497, 87–116. [Google Scholar] [CrossRef]
- Swanson, D.A.; Wright, T.L.; Hooper, P.R.; Bentley, R.D. Revisions in Stratigraphic Nomenclature of the Columbia River Basalt Group; US Government Printing Office: Washington, DC, USA, 1979. [Google Scholar]
- Carlson, R.W. Isotopic Constraints on Columbia River Flood Basalt Genesis and the Nature of the Subcontinental Mantle. Geochim. Cosmochim. Acta 1984, 48, 2357–2372. [Google Scholar] [CrossRef]
- Brandon, A.D.; Hooper, P.R.; Goles, G.G.; St, R.; Lamberp, J. Contributions to Mineralogy and Petrology Evaluating Crustal Contamination in Continental Basalts: The Isotopic Composition of the Picture Gorge Basalt of the Columbia River Basalt Group. Contrib. Mineral. Petrol. 1993, 114, 452–464. [Google Scholar] [CrossRef]
- Wolff, J.A.; Ramos, F.C.; Hart, G.L.; Patterson, J.D.; Brandon, A.D. Columbia River Flood Basalts from a Centralized Crustal Magmatic System. Nat. Geosci. 2008, 1, 177–180. [Google Scholar] [CrossRef]
- Wolff, J.A.; Ramos, F.C. Source Materials for the Main Phase of the Columbia River Basalt Group: Geochemical Evidence and Implications for Magma Storage and Transport. Spec. Pap. Geol. Soc. Am. 2013, 497, 273–291. [Google Scholar] [CrossRef]
- Cahoon, E.B.; Streck, M.J.; Koppers, A.A.P.; Miggins, D.P. Reshuffling the Columbia River Basalt Chronology-Picture Gorge Basalt, the Earliest-and Longest-Erupting Formation. Geology 2020, 48, 348–352. [Google Scholar] [CrossRef]
- Moore, N.; Grunder, A.; Bohrson, W. The Three-Stage Petrochemical Evolution of the Steens Basalt (Southeast Oregon, USA) Compared to Large Igneous Provinces and Layered Mafic Intrusions. Geosphere 2018, 14, 2505–2532. [Google Scholar] [CrossRef]
- Schwartz, J.J.; Snoke, A.W.; Cordey, F.; Johnson, K.; Frost, C.D.; Barnes, C.G.; LaMaskin, T.A.; Wooden, J.L. Late Jurassic magmatism, metamorphism, and deformation in the Blue Mountains Province, northeast Oregon. Bulletin 2011, 123, 2083–2111. [Google Scholar] [CrossRef]
- Carlson, R.W.; Lu, G.W.; Macdock, J.D. Columbia River Volcanism: The Question of Mantle Heterogeneity or Crustal Contamination. Geochim. Cosmochim. Acta 1981, 45, 2483–2499. [Google Scholar] [CrossRef]
- Geist, D.; Richards, M. Origin of the Columbia Plateau and Snake River Plain: Deflection of the Yellowstone Plume. Geology 1993, 21, 789–792. [Google Scholar] [CrossRef]
- Hales, T.C.; Abt, D.L.; Humphreys, E.D.; Roering, J.J. A Lithospheric Instability Origin for Columbia River Flood Basalts and Wallowa Mountains Uplift in Northeast Oregon. Nature 2005, 438, 842–845. [Google Scholar] [CrossRef] [PubMed]
- Camp, V.E.; Hanan, B.B. A Plume-Triggered Delamination Origin for the Columbia River Basalt Group. Geosphere 2008, 4, 480–495. [Google Scholar] [CrossRef]
- Camp, V.E. Plume-Modified Mantle Flow in the Northern Basin and Range and Southern Cascadia Back-Arc Region since ca. 12 Ma. Geology 2019, 47, 695–699. [Google Scholar] [CrossRef]
- Moore, N.E.; Grunder, A.L.; Bohrson, W.A.; Carlson, R.W.; Bindeman, I.N. Changing Mantle Sources and the Effects of Crustal Passage on the Steens Basalt, SE Oregon: Chemical and Isotopic Constraints. Geochem. Geophys. Geosystems 2020, 21, e2020GC008910. [Google Scholar] [CrossRef]
- Richards, M.A.; Duncan, R.A.; Courtillot, V.E. Flood Basalts and Hot-Spot Tracks: Plume Heads and Tails. Science 1989, 246, 103–107. [Google Scholar] [CrossRef] [PubMed]
- Pierce, K.L.; Morgan, L.A.; Morgan, A. The Track of the Yellowstone Hot Spot: Volcanism, Faulting, and Uplift; Geological Society of America Memoir: Boulder, CO, USA, 1992; Volume 179. [Google Scholar]
- Carlson, R.W.; Hart, W.K. Crustal Genesis on the Oregon Plateau (Pacific). J. Geophys. Res. 1987, 92, 6191–6206. [Google Scholar] [CrossRef]
- Long, M.D.; Till, C.B.; Druken, K.A.; Carlson, R.W.; Wagner, L.S.; Fouch, M.J.; James, D.E.; Grove, T.L.; Schmerr, N.; Kincaid, C. Mantle Dynamics beneath the Pacific Northwest and the Generation of Voluminous Back-Arc Volcanism. Geochem. Geophys. Geosystems 2012, 13, 2012GC004189. [Google Scholar] [CrossRef]
- Liu, L.; Stegman, D.R. Origin of Columbia River Flood Basalt Controlled by Propagating Rupture of the Farallon Slab. Nature 2012, 482, 386–389. [Google Scholar] [CrossRef] [PubMed]
- Hoopers, P.R.; Hawkesworth, C.J.; Hooper, P.R.; Hawkesworth, C.J. Isotopic and Geochemical Constraints on the Origin and Evolution of the Columbia River Basalt. J. Petrol. 1993, 34, 1203–1246. [Google Scholar] [CrossRef]
- Mcdougall, I. Geochemistry and Origin of Basalt of the Columbia River Group, Oregon and Washington. Geol. Soc. Am. Bull. 1976, 87, 777–792. [Google Scholar] [CrossRef]
- Bailey, M.M. Evidence for Magma Recharge and Assimilation in the Picture Gorge Basalt Subgroup, Columbia River Basalt Group. Geol. Soc. Am. Spec. Pap. 1989, 239, 343–355. [Google Scholar]
- Sun, S.S.; McDonough, W.F. Chemical and isotopic systematics of oceanic basalts: Implications for mantle composition and processes. Geol. Soc. Lond. Spec. Publ. 1989, 42, 313–345. [Google Scholar] [CrossRef]
- Osawa, M.; Goles, G. Trace Element Abundances in Columbia River Basalts. In Proceedings of the Columbia River Basalt Symposium, Cheney, WA, USA, 21–23 March 1969; Eastern Washington State College Press: Cheney, WA, USA, 1970; pp. 173–175. [Google Scholar]
- Nathan, S.; Fruchter, J.S. Geochemical and Paleomagnetic Stratigraphy of the Picture Gorge and Yakima Basalts (Columbia River Group) in Central Oregon. Geol. Soc. Am. Bull. 1974, 85, 63–76. [Google Scholar] [CrossRef]
- Watkins, N.D.; Baksi, A.K. Magnetostratigraphy and Oroclinal Folding of the Columbia River, Steens, and Owyhee Basal ts in Oregon, Washington, and Idaho. Am. J. Sci. 1974, 274, 148–189. [Google Scholar] [CrossRef]
- Goles, G.G. Miocene Basalts of the Blue Mountains Province in Oregon. I: Compositional Types and Their Geological Settings. J. Petrol. 1986, 27, 495–520. [Google Scholar] [CrossRef]
- NORTH AMERICAN STRATIGRAPHIC CODE. North American Commission on Stratigraphic Nomenclature. AAPG Bull. 2005, 89, 1547–1591. [Google Scholar] [CrossRef]
- Kasbohm, J.; Schoene, B. Rapid eruption of the Columbia River flood basalt and correlation with the mid-Miocene climate optimum. Sci. Adv. 2018, 4, eaat8223. [Google Scholar] [CrossRef]
- Mahood, G.A.; Benson, T.R. Using 40Ar/39Ar ages of intercalated silicic tuffs to date flood basalts: Precise ages for Steens Basalt Member of the Columbia River Basalt Group. Earth Planet. Sci. Lett. 2017, 459, 340–351. [Google Scholar] [CrossRef]
- Kuiper, K.F.; Deino, A.; Hilgen, F.J.; Krijgsman, W.; Renne, P.R.; Wijbrans, J.R. Synchronizing rock clocks of Earth history. Science 2008, 320, 500–504. [Google Scholar] [CrossRef]
- Johnson, D.; Hooper, P.; Conrey, R. XRF Method XRF Analysis of Rocks and Minerals for Major and Trace Elements on a Single Low Dilution Li-Tetraborate Fused Bead. Adv. X-ray Anal. 1999, 41, 843–867. [Google Scholar]
- Carlson, R.W.; Czamanske, G.; Fedorenko, V.; Ilupin, I. A Comparison of Siberian Meimechites and Kimberlites: Implications for the Source of High-Mg Alkalic Magmas and Flood Basalts. Geochem. Geophys. Geosyst. 2006, 7, 2006GC001342. [Google Scholar] [CrossRef]
- Patchett, P.J.; Tatsumoto, M. Hafnium Isotope Variations in Oceanic Basalts. Geophys. Res. Lett. 1980, 7, 1077–1080. [Google Scholar] [CrossRef]
- Garçon, M.; Boyet, M.; Carlson, R.W.; Horan, M.F.; Auclair, D.; Mock, T.D. Factors Influencing the Precision and Accuracy of Nd Isotope Measurements by Thermal Ionization Mass Spectrometry. Chem. Geol. 2018, 476, 493–514. [Google Scholar] [CrossRef]
- Tanaka, T.; Togashi, S.; Kamioka, H.; Amakawa, H.; Kagami, H.; Hamamoto, T.; Yuhara, M.; Orihashi, Y.; Yoneda, S.; Shimizu, H.; et al. JNdi-1: A Neodymium Isotopic Reference in Consistency with LaJolla Neodymium. Chem. Geol. 2000, 168, 279–281. [Google Scholar] [CrossRef]
- Todt, W.; Cliff, R.A.; Hanser, A.; Hofmann, A.W. Evaluation of a 202Pb–205Pb Double Spike for High—Precision Lead Isotope Analysis. In Geophysical Monograph Series; Blackwell Publishing Ltd.: Oxford, UK, 1996; Volume 95, pp. 429–437. ISBN 9781118664230. [Google Scholar]
- Bouvier, A.; Vervoort, J.D.; Patchett, P.J. The Lu-Hf and Sm-Nd Isotopic Composition of CHUR: Constraints from Unequilibrated Chondrites and Implications for the Bulk Composition of Terrestrial Planets. Earth Planet Sci. Lett. 2008, 273, 48–57. [Google Scholar] [CrossRef]
- Bindeman, I. Oxygen Isotopes in Mantle and Crustal Magmas as Revealed by Single Crystal Analysis. Rev. Miner. Geochem. 2008, 69, 445–478. [Google Scholar] [CrossRef]
- Loewen, M.W.; Bindeman, I.N. Oxygen Isotope and Trace Element Evidence for Three-Stage Petrogenesis of the Youngest Episode (260–279 Ka) of Yellowstone Rhyolitic Volcanism. Contrib. Mineral. Petrol. 2015, 170, 39. [Google Scholar] [CrossRef]
- Gualda, G.A.R.; Ghiorso, M.S.; Lemons, R.V.; Carley, T.L. Rhyolite-MELTS: A Modified Calibration of MELTS Optimized for Silica-Rich, Fluid-Bearing Magmatic Systems. J. Petrol. 2012, 53, 875–890. [Google Scholar] [CrossRef]
- Gualda, G.A.R.; Ghiorso, M.S. MELTS-Excel: A Microsoft Excel-Based MELTS Interface for Research and Teaching of Magma Properties and Evolution. Geochem. Geophys. Geosyst. 2015, 16, 315–324. [Google Scholar] [CrossRef]
- Houston, R.A.; McClaughry, J.D.; Duda, C.J.M.; Ferns, M.L. Geologic Map of the Harney 7.5’ Quadrangle, Harney County, Oregon. 2017. [Google Scholar]
- Brandon, A.D.; Gordon, G.G. Assessing Subcontinental Lithospheric Mantle Sources for Basalts: Neogene Volcanism in the Pacific Northwest, USA as a Test Case. Contrib. Miner. Pet. 1995, 121, 364–379. [Google Scholar] [CrossRef]
- Hooper, P.R. Petrology and chemistry of the Rock Creek flow, Columbia River basalt, Idaho. Geological Society of America Bulletin 1974, 85, 15–26. [Google Scholar] [CrossRef]
- Fruchter, J.S.; Baldwin, S.F. Correlations between Dikes of the Monument Swarm, Central Oregon, and Picture Gorge Basalt Flows. Geol. Soc. Am. Bull. 1975, 86, 514–516. [Google Scholar] [CrossRef]
- Gaschnig, R.M.; Macho, A.S.; Fayon, A.; Schmitz, M.; Ware, B.D.; Vervoort, J.D.; Kelso, P.; LaMaskin, T.A.; Kahn, M.J.; Tikoff, B. Intrusive and depositional constraints on the Cretaceous tectonic history of the southern Blue Mountains, eastern Oregon. Lithosphere 2017, 9, 265–282. [Google Scholar] [CrossRef]
- Standhaft, D. Textural and Compositional Analysis of Early Miocene Dacite Lavas in Malheur National Forest, Eastern Oregon: Testing Models of Granodiorite Remobilization to Yield Dacite Magmas. Masters Thesis, Portland State University, Portland, OR, USA, University of Greifswald, Greifswald, Germany, 2018. [Google Scholar]
- Dickinson, W.R. Mesozoic Forearc Basin in Central Oregon. Geology 1979, 7, 166–170. [Google Scholar] [CrossRef]
- Elliot, T. Tracers of the Slab. In Inside the Subduction Factory; Geophysical Monograph-American Geophysical Union: Washington, DC, USA, 2004. [Google Scholar] [CrossRef]
- Nelson, D.O. Implications of oxygen-isotope data and trace-element modeling for a large-scale mixing model for the Columbia River Basalt. Geology 1983, 11, 248–251. [Google Scholar] [CrossRef]
- Hooper, P.R.; Swanson, D.A. The Columbia River Basalt Group and Associated Volcanic Rocks of the Blue Mountains Province; US Geological Survey Professional Paper; US Geological Survey: Reston, VA, USA, 1990; Volume 1437, pp. 63–99. [Google Scholar]
- Bindeman, I.N.; Greber, N.D.; Melnik, O.E.; Artyomova, A.S.; Utkin, I.S.; Karlstrom, L.; Colón, D.P. Pervasive Hydrothermal Events Associated with Large Igneous Provinces Documented by the Columbia River Basaltic Province. Sci. Rep. 2020, 10, 10206. [Google Scholar] [CrossRef] [PubMed]
- James, D.E. The Combined Use of Oxygen and Radiogenic Isotopes as Indicators of Crustal Contamination. Annu Rev Earth Planet Sci. 1981, 9, 311–344. [Google Scholar] [CrossRef]
- Lamaskin, T.A.; Dorsey, R.J.; Vervoort, J.D. Tectonic Controls on Mudrock Geochemistry, Mesozoic Rocks of Eastern Oregon and Western Idaho, U.S.A.: Implications for Cordilleran Tectonics. J. Sediment. Res. 2008, 78, 765–783. [Google Scholar] [CrossRef]
- LaMaskin, T.; Vervoort, J.; Dorsey, R. Crustal Growth by Tectonic Accretion of Island Arc Terranes: Radioisotopic Provenance of Late Paleozoic–Mesozoic Rocks of the Blue Mountains, Western United States. Geol. Soc. Am. Abstr. Programs 2013, 45, 441. [Google Scholar]
- Soderberg, E.R.; Wolff, J.A. Mantle Source Lithologies for the Columbia River Flood Basalt Province. Contrib. Mineral. Petrol. 2023, 178, 11. [Google Scholar] [CrossRef]
- Takahashi, E.; Kushiro, I. Melting of a Dry Peridotite at High Pressures and Basalt Magma Genesis. Am. Mineral. 1983, 68, 859–879. [Google Scholar]
- Cahoon, E.B.; Streck, M.J.; Koppers, A.A. Picture Gorge Basalt: Internal stratigraphy, eruptive patterns, and its importance for understanding Columbia River Basalt Group magmatism. Geosphere 2023, 19, 406–430. [Google Scholar] [CrossRef]
- Streck, M.J.; Ferns, M.L.; McIntosh, W. Large, Persistent Rhyolitic Magma Reservoirs above Columbia River Basalt Storage Sites: The Dinner Creek Tuff Eruptive Center, Eastern Oregon. Geosphere 2015, 11, 226–235. [Google Scholar] [CrossRef]
- Thayer, T.P.; Brown, E. Local Thickening of Basalts and Late Tertiary Silicic Volcanism in the Canyon City Quadrangle, Northeastern Oregon; U.S. Geological Survey: Reston, VA, USA, 1966; pp. C73–C78. [Google Scholar]
- McKenzie, D.A.N.; O’nions, R.K. Partial melt distributions from inversion of rare earth element concentrations. J. Petrol. 1991, 32, 1021–1091. [Google Scholar] [CrossRef]
- Hart, S.R.; Dunn, T. Experimental cpx/melt partitioning of 24 trace elements. Contrib. Mineral. Petrol. 1993, 113, 1–8. [Google Scholar] [CrossRef]
- Green, T.H. Experimental studies of trace-element partitioning applicable to igneous petrogenesis—Sedona 16 years later. Chem. Geol. 1994, 117, 1–36. [Google Scholar] [CrossRef]
- Hauri, E.H.; Wagner, T.P.; Grove, T.L. Experimental and natural partitioning of Th, U, Pb and other trace elements between garnet, clinopyroxene and basaltic melts. Chem. Geol. 1994, 117, 149–166. [Google Scholar] [CrossRef]
- Dunn, T.; Senn, C. Mineral/matrix partition coefficients for orthopyroxene, plagioclase, and olivine in basaltic to andesitic systems: A combined analytical and experimental study. Geochim. Cosmochim. Acta 1994, 58, 717–733. [Google Scholar] [CrossRef]
- Onuma, N.; Higuchi, H.; Wakita, H.; Nagasawa, H. Trace element partition between two pyroxenes and the host lava. Earth Planet. Sci. Lett. 1968, 5, 47–51. [Google Scholar] [CrossRef]
Figure 1.
Regional map illustrating distribution of the CRBG and extended spatial distribution of PGB lavas. Locations of dikes shown for the Chief Joseph, Steens, and Monument Dike swarms. High MgO (HMD) and Rattlesnake Road (RR) highlight sample locations for compositions used in MELTS modeling and definition of PGB compositional endmembers. Spatial extent of accreted terranes (Baker, Wallowa, Olds Ferry, and Izee terranes) throughout the Blue Mountains Province in eastern Oregon, with the extent of the Izee terrane shown with a mottled pattern (modified from Schwartz et al., 2011 [9]). Blue polygons represent spatial extent of Jurassic to Cretaceous (J-K) plutonic rocks that constrain timing of terrane accretion. Dashed 0.704/0.706 line represents the 87Sr/86Sr contact between accreted terranes and the western margin of the North American craton. Inset map showing distribution of Columbia River Basalt Group (CRBG) in northwestern U.S. with state lines for reference.

Figure 2.
Geochemical major and trace elements for PGB relative to all main-phase CRBG. (A) Zr/Y, (B) Ba/Nb, and (C) TiO2 (wt. %) versus MgO (wt. %), (D) La (ppm), and (E) Hf (ppm) versus SiO2 (wt. %). Samples of PGB are subdivided based on their location; the previously mapped extent of PGB (original distribution) shown with open diamonds or additional locations (extended distribution) shown with solid diamonds. Geochemistry compiled from * Wolff et al. (2008) [5], + Moore (2018) [8], and ^ this study.

Figure 3.
Mantle normalized incompatible element diagram (Sun and McDonough, 1989 [24]) with average compositions for main-phase formations of the CRBG. Geochemistry compiled from * Wolff et al. (2008) [5] and + Moore (2018) [8].

Figure 4.
(A) Stratigraphic section with magnetic polarity of CRBG main-phase units that include six major polarity chrons R0-N2 (‘R’ represents ‘reverse polarity’ and ‘N’ represents ‘normal polarity’), highlighting PGB internal stratigraphy (including subunits and chemical types). Geochemical plots of identified subunits of the PGB, noting their internal subdivisions, the Twickenham, Monument Mountain, and Dayville Basalts, including (B) Zr (ppm) versus MgO (wt. %) and (C) Y (ppm) versus P2O5 (wt. %) compositions for PGB subunits from Bailey (1989) [23]. Additional ages: * Kasbohm and Schoene (2018) [30]; + Mahood and Benson (2017) [31]; ^ Moore, et al. (2018) [8]. All 40Ar/39Ar dates were calculated using the Fish Canyon Tuff sanidine age of 28.201 ± 0.023 Ma, after Kuiper et al. (2008) [32], and the U-Pb errors for the Kasbohm and Schoene (2018) [30] age are reported as 95% confidence intervals given for internal uncertainty and decay constant uncertainty. Note on (C): The pixelation of data points on this plot is a result of older Y data that lack precision to concentrations below 1.0 ppm.

Figure 5.
Comparison of 87Sr/86Sr isotopic ratios versus (A) SiO2 (wt. %), (B) Mg#, (C) Epsilon Nd, and (D) δ18O (‰) data for main-phase units of the CRBG: PGB, Steens Basalt (upper and lower), and Imnaha Basalts (Grande Ronde Basalt not depicted). Both subtypes of the Imnaha Basalts are distinguished, American Bar and Rock Creek, in addition to the American Bar lavas located at Dug Bar, which reflect some PGB characteristics. Geochemical data from † Moore et al. (2020) [15]; this study and all other isotopic and geochemical data from Wolff et al. (2008) [5].

Figure 6.
Elemental ratio plots to distinguish identified PGB endmembers. Y/P2O5 versus (A) Mg#, (B) TiO2 (wt. %), (C) Zr/Y, and 143Nd/144Nd isotopic ratios versus (D) Mg#, (E) TiO2 (wt. %), (F) Zr/Y for the Imnaha Basalt and PGB main-phase units of the CRBG. Both identified PGB endmember compositions; HMD (orange) and RR (green) are noted along with additional PGB lavas located along Rattlesnake Road. These samples are included in the trace element plots for comparison but do not have isotopic data. Trace element and isotopic data from * Wolff et al. (2008) [5] and + this study.

Figure 7.
Geochemical plots of major elements, trace elements, and isotope ratios to distinguish identified PGB endmember samples (RR, three representative samples; HMD, three representative samples). Isotopic ratios of 143Nd/144Nd versus (A) Y/P2O5, (B) La (ppm), (C) 87Sr/86Sr, and (D) 206Pb/204Pb for the Imnaha Basalt and PGB main-phase units of the CRBG. The C1 enriched mantle and C2 depleted mantle components of Carlson (1984) [3] are noted on plots (C,D) along with both identified PGB endmember compositions, HMD (orange) and RR (green). The gray horizontal band on plot (D) represents the 143Nd/144Nd value of one RR endmember sample where the 206Pb/204Pb value was not reported. Geochemical data from * Wolff et al. (2008) [5] and + this study.

Figure 8.
Geochemical comparison of PGB samples collected in this study relative to the three PGB subunits distinguished by Bailey (1989) [23]. (A) Y (ppm) and (B) TiO2 (wt. %) versus P2O5 (wt. %) for PGB samples collected as part of this study compared to all previously analyzed PGB samples. Composition evolution of both identified PGB endmembers (HMD and RR) shown with predicted evolution from MELTS modeling results. Dark gray lines represent modeling at 0.5 wt. % H2O, and light gray lines represent modeling at 0.1 wt. % H2O. Solid lines are 9 kb progressively more from dashed to dotted lines, representing 2 kb. PGB subunit geochemistry from Bailey (1989) [23] and * previous PGB geochemistry from Wolff et al. (2008) [5].

Figure 9.
MELTS modeling results for parental RR and HMD endmember compositions. Scatterplots include (A) Sc (ppm), (B) Ba/Nb, and (C) Zr/Y versus Mg# and (D) Y (ppm) versus P2O5 (wt. %). All plots include models conducted at low pressure (2 kb) and high pressure (9 kb), at both 0.1 and 0.5 wt. % H2O, and include two model runs with 3.0 wt. % H2O (2 kb and 5 kb). Blue diamonds illustrate which samples also have Sr, Nd, Hf, and Pb isotopic analyses.

Figure 10.
Trace element ratios (A) K/P and (B) K/Ti versus Mg# for PGB samples (this study). Both ratios are sensitive to assimilation when the crustal contaminant is felsic and may indicate if crustal contamination influences geochemical signatures of the PGB. * Cretaceous plutons include the Lookout Mountain, Turemen Ranch, Amelia, and Pedro Mountain plutons (data from Gaschnig et al., 2017 [48]; Standhaft, 2018 [49]). + Samples of Izee metasediments, predominantly argillite and shale lithologies (data from Streck, unpub.).

Figure 11.
Ba/Th versus La/Sm (normalized) of PGB and Izee metasediments. Trace element data from * Wolff et al. (2008) [5] and Izee crustal samples from Streck, unpublished data.
Figure 11.
Ba/Th versus La/Sm (normalized) of PGB and Izee metasediments. Trace element data from * Wolff et al. (2008) [5] and Izee crustal samples from Streck, unpublished data.

Figure 12.
Mixing models illustrating initial compositions of (A) the primitive HMD endmember and (B) the primitive RR endmember and mixture compositions (m) resulting from 2, 5, 8, 15, and 20% contamination with average Izee metasediments on mantle normalized trace element diagrams (Sun and McDonough, 1989 [24]). Geochemical compositions for average PGB and Izee metasedimentary material shown for reference; data compiled from * this study; + Wolff et al., 2008 [5]; and ^ Streck, unpublished data.

Figure 13.
(A) Histogram of δ18O compositions for PGB and other CRBG units. δ18O data compiled from Nelson, 1983 [52]; Carlson, 1984 [3]; Hooper and Swanson, 1990 [53]; Brandon et al., 1993 [4], and Moore, 2018 [8]. Steens analyses are from plagioclase separates, and all other CRBG analyses are from whole-rock samples. (B) Scatterplot of Mg# versus the δ18O value for PGB samples analyzed as part of this study; x-axis scaled similarly to panel.

Figure 14.
Plot of δ18O versus 87Sr/86Sr ratios for PGB samples and approximated Izee crustal material as a potential contaminant. Mixing lines are not included, as there is not a well-defined isotopic composition for this potential contaminant. PGB * data from Wolff et al. (2008) [5].
Figure 14.
Plot of δ18O versus 87Sr/86Sr ratios for PGB samples and approximated Izee crustal material as a potential contaminant. Mixing lines are not included, as there is not a well-defined isotopic composition for this potential contaminant. PGB * data from Wolff et al. (2008) [5].

Figure 15.
Geochemical signatures through time for dated PGB samples in this study. Age (Ma) versus (A) Mg#, (B) Sc (ppm), (C) Ba/Nb, and (D) 143Nd/144Nd isotopic ratios (arrows illustrate potential trends through each eruptive pulse/time). (E) Histogram of PGB ages (15 total) at 2-sigma using 1000 uniformly distributed points from Cahoon et al., 2023 [60]; ages along the y-axis are scaled to align with panels and greyscale color indicates samples where dark to light grey represents PGB temporal endmembers (A–D). A bimodal distribution of PGB ages suggests two temporal pulses of volcanism that are comparable in their geochemical variability, although 143Nd/144Nd appears to increase within each age population.


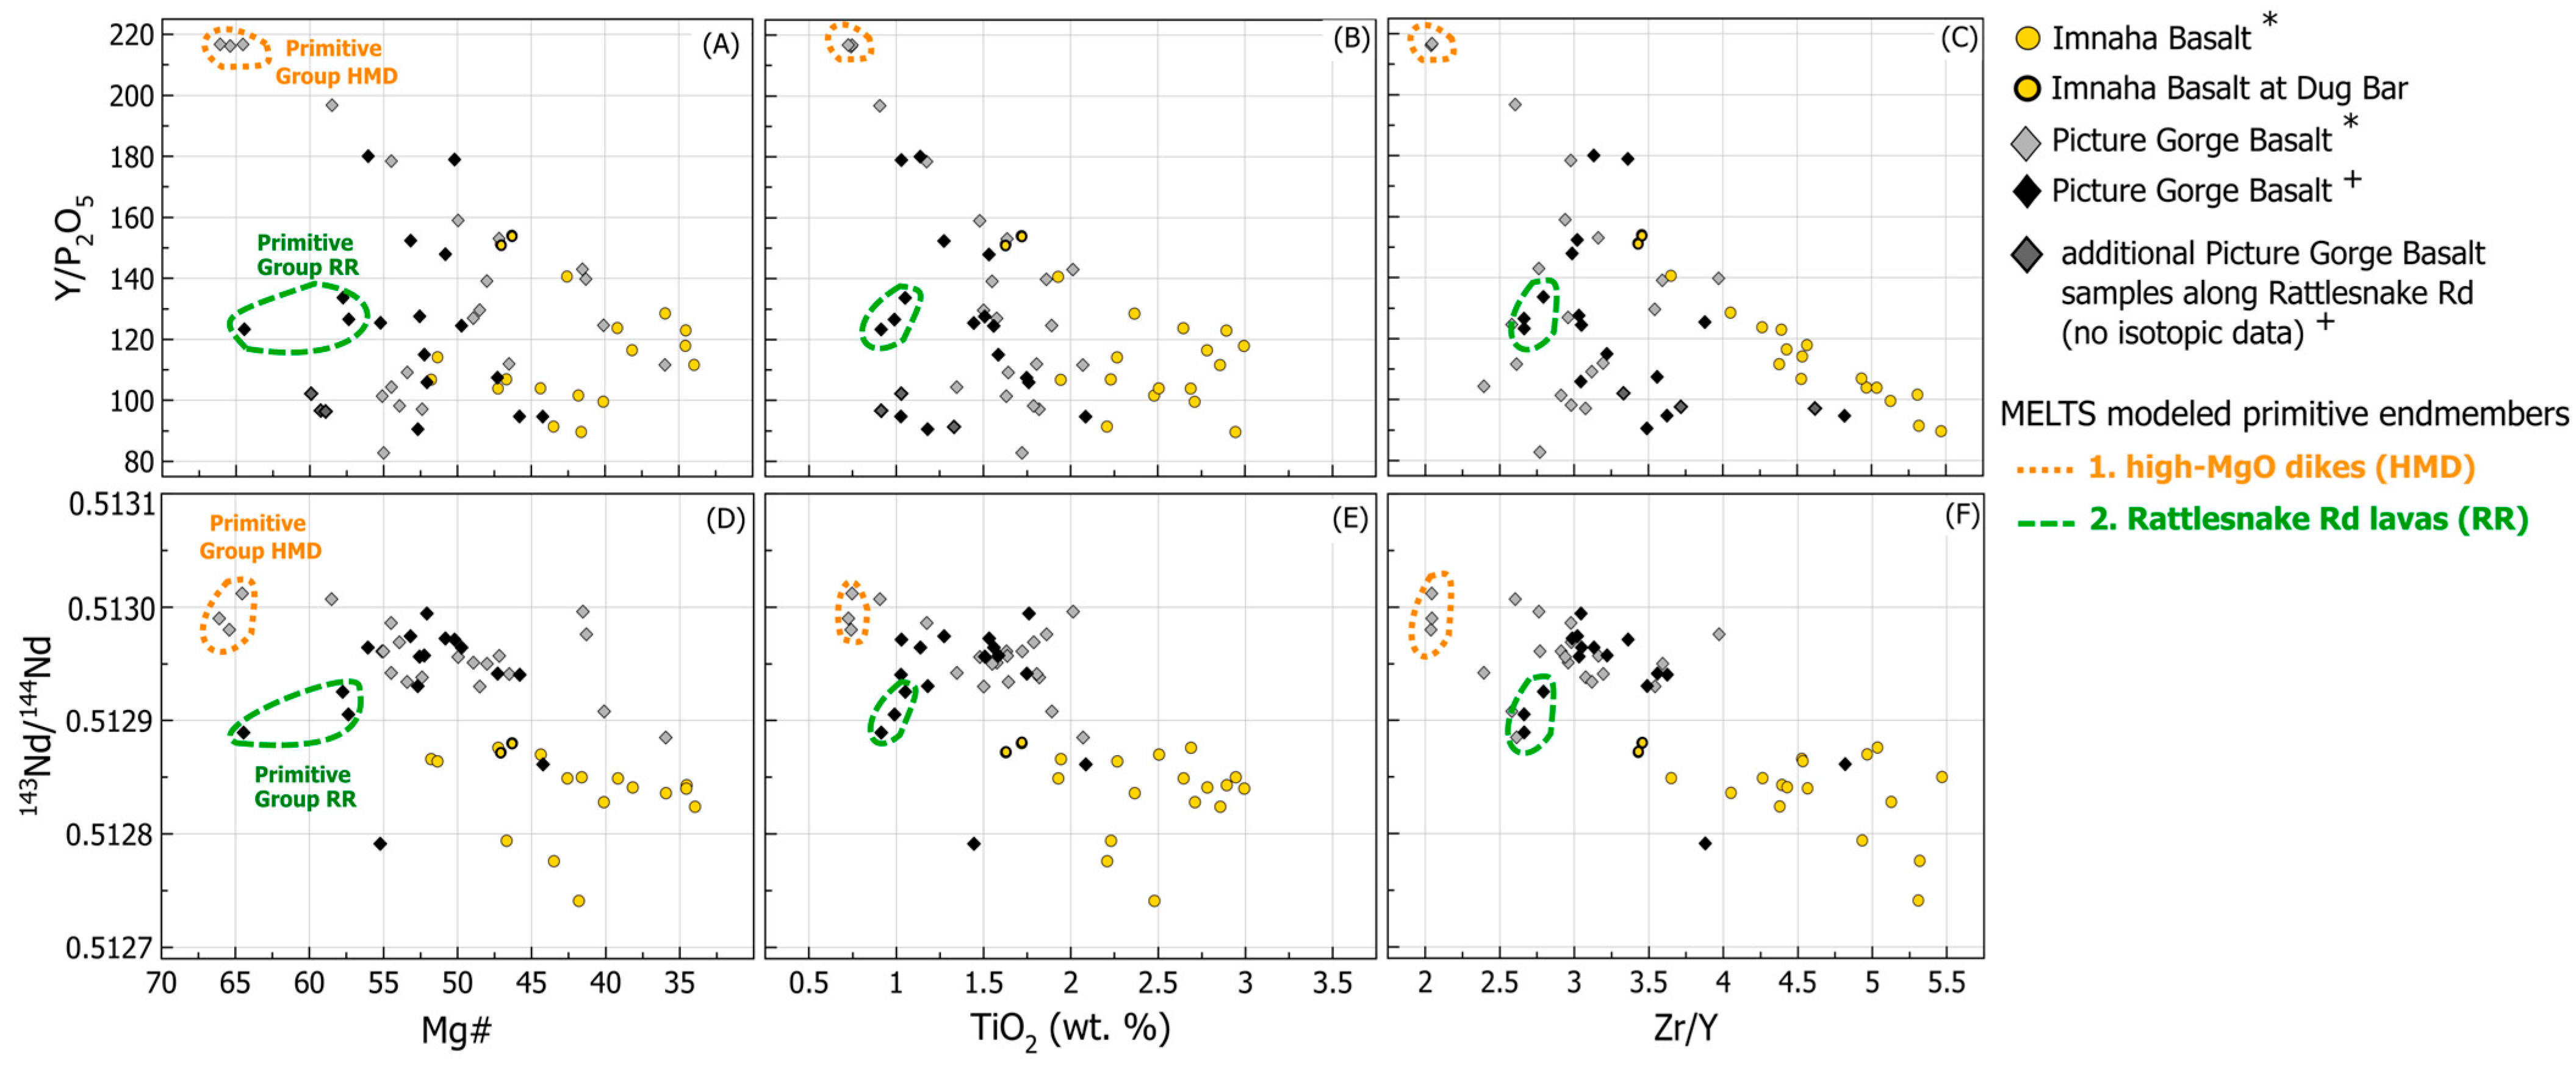
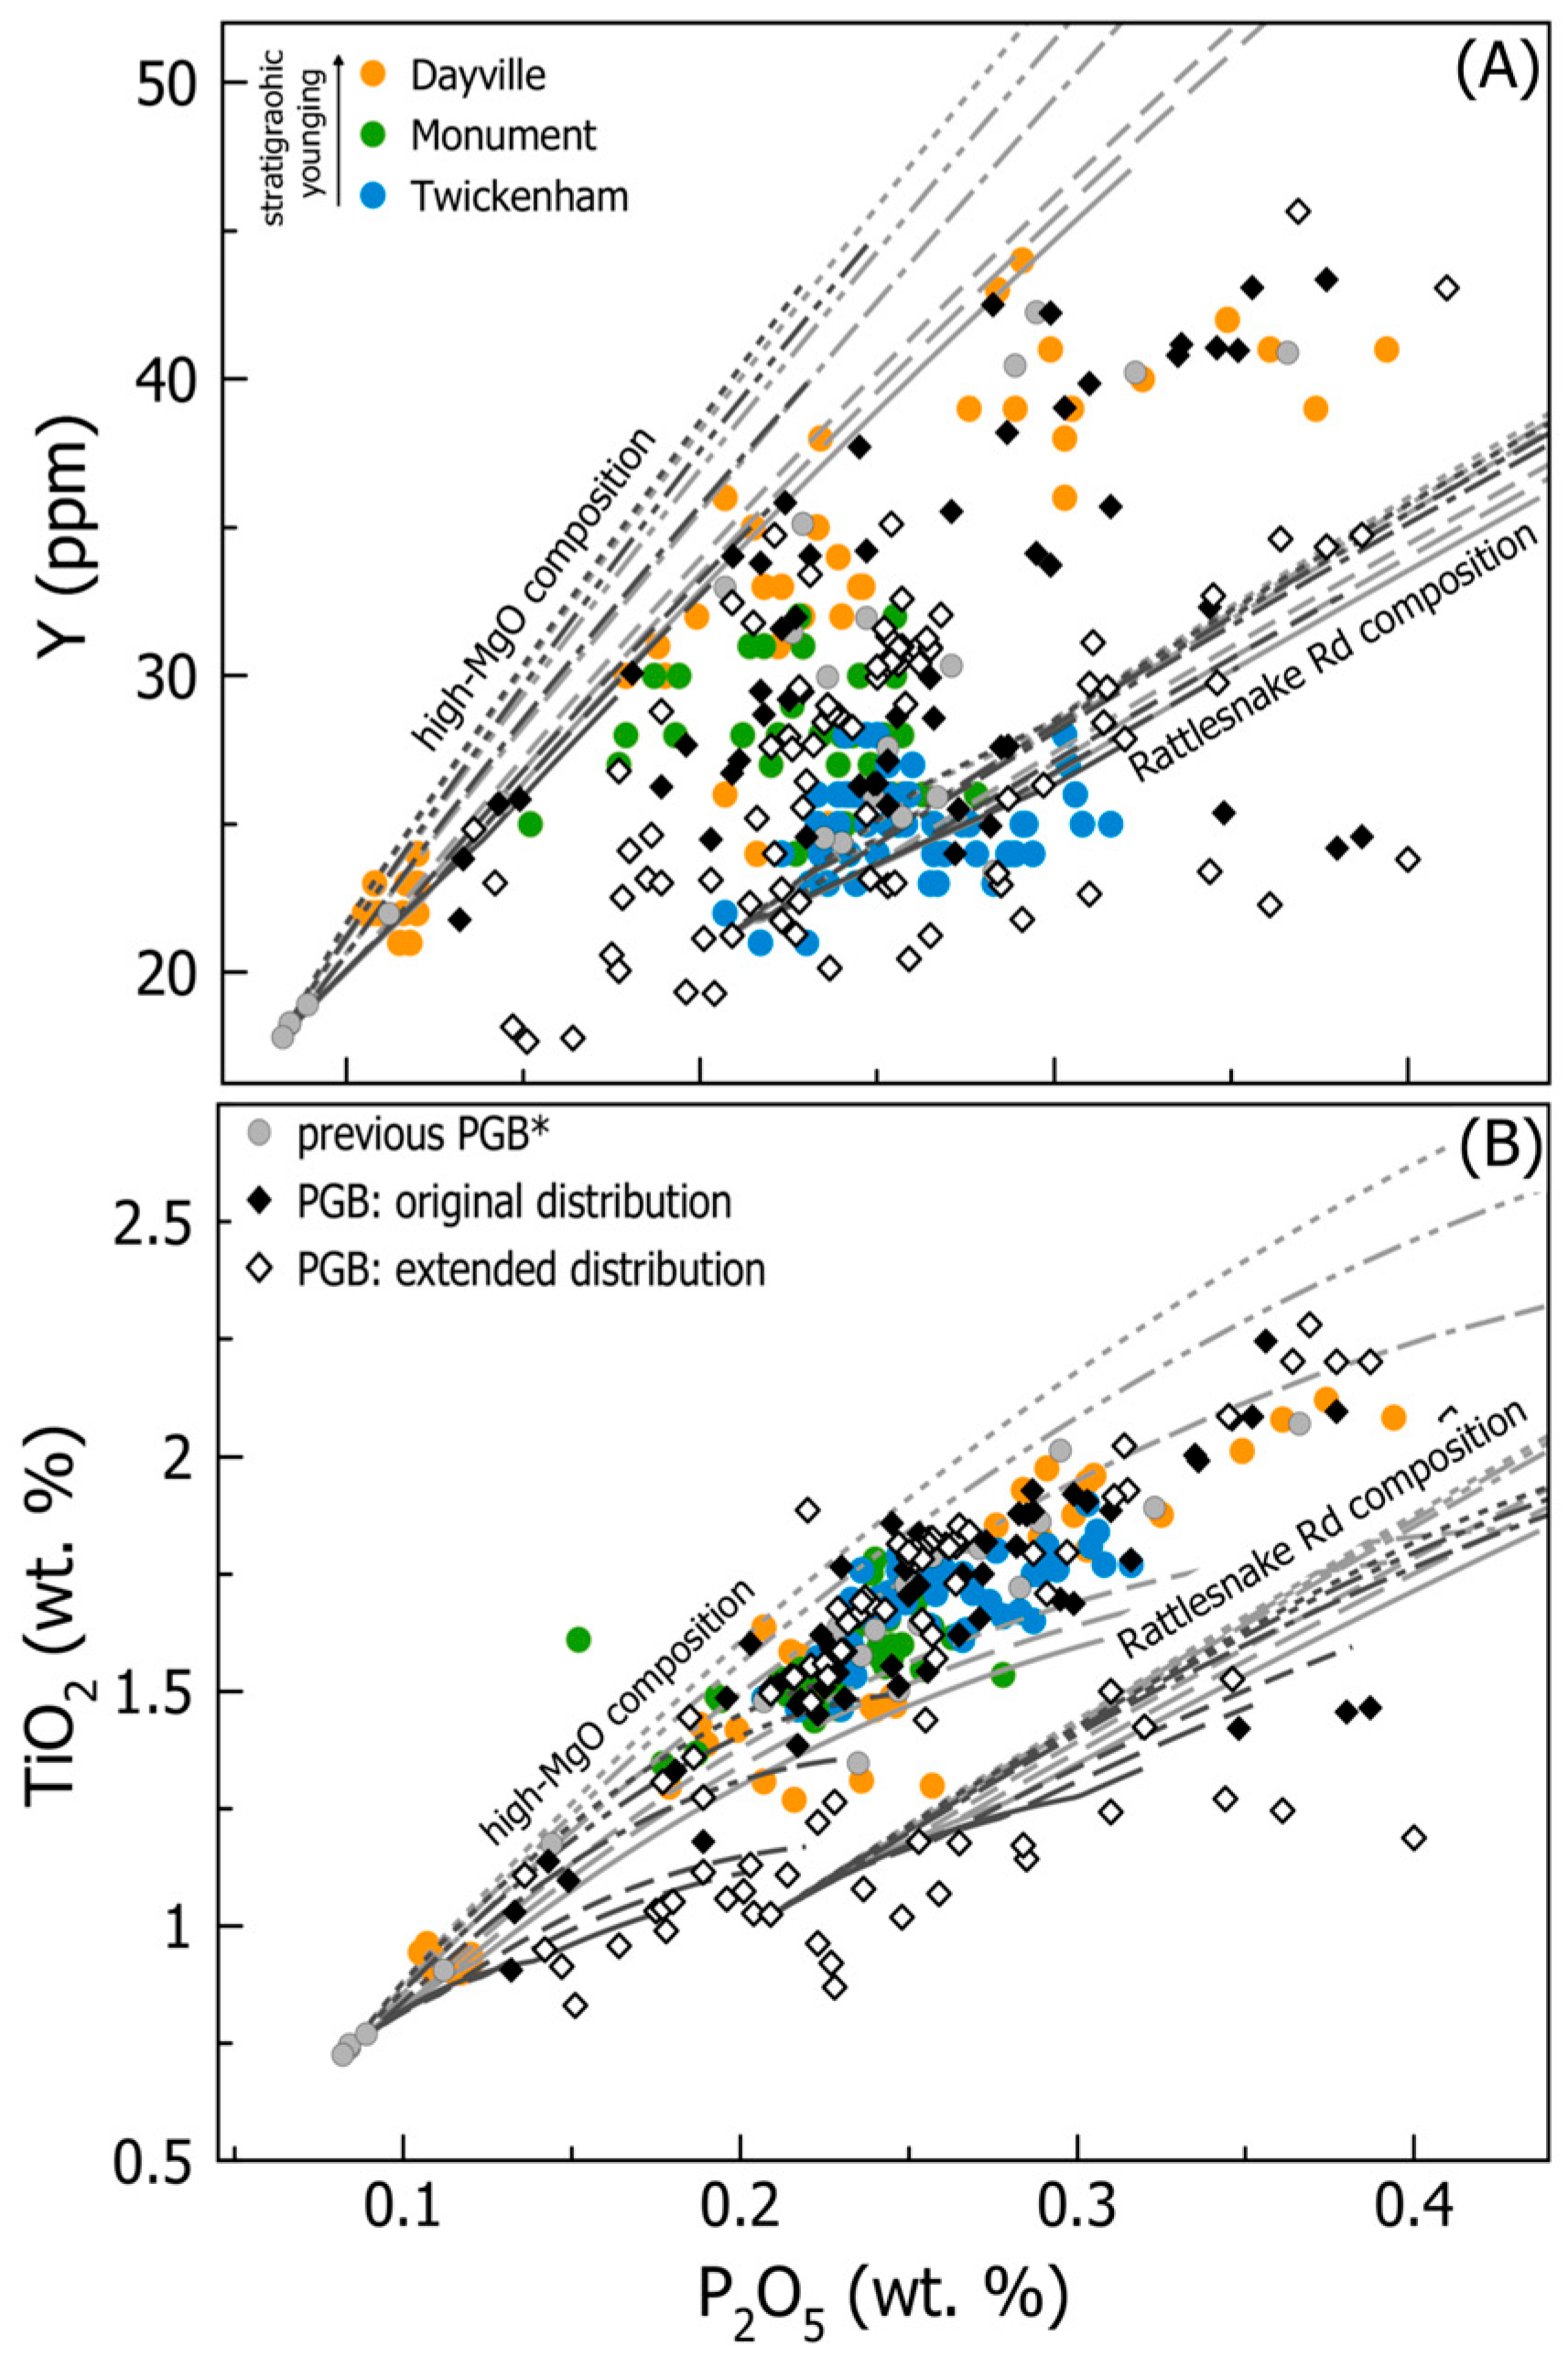
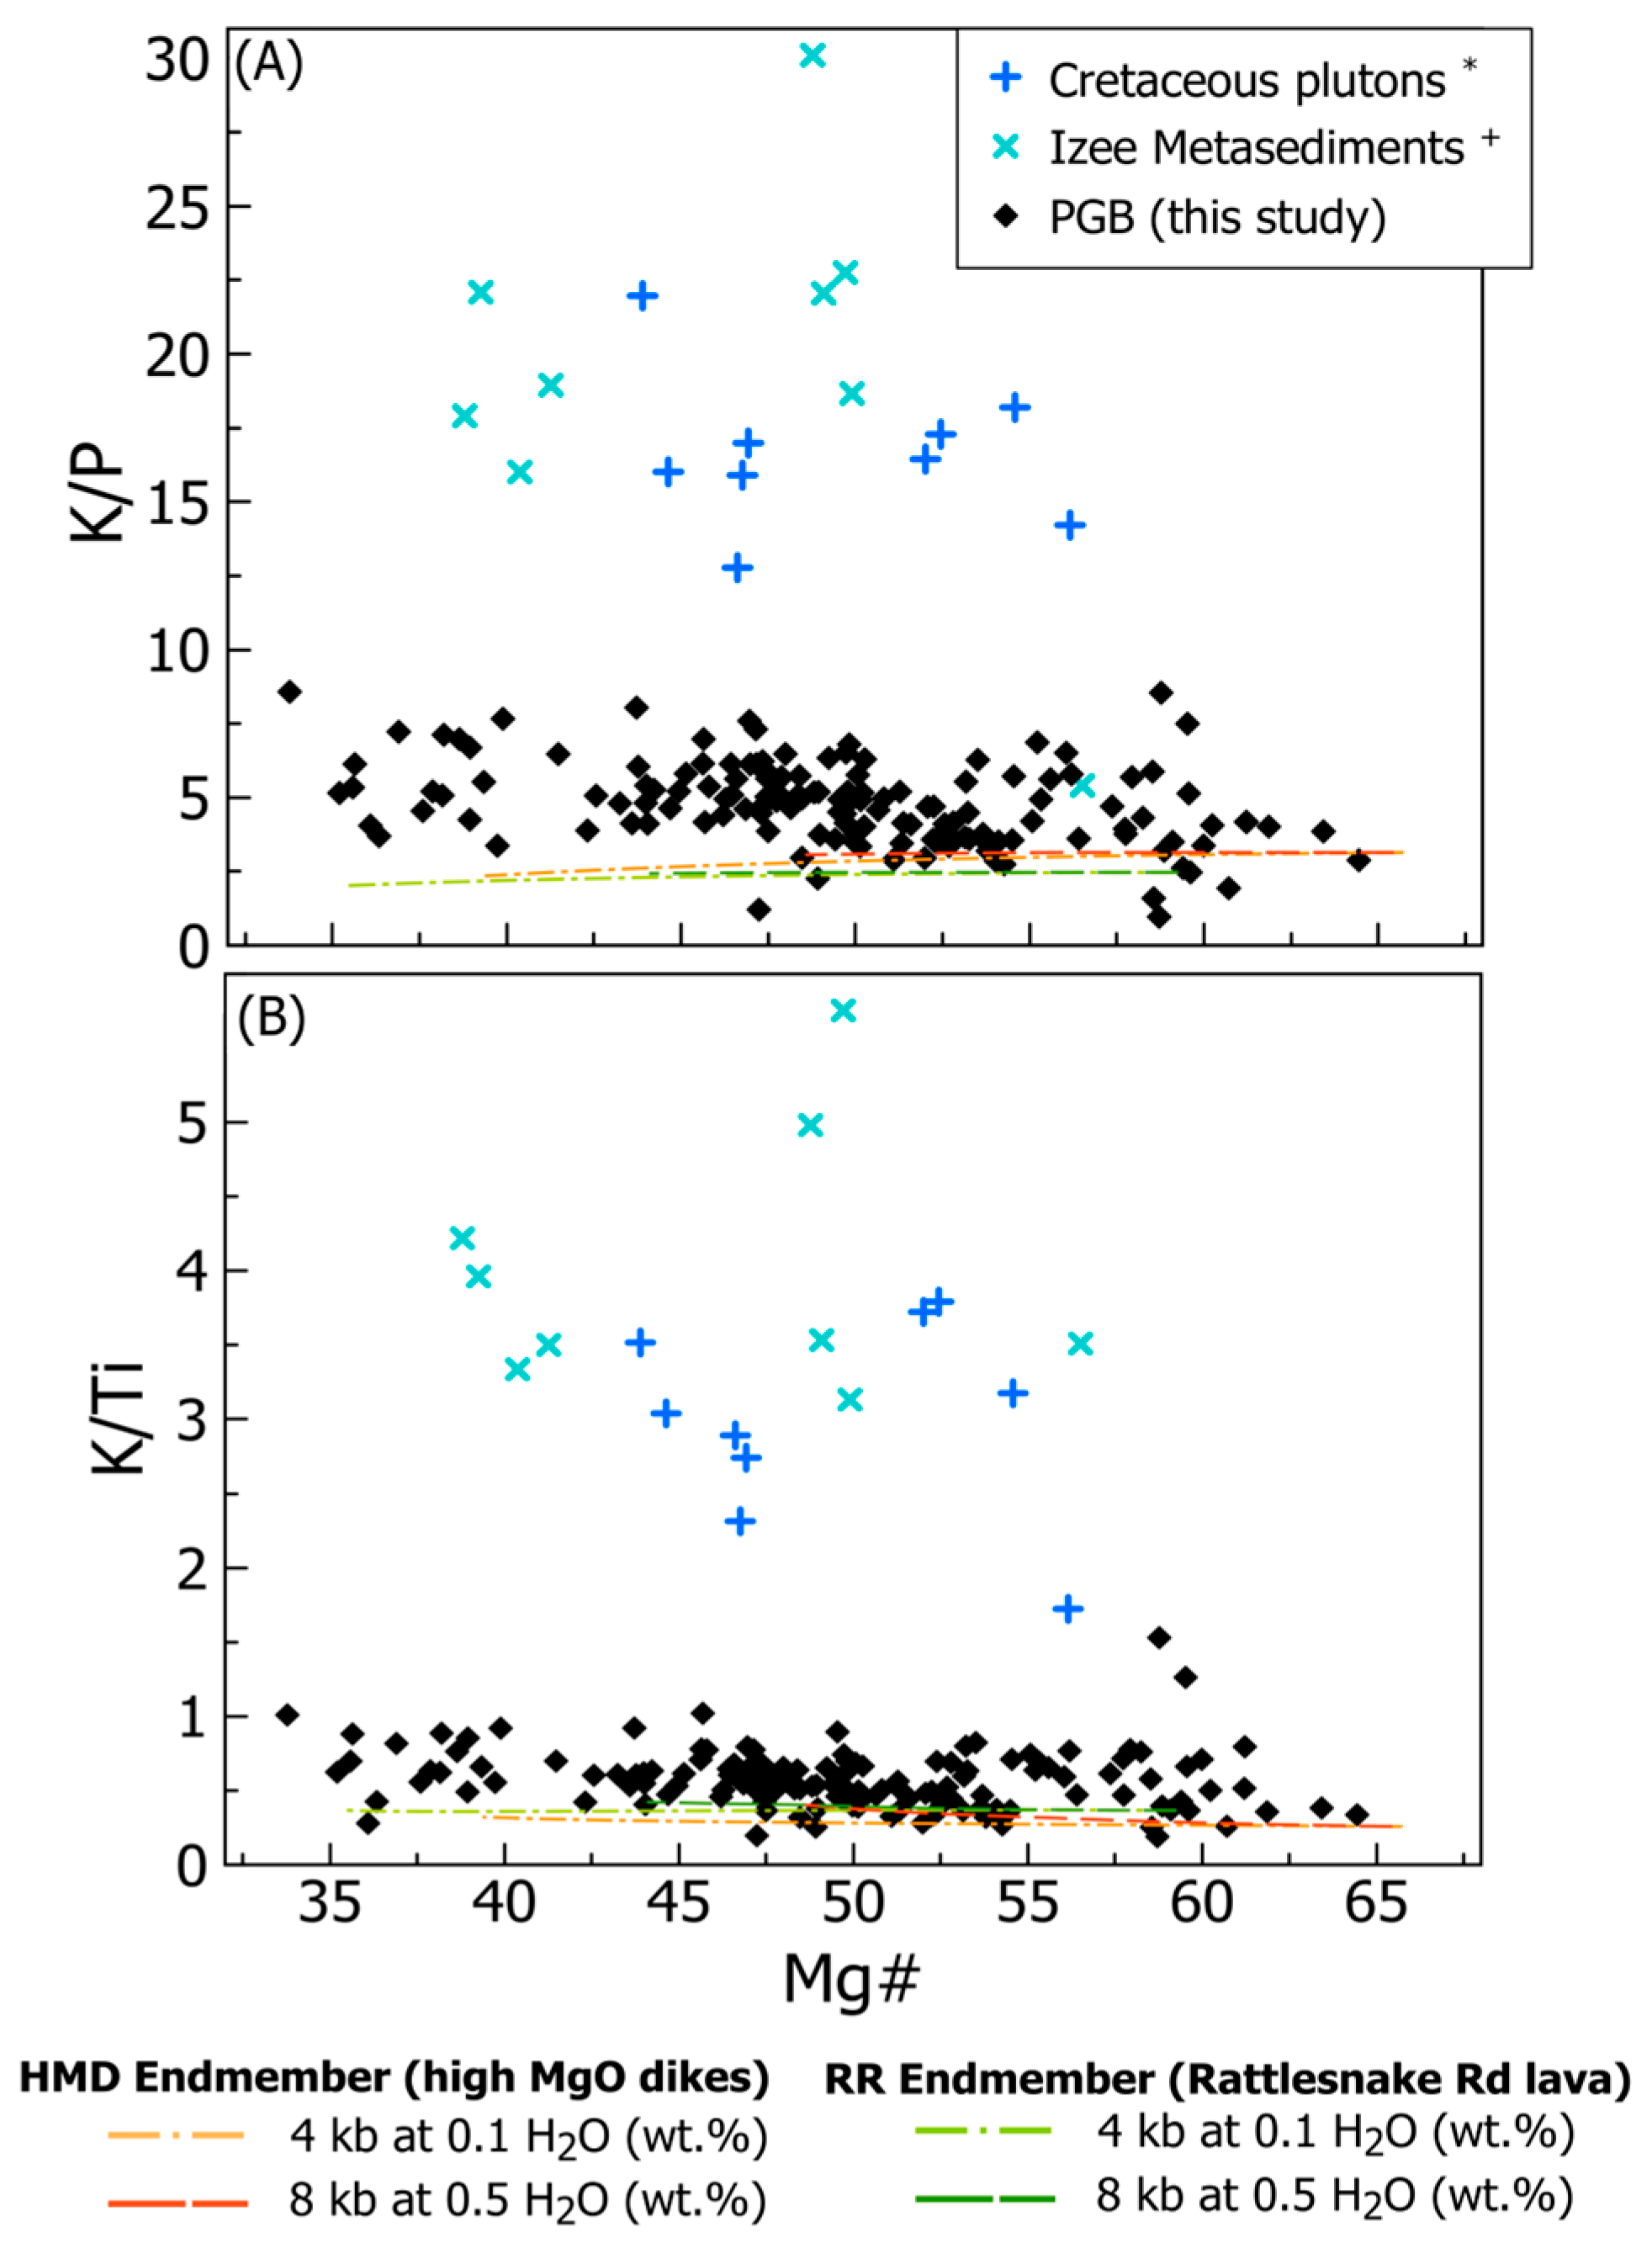
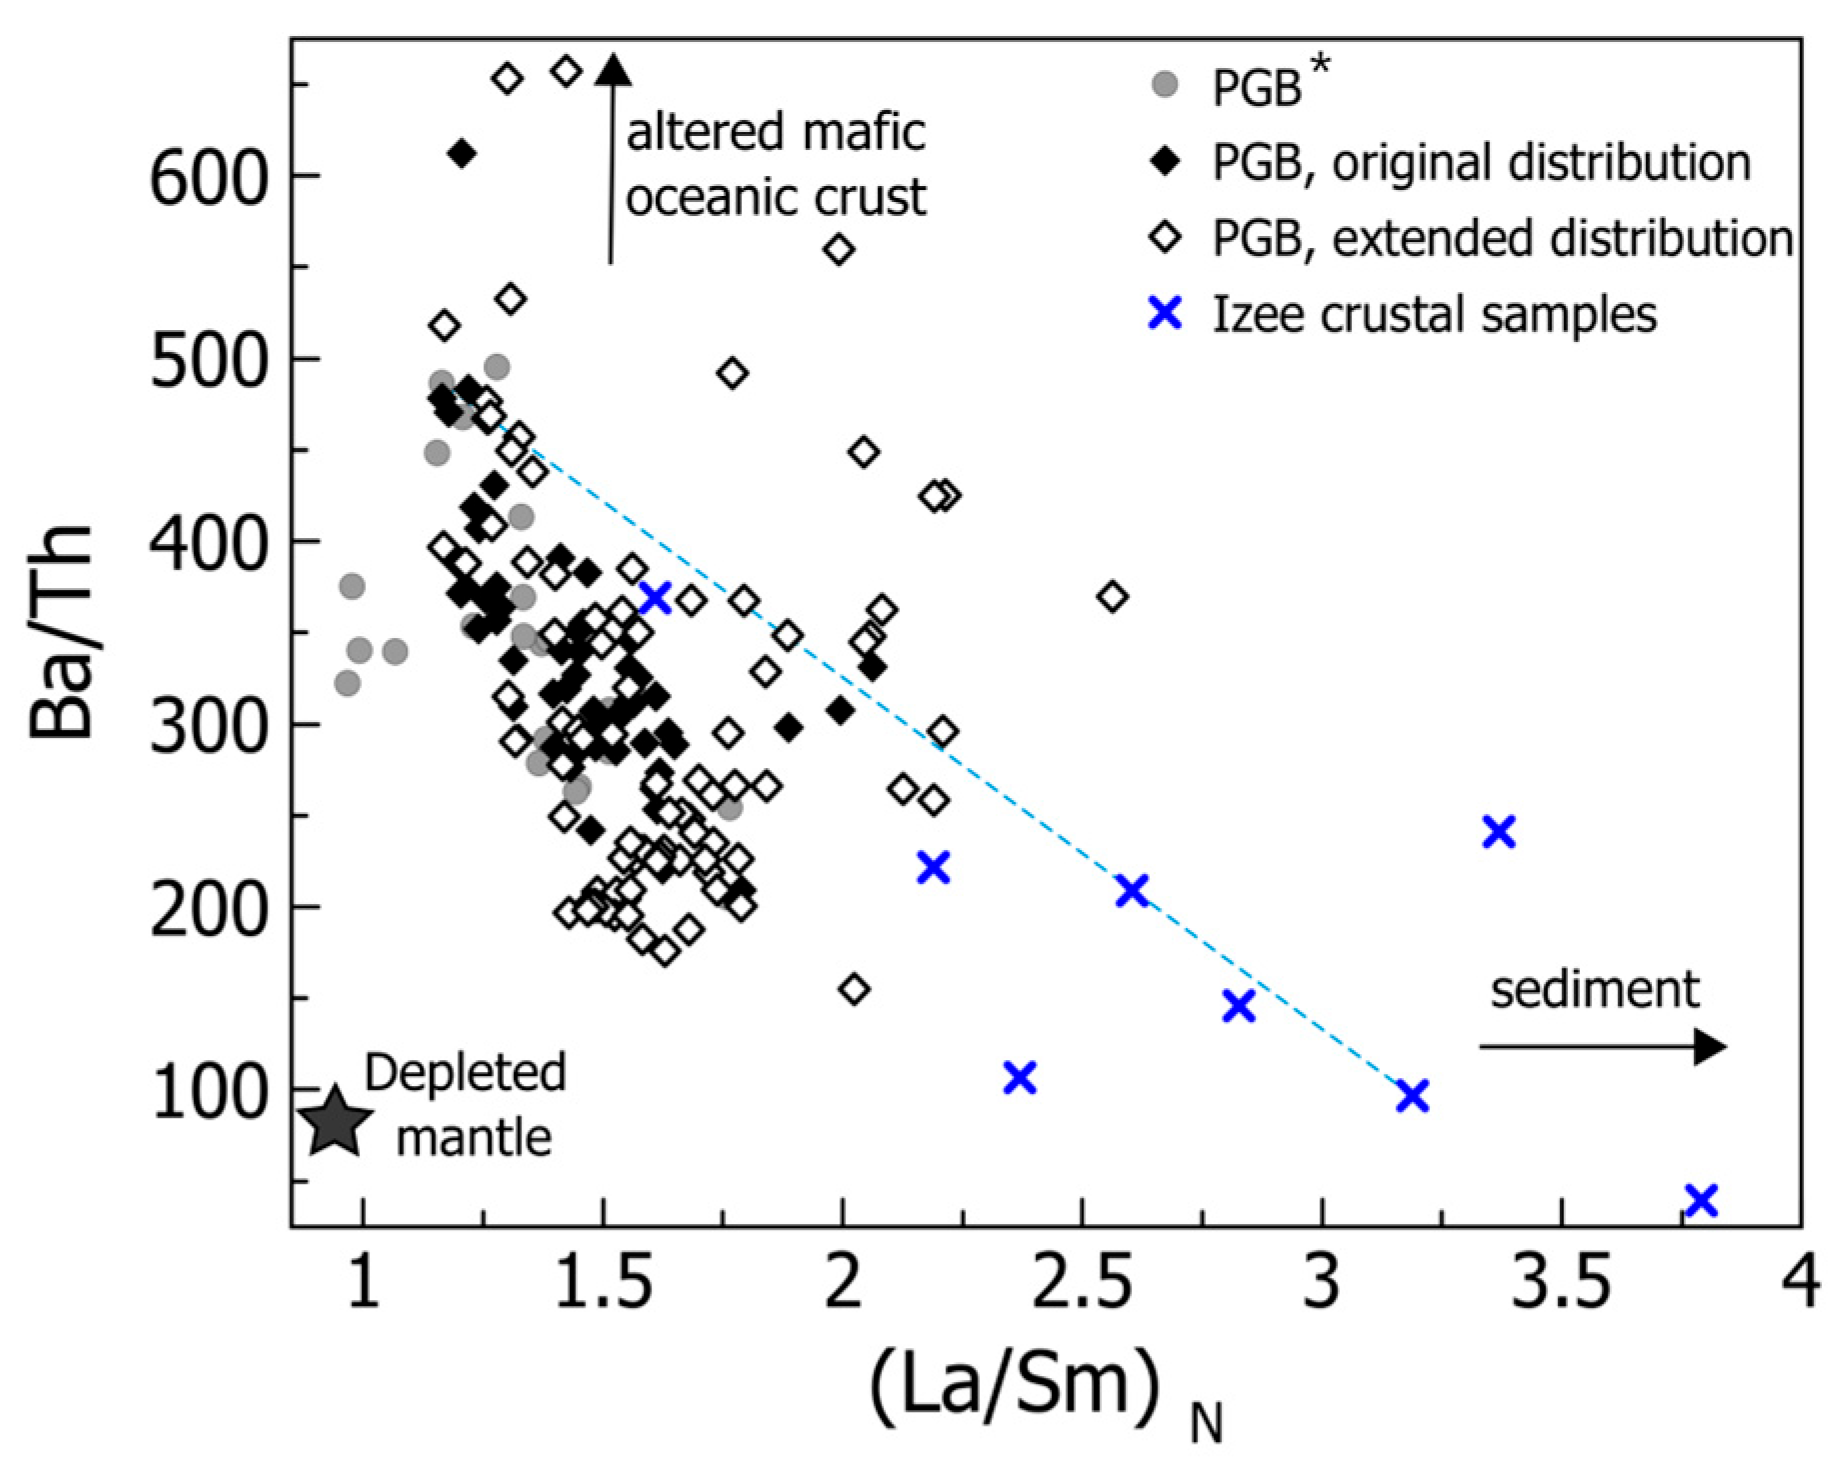
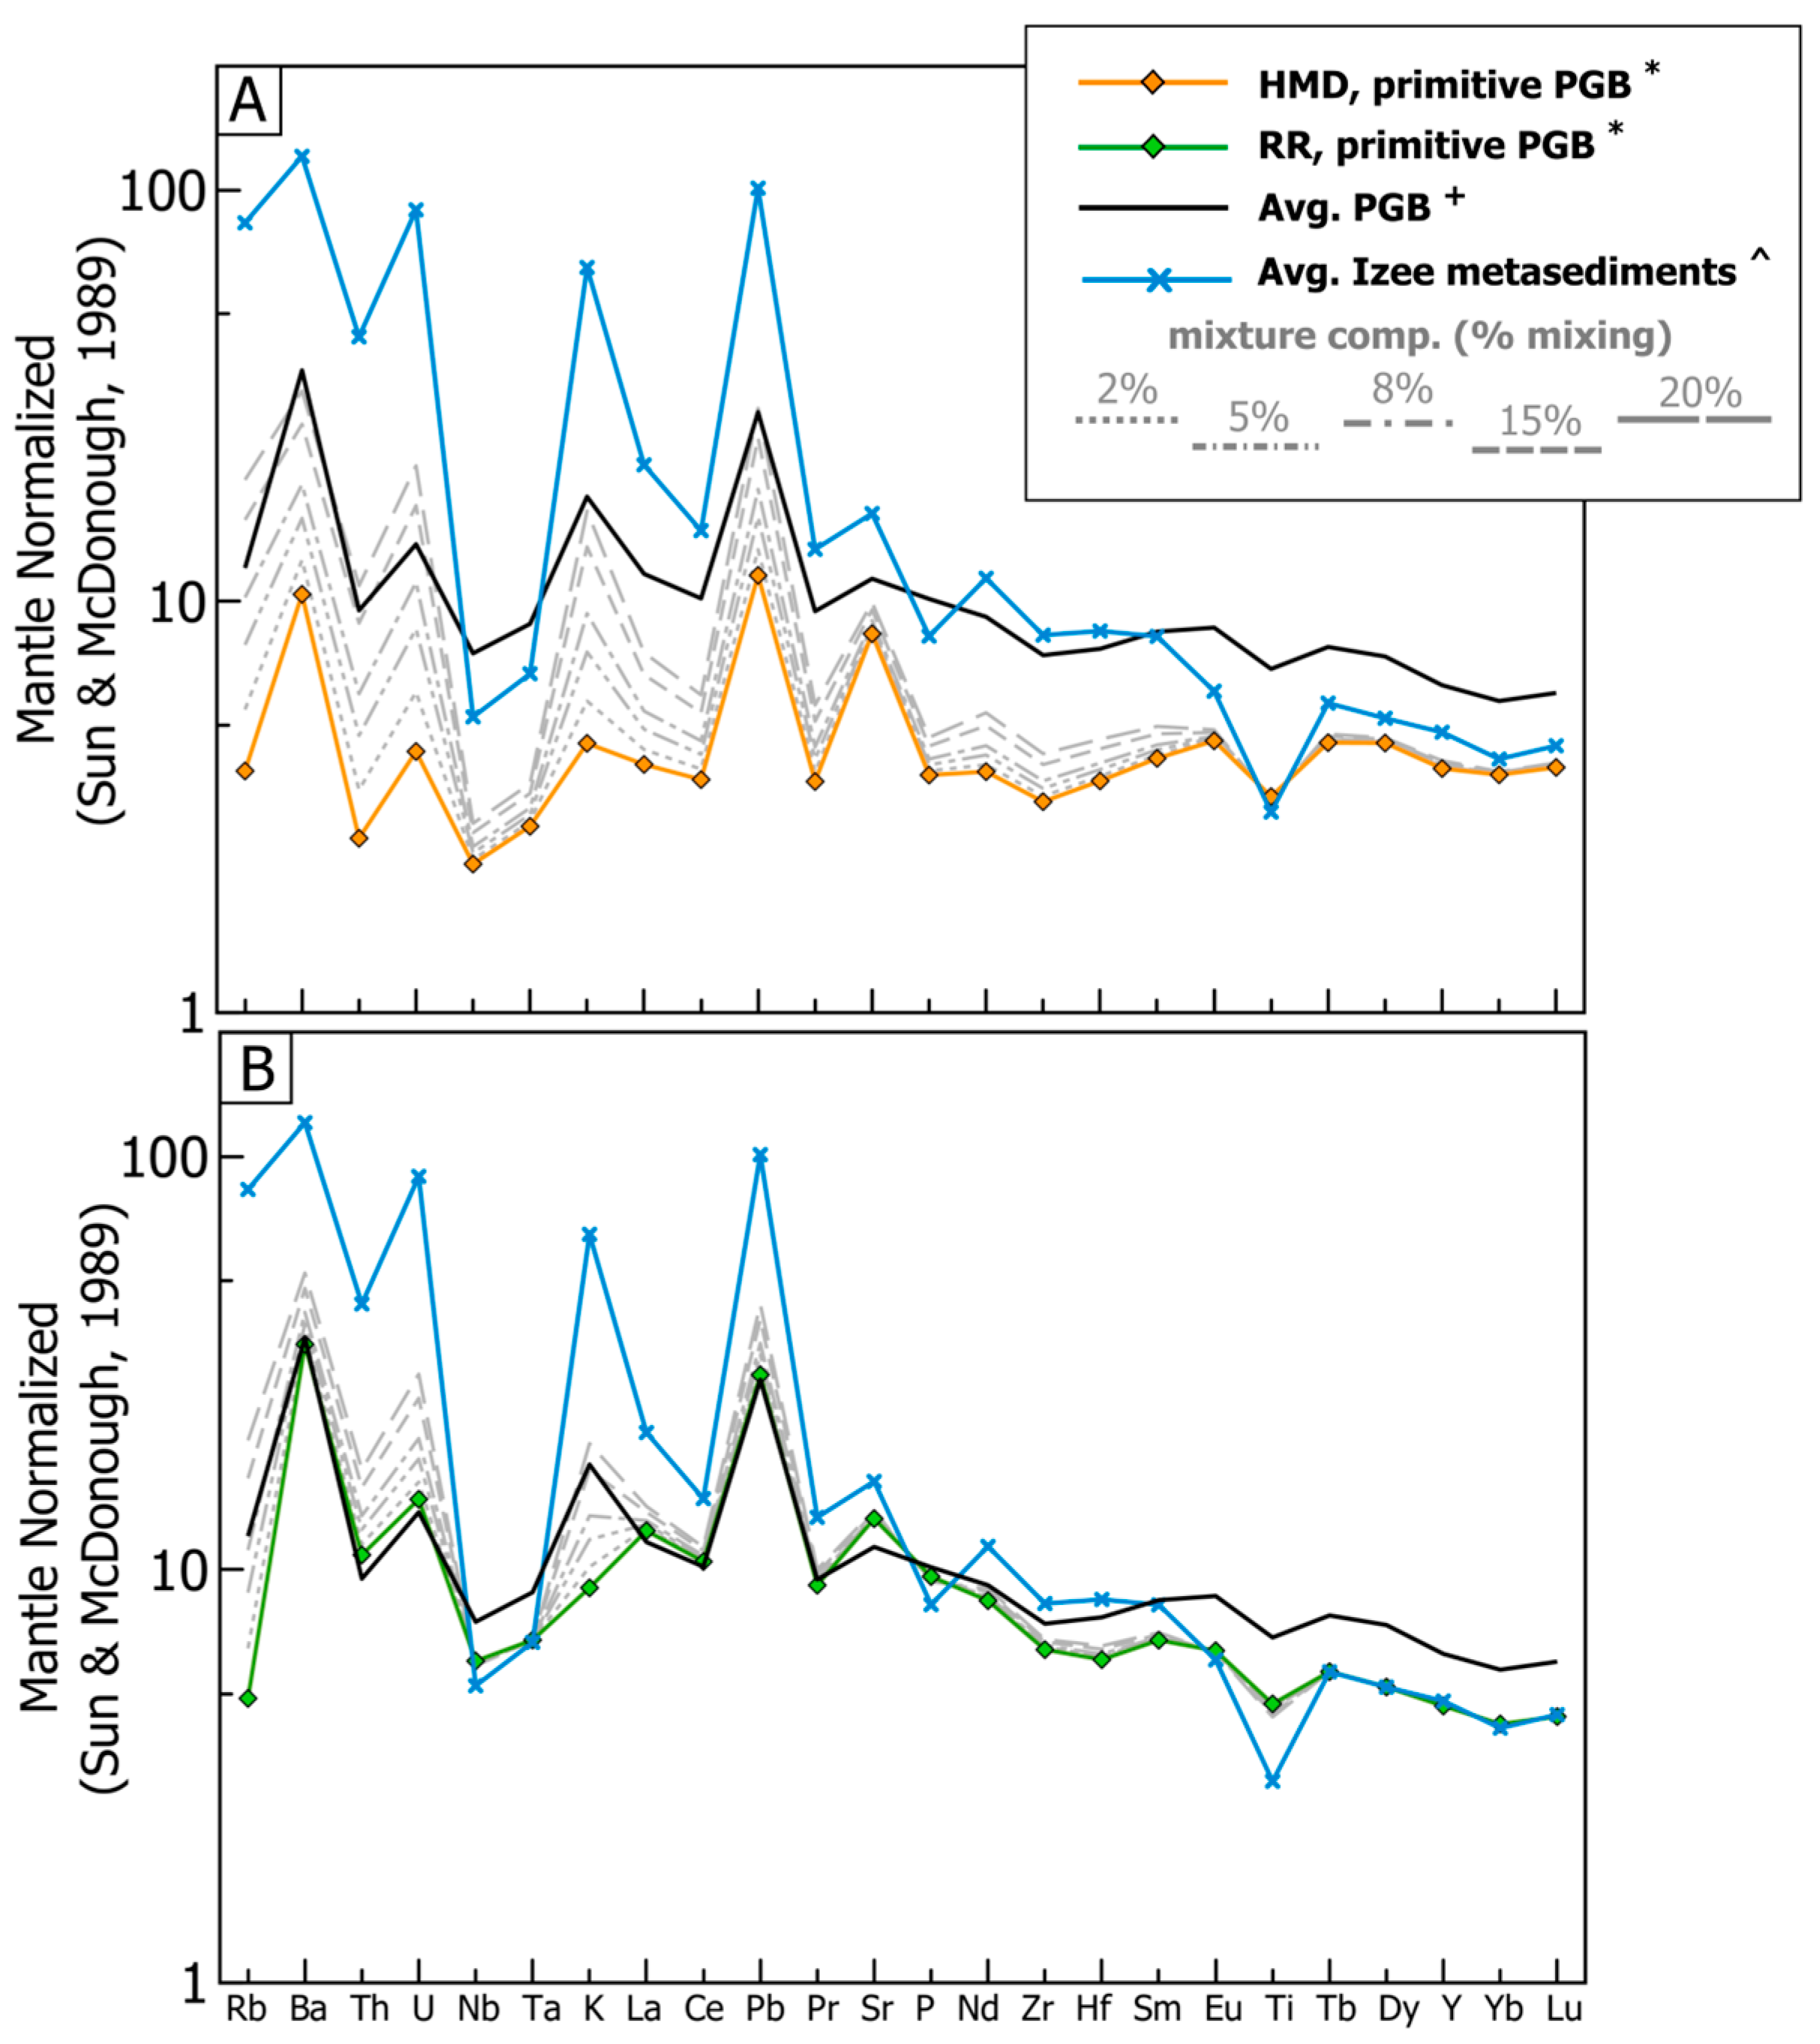
Table 1.
Summary Table of Picture Gorge Basalt Primitive Endmember Samples.
| Sample Name | Mg# | 87Sr/86Sr | 143Nd/144Nd | Age (Ma) |
|---|---|---|---|---|
| high-MgO dike (HMD) Endmember | ||||
| MMB D69A | 65.4 | 0.703400 | 0.512980 | no age data |
| MMB D69B | 64.5 | 0.703066 | 0.513012 | |
| MMB D70A * | 66.1 | 0.703400 | 0.512990 | |
| MMB D70B | 64.1 | - | - | |
| Rattlesnake Road (RR) Endmember | ||||
| DM255B | 57.4 | 0.703757 | 0.512905 | 15.76 |
| CAH15-007 | 64.4 | 0.703691 | 0.512889 | 16.22 |
| CAH17-241A *^ | 59.6 | - | - | 15.5–16.16 |
| CAH17-241B ^ | 59.5 | - | - | |
| CAH17-242A ^ | 57.8 | 0.703565 | 0.512925 | |
| MS-15-18ba ^ | 58.8 | - | - | |
^ Samples collected along Rattlesnake Road (see Figure 1 for location). * Samples used for MELTS modeling.
Table 2.
Sr, Nd, Hf, Pb, and δ18O Isotopic Compositions for the PGB.
| Sample Name | Dike or Lava | 87Sr/86Sr | 143Nd/144Nd | εNd | 176Hf/177Hf | εHf | 208Pb/204Pb | 207Pb/204Pb | 206Pb/204Pb | 208Pb/206Pb | 207Pb/206Pb | 204Pb/206Pb | δ18O | δ18O | Mg# | Age | Error |
|---|---|---|---|---|---|---|---|---|---|---|---|---|---|---|---|---|---|
| GM (‰) | PL (‰) | (Ma) | (±2σ) | ||||||||||||||
| DM255B | Lava | 0.703757 | 0.512905 | 5.4 | 0.283093 | 10.9 | 38.62 | 15.64 | 18.96 | 2.04 | 0.83 | 0.05 | 6.68 | - | 57.4 | 15.76 | 0.11 |
| CAH16-179B | Lava | - | - | - | - | - | - | - | - | - | - | - | - | 5.92 | 53.5 | 16.02 | 0.08 |
| MS-11-6 | Dike | 0.703461 | 0.512974 | 6.7 | - | - | 38.70 | 15.68 | 18.97 | 2.04 | 0.83 | 0.05 | 5.55 | 5.79 | 53.2 | 16.06 | 0.14 |
| CAH16-163 | Lava | 0.703584 | 0.512940 | 6.1 | 0.283093 | 10.9 | - | - | - | - | - | - | 5.99 | 5.83 | 45.8 | 16.18 | 0.05 |
| CAH15-007 | Lava | 0.703691 | 0.512889 | 5.1 | - | - | 38.52 | 15.60 | 18.89 | 2.04 | 0.83 | 0.05 | 6.12 | - | 64.4 | 16.22 | 0.06 |
| MC-76-16 | Lava | - | 0.512957 | 6.4 | 0.283128 | 12.1 | - | - | - | - | - | - | - | 5.76 | 52.2 | 16.23 | 0.09 |
| CAH16-148 | Lava | - | - | - | - | - | - | - | - | - | - | - | - | 5.54 | 49.8 | 16.62 | 0.07 |
| CAH16-138 | Dike | - | 0.512971 | 6.7 | 0.283109 | 11.4 | 38.43 | 15.58 | 18.84 | 2.04 | 0.83 | 0.05 | 5.75 | 5.81 | 50.2 | 16.70 | 0.09 |
| CAH16-065 | Lava | 0.704102 | 0.512861 | 4.5 | 0.283039 | 9.0 | 38.59 | 15.60 | 18.98 | 2.03 | 0.82 | 0.05 | - | - | 44.2 | 16.72 | 0.03 |
| CAH15-023 | Dike | 0.703494 | 0.512964 | 6.5 | 0.283100 | 11.1 | 38.40 | 15.57 | 18.79 | 2.04 | 0.83 | 0.05 | 5.45 | - | 56.1 | 16.88 | 0.06 |
| CAH16-174A | Lava | 0.703528 | 0.512964 | 6.5 | 0.283111 | 11.5 | 38.52 | 15.60 | 18.85 | 2.04 | 0.83 | 0.05 | 5.52 | - | 49.7 | 16.96 | 0.07 |
| CAH17-200 | Lava | - | 0.512956 | 6.4 | 0.283126 | 12.1 | - | - | - | - | - | - | 5.75 | 5.72 | 52.6 | 17.02 | 0.03 |
| CAH17-245 | Lava | 0.703573 | 0.512941 | 6.1 | 0.283097 | 11.0 | 38.49 | 15.58 | 18.87 | 2.04 | 0.83 | 0.05 | 5.78 | - | 47.3 | 17.14 | 0.04 |
| CAH17-222A | Lava | 0.703412 | 0.512994 | 7.1 | 0.283126 | 12.1 | 38.52 | 15.61 | 18.86 | 2.04 | 0.83 | 0.05 | 5.28 | 5.32 | 52.1 | 17.23 | 0.04 |
| CAH16-073A | Lava | 0.703969 | 0.512791 | 3.1 | - | - | 38.93 | 15.73 | 19.14 | 2.03 | 0.82 | 0.05 | - | - | 55.2 | - | - |
| CAH16-171A | Lava | 0.703597 | 0.512930 | 5.9 | 0.283071 | 10.1 | 38.51 | 15.60 | 18.86 | 2.04 | 0.83 | 0.05 | - | - | 52.7 | - | - |
| CAH16-195 | Dike | 0.703428 | 0.512972 | 6.7 | 0.283109 | 11.4 | 38.44 | 15.57 | 18.84 | 2.04 | 0.83 | 0.05 | - | - | 50.8 | - | - |
| CAH17-242A | Lava | 0.703565 | 0.512925 | 5.8 | 0.283084 | 10.6 | - | - | - | - | - | - | - | - | 57.8 | - | - |
| CAH16-140 | Dike | - | - | - | - | - | - | - | - | - | - | - | - | 5.9 | 55.6 | - | - |
GM: groundmass. PL: plagioclase.
Disclaimer/Publisher’s Note: The statements, opinions and data contained in all publications are solely those of the individual author(s) and contributor(s) and not of MDPI and/or the editor(s). MDPI and/or the editor(s) disclaim responsibility for any injury to people or property resulting from any ideas, methods, instructions or products referred to in the content. |
© 2024 by the authors. Licensee MDPI, Basel, Switzerland. This article is an open access article distributed under the terms and conditions of the Creative Commons Attribution (CC BY) license (https://creativecommons.org/licenses/by/4.0/).
Share and Cite
MDPI and ACS Style
Cahoon, E.B.; Streck, M.J.; Carlson, R.W.; Bindeman, I.N. Mantle Sources and Geochemical Evolution of the Picture Gorge Basalt, Columbia River Basalt Group. Minerals 2024, 14, 440. https://doi.org/10.3390/min14050440
AMA Style
Cahoon EB, Streck MJ, Carlson RW, Bindeman IN. Mantle Sources and Geochemical Evolution of the Picture Gorge Basalt, Columbia River Basalt Group. Minerals. 2024; 14(5):440. https://doi.org/10.3390/min14050440
Chicago/Turabian StyleCahoon, Emily B., Martin J. Streck, Richard W. Carlson, and Ilya N. Bindeman. 2024. "Mantle Sources and Geochemical Evolution of the Picture Gorge Basalt, Columbia River Basalt Group" Minerals 14, no. 5: 440. https://doi.org/10.3390/min14050440
Note that from the first issue of 2016, this journal uses article numbers instead of page numbers. See further details here.