1. Introduction
Montmorillonites are clay minerals commonly found as components in soils in temperate climates. They are formed as result of the weathering of volcanic glass abundant in ash-beds and basic rocks like basalts. These mineral materials are useful for dam bed impregnation for their ability to improve water retention properties and as drilling mud to seal the cut, thus preventing fluid loss. They are also popular stabilizing additives in engine oils, cosmetics, pharmaceutical and chemical industries.
The unusual behavior of montmorillonites, the ability to change volume when wet (swelling) or dried (shrinking), make soil containing montmorillonites very unstable and hazardous for the building industry, due to foundation movement and poor slope stability. These macroscopic properties are dominated by the structural arrangement of its finest fraction. In this work, we demonstrate utilization of a nanotomography technique called Transmission X-ray Microscopy (TXM) based on a synchrotron photon source. This technique enables the study, in three dimensions, of montmorillonite gel arranged in a voluminous cellular structure and its modification by adding Al13 Keggin. This is the macro-molecule carrying high positive charge [Al13(O)4(OH)24(H2O)12]7+ and may cause reduce of negatively charged on the clay particle surface. All these observations were conducted in the natural aqueous environment.
The first experimental confirmation of montmorillonite clay gel structure was obtained with the advent of Transmission Electron Microscopy (TEM) and Scanning Electron Microscopy (SEM). Rosenquist [
1] published a micrograph confirming the existence of the “card house” structure. Bowles [
2] and O’Brien [
3] confirmed the presence of the honeycomb microstructure in wet clay sediments. Grabowska-Olszewska [
4] using cryo-SEM investigations published a large amount of microstructural data from 86 studied samples of wet clay rocks combined with compositional and physical properties. Given the size of clay constituents, SEM was found to be the tool of choice used by scientists studying the microstructure of smectitic clays [
5,
6]. Sample preparation methods available for such investigations, like partial freeze drying, critical point-drying and cryo-fixation, have been found to introduce many artifacts, especially when applied to the study of montmorillonite structure. These artifacts result as a consequence of the low thermal conductivity of water and ice, which only allows a slow rate of heat withdrawal from the specimen. Thus, the size of the gelled montmorillonite sample must be small enough to freeze quickly limiting the inevitable damage associated with the sampling process.
Different microscopy techniques were developed during recent decades. The development of a high-resolution transmission X-ray microscope [
7,
8,
9] (TXM), has improved since the availability of synchrotron photon sources. In the soft X-ray range (100 eV–1 keV), a zone plate based TXM [
10,
11] has achieved a spatial resolution of 15 nm, which is a big challenge in the hard x-ray region due to difficulties in zone plate manufacturing. In this article, we are basing our research on the microscope constructed in the National Synchrotron Radiation Research Canter (NSRRC) and described by Yin and colleges for the first time in 2006 [
12]. Attwood [
13] also described this method of nanotomography that was used in present work. In this method we combine two–dimensional images (2D) taken at different incident X-ray angles, allowing internal structures to be discerned with a spatial resolution of around 60 nanometers. Clay aggregates we have already studied by the use of different X-ray microscopy methods such as those described in [
14] but this particular method using TXM with nanotomography was pioneering in the clay suspension nano-structure investigation by Zbik
et al., since the first publication [
15].
The great advantage of the TXM tomography is the possibility for observing clay microstructure in a water environment, artifact free and without sample pre-treatment. This method has been tested [
16] in the study of kaolinite aggregate microstructure modified by layered double hydroxide addition in the aqueous suspension. This method may be useful in characterization of selected samples in the field of mineral processing in order to better understand the way modified aggregates change their structure. In present work synchrotron based TXM nanotomography method is shown in microstructure characterization of modified clay montmorillonite suspensions.
2. Results and Discussion
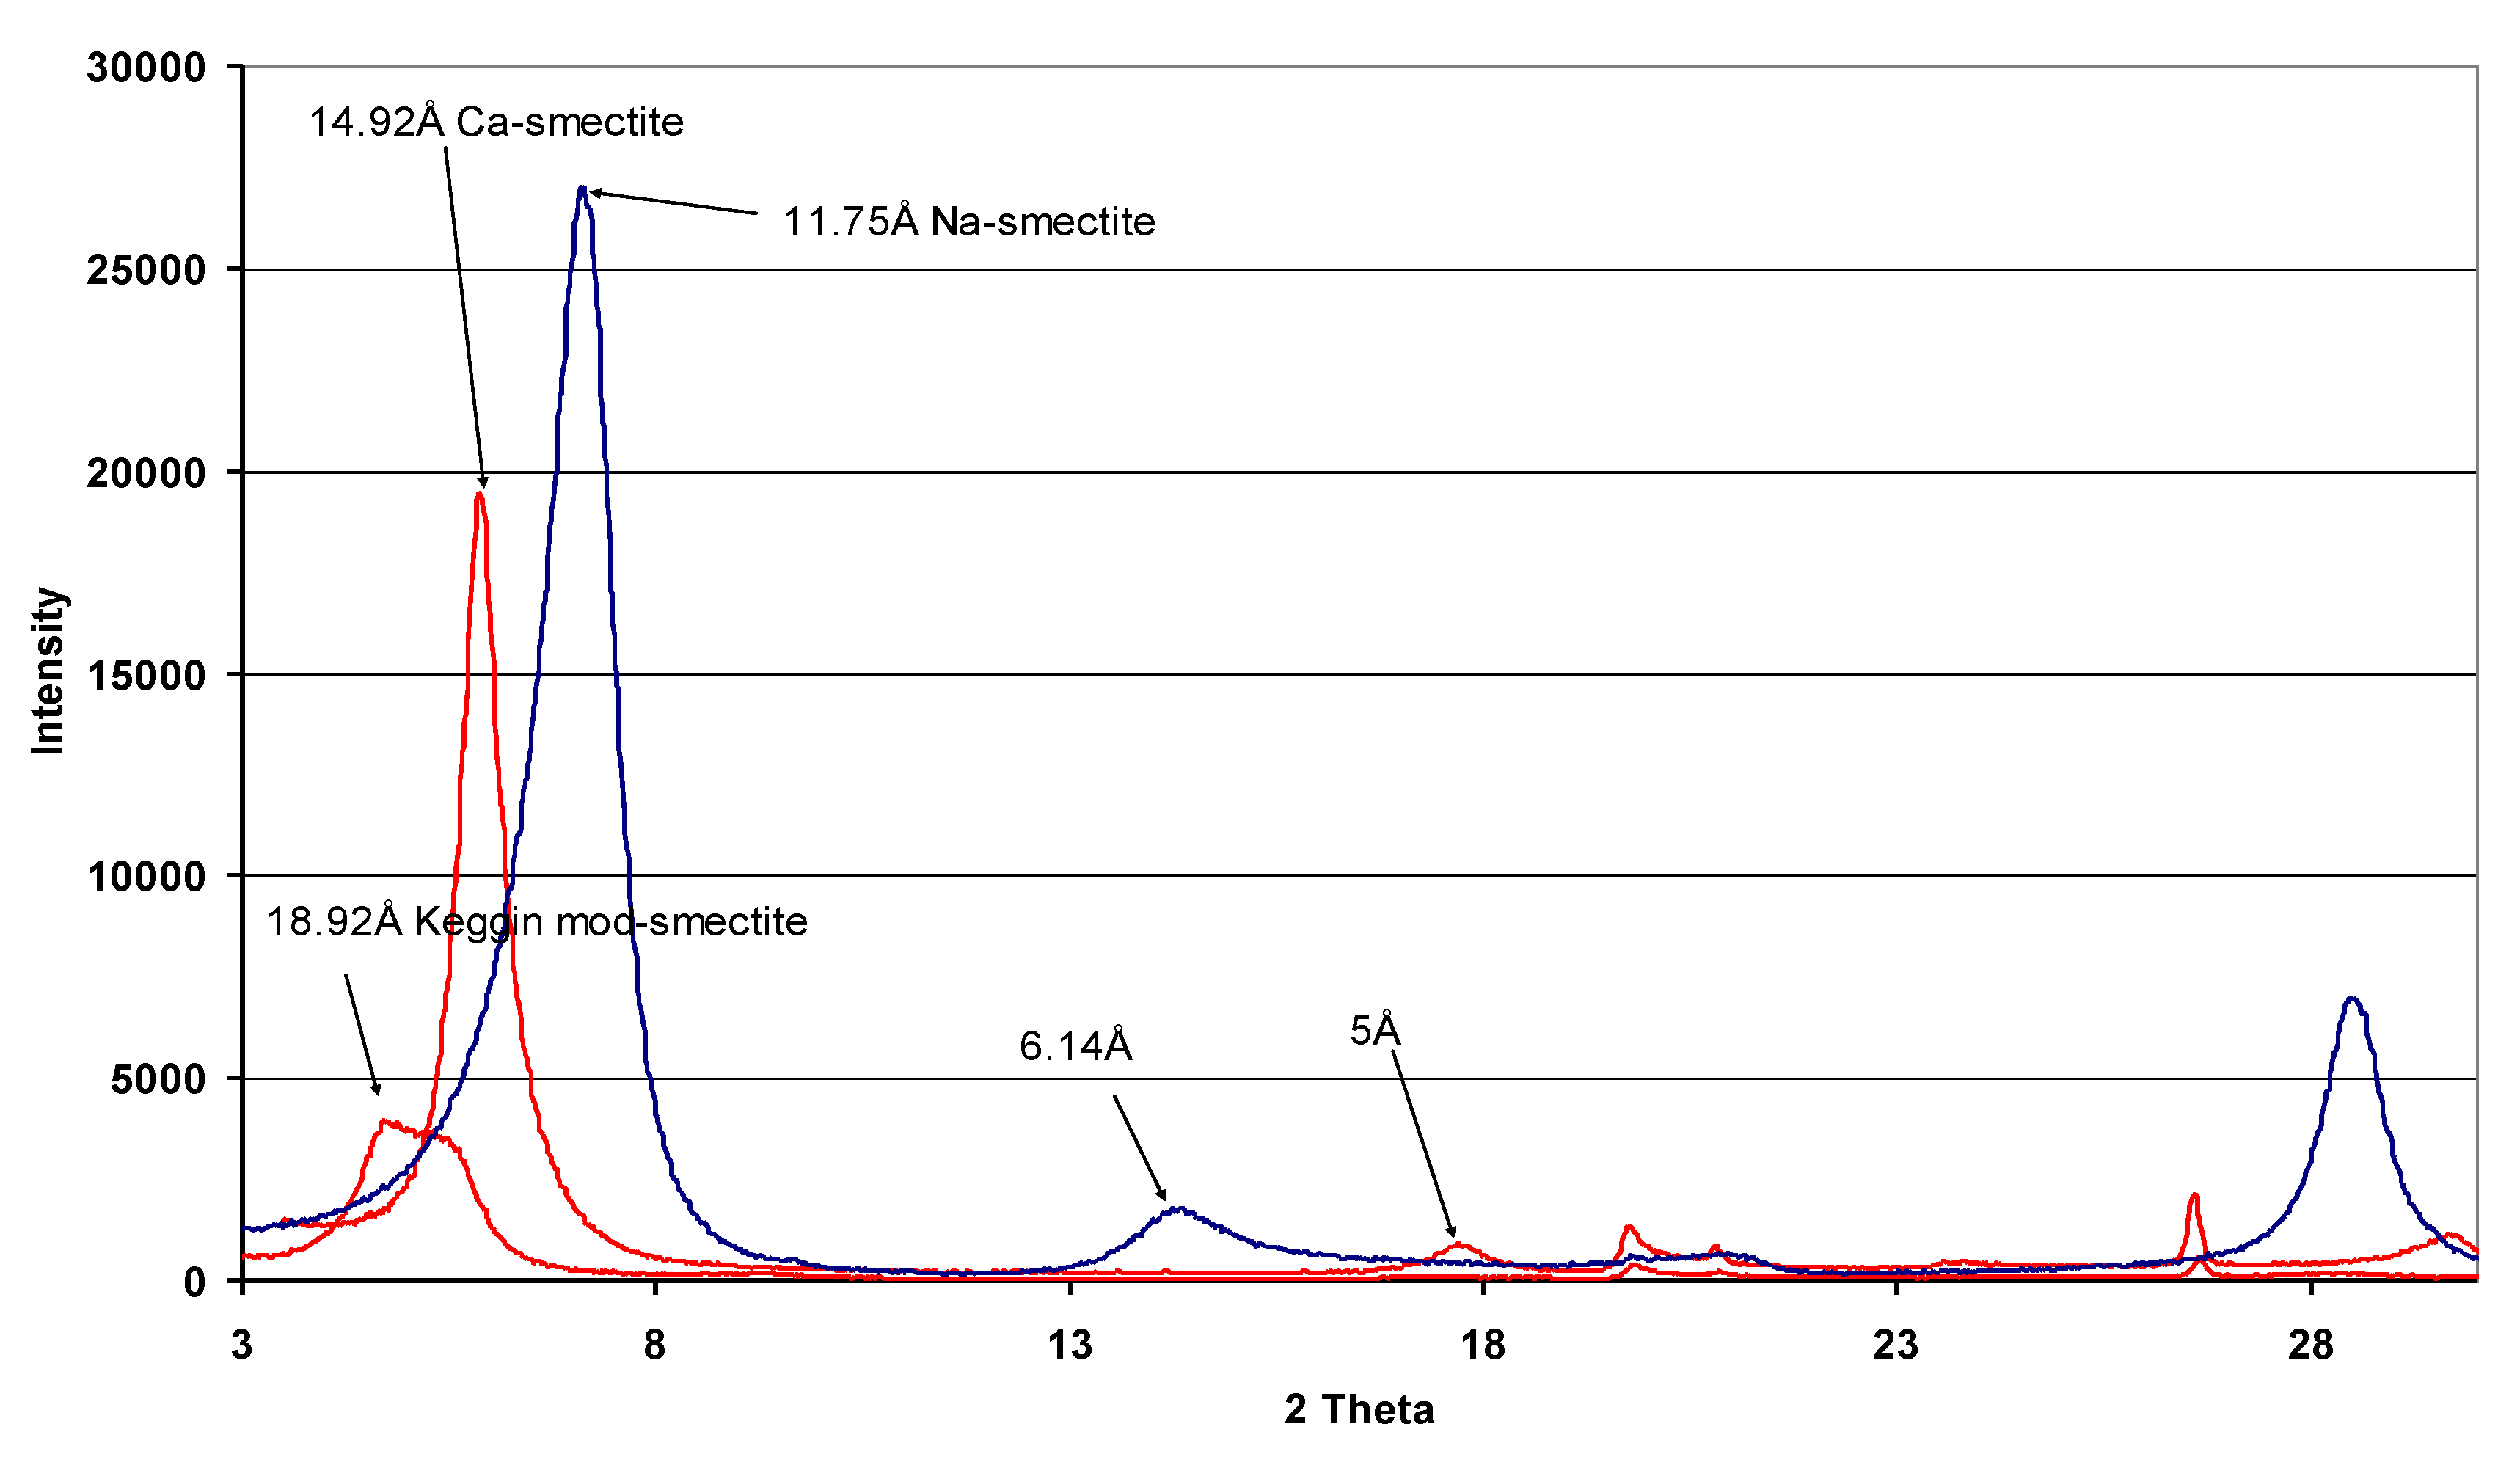
The Keggin ion exchanged SWy-2 sample along with Na
+ and Ca
2+ modified montmorillonite were subjected to X-ray diffraction to ensure complete exchange as shown in
Figure 1. The major peak in montmorillonite modified by Na
+, Ca
2+ and Keggin Al
137+ cations, shifts towards larger (
d) spaces from 11.75 Å, 14.92 Å to 18.92 Å, respectively.
Figure 1.
XRD pattern from SWy-2 montmorillonite sample modified using Na+, Ca2+ and Keggin Al137+ shows significant shift in the major peak from 001 distance between montmorillonite layers. (Theta is in degrees and intensity in count per second).
Figure 1.
XRD pattern from SWy-2 montmorillonite sample modified using Na+, Ca2+ and Keggin Al137+ shows significant shift in the major peak from 001 distance between montmorillonite layers. (Theta is in degrees and intensity in count per second).
The montmorillonite zeta potential for this montmorillonite as a function of pH as shown in [
17] does not display an isoelectric point (iep). For all pH values investigated, the zeta potential of montmorillonite is negative and remains unchanged in magnitude with pH. The pH-independent zeta potential profile results from the dominance of the basal plane or face over the pH-dependent edge surface groups. The basal plane of montmorillonite is negatively charged, due to isomorphoric substitution within the basal surface siloxane layer [
18,
19]. Because of the weak interlayer bonding, montmorillonite naturally disperses in water and stays in suspension or coagulates weakly forming a gel. In the dilute salt solutions where the individual sheets of SWy-2 montmorillonite are highly flexible and interact with each other by a combination of edge-edge (E-E) weak Van der Waals attraction and basal plane (F-F) repulsion building in result an expanded and extremely voluminous cellular network. Earlier works, such as M’Ewen and Pratt 1957 [
20], predicted that Na-montmorillonite diluted suspension gels in form of the three-dimensional structure, based on a system of cross-linked ribbons. Similar structure is presented our TXM 3D anaglyphic micrograph in
Figure 2a. In such an extended cellular network flexible montmorillonite sheets encapsulate water within cellular voids up to 0.5–2 µm in dimension. Geometry of this network can be easily modified by shear, resulting in highly oriented cells, which may evolve. This flocked cellular structure may fill the entire vessel or be fragmented to individual flocks, which differ in size. When structured clay spans all volume that it is placed in, the suspension is gelled; there is no free settling in this system and further compacting may evolve slowly by structural re-arrangement of the entire network [
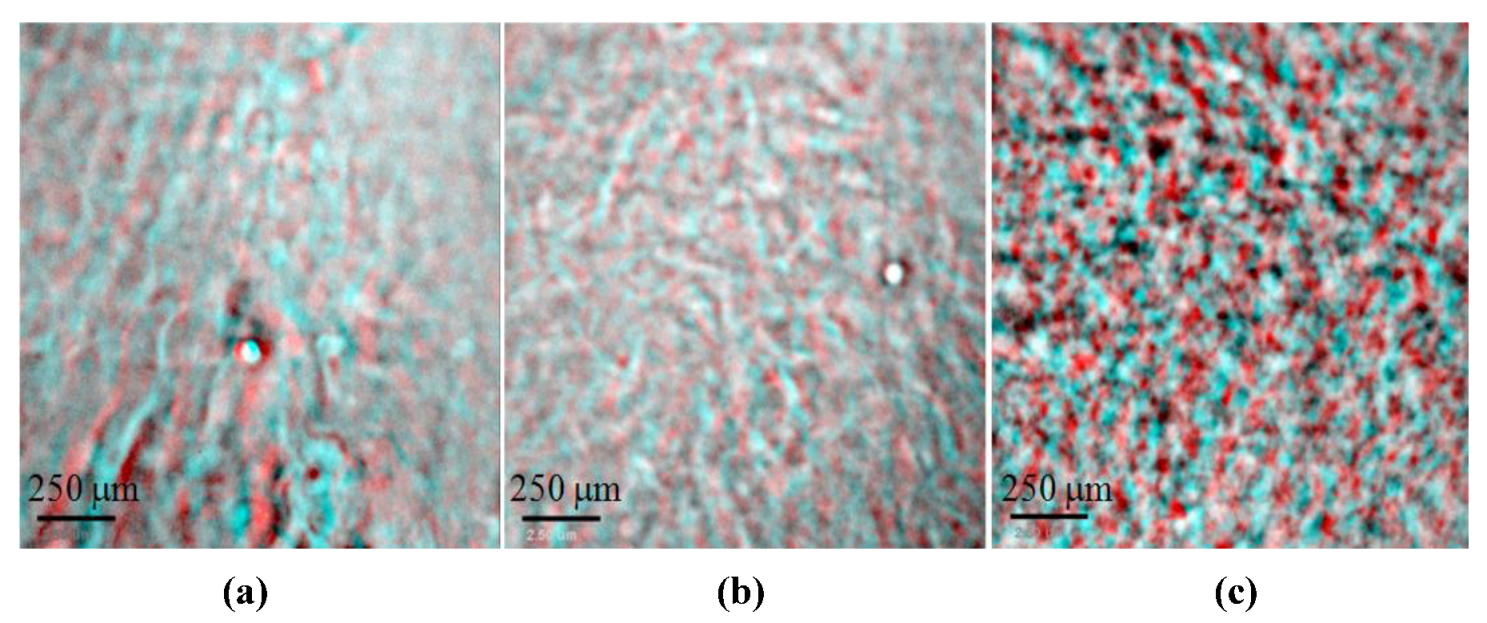
17]. The slightest water movement influences shear, which promotes orientation in the entire network, as weak electrostatic forces cannot resist. In our view this ribbon-like structure may result from higher E-E Van der Waals attraction as compared with edge to face (E-F) forces. As the ribbons flop then around, areas of basal surface become attached where the surface charge density is slightly higher. Anaglyphic pictures were obtained from 2D images of different incident angle and were produced using standard Photoshop software. This type of display was chosen to display stereoscopic view of studied structures as the best way to display it in the 2D publication. Micrographs have to be viewed using red and blue glasses.
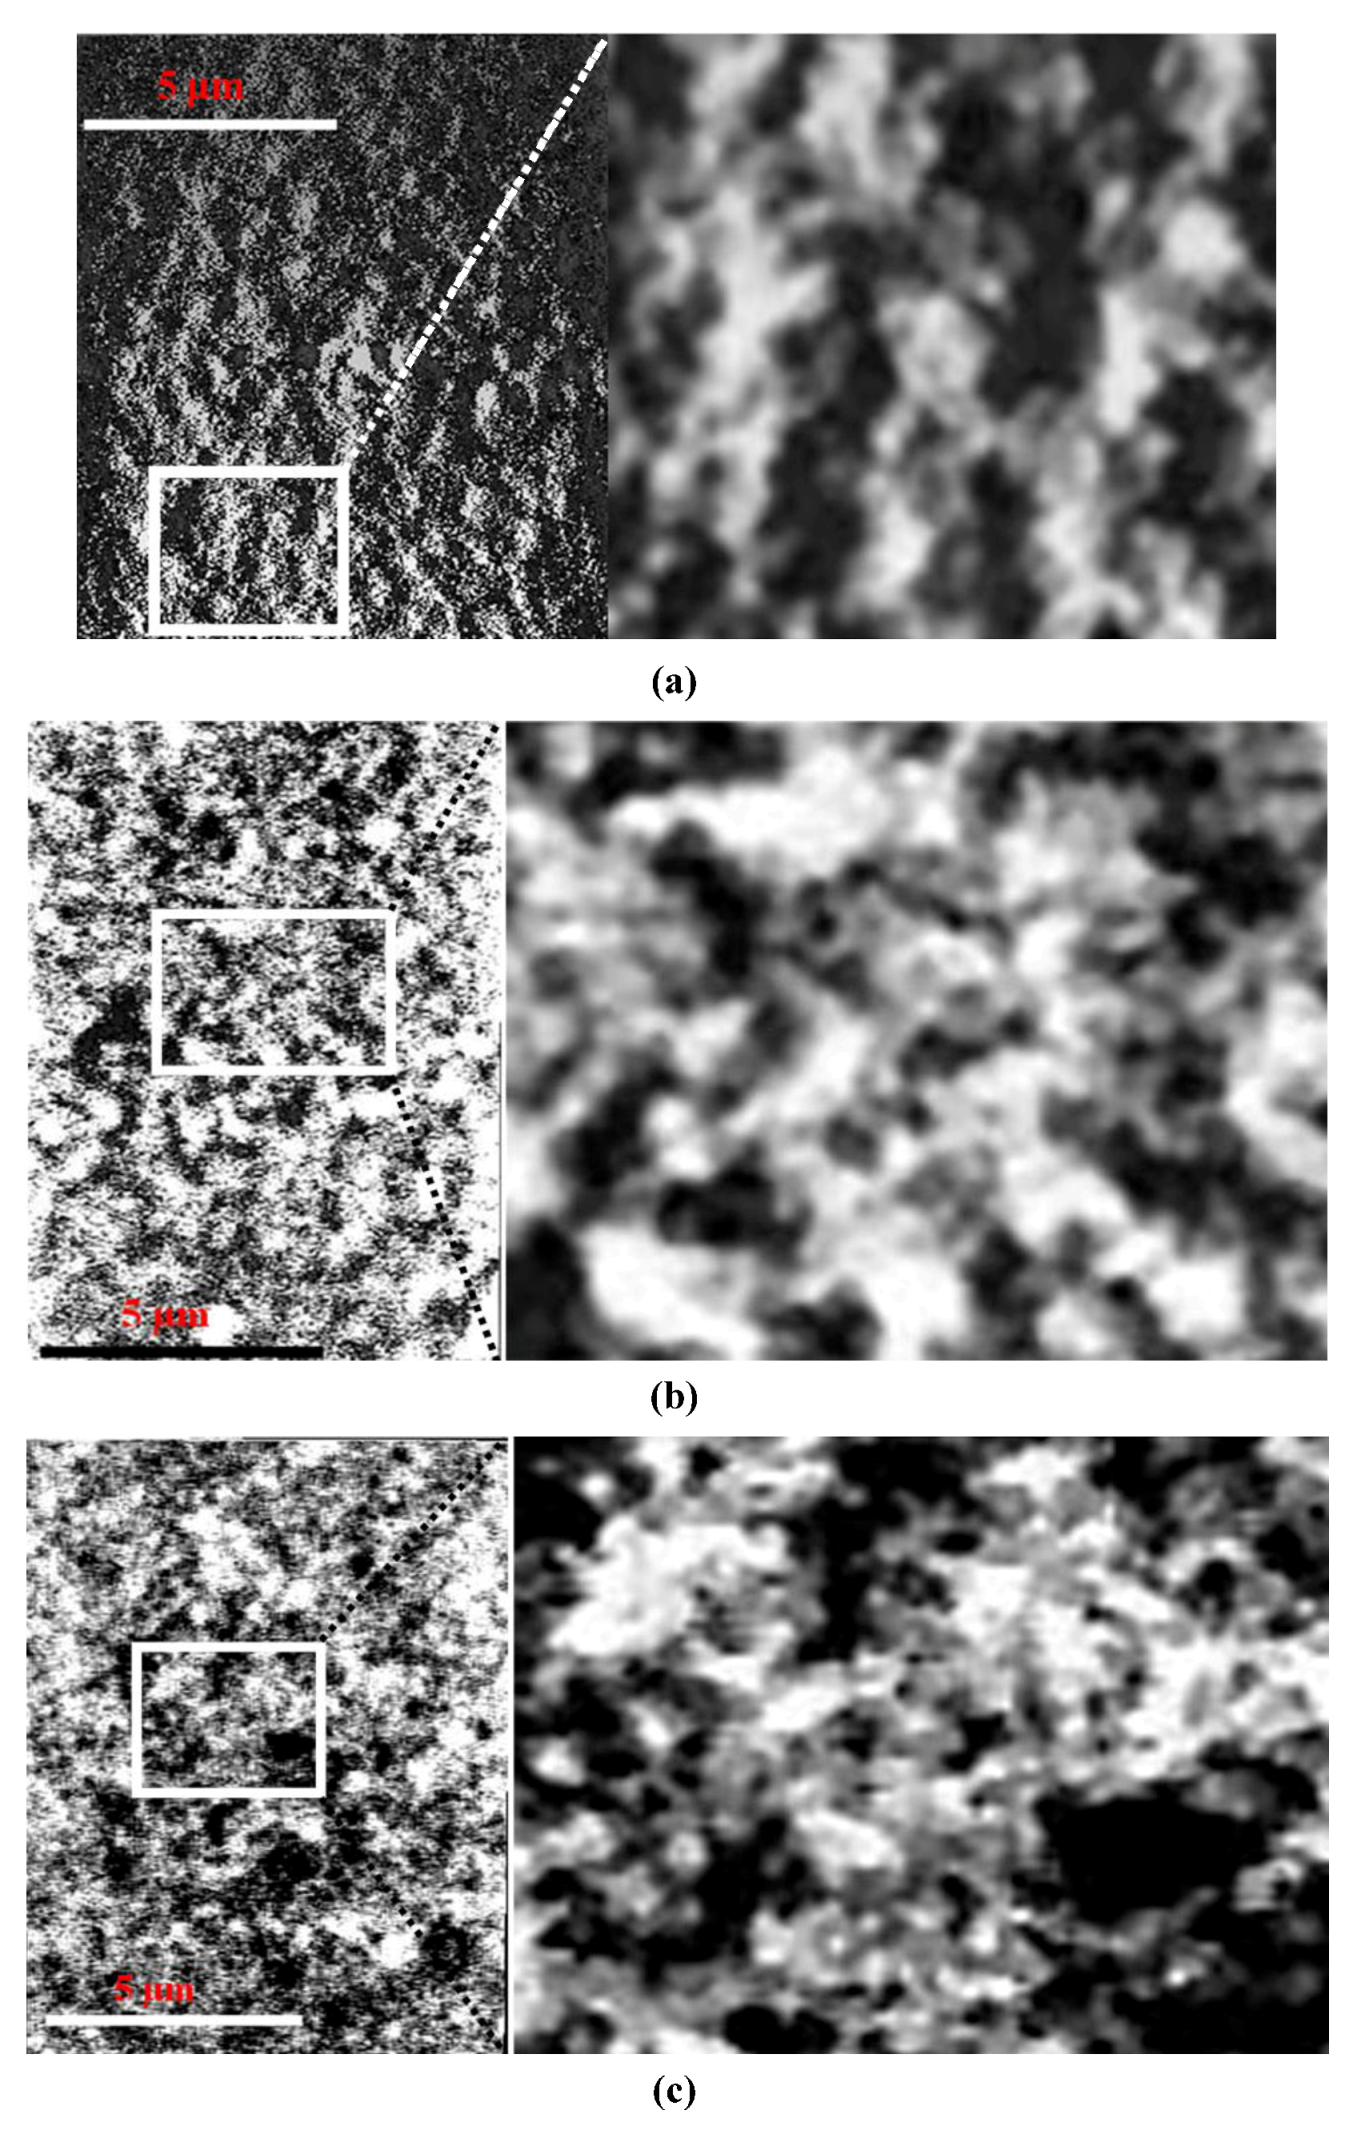
Oriented structure of montmorillonite sheets resemble domains consisting of individual sheets and/or stacked on top of each other and forming laminar elongated cellular network. Such ribbon-like structures can be seen in 3D, TXM tomographic reconstruction, which can be studied and measurements were carried out on moving images using the Amira software. Furthermore, these images can be displayed in form of an anaglyphic micrograph as shown in
Figure 2. In the micrograph (
Figure 2a), elongated montmorillonite sheets in Na-montmorillonite forms a cellular network 0.5 to 2 µm in diameter (average 940 nm). In the 3D, TXM anaglyphic micrograph shown in
Figure 2b, Ca-montmorillonite gel cellular structure displays much smaller and mostly randomly oriented cells with dimensions 300–600 nm. The average distances measured between montmorillonite sheets was around 450 nm, which is less than half of the cells dimension measured in Na-montmorillonite.
Most dramatic structural changes were observed after SWy-2 was treated with Al
13 Keggin. As can be seen from
Figure 2c, montmorillonite domains become arranged in more compacted network of thicker stacked platelets about 300 nm thick, which are built of thick aggregated chains. Studied in water suspension, short-chained aggregates are arranged into parallel-orientated elongated, spongy plaits-like ribbons, which are shown in the stereoscopic TXM anaglyphic micrograph
Figure 2c. Individual chain aggregates are cross-linked to each other, often with smaller spongy edge-to-edge (E-E) platelets assembled in closed loops. Within aggregates, voids are very small and about 30% of total measured porosity belongs to voids of diameter up to 600 nm. Larger channel-like and spherical voids up to 0.5–1.5 μm in diameter are these, which form between plates-like aggregates. They are lower in number but very important in dewatering because they significantly contribute to flock permeability. Compacted chain aggregates of irregular shape, which assembled in long plate-like structure are also cross-linked to neighbor similar structural elements by bridges of face-to-edge orientated thick stack domains, as shown in TXM micrograph
Figure 2c, which integrates all spongy 3D cellular networks. Cells look clear inside and the whole structure appears to be stabilized by strength of the chain assembly and reinforced between contacting platelets. Elongated walls of cellular pattern consist with thick (up to 300 nm) aggregates of stair step-like arranged domains.
Figure 2.
The high magnification Transmission X-ray Microscope (TXM) micrographs of 5 wt % montmorillonite colloidal gel in water; stereoscopic TXM anaglyphs (a) Na saturated at exchangeable position; (b) Ca saturated at exchangeable position; (c) Al13 Keggin treated.
Figure 2.
The high magnification Transmission X-ray Microscope (TXM) micrographs of 5 wt % montmorillonite colloidal gel in water; stereoscopic TXM anaglyphs (a) Na saturated at exchangeable position; (b) Ca saturated at exchangeable position; (c) Al13 Keggin treated.
The differences in the microstructural types described here probably reflect the difference in the Gibbs energy position and may be explained on the basis of DLVO theory [
18]. In case of the Keggin, modified montmorillonite particles were assembled in low porosity and thick domains, which may be result of the strong electrostatic reduction of the surface charge by the Keggin macromolecule. In this case the Van der Waals forces, according to the DLVO theory, may dominate between FF oriented montmorillonite flakes over electrostatic repulsion forces, and aggregates become approach irreversible flocculation.
In our TXM investigations we also used a gallium based Keggin macromolecule as we assumed that Ga would enhance visibility of aggregates as it absorbs more X-ray than aluminium. We found no differences between Al and Ga based Keggin in regard to the better presentation in X-ray micrographs.
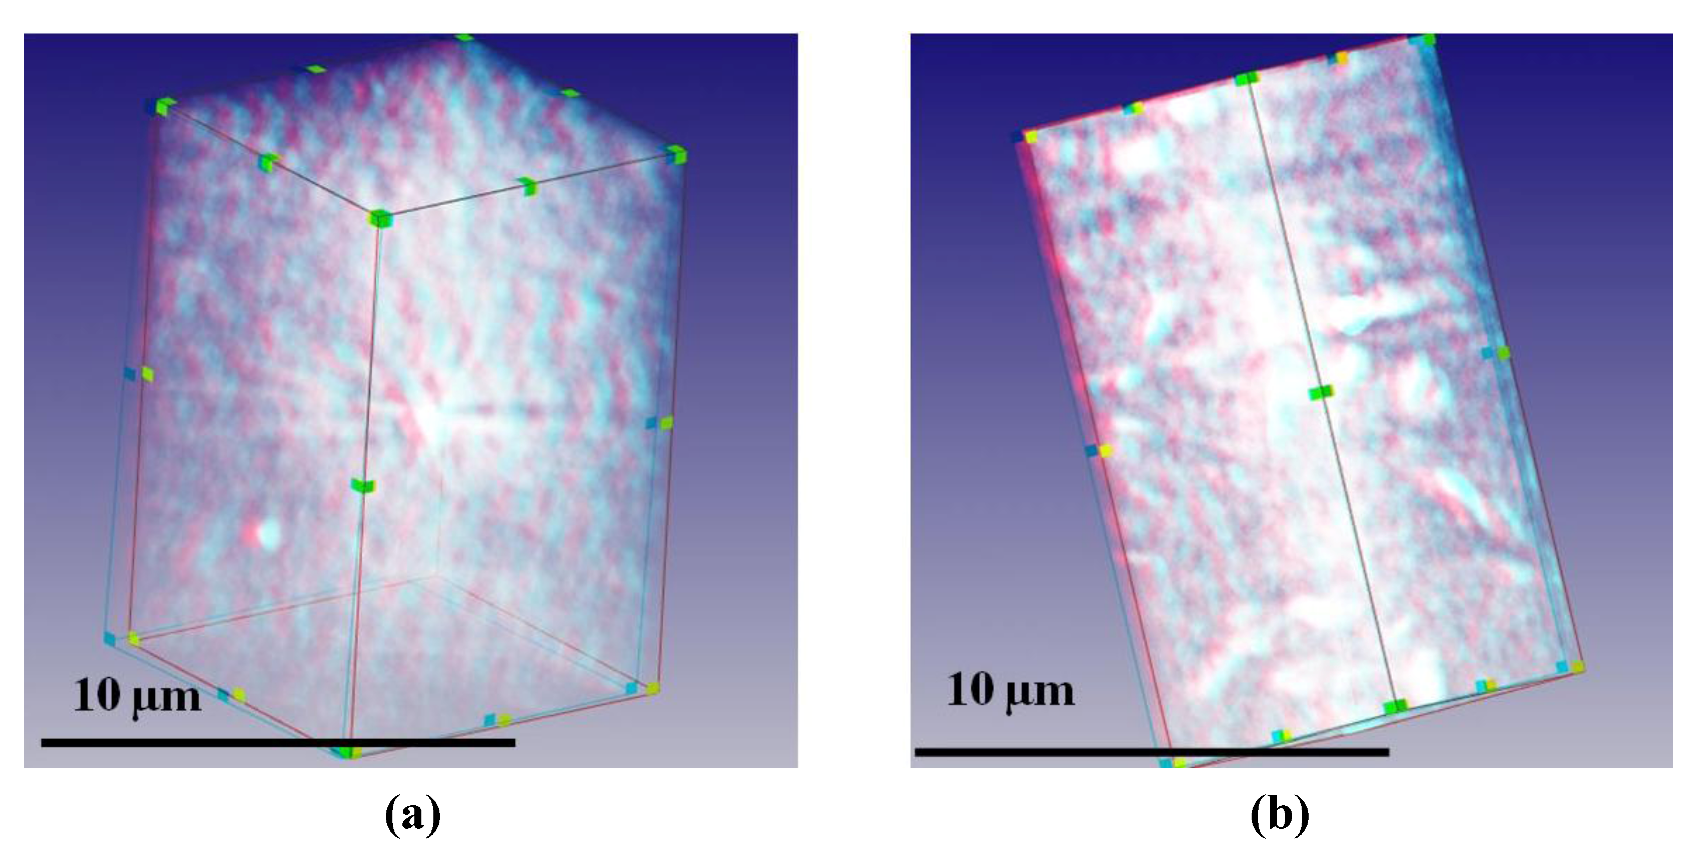
Anaglyphic images shown in
Figure 3 represent 3D computer reconstructions of Na and Ca-montmorillonite (SWy-2) structures. They are in slightly lower magnification resolution than the 2D X-ray photographs from which the stereoscopic images were assembled in
Figure 2. These images are shown for a better understanding of how the assembly of particles is arranged over the larger volume. These space reconstructions were obtained from 141, 2D pictures of particles observed from different incident angles +70° to −70° (it is possible to observe this gelled suspensions from different angles during investigations). Such an angle range was used because of the flat microscopy stage available for these investigations. Earlier attempts to use plastic capillaries for 90° tomography (15) showed difficulties when using this method. Such a reconstruction reveals the cellular orientation of associated mineral sheets within aqueous suspension as well as observing significant differences in sheet thicknesses between Na and Ca-montmorillonite, observed from different angles.
Figure 3.
The TXM 3D anaglyphic computer reconstruction of 5 wt % montmorillonite colloidal gel in water. (a) Na saturated at exchangeable position; (b) Ca saturated at exchangeable position.
Figure 3.
The TXM 3D anaglyphic computer reconstruction of 5 wt % montmorillonite colloidal gel in water. (a) Na saturated at exchangeable position; (b) Ca saturated at exchangeable position.
Similar patterns to these observed in the high resolution micrographs can be seen in the 2D section taken from the 3D computer reconstructions. Displayed in sections structural patterns were subjected of image analyzing technique “STIMAN” and described in details in [
6]. The
STIMAN is the
STatistical
IMage
ANalyzing technique designed at Moscow State University and was originally an approach and software for the statistic comparison of SEM images of different soil types. In [
6] we utilized it to characterize the suspension structure description and in the present contribution it is used to obtain information about TXM sections.
In the
Figure 4a cross-section of the 3D reconstruction of Na-montmorillonite gel in water shows distinctive parallel arrangement of montmorillonite domains, which differ in thickness. Large and closed empty voids in between are the cells observed in the high magnification micrograph in
Figure 2a. The water in these large cellular voids looks to be permeable encapsulated.
A much different pattern is shown in Ca-montmorillonite (
Figure 4b), where denser spherical aggregates are seen and larger empty spaces between these aggregates are filled by water. The porous cellular structure of these aggregates was displayed in the TXM micrograph in
Figure 2b. The water in these large irregularly inter-connected voids can be mobile. When within small intra-aggregate closed voids the water seems to be encapsulated.
As shown in Al
13-montmorillonite,
Figure 4c, compact aggregates are arranged in a similar pattern like in Ca-montmorillonite but with much larger inter-aggregate voids. Aggregates are frequently connected with each other by clay-assembled bridges. Large voids between aggregates as well as these within aggregates seem to be connected and more regular in shape.
Figure 4.
TXM slices of 5 wt % montmorillonite in water, full frame and enlarged fragment. (a) Na saturated at exchangeable position; (b) Ca saturated at exchangeable position; (c) Al13 Keggin treated. White areas represent particles and black areas belong to voids.
Figure 4.
TXM slices of 5 wt % montmorillonite in water, full frame and enlarged fragment. (a) Na saturated at exchangeable position; (b) Ca saturated at exchangeable position; (c) Al13 Keggin treated. White areas represent particles and black areas belong to voids.
Direct measurements of forces acting between studied Na and Ca-montmorillonites were described in [
21] and show a long-range repulsion between the surfaces of these particles. These long range repulsive forces have been detected from distances of over ~1000 nm of the surface separation in case of Na-montmorillonite whereas in case of Ca-montmorillonite repulsive forces were detected from distances of about ~400 nm. These results are consistent with void sizes observed in the TXM images.
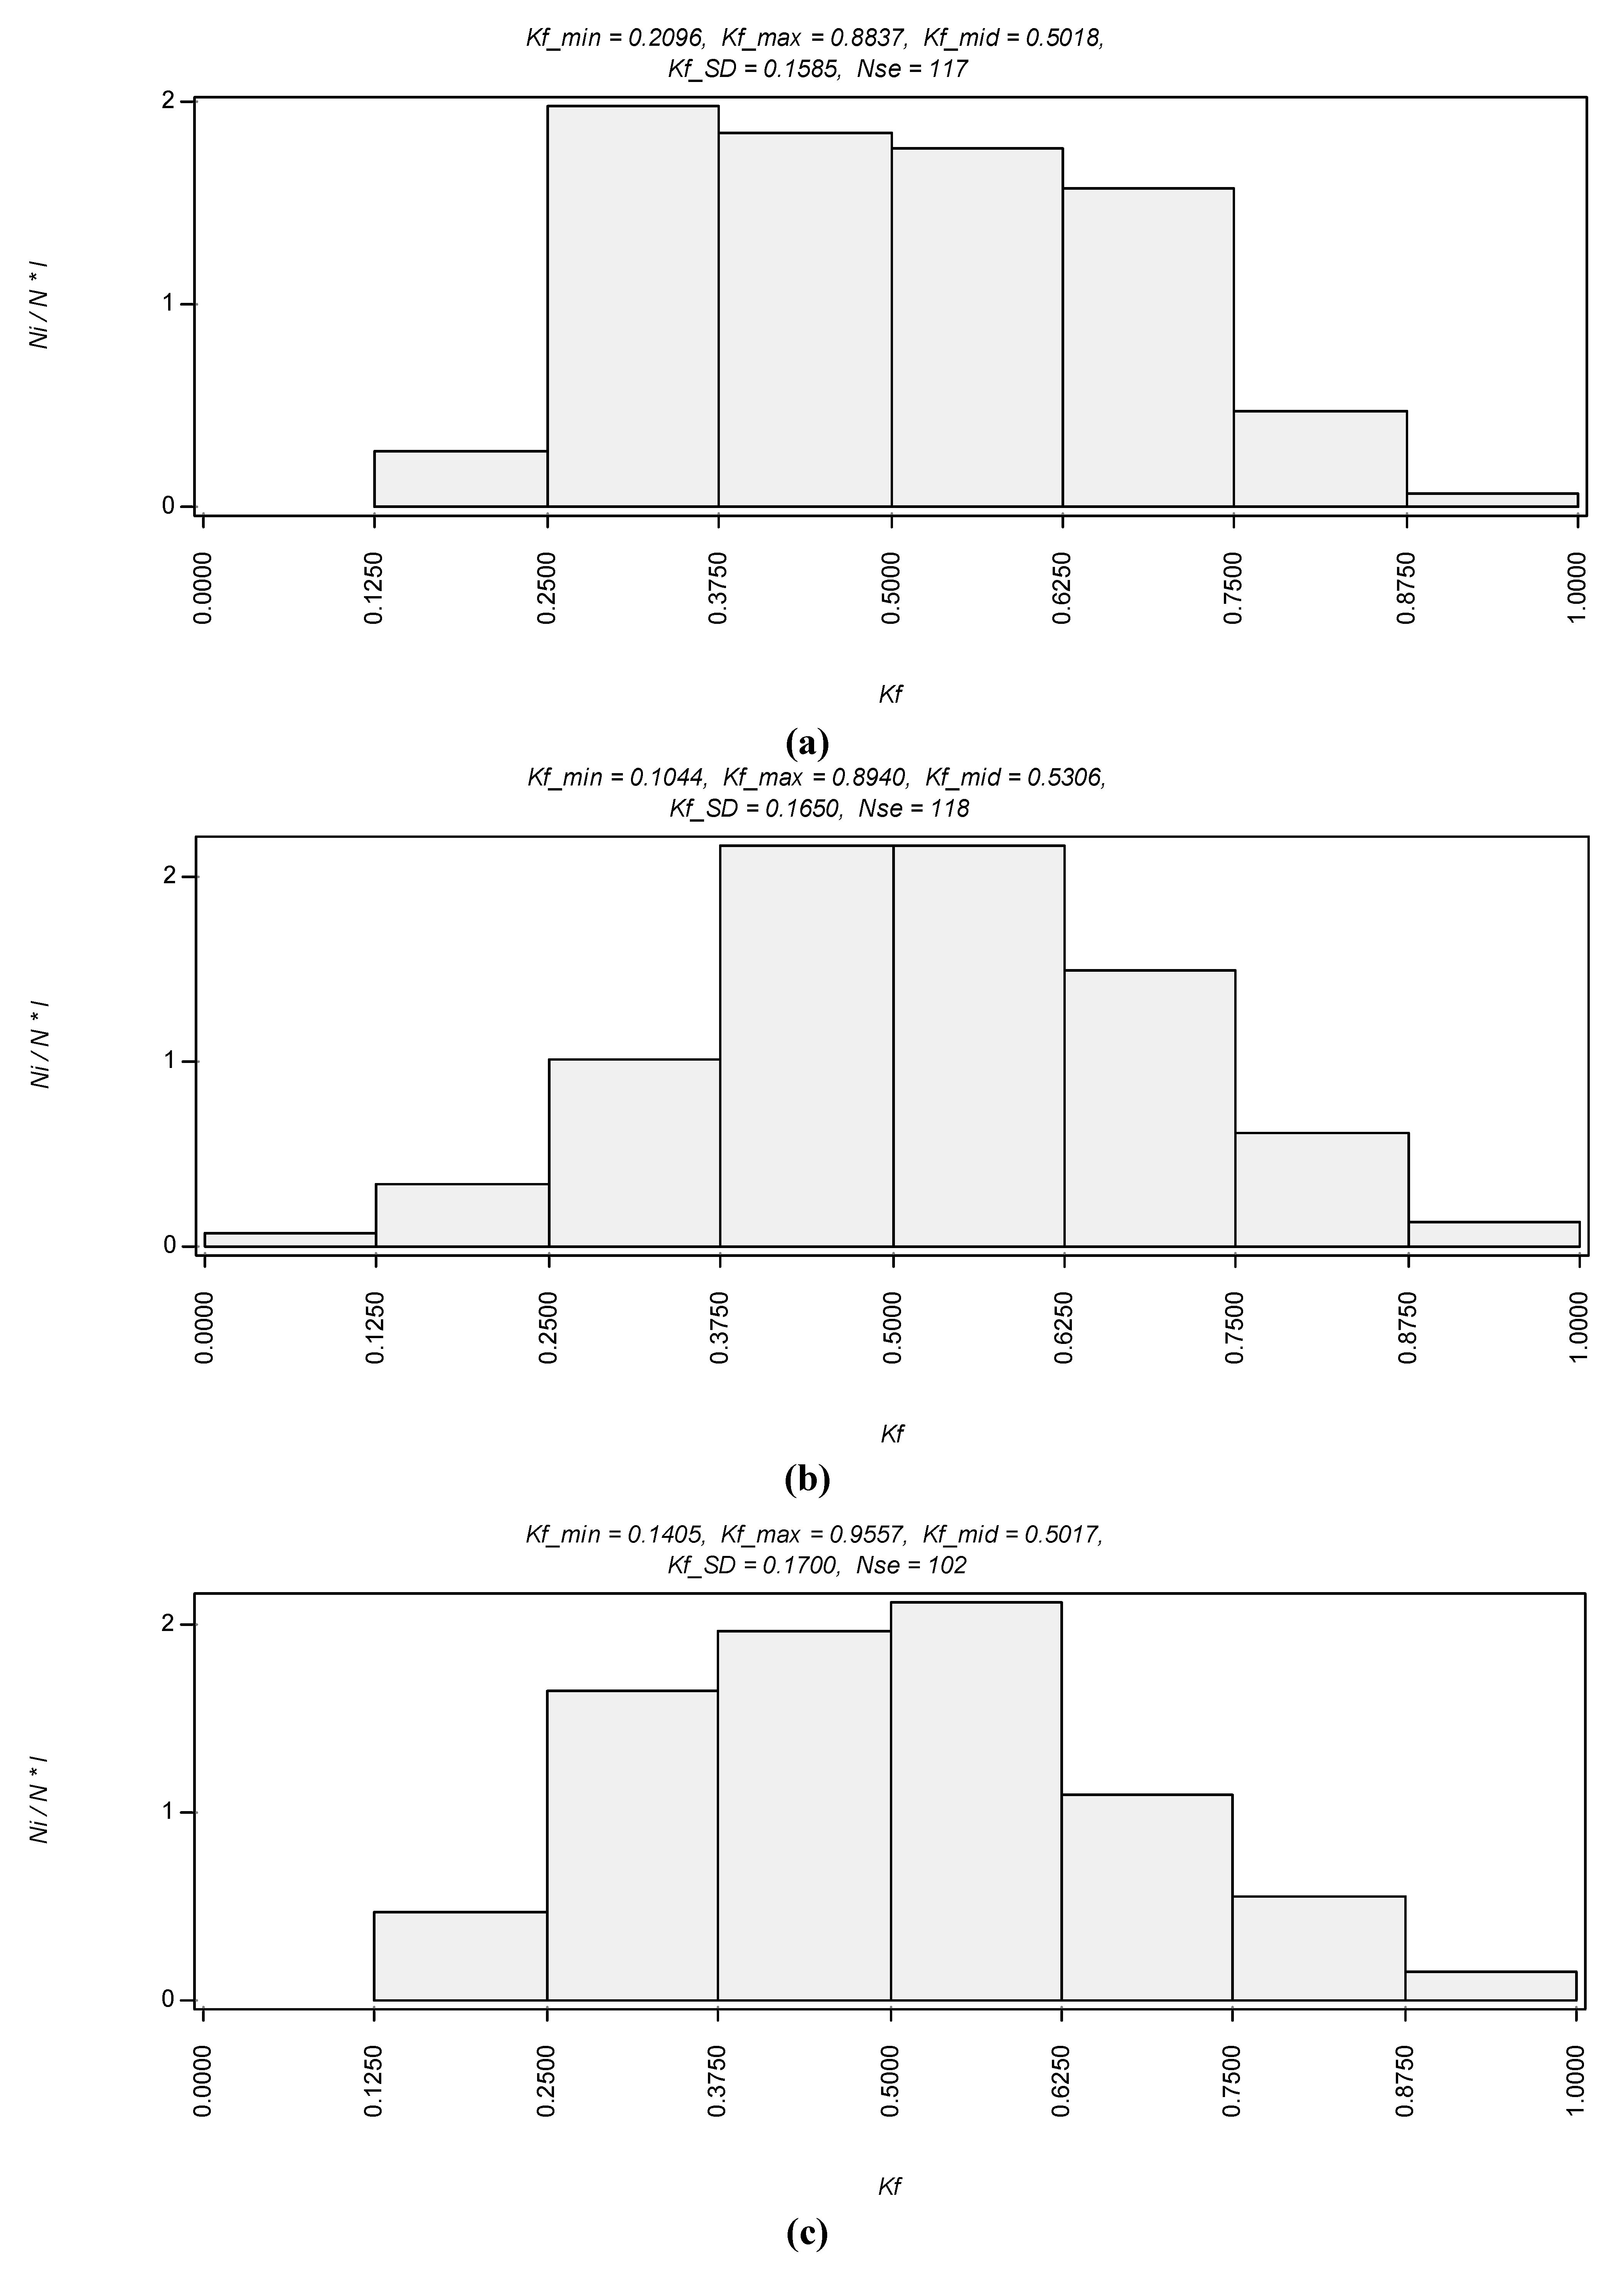
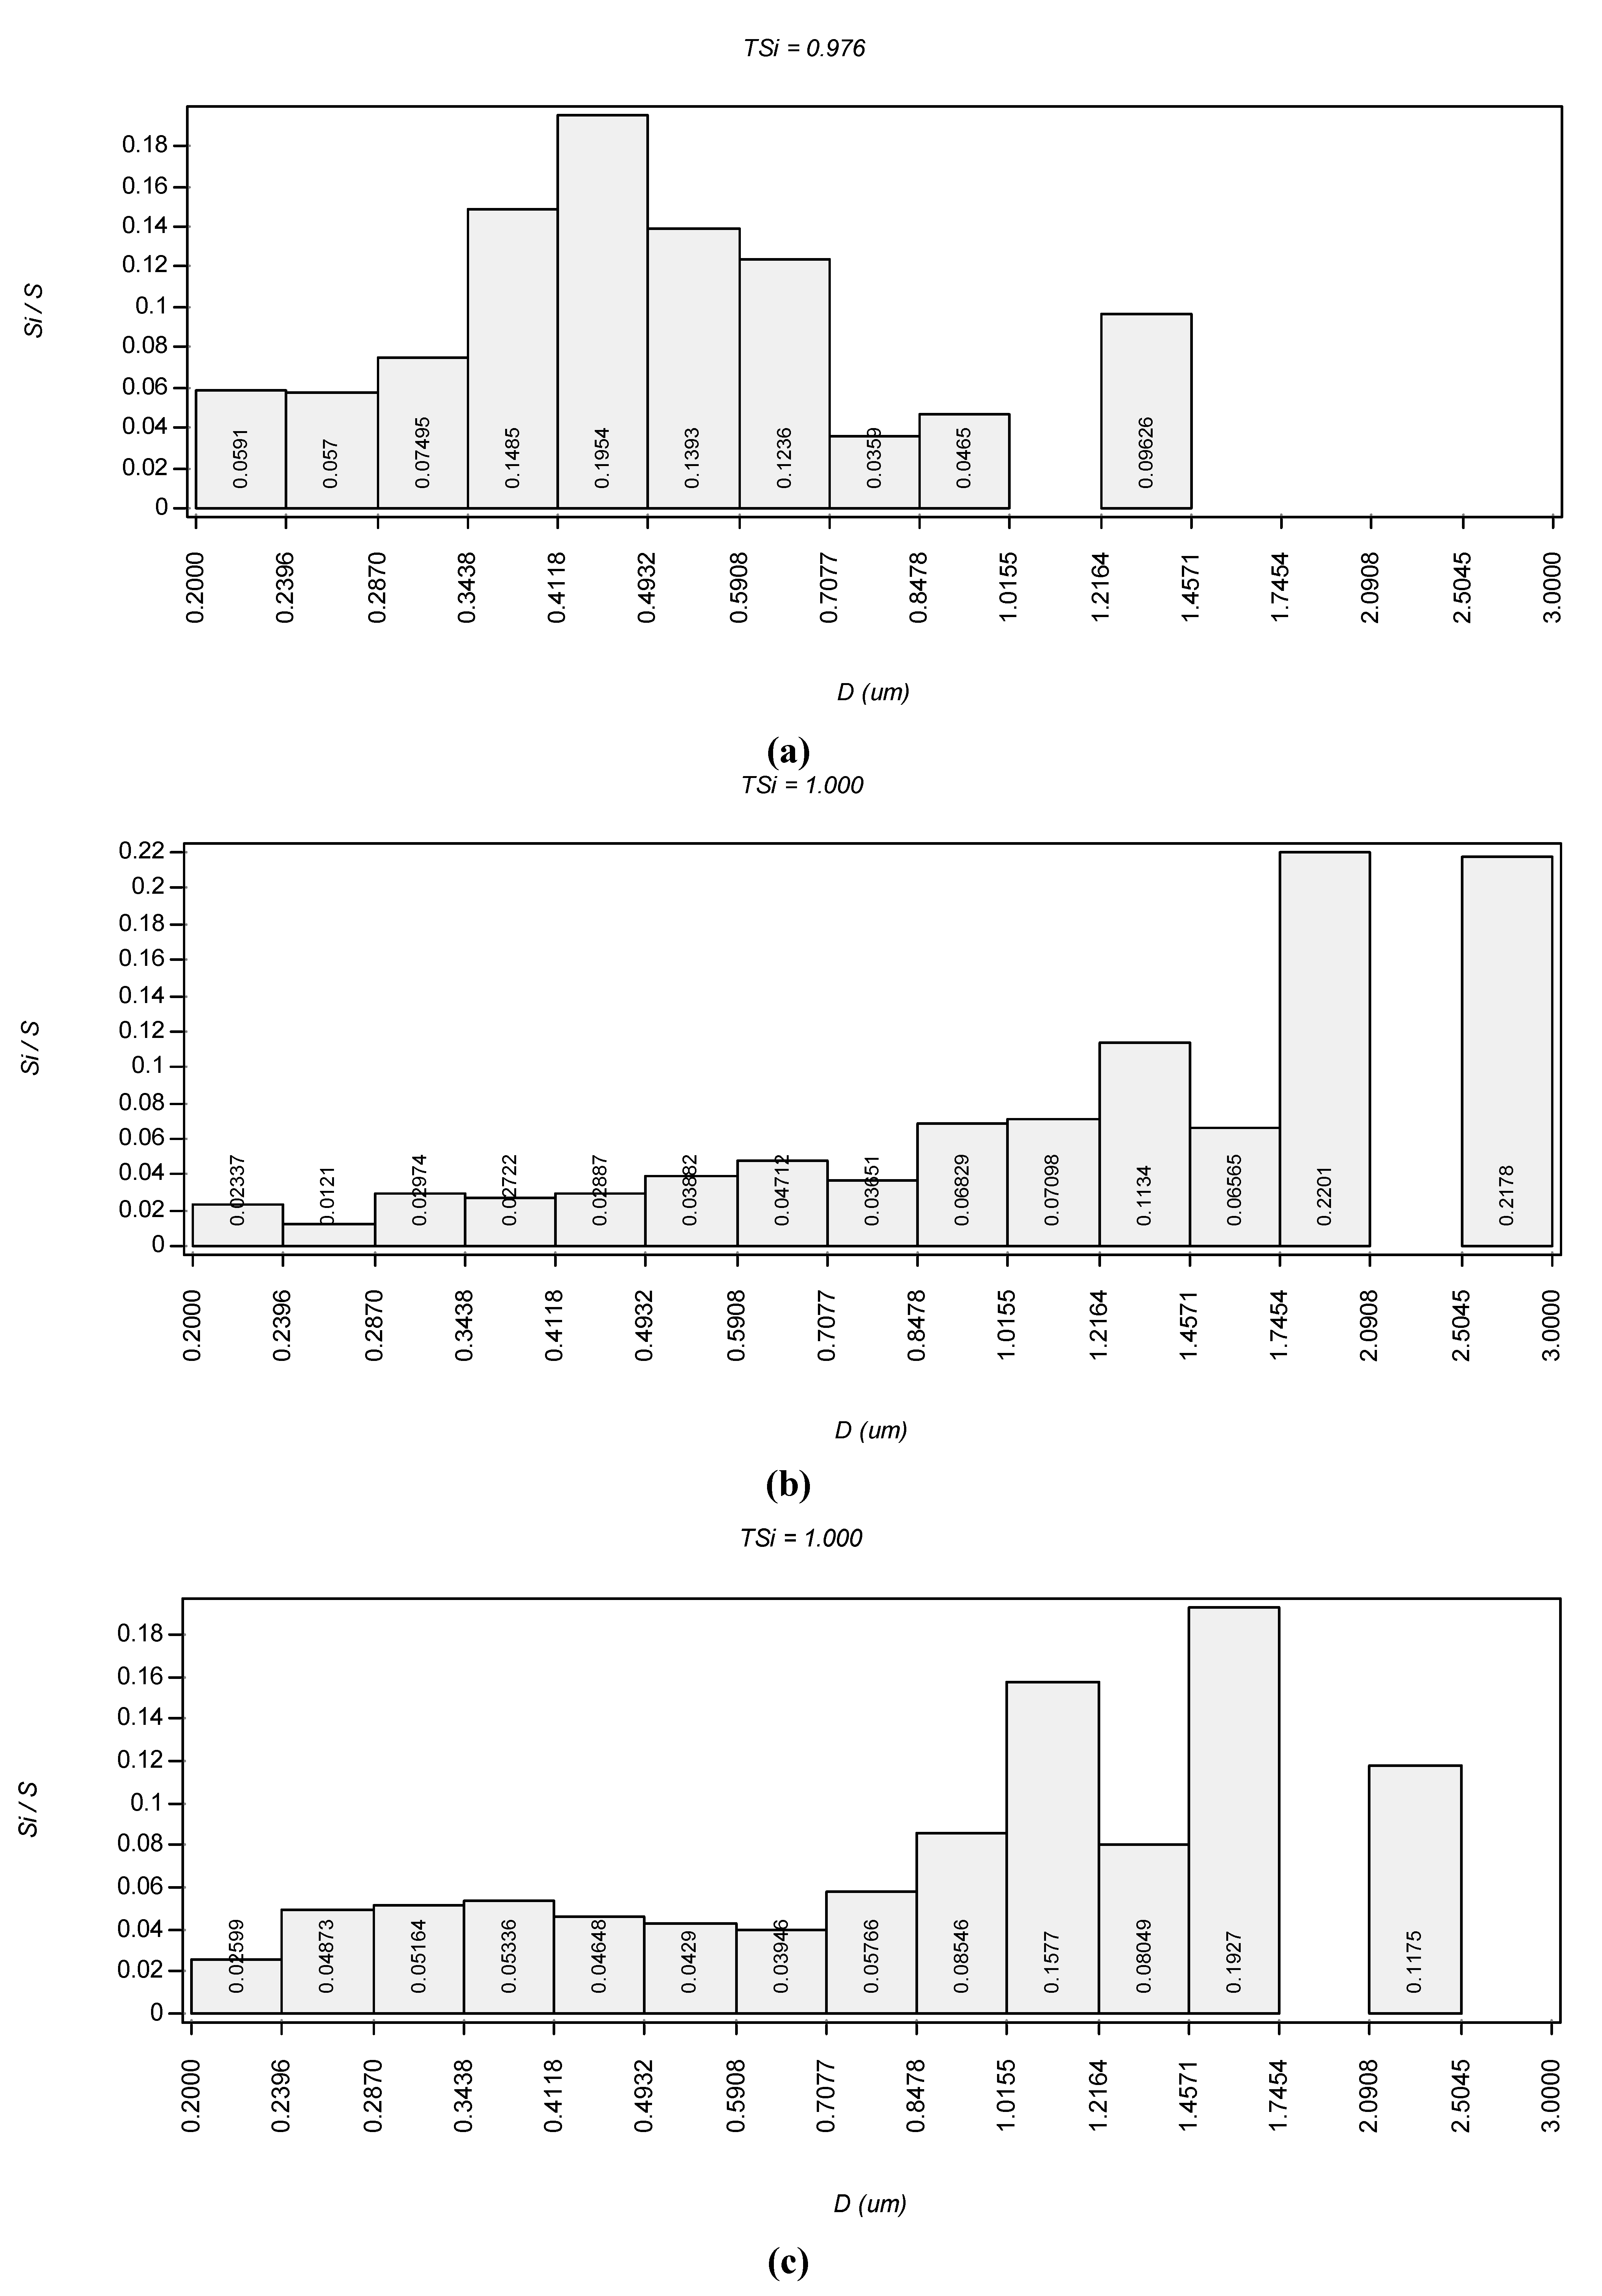
Selected statistical results obtained from analyzing cross sections of computer reconstruction images as shown in
Figure 4 are presented in the form of diagrams (
Figure 5). Aggregates and voids were studied. Diagrams in
Figure 5 show total particle distribution across their diameter. These graphs show the smallest particles build aggregates in the Na-montmorillonite water gel, where mostly representative were particles of 450 nm in diameter and these particles were assembled into larger elongated aggregates. Most particles were below 1 µm in the equivalent diameter, which is a diameter of an ideal, spherical particle that settles in the same rate in the aqueous environment. Ca and Al
13-montmorillonites display much larger aggregates where most of them are between 1 and 3 µm in the equivalent diameter.
Figure 5.
Results of the Statistical Image Analyzing Technique (STIMAN) statistical analysis drawn from TXM micrographs. We show original graphs generated by the STIMAN program. The 4 digits after the comma add a strange accuracy that cannot be deduced from the measurements, it should be reduced to two digits. Also there are some abbreviations which are not relevant to the article text and for the better clarity were not explained it in this figure. Requency of aggregates distribution according to their total area for (a) Na+, (b) Ca2+ cationic form and (c) Al13 treated clay respectively. In the y-axis units is the probability density.
The results of voids distribution over equivalent diameters are shown in
Figure 6. The results show a very broad distribution of the voids over smaller diameters ranging from 200 nm up to 1 µm. The majority of voids in Na-montmorillonite are represented by this range of diameters and only 35% voids are 2.5–3 µm in diameters. These larger voids are perhaps the cellular elongated voids observed in TXM micrographs. The graphs did not show us if these voids are connected. Consequently, the majority of voids in Ca and Al
13-montmorillonites groups are within 1–3 µm in diameter. In Ca-montmorillonite the distribution of the voids steadily increases over the diameter range, when in the Al
13-montmorillonite distribution increase sharply in the range of diameters between 1.2–2.5 µm.
Figure 6.
Results of the Statistical Image Analyzing Technique (STIMAN) statistical analysis drawn from TXM micrographs. Frequency the distribution of the voids according to their total area voids for (a) Na+, (b) Ca2+ cationic form and (c) Al13 treated clay respectively. In the y-axis units is the probability density.
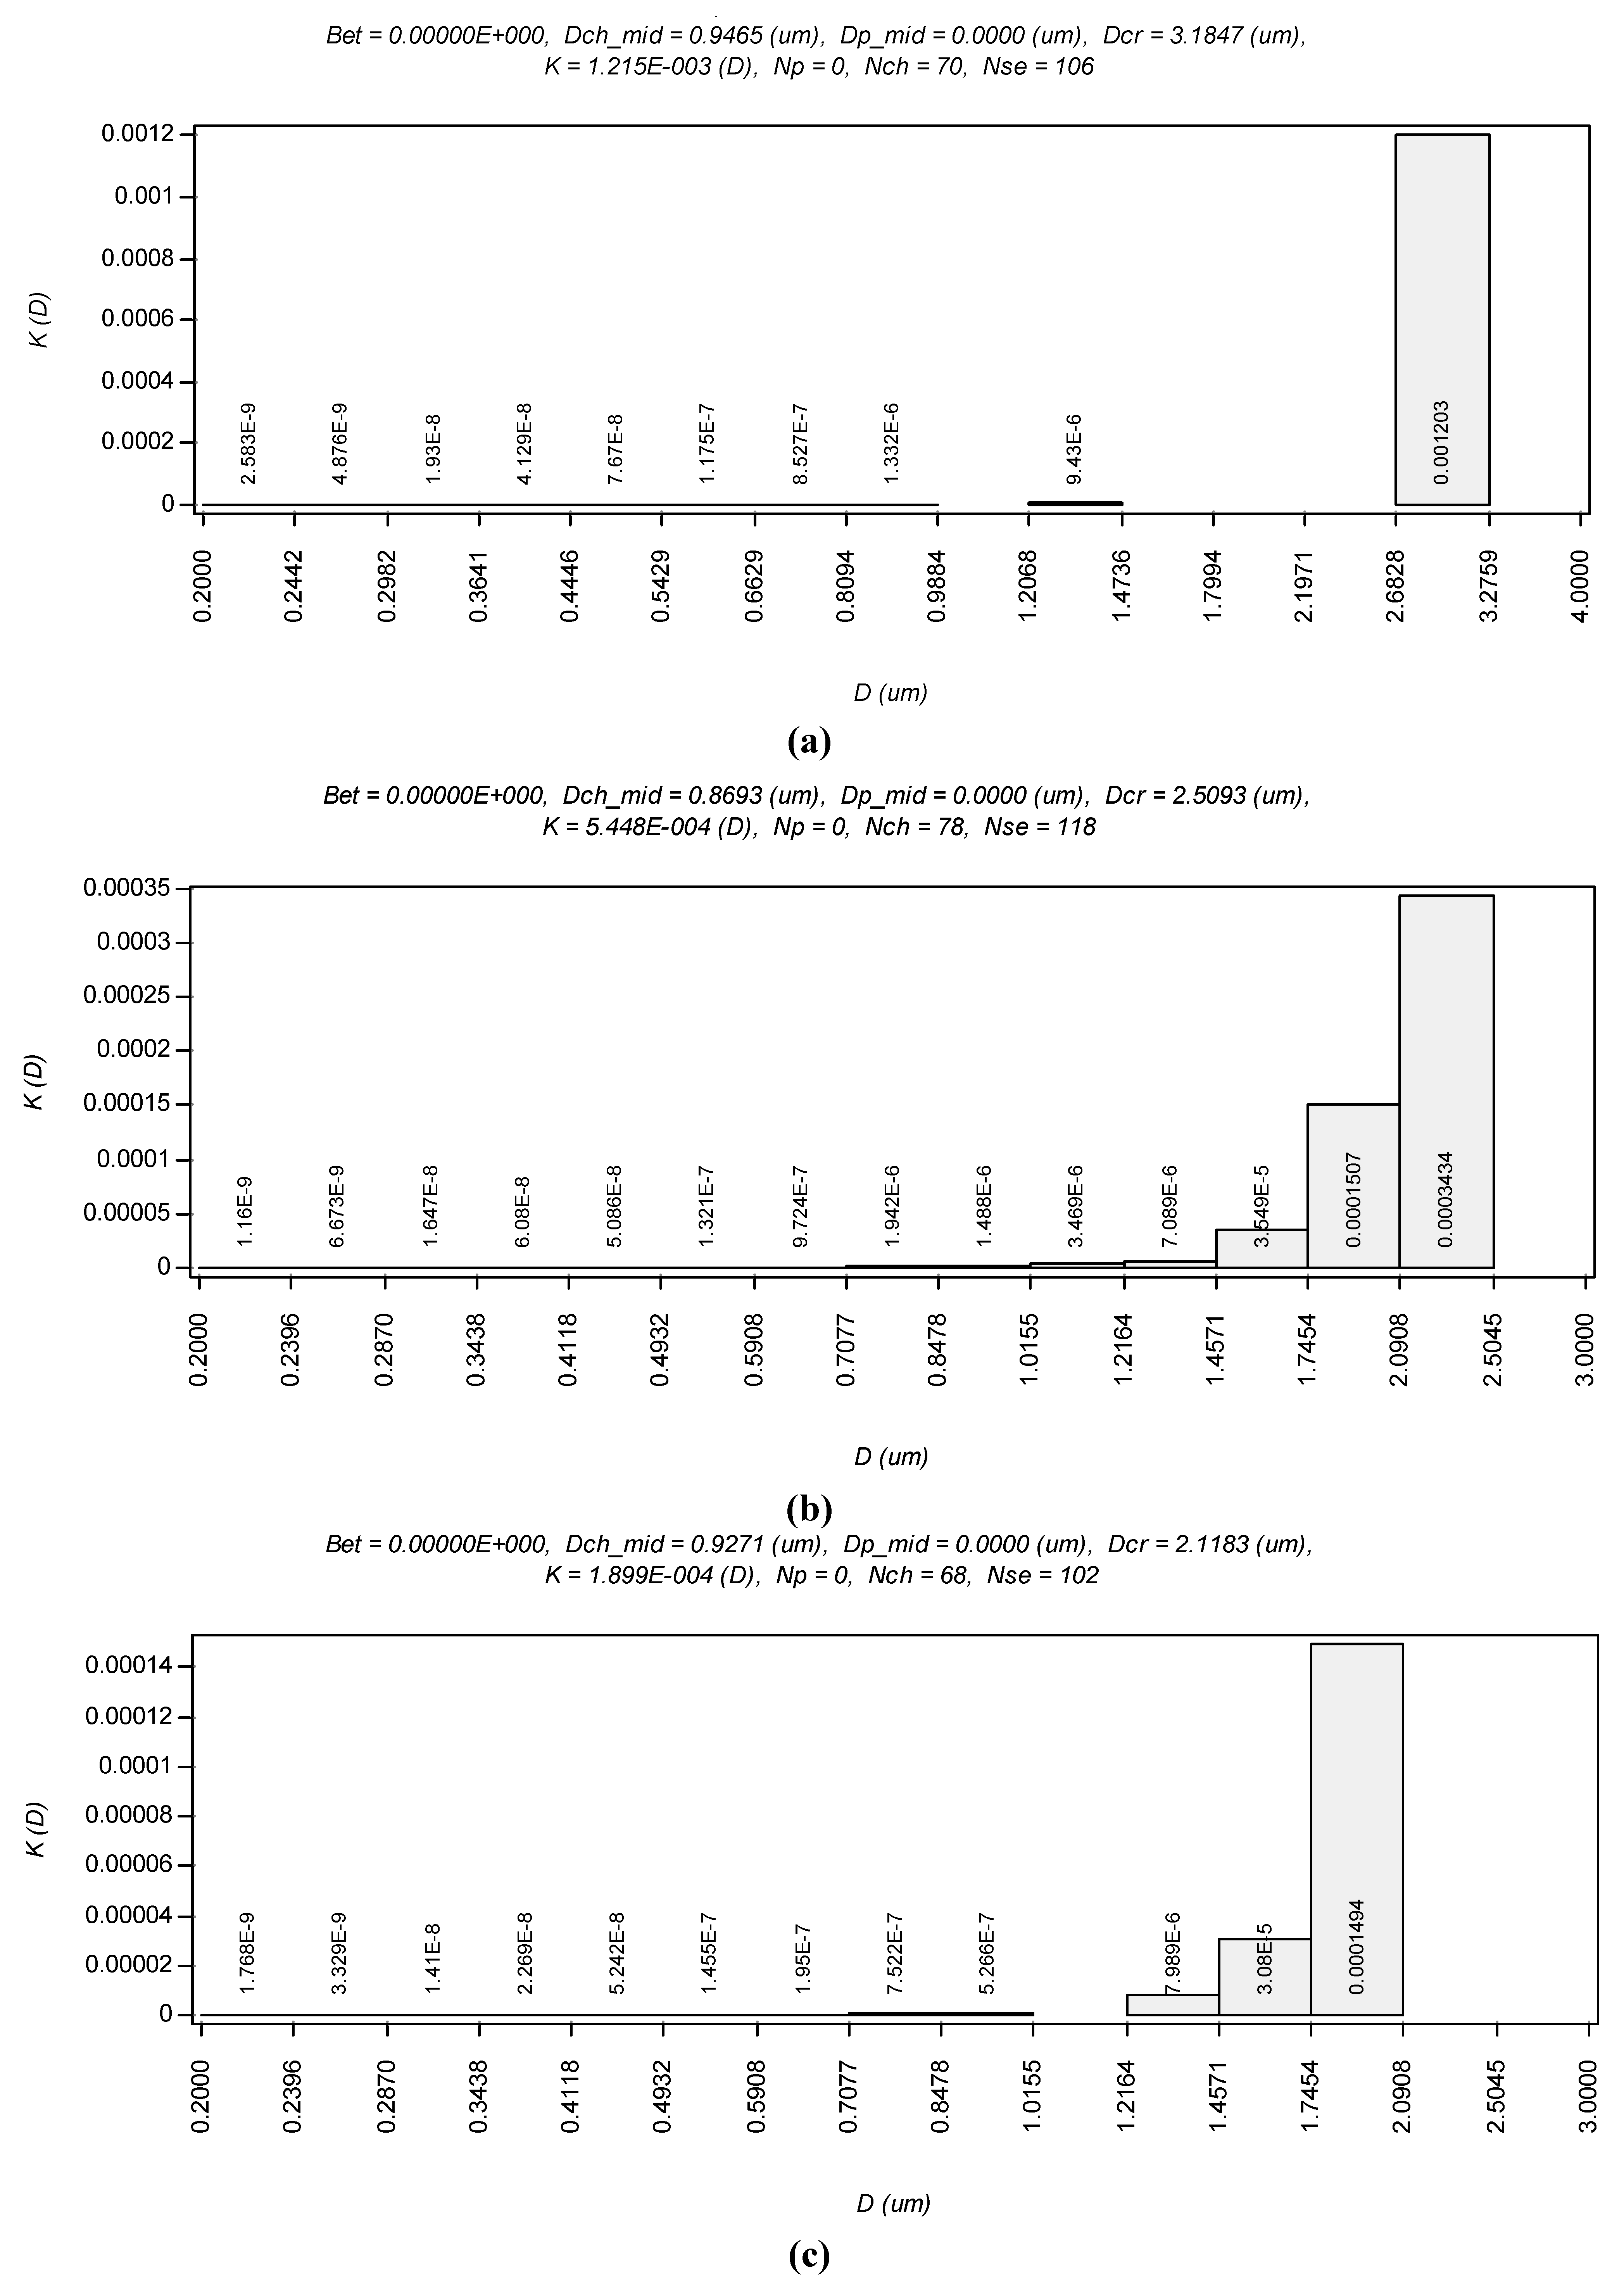
The permeability of studied systems was shown in
Figure 7 as the filtration coefficient distribution across voids of different diameters. The smallest value of permeability was obtained for Na-montmorillonite-water system. The maximum seen in larger voids diameter range do not make this structure permeable because these voids are more likely to be cellular and closed. A wider range of larger filtration coefficients were obtained for Ca and Al
13-montmorillonite and because larger voids responsible for this larger permeability are open it is more likely to dewater these structural systems more easily.
Figure 7.
Results of the Statistical Image Analyzing Technique (STIMAN) statistical analysis drawn from TXM micrographs. Voids contribution in filtration for (a) Na+, (b) Ca2+ cationic and (c) Al13 treated clay respectively. In the y-axis units is the filtration coefficient in Darcy (D).
Figure 7.
Results of the Statistical Image Analyzing Technique (STIMAN) statistical analysis drawn from TXM micrographs. Voids contribution in filtration for (a) Na+, (b) Ca2+ cationic and (c) Al13 treated clay respectively. In the y-axis units is the filtration coefficient in Darcy (D).
The form index of studied voids is shown in
Figure 8. This parameter displays evolution from mostly elongated void forms in Na-montmorillonite structure, to a more equal distribution in Ca-montmorillonite structure and to mostly regular voids within Al
13-montmorillonite structural type.
Figure 8.
Results of the Statistical Image Analyzing Technique (STIMAN) statistical analysis drawn from TXM micrographs. The voids form index for (a) Na+, (b) Ca2+ cationic and (c) Al13 treated clay respectively.
Figure 8.
Results of the Statistical Image Analyzing Technique (STIMAN) statistical analysis drawn from TXM micrographs. The voids form index for (a) Na+, (b) Ca2+ cationic and (c) Al13 treated clay respectively.
3. Experimental Section
X-ray microscopy is proved to be an efficient instrument in interior 3D structure of nano-material owing to its large penetration depth and superior spatial resolution. TXM used here has been installed at beamline BL01B of NSRRC in Taiwan [
12]. This TXM provides 2D imaging and 3-D tomography at energy 8–11 keV with a spatial resolution of 50–60 nm, and with the Zernike-phase contrast capability for imaging light material which lacks x-ray absorption contrast. TXM enables imaging of aqueous specimens due to the fact that no vacuum condition is required. X-rays generated by a superconducting wavelength shifter source, are primarily focused by a toroidal focusing mirror. A double crystal monochromator exploiting a pair of Ge (111) crystals selects the x-ray energy. After the focusing mirror and double crystal monochromator, the x-rays are further shaped by a capillary condenser. The zone-plate is a circular diffraction grating consisting of alternating opaque and transparent concentric zones. In the microscope, the zone-plate is being used as an objective lens magnifying the images. A gold-made phase ring positioned at the back focal plane of the objective zone-plate resulting in a recording of the phase contrast images at the detector.
The photon energy of 8 keV was used to image the clay suspension for the maximum x-ray absorption. The exposure time of a 2D image is from 15 s to 4 min. By acquiring a series of 2D images with the sample rotated stepwise, 3D tomography datasets are reconstructed based on 141 sequential image frames taken in the first order diffraction mode with azimuth angle rotating from −70° to +70° for our lateral plate specimen. If we capsulate our clay suspension to a Kapton tube or for small pellet clay mineral specimen, 181 sequential image frames with azimuth angle rotating from –90° to +90° can be take.
This technique, however, has some limitations [
15], which were overcome and the method been recently tested in the study of different clay minerals like kaolinite [
16,
22] and montmorillonite [
21] clay samples. This method shows progress in discrete structure imaging of the clay-water aggregates and in visualization of structural modifications. These modifications may have significant impact on the macroscopical behavior of resulting, subject to modification, clay materials.
The montmorillonite used in this study was the well-known Na-montmorillonite from Wyoming (USA) obtained from Clay Mineral Repository. This sample (SWy-2) has been well described [
23] and two samples were prepared from this original clay. First the colloidal fraction was separated by centrifugation and secondly all cations in exchangeable positions were ion exchanged with sodium Na
+ and calcium Ca
2+ ions by saturating original montmorillonite sample in chlorine 1 N salt solution over 24 h and dialyzed it until no reaction on Cl
− was detected. Measurements were performed in deionised water of unknown ionic strength. Note that it is difficult to control Debye length in “water” because there is always some low level, 0.01 mM or less, of background electrolyte (including ions from the self-dissociation of water) that is hard to quantify or control. The most important difference in the bonding between Ca- and Na-montmorillonite sheets is that the spacing between most of the former (Ca-montmorillonite) is restricted to 0.95 nm, whereas the spacing of the latter (Na-montmorillonite) can be unlimited [
15].
Preparation of intercalated SWy-2 montmorillinite and solutions of aluminium and gallium 13 Keggin ions where prepared by a method similar to [
24]. Solutions of sodium hydroxide (0.10
M), aluminium nitrate (0.05
M) and gallium nitrate (0.05
M) were prepared in filtered water (18.2 MΩ). A peristaltic pump was used to add the hydroxide solution (0.125% of the solution per minute) to a solution of the metal nitrate in a molar ratio of 2:1 (hydroxide: metal). The cluster cation (Al
13O
4(OH)
24(H
2O)
12)
7+ has the Keggin structure with a tetrahedral Al atom in the centre of the cluster coordinated to 4 oxygen atoms. This ion is generally called the Al
13 ion. A Ga
13 analogue is known and also was used in our experiments to investigate whether Ga atoms have greater absorption in contrast to the Al atoms.
The resultant Keggin ion solution was allowed to age over night before use. To an aliquot of the Keggin ion solution, the sodium exchanged SWy-2 was added in an amount, which ensured the Keggin ion remained four times the Cation Exchange Capacity (CEC). The clay in Keggin ion solution was mixed overnight using a magnetic stirrer before collection, washing and drying via vacuum filtration. Before redispersing for structural examination, the sample was grounded and mixed with deionized water.
The sample suspensions (100 mL) were transported to the Taiwanese synchrotron where fraction of a droplet was placed into the square steel frame and secured from both sides by Kapton tape. The thickness of the suspension layer within the microscopy stage was >100 µm. The 3D tomography was reconstructed based on 141 sequential images taken in first order diffraction mode with azimuth angle rotating.
4. Conclusions
Our TXM investigations reveal swollen cellular structure in aqueous montmorillonite gel with void diameters on the micrometer scale, which are consistent with previously published AFM force measurements [
21]. Na-montmorillonite diluted suspension gels in form of a 3-D structure, based on a system of cross-linked ribbons. These ribbon-like aggregates form a highly orientated, spacious cellular network with cells of up to 1–2 µm in diameter. They form laminar elongated cellular liquid crystal-like micelles. The voids in this structure seem to be closed and not to be connected; the system became mostly impermeable.
This network encapsulates water within impregnable elongated cellular structure. A different, coagulated aggregate type of microstructure has been observed in Ca-montmorillonite with cells having a diameter of ~0.4 µm—shorter within aggregates—and 1–3 µm voids between aggregates. Thicker and more rigid structural network elements are multi-sheet assembly, which are mostly randomly orientated and were more resistant to shear forces. All larger inter-aggregate voids look more open than in case of Na-montmorillonite and connected with neighboring voids. The inter-aggregate channels are elongated and seem to be connected when more regular in shape intra-aggregate voids look to be closed.
The Keggin modified montmorillonite displays a significantly different microstructural type wherein montmorillonite flakes stacked into Face-to-Face (FF) and Edge-to-Face (EF) orientated particles, building denser aggregates, which assembled spongy super-aggregates. These aggregates are bridged to other similar aggregates in random directions. A large and connected void system generates larger permeability of such a structure, allowing better sediment dewatering.
This novel preparative method using a synchrotron-based TXM nanotomorgaphy technique can be useful in the field of mineral processing as a tool for better understanding of micro-structural changes during operations. Because this method involves more time and special equipment, which is not presently available in Australia, it cannot be commonly implemented. However, a lot of industrial institutions have academic partners for their linkage projects and in such instances it can be very useful for pushing forward our frontier of knowledge in the field of mineral processing. It is also very likely that modernization of x-ray microscopy techniques will introduce techniques that are much cheaper and more suitable for routine structural monitoring. Such monitoring can direct technological processes to achieve desired material properties, which are determined almost exclusively by the microstructural design.
The TXM technique allows us to monitor aggregate structure within natural water environments and give more accurate description of processes. This technique is in a state of evolution and in the near future will be most valuable for monitoring in mineral processing.
