
Evaluation of Uranium Concentration in Soil Samples of Central Jordan

Nuclear Engineering Department, King Abdulaziz University, P.O. Box 80204, Jeddah 21589, Saudi Arabia
Minerals 2015, 5(2), 133-141; https://doi.org/10.3390/min5020133
Submission received: 8 January 2015
/
Revised: 18 March 2015
/
Accepted: 20 March 2015
/
Published: 25 March 2015
(This article belongs to the Special Issue Uranium Minerals: From Resources to Environmental Impact)
Abstract
:Naturally occurring radionuclides such as uranium, thorium and their decay products (226Ra, 222Rn) are present in a number of geological settings in Jordan. Motivated by the existence of uranium anomalies coupled with its lack of conventional energy resources, Jordan decided that the development of this indigenes resource (uranium) is the first step in introducing nuclear power as part of its energy mix. Uranium deposits in Central Jordan were perceived not only as a secured resource that will fulfill Jordan’s energy needs, but also as an economic asset that will finance Jordan’s nuclear program. The average uranium concentration of 236 soil samples using ICP-Mass (inductively coupled plasma mass spectrometry) was found to be 109 parts per million (ppm). Results analysis revealed a wide range of 1066 ppm for uranium concentration, and a median of 41 ppm uranium. The measurements frequency distribution indicates that 72% of samples measured had a uranium content of less than 100 ppm, a concentration that characterizes overburden and tailings quality, rather than minable reserves. This paper presents and evaluates the concentration of uranium in central Jordan, being the most promising area with the highest radioactive anomalies in Jordan.
1. Introduction
Worldwide most countries rely on imports to fulfill their energy needs. Jordan is no exception, with the lack of conventional energy resources and motivated by the existence of uranium occurrences coupled with official studies claiming proven reserves of high-grade uranium. The government of Jordan declared in 2007 its intention to introduce nuclear power as part of its energy mix [1].
The development of this indigenous fuel (uranium) resource was presented by Officials not only as a secured resource that will help fulfill Jordan’s energy needs, but also an economic asset that will finance Jordan’s nuclear program [2,3].
In 2008, Jordan Atomic Energy Commission (JAEC) was established, and its Chairman stated that, “The first step in Jordan’s nuclear program is the mining and extraction of uranium, which constitute a strategic wealth being available in commercial quantities in Jordan” [4]. He added, “Uranium reserves in central Jordan are estimated at about 70,000 metric tons, with an average concentration of 500 ppm” [5].
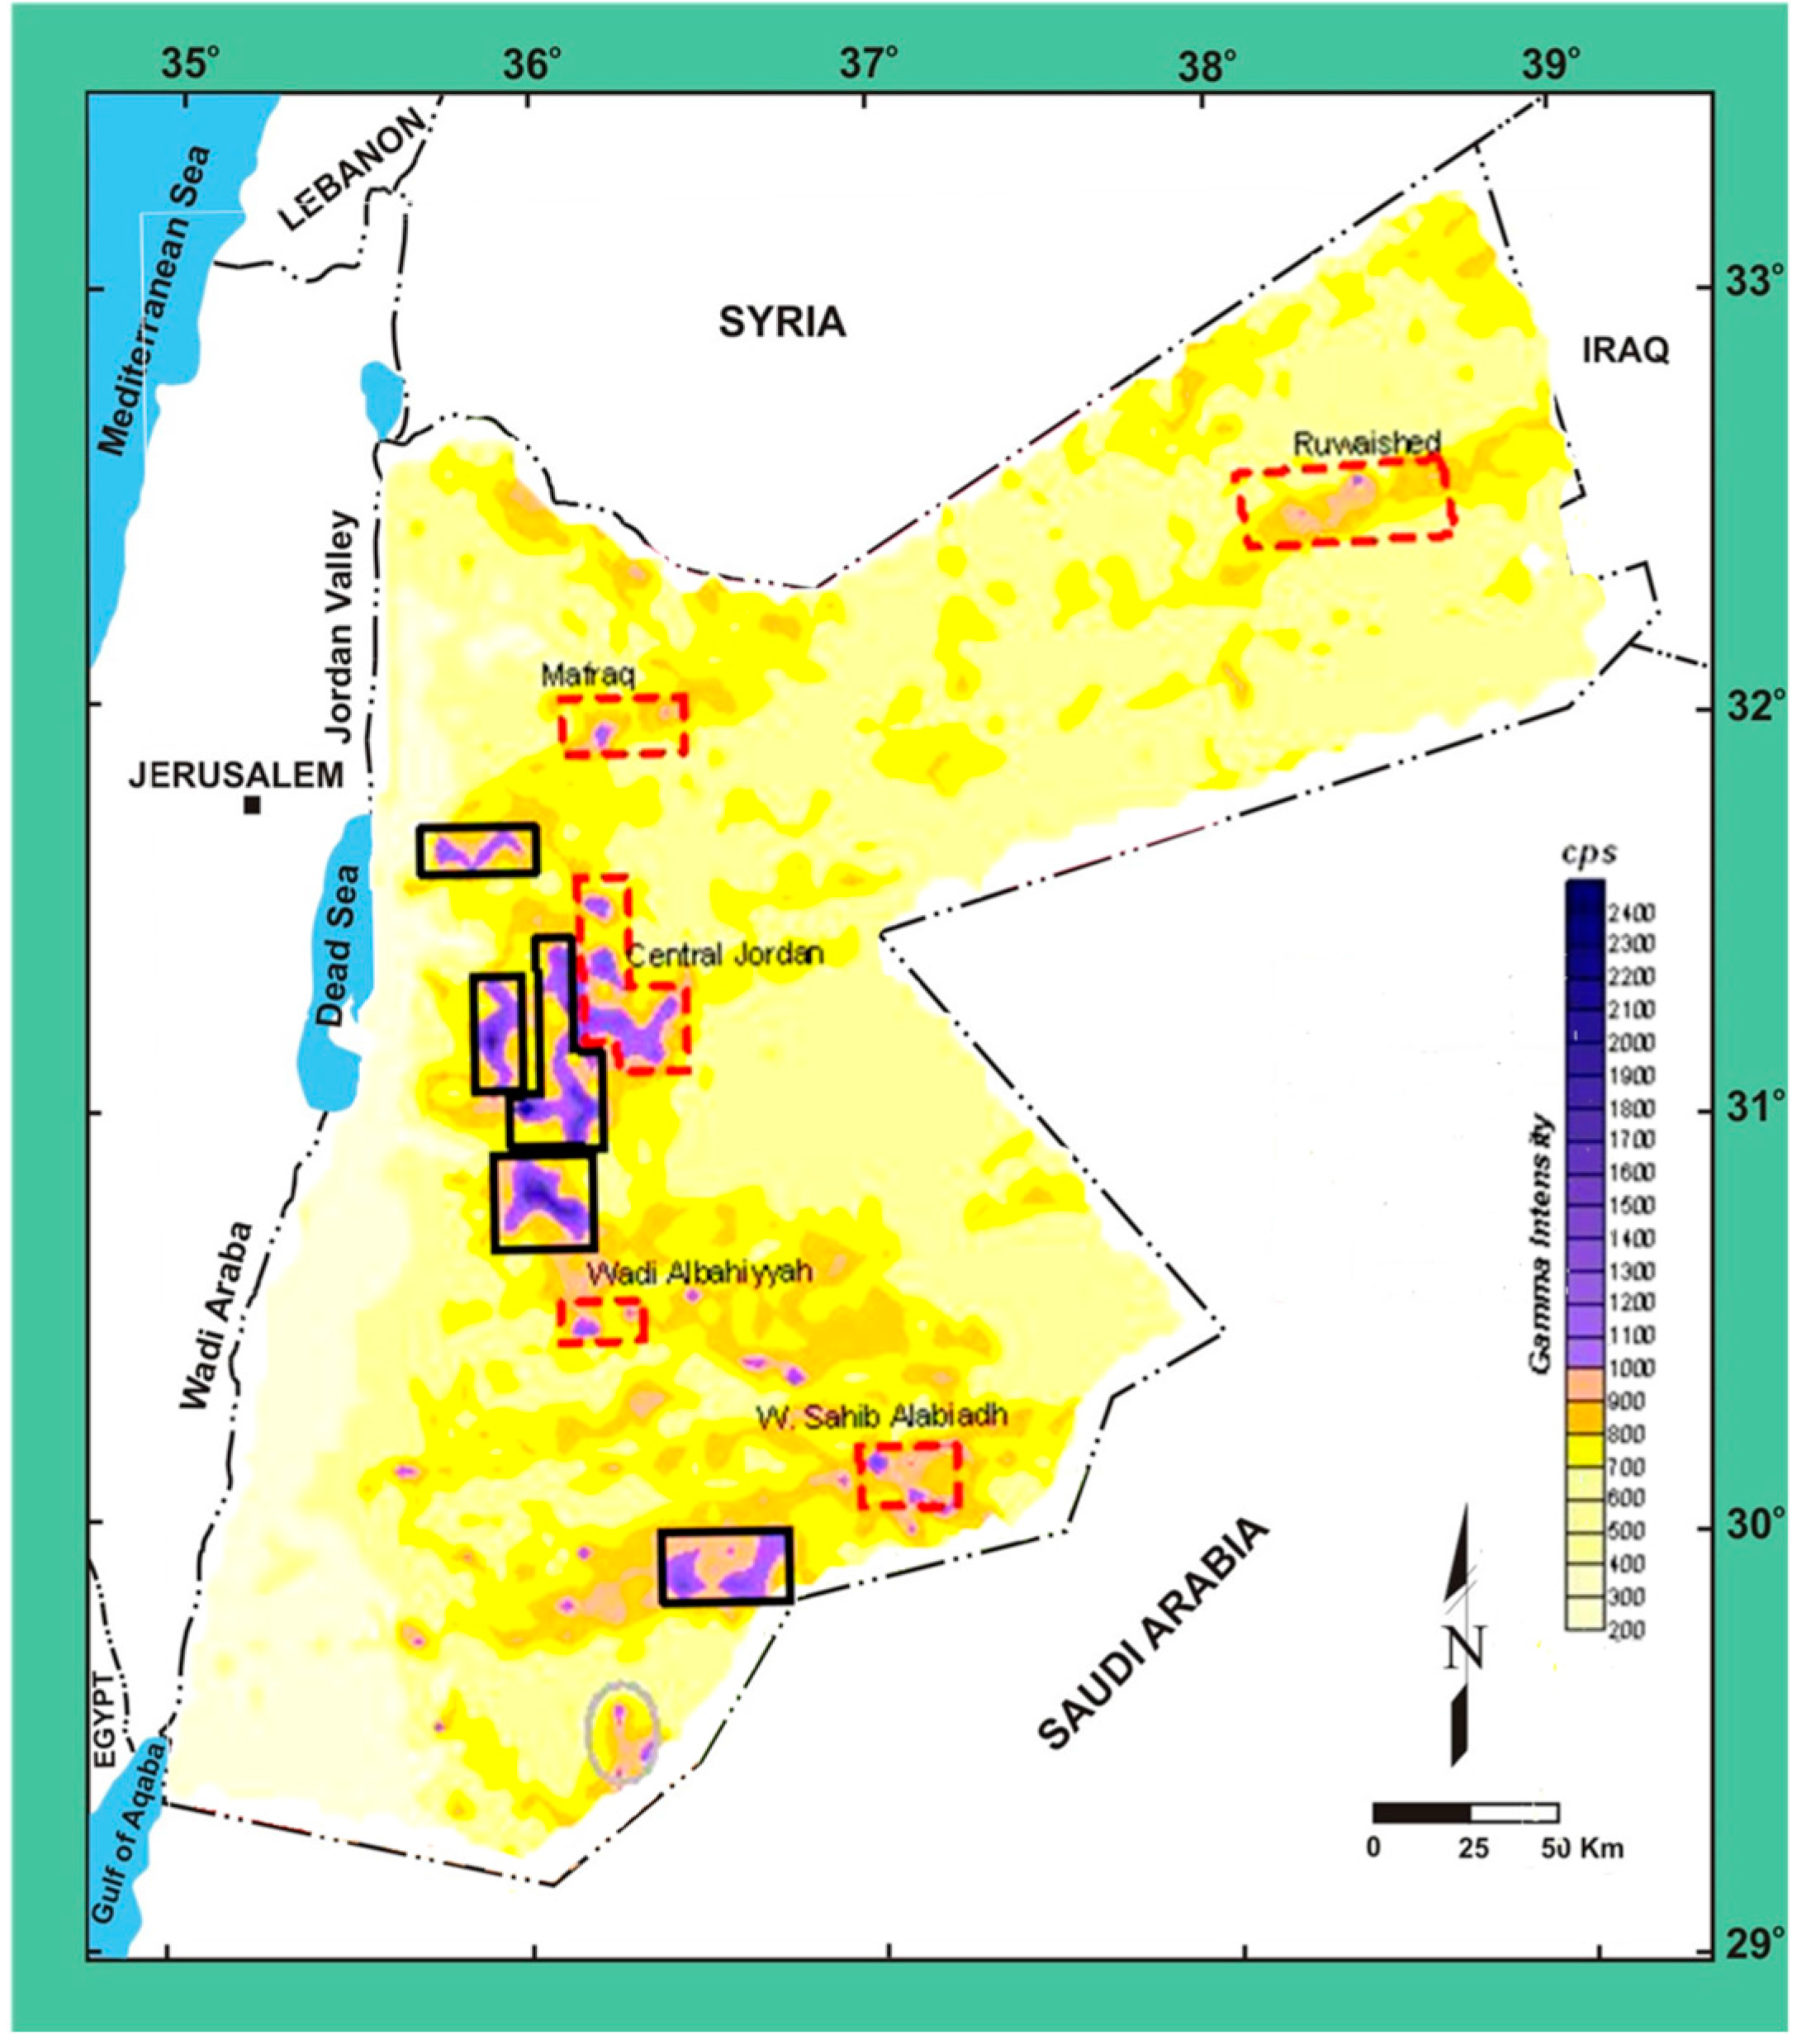
In 1980, a countrywide Gamma airborne survey was carried out revealing 11 areas with high background radiation intensity of up to 2000 counts per second (cps) as shown in Figure 1 [6]. Although most areas are related to known phosphorite formations (outlined in black), where Phosphate is being mined and exported, five of the areas were identified as potential uranium deposits (outlined in red); the most promising of the five is an area located the central part of the Jordan.
Figure 1.
Jordan countrywide Gamma intensity airborne survey, showing areas of high radiation. Known phosphate mining areas are outlined in black, areas with uranium anomalies are outlined in red, and one area with thorium anomalies is outlined in gray (modified after [6]).
Figure 1.
Jordan countrywide Gamma intensity airborne survey, showing areas of high radiation. Known phosphate mining areas are outlined in black, areas with uranium anomalies are outlined in red, and one area with thorium anomalies is outlined in gray (modified after [6]).

Naturally occurring radionuclides such as uranium, thorium and their decay products (226Ra, 222Rn) are present in a number of geological settings in Jordan. Uranium occurrences in phosphorite, oil shale, limestone, marble, sandstone have been studied over the last 40 years primarily during geological mapping and exploration projects [7,8,9,10,11,12,13,14]. Jordan does not have any assured uranium resources, or uranium mining.
The aim of this work is to present and evaluate the concentration of uranium in central Jordan, and to analyze the results in the framework of international standards for uranium ore, resources and reserves classification.
2. Geological Setting
Jordan is a small country situated to the north west of the Arabian Peninsula, south of Syria and east of the Great Rift Valley home of the Dead Sea and Jordan River, between latitudes 29° and 33° north and longitudes 34° and 39° east. The study area is located in central Jordan, approximately 65 km southeast of the capital Amman, and 40 km East of the Dead sea, and consists of two zones, the Fertile Zone (FZ) and Khan Az-Zabib (KZ) (Figure 2).

During the Late Cretaceous to early Eocene period, Jordan was situated in a shallow marine environment of the Tethys Sea. In the Cenomanian times, transgression took place in relation to a global warming event, which resulted in the deposition of mostly calcareous marine sediments.
During the Late Eocene, a regression led to a period of uplifting, folding and faulting in the region, which are mostly related to the continued tectonic movement along the Great Rift. This period is also characterized by left lateral trans-tensional events, which were responsible for the Dead Sea rifting, extensive basalt flows, that extend to Syria and Saudi Arabia [17,18,19].
The central Jordan area is located near the opening area of the Dead Sea, a sector that is strongly structured by fault system; the main faults are the Zerqa Main, Daba and Siwaqa fault systems [20,21].
Central Jordan area was mapped by the Natural Resources Authority (NRA) [20,21] and its geology was described in detail as illustrated in Figure 3 [13,18,19,22].
In 2008, Jordan Atomic Energy commission (JAEC) delineated an area of 1469 km2 in central Jordan for uranium exploration and mining, the area was licensed to Areva and was closed to all mining activities except uranium. The central Jordan uranium area map is shown in Figure 1, and its coordinates are tabulated in Table 1.
Figure 3.
Geological map of central Jordan (modified after [13]).
Figure 3.
Geological map of central Jordan (modified after [13]).


Table 1.
Coordinates of the Central Jordan uranium area, in UTM (Universal Transverse Mercator) 37° north, and in GPS.
| North (UTM) | East (UTM) | Latitude | Longitude |
|---|---|---|---|
| 3,500,685 | 246,010 | 31°36' | 36°19' |
| 3,470,281 | 245,863 | 31°20' | 36°19' |
| 3,470,281 | 256,291 | 31°20' | 36°26' |
| 3,441,306 | 255,339 | 31°04' | 36°26' |
| 3,442,076 | 232,782 | 31°04' | 36°11' |
| 3,460,200 | 233,403 | 31°14' | 36°12' |
| 3,460,734 | 222,363 | 31°14' | 36°05' |
| 3,500,685 | 222,510 | 31°36' | 36°04' |
3. Results and Discussion
The uranium concentration of 236 soil samples from central Jordan was measured using inductively coupled plasma mass spectrometry (ICP-MS) [23], a precise method that is capable of detecting uranium concentration as low as 0.001 ppm. Collected soil samples were oven dried for 24 h and sieved to remove stones and pebbles. The samples were then crushed in a ball mill to pass through a fine mesh sieve (0.5 mm), each sample was mixed after sieving to assure homogeneity.
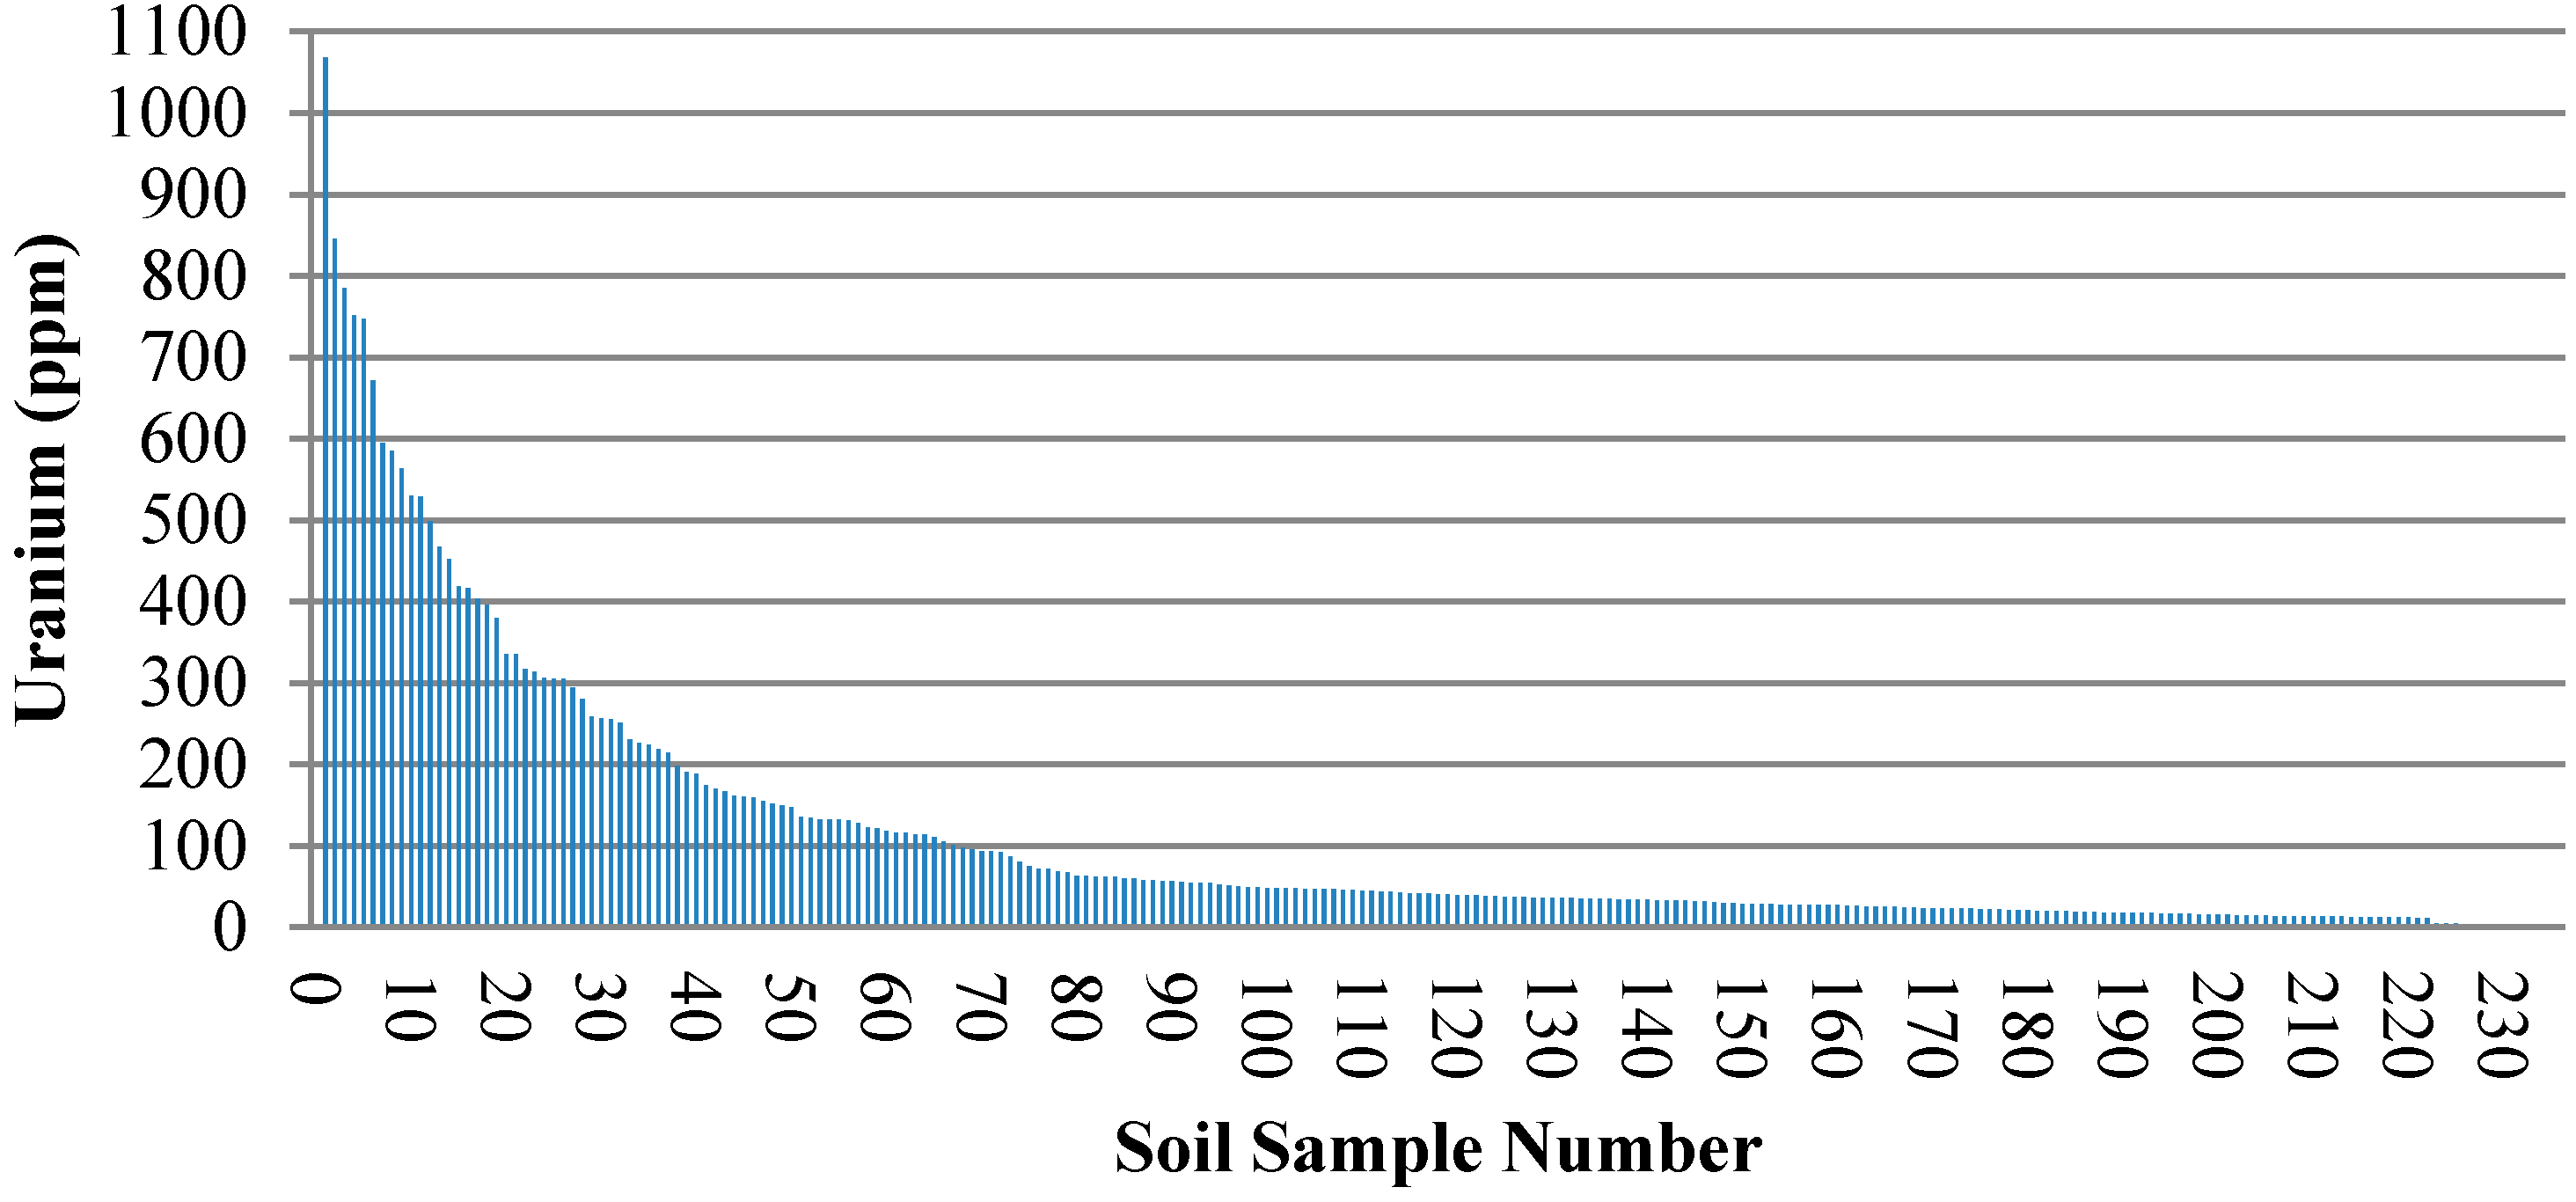
Measurement results of uranium concentration in parts per million (ppm) vs. sample number are tabulated in Table 2, and depicted graphically in Figure 4. Statistical analysis revealed that the results exhibit a very wide range of 1066 ppm for uranium concentration, with a mean value of 109 ppm, and a median of 41 ppm. Which indicate that uranium mineralization is dispersed over wide areas in small-localized areas rather than uniform concentration in a large enough layers adequate for exploitation.
The mean average value of 109 ppm uranium in the soil samples, is analogous to the concentration of secondary uranium found in phosphorite beds adjacent to the study area. The average uranium concentration in Jordanian phosphate ore of central Jordan is 105 ppm [24].
The measurements frequency distribution (Table 3) indicates that 72% of samples measured had a uranium content of less than 100 ppm, an extremely low concentration that is characteristic of natural radioactivity rather than uranium resources, and certainly falls below the cut-off grade of any commercially operated uranium mines worldwide.
In fact, the frequency distribution reveals that 86% of samples measured have a concentration below the cut-off grade of 250 ppm, which was set-up by the government of Jordan for uranium resource estimation in Central Jordan [15].
Figure 4.
Uranium concentration in parts per million (ppm) in soil samples from Central Jordan using inductively coupled plasma mass spectrometry (ICP-MS).
Figure 4.
Uranium concentration in parts per million (ppm) in soil samples from Central Jordan using inductively coupled plasma mass spectrometry (ICP-MS).

| Sample Number | Uranium (ppm) | Sample Number | Uranium (ppm) | Sample Number | Uranium (ppm) |
|---|---|---|---|---|---|
| 1 | 1068 | 36 | 219 | 71 | 93 |
| 2 | 845 | 37 | 215 | 72 | 93 |
| 3 | 785 | 38 | 198 | 73 | 92 |
| 4 | 752 | 39 | 191 | 74 | 87 |
| 5 | 747 | 40 | 188 | 75 | 80 |
| 6 | 671 | 41 | 174 | 76 | 75 |
| 7 | 595 | 42 | 170 | 77 | 72 |
| 8 | 585 | 43 | 167 | 78 | 72 |
| 9 | 564 | 44 | 162 | 79 | 69 |
| 10 | 530 | 45 | 160 | 80 | 67 |
| 11 | 529 | 46 | 159 | 81 | 63 |
| 12 | 499 | 47 | 155 | 82 | 63 |
| 13 | 467 | 48 | 152 | 83 | 62 |
| 14 | 452 | 49 | 150 | 84 | 62 |
| 15 | 419 | 50 | 147 | 85 | 62 |
| 16 | 416 | 51 | 136 | 86 | 60 |
| 17 | 404 | 52 | 134 | 87 | 60 |
| 18 | 396 | 53 | 132 | 88 | 58 |
| 19 | 380 | 54 | 132 | 89 | 58 |
| 20 | 336 | 55 | 132 | 90 | 57 |
| 21 | 336 | 56 | 131 | 91 | 57 |
| 22 | 317 | 57 | 128 | 92 | 56 |
| 23 | 314 | 58 | 123 | 93 | 55 |
| 24 | 306 | 59 | 122 | 94 | 55 |
| 25 | 305 | 60 | 118 | 95 | 55 |
| 26 | 305 | 61 | 116 | 96 | 52 |
| 27 | 294 | 62 | 116 | 97 | 51 |
| 28 | 280 | 63 | 114 | 98 | 50 |
| 29 | 259 | 64 | 114 | 99 | 49 |
| 30 | 257 | 65 | 111 | 100 | 49 |
| 31 | 256 | 66 | 105 | 101 | 48 |
| 32 | 251 | 67 | 101 | 102 | 48 |
| 33 | 231 | 68 | 98 | 103 | 48 |
| 34 | 226 | 69 | 96 | 104 | 48 |
| 35 | 224 | 70 | 93 | 105-236 | <48 |
Results were grouped into eight categories depending on the uranium content of the sample as illustrated in Figure 5, the lowest category is for uranium of less than 50 ppm of which 139 samples fallen into this category. The highest category is for uranium of more than 500 ppm of which only 11 samples fallen into this category. The rest of our measurements, 86 samples fell in the six categories in between with the majority of result closer to the lower concentration categories.
The US Nuclear Regulatory commission (NRC) has established a threshold of 500 ppm (0.05%) uranium concentration for ore grade to be deemed as source material under its regulations 10 CFR (Code of Federal Regulation) 40.4; NRC has carefully taken into account current technology and economics in selecting this threshold [25]. Applying the NRC threshold, we found that only 5% of the samples have an adequate amount of uranium concentration to pass the threshold and maybe considered with potential for exploration.
| Uranium Concentration (ppm) | Number of Samples | Frequency (%) | Cumulative Frequency (%) |
|---|---|---|---|
| Less than 50 | 139 | 59% | 59% |
| 50–99 | 30 | 13% | 72% |
| 100–149 | 18 | 8% | 79% |
| 150–199 | 12 | 5% | 84% |
| 200–249 | 5 | 2% | 86% |
| 250-299 | 6 | 3% | 89% |
| 300-499 | 15 | 6% | 95% |
| More than 500 | 11 | 5% | 100% |
Figure 5.
Uranium concentration in parts per million (ppm) vs. number of samples.

4. Conclusions
Countrywide Gamma airborne survey of Jordan revealed the presence of high radiation intensity areas, some associated with the presence of uranium mineralization. Two zones in central Jordan (Fertile zone and Khan Az-Zabib) were identified as having the highest concentration of uranium anomalies in the country.
The average uranium concentration of 236 soil samples from central Jordan was found to be 109 ppm. Farther analysis showed that more than 72% of the samples measured had a uranium content of less 100 ppm, an extremely low concentration that is characteristic of natural radioactivity rather than uranium resources.
Statistical analysis revealed that the results exhibit a very wide range of 1066 ppm for uranium concentration, with a median of 41 ppm. Results that are normally indicative of scattered mineralization rather than uniform concentration in large enough layers adequate for exploitation.
We can finally conclude, based on our findings, that the central Jordan area offers little or no uranium prospectively. Furthermore, that apart from perhaps by-product uranium arising from phosphate mining, Jordan does not seem to have any prospect for radioactive minerals.
Acknowledgement
The author would like to extend special thanks to the three anonymous reviewers for their valuable and constructive comments, which have helped improving the quality of the article.
Conflicts of Interest
The authors declare no conflict of interest.
References
- Eldar, A. Jordan Aims to Develop Nuclear Power. Available online: http://www.haaretz.com/news/king-abdullah-to-haaretz-jordan-aims-to-develop-nuclear-power-1.210546 (accessed on 20 March 2015).
- Dawood, A.; Sayidh, W.; Nofal, I. Head of the Atomic Energy Commission in a Comprehensive Dialogue, Ad-Dustour. Available online: http://www.addustour.com/2009/6/16/18/ (accessed on 20 March 2015).
- Toukan, K. Jordan’s Nuclear Reactor as an Alternative Source of Energy, Alrai Studies Center. Available online: http://alraicenter.com/alraicenter.com/User_Site/Site/View_Articlear.aspx?type=2&ID=254 (accessed on 20 March 2015).
- Toukan, K. Jordan and France Sign a Protocol on the Use Nuclear Energy for Peaceful Purposes. Alarab Alyawm: Amman, Jordan, 28 August 2008. (In Arabic) [Google Scholar]
- Haddad, S.; Hgazeen, F. No Real Obstacles in Front of Jordan to Implement its Nuclear Program. Alarab Alyawm: Amman, Jordan, 19 July 2009. (In Arabic) [Google Scholar]
- Phoenix Corporation. Comprehensive Airborne Radiation Survey of the Hashemite Kingdom of Jordan; Natural Resources Authority (NRA): Amman, Jordan, 1980. [Google Scholar]
- Abu-ajamieh, M. Uranium Reserves in Jordan, Geological Survey and Bureau of Mines; Natural Resources Authority (NRA): Amman, Jordan, 1974. [Google Scholar]
- Healy, R.; Young, J. Mineralogy of U-Bearing Marls from the Jordanian Desert; Unpublished Report; Cameco Corporation: Saskatoon, SK, Canada, 1998. [Google Scholar]
- Smith, B.; Powell, J.; Bradley, A.; Gedeon, R.; Amro, H. Naturally occurring uranium pollution in Jordan. Int. J. Rock Mech. Min. Sci. Geomech. Abstr. 1996, 33, 96A. [Google Scholar]
- Abed, A.M.; Khalid, H. Uranium distribution in the Jordanian phosphorite. Dirasat 1985, 12, 91–103. [Google Scholar]
- Helmdach, F.; Khoury, H.; Meyer, J. Secondary uranium mineralization in the Santonian-Turonian, near Zarqa, North Jordan. Dirasat 1985, 12, 105–112. [Google Scholar]
- Xoubi, N. dan’s Recent & Ongoing Activities in Uranium Exploration. In Proceedings of the 43rd Meeting of Joint Uranium Group, Vienna, Austria, 17–19 June 2009.
- Khoury, H.; Salameh, E.; Clark, I. Mineralogy and origin of surficial uranium deposits hosted in travertine. Appl. Geochem. 2014, 43, 49–65. [Google Scholar]
- Fleurance, S.; Cuney, M.; Malartre, F.; Reyx, J. Origin of the extreme polymetallic enrichment (Cd, Cr, Mo, Ni, U, V, Zn) of the Late Cretaceous—Early Tertiary Belqa Group, central Jordan. Palaeogeogr. Palaeoclim. Palaeoecol. 2013, 369, 201–219. [Google Scholar]
- Uranium Mining Agreement. In Government of Jordan and Areva, Jordan Official Gazette No 5037; Prime Ministry–Directorate of the Official Gazette: Amman, Jordan, 2010; pp. 3424–3551.
- Central Intelligence Agency. The World Fact Book; Base 803051AI (C00697)4-04; Central Intelligence Agency: Washington, DC, USA, 2013. [Google Scholar]
- Bender, F. Geology of Jordan: Contribution of the Regional Geology of the Earth; Gebrüder Borntraeger: Berlin, Germany, 1974. [Google Scholar]
- Powell, J.H.; Moh’d, B.K. Evolution of Cretaceous to Eocene alluvial and carbonate platform sequences in central and south Jordan. GeoArab. Middle East Pet. Geosci. 2011, 16, 29–82. [Google Scholar]
- Powell, J.H. Stratigraphy and Sedimentology of the Phanerozoic Rocks in Central and Southern Jordan, Bull. 11; Part B: Kurnub, Ajlun and Belqa Group; Geology Directorate, Natural Resources Authority (NRA): Amman, Jordan, 1989. [Google Scholar]
- Jaser, D. The Geology of Khan Ez Zabib, Bull. 3; Natural Resources Authority (NRA): Amman, Jordan, 1986. [Google Scholar]
- Barjous, M. The Geology of Siwaqa, Bull. 4; Natural Resources Authority (NRA): Amman, Jordan, 1986. [Google Scholar]
- Quennell, A. Geological Map of Jordan (East of the Rift Valley 1:250,000). Department of Lands and Survey: Amman, Jordan, 1956. [Google Scholar]
- Toukan, K. Strategy of Nuclear Energy in Jordan Abdul Hameed Shoman Foundation. Available online: http://www.shoman.org.jo/lecture/GetMaterial.aspx?MID=478 (accessed on 20 March 2015).
- Abed, A. Review of uranium in the Jordanian phosphorites: Distribution, genesis and industry. Jordan J. Earth Environ. Sci. 2012, 4, 35–45. [Google Scholar]
- Environmental Protection Agency (EPA). Technologically Enhanced Naturally Occurring Radioactive Materials from Uranium Mining; US Environmental Protection Agency: Washington, DC, USA, 2008. [Google Scholar]
© 2015 by the authors; licensee MDPI, Basel, Switzerland. This article is an open access article distributed under the terms and conditions of the Creative Commons Attribution license (http://creativecommons.org/licenses/by/4.0/).
Share and Cite
MDPI and ACS Style
Xoubi, N. Evaluation of Uranium Concentration in Soil Samples of Central Jordan. Minerals 2015, 5, 133-141. https://doi.org/10.3390/min5020133
AMA Style
Xoubi N. Evaluation of Uranium Concentration in Soil Samples of Central Jordan. Minerals. 2015; 5(2):133-141. https://doi.org/10.3390/min5020133
Chicago/Turabian StyleXoubi, Ned. 2015. "Evaluation of Uranium Concentration in Soil Samples of Central Jordan" Minerals 5, no. 2: 133-141. https://doi.org/10.3390/min5020133