Copper Isotope Constraints on the Genesis of the Keweenaw Peninsula Native Copper District, Michigan, USA


1
A. E. Seaman Mineral Museum and Department of Geological and Mining Engineering and Sciences, Michigan Technological University, Houghton, MI 49931, USA
2
Department of Geology, Juniata College, Huntingdon, PA 16652, USA
*
Author to whom correspondence should be addressed.
Minerals 2017, 7(10), 185; https://doi.org/10.3390/min7100185
Submission received: 22 August 2017
/
Revised: 17 September 2017
/
Accepted: 20 September 2017
/
Published: 30 September 2017
(This article belongs to the Special Issue Geochemistry and Mineralogy of Hydrothermal Metallic Mineral Deposits)
Abstract
:The Keweenaw Peninsula native copper district of Michigan, USA is the largest concentration of native copper in the world. The copper isotopic composition of native copper was measured from stratabound and vein deposits, hosted by multiple rift-filling basalt-dominated stratigraphic horizons over 110 km of strike length. The δ65Cu of the native copper has an overall mean of +0.28‰ and a range of −0.32‰ to +0.80‰ (excluding one anomalous value). The data appear to be normally distributed and unimodal with no substantial differences between the native copper isotopic composition from the wide spread of deposits studied here. This suggests a common regional and relatively uniform process of derivation and precipitation of the copper in these deposits. Several published studies indicate that the ore-forming hydrothermal fluids carried copper as Cu1+, which is reduced to Cu0 during the precipitation of native copper. The δ65Cu of copper in the ore-forming fluids is thereby constrained to +0.80‰ or higher in order to yield the measured native copper values by reductive precipitation. The currently accepted hypothesis for the genesis of native copper relies on the leaching of copper from the rift-filling basalt-dominated stratigraphic section at a depth below the deposits during burial metamorphism. Oxidative dissolution of copper from magmatic source rocks with magmatic δ65Cu of 0‰ ± 0.3‰ is needed to obtain the copper isotopic composition of the metamorphogenic ore-forming hydrothermal fluids. In order to accommodate oxidative dissolution of copper from the rift-filling basalt source rocks, the copper needs to have been sited in native copper. Magmatic native copper in basalt is likely stable when the magma is low in sulfur. Low sulfur is predicted by the lack of sulfide minerals in the ore deposits and in the rift-filling basalt-dominated section, which are source rocks, the same rocks through which the ore fluids moved upwards, and the host rocks for the native copper ores. When combined with geologic evidence and inferences, the copper isotopic composition of native copper helps to further constrain the genetic model for this unique mining district.
1. Introduction
Copper is one of the top five utilised metals today. Thus, the exploration for, and discovery of, economic deposits of copper contribute to our standard of living. An understanding of the genesis of copper deposits is a critical component in the discovery of new deposits and the extension of existing deposits. Geologists have assembled a wide variety of data to build genetic and exploration models for copper deposits. In the last half of the 20th century, geochemical characterization has become an increasingly important part of this database.
Advances in analytical methods more than 50 years ago led to a utilization of stable isotopes of sulfur, oxygen, carbon, and hydrogen to trace the origins of these elements in mineral-forming environments. However, at that time analytical methods were not sufficiently precise and accurate enough to be able to measure natural isotopic variation of metals, such as copper, to trace their conditions of formation. For copper, the natural isotopic variation is small because of the small mass difference between the two stable isotopes of copper, 63Cu and 65Cu, which in turn results in small mass-dependent fractionation. There are virtually no geologic studies involving copper isotopes prior to 1999 [1], but subsequent advances in analytical methods that lowered analytical errors have made it possible to investigate the natural variation of copper isotopes in geological materials (e.g., [2,3,4]). In the two decades following, there have been multiple studies that document the natural variability of copper isotopes in mineral deposit environments (e.g., [5,6,7,8,9,10,11,12,13,14,15]). Copper isotopic studies have demonstrated their value in developing a better understanding of the processes involved in the genesis of copper-bearing minerals, and Mathur [16] has demonstrated that copper isotopes are directly applicable to mineral exploration. However, copper isotopic data on minerals are still not extensive and there are a limited number of experimental studies that provide a foundation for interpretation.
There are important copper deposits/districts for which copper isotope characterization is incomplete [6] or lacking. The Keweenaw Peninsula, Michigan, USA hosts the world’s largest concentration of native copper. It is among important copper districts/deposits for which geologic interpretation of copper isotope data is heretofore not available. The ore deposits of the Keweenaw Peninsula are unique as native copper represents more than 99% of the district production of about 11 billion lbs of refined copper from 1845 to 1968 [17]. While other districts have produced more copper, it is not predominately sited in native copper. The Keweenaw Peninsula native copper district is historically notable for being the first major mining rush in North America, beginning in 1841, with the opening of the first profitable native copper mine in 1845. The Keweenaw Peninsula was an important source of native copper used by Native Americans to make a wide variety of artifacts and trade them across eastern North America [18,19], and thus, Mathur et al. [20] determined the copper isotopic composition of an extensive set of native copper samples from the Keweenaw Peninsula as a means to fingerprint the source of artifacts. Mathur et al. [21] also analyzed samples from the Keweenaw and elsewhere to investigate the history of copper in the U.S. cent.
In this study, we have assembled a comprehensive data set from published studies and added new data to fill in geologically relevant gaps. The objective of this study is to describe and interpret the variation of copper isotopes in order to constrain the genesis of native copper ore deposition in the Keweenaw Peninsula native copper district.
2. Geologic Setting
The Keweenaw Peninsula native copper district is located on the southwest edge of the Midcontinent Rift of North America (Figure 1), which developed from about 1.15 to ~1.0 Ga. This failed continental rift is a large structure that extends more than 2000 km. Beneath the center of Lake Superior, offshore of the Keweenaw Peninsula, the rift is filled with more than 25 km of dominantly subaerial basalt lava flows. This basalt-dominated section is overlain by a succession, about 8 km thick, of clastic sedimentary rocks [22].
About 5 km of rift-filling basalt-dominated stratigraphic section, Portage Lake Volcanics (PLV), is exposed on the Keweenaw Peninsula and it hosts the economic native copper deposits; the exposed thickness of the PLV is greater towards the center of the rift as its exposed base on the Keweenaw Peninsula is truncated by a reverse fault (Keweenaw fault, Figure 2). The exposed PLV is composed of over 200 subaerial basalt lava flows that have erupted from fissure volcanoes. These flows are typically about 10 m thick, ranging in thickness from less than 1 to 450 m, and are characterized by a massive interior overlain by vesicular or brecciated flow tops. Rhyolite lava flows are restricted to the lower 0.5 km of the PLV near the truncated base and are less than 1% of the formation. Rhyolites are more abundant in older rift-related formations and are about 10% of the rift-filling volcanic rocks as a whole [23]. Stratigraphically scattered beds of conglomerate and sandstone occur between the basalt lava flows of the PLV and constitute less than 5% of the exposed PLV. Conglomerates and sandstones are generally red-colored and the pebbles to boulders of the conglomerates are dominantly composed of rhyolite and lesser amounts of basalt.
Magmatism waned but the subsidence continued as the PLV succession of dominantly basalt lava flows is overlain by an exposed thickness of about 6 km of clastic sedimentary rocks of the Oronto Group. The Oronto Group consists of red-colored conglomerate and sandstone, deposited in alluvial fans, overlain by gray to black siltstone and shale, deposited in a lake, and followed by red- to brown-colored fine sandstone and siltstone, deposited by shallow streams.
Rift-bounding normal faults, e.g., Keweenaw fault (Figure 2), were inverted into high-angle reverse faults by regional Grenvillian compression late in the history of the rift [25]. In addition to the reactivation of existing faults, new faults, fractures, minor flexures and folds developed in response to regional compression. The reactivated and new faults/fractures provided important pathways for the upward movement of mineralizing hydrothermal fluids and the focusing of them into sites of ore deposition [26,27]. Faulting is well documented as synchronous with native copper mineralization in some deposits and generally faults/fractures are connected to mineralization [26,27,28,29,30,31].
2.1. Native Copper Deposits
The Keweenaw Peninsula native copper district is roughly 200 km long and includes numerous dormant mines (Figure 2). The main economically productive part of the district is about 4 km wide and 40 km long, and hosts about 98% of the 11 billion lbs of copper production from deposits at a weighted average grade of 1.85% copper [17]. To the southwest of the main part of the district, the Greenland-Mass subdistrict is about 1 km wide and 10 km long, with about 170 million lbs of copper production or about 1.6% of the total district production (Figure 2; [28]). The native copper deposits are hosted by the PLV, however, younger rift-filling stratigraphic units of the Oronto Group host native copper, although not of economic or near economic grade and tonnage. The sedimentary rock-hosted (Oronto Group) stratiform chalcocite-dominated White Pine mine is the result of two stages of copper deposition, chalcocite followed by a second stage of native copper that is likely genetically connected to the native copper deposits, the native copper by itself is not economic [32]. White Pine is outside of the scope of this study. While the economic native copper-dominated deposits are restricted to the Keweenaw Peninsula, Midcontinent Rift related rocks exposed throughout the Lake Superior region host native copper in lesser amounts (Figure 1).
Most of the mined native copper occurs in tabular to lensoidal deposits that are stratigraphically bounded by much less permeable and porous rocks. About 58.5% of the total district production was from brecciated and vesicular flow tops, which are underlain and overlain by relatively massive flow interiors. About 39.5% of the total district production was from four different conglomerate and sandstone beds. These red-colored beds are underlain and overlain by lava flows. The single largest deposit in the district is hosted by the Calumet & Hecla Conglomerate, from which 4.2 billion lbs of copper was produced (38.3% of the total district production or nearly all of the conglomerate-hosted production). There were many different flow tops that yielded native copper, but most of the copper was produced from the tops of two flows, Kearsarge and Baltic, which together yielded about 4.1 billion lbs or 37% of the district copper production. Most of the remaining production came from eight other flow tops. Tabular vein or fissure dominated deposits accounted for about 210 million lbs or 1.9% of the total district production [17], however there was production of copper from veins associated with many of the stratabound deposits, which is not counted in this number although this is not likely a large amount of production. About 3/4 of the vein/fissure deposits occur north of the area that hosts most of the stratabound deposits (Figure 2) with the other vein/fissure production from the Greenland-Mass subdistrict. In the Greenland-Mass subdistrict, the vein/fissure type of native copper represented a much higher proportion (ca. 30%) of the total subdistrict production as compared to the overall district proportion of about 2%. There is a concentration of native copper deposits connectable to the transverse Allouez Gap fault, which acted as an important pathway for ore-forming hydrothermal fluids (Figure 2; [27]).
Almost all of the metal produced from the district was copper as native copper. A very small amount of silver (very approximate 0.05 to 0.5 oz per ton from incomplete records) was recovered in the form of native silver closely associated with the native copper. The native copper was precipitated with a suite of secondary hydrothermal minerals equivalent to zeolite to prehnite-pumpellyite low temperature and pressure metamorphic mineral assemblages [33,34,35,36,37]. These secondary hydrothermal minerals follow a regular paragenetic sequence on a district-wide basis, although individual deposits deviate based on their spatial location and local differences in the environment of precipitation. Overall, the paragenesis of stratabound and vein/fissure deposits is consistent with one another. In the main part of the district, minerals precipitated during peak hydrothermal conditions (prograde), such as epidote and pumpellyite, were followed by those precipitated from lower temperature fluids during the collapse of the hydrothermal system (retrograde) such as laumontite, analcime, and adularia. The paragenetically later lower temperature minerals generally lack associated native copper in the main part of the district. There is a district-wide regular spatial variation in the secondary hydrothermal mineral assemblages, as well as definable spatial variation within individual deposits [33]. The district-wide spatial variation of hydrothermal mineral assemblages corresponds to district-wide spatial variation in temperature with the main part of the district being at the higher peak temperatures, while nearby areas were simultaneously at lower temperatures. When the main part of the district was precipitating minerals, such as epidote and native copper at peak temperatures of about 300 °C to 200 °C, areas on the fringe were around 150 °C to 100 °C precipitating minerals, such as laumontite, analcime, and native copper, and thus, laumontite and analcime in the district formed at earlier and later times. Dehydration was an important process at a depth below the native copper deposits [34].
2.2. Model of Native Copper Deposition
Multiple hypotheses have been proposed for the genesis of the native copper deposits [28,36,37]. Since movement of the hydrothermal fluids was up-dip (e.g., [28,30,37]), the source of copper was down-dip. White [37] evaluated the two most likely the sources of copper at depth beneath the deposits: the leaching of copper from rift-filling basaltic volcanic rocks by metamorphogenic hydrothermal fluids or from magmatic hydrothermal fluids emanating from concealed intrusives. On the basis of several arguments, White [37] concluded that magmatic hydrothermal fluids were unlikely to have been the source of the copper. The principal argument is field evidence that documents native copper was precipitated long after almost all of the rift-related magmatism ended [37]. Subsequent radiometric age dating and bracketing of lithostratigraphic units (e.g., [38,39,40]), and the dating of the native copper mineralization itself [41] demonstrate that more than 10 million years elapsed between the end of significant magmatism and native copper mineralization. Temperature history models predict that peak metamorphic conditions at depth in the rift-filling volcanic strata occurred millions of years after rift-filling magmatism ended [42]. Widespread distribution of native copper throughout the exposed rift strata (Figure 1) argues against a magmatic origin and in favor of regional metamorphogenic ore-forming hydrothermal fluids. For more than 50 years, the favored hypothesis for the source of copper has been from the leaching of rift-filling basalt by regional burial metamorphogenic hydrothermal fluids (Figure 3; [27,33,35,37,43,44,45,46,47]). The abundance of copper in the basalt when combined with reasonable parameters for leaching demonstrates that basalt is a viable source rock [37,43]. Brown [45,48] has proposed a variant of the metamorphogenic genetic model; a hybrid evolved meteoric and metamorphogenic fluid model. The copper isotope data are useful to evaluate the magmatic versus the metamophogenic origin of the copper.
The temperature of ore-forming fluid generation in the source area is likely to have been in excess of 300 °C, but less than 500 °C, according to the thermal modeling of Woodruff et al. [42]. Copper was likely transported in slightly alkaline pH hydrothermal fluids as a chloride complex CuCl2− (Cu1+) [43,45]. The charge on the copper in the hydrothermal fluids is an important constraint for the interpretation of the copper isotope data presented below. The metamorphogenic hydrothermal fluids moved up dip from the source zone through stratigraphically these same rocks, and precipitated native copper in these same rocks, which are now ore host rocks (Figure 3). Native copper, as essentially the only copper ore mineral, is a strong indication that there was a lack of sulfur in the ore-forming fluids [37,43,45], and thus, a lack of sulfur in the source rocks, a lack of sulfur in the rocks through which the fluids moved upwards towards ore deposits, and a lack of sulfur in the ore host rocks or in other words there was a lack of sulfur in the rift-filling basalt-dominated section. The lack of sulfur in the rift-filling basalts can be explained by a lack of or very low sulfur in the magmas before eruption and/or the loss of sulfur by degassing from the subaerial lava flows. The reduction of Cu1+ from the metamorphogenic hydrothermal fluids resulted in precipitation of native copper, Cu0. Püeschner [35] concluded that oxygen and hydrogen stable isotope data for minerals associated with precipitation of native copper are consistent with metamorphogenic fluids mixing with meteoric water input at the time of precipitation. He [35] also concluded that there was a lack of involvement of seawater. Mineral and water-rock reactions and fluid mixing (dilute resident waters) likely facilitated precipitation of native copper [27,43,45,49].
3. Analytical Methods
Native copper specimens that lacked oxidative rims and larger masses of non-weathered copper were chosen for analysis because the oxidation of native copper can change the copper isotope value [20]. Approximately 0.2 g of native copper was dissolved in 4 mL of heated ultrapure 8 M HNO3. A small aliquot was diluted to 100 ppb for isotopic analysis. Native copper samples did not require ion chromatographic separations, as shown in Mathur et al. [50].
Isotopic analysis is otherwise the same as presented in Mathur et al. [21,50]. Samples reported here were measured on the Neptune at the Pennsylvania State University. They were corrected for mass bias by bracketing with the NIST 976 standard. Samples are reported in the traditional per mil unit as compared to the NIST 976. Reported values are an average of 1 block of 30 ratios, measured at separate times in the analytical session. An in house standard (USA cent from 1838, reported in Mathur et al. [21] and Yao et al. [51]) was interleaved throughout the session and the δ65Cu = −0.04‰ ± 0.07‰ (n = 5, 2σ), which overlapped the previous values reported. The error of the NIST 976 bracketed by itself throughout the measuring session varied 0.09‰ (n = 56, 2σ). This is considered the error for analysis as none of the replicates of the unknowns fell outside of the reported errors.
4. Copper Isotopic Composition of Keweenaw Native Copper
We have compiled an extensive set of 121 copper isotopic measurements on native copper from the Keweenaw Peninsula native copper district of Michigan, USA that are geographically from one end of the district to the other (Table 1, Figure 2), and include the major deposit types (basalt-hosted, conglomerate-hosted, and vein/fissure) (Table 2). Forty-three of these data are previously unpublished (Table 2).
There is one obvious anomalous sample from the Copper Falls vein deposit with a δ65Cu of 2.29. It is easily discernible from a simple inspection of the data (Table 1) or by comparison to a dot histogram of the other data (Figure 4). It is statistically anomalous on a box plot (not shown here). This anomalous sample is rejected from the following description of the copper isotopic character of Keweenaw native copper but is briefly considered in the discussion.
The data range from −0.32‰ to 0.80‰ δ65Cu. They are not strictly normally distributed according to statistical testing, but they are visually about normally distributed (Figure 4). On a probability plot (not shown here) they are close to linear indicative of a near normal distribution. Overall, the distribution is visually unimodal, suggesting that the same processes operated similarly throughout the district. The overall mean is +0.28‰ δ65Cu with a very similar median of +0.27‰, as expected for normally distributed data. The 90% confidence interval of the mean is +0.25‰ to +0.31‰, and the one standard deviation of the mean is 0.20‰.
A comparison of the larger basalt-hosted native copper deposits (Kearsarge, Baltic, Osceola, and Isle Royale) and the conglomerate-hosted deposit (C & H), the largest deposit in the district, with each other by analysis of variance suggests that there are no differences between their mean values at the 90% confidence level. When all of the data from basalt-hosted native copper deposits are compared to all of those from conglomerate-hosted deposits by using a simple t-test, the results suggest that they may be statistically different from one another. The nonparametric Mann-Whitney U test gives the same statistical conclusion that they are statistically different. The basalt-hosted deposits, mean of +0.31‰ δ65Cu and a 90% confidence interval of +0.28‰ to +0.34‰ δ65Cu are slightly higher than the conglomerate-hosted deposits, mean of +0.18‰ δ65Cu and a 90% confidence interval of +0.11‰ to +0.25‰ δ65Cu. However, the 90% confidence intervals do overlap when a 0.09‰ precision is considered (errors on all data are similar). While the means may be different, the dot histogram illustrates that the overlap of the individual values is considerable (Figure 4). We conclude that the copper isotopic composition of these two types of stratabound deposits is similar to one another, but the conglomerate-hosted deposits are biased towards lower δ65Cu.
Overall, comparing the vein/fissure deposit data to the stratabound deposit data by the t-test indicates that there is no statistical difference between the means of these two groups, as illustrated by the dot histogram (Figure 4). Thus, all of the main deposit types are similar to each other.
Geographically, the vein/fissure deposits are just east of the main part of the native copper district and both are separated from the Greenland-Mass subdistrict by an area with few known native copper deposits (Figure 2). There is no statistical difference in the means of these three geographic areas on the basis of analysis of variance. There is a tendency for those deposits in the productive core of the district (many connectable to the Allouez Gap fault) to have slightly lower values, although there is considerable overlap of the within deposit variation.
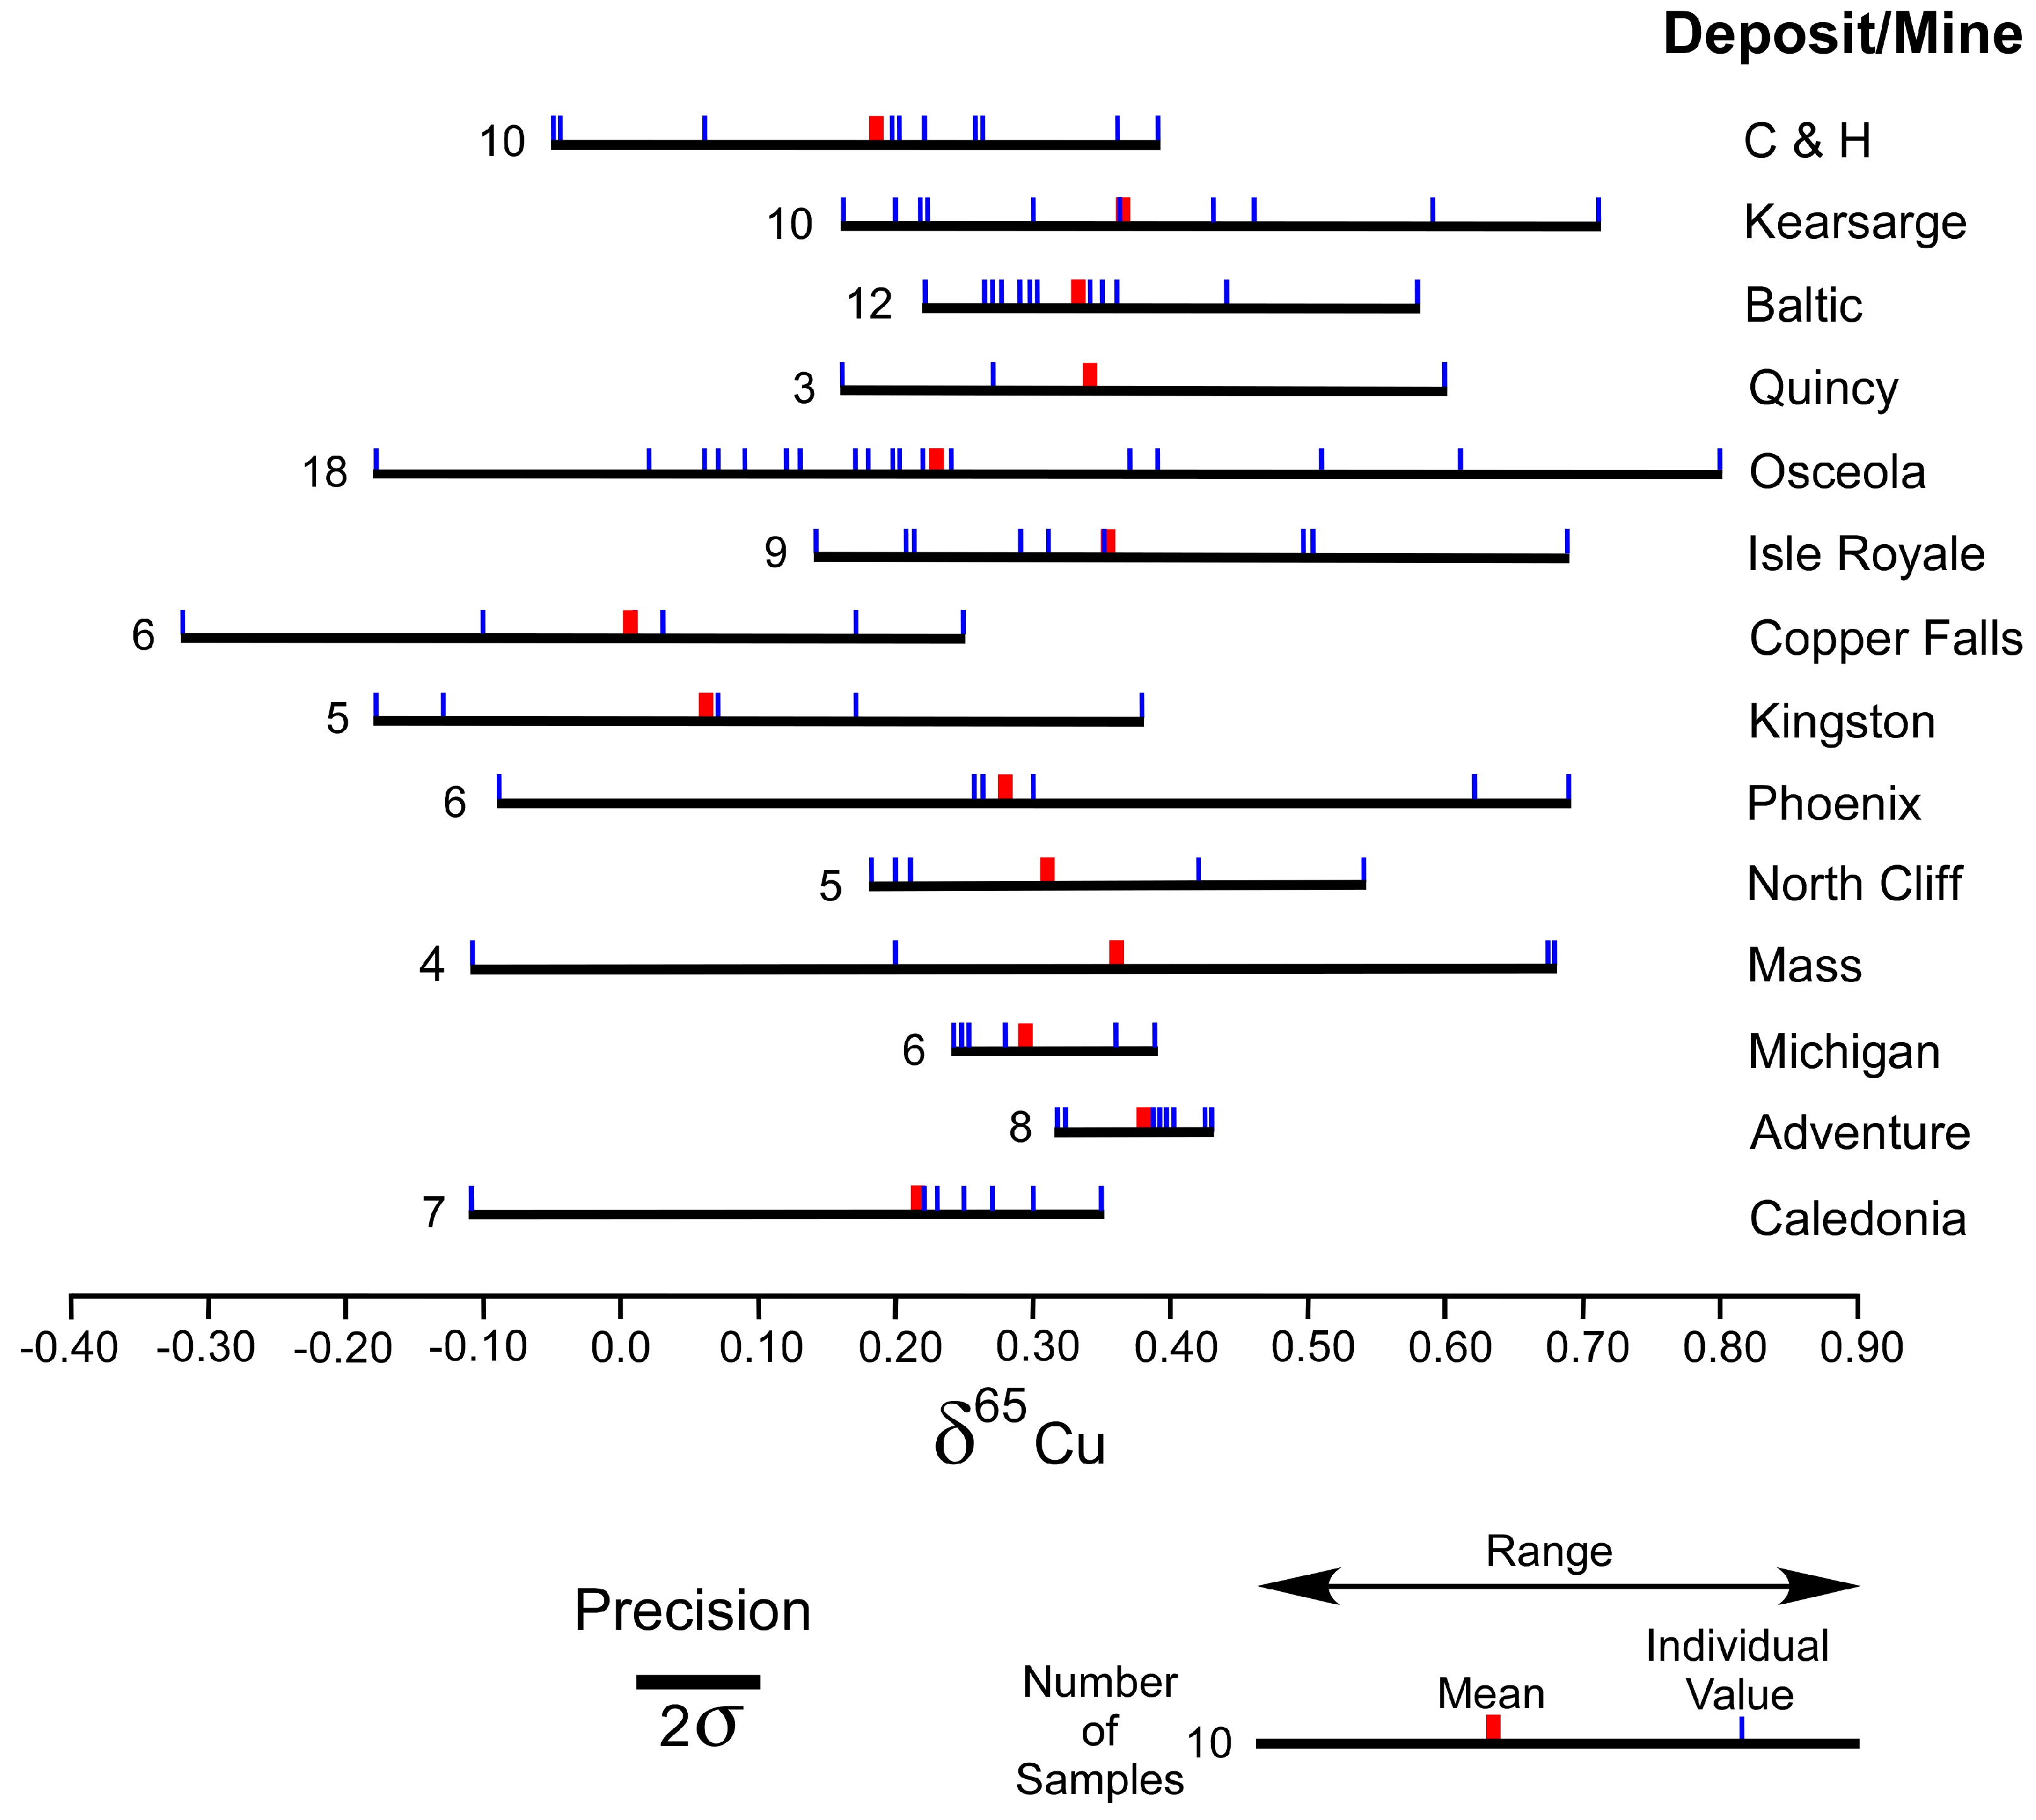
There are insufficient data to statistically test the difference between all of the various deposits/mines, however visually they overlap with one another (Figure 5). While additional data may demonstrate significant differences between certain deposits/mines, we conclude that, in general, there is no substantial difference in copper isotopic composition between the native copper deposits that are included in this study. In addition, the data are approximately normally distributed with a single population, and hence, we will focus on a single overall interpretation of the copper isotopic data in light of existing geologic and geochemical constraints.
5. Discussion
Fractionation of copper isotopes occurs when the dissolution or precipitation is incomplete as seen in copper ores from many different deposits [5,7,8,10]. If all of the copper is dissolved from the source rocks, then the δ65Cu of the copper in the hydrothermal fluids will be the same as that of the source rocks, and if all of the copper is precipitated from ore-forming hydrothermal fluids, then the measured δ65Cu in the total mass of copper minerals will be the same as the δ65Cu of the fluid. There is negligible fractionation of δ65Cu at magmatic temperatures in igneous rocks [54]. Fractionation is less between the aqueous and copper mineral species at higher temperatures than at lower temperatures for hydrothermal fluids involving dissolution or precipitation [8]. Fractionation can be quite significant (1‰ to 4‰) at low temperatures involving abiotic redox reactions [16,50]. Isotopically heavier Cu, higher δ65Cu, is favored when Cu is at a higher oxidation state in minerals or aqueous fluids [20,50] and isotopically lighter copper, lower δ65Cu, when Cu is at a lower oxidation state. When the oxidation state is the same, fractionation is typically small within the limits of precision. However, experiments on the dissolution of Cu1+ from a source rock into Cu1+ in an aqueous fluid by Maher et al. [55], at temperatures of 250 °C to 300 °C indicate that δ65Cu composition of the copper in the aqueous fluid is lighter than the source rock (fractionation is generally 0‰ to −1‰). Fractionation of copper isotopes can be controlled by factors such as temperature, pH, salinity, and the types of aqueous ligands, but these controls are not well defined by experimental data [55,56].
The derivation of the δ65Cu in the Keweenawan native copper ore-forming fluids is a function of: the copper isotopic composition of the probable source rocks, the rift-filling basalts with minor rhyolite, and/or minor conglomerate derived from these magmatic rocks; processes leading to metamorphogenic dissolution of the copper into the fluids; and, precipitation of the copper from the fluids. Intra-crystalline δ65Cu variation, while perhaps not being analytically resolvable, could contribute to intra-deposit variation.
5.1. Initial δ65Cu Composition of Source Rocks
The initial δ65Cu of copper in the basalt-dominated source rocks is expected to have magmatic values that can be predicted from published values. Liu [54] has shown that the δ65Cu of MORB, OIB, and nonmetasomatized peridotite is from −0.04‰ to +0.22‰; continental basalts are from −0.18‰ to +0.35‰; and, arc basalts are from −0.19‰ to +0.47‰. Liu [54] interprets the slightly higher δ65Cu in arc basalts to reflect crustal material in their sources. Basalt from Hawaii, Iceland, and the Columbia River Plateau range in δ65Cu from 0‰ to +0.22‰ [57]. Ikehata and Hirata [58] suggested the range of terrestrial magmatic copper is −0.27‰ to 0.27‰. In general, the δ65Cu of terrestrial basalt is ~0‰ [4,54,59]. The δ65Cu bulk silicate Earth is estimated to be +0.06 ± 0.20, and thus, fractionation during partial melting is limited [54]. Granodiorite, dacite, and andesite from arc environments have δ65Cu of −0.2‰ to +0.3‰ [54,57], and hence, rhyolites of the Keweenaw Peninsula are likely to have similar δ65Cu as basalts. Magmatic δ65Cu values are applicable for the copper isotopic composition of the source rocks after deposition and are likely between about −0.3‰ to +0.3‰ with a central tendency of 0‰.
5.2. Copper Oxidation State in the Source Rocks
Conditions in the upper mantle and crust favor Cu1+ ions in the magmatic environment [60]. Copper does not have a strong affinity for oxygen so when sulfur is present it tends to enter sulfide minerals such as chalcopyrite (Cu1+, [61]). Sulfide minerals are rare in the least altered interiors of Kewenawan basalt lava flows [62] suggesting the magmas were low in sulfur. This is supported by the lack of sulfur-bearing minerals in the ore deposits. At magmatic temperatures in a low sulfur environment delafossite, CuFeO2 (Cu1+) coexists with magnetite but not with cuprite (Cu1+) [63]. Cuprospinel CuFe2O4 (Cu2+) is also stable with magnetite [63]. When the sulfur fugacity is low in magmas, as we suspect is the case for Keweenawan basalts, magmatic native copper (Cu0) can be the stable species [58]. The latter is consistent with the observations of Scofield [64] who found native copper inclusions in unaltered magmatic minerals in the least altered Keweenawan basalt massive flow interiors. In the Keweenaw basalts, copper is closely associated with magnetite, olivine, and pyroxene as lattice substitutions or as native copper inclusions [64]. In basalts of the Paraná volcanic province, Baggio et al. [15] also found high amounts of copper associated with magnetite, less abundant with pyroxene, and minimal with plagioclase, although they do not discuss the oxidation state. The oxidation state of copper in the magmatic rocks when deposited could reasonably have been either Cu0 or Cu1+.
During deuteric/diagenetic alteration, the magmatic stable copper mineral may change to another mineral, tenorite (Cu2+), cuprite (Cu1+), or native copper (Cu0), depending on physicochemical conditions. If native copper was the stable magmatic copper species then it is also quite possible that the deutric/diagenetic alteration may not significantly alter it. Deuteric/diagenetic alteration may or may not change the initial copper isotopic composition while changing the oxidation state of copper.
5.3. Constraint on the δ65Cu Composition of the Ore-Forming Fluids
Precipitation of native copper from the ore-forming hydrothermal fluids constrains the copper isotopic composition of the fluids. Copper transported in the fluids as CuCl2− (Cu1+) [43,45] must be reduced during precipitation to native copper (Cu0). By analog to low temperature experiments, the reductive precipitation of native copper will result in the native copper having a lower (lighter) δ65Cu value than δ65Cu of copper in the fluid [65,66]. Thus, the δ65Cu composition of the fluids must have had an isotopic value at the high (heavy) side of the range of measured δ65Cu of the Kewenawan native copper. A δ65Cu of +0.8‰ for copper in the ore-forming hydrothermal fluids is the minimum isotopic composition for copper in the fluids as it is the highest value of the native copper range (Figure 4), and therefore, the fluid value could be higher (heavier).
To explain the lowest δ65Cu native copper value of about −0.3‰ requires fractionation during reductive precipitation of at least −1.1‰. If all of the copper were precipitated from a batch of fluid, then the precipitated native copper would have the same value as the fluid, e.g., δ65Cu of +0.8‰, and if the efficiency was low then the precipitated native copper would have had a value closer to −0.3‰. The variable efficiency of reductive precipitation of native copper can explain the local within mine variation. In addition, the processes of progressive mineral reactions, water-rock reactions, and fluid mixing likely played a role in the local variation of the native copper isotopic composition, although none of these processes is expected to contribute a significant mass of copper to the deposits and thereby will not have a major effect on the δ65Cu of the native copper. Water-rock reactions in the vicinity of the ore deposits likely released copper from the ore host rocks into the fluids, and subsequently it was locally precipitated. Fluids mixing with the ore-forming hydrothermal fluids would have likely carried some amount of copper, albeit very small, that would have been precipitated upon mixing.
5.4. Derivation of the δ65Cu in the Ore-Forming Fluids
There are various possible ways to generate a δ65Cu of +0.8‰ or higher for the copper carried in the ore-forming fluids. Three constraints are especially relevant to the analysis of ways to derive the copper isotopic composition of the ore-forming fluids: (1) the oxidation state of copper in the ore-forming fluids, Cu1+; (2) the initial copper isotopic composition of the source rocks, ~0‰; and, (3) the oxidation state of copper in the source rocks, most likely either Cu0 or Cu1+.
Direct dissolution of copper from the rift-filling basalt source rock with magmatic copper isotopic composition is a viable way to derive the copper isotopic composition in the ore-forming hydrothermal fluids. By analog with low temperature experiments, oxidative dissolution of copper from source rocks with an initial magmatic copper isotopic composition would be expected to result in the δ65Cu of the copper in the fluids being higher (heavier) than in the source rocks (> ~0‰). Fractionation due to the oxidation of copper during dissolution would need to be +0.8‰ or greater. Given the oxidation state of copper in the fluids as Cu1+, the oxidation state of copper in the source rocks has to be Cu0 for this process to be viable. The reductive dissolution of copper will result in the fluid having a copper isotopic composition of less than the source rock, δ65Cu < ~0‰, rather than higher as necessary (fluid δ65Cu of +0.80‰ or higher). Neutral dissolution (no difference in oxidation state) will presumably result in the fluid δ65Cu of ~0‰ or too low.
An increase in the δ65Cu of the rift-filling basalt source rock above the initial magmatic composition prior to the generation of the ore-forming fluids can subsequently make dissolution involving oxidation or reduction of copper potentially viable. This also could eliminate the need for copper in the source rocks to be Cu0. However, viability requires involving a large mass of copper. If the source rocks were subjected to a reductive dissolution event prior to forming the ore fluids wherein the dissolved lighter isotopic copper in the fluid was transported out of the source rocks, the residual copper in the source rocks could be enriched in the heavier copper isotope to +0.80 or higher. At δ65Cu +0.80‰ in the source rocks a complete dissolution of copper would result in a fluid with the same value or +0.80‰. Another method to increase the δ65Cu of the source rock would be to precipitate isotopically heavier copper from fluid deriving copper from outside of the source rock volume. Oxidative precipitation could add isotopically heavier copper to the source rocks prior to the copper dissolution into the ore-forming fluids.
A more complex derivation of the δ65Cu of the ore-forming fluids is possible. The dissolution of copper into the ore-forming fluids along the fluid flow path could have occurred in episodes with different physiochemical conditions, such that copper was dissolved by both oxidation and reduction and from both source rocks with initial magmatic copper isotopic composition and/or modified. Oxidative dissolution needs to be the dominant process to result in the fluids with δ65Cu elevated above magmatic values.
5.5. Anomalous δ65Cu
One sample of native copper out of 121 was statistically anomalous. The sample is from the Copper Falls vein deposit, and had a δ65Cu of 2.29. Since there was only one such value we did not undertake special investigation. The easiest explanation is that this heavy δ65Cu is the result of near surface supergene processes. The hydrothermally precipitated native copper could have been oxidatively dissolved in the near surface supergene environment resulting in a high (heavy) enough δ65Cu for the copper in solution so that the subsequent reductive precipitation yielded the elevated δ65Cu value. An alternative is that the native copper analysis included unobserved oxidatively precipitated copper oxide minerals.
5.6. Keweenaw Copper Derivation Model
The simplest method to generate an ore-forming fluid with δ65Cu +0.80‰ or higher is through oxidative dissolution from rift-filling basalt source rocks. We consider this the most probable means to explain the restricted distribution of native copper δ65Cu extending from the lower limit of values expected for magmatic rocks to above magmatic values, with an average of +0.3‰, on the highest side of the magmatic range.
While increasing the initial δ65Cu of the source rock prior to the generation of the fluids is possible, it seems less likely considering the large volume of source rock that must be modified in a uniform enough manner to yield batches of metamorphogenic ore-forming fluids over time to keep the distribution of native copper δ65Cu in a range of 1.1‰.
More complex, multiple step processes of derivation of the copper in the ore-forming fluids are possible. A hybrid evolved meteoric and metamorphogenic water/copper model has been proposed by Brown [45,48]. In Brown’s model, the dissolution of copper occurs along an extended path beginning with meteoric waters near the surface that leach copper and evolve as they move deeper, followed by the addition and mixing of metamorphogenic waters and copper at depth into the ore-forming hydrothermal fluids. Based on Brown’s proposed meteoric water evolution, the initial dissolution of copper involves either reduction or no change in the oxidation state of copper as either Cu2+ or Cu1+ in the source rocks is dissolved into the aqueous fluid as Cu1+. Beginning with a magmatic δ65Cu, the dissolution of copper into the evolving meteoric waters would result in too low (light) δ65Cu in the waters. This could be overcome if the metamorphogenic copper, derived through oxidative dissolution, overwhelmed the meteoric water copper negating the hybrid nature of Brown’s model. The more complex nature of the hybrid model is less consistent with the lack of spread in the native copper δ65Cu than a simpler metamorphogenic model. Brown’s hybrid model relies on gravity-driven fluid flow with a unidirectional curved path from northwest to southeast, yet geologic evidence is lacking for the existence of the proposed highlands. Downward moving meteoric waters presumably entered on the side of the rift opposite to the Keweenaw Peninsula or entered in vicinity of Isle Royale (Figure 1). However, native copper deposition occurred in Isle Royale [27,67], indicating that hydrothermal ore-forming fluids were moving upwards towards Isle Royale rather than unidirectionally downwards as in the hybrid model (Figure 3). The gravity-driven model also includes the meteoric waters moving through overlying sedimentary rocks and dissolving evaporites before continuing the downward transport in the PLV, which is physically difficult to accomplish without pathways through the massive interiors of the subaerial basalt lava flows. Additionally, there is no direct evidence for the existence of evaporite horizons, as noted by Brown [45], and the proposed dissolution of evaporites from an undocumented horizon or from evaporite minerals scattered about in the overlying red-bed sedimentary rocks must not involve sulfate minerals or else the waters would become enriched in sulfur. Although not conclusive, limited oxygen-hydrogen isotope data are not elongate indicative of an evaporative component, but are consistent with metamorphogenic waters mixed with meteoric waters at the time of copper precipitation [35]. The hybrid model of Brown [45,48] is less likely a significant part of the genetic model on the basis of the copper isotope data and geologic arguments.
The dissolution of copper from the rift-filling basalt source rocks involving the oxidation of copper requires that the oxidation state of copper in the source rocks had to be Cu0 in order to yield Cu1+ in the metamorphogenic ore-forming hydrothermal fluids. The electrons released by the oxidation were likely used in other mineral reactions. If the dominant rift-filling basalt magmas were low enough in sulfur, then magmatic native copper could have been the stable copper species. Zhang et al. [68] and Ikehata and Hirata [58] have demonstrated the occurrence of magmatic native copper in sulfur-undersaturated magma. While the possibility of magmatic native copper is proven, we do not know if a large amount of native copper in basaltic rock is realistic. Further studies are needed. Ascribing the low sulfur in the source rocks to low sulfur magmas seems more likely than to it mostly resulting from the degassing of sulfur after eruption. If degassing were the principal cause of low sulfur, we expect that there would still be abundant enough copper sulfide mineral inclusions to have yielded significant amounts of sulfur into the ore-forming fluids. Another problem with degassing is that it would have had to have been highly efficient and nearly always complete to generate low sulfur in the very large volumes of basalt involved in the system from source to host rocks. Low sulfur in the pre-eruption magmas likely resulted in magmatic crystallized native copper that was oxidatively dissolved from the rift-filling basalt source rocks into the metamorphogenic ore-forming fluids. It also resulted in low sulfur in the rocks along the ore-forming fluid upward pathways and in host rocks, thereby maintaining the low sulfur in the ore-forming fluids that ultimately only precipitated native copper. Although the degassing of small amounts of sulfur cannot be precluded, we hypothesize a critical factor in producing the unique concentration of native copper was likely the low sulfur magmas. Further work on the sulfur content of these magmas is needed.
6. Conclusions
This copper isotopic study provides new constraints on the genesis of native copper ore deposits in Michigan’s Keweenaw Peninsula native copper district:
- (1)
- The δ65Cu of native copper is visually a single population, normally distributed, similar between mines spread along a strike length of about 120 km, and limited in variation of 1.1‰. This favors a regionally consistent process to derive copper from source rocks and is compatible with the well-established genetic hypothesis wherein copper was leached from the rift-filling basalt-dominated stratigraphic section during burial metamorphism.
- (2)
- The reduction of native copper from the ore-forming hydrothermal fluids constrains the δ65Cu of the fluids to a value of δ65Cu +0.80‰ or higher. This supports the hypothesis that the dissolution of copper from rift-filling basalt source rocks with magmatic copper isotopic composition involved the oxidation of copper into the fluids.
- (3)
- The contribution of copper to the ore-forming hydrothermal fluids by the reductive dissolution of copper from red-bed sedimentary rocks (overlying rift-filling basalt dominated stratigraphic section) by evolved meteoric water, as described by Brown [45,48], is limited to small amounts or else it is difficult to explain the copper isotopic data. A hybrid evolved meteoric and metamorphogenic water model is not supported by the copper isotope data or by geologic arguments and inferences.
- (4)
- The dissolution of copper by oxidation strongly suggests that the oxidation state of copper in the rift-filling basalt source rocks was magmatic Cu0 (native copper). Magmatic native copper crystallized in the rift-filling basalt magmas and provided a large volume of relatively uniform source rocks. The restricted range of δ65Cu for native copper from the native copper ore deposits is consistent with progressive batches of metamorphogenic ore-forming fluids with similar copper isotopic composition generated over an extended period of time from source rocks, in which generally uniformly distributed native copper had a magmatic isotopic composition. It is likely that the magmas were low in sulfur prior to eruption as this would have been necessary for magmatic native copper to be stable.
- (5)
- As the ore-forming fluids moved upwards they did not acquire sulfur, as they were moving through the same stratigraphic section as the low sulfur source rocks. At depth beneath the surface, reductive precipitation of native copper from the metamorphogenic ore-forming hydrothermal fluids was facilitated by the mixing with meteoric waters, water-rock reactions, and other physicochemical changes. It is likely that a local variation of the native copper δ65Cu was mostly controlled by the efficiency of reductive precipitation.
The study of the copper isotopic composition of native copper ores from Michigan’s Keweenaw Peninsula once again demonstrates the value of such studies in constraining genetic models. However, more refined interpretations await additional experimental data on the behavior of copper isotopes during dissolution. An additional study of the copper isotopic composition of native copper from elsewhere in the Midcontinent Rift could help determine if the processes resulting in the native copper ores are the restricted, which thereby limits the potential ore deposits to the Keweenaw Peninsula or are more widely applicable. A copper isotopic study of the nearby White Pine and Copperwood deposits will not only provide insight into the genesis of these sedimentary rock-hosted stratiform copper sulfide-dominated deposits, but it will also contribute further to understanding of the native copper ores.
Acknowledgments
We thank Marc Wilson for contributing some of the native copper samples that were analyzed and provided here as new results. The Pennsylvania State University provided access to their analytical facilities aided by Mathew Gonzalez. This work was supported by the Carnegie Museum of Natural History, A. E. Seaman Mineral Museum of Michigan Tech and Department of Geology of Juniata College.
Author Contributions
Both authors wrote the paper. Ryan Mathur performed the analytical work.
Conflicts of Interest
The authors declare no conflict of interest.
References
- Shields, W.R.; Goldich, S.S.; Garner, E.L.; Murphy, T.J. Natural variations in the abundance ratio and the atomic weight of copper. J. Geophys. Res. 1963, 70, 479–491. [Google Scholar] [CrossRef]
- Maréchal, C.N.; Telouk, P.; Albarede, F. Precise analysis of copper and zinc isotopic compositions by plasma-source mass spectrometry. Chem. Geol. 1999, 156, 251–273. [Google Scholar] [CrossRef]
- Gale, N.H.; Woodhead, A.P.; Stoc-Gale, Z.A.; Walder, A.; Bowen, I. Natural variations detected in the isotopic composition of copper: Possible applications to archaeology and geochemistry. Int. J. Mass Spectrom. 1999, 184, 1–9. [Google Scholar] [CrossRef]
- Albarede, F. The stable isotope geochemistry of copper and zinc. Rev. Mineral. Geochem. 2004, 55, 409–427. [Google Scholar] [CrossRef]
- Zhu, X.K.; O’Nions, R.K.; Guo, Y.; Belshaw, N.S.; Rickard, D. Determination of natural Cu-isotope variation by plasma-source mass spectrometry: Implications for use as geochemical tracers. Chem. Geol. 2000, 163, 139–149. [Google Scholar] [CrossRef]
- Larson, P.B.; Maher, K.; Ramos, F.C.; Chang, Z.; Gaspar, M.; Meinert, L.D. Copper isotope ratios in magmatic and hydrothermal processes. Chem. Geol. 2003, 201, 337–350. [Google Scholar] [CrossRef]
- Graham, S.; Pearson, N.; Jackson, S.; Griffin, W.; O’Reilly, S.Y. Tracing Cu and Fe from source to porphyry: In situ determination of Cu and Fe isotope ratios in sulfides from the Grasberg Cu-Au deposit. Chem. Geol. 2004, 207, 147–169. [Google Scholar] [CrossRef]
- Markl, G.; Lahaye, Y.; Schwinn, G. Copper isotopes as monitors of redox processes in hydrothermal mineralization. Geochem. Cosmochim. Acta 2006, 70, 4215–4228. [Google Scholar] [CrossRef]
- Asael, D.; Matthews, A.; Bar-Matthews, M.; Halicz, L. Copper isotope fractionation in sedimentary copper mineralization (Timna Valley, Israel). Chem. Geol. 2007, 243, 238–254. [Google Scholar] [CrossRef]
- Maher, K.C.; Larson, P.B. Variation in copper isotope ratios and controls on fractionation in hypogene skarn mineralization at Coroccohuayco and Tintaya, Peru. Econ. Geol. 2007, 102, 225–237. [Google Scholar] [CrossRef]
- Asael, D.; Matthews, A.; Oszczepalski, S.; Bar-Matthews, M.; Halicz, L. Fluid speciation controls of low temperature copper isotope fractionation applied to Kupferschiefer and Timna ore deposits. Chem. Geol. 2009, 262, 147–158. [Google Scholar] [CrossRef]
- Li, W.; Jackson, S.E.; Pearson, N.J.; Graham, S. Copper isotope zonation in Northparkes porphyry Cu-Au deposit, SE Australia. Geochem. Cosmochim. Acta 2010, 74, 4078–4096. [Google Scholar] [CrossRef]
- Ikehata, K.; Notsu, K.; Hirata, T. Copper isotope characteristics of copper-rich minerals from Besshi-type volcanogenic massive sulfide deposits, Japan, determined using a femtosecond LA-MC-ISP-MS. Econ. Geol. 2011, 106, 307–316. [Google Scholar] [CrossRef]
- Mathur, R.; Fantle, M.S. Copper isotopic perspectives on supergene processes: Implications for the global Cu cycle. Elements 2015, 11, 323–329. [Google Scholar] [CrossRef]
- Baggio, S.B.; Hartmann, L.A.; Lazarov, M.; Massonne, H.-J.; Opitz, J.; Theye, T.; Viefhaus, T. Origin of native copper in Paraná Volcanic Province, Brazil, integrating Cu stable isotopes in a multi-analytical approach. Miner. Deposita 2017. [Google Scholar] [CrossRef]
- Mathur, R.; Titley, S.; Barra, F.; Brantley, S.; Wilson, M.; Phillips, A.; Munizaga, F.; Maksaev, V.; Vervoort, J.; Hart, G. Exploration potential of Cu isotope fractionation in porphyry copper deposits. J. Geochem. Explor. 2009, 102, 1–6. [Google Scholar] [CrossRef]
- Weege, R.J.; Pollack, J.P. Recent developments in native-copper district of Michigan. In Proceedings of the Society of Economic Geologists Field Conference, Michigan Copper District, MI, USA, 30 September–2 October 1971; pp. 18–43. [Google Scholar]
- Martin, S.R. Wonderful Power: The Story of Ancient Copper Working in the Lake Superior Basin; Wayne State University Press: Detroit, MI, USA, 1999; pp. 1–298. [Google Scholar]
- Rapp, G.; Allert, J.; Vitali, V.; Jing, Z.; Henrickson, E. Determining Geologic Sources of Artifact Copper; University Press America: New York, NY, USA, 2000; pp. 1–156. [Google Scholar]
- Mathur, R.; Wilson, M.; Parra, M.L. Challenges of using copper isotope ratios to trace the origin of native copper artifacts: An example from the Keweenaw Peninsula. Ann. Carnegie Mus. 2014, 82, 241–245. [Google Scholar] [CrossRef]
- Mathur, R.; Titley, S.; Hart, G.; Wilson, M.; Davignon, M.; Zlatos, C. The history of the United States cent revealed through copper isotope fractionation. J. Archaeol. Sci. 2009, 36, 430–433. [Google Scholar] [CrossRef]
- Cannon, W.F.; Green, A.G.; Hutchinson, D.R.; Lee, M.W.; Milkereit, B.; Behrendt, J.C.; Halls, H.C.; Green, J.C.; Dickas, A.B.; Morey, G.B.; et al. The North American mid-continent rift beneath Lake Superior from Glimpse seismic reflection profiling. Tectonics 1989, 8, 305–332. [Google Scholar] [CrossRef]
- Nicholson, S.W. Geochemistry, Petrography, and Volcanology of Rhyolites of the Portage Lake Volanics, Keweenaw Peninsula, Michigan, U.S. Geological Survey Bulletin 1970B; U.S. Government Printing Office: Washington, DC, USA, 1992; pp. B1–B57.
- Bornhorst, T.J.; Lankton, L.D. Copper mining: A billion years of geologic and human history. In Michigan Geography and Geology; Schaetzl, R., Darden, J., Brandt, D., Eds.; Pearson Custom Publishing: New York, NY, USA, 2009; pp. 150–173. [Google Scholar]
- Cannon, W.F. Closing of the Midcontinent Rift—A far field effect of Grenvillian contraction. Geology 1994, 22, 155–158. [Google Scholar] [CrossRef]
- Broderick, T.M. Fissure vein and lode relations in Michigan copper deposits. Econ. Geol. 1931, 26, 40–856. [Google Scholar] [CrossRef]
- Bornhorst, T.J. Tectonic context of native copper deposits of the North American Midcontinent Rift system. Geol. Soc. Am. Spec. Pap. 1997, 312, 127–136. [Google Scholar]
- Butler, B.S.; Burbank, W.S. The copper deposits of Michigan. U.S. Geol. Surv. Prof. Pap. 1929, 144, 1–238. [Google Scholar]
- Broderick, T.M.; Hohl, C.D.; Eidenmiller, H.N. Recent contributions to the geology of the Michigan copper district. Econ. Geol. 1946, 41, 675–725. [Google Scholar] [CrossRef]
- Weege, R.J.; Pollock, J.P. The Calumet Division Geological Staff. The geology of two new mines in the native copper district. Econ. Geol. 1972, 67, 622–633. [Google Scholar]
- Bornhorst, T.J.; Barron, R.J.; Whiteman, R.C. Caledonia Mine, Keweenaw Peninsula native copper district, Ontonagon County, Michigan. Inst. Lake Super. Geol. Proc. 2013, 59 Pt 2, 43–57. [Google Scholar]
- Mauk, J.L.; Kelly, W.C.; van der Pluijm, B.A.; Seasor, R.W. Relations between deformation and sediment-hosted copper mineralization: Evidence from the White Pine portion of the Midcontinent Rift system. Geology 1992, 20, 427–430. [Google Scholar] [CrossRef]
- Stoiber, R.E.; Davidson, E.S. Amygdule mineral zoning in the Portage Lake Lava Series, Michigan copper district. Econ. Geol. 1959, 54, 1250–1277. [Google Scholar] [CrossRef]
- Jolly, W.T.; Smith, R.E. Degradation and metamorphic differentiation of the Keweenawan tholeiitic lavas of northern Michigan, USA. J. Petrol. 1972, 13, 273–309. [Google Scholar] [CrossRef]
- Püeschner, U.R. Very low-grade metamorphism in the Portage Lake Volcanics on the Keweenaw Peninsula, Michigan, USA. Ph.D. Dissertation, University of Basel, Basel, Switzerland, 2001; pp. 1–81. [Google Scholar]
- Cornwall, H.R. A summary of ideas on the origin of native copper deposits. Econ. Geol. 1956, 51, 615–631. [Google Scholar] [CrossRef]
- White, W.S. The native-copper deposits of northern Michigan. In Ore Deposits of the United States, 1933–1967 (Graton Sales Volume); Ridge, J.D., Ed.; American Institute of Mining, Metallurgical, and Petroleum Engineers: New York, NY, USA, 1968; pp. 303–325. [Google Scholar]
- Cannon, W.F. The Midcontinent Rift in the Lake Superior region with emphasis on its geodynamic evolution. Tectonophysics 1992, 213, 41–48. [Google Scholar] [CrossRef]
- Davis, D.W.; Paces, J.B. Time resolution of geologic events on the Keweenaw Peninsula and implications for development of the Midcontinent rift system. Earth Planet. Sci. Lett. 1990, 97, 54–64. [Google Scholar] [CrossRef]
- Heaman, L.M.; Easton, R.M.; Hart, T.M.; MacDonald, C.A.; Hollings, P.; Smyk, M. Further refinement to the timing of Mesoproterozoic magmatism, Lake Nipigon region, Ontario. Can. J. Earth Sci. 2007, 44, 1055–1086. [Google Scholar] [CrossRef]
- Bornhorst, T.J.; Paces, J.B.; Grant, N.K.; Obradovich, J.D.; Huber, N.K. Age of native copper mineralization, Keweenaw Peninsula, Michigan. Econ. Geol. 1988, 83, 619–625. [Google Scholar] [CrossRef]
- Woodruff, L.G.; Daines, M.J.; Cannon, W.F.; Nicholson, S.W. The Thermal History of the Midcontinent Rift in the Lake Superior Region: Implications for Mineralization and Partial Melting. In Proceedings of the International Geological Correlation Program Field Conference and Symposium on the Petrology and Metallogeny of Volcanic and Intrusive Rocks of the Midcontinent Rift System, Duluth, MN, USA, 19 August–1 September 1995; Volume 336, pp. 213–214. [Google Scholar]
- Jolly, W.T. Behavior of Cu, Zn, and Ni during prehnite-pumpellyite rank metamorphism of the Keweenawan basalts, northern Michigan. Econ. Geol. 1974, 69, 1118–1125. [Google Scholar] [CrossRef]
- Livnat, A. Metamorphism and Copper Mineralization of the Portage Lake Lava Series, Northern Michigan. Ph.D. Dissertation, University of Michigan, Ann Arbor, MI, USA, 1983; pp. 1–292. [Google Scholar]
- Brown, A.C. Genesis of native copper lodes in the Keweenaw Peninsula, Norther Michigan: A hybrid evolved meteoric and metamorphogenic model. Econ. Geol. 2006, 101, 1437–1444. [Google Scholar] [CrossRef]
- Bornhorst, T.J.; Barron, R.J. Copper deposits of the western Upper Peninsula of Michigan. Inst. Lake Super. Geol. Proc. 2011, 59 Pt 2, 1–42. [Google Scholar]
- Bornhorst, T.J.; Barron, R.J. Geologic overview of the Keweenaw Peninsula, Michigan. Geol. Soc. Am. Field Guide 2013, 24, 1–42. [Google Scholar]
- Brown, A.C. District-scale concentration of native copper lodes from a tectonically induced thermal plume of ore fluids on the Keweenaw Peninsula, Northern Michigan. Econ. Geol. 2008, 103, 1691–1694. [Google Scholar] [CrossRef]
- Bornhorst, T.J.; Woodruff, L.G. Native copper precipitation by fluid-mixing Keweenaw Peninsula, Michigan. Inst. Lake Super. Geol. Proc. 1997, 43 Pt 1, 9–10. [Google Scholar]
- Mathur, R.; Ruiz, J.; Titley, S.; Liermann, L.; Buss, H.; Brantley, S. Cu isotopic fractionation in the supergene environment with and without bacteria. Geochem. Cosmochim. Acta 2005, 69, 5233–5246. [Google Scholar] [CrossRef]
- Yao, J.; Mathur, R.; Sun, W.; Song, W.; Chen, H.; Mutti, L.; Xiang, X.; Luo, X. Fractionation of Cu and Mo isotopes caused by vapor-liquid partitioning, evidence from the Dahutang W-Cu-Mo ore field. Geochem. Geophys. Geosyst. 2016, 17, 1725–1739. [Google Scholar] [CrossRef]
- Wilson, M.; Wilson, D.L.; Mathur, R. Tracing the source of native copper specimens with copper isotope values. Rocks Miner. 2016, 91, 352–356. [Google Scholar] [CrossRef]
- Ikehata, K.; Chida, K.; Bornhorst, T.J.; Ishibashi, J.; Hirata, T. Using copper isotopic composition to distinguish native copper formation mechanisms. Geol. Soc. Am. Abstr. Prog. 2015, 47, 518. [Google Scholar]
- Liu, S.A.; Huang, J.; Liu, J.; Worner, G.; Yang, W.; Tang, Y.J.; Chen, Y.; Tang, L.; Zheng, J.; Li, S. Copper isotopic composition of silicate Earth. Earth Planet. Sci. Lett. 2015, 427, 95–103. [Google Scholar] [CrossRef]
- Maher, K.C.; Jackson, S.; Mountain, B. Experimental evaluation of the fluid-mineral fractionation of Cu isotopes at 250 °C and 300 °C. Chem. Geol. 2011, 286, 229–239. [Google Scholar] [CrossRef]
- Seo, J.H.; Lee, S.K.; Lee, I. Quantum chemical calculations of equilibrium copper (I) isotope fractionations in ore-forming fluids. Chem. Geol. 2007, 243, 225–237. [Google Scholar] [CrossRef]
- Liu, S.A.; Li, D.; Li, S.; Teng, F.Z.; Ke, S.; He, Y.; Lu, Y. High-precision copper and iron isotope analysis of igneous rock standards by MC-ICP-MS. J. Anal. At. Spectrom. 2014, 29, 122–133. [Google Scholar] [CrossRef]
- Ikehata, K.; Hirata, T. Copper isotope characteristics of copper-rich minerals from the Horoman peridotite complex, Hokkaido, Northern Japan. Econ. Geol. 2012, 107, 1489–1497. [Google Scholar] [CrossRef]
- Savage, P.S.; Moynier, F.; Chen, H.; Shofner, G.; Siebert, J.; Badro, J.; Puchtel, I.S. Copper isotope evidence for large-scale sulphide fractionation during Earth’s differentiation. Geochem. Perspect. Lett. 2015, 1, 53–64. [Google Scholar] [CrossRef] [Green Version]
- Fellows, S.A.; Canil, D. Experimental study of the partitioning of Cu during partial melting of Earth’s mantle. Earth Planet. Sci. Lett. 2012, 337–338, 133–143. [Google Scholar] [CrossRef]
- Pearce, C.I.; Pattrick, R.A.D.; Vaughan, D.J.; Henderson, C.M.B.; van der Laan, G. Copper oxidation state in chalcopyrite: Mixed Cu d9 and d10 characteristics. Geochem. Cosmochim. Acta 2006, 70, 4635–4642. [Google Scholar] [CrossRef]
- Cornwall, H.R. Ilmentite, magnetite, hematite, and copper in lavas of the Keweenawan series. Econ. Geol. 1951, 46, 51–67. [Google Scholar] [CrossRef]
- Yund, R.A.; Kullerud, G. Stable mineral assemblages of anhydrous copper and iron oxides. Am. Mineral. 1964, 49, 689–696. [Google Scholar]
- Scofield, N. Mineral Chemistry Applied to Interrelated Albitization, Pumpellyitization, and Native Copper Distribution in Some Portage Lake Basalts, Michigan. Ph.D. Dissertation, Michigan Technological University, Houghton, MI, USA, 1976; pp. 1–144. [Google Scholar]
- Zhu, X.; Guo, Y.; Williams, R.; O’Nions, K.; Matthews, A.; Belshaw, N.; Canters, G.; de Waal, E.; Weser, U.; Burgess, B.; et al. Mass fractionation process of transition metal isotopes. Earth Planet. Sci. Lett. 2002, 200, 47–62. [Google Scholar] [CrossRef]
- Ehrlich, S.; Butler, I.; Halicz, L.; Rickard, D.; Oldroyd, A.; Matthews, A. Experimental study of copper isotope fractionation between aqueous Cu(II) and covellite, CuS. Chem. Geol. 2004, 209, 259–270. [Google Scholar] [CrossRef]
- Huber, N.K. The Geologic Story Of Isle Royale National Park, U.S. Geological Survey Bulletin 1309; U.S. Government Printing Office: Washington, DC, USA, 1975; pp. 1–66.
- Zhang, Z.; Mao, J.; Wang, F.; Pirajno, F. Native gold and native copper grains enclosed by olivine phenocrysts in a picrite lava of the Emeishan large igneous province, SW China. Am. Mineral. 2006, 91, 1178–1183. [Google Scholar] [CrossRef]
Figure 1.
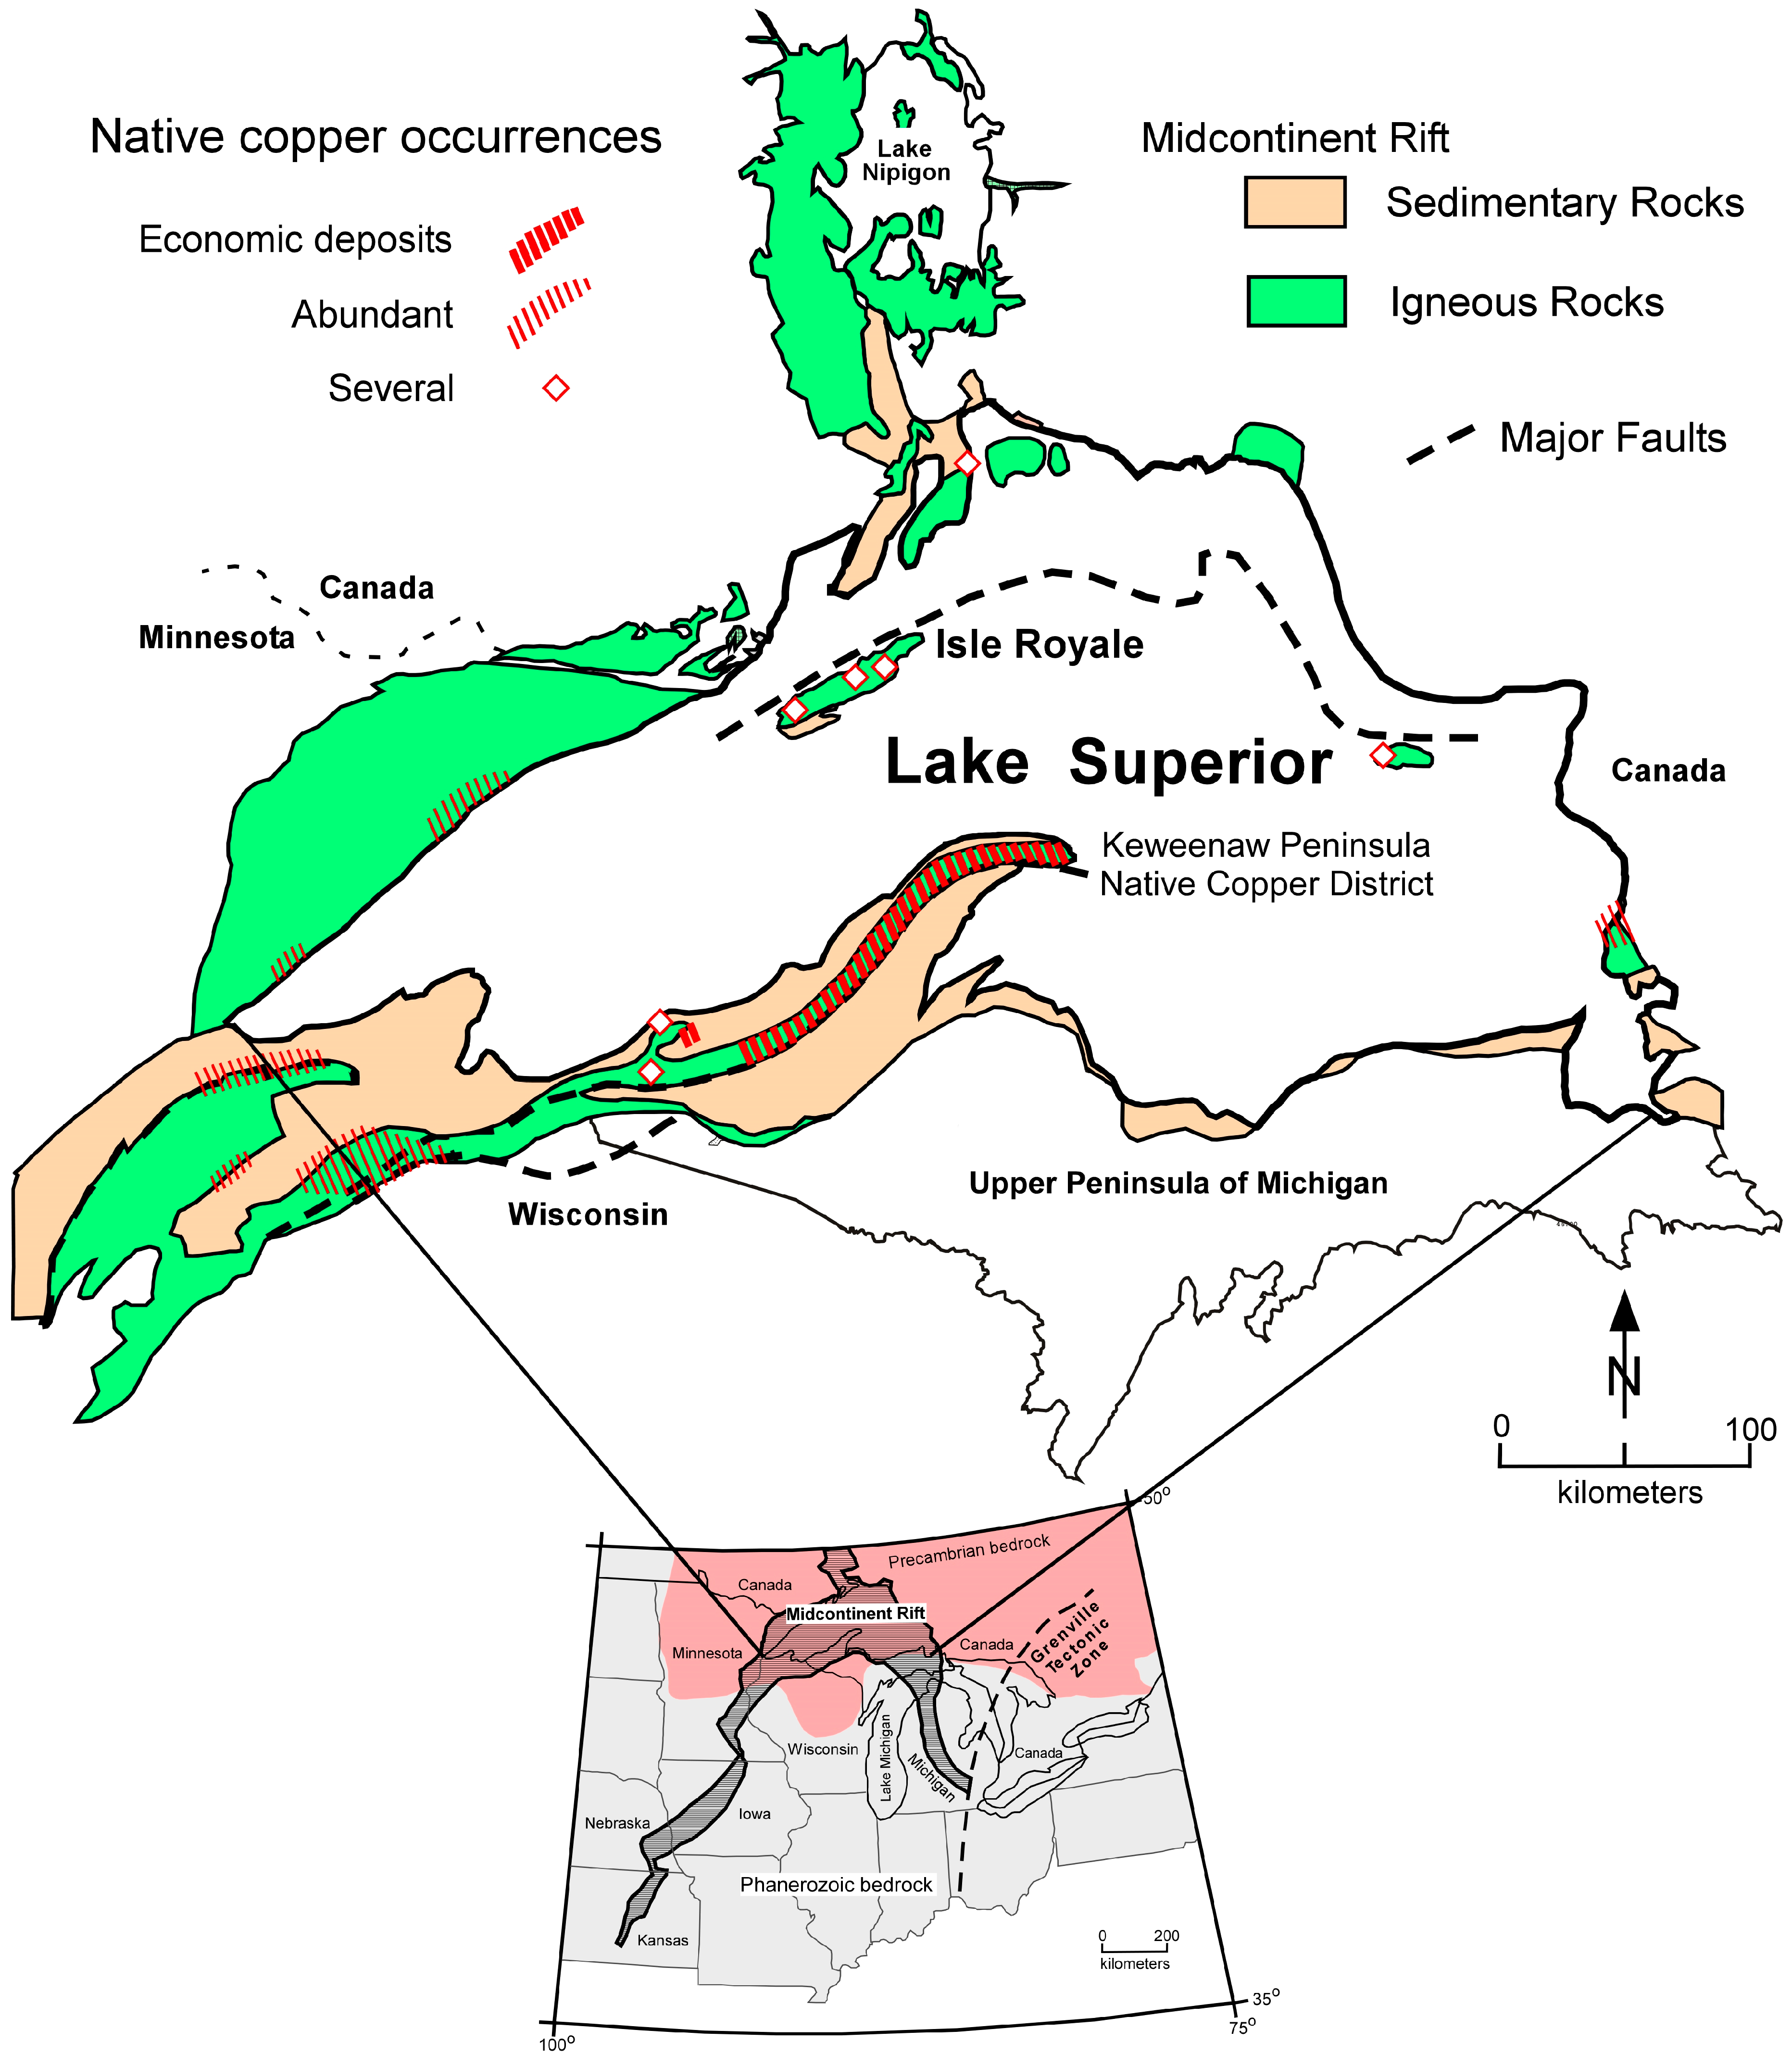
Geologic setting of the Mesoproterozoic Midcontinent Rift showing location of native copper occurrences and the Keweenaw Peninsula native copper district. Modified from Bornhorst and Lankton [24].
Figure 1.
Geologic setting of the Mesoproterozoic Midcontinent Rift showing location of native copper occurrences and the Keweenaw Peninsula native copper district. Modified from Bornhorst and Lankton [24].

Figure 2.
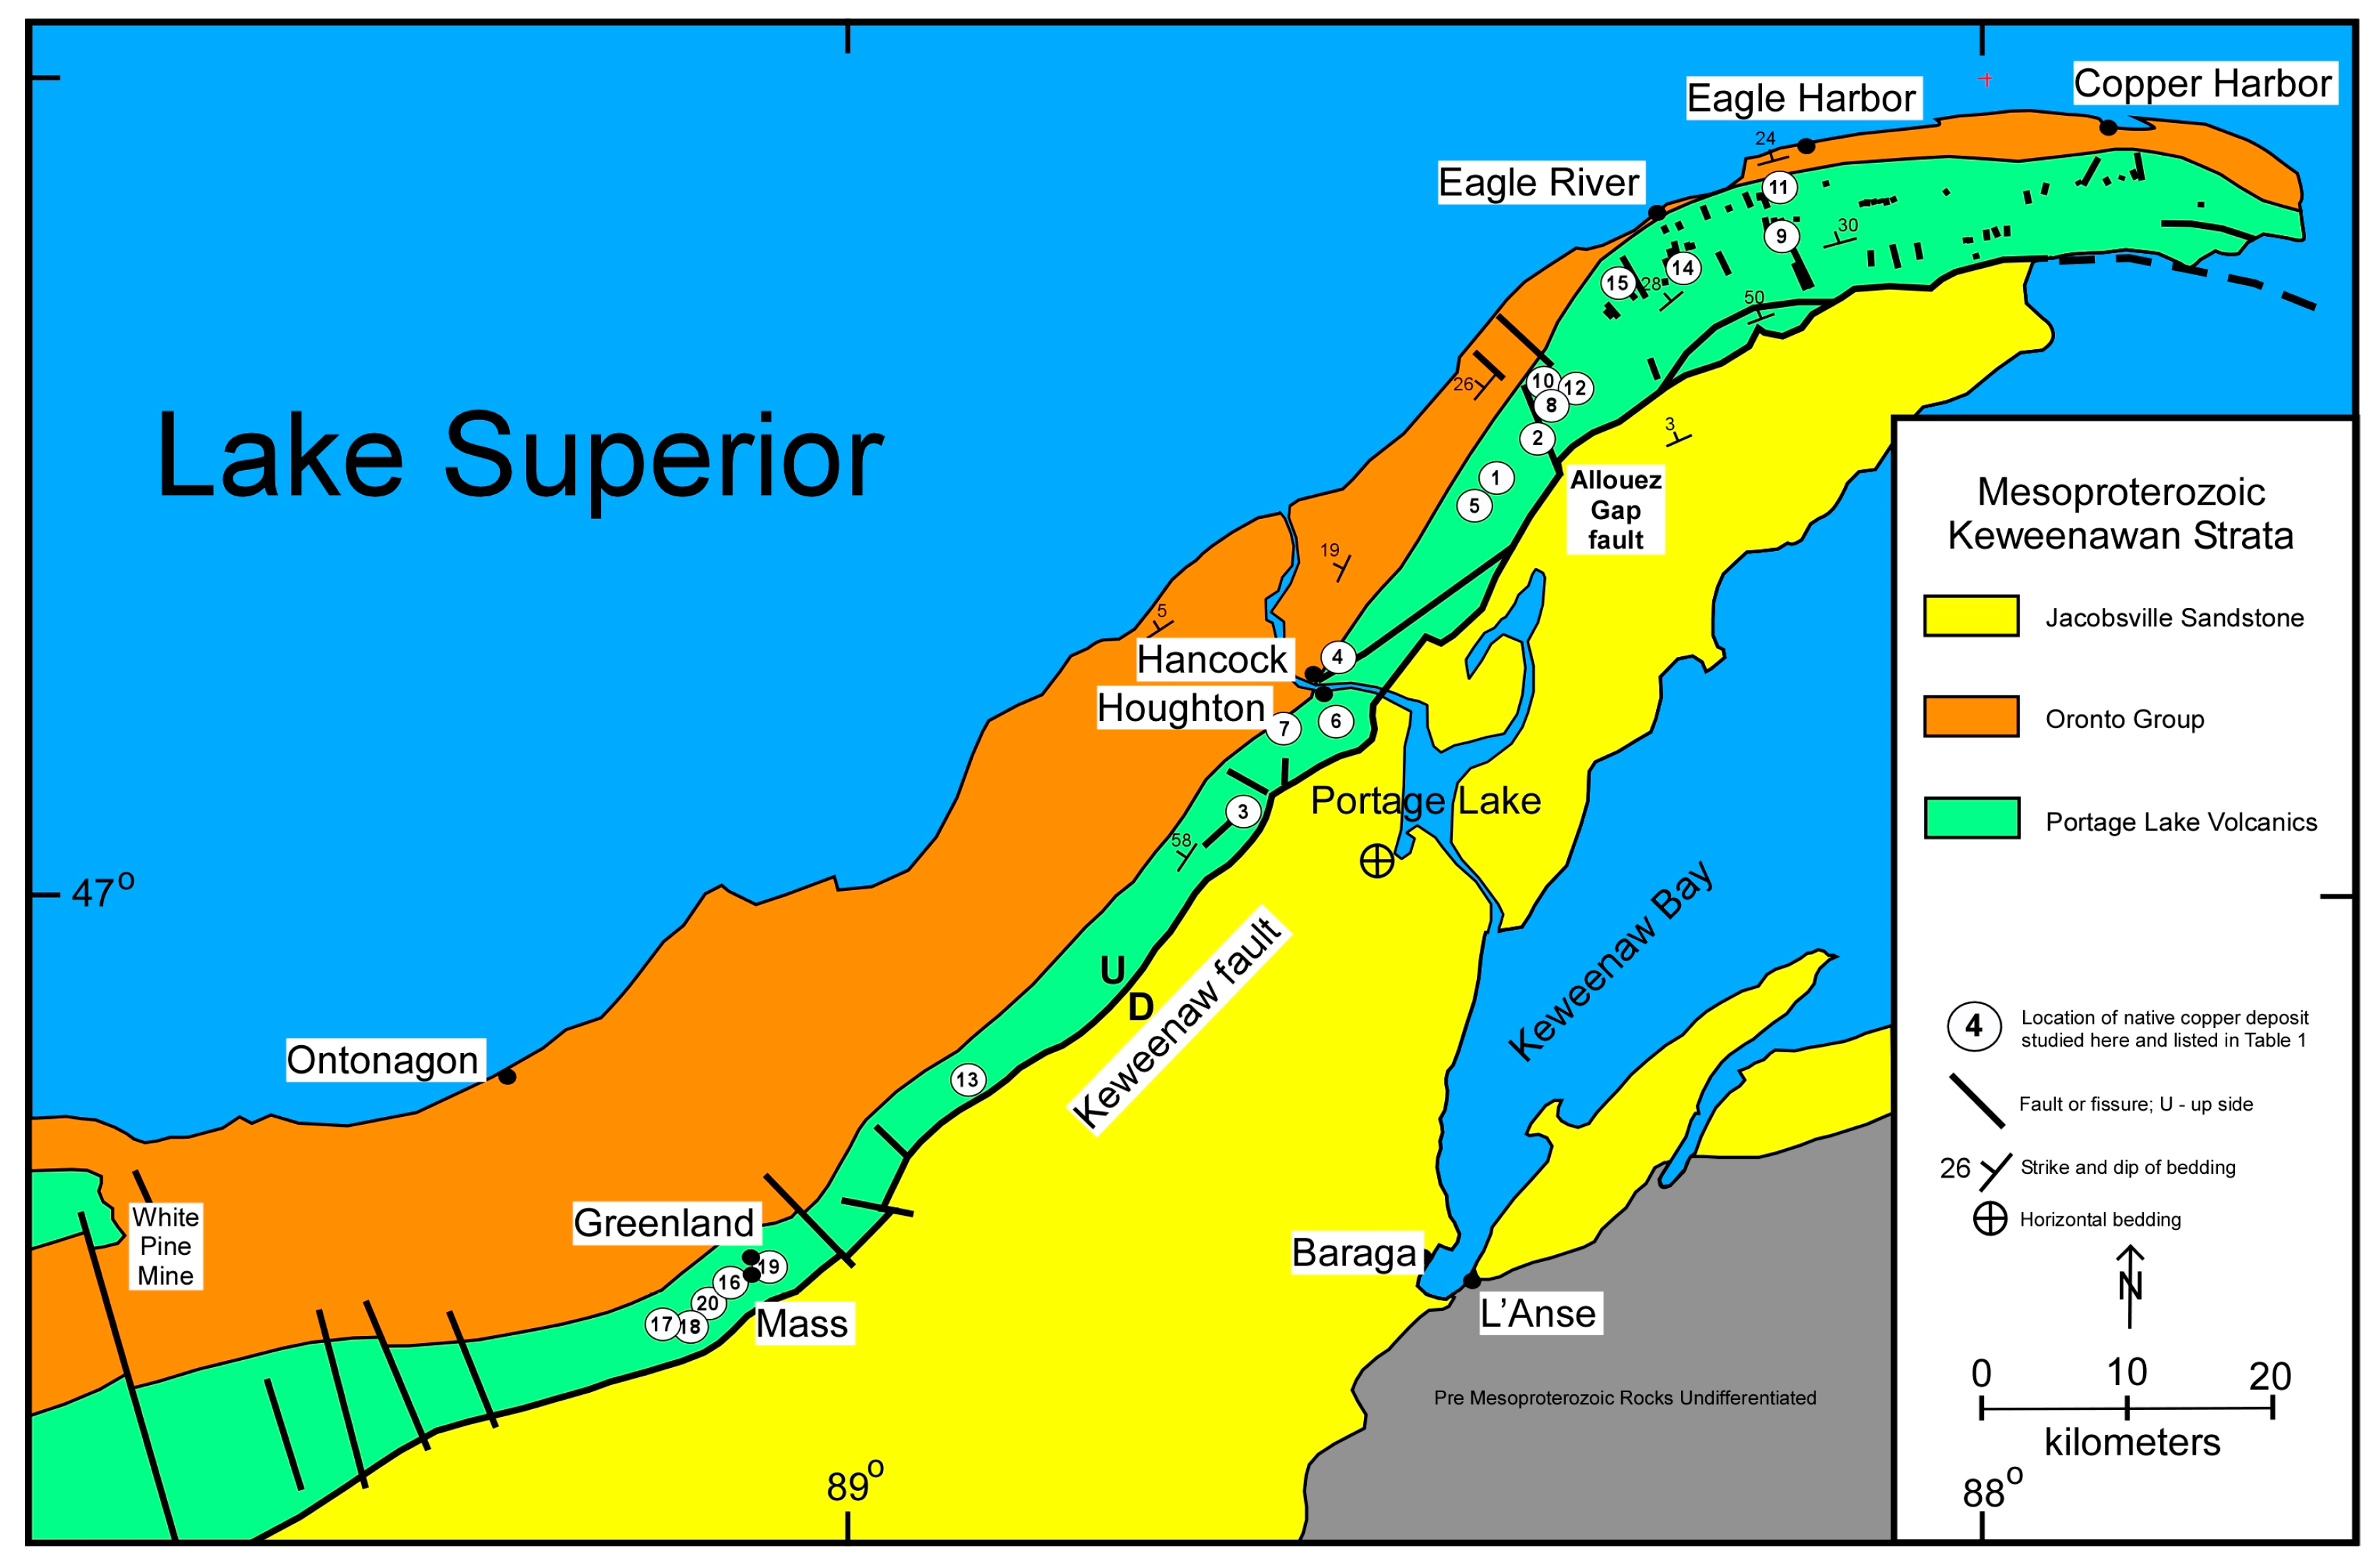
Bedrock geologic map of the Keweenaw Peninsula in the western part of the Upper Peninsula of Michigan. Numbered locations of native copper deposits correspond to Table 1. The main part of the Keweenaw Peninsula native copper district extends from approximately deposit 3 to 12. A concentration of small native copper deposits is located in the Greenland-Mass subdistrict. Vein-type deposits are notable from vicinity of deposits 15 to 11. The regional location is illustrated in Figure 1.
Figure 2.
Bedrock geologic map of the Keweenaw Peninsula in the western part of the Upper Peninsula of Michigan. Numbered locations of native copper deposits correspond to Table 1. The main part of the Keweenaw Peninsula native copper district extends from approximately deposit 3 to 12. A concentration of small native copper deposits is located in the Greenland-Mass subdistrict. Vein-type deposits are notable from vicinity of deposits 15 to 11. The regional location is illustrated in Figure 1.

Figure 3.
Cartoon geologic cross section showing the conceptual model for the native copper deposits of the Keweenaw Peninsula. Section from Isle Royale to the Keweenaw Peninsula, which can be seen in Figure 1. Metamorphogenic ore-forming fluids are derived from a source zone at depth below the native copper deposits in the same basalt-dominated stratigraphic section that hosts the deposits. Ore-forming fluids move upward and precipitate native copper at depths below the surface corresponding to zeolite to prehnite-pumpellyite facies low temperature and pressure conditions.
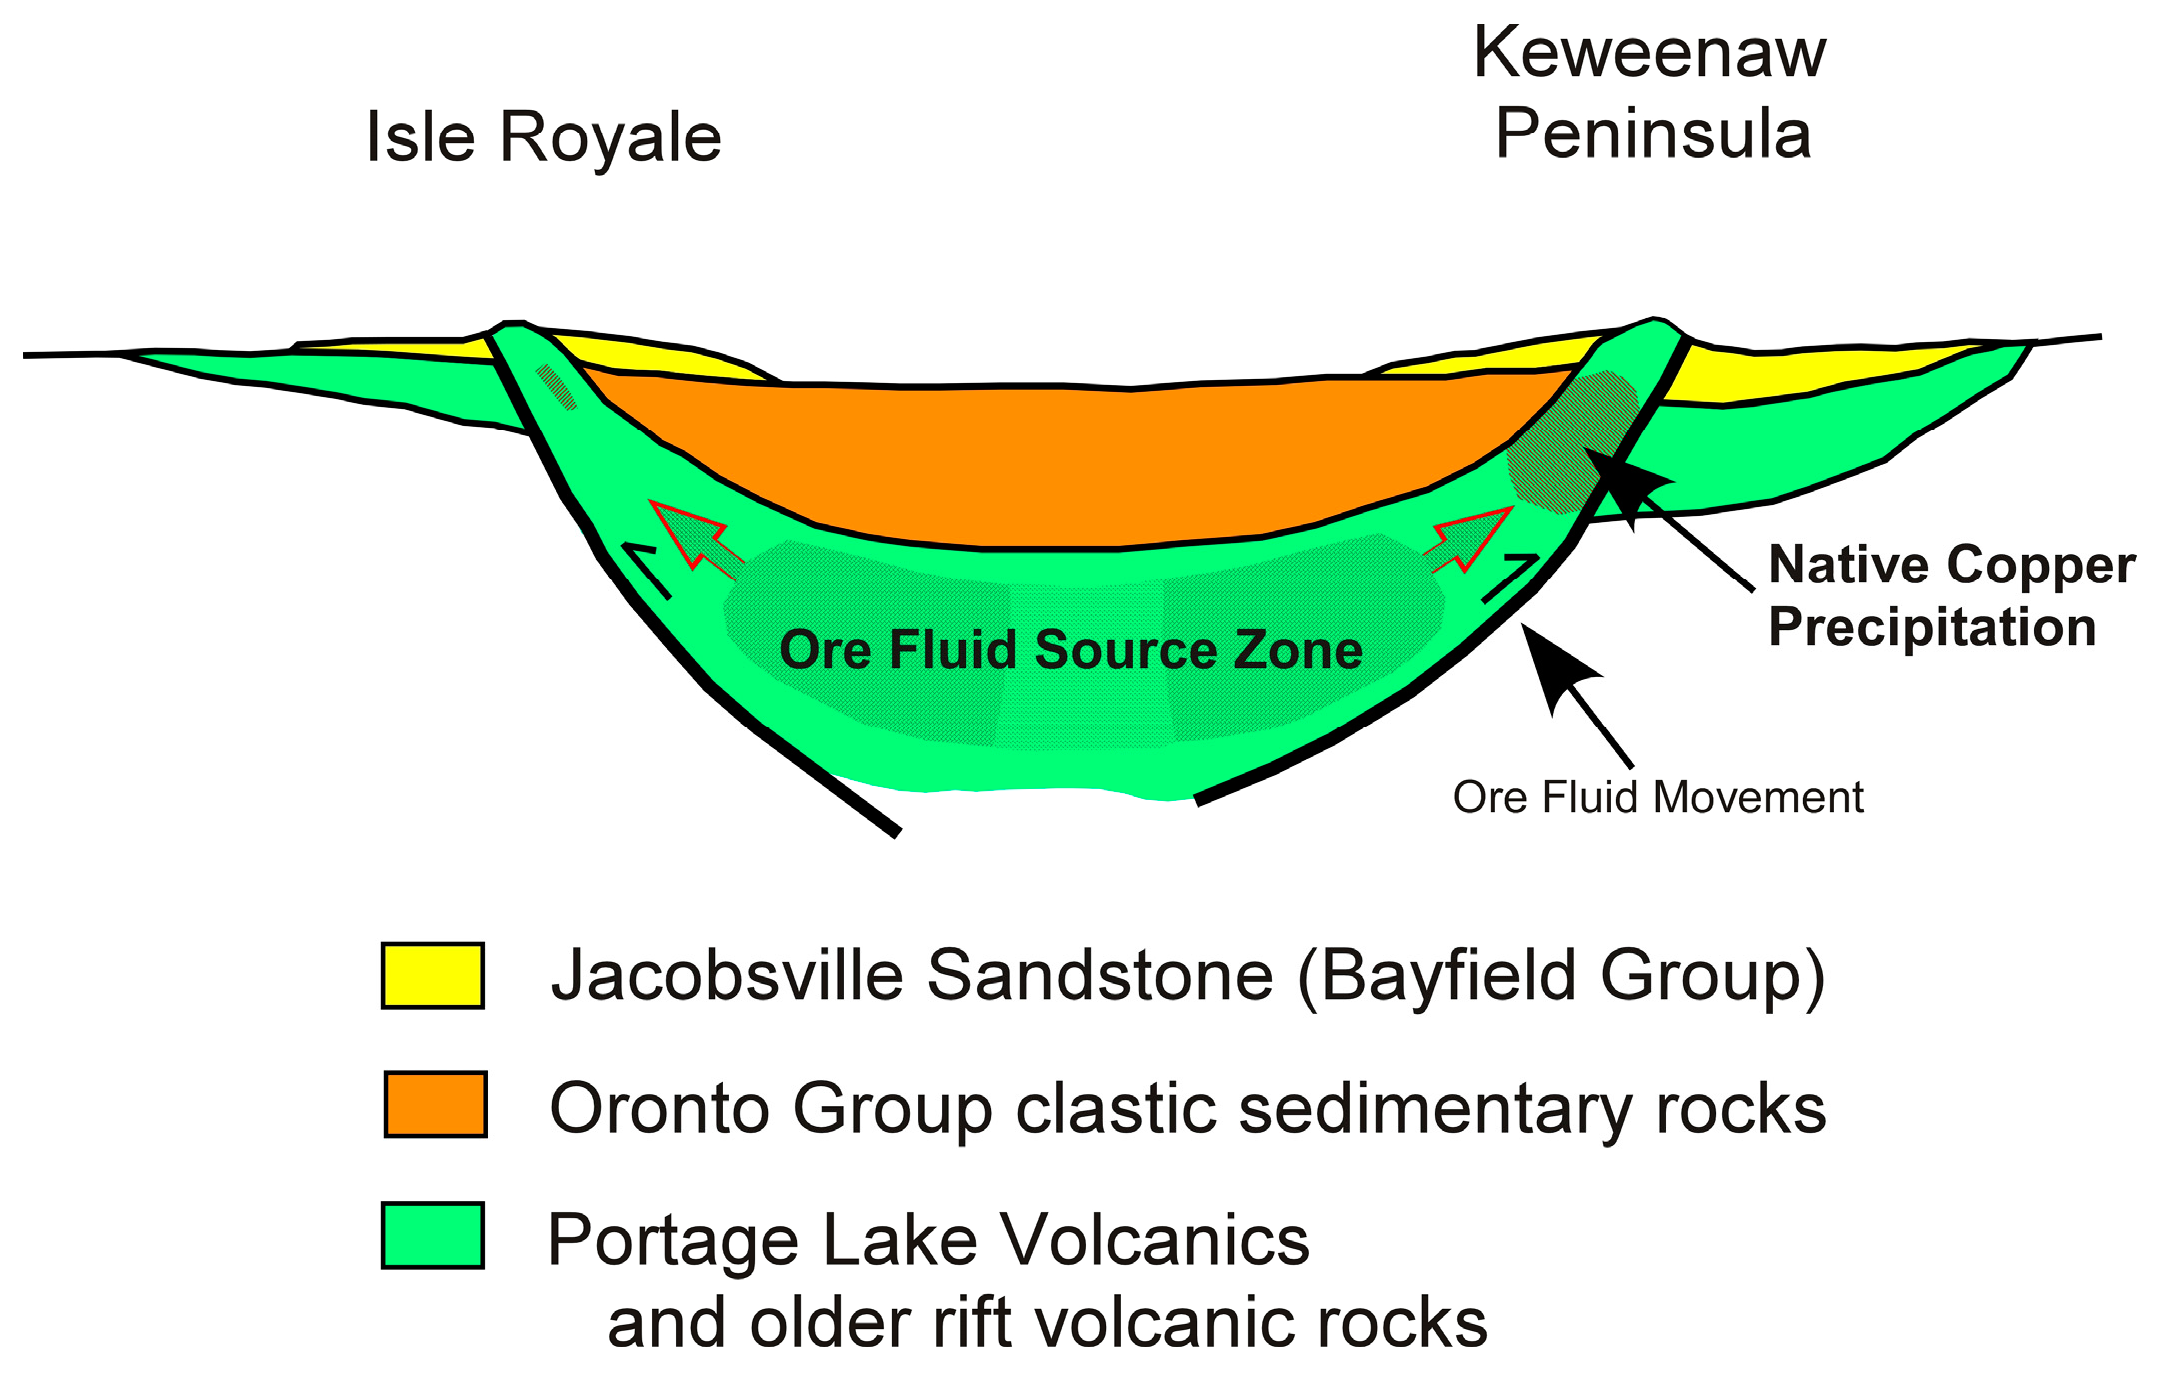
Figure 4.
Dot histogram of the copper isotopic composition of native copper from the Keweenaw Peninsula, Michigan. (A) The main district and vein-type deposits to the northeast are compared to deposits of the Greenland-Mass subdistrict; (B) The major native copper deposit types are compared to each other. Copper isotopic data are given in Table 2.
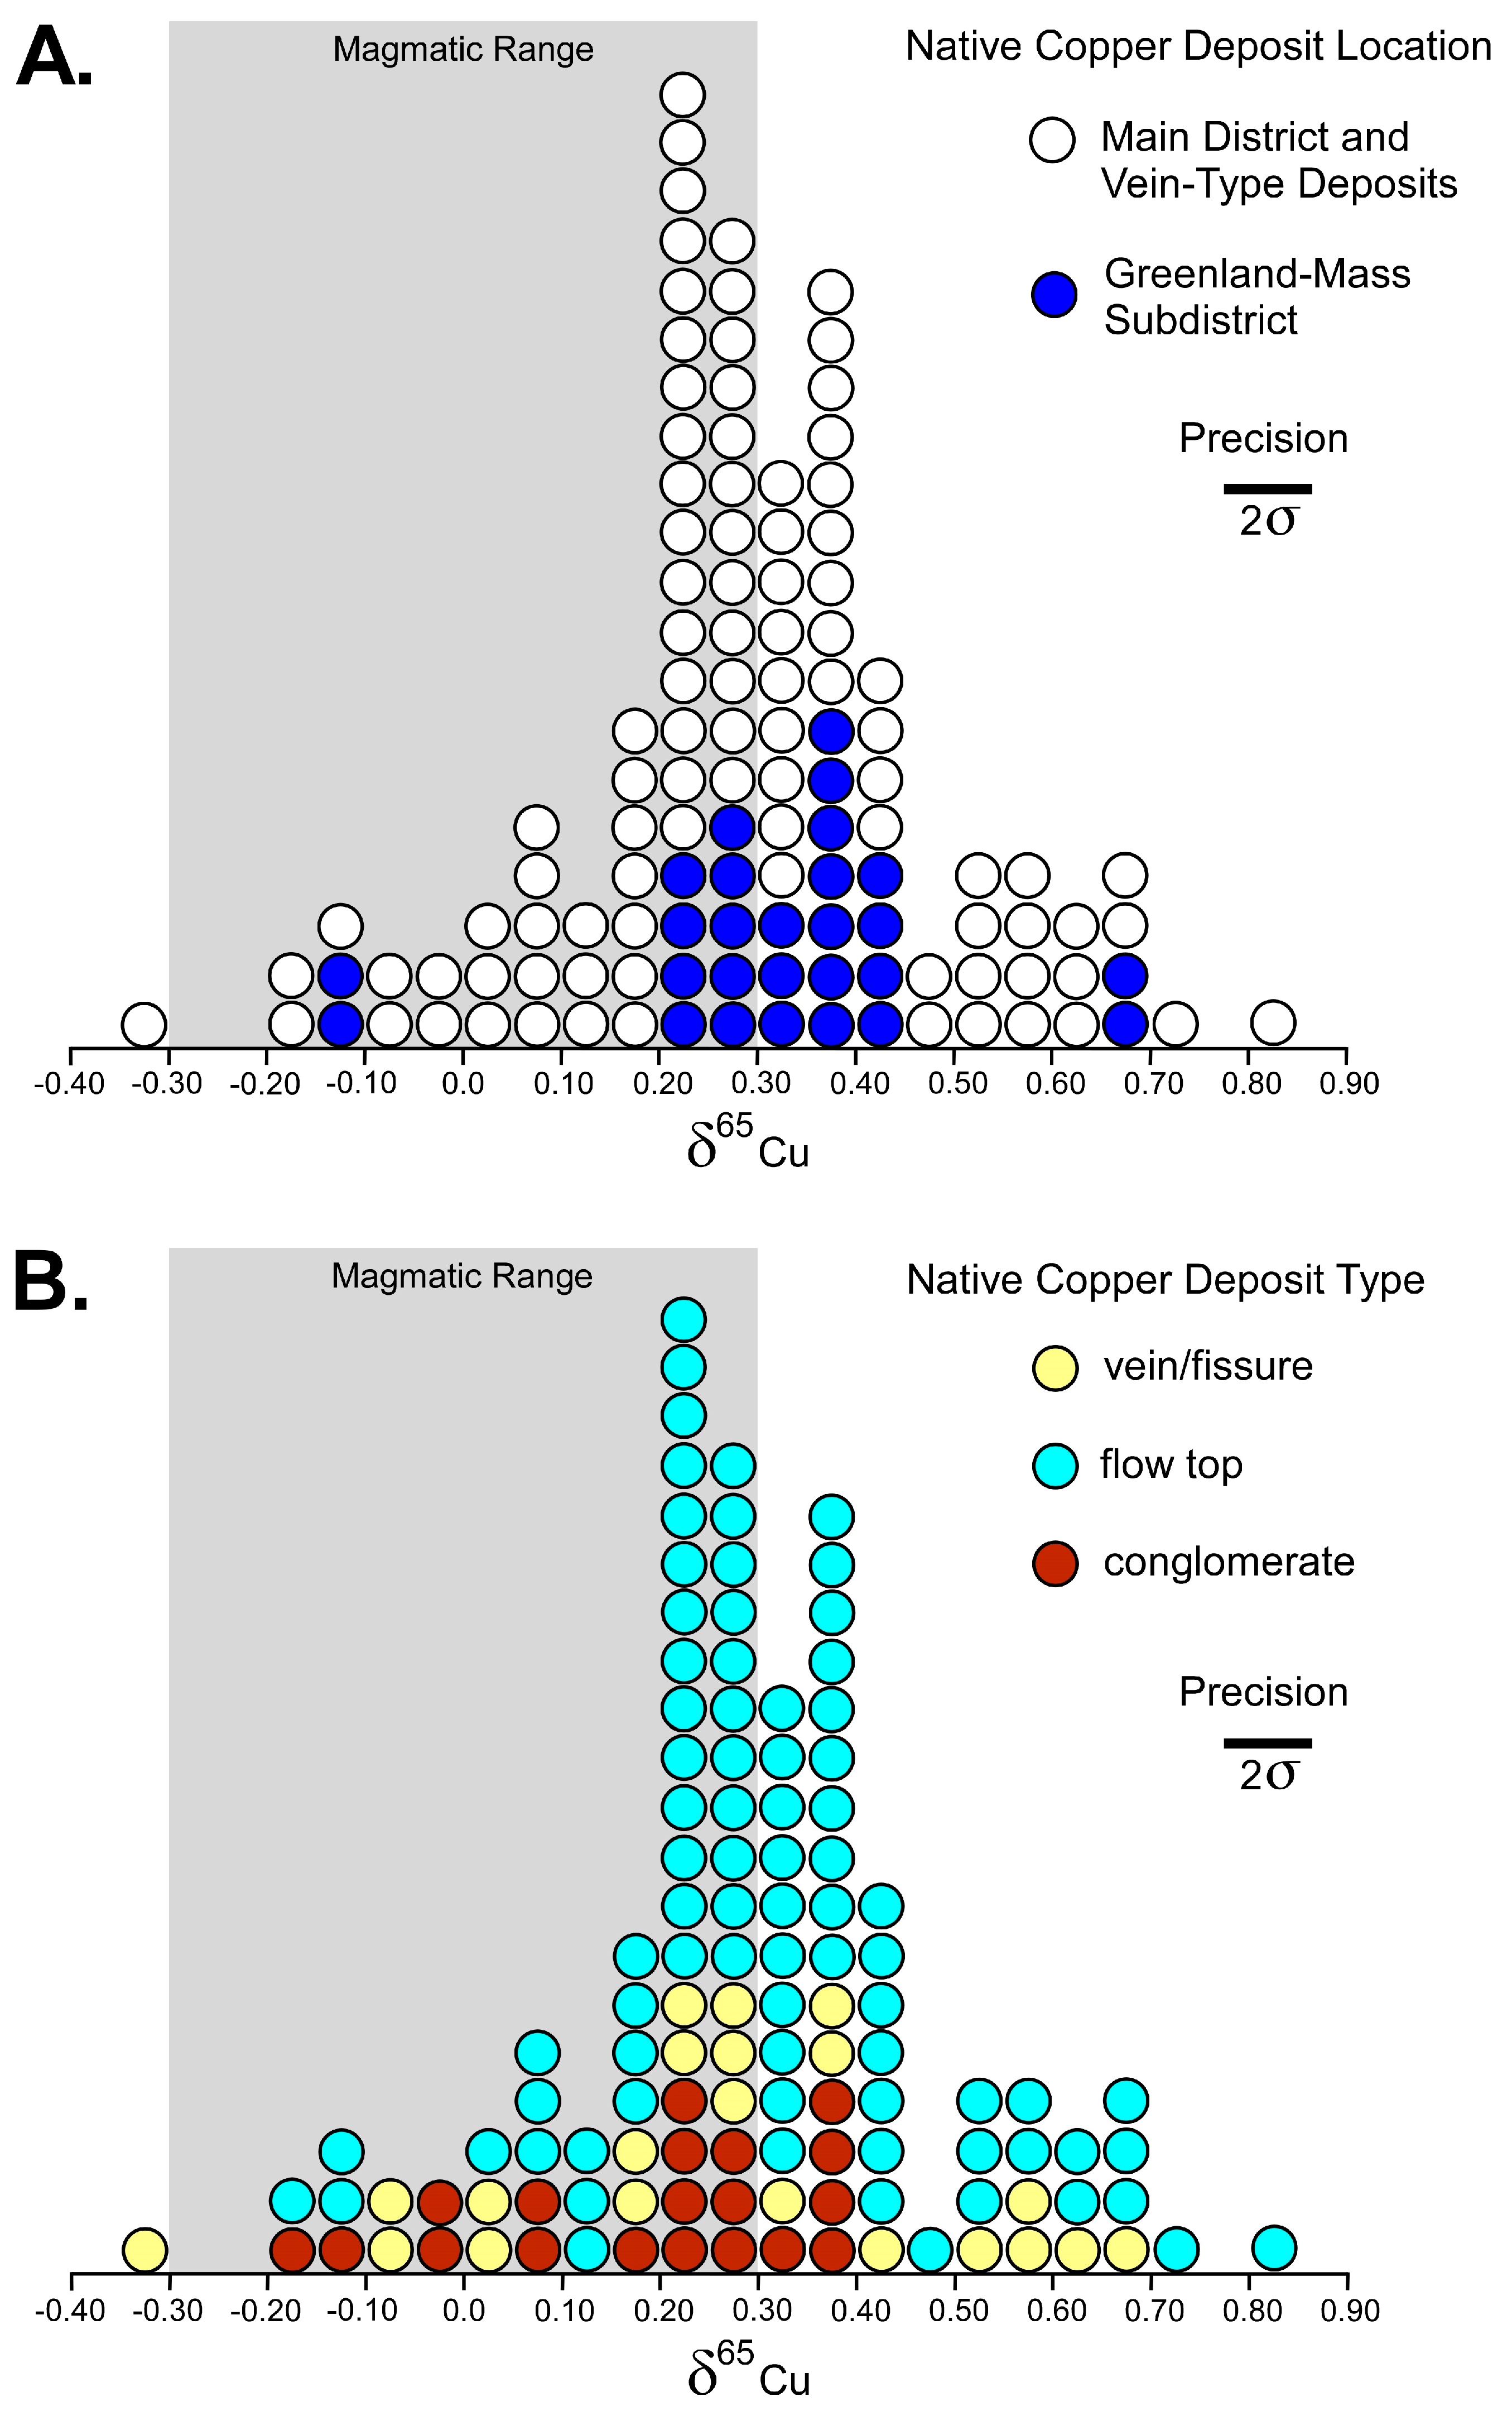
Figure 5.
Graphical comparison of the mean and range of the copper isotopic composition of deposits/mines of the Keweenaw Peninsula native copper district when the number of samples is three or more. Deposits are ordered by production size with the largest at top as given in Table 1. Copper isotopic data are given in Table 2. Individual values are slightly adjusted so all values are observable.


Table 1.
Summary of copper produced from deposits/mines of the Keweenaw native copper district. Copper was exclusively as native copper; native silver occurs as a by-product of native copper mining but was not consistently recovered. The location of the deposits/mines is shown on Figure 2 and the copper isotope data are given in Table 2. Production figures are from Weege and Pollack [17] or Butler and Burbank [28].
| Deposit or Mine | Millions lbs Produced Refined Copper | Location Number on Figure 2 |
|---|---|---|
| Calumet & Hecla conglomerate | 4229 | 1 |
| Kearsarge flow top | 2263 | 2 |
| Baltic flow top | 1845 | 3 |
| Pewabic flow top | 1077 | 4 |
| Osceola flow top | 578 | 5 |
| Isle Royale flow top | 341 | 6 |
| Atlantic mine flow top | 143 | 7 |
| Allouez conglomerate | 73 | 8 |
| Central fissure | 52 | 9 |
| Houghton conglomerate | 38 | 10 |
| Copper Falls fissure and flow top | 26 | 11 |
| Kingston conglomerate | 20 | 12 |
| Winona flow top | 18 | 13 |
| Phoenix fissure | 17 | 14 |
| North Cliff fissure | <1 | 15 |
| Greenland-Mass Subdistrict | ||
| Mass mine Evergreen flow tops | 53 | 16 |
| Minesota fissure | 35 | 17 |
| Michigan mine Evergreen flow tops | 21 | 18 |
| Adventure mine Evergreen flow tops | 11 | 19 |
| Caledonia mine Evergreen flow tops | 7 | 20 |
| Other deposits/mines | 182 | |
| District Total | 11,029 |
Table 2.
Copper isotopic composition of native copper from native copper deposits of the Keweenaw Peninsula, Michigan, USA. The location of the deposits is shown on Figure 2; each deposit is often accessed by multiple shafts which were sometimes operated under different mine names. Copper isotopic composition is the average of two measurements.
| Sample | Deposit | Mine | δ65Cu ‰ | Data Source |
|---|---|---|---|---|
| WAS1736 | C&H conglomerate | C&H | 0.22 | this study |
| CM32627 | C&H conglomerate | Centennial | 0.06 | this study |
| CM32631 | C&H conglomerate | Centennial | 0.26 | this study |
| CM32632 | C&H conglomerate | Centennial | 0.39 | this study |
| CM32634 | C&H conglomerate | Centennial | −0.05 | this study |
| CM32731 | C&H conglomerate | Centennial | 0.20 | [52] |
| LS-12 | C&H conglomerate | Centennial | 0.26 | [6] |
| PCH0008 | C&H conglomerate | Centennial | 0.20 | this study |
| CHJV01 | C&H conglomerate | Hecla | 0.36 | this study |
| CHJV04 | C&H conglomerate | Hecla | −0.05 | this study |
| DM2282 | Kearsarge flow top | Ahmeek Mine | 0.36 | this study |
| CHDM1120 | Kearsarge flow top | Seneca Mine | 0.71 | this study |
| CM32738 | Kearsarge flow top | Seneca Mine | 0.22 | [52] |
| FC0007 | Kearsarge flow top | Seneca Mine | 0.22 | this study |
| CM32681 | Kearsarge flow top | Wolverine | 0.16 | [52] |
| CM32682 | Kearsarge flow top | Wolverine | 0.20 | [52] |
| CM32684 | Kearsarge flow top | Wolverine | 0.59 | [52] |
| CM32685 | Kearsarge flow top | Wolverine | 0.46 | [52] |
| LS-48 | Kearsarge flow top | Wolverine | 0.30 | [6] |
| WAS883 | Kearsarge flow top | Wolverine | 0.43 | this study |
| CM32706 | Baltic flow top | Baltic | 0.44 | this study |
| CM32710 | Baltic flow top | Baltic | 0.35 | this study |
| LS-10 | Baltic flow top | Baltic | 0.36 | [6] |
| LS-10a | Baltic flow top | Baltic | 0.30 | [6] |
| LS-10b | Baltic flow top | Baltic | 0.27 | [6] |
| LS-10c | Baltic flow top | Baltic | 0.30 | [6] |
| LS-10d | Baltic flow top | Baltic | 0.29 | [6] |
| LS-10e | Baltic flow top | Baltic | 0.27 | [6] |
| LS-10f | Baltic flow top | Baltic | 0.22 | [6] |
| LS-10g | Baltic flow top | Baltic | 0.34 | [6] |
| CM32719 | Baltic flow top | Champion | 0.58 | this study |
| LS-7 | Baltic flow top | Trimountain | 0.27 | [6] |
| CM32614 | Pewabic flow top | Quincy | 0.27 | this study |
| WAS506 | Pewabic flow top | Quincy | 0.16 | this study |
| WAS1417 | Pewabic flow top | Quincy | 0.60 | this study |
| CM32671 | Osceola flow top | La Salle | 0.06 | [52] |
| CM32672 | Osceola flow top | La Salle | 0.09 | [52] |
| CM32672 | Osceola flow top | La Salle | 0.18 | this study |
| CM32673 | Osceola flow top | La Salle | 0.13 | [52] |
| CM32675 | Osceola flow top | La Salle | 0.51 | [52] |
| CM32678 | Osceola flow top | La Salle | 0.17 | [52] |
| CM32678 | Osceola flow top | La Salle | 0.20 | [52] |
| CM32679 | Osceola flow top | La Salle | −0.18 | [52] |
| CM32680 | Osceola flow top | La Salle | 0.02 | [52] |
| CM32666 | Osceola flow top | Laurium | 0.37 | [52] |
| CM32667 | Osceola flow top | Laurium | 0.07 | [52] |
| CM32669 | Osceola flow top | Laurium | 0.22 | [52] |
| CM32670 | Osceola flow top | Laurium | 0.80 | [52] |
| CM32689 | Osceola flow top | Osceola | 0.20 | this study |
| CM32690 | Osceola flow top | Osceola | 0.61 | this study |
| CM32693 | Osceola flow top | Osceola | 0.12 | this study |
| CM32694 | Osceola flow top | Osceola | 0.24 | this study |
| CM32695 | Osceola flow top | Osceola | 0.39 | this study |
| CM32660 | Isle Royale flow top | Isle Royale | 0.14 | [52] |
| CM32662 | Isle Royale flow top | Isle Royale | 0.29 | [52] |
| CM32664 | Isle Royale flow top | Isle Royale | 0.31 | [52] |
| CM32665 | Isle Royale flow top | Isle Royale | 0.69 | [52] |
| CM32739 | Isle Royale flow top | Isle Royale | 0.50 | [52] |
| CM32740 | Isle Royale flow top | Isle Royale | 0.21 | [52] |
| FC0008 | Isle Royale flow top | Isle Royale | 0.50 | this study |
| FC0009 | Isle Royale flow top | Isle Royale | 0.21 | this study |
| LS-45 | Isle Royale flow top | Isle Royale | 0.34 | [6] |
| CM32705 | Atlantic flow top | Atlantic | 0.43 | this study |
| CH41860A | Allouez Conglomerate | Allouez | 0.23 | this study |
| CH41860B | Allouez Conglomerate | Allouez | 0.28 | this study |
| CM32730 | Keweenaw County fissure | Central | 0.58 | [52] |
| PCH0007 | Keweenaw County fissure | Central | 0.58 | this study |
| CH960level23 | Houghton Conglomerate | Allouez | 0.37 | this study |
| CH960level29 | Houghton Conglomerate | Allouez | 0.33 | this study |
| CM29818 | Keweenaw County fissure | Copper Falls | −0.32 | [52] |
| CM29819 | Keweenaw County fissure | Copper Falls | 0.17 | [52] |
| CM29820 | Keweenaw County fissure | Copper Falls | −0.10 | [52] |
| CM29821 | Keweenaw County fissure | Copper Falls | 2.29 | this study |
| CM29822 | Keweenaw County fissure | Copper Falls | 0.25 | [52] |
| LS-51a | Keweenaw County fissure | Copper Falls | 0.03 | [6] |
| LS-51b | Keweenaw County fissure | Copper Falls | 0.01 | [6] |
| CM29823 | Kingston conglomerate | Kingston | −0.13 | [52] |
| CM29824 | Kingston conglomerate | Kingston | 0.07 | [52] |
| CM29825 | Kingston conglomerate | Kingston | −0.18 | [52] |
| CM29826 | Kingston conglomerate | Kingston | 0.38 | [52] |
| CM29827 | Kingston conglomerate | Kingston | 0.17 | [52] |
| CM32658 | Winona flow top | Winona | 0.33 | [52] |
| CM239 | Keweenaw County fissure | Phoenix | 0.62 | this study |
| CM32724 | Keweenaw County fissure | Phoenix | 0.26 | [52] |
| CM29489 | Keweenaw County fissure | Phoenix | −0.09 | [52] |
| CM29233.2 | Keweenaw County fissure | Phoenix | 0.69 | this study |
| CM29491 | Keweenaw County fissure | Phoenix | 0.30 | [52] |
| PCH0001 | Keweenaw County fissure | Phoenix | 0.26 | this study |
| CM32699 | Keweenaw County fissure | North Cliff | 0.44 | [52] |
| CM32700 | Keweenaw County fissure | North Cliff | 0.54 | [52] |
| CM32701 | Keweenaw County fissure | North Cliff | 0.20 | [52] |
| CM32703 | Keweenaw County fissure | North Cliff | 0.21 | [52] |
| CM32704 | Keweenaw County fissure | North Cliff | 0.18 | [52] |
| Greenland-Mass Subdistrict | ||||
| CM287 | Evergreen Series 1 flow top | Mass | 0.20 | [52] |
| CM32736 | Evergreen Series 1 flow top | Mass | 0.68 | [52] |
| CM32736 | Evergreen Series 1 flow top | Mass | −0.11 | [52] |
| FC0005 | Evergreen Series 1 flow top | Mass | 0.68 | this study |
| CM32638 | Ontonogan County fissure | Minesota | 0.39 | this study |
| CM32639 | Ontonogan County fissure | Minesota | 0.38 | [52] |
| CM32641 | Evergreen Series flow top 1 | Michigan | 0.25 | [52] |
| CM32642 | Evergreen Series flow top 1 | Michigan | 0.36 | [52] |
| CM32644 | Evergreen Series flow top 1 | Michigan | 0.39 | [52] |
| CM32645 | Evergreen Series flow top 1 | Michigan | 0.28 | [52] |
| CM32648 | Evergreen Series flow top 1 | Michigan | 0.25 | [52] |
| CM32649 | Evergreen Series flow top 1 | Michigan | 0.24 | [52] |
| CM32732 | Evergreen Series flow top 1 | Adventure | 0.40 | [52] |
| CM32733 | Evergreen Series flow top 1 | Adventure | 0.39 | [52] |
| CM32734 | Evergreen Series flow top 1 | Adventure | 0.32 | [52] |
| CM32735 | Evergreen Series flow top 1 | Adventure | 0.43 | [52] |
| FC0001 | Evergreen Series flow top 1 | Adventure | 0.40 | this study |
| FC0002 | Evergreen Series flow top 1 | Adventure | 0.39 | this study |
| FC0003 | Evergreen Series flow top 1 | Adventure | 0.32 | this study |
| FC0004 | Evergreen Series flow top 1 | Adventure | 0.43 | this study |
| CM32615 | Evergreen Series flow top 1 | Caledonia | 0.30 | [52] |
| CM32616 | Evergreen Series flow top 1 | Caledonia | 0.23 | [52] |
| CM32617 | Evergreen Series flow top 1 | Caledonia | 0.22 | [52] |
| CM32618 | Evergreen Series flow top 1 | Caledonia | 0.25 | [52] |
| FC0006 | Evergreen Series flow top 1 | Caledonia | −0.11 | this study |
| Range 2 | Evergreen Series flow top 1 | Caledonia | 0.27 | [53] |
| Range 2 | Evergreen Series flow top 1 | Caledonia | 0.35 | [53] |
| OUM15120 | unknown | unknown | 0.45 | [5] |
1 Evergreen Series contains 7 different lava flow tops which were mined in different proportions for the various mines; 2 Range of measurements is reported by Ikehata et al. [53], these are the end-member values.
© 2017 by the authors. Licensee MDPI, Basel, Switzerland. This article is an open access article distributed under the terms and conditions of the Creative Commons Attribution (CC BY) license (http://creativecommons.org/licenses/by/4.0/).
Share and Cite
MDPI and ACS Style
Bornhorst, T.J.; Mathur, R. Copper Isotope Constraints on the Genesis of the Keweenaw Peninsula Native Copper District, Michigan, USA. Minerals 2017, 7, 185. https://doi.org/10.3390/min7100185
AMA Style
Bornhorst TJ, Mathur R. Copper Isotope Constraints on the Genesis of the Keweenaw Peninsula Native Copper District, Michigan, USA. Minerals. 2017; 7(10):185. https://doi.org/10.3390/min7100185
Chicago/Turabian StyleBornhorst, Theodore J., and Ryan Mathur. 2017. "Copper Isotope Constraints on the Genesis of the Keweenaw Peninsula Native Copper District, Michigan, USA" Minerals 7, no. 10: 185. https://doi.org/10.3390/min7100185
Note that from the first issue of 2016, this journal uses article numbers instead of page numbers. See further details here.