Article

The Effects of Calcium Ions on the Flotation of Sillimanite Using Dodecylammonium Chloride

1
School of Resources and Environmental Engineering, Wuhan University of Technology, Wuhan 430070, China
2
Hubei Key Laboratory of Mineral Resources Processing and Environment, Wuhan University of Technology, Wuhan, 430070, China
3
School of Materials Science and Engineering, Anhui University of Science and Technology, Huainan 232001, China
*
Author to whom correspondence should be addressed.
Minerals 2017, 7(2), 28; https://doi.org/10.3390/min7020028
Submission received: 3 November 2016 / Revised: 20 January 2017 / Accepted: 16 February 2017 / Published: 17 February 2017

Abstract

:
The effects of Ca2+ ions on the flotation of sillimanite using dodecylammonium chloride as a collector were investigated by micro-flotation tests, zeta potential measurements, solution chemistry analysis and molecular dynamics (MD) simulation. The micro-flotation results indicated that Ca2+ ions remarkably inhibit the flotation of sillimanite in the pH range of 2.0–9.0. The point of zero charge (PZC) of sillimanite changed from 5.4 to 6.1 with the addition of Ca2+ ions. Meanwhile, the calculated concentration of RNH3+ in the sillimanite interface layer decreased in the presence of Ca2+ ions. The results of MD simulation revealed that Ca2+ ions have strong binding energy with the sillimanite (010) surface, and the binding energy of RNH3+ with sillimanite (010) surface reduced in the presence of Ca2+ ions. The conclusions drawn from the computations are in good agreement with the experimental results.

Graphical Abstract

1. Introduction

Sillimanite is an alumino-silicate mineral with a chain structure, which shares the same chemical formula Al2SiO5 with kyanite and andalusite. The bulk lattice structure of sillimanite is shown in Figure 1. As a kind of refractory raw material, sillimanite is widely used in the linings of blast furnaces, the rotary kilns in cement manufacturing and general kilns of lime production [1,2,3,4,5,6]. Today, it is of great necessity to produce high quality sillimanite as industrial needs of high grade sillimanite are gradually increasing.
As a non-conducting and non-magnetic mineral, sillimanite needs to be separated from other gangue minerals by flotation [4]. Dodecylammonium chloride (a kind of cationic collector) has been extensively used in this situation [7,8]. Previous research has showed that the unavoidable metal ions in process water, such as Ca2+ and Mg2+ ions, affect the flotation of silicate minerals significantly [9,10,11,12,13,14]. Lu et al. [15] described the depression effects of Ca2+ ions on andalusite, and the results showed that both Ca2+ ions and [CaOH]+ could depress the flotation of andalusite. Liu et al. [13] investigated the effects of Ca2+ and Mg2+ ions on the flotation of spodumene with sodium oleate as the collector. They found that the hydroxy complexes ([CaOH]+ and [MgOH]+) and precipitates (Ca(OH)2 and Mg(OH)2) contributed to the formation of oleate complexes, thus the amount of collector adsorption and the floatability of spodumene increased. A similar result was reported by Yu et al. [12] through a density functional theory (DFT) calculation. They pronounced that the precipitation of calcium hydroxide on the spodumene surface was an effective process to activate the flotation of spodumene. Demir et al. [9] researched the effects of Ca2+ ions on the separation of Na-feldspar from K-feldspar. In their study, Ca2+ ions exhibited complex and interesting features of adsorption and ion exchange patterns, which proved beneficial in the separation of individual feldspar minerals. In the flotation of microcline, quartz as the gangue could be activated in the presence of Ca2+ and Mg2+ ions, but microcline did not respond to flotation with these cations [16]. Burdukova et al. [17] concluded that the presence of calcium ions greatly enhanced the adsorption density of carboxymethyl cellulose on talc, which was attributed to the increased concentration of [CaOH]+ on the mineral surface as well as the increased amount of coiling of the carboxymethyl cellulose macromolecules due to their reaction with Ca2+ ions.
Although the flotation of silicates with Ca2+ ions as the activator in the presence of sodium oleatehas been well researched, studies on the inhibition mechanism of Ca2+ ions on silicates with dodecylammonium chloride as the collector are limited. In the current work, the effects of Ca2+ ions on the flotation behavior of sillimanite were examined by pure mineral micro-flotation tests. The zeta potential analysis was carried out to reveal the charge changing on the mineral surface, with a molecular dynamics simulation applied to explain the experimental data at a molecular level, in an attempt to explain the mechanisms of the depression of Ca2+ ions on sillimanite.

2. Materials and Methods

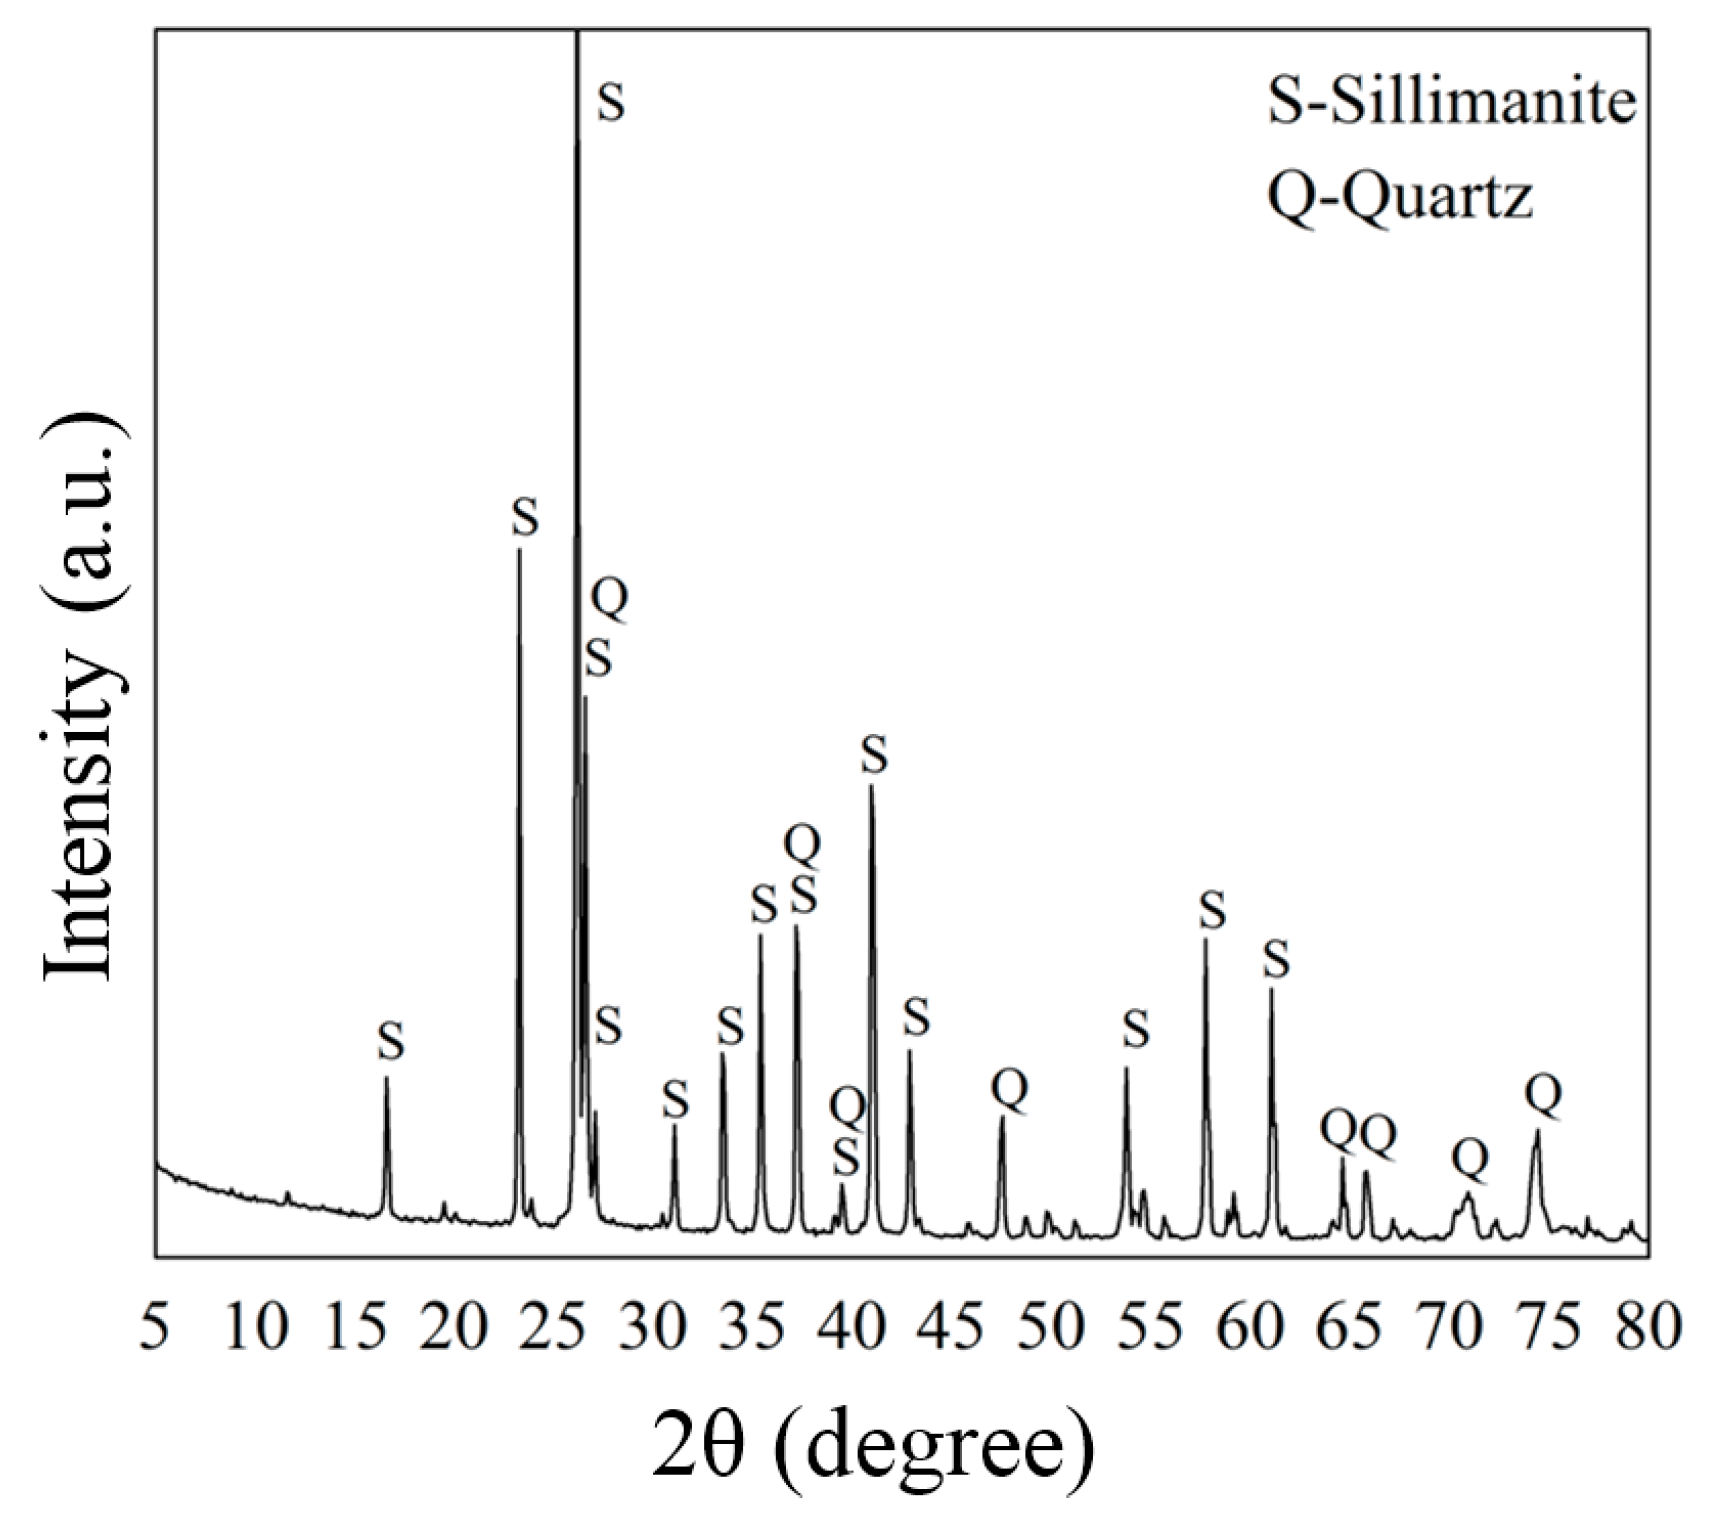
2.1. Materials and Reagents

High grade sillimanite samples were obtained from Hebei Province, China. The samples were crushed and ground with an agate mortar, then sieved to obtain a particle size of 0.105–0.074 mm for micro-flotation tests before being washed with deionized water. The prepared samples were examined via a chemical method with a X-ray Fluorescence (XRF) spectrometer (Axios advanced, PAN Alytical B.V., Almelo, The Netherlands), and phase-examined using a powder X-ray diffractometer (XRD, D/Max-IIIA, Rigaku, Tokyo, Japan) with monochromatic Cu Kα radiation in 5°–80° at a rate of 0.02°/s. The results are shown in Table 1 and Figure 2, respectively. According to the results of the XRF and XRD analyses, the grade of sillimanite was approximately 95%, and the main impurity was quartz (around 2.5%).
Dodecylammonium chloride (DAC) was employed as the cationic collector for the flotation of sillimanite. Calcium chloride (CaCl2) was purchased from the Sinopharm Chemical Reagent Co., Ltd. (Shanghai, China). Hydrochloric acid (HCl) and sodium hydroxide (NaOH) were prepared as one percent solutions for the pH adjustment of the slurry. The pH of the slurry was monitored with a RPB10 pH meter (Ruosull Technology Co., Ltd., Shanghai, China). All chemicals were of analytical grade, and deionized water with a resistivity value of 18.25 MΩ·cm was used in all experiments.

2.2. Micro-Flotation Experiments

The micro-flotation experiments were conducted in a RK/FGC-35 hitch groove flotation cell (Wuhan Rock Crush & Grand Equipment manufacture Co. Ltd., Wuhan, China). The pure mineral particles (two grams) were placed into a Plexiglas cell, which was then filled with 30 mL of deionized water. The pulp was continuously stirred for two minutes using a pH regulator, two minutes with the depressor, and two minutes with the collector at 1500 rpm of agitation. The pH of the slurry was monitored before the flotation with a RPB10 pH meter, and flotation was conducted for five minutes. The floated and tailing fractions were collected separately and dried, then weighed for calculating recovery. All of the flotation tests were completed three times, and the average recovery and the standard deviation were reported.

2.3. Zeta Potential Tests

Zeta potential measurements were carried out using a 90 Plus Zeta Size Analyzer (Brookhaven Instruments Corporation, Holtsville, NY, USA). The particle size of the powder was ground finer than two micron for zeta potential tests. Suspensions (0.01% mass fraction) with 1.00 × 10⁻³ M KCl solution were dispersed in a beaker, then magnetically stirred for 15 min with and without Ca2+ ions at various pH levels. After one hour of settling, the pH value of the suspension was measured and the supernatant was obtained for Zeta-potential measurements. The measurements were performed at about 25 °C. Each sample was measured three times.

2.4. Computational Methods

All calculations were undertaken using the Material Studio 6.0 package (Accelrys Inc., San Diego, CA, USA). The Cambridge Sequential Total Energy Package (CASTEP) module was adopted to optimize the structure of sillimanite and adsorbates. For the sillimanite unit cell, the optimization parameters were set as follows: the function was GGA + PBE, k-point set was 3 × 3 × 4, and the custom energy cutoff was 340 eV. The dispersion-corrected density functional theory (DFT-D) correction was adopted [18]. The threshold values for the convergence criteria were 2.00 × 10⁻³ Å as maximum displacement, 0.05 eV/Å as maximum force, 0.1 GPa as maximum stress, 2.0 × 10⁻⁵ eV/atom as energy, and 1.0 × 10⁻⁶ eV/atom as the self-consistent field tolerance. In the geometric optimization for bulk sillimanite, all the atoms and unit cell parameters were relaxed. The lattice optimization results were a = 7.57 Å, b = 7.80 Å, c = 5.81 Å, α = 90°, β = 90°, γ = 90°, where the predicted lattice parameters were in reasonable agreement with those reported [19]. Next, a 2D periodic surface cell was created from the unit cell of the sillimanite at the complete cleavage plane (010) [6], and then optimized in the same way. The optimization of the Ca, RNH3 (R = 12) and water molecules were calculated in a 30.00 Å × 30.00 Å × 30.00 Å cubic cell, and the optimizations were performed at the gamma point in the Brillouin zone. The other optimization parameters were the same as the primitive unit cell optimization. According to the molecule charged situation, the charge was chosen with Ca as +2, RNH3 as +1.
The condensed-phase optimized molecular potentials for atomistic simulation studies (COMPASS) force field was employed in this work, and has been widely used in similar research [6,20]. The COMPASS force field can accurately predict structural, conformational, vibrational, cohesive and thermophysical properties for a broad coverage of molecules in isolation and in condensed phases under a wide scope of pressures and temperatures [21]. The expression of the COMPASS force field is detailed in [6].
A Forcite module was employed to calculate the adsorption energy. A periodic supercell (34.86 Å × 37.59 Å × 33.72 Å) with a 40 Å vacuum along the c-axis was used. Ca, RNH3 and water molecules worked as the adsorbate, and sillimanite worked as an adsorbent. The input structure of the adsorbate-sillimanite (010) surface complex was created with molecular graphics tools, and the geometry optimization of the system of adsorbate-sillimanite was conducted using the Smart Minimizer in the COMPASS force field [6,20]. The convergence criteria for the energy, force and displacement were set at 1.00 × 10⁻⁴ kcal/mol, 5.00 × 10⁻³ kcal/(mol·Å2) and 5.00 × 10⁻⁵ Å, respectively. The atoms at the top four layers and adsorbates were allowed to relax and the rest of atoms were constrained during the minimizations as only the atoms in the top several layers have interactions with adsorbate molecules [21]. Several initial conformations were assessed to locate the minimum energy conformation of adsorbates at the sillimanite (010) surface. Next, MD simulations were run using a canonical ensemble (NVT) [6,22] at 298.0 K with the time step of one femtosecond, and the total run length was 500 ps. As periodic boundary conditions were used in this study, the NVT ensemble provided the advantage of less perturbation of the trajectory, owing to the absence of coupling to a pressure bath [23]. During the MD simulations, the temperature was controlled with a Nose method and an atom based direct cut off (12.50 Å) method was employed to calculate both electrostatic interactions and van der Waals [24,25,26]. As the mineral surface was minimized in an earlier step, the entire surface atoms were constrained during dynamics [22,27,28].
The aqueous environment was not included explicitly in the simulations; however, the interaction energy of a water molecule with a sillimanite (010) surface was computed and compared with other adsorbates-sillimanite interaction energies [6,29,30,31].
The interaction energy could be calculated using Equation (1) [32]:
E i = E complex ( E surface + E adsorbates ) n
where Ecomplex is the total energy of the optimized adsorbates-sillimanite complex; Eadsorbates is the energies of n adsorbates; and Esurface is the energy of the sillimanite (010) surface. The number of the adsorbates is n, and all the number of the adsorbates in all systems was one in this study.
Binding energy was defined to be the negative value of interaction energy [20,25,33], namely:
Eb = −Ei
The more positive the magnitude of binding energy shown, the more favorable the interactions between the sillimanite (010) surface and the adsorbate. Hence, the magnitude of binding energy is an excellent measure of the relative efficiency of the interaction of different adsorbates with the sillimanite (010) surface [34].

3. Results and Discussion

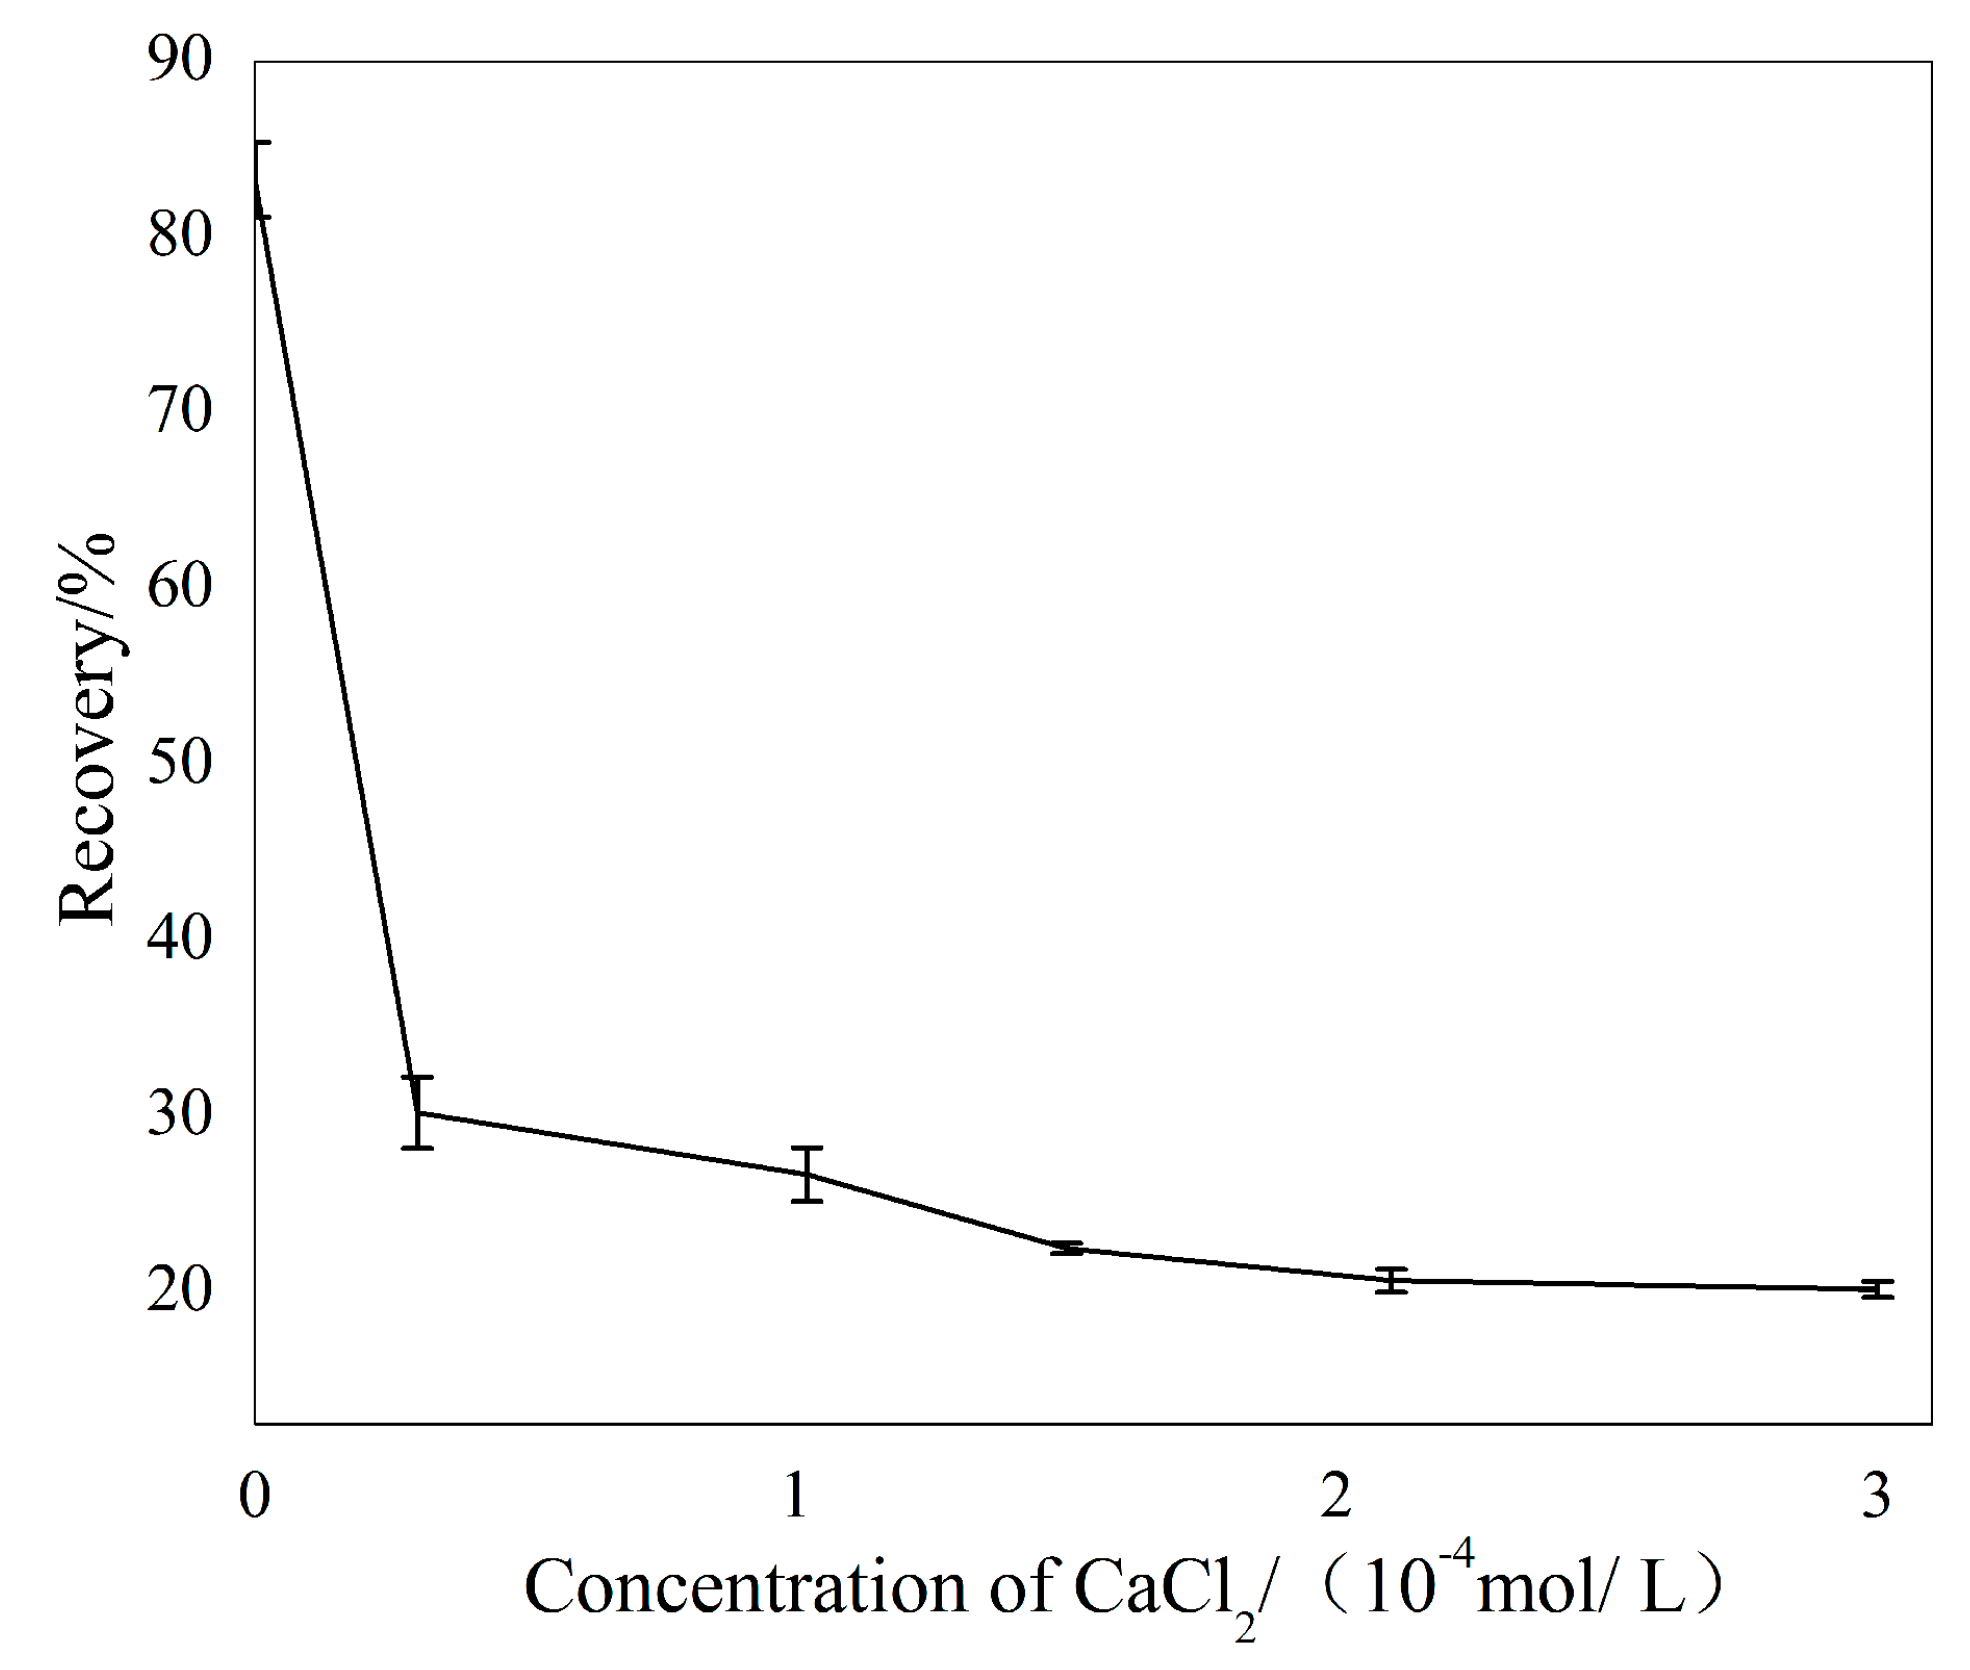
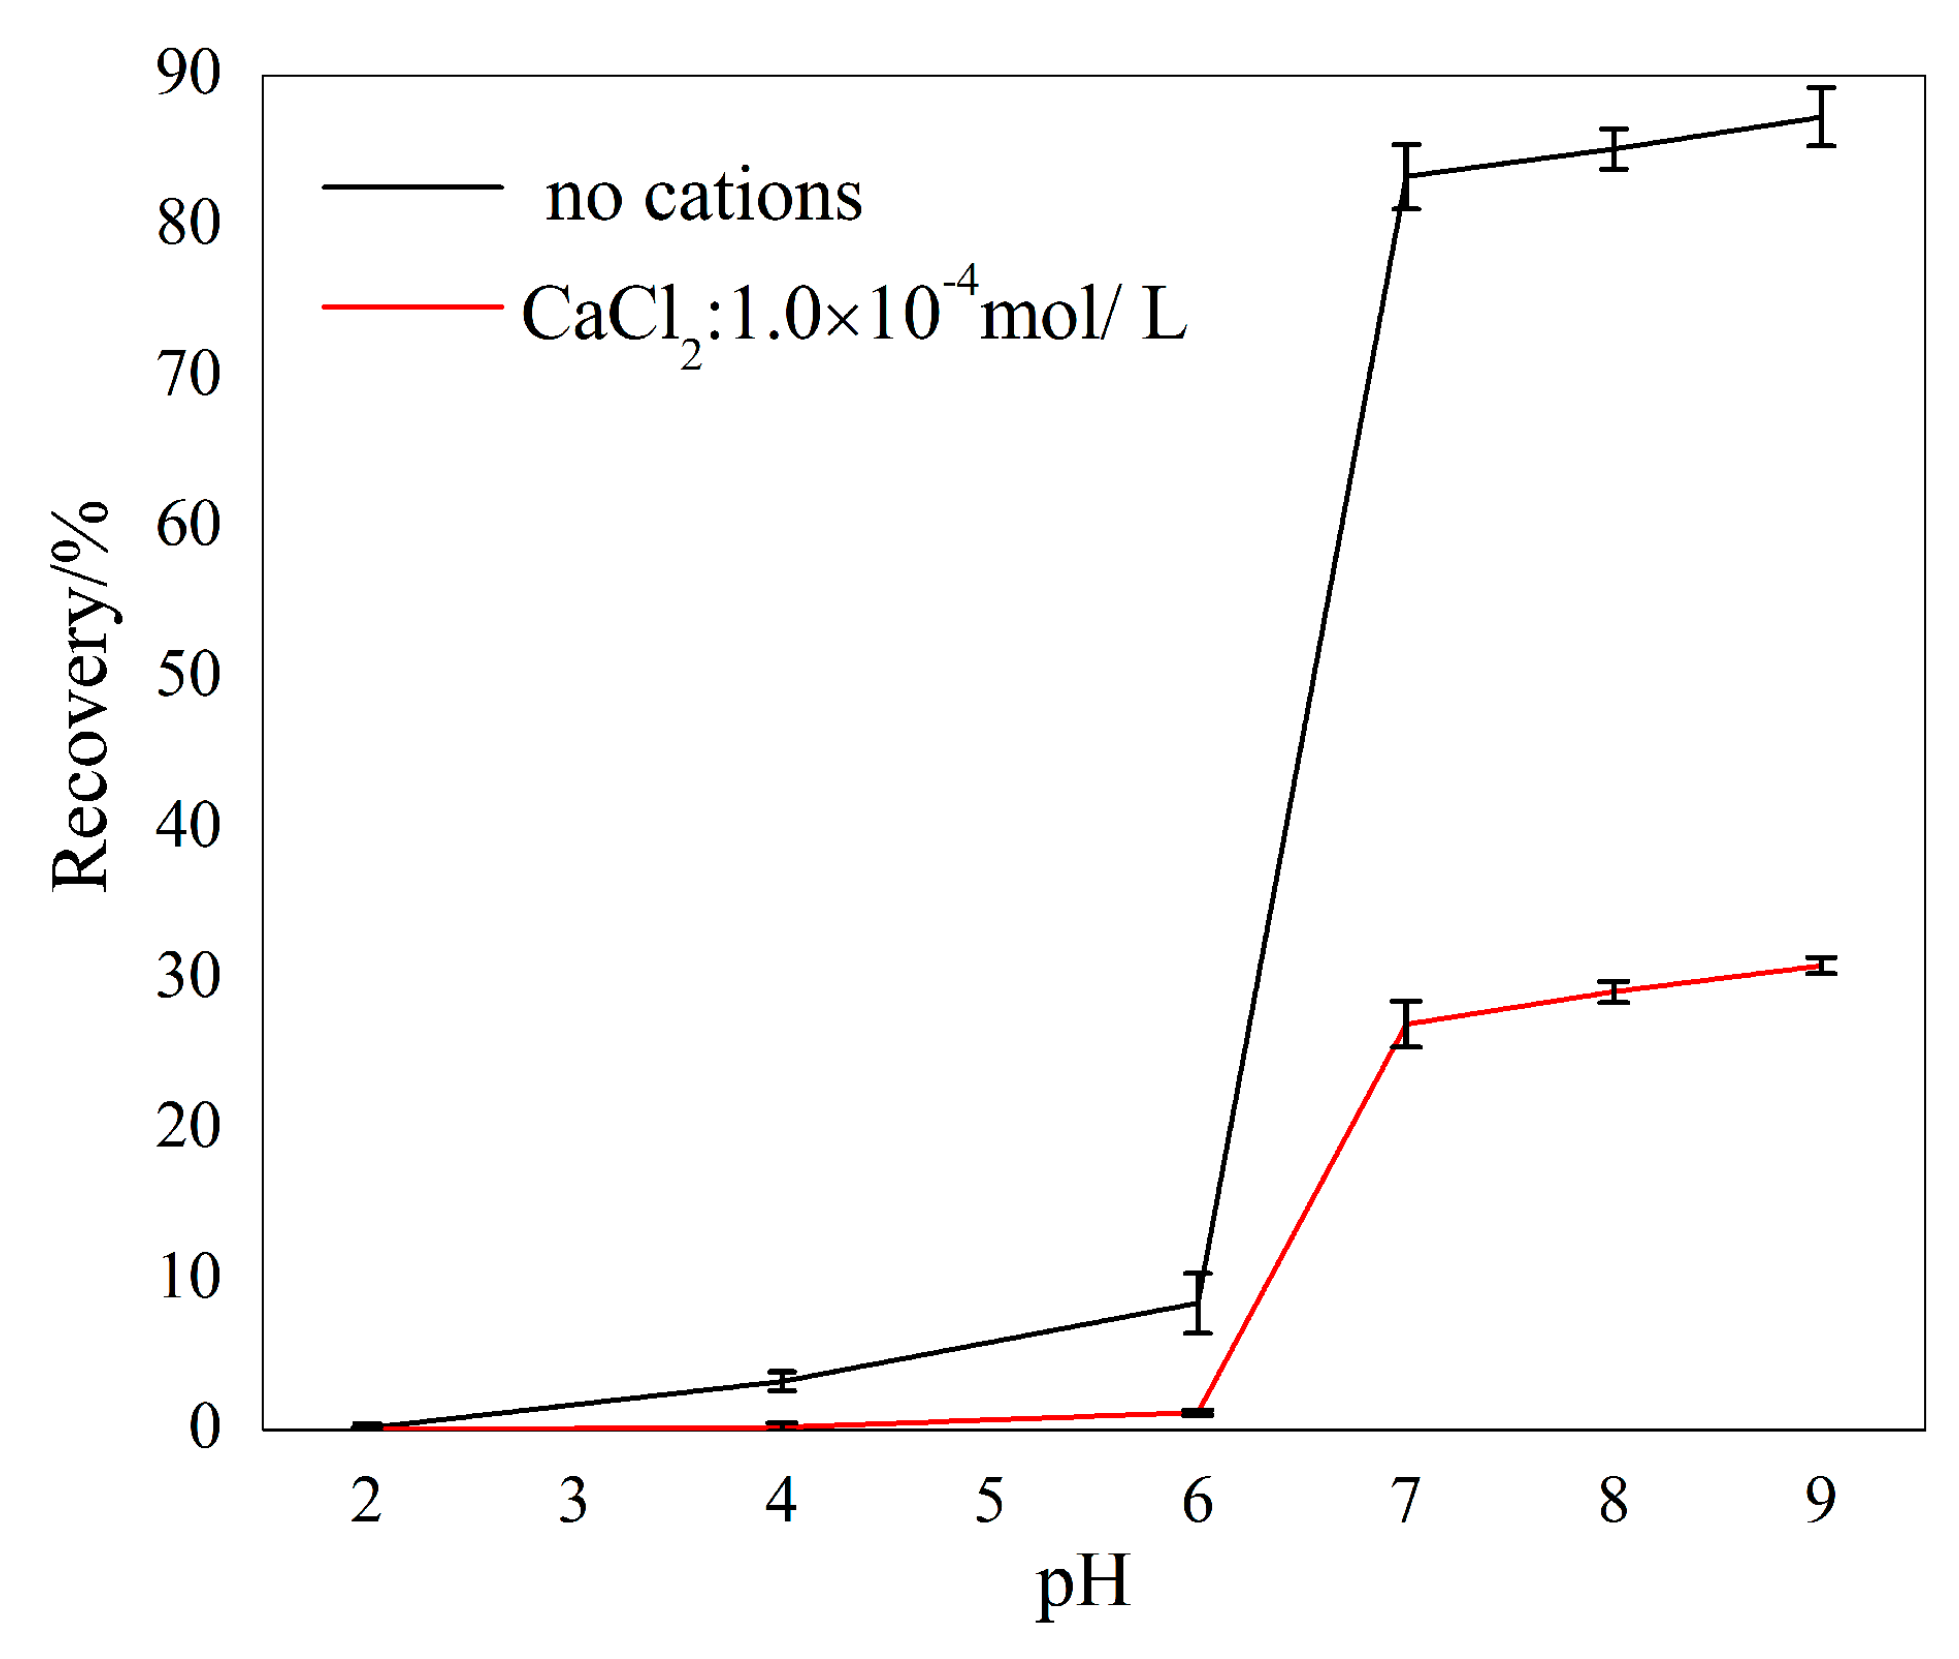
3.1. Micro-Flotation

Micro-flotation tests were conducted to show the flotation behavior of sillimanite and the depression of Ca2+ ions. The flotation results of sillimanite with increasing DAC concentration are shown in Figure 3. The flotation recovery of the sillimanite increased rapidly with increasing DAC concentration until 4.50 × 10⁻⁴ M, and above that the recovery increased insignificantly. The maximum flotation recovery reached around 87% using a collector dosage of 7.21 × 10⁻⁴ M.
Figure 4 describes the flotation responses of sillimanite as a function of Ca2+ ions with a concentration fixed at pH = 7.0, and the collector concentration was 4.50 × 10⁻⁴ M. These results demonstrate that the flotation recovery of sillimanite decreased sharply as the concentration of Ca2+ ions increased from 0 to 1.00 × 10⁻⁴ M, beyond which the flotation recovery of sillimanite reduced gradually and remained constant when 2.00 × 10⁻⁴ M of Ca2+ ions was dissolved prior to the test.
The curves given in Figure 5 show the flotation recovery of sillimanite as a function of pH with and without 1.00 × 10⁻⁴ M Ca2+ ions. Sillimanite showed a better floatability throughout the pH range of 2.0–9.0 without Ca2+ ions, and recovery was promoted as pH increased and reached 87.25% at pH = 9.0. In the presence of Ca2+ ions, the recovery of sillimanite increased with increasing pH and reached approximately 30.36% at pH = 9.0, which was less than 50% of the figure when Ca2+ ions were absent. It is obvious that the recovery of sillimanite was very low when pH values were less than 6.0, beyond which recovery increased rapidly.

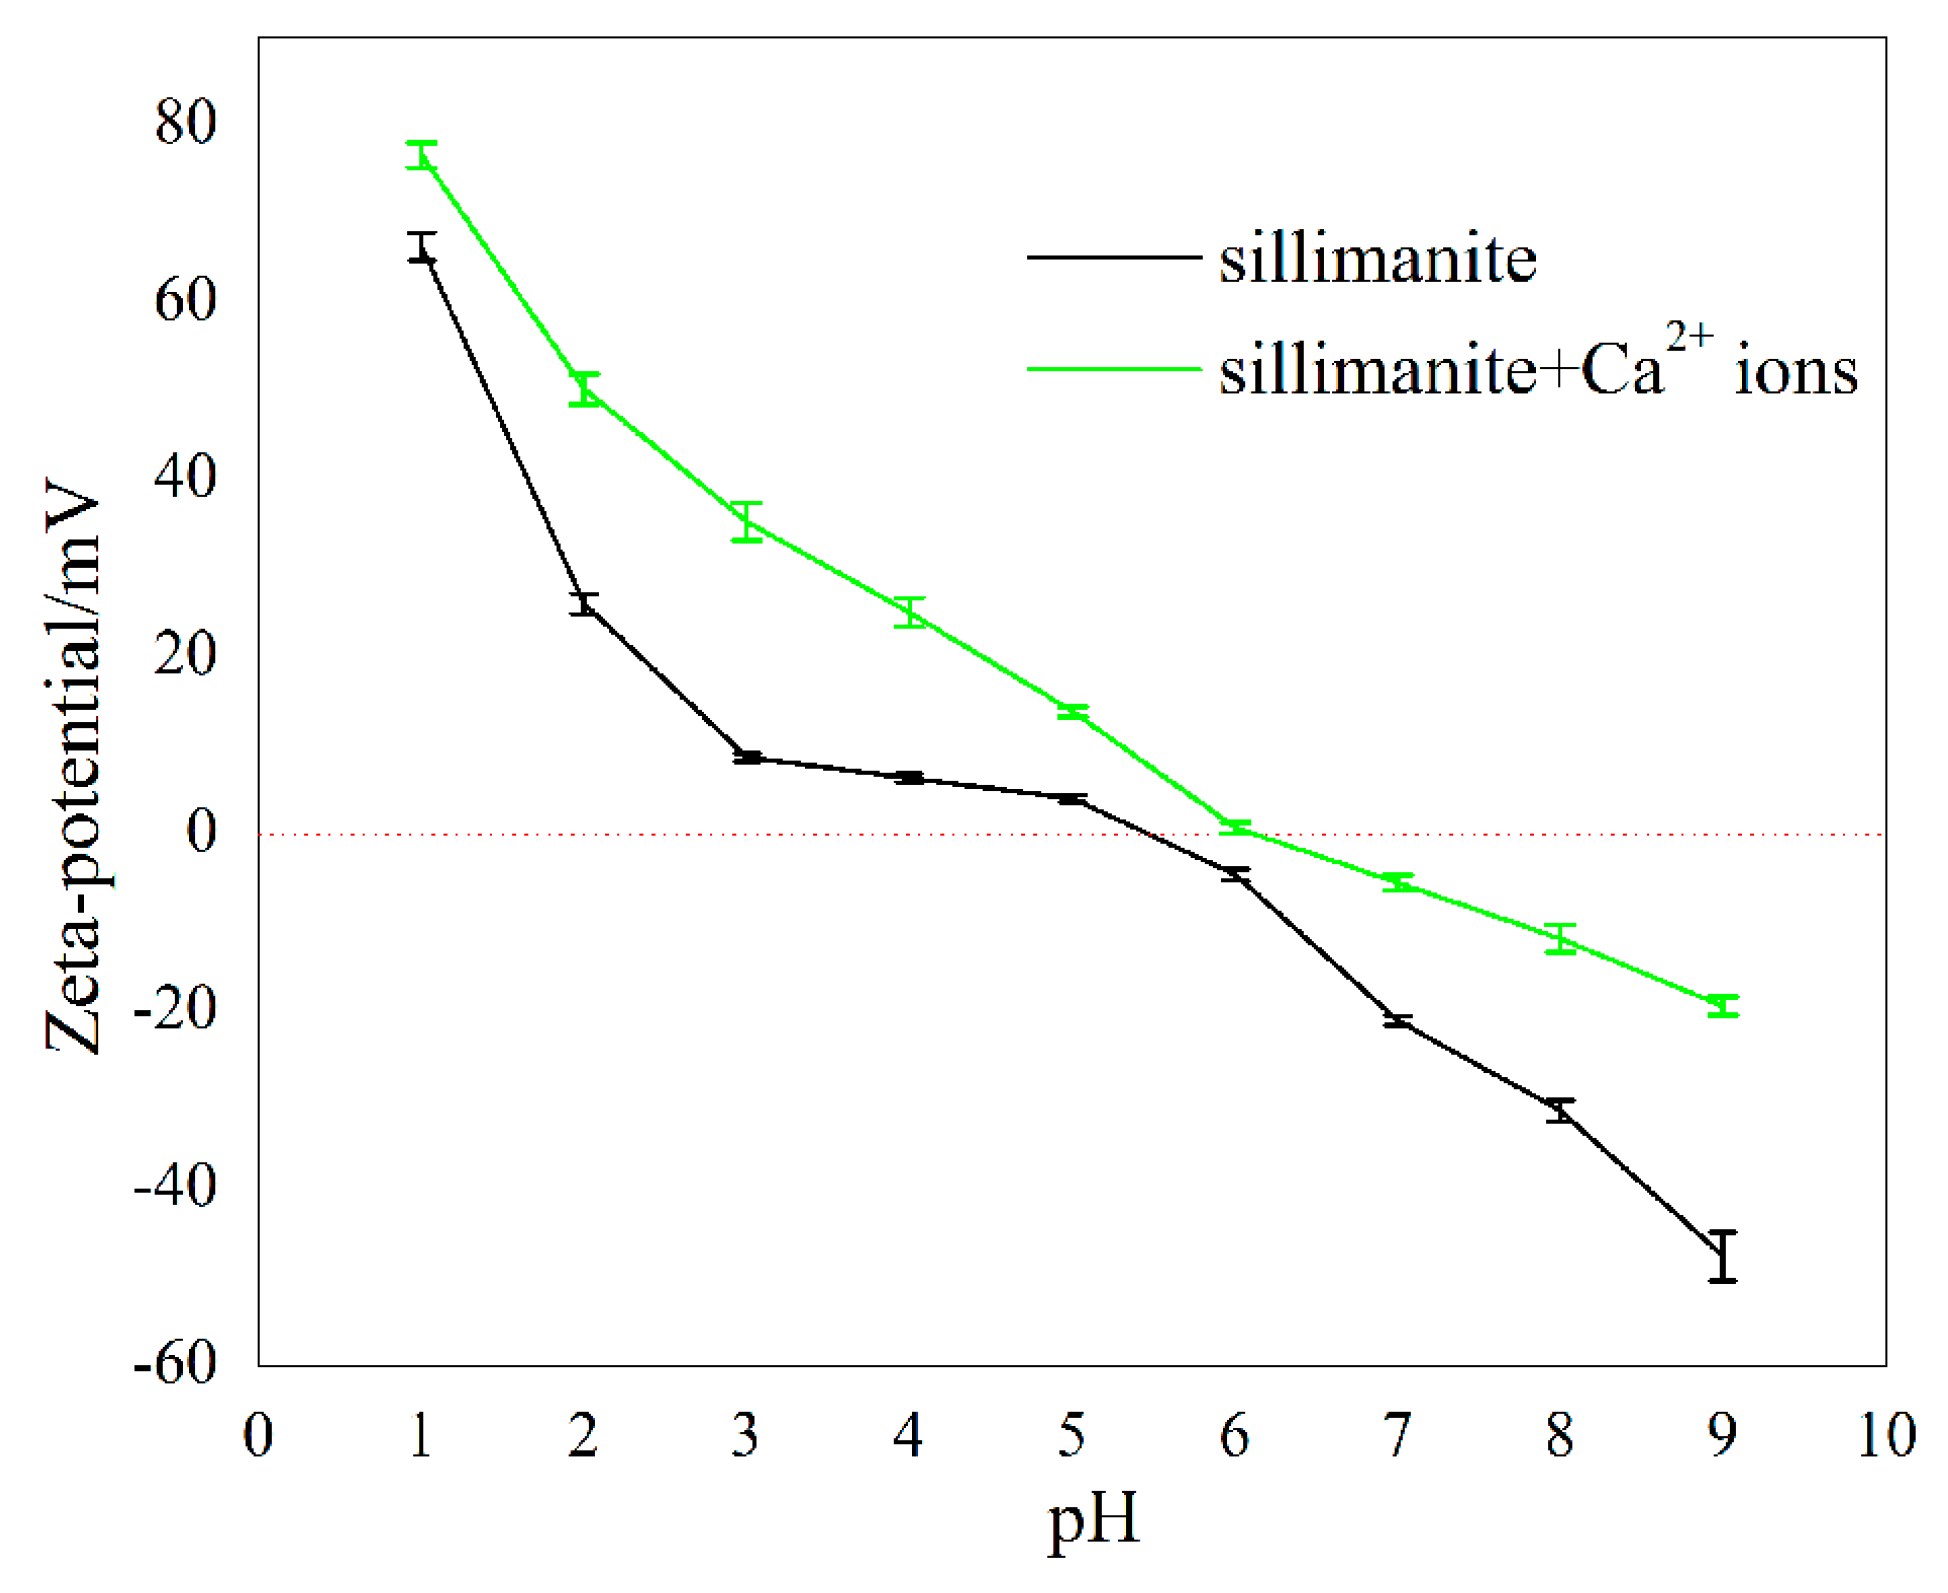
3.2. Zeta Potential Analyses

The zeta potentials of sillimanite as a function of pH in the absence and presence of 1.00 × 10⁻⁴ M Ca2+ ions were measured, and the results are shown in Figure 6. In the absence of Ca2+ ions, the point of zero charge (PZC) of sillimanite occurred at pH 5.4, when pH > 5.4, the charge of the mineral surface switched from positive to negative, and the cationic collector DAC could interact with sillimanite at this pH value. Compared to Figure 5, it can be concluded that the interaction between DAC and sillimanite appear to be governed well by electrostatic interactions in this condition, which agrees with results from other research [10]. In the presence of Ca2+ ions, the PZC of sillimanite showed a slight change, which shifted to 6.1. This behavior of zeta potential suggests that the Ca2+ ions are being adsorbed on the sillimanite surface [6,13,15,35].

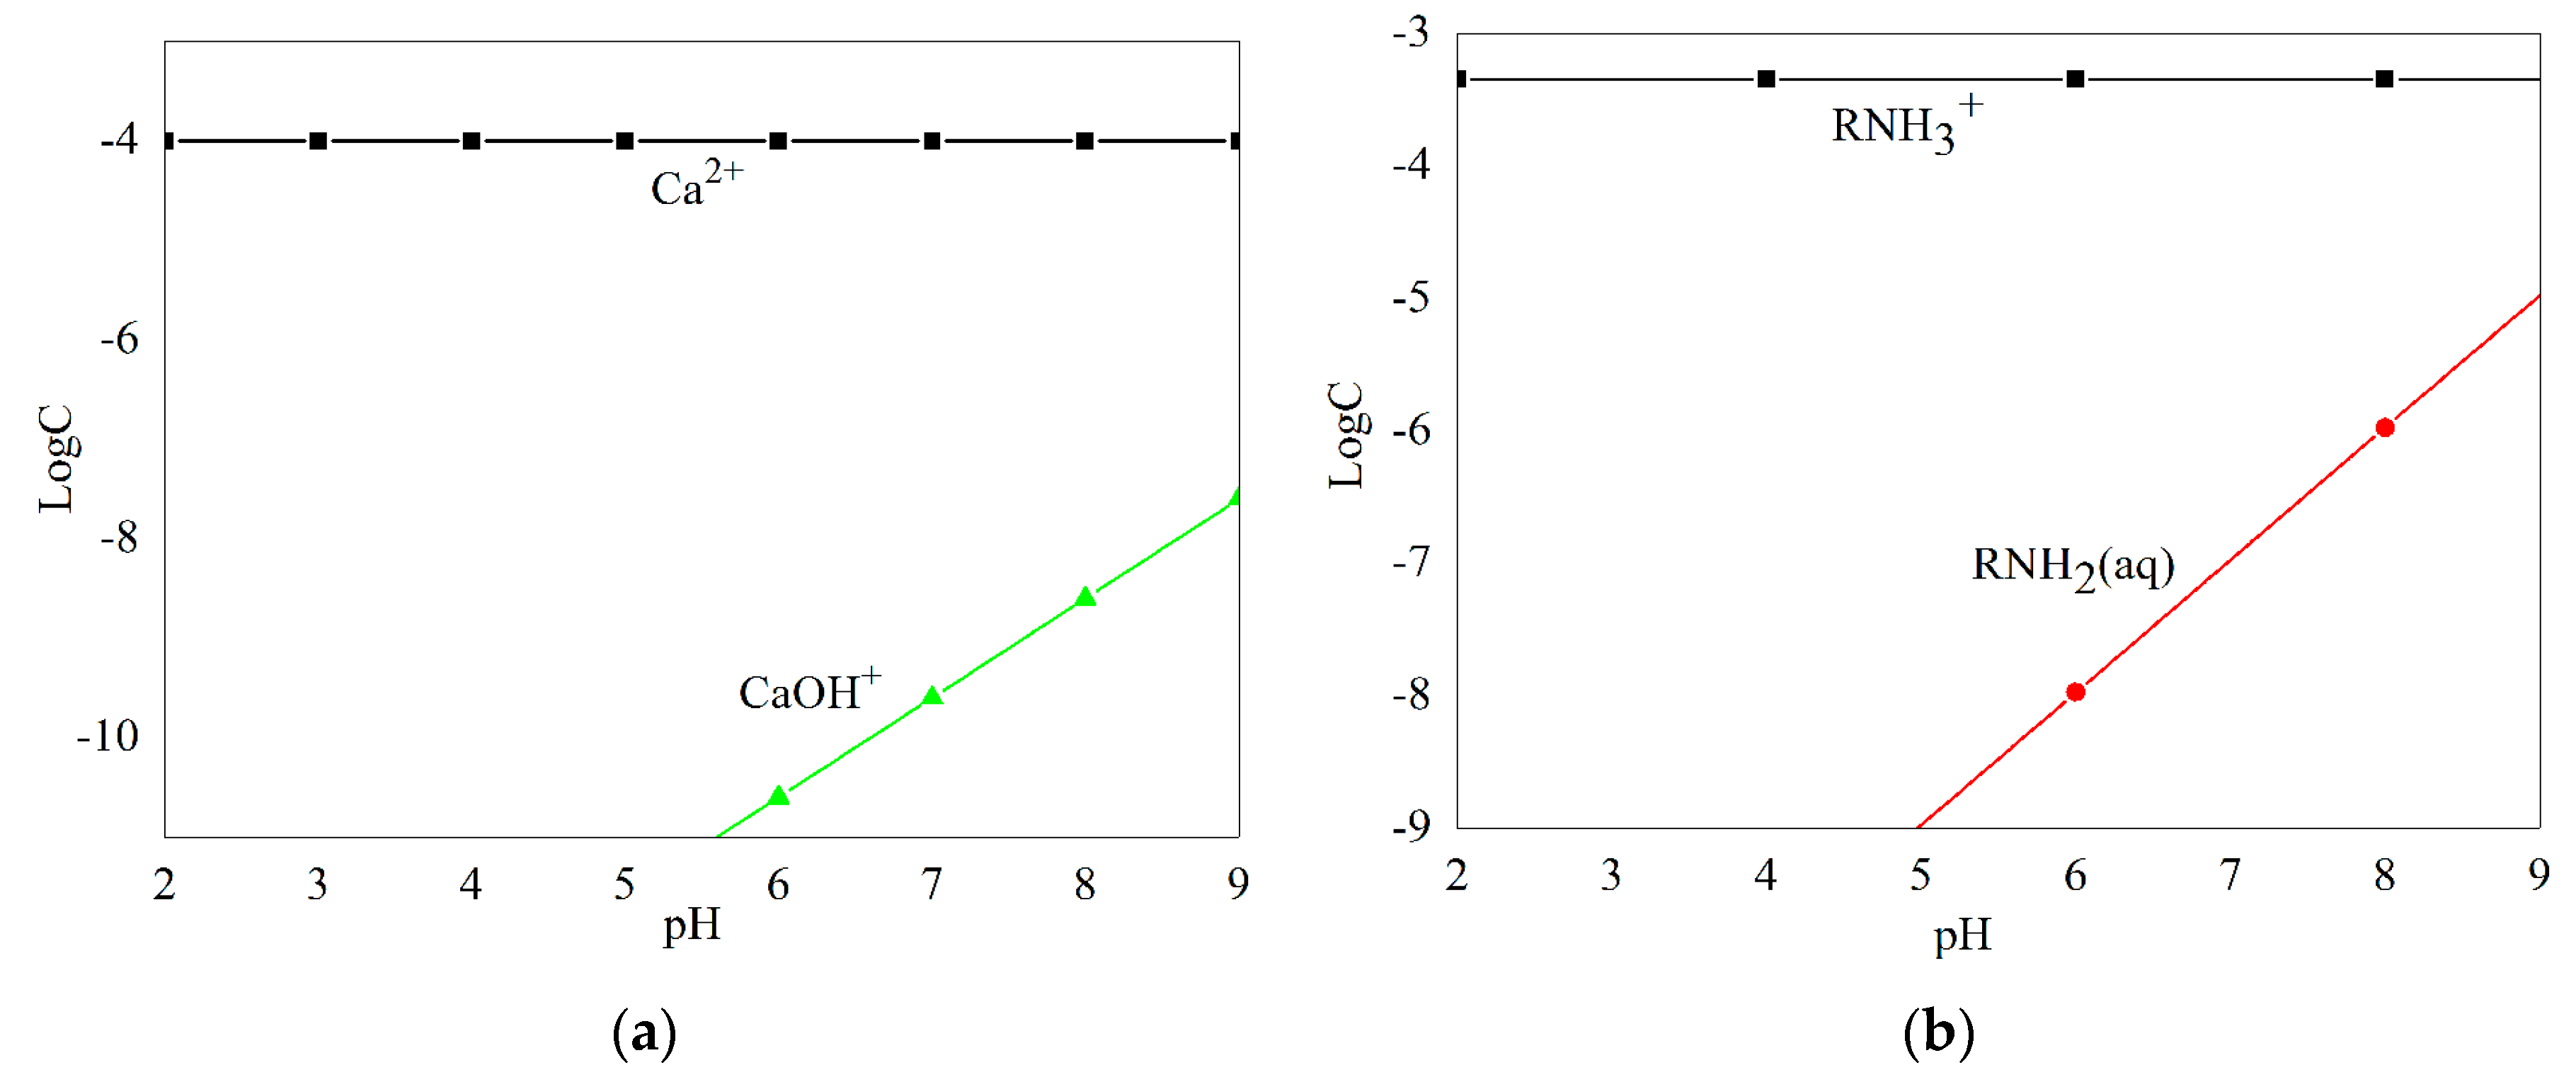
3.3. Solution Chemistry Analyses

Species distribution diagrams of Ca2+ ions (1.0 × 10⁻⁴ M) and DAC (4.50 × 10⁻⁴ M) as a function of pH are shown in Figure 7. Ca2+ ions main exist as free ions throughout the pH range of 2.0–7.0, and the concentration of free ions decreased as pH increased. When pH levels were between 7.0 and 9.0, concentrations of the cation hydrolysis products [CaOH]+ increased obviously, but Ca2+ ions still dominated in this pH range. In the pH range of 2.0–9.0, [CaOH]+ was found in an exceptionally small amount, 1000-fold less than Ca2+ ions, so Ca2+ ions acted as the only component of Ca species in further discussion. DAC existed mainly as RNH3+ ions when pH < 9.3; when the pH was above five, concentrations of RNH2 (aq) increased as the pH increased, but far less than that of RNH3+ ions as pH ≤ 9, hence only RNH3+ ions were considered as a collector component in the present study.
Based on the above analysis, this study found that RNH3+ ions were adsorbed on sillimanite by electrostatic attraction. Under this condition, the Boltzmann factor gives the probability of finding an ions i of charge zi e at a particular point with potential φ, so that the distribution of ions in a potential field can be given by:
Ci = Ci0·exp (−zi·φF/RT)
where Ci is the concentration of i at the point where the potential is φ; Ci0 is the concentration of i at the point where the potential is zero (out in the bulk solution); and zi is the valence of i. F is the Faraday constant; R is the gas constant; and T is the absolute temperature [10,36,37].
As an approximation, the potential of the sillimanite surface can be considered to vary with pH by:
φ = 0.059 (pHPZC − pH)
where pHPZC is the pH value when the sillimanite surface charge is zero [10].
As can be seen in Figure 6, the PZC of sillimanite showed a slight change in the presence of Ca2+ ions, which shifted from 5.4 to 6.1. Concentrations of RNH3+ ions in the sillimanite interface layer in the absence and presence of Ca2+ ions are shown in Table 2, with Ci0 fixed at 4.50 × 10⁻⁴ M.
In the absence of Ca2+ ions, the concentration of RNH3+ ions in the sillimanite interface layer increased as the pH increased, when the pH was above six, the concentration of RNH3+ ions in the sillimanite interface layer was higher than that of the bulk solution, and the recovery of sillimanite increased rapidly in this condition as shown in Figure 5. With the addition of Ca2+ ions, the concentration of RNH3+ ions in the sillimanite interface layer reduced significantly, and the concentration of RNH3+ ions in the sillimanite interface layer was higher than that of the bulk solution when the pH was above seven. These results are coherent with the results of the micro-flotation experiments.

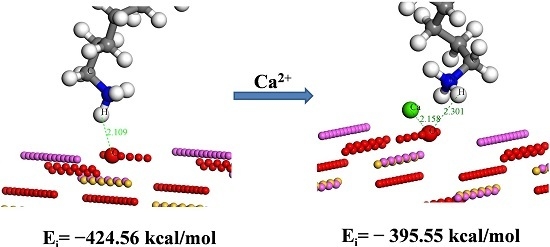
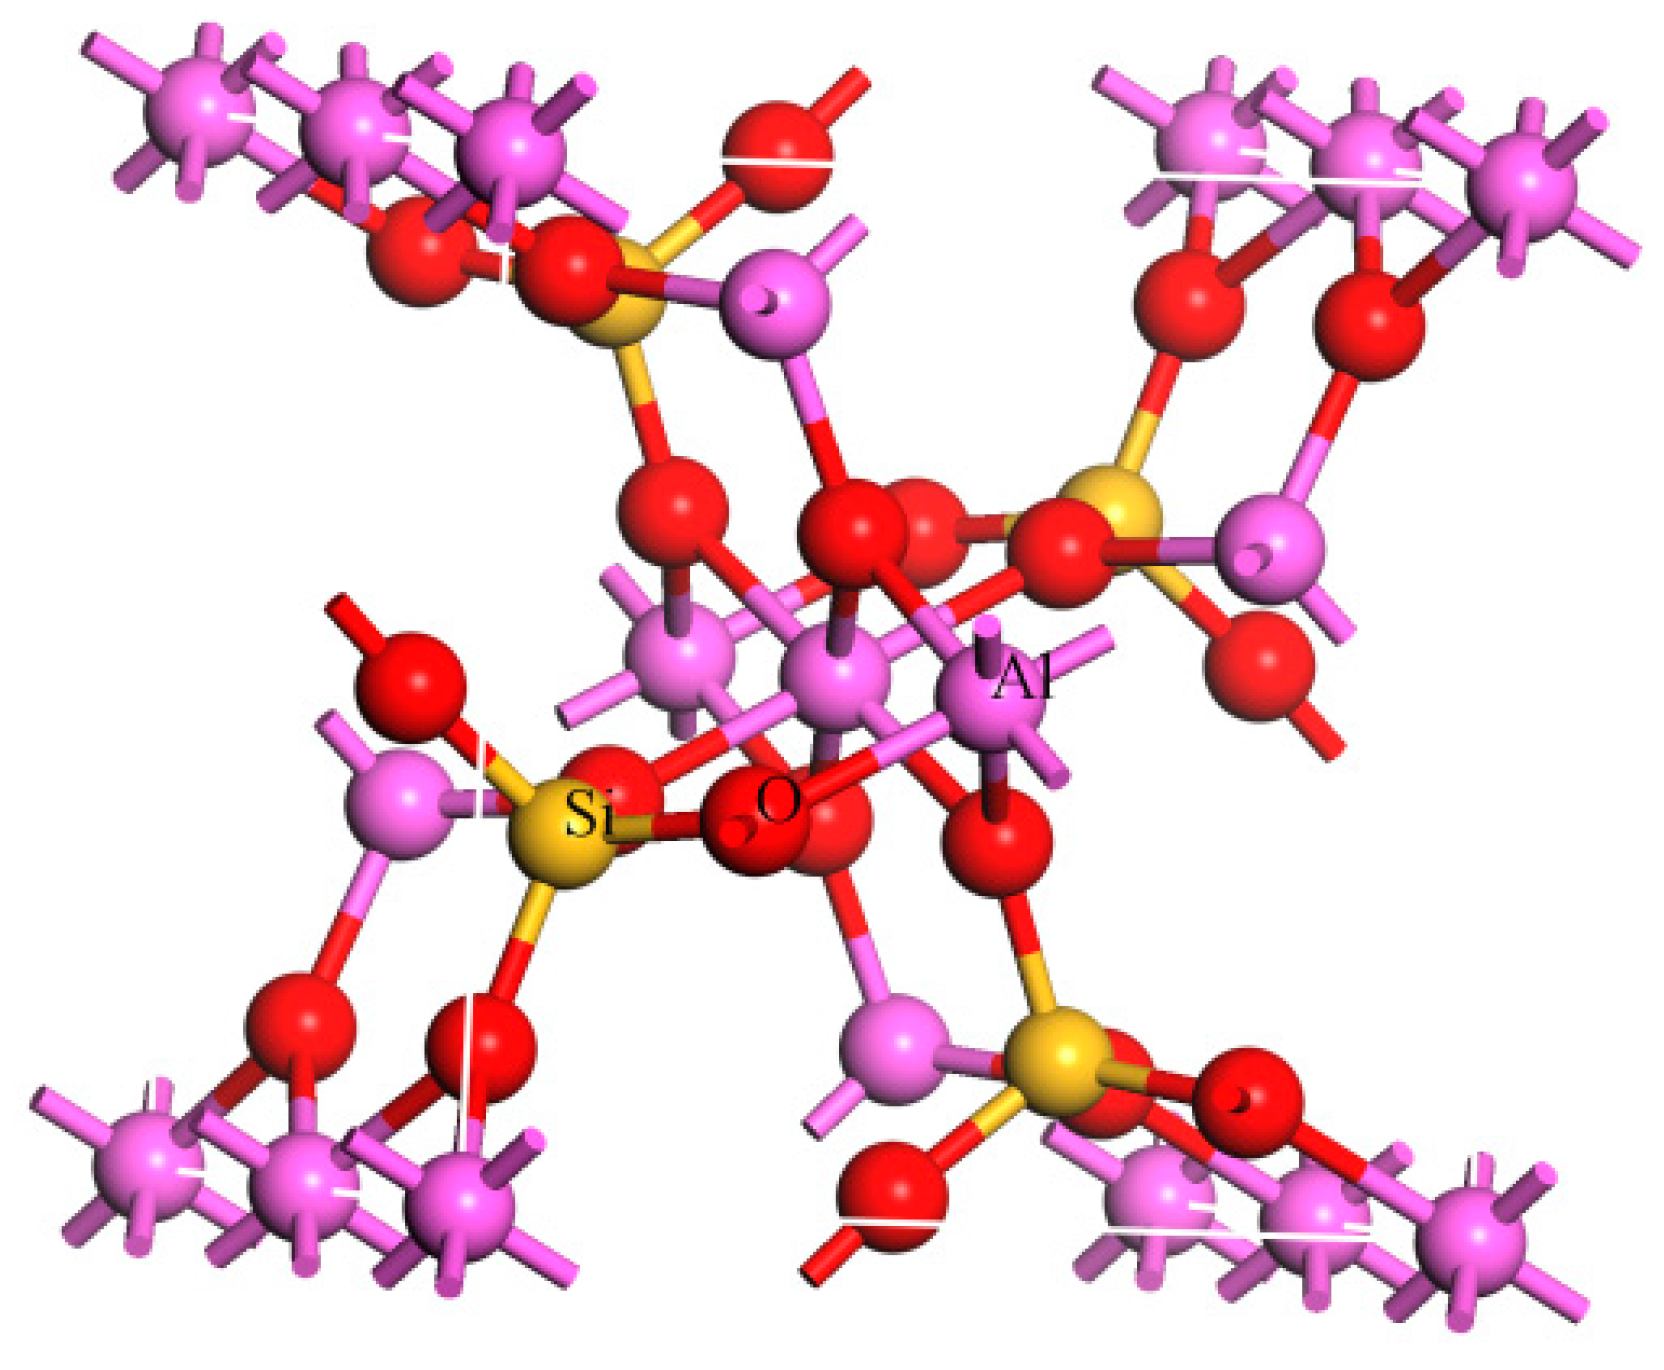
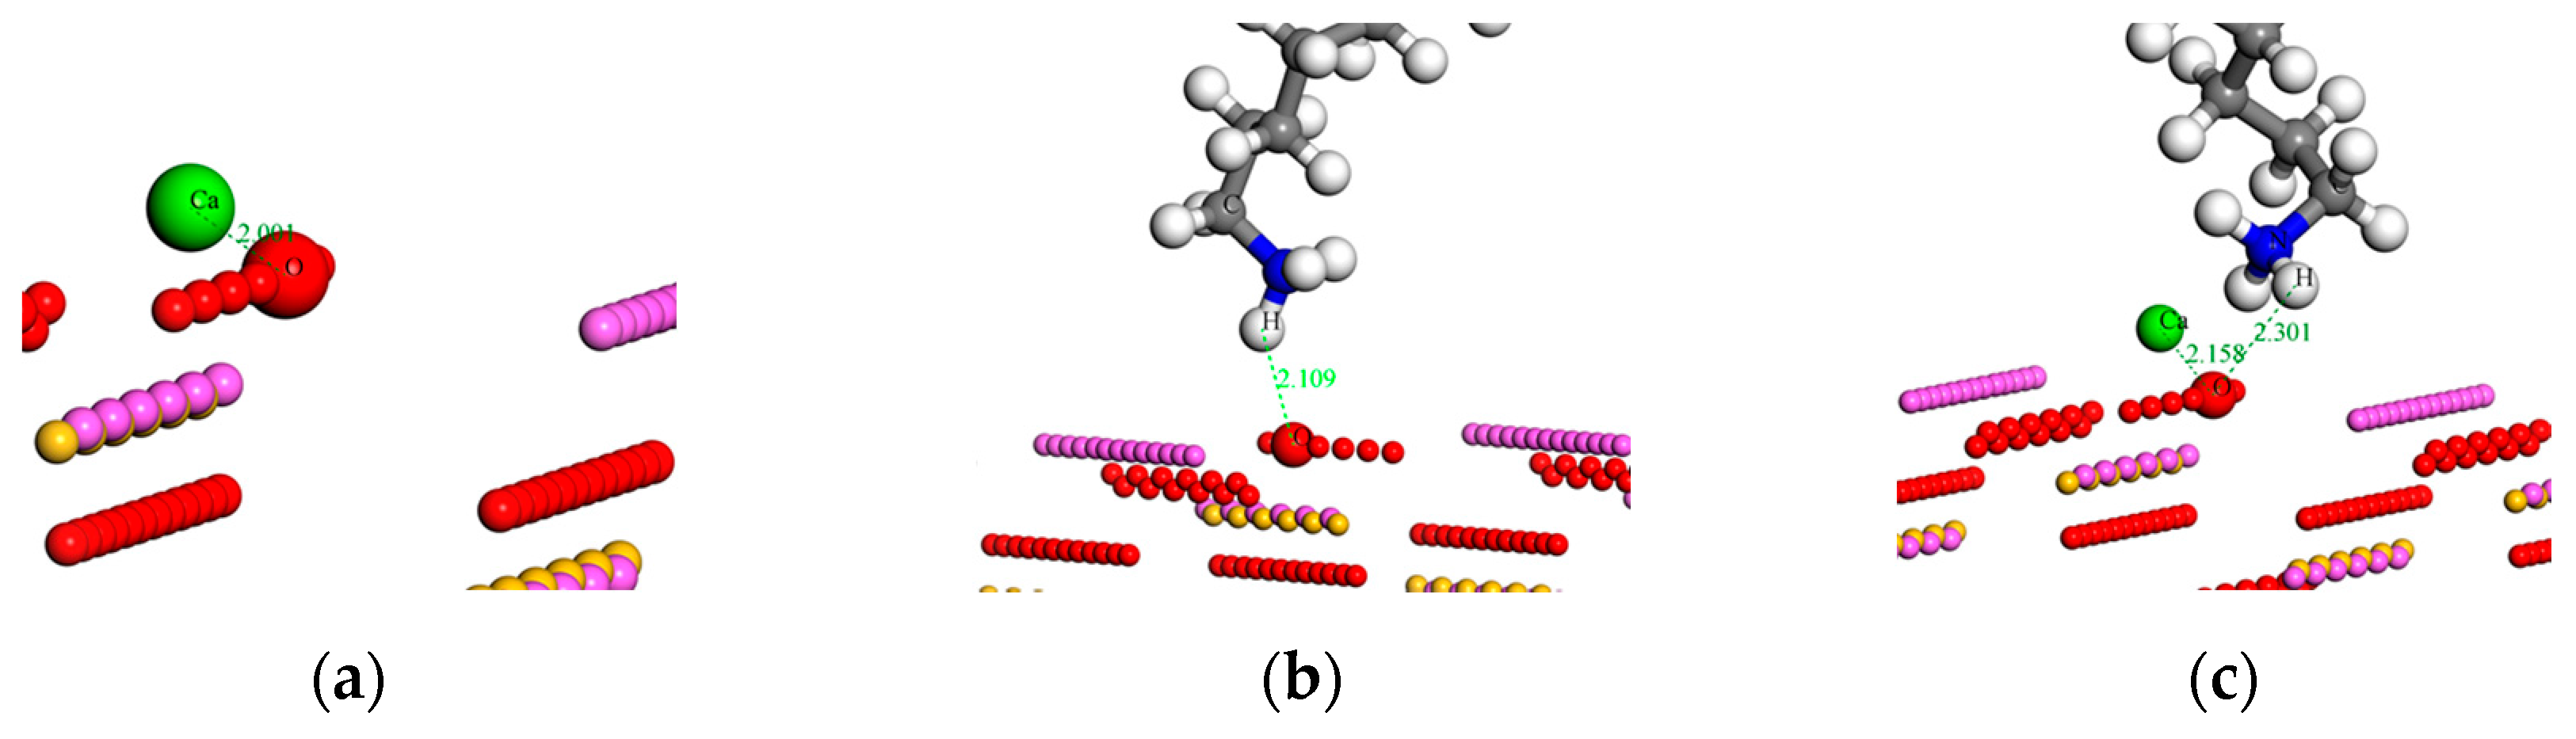
3.4. Molecular Dynamics Calculation Results

Molecular dynamics simulation was performed to study the adsorption mode of adsorbates on the sillimanite surface, and to clarify the inhibition mechanism of Ca2+ ions on sillimanite at the molecular level.
The values of the interaction and binding energies of the adsorbates on the sillimanite (010) surface were calculated according to the Equations (1) and (2), and are listed in Table 3. The binding energy of the water molecule with the sillimanite (010) surface was 189.36 kcal/mol, indicating that the water molecule can adsorb spontaneously on the sillimanite (010) surface, and the Eb (H2O) was lower than that of other adsorbates, suggesting that other adsorbates could replace water on the sillimanite (010) surface [6,29,31,38].
The optimized adsorption configurations are graphically illustrated in Figure 8, with values indicating the atomic distance in angstroms. It clearly shows that the Ca atom was closely bonded with the O atom in both Ca2+ and Ca2+ + RNH3+ (CN) systems (Figure 8a,c), and the interatomic distance was 2.00 Å and 2.16 Å, respectively, indicating that a chemistry bond between the Ca atom and surface O atom in the two systems may form. It is noted, that as the Ca2+ ions mainly interacted with O atoms on the sillimanite (010) surface, the occupancy of cations on the sillimanite (010) surface will rise as a consequence and the surface charge of the sillimanite will increase with the addition of Ca2+ ions, which corroborates with the zeta potential analysis.
The adsorption configurations of N (RNH3+) and CN systems are presented in Figure 8b,c. It is worth noting that the adsorption process of CN system was conducted in two steps: the adsorption of Ca2+ ions on the sillimanite (010) surface was defined as the first step, with the later collector RNH3+ adsorbing on the inhibited sillimanite (010) surface as the second steps. The results in Figure 8b,c indicate that RNH3+ mayinteract with the sillimanite (010) surface through electrostatic attraction in the absence and presence of Ca2+ ions, and the presence of Ca2+ ions decreases the interaction between H in the RNH3+ and O on the sillimanite (010) surface. Therefore, Ca2+ ions and RNH3+ may compete for adsorption on the sillimanite (010) surface through interacting with O atoms.
The binding energy of the sillimanite (010) surface with RNH3+ in the absence and presence of Ca2+ ions was 424.56 kcal/mol and 395.55 kcal/mol, respectively. Since the higher binding energy indicates stronger interactions or stable adsorption [20], this suggests that the combination of the sillimanite (010) surface with RNH3+ is firmer than that with CN. Therefore, it could be found that Ca2+ has an apparent depression on the adsorption of RNH3+ on the sillimanite (010) surface, which is in line with the flotation results.

4. Conclusions

Micro-flotation tests achieved flotation recoveries of sillimanite in the presence of DAC, where the floatability of sillimanite was inhibited by adding Ca2+ ions. The maximum flotation recovery of sillimanite decreased from 87.25% to 30.36% at pH = 9.0 with Ca2+ ions. Zeta potential measurements results illustrated that sillimanite was positively charged below pH = 5.4 in water; however, the mineral became negatively charged at pH range of 6.1–10.0 in the presence of Ca2+ ions. Under these conditions, the concentration of RNH3+ in the sillimanite interface layer was reduced with the addition of Ca2+ ions. The results of MD simulations indicated that NH3+ interacted with the sillimanite (010) surface through electrostatic attraction, that Ca2+ ions possibly adsorbed on the sillimanite (010) surface through chemical interaction, and that the binding energy of RNH3+ with the sillimanite (010) surface decreased in the presence of Ca2+ ions.

Acknowledgments

The authors would like to acknowledge the financial support for this work provided by “the Fundamental Research Funds for the Central Universities (WUT: 2016IVA048)” and Wuhan University of Technology.

Author Contributions

Zijie Ren, Huimin Gao and Fanfei Min conceived the project and designed the experiments; Zhijie Chen conducted a part of experiments and analyzed the data. Jia Lu and Junxun Jin performed a part of experiments. All authors participated in writing the manuscript.

Conflicts of Interest

The authors declare no conflict of interest.

References

  1. Filippov, L.O.; Duverger, A.; Filippova, I.V.; Kasaini, H.; Thiry, J. Selective flotation of silicates and Ca-bearing minerals: The role of non-ionic reagent on cationic flotation. Min. Eng. 2012, 36, 314–323. [Google Scholar] [CrossRef]
  2. Murty, C.; Murthy, Ch.V.R.; JaiSankar, N.; Manjeera, P.B.; Kumar, P. Operation and optimization of sillimanite beneficiation from beach sands. Int. J. Intell. Inf. Technol. 2013, 1, 347–355. [Google Scholar]
  3. Murthy, V.A.N. Beneficiation of sillimanite by flotation. Int. J. Intell. Inf. Technol. 2013, 1, 24–28. [Google Scholar]
  4. Prabhakar, S.; Bhaskar Raju, G.; Subba Rao, S. Beneficiation of sillimanite by column flotation—A pilot scale study. Int. J. Min. Process. 2006, 81, 159–165. [Google Scholar] [CrossRef]
  5. Laxmia, T.; Raob, R.B. Upgradation of sillimanite by using advanced air cyclone classifier. Turk. J. Eng. 2013, 3, 46–52. [Google Scholar]
  6. Jin, J.; Gao, H.; Chen, X.; Peng, Y.; Min, F. The flotation of aluminosilicate polymorphic minerals with anionic and cationic collectors. Min. Eng. 2016, 99, 123–132. [Google Scholar] [CrossRef]
  7. Prabhakar, S.; Hanumantha Rao, K.; Forsling, W. Dissolution of wollastonite and its flotation and surface interactions with tallow-1,3-diaminopropane (duomeen T). Min. Eng. 2005, 18, 691–700. [Google Scholar] [CrossRef]
  8. You, C.; Zeng, X. The research of sillimanite flotation collection selection. J. Wuhan Univ. Technol. 1990, 3, 52–58. [Google Scholar]
  9. Demir, C.; Bentli, I.; Gülgönül, I.; Çelik, M.S. Effects of bivalent salts on the flotation separation of Na-feldspar from K-feldspar. Miner. Eng. 2003, 16, 551–554. [Google Scholar] [CrossRef]
  10. Fuerstenaua, D.W. Zeta potentials in the flotation of oxide and silicate minerals. Adv. Colloid Interface Sci. 2005, 114, 9–26. [Google Scholar] [CrossRef]
  11. Yu, F.; Wang, Y.; Wang, J.; Xie, Z. Investigation on different behavior and mechanism of Ca (II) and Fe (III) adsorption on spodumene surface. Phys. Probl. Min. Process. 2014, 50, 535–550. [Google Scholar]
  12. Yu, F.; Wang, Y.; Wang, J.; Xie, Z.; Zhang, L. First-principle investigation on mechanism of Ca ion activating flotation of spodumene. Rare Met. 2014, 33, 358–362. [Google Scholar] [CrossRef]
  13. Liu, W.; Zhang, S.; Wang, W.; Zhang, J.; Yan, W.; Deng, J.; Feng, Q.; Huang, Y. The effects of Ca (II) and Mg (II) ions on the flotation of spodumene using NaOL. Miner. Eng. 2015, 79, 40–46. [Google Scholar] [CrossRef]
  14. Li, Y.; Lei, D.; Xu, S. Effect of metal ions in pulp on flotation separation of sillimanite from quartz. J. Chin. Ceram. Soc. 2002, 30, 362–364. [Google Scholar]
  15. Lu, J.; Gao, H.; Jin, J.; Cen, D.; Ren, Z. Effect and mechanism of calcium ion on flotation of andalusite. Chin. J. Nonferr. Met. 2016, 26, 1311–1315. [Google Scholar]
  16. El-Salmawy, M.S.; Nakahiro, Y.; Wakamatsu, T. The role of alkaline earth cations in flotation separation of quartz from feldspar. Miner. Eng. 1993, 6, 1231–1243. [Google Scholar] [CrossRef]
  17. Burdukova, E.; Van Leerdam, G.C.; Prins, F.E.; Smeink, R.G.; Bradshaw, D.J.; Laskowski, J.S. Effect of calcium ions on the adsorption of CMC onto the basal planes of New York talc—A ToF-SIMS study. Miner. Eng. 2008, 21, 1020–1025. [Google Scholar] [CrossRef]
  18. Han, Y.; Liu, W.; Chen, J. DFT simulation of the adsorption of sodium silicate species on kaolinite surfaces. Appl. Surf. Sci. 2016, 370, 403–409. [Google Scholar] [CrossRef]
  19. Demichelis, R.; Civalleri, B.; D’Arco, P.; Dovesi, R. Performance of 12 DFT functionals in the study of crystal systems: Al2SiO5 orthosilicates and Al hydroxides as a case study. Int. J. Quantum Chem. 2010, 110, 2260–2273. [Google Scholar] [CrossRef]
  20. Jiang, Y.; Li, X. The theoretical study on the efficiencies of 2-[tris(hyroxycarbamoyl) methyl] carboxylic acids as chelating agents in flotation separation of diaspore and aluminosilicates. Sep. Purif. Technol. 2013, 104, 114–120. [Google Scholar] [CrossRef]
  21. Gocmez, H. The interaction of organic dispersant with alumina: A molecular modelling approach. Ceram. Int. 2006, 32, 521–525. [Google Scholar] [CrossRef]
  22. Qiang, L.; Li, Z.; Zhao, T.; Zhong, S.; Wang, H.; Cui, X. Atomic-scale interactions of the interface between chitosan and Fe3O4. Colloids Surf. A 2013, 419, 125–132. [Google Scholar] [CrossRef]
  23. Guide, C.U. Force Field-Based Simulations; Molecular Simulations Inc.: San Diego, CA, USA, 1997. [Google Scholar]
  24. Ji, Y.; Wang, F.; Duan, L.; Zhang, F.; Gong, X. Effect of temperature on the adsorption of sulfanilamide onto aluminum oxide and its molecular dynamics simulations. Appl. Surf. Sci. 2013, 285, 403–408. [Google Scholar] [CrossRef]
  25. Bu, H.; Cao, M.; Gao, Y.; Huang, H. Synergic effect of sodium oleate (NaOL) and benzohydroxamic acid (BHA) on flotation of wolframite. Phys. Probl. Min. Process. 2017, 53, 82–93. [Google Scholar]
  26. Rai, B.; Sathish, P.; Tanwar, J.; Moon, K.S.; Fuerstenau, D.W. A molecular dynamics study of the interaction of oleate and dodecylammonium chloride surfactants with complex aluminosilicate minerals. J. Colloid Interface Sci. 2011, 362, 510–516. [Google Scholar] [CrossRef] [PubMed]
  27. Prathab, B.; Subramanian, V.; Aminabhavi, T.M. Molecular dynamics simulations to investigate polymer-polymer and polymer-metal oxide interactions. Polymer 2007, 48, 409–416. [Google Scholar] [CrossRef]
  28. Mi, H.; Xiao, G.; Chen, X. Theoretical evaluation of corrosion inhibition performance of three antipyrine compounds. Comput. Theor. Chem. 2015, 1072, 7–14. [Google Scholar] [CrossRef]
  29. Pradip; Rai, B. Molecular modeling and rational design of flotation reagents. Int. J. Miner. Process. 2003, 72, 95–110. [Google Scholar] [CrossRef]
  30. Hu, Y.; Gao, Z.; Sun, W.; Liu, X. Anisotropic surface energies and adsorption behaviors of scheelite crystal. Colloids Surf. A 2012, 415, 439–448. [Google Scholar] [CrossRef]
  31. Pradip; Rai, B.; Rao, T.K.; Krishnamurthy, S.; Vetrivel, R.; Mielczarski, J.; Cases, J.M. Molecular modeling of interactions of diphosphonic acid based surfactants with calcium minerals. Langmuir 2002, 18, 932–940. [Google Scholar] [CrossRef]
  32. Xu, Y.; Liu, Y.; Liu, G. Molecular dynamics simulation of primary ammonium ions with different alkyl chains on the muscovite (001) surface. Int. J. Miner. Process. 2015, 145, 48–56. [Google Scholar] [CrossRef]
  33. Zhang, H.; Lu, X.; Leng, Y.; Watari, F.; Weng, J.; Feng, B.; Qu, S. Effects of aqueous environment and surface defects on Arg-Gly-Asp peptide adsorption on titanium oxide surfaces investigated by molecular dynamics simulation. J. Biomed. Mater. Res. 2011, 96, 466–476. [Google Scholar] [CrossRef] [PubMed]
  34. Xu, L.; Wu, H.; Dong, F.; Wang, L.; Wang, Z.; Xiao, J. Flotation and adsorption of mixed cationic/anionic collectors on muscovite mica. Miner. Eng. 2013, 41, 41–45. [Google Scholar] [CrossRef]
  35. Jin, J.; Gao, H.; Ren, Z.; Chen, Z. The flotation of kyanite and sillimanite with sodium oleate as the collector. Minerals 2016, 6, 90. [Google Scholar] [CrossRef]
  36. Sun, C.; Yin, W. Flotation Principles of Silicate Minerals; Science Press: Beijing, China, 2001; pp. 216–223. [Google Scholar]
  37. Wang, B.; Peng, Y. The effect of saline water on mineral flotation—A critical review. Miner. Eng. 2014, 66, 13–24. [Google Scholar] [CrossRef]
  38. Zhu, Y.; Luo, B.; Sun, C.; Liu, J.; Sun, H.; Li, Y.; Han, Y. Density functional theory study of α-Bromolauric acid adsorption on the α-quartz (101) surface. Miner. Eng. 2016, 92, 72–77. [Google Scholar] [CrossRef]
Figure 1. Bulk lattice structure of sillimanite (Atom color: pink = Al, red = O, yellow = Si).
Minerals 07 00028 g001
Figure 2. X-ray diffractometer (XRD) spectra of the sillimanite sample.
Minerals 07 00028 g002
Figure 3. The flotation recovery of sillimanite as a function of dodecylammonium chloride (DAC) concentration at pH = 7.0.
Minerals 07 00028 g003
Figure 4. The flotation recovery of sillimanite as a function of Ca2+ ions concentration with 4.50 × 10⁻⁴ M, DAC at pH = 7.0.
Minerals 07 00028 g004
Figure 5. The flotation recovery of sillimanite as a function of pH with 4.50 × 10⁻⁴ M DAC.
Minerals 07 00028 g005
Figure 6. Zeta potentials of sillimanite mineral as a function of pH in the absence and presence of Ca2+ ions.
Minerals 07 00028 g006
Figure 7. Species distribution diagrams of 1.00 × 10⁻⁴ M Ca2+ ions (a) and 4.50 × 10⁻⁴ M DAC (b) as a function of pH.
Minerals 07 00028 g007
Figure 8. Optimized adsorption configurations of: (a) Ca2+; (b) RNH3+ (N); and (c) Ca2+ + RNH3+ (CN) on the sillimanite (010) surface (atom color: green = Ca, white = H, gray = C, blue = N).
Minerals 07 00028 g008
Table 1. The chemical composition of the sillimanite sample.
CompositionSiO2Al2O3CaOFe2O3TiO2K2OZrO2Cr2O3V2O5MoO3Ignition Loss
Content (%)38.0959.850.080.270.130.020.590.070.140.080.68
Table 2. The concentration of RNH3+ in the sillimanite interface layer in the absence and presence of Ca2+ ions. Ci and Ci’ are the concentrations of RNH3+ ions in the sillimanite interface layer without and with Ca2+ ions, respectively.
pH23456789
Ci (M)1.82 × 10−71.81 × 10−61.80 × 10−51.79 × 10−41.79 × 10−31.78 × 10−21.77 × 10−11.76
Ci/Ci04.04 × 10−44.02 × 10−34.01 × 10−23.99 × 10−13.9739.52393.413916.12
Ci’ (M)3.65 × 10−83.63 × 10−73.62 × 10−63.60 × 10−53.58 × 10−43.57 × 10−33.55 × 10−23.54 × 10−1
Ci’/Ci08.11 × 10−58.07 × 10−48.04 × 10−38.00 × 10−27.96 × 10−17.9378.92785.61
Table 3. The interaction and binding energies between adsorbates and the sillimanite (010) surface.
AdsorbateH2OCa2+RNH3+ (N)Ca2+ + RNH3+ (CN)
Ei (kcal/mol)−189.36−489.68−424.56−395.55

