
Pore Structure Characterization of Shale Using Gas Physisorption: Effect of Chemical Compositions
by
 ,
,
Yosep Han
1 ,
,
Daewoong Kwak
1,
Siyoung Q. Choi
2,
Changhoon Shin
3,
Youngsoo Lee
1,* and
Hyunjung Kim
1,* 1
Department of Mineral Resources and Energy Engineering, Chonbuk National University, 567, Baekje-daero, Deokjin-gu, Jeonju, Jeonbuk 54896, Korea
2
Department of Chemical and Biomolecular Engineering, KAIST, Daejeon 305-701, Korea
3
Gas Resource Technology Center, Korea Gas Corporation, 1248 Suin-ro, Sangnok-Gu, Ansan-si, Kyounggi-do 15328, Korea
*
Authors to whom correspondence should be addressed.
Minerals 2017, 7(5), 66; https://doi.org/10.3390/min7050066
Submission received: 8 March 2017
/
Revised: 5 April 2017
/
Accepted: 24 April 2017
/
Published: 28 April 2017
Abstract
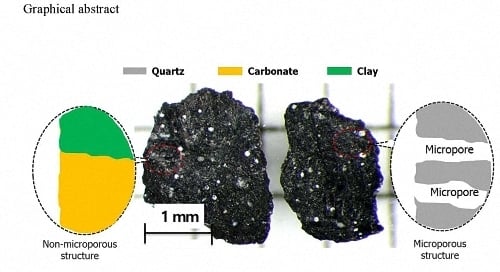
:In this study, the pore structure characteristics of Canadian Horn River basin shales with various chemical compositions were evaluated using gas physisorption analyses. The samples used in this research were obtained from two different regions (shallow and deep regions) of rock cuttings during the drilling of the shale gas field located in Horn River basin. The pore size, specific surface area, total pore volume, micropore surface area, and micropore volume of the shale samples were measured using both nitrogen and CO2. The results indicated that the pore size was not a function of chemical composition, while distinct trends were observed for other macroscopic and microscopic pore-related properties. In particular, the greatest specific surface area and total pore volume were observed for silica-rich carbonate shales, while clay-rich siliceous shales exhibited the greatest micropore volume and micropore surface area. The trends clearly suggested that macroscopic and microscopic pore-related properties of the Canadian Horn River basin shales were closely related to their chemical composition. Furthermore, a stronger correlation was observed between the quartz content and the micropore-related physical properties of shales (i.e., the micropore surface area and micropore volume) in comparison to other properties.
1. Introduction
With an increasing natural gas consumption worldwide, and in the face of challenges involved in finding massive conventional gas resources, novel and unconventional gas resources have been actively explored. As a representative unconventional gas resource, the shale gas resources of the world are known to be abundant. More recently, the amount of gas production from shale gas has increased in Canada, the USA, and other countries, owing to the advancements in cutting-edge technologies including horizontal drilling and multi-stage hydraulic fracturing [1]. Nevertheless, the porous shale medium that stores hydrocarbon has complicated and anisotropic geological structures.
Accordingly, the condition of this gas significantly varies depending on the region [2,3,4]. Thus, the same evaluation criteria for estimating the gas in a given place can hardly be applied to a variety of regions in different countries, indicating that it is difficult to provide information about the gas found in each territory. The international considerations for effectively using shale gas include its successful supply and economic feasibility. Moreover, understanding of the storage and flow mechanism of shale gas is essential in optimizing the development plan and subsequent economic production of gas.
Shale usually has a wide range of pore size distribution [5]; therefore, various methods are required for evaluation [6,7]. The pore structure in the matrix of shale gas reservoirs is considerably complicated. Furthermore, the total matrix porosity mainly comprises nanopore distributions [6,7,8,9,10,11]. In particular, considerable amount of shale gas is adsorbed onto the nanosize pore surface, where organic matter and clay are present [10,11,12,13,14]. To estimate the shale gas in place, the total organic carbon (TOC) and clay contents [15] as well as the nanosize pore size distribution must be accurately evaluated. Thus, appropriate methods for analyzing and interpreting the shale’s pore size distribution are required.
Considerable effort has been made to analyze the pore structure of shales and interpret the correlation of the results with methane (CH4) adsorption to shales. For instance, Yuan et al. [16] used pore size distribution data determined by N2 isotherm for CH4 adsorption and diffusion in shale. The parameters for the evaluation of CH4 adsorption and diffusion were the size and moisture content of shale samples. Yang et al. [13] investigated the pore structures of shale samples from a fractal basis. They found that micropores had a larger fractal dimension than mesopores and macropores. Additionally, the shale samples with better fractal dimensions exhibited a larger amount of CH4 adsorption.
Ji et al. [12] conducted methane adsorption tests using clay-rich shales and reported that montmorillonite showed greater CH4 adsorption than other clay-rich shales due to an abundant presence of micro-mesopores, which provided extensive Brunauer–Emmett–Teller (BET) surface area. Ross and Bustin [10] reported the correlation between the shale’s composition and pore structure and the corresponding CH4 adsorption amount. Greater CH4 adsorption was observed in shale with a higher TOC content, while the BET surface area or micropore volume had no correlation with the amount of CH4 adsorption into the shale. Moreover, the total porosity of quartz-rich shale was lower than that of clay-rich shale due to the tight-rock characteristics.
Considering these outcomes, the amount of CH4 gas in shale seems to be affected by the pore structure of the shale. Conversely, the pore structure values (e.g., BET surface area and micropore-mesopore volume) would function as critical values for estimating the amount of CH4 gas in place. Since the pore structure of shale changes with the mineral composition of the shale, systematic studies regarding the correlation between the chemical composition and the pore structure of shale are required. In this study, therefore, the chemical composition and the micropore and mesopore size distribution of Canadian shales with different sampling depths were analyzed. The pore size distribution was evaluated using a gas (nitrogen and carbon dioxide) physisorption method. Furthermore, the correlations of pore structure and chemical composition are provided.
2. Materials and Methods
2.1. Shale Sample and Preparation
The samples used in this study were obtained from rock cuttings during drilling of the shale gas field located in Horn River basin, Canada. Twenty-four samples were obtained from depths of 2300 m to 2500 m, which was also divided into two depth regions (shallow region: 2325 m to 2380 m underground, and deep region: 2405 m to 2470 m underground). The entire depth region was separated into eight sub-regions using a depth interval of 5 m for each sub-region. Table 1 and Table 2 provide the depth index that represents the lowest depth value of each section. More detailed information of Horn River basin and the stratigraphic column on each shale sample can be found elsewhere [14,17]. Three representative samples were chosen from each sub-region to increase the reliability of the results. Total organic carbon values were determined by subtracting total inorganic carbon (IC) from total carbon values (TC); TOC = TC − IC. A TOC analyzer manufactured by Shimadzu TOC-VCPH (Shimadzu, Tokyo, Japan) was used to analyze 50 mg samples.
2.2. X-ray Diffraction (XRD) Analysis
For XRD analysis, the shale samples were dried at 50 °C for 5 h after being milled to a fine particle size, and random grain mounts were prepared and analyzed. XRD patterns were recorded with a Bruker D8 HRXRD X-ray diffractometer (Bruker, Karlsruhe, Germany) using Ni-filtered Cu Kα radiation at 40 kV and 40 mV, as well as a scan rate of 1°/min with a step size of 0.01° in 10°–80° 2-theta. The mineralogy was quantified by Rietveld refinement analyses using the TOPAS 3 program [18,19].
2.3. Low-Pressure N2 and CO2 Isotherm Analysis
Low pressure gas physisorption analyses using both nitrogen (N2) and carbon dioxide (CO2) gases were used to measure the pore size distribution between the pore sizes of 0.35 and 150 nm and describe the pore space of organic, microporous shales, as average pore size distributions are in the nanometer scale, into which gas can effectively penetrate. Between 1 and 2 g of cutting samples (size < 1 mm) prepared for gas physisorption analysis were first outgassed for a minimum of 4 days in a vacuum oven [7]. N2 adsorption-desorption isotherms were collected at 77 K using a Micromeritics 3Flex. The total pore volume was determined from the amount of N2 adsorbed at a relative pressure, P/P0, of 0.99; where P is the gas vapor pressure in the system and P0 is the vapor pressure at the temperature of interest. The meso-macropore size distributions (2.0–150 nm) were analyzed from adsorption data in the partial relative pressure range of 0.3–0.99 using the Barrett–Joyner–Halenda (BJH) method [20,21]. The specific surface area was assessed from N2 adsorption data in the partial relative pressure range of 0.05–0.30 using the BET method [22,23] based on the following equation:
where W is the weight of the nitrogen gas at relative pressure P0/P, Wm is the weight of the monolayer adsorbent (nitrogen), and C is the BET constant which relates to the sorption energy between the adsorbent and adsorbate.
Carbon dioxide (CO2) adsorption data (273 K) were also collected on the same apparatus. For mircropore analysis, CO2 adsorption isotherms were measured over a relative pressure range of 4.5 × 10⁻⁵−3.2 × 10⁻² at 273 K and monolayer capacities were determined using the Dubinin–Radushkevich (D–R) equation [24]:
where V is the volume of the sorbed gas at equilibrium pressure (cm3/g, Standard Temperature and Pressure, STP), V0 is the total micropore volume (cm3/g, STP), S is a constant, P is pressure and P0 is saturation vapor pressure. The lower limit of micropore depends on the kinetic diameter of the probing gas molecule, such as 0.35 nm for CO2. Micropore volumes (pore size < 2.0 nm) were measured by the volume of adsorbed CO2 (which completely fills the micropores), expressed in terms of bulk liquid at atmospheric pressure and 273 K [24,25]. As discussed by Dubinin and Stoeckli [26], the theory of volume filling of micropores is a rational basis for the description of microporous structures in carbonaceous materials. The measurements for N2 and CO2 isotherms were repeated the times for each shale sample at the same sampling depth.
3. Results and Discussion
3.1. Mineralogy and Shale Lithofacies
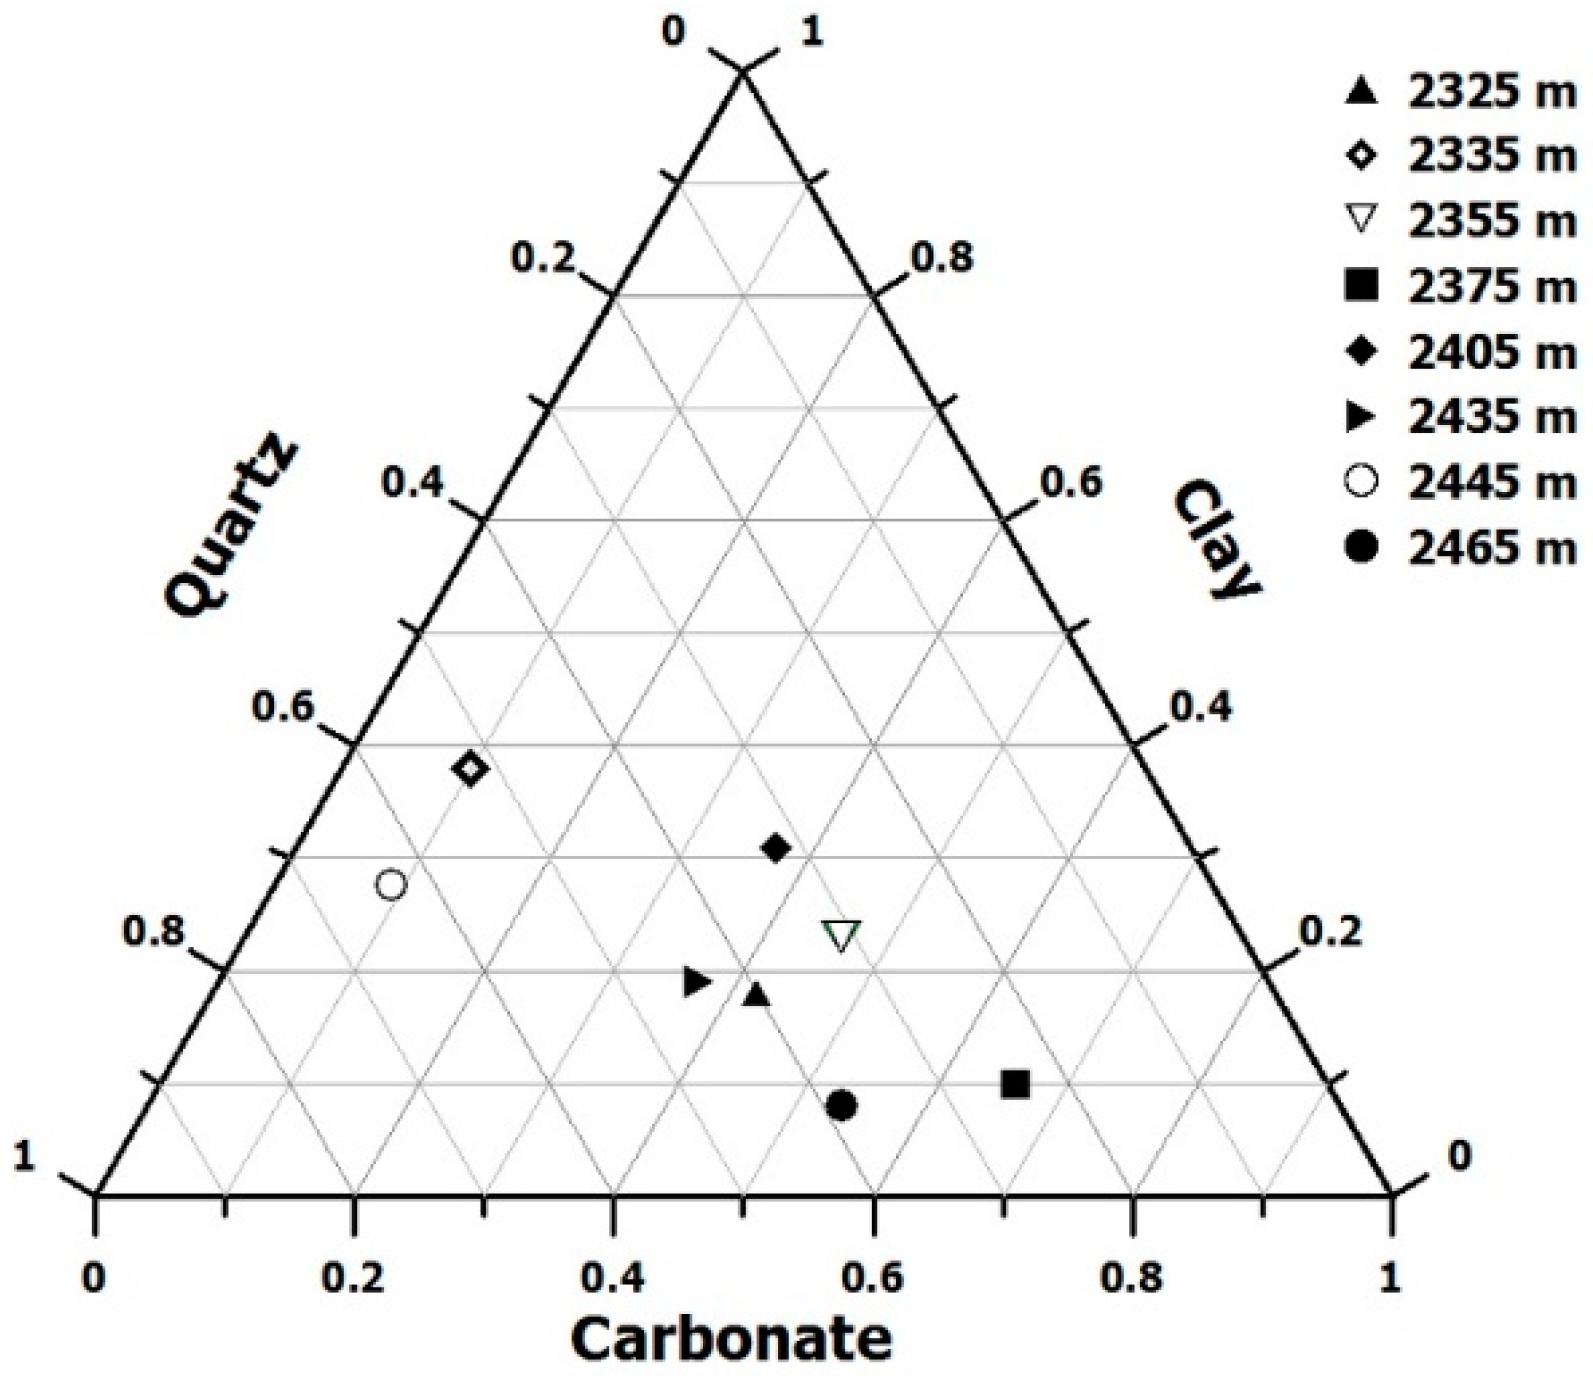
The chemical composition of eight representative samples corresponding to each sub-region is summarized in Table 1. All the samples include comparatively high levels of quartz, calcite, dolomite, and illite contents. To increase the reliability of the results regarding the changes in the pore structure dependent on chemical composition, two shales having a similar chemical composition to each other were grouped from two different depth regions (shallow versus deep). Note that four major chemical compositions (i.e., quartz dominated shale, carbonaceous shale, clay dominated shale, and mixed shale) were eventually selected based on the information of the sCore Lithofacies Classification [27]. Specifically, the Horn River basin can be divided into three groups: Muskwa, Otter Park, and Evie formation [28]. Evie and Otter Park were known to be mainly composed of deep to marginal tropical shales and shallow tropical carbonates, while Muskwa consisted of deep to marginal tropical shales. Their ternary diagram based on the weight percent of minerals (Table 1) is also shown in Figure 1.
As shown in Figure 1, two shale samples classified as the same category have a similar chemical composition but are from different depths. In the shale samples obtained from 2375 m and 2465 m underground, the quartz level was less than 40%, and carbonate was the primary component (50–80%). The sample classification and lithofacies of this study are shown in Table 2. In this study, all samples were categorized into four groups (i.e., four different chemical compositions) based on a 50 m or more difference in the sampling depth (i.e., shallow versus deep) (see Figure 1 and Table 2).
3.2. Pore Characteristics of the Shale with Chemical Composition
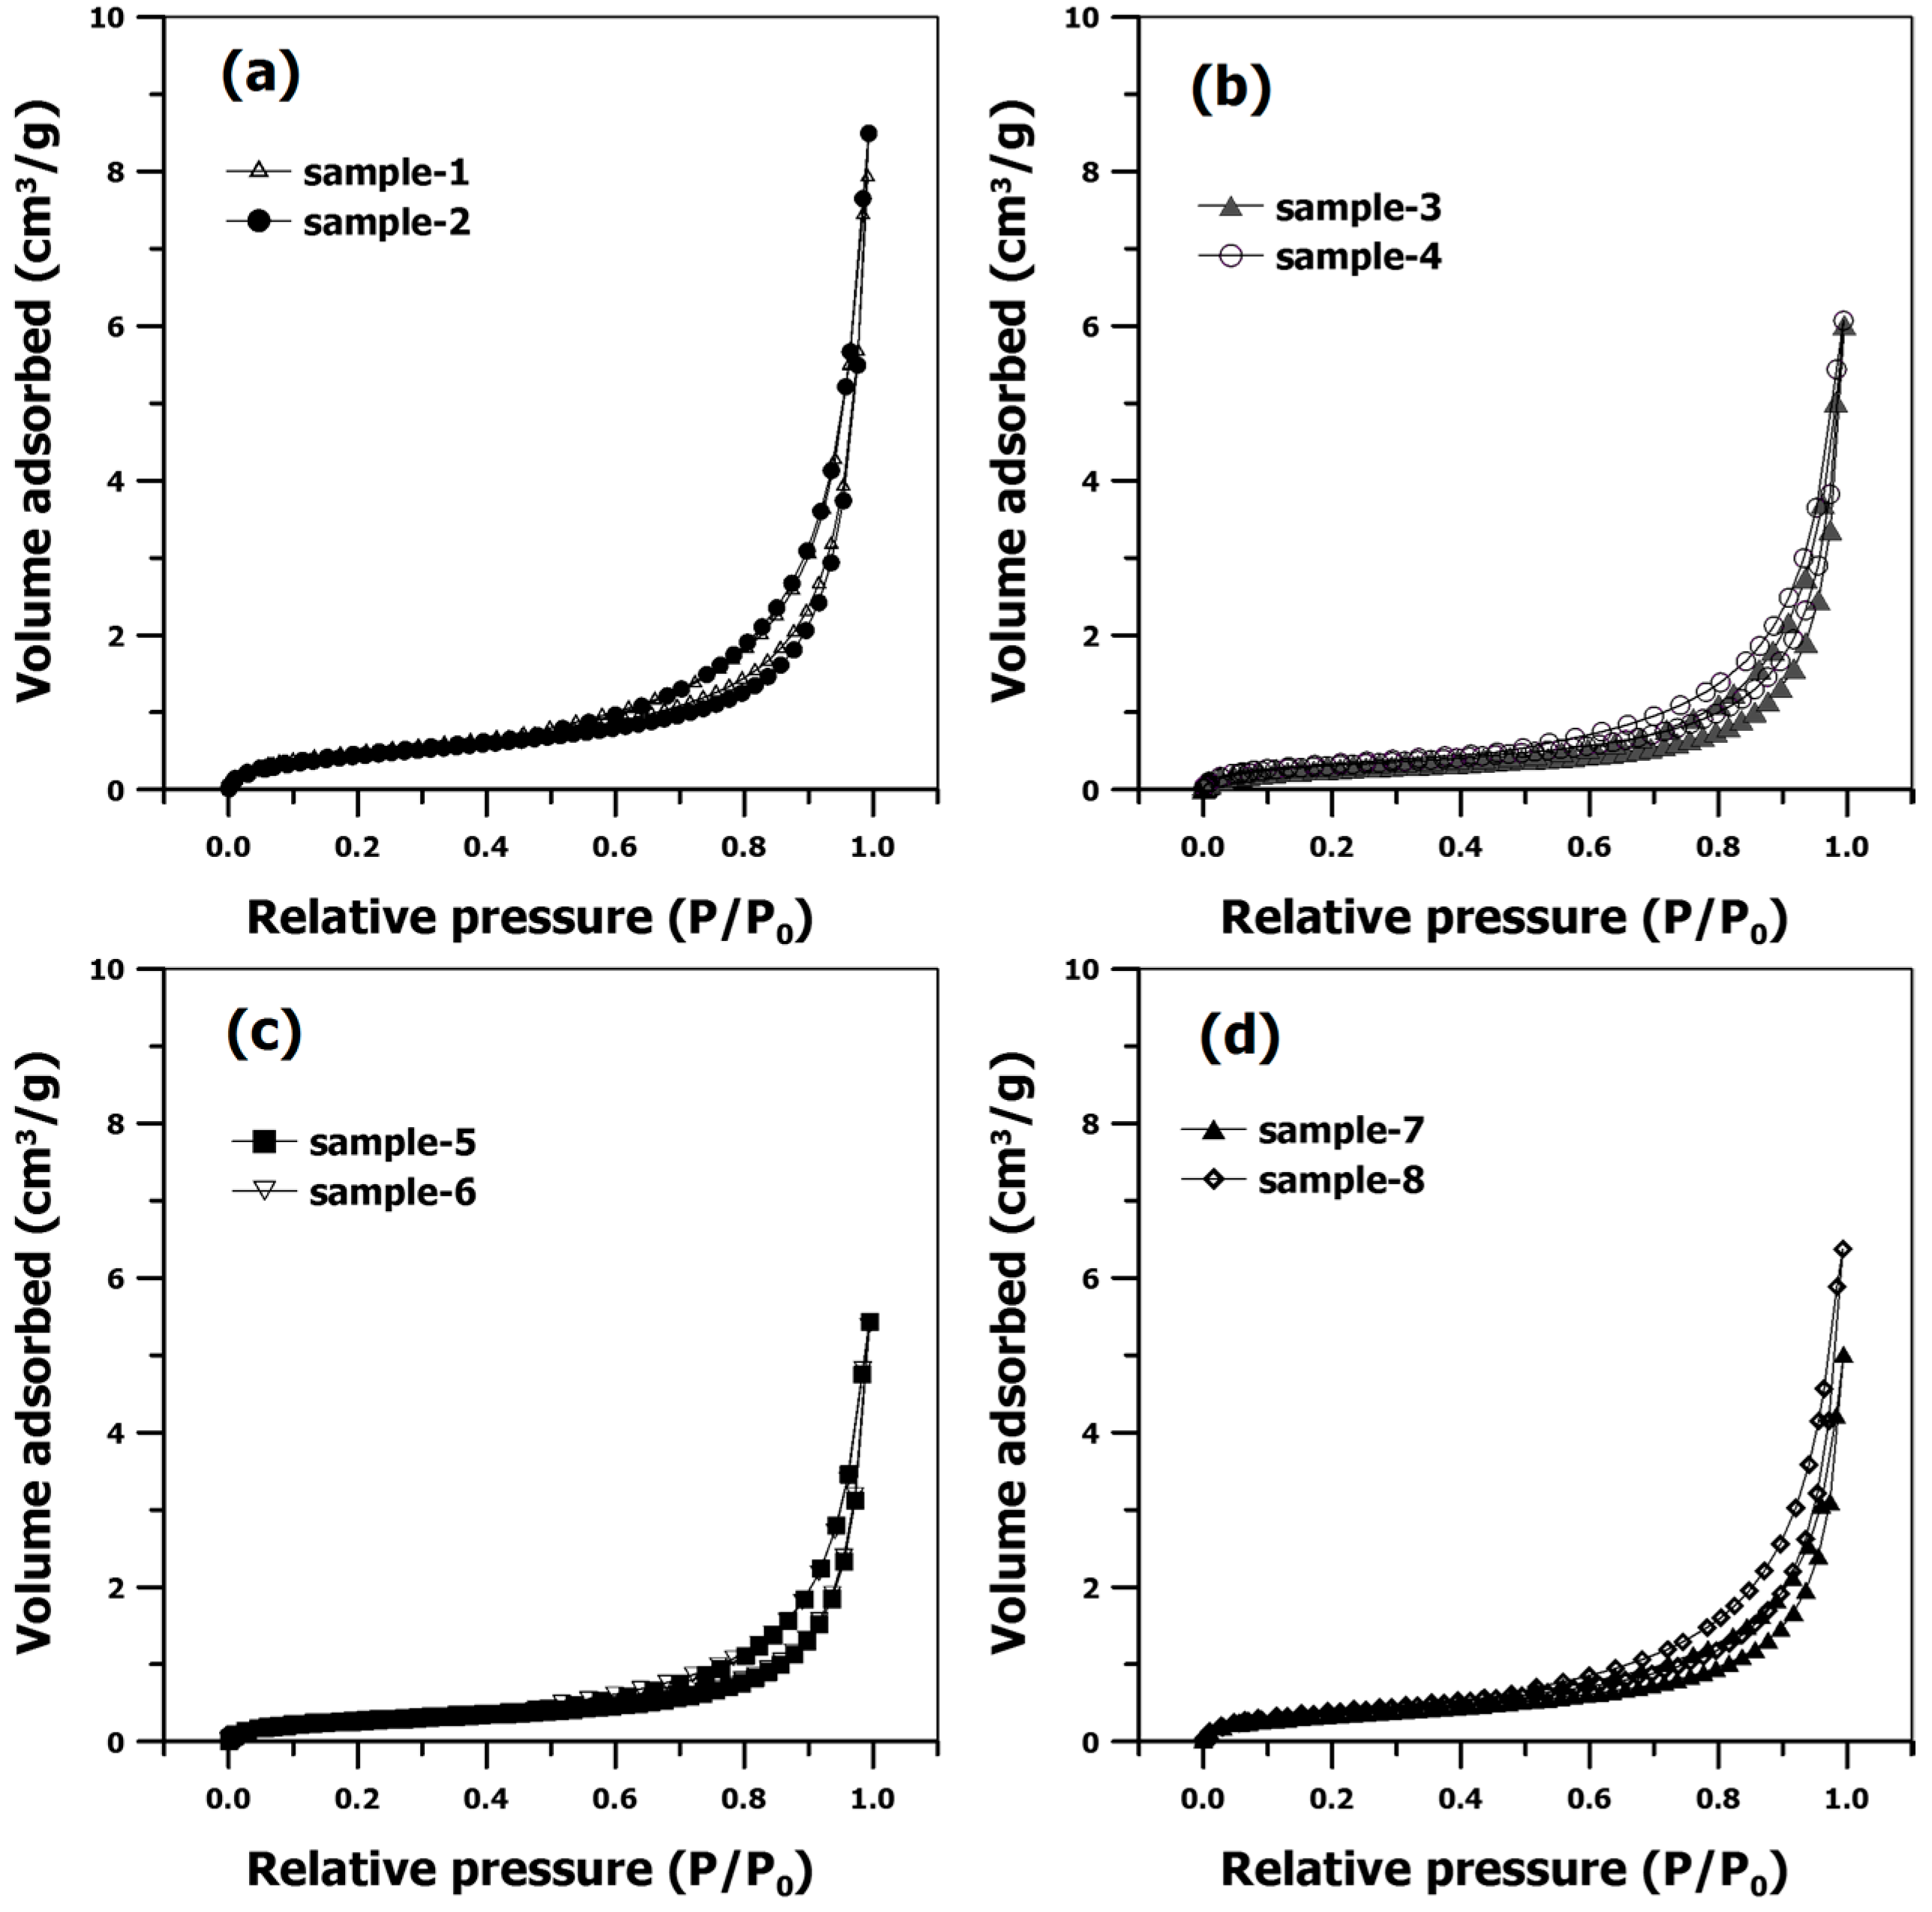
Figure 2 shows the adsorption-desorption isotherm curves for every sample, which were observed as isotherm type II [6,24]. In all the shale samples, a complete monolayer adsorption was observed up to the relative pressure level of approximately 0.1 before a multi-layer adsorption was initiated [24]. Therefore, a multi-layer adsorption occurred on the shale surface, and the meso-macropore-level pores were found to be slit-shaped [24]. The hysteresis loop of all the shale samples was confirmed as H3 (hysteresis loop type 3). Thus, the meso-macropore size distribution was determined using the desorption branch based on the BJH model [24].
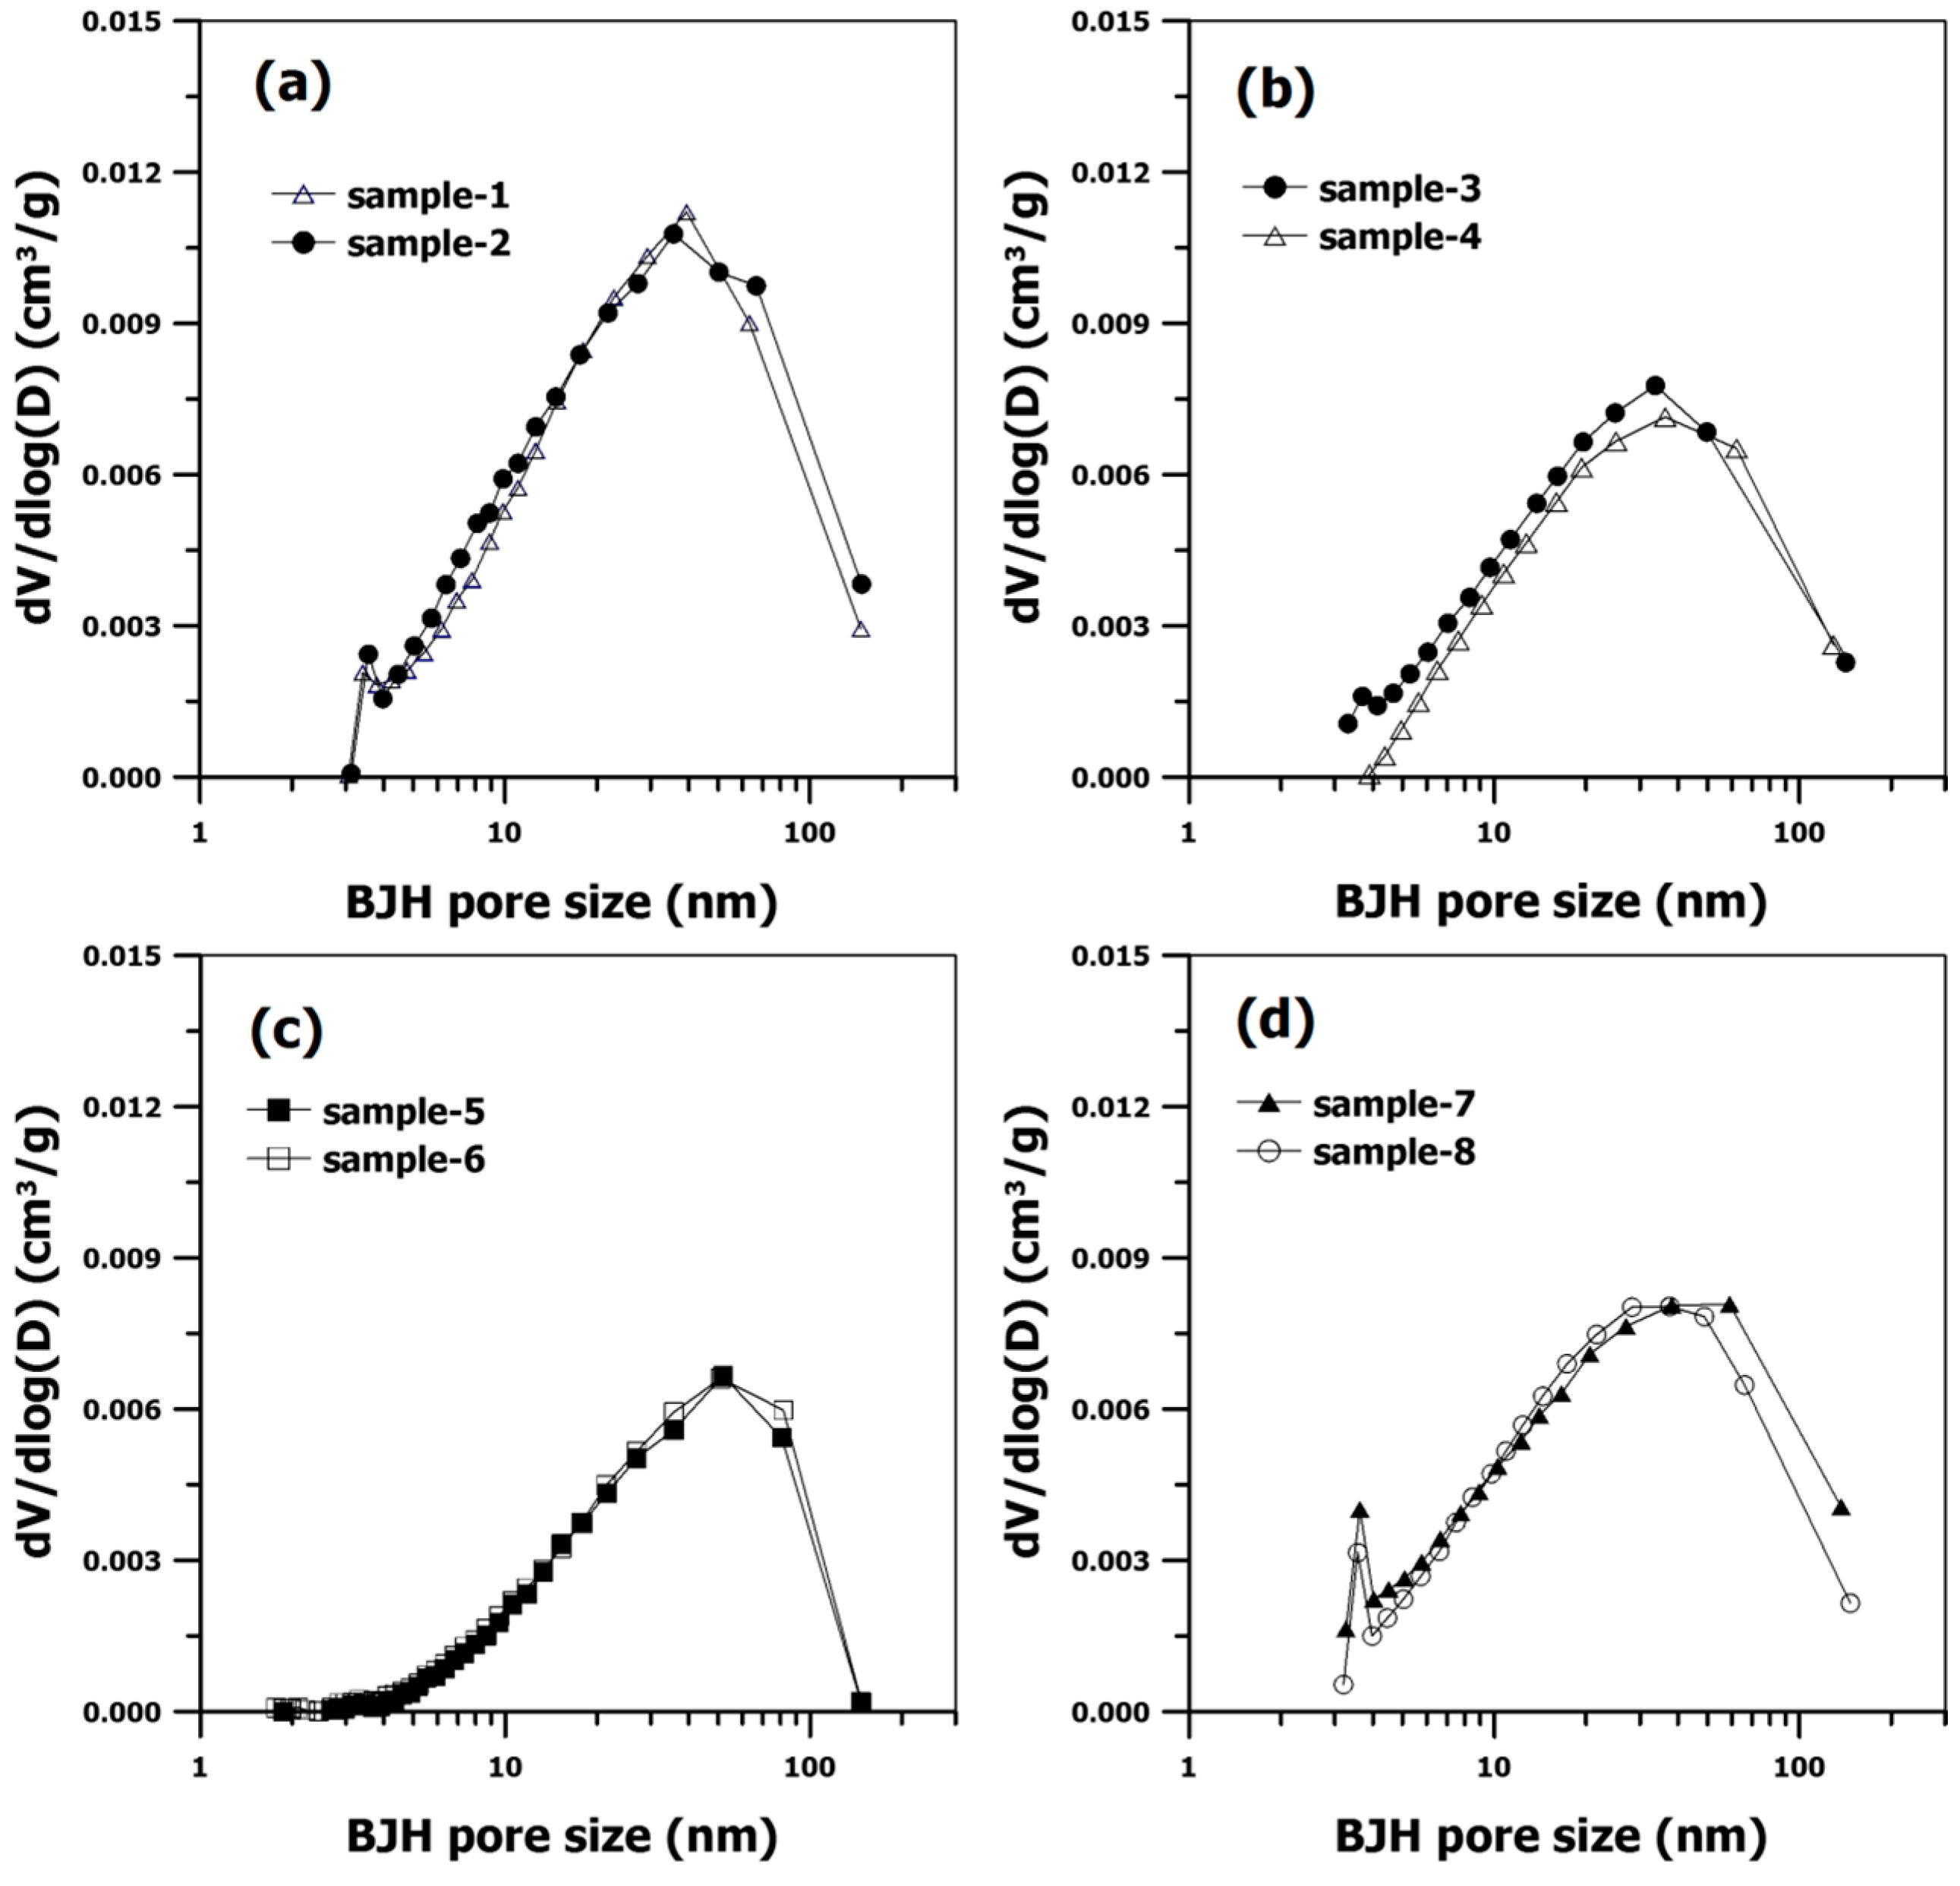
Figure 3 shows the distribution of the meso-macropore pore size for all the samples. The shale samples that had four different chemical compositions exhibited slightly different curve shapes. Nevertheless, their mean pore size ranged from 18 nm to 25 nm without significant difference (see Table 2). This indicated that the chemical composition did not influence the meso-macropore size distribution, regardless of the sampling depth. However, a distinct trend in the specific surface area and the total pore volume was observed among the samples with different chemical compositions, which is valid for two different sampling regions.
Regardless of the sampling region, silica-rich carbonate shale samples consistently exhibited greater values of specific surface area than other samples (i.e., carbonate-siliceous shale, clay-rich siliceous shale and mixed shale) (Table 2). Quantitatively, for the shallow region, the BET specific surface area of sample-1 was determined to be 1.61 m2/g, while sample-3, sample-5, and sample-7 were 0.82, 1.00 and 1.25 m2/g, respectively. The same trend was also observed for the deep region. For the total pore volume in the shallow region, sample-1 exhibited 0.0123 cm3/g. This value is much greater than those of other samples. Similar to the specific surface area, this observation is also true for the deep region. This trend is likely due to the difference in the amount of carbonate in the samples. Previous studies reported that carbonate minerals are easily dissolved relative to other minerals, resulting in the greater development of meso- or macropores [29].
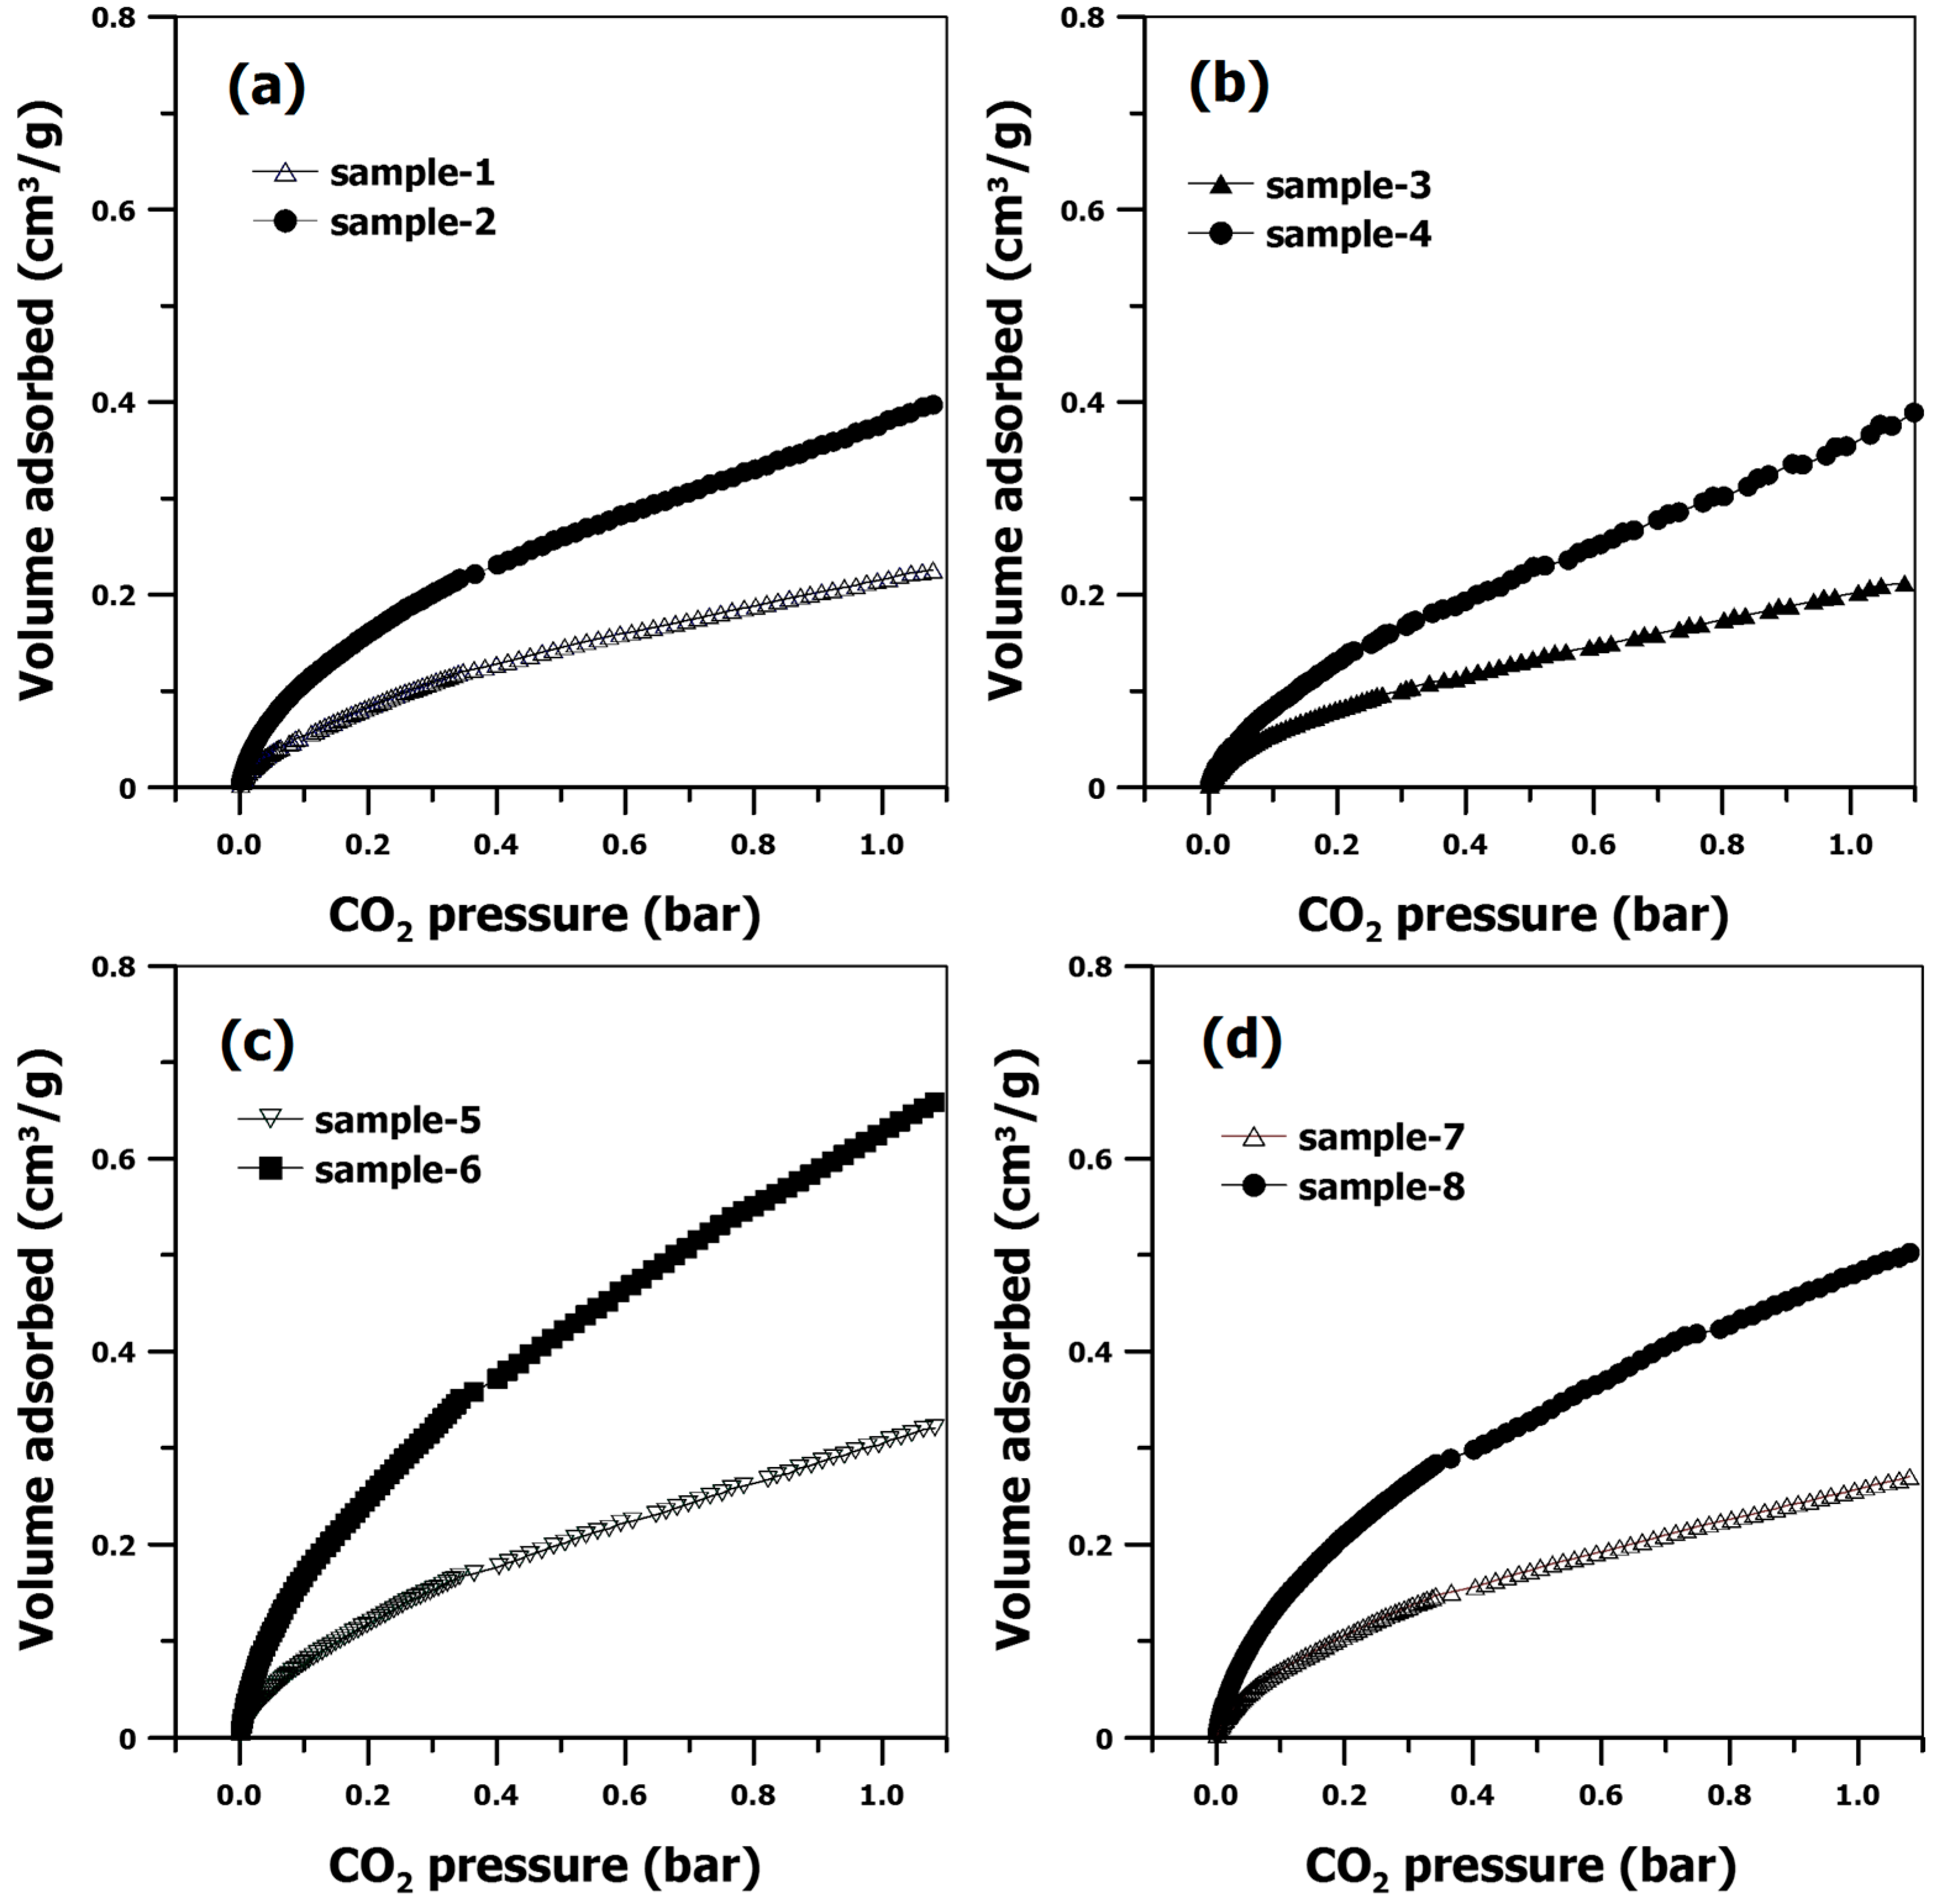
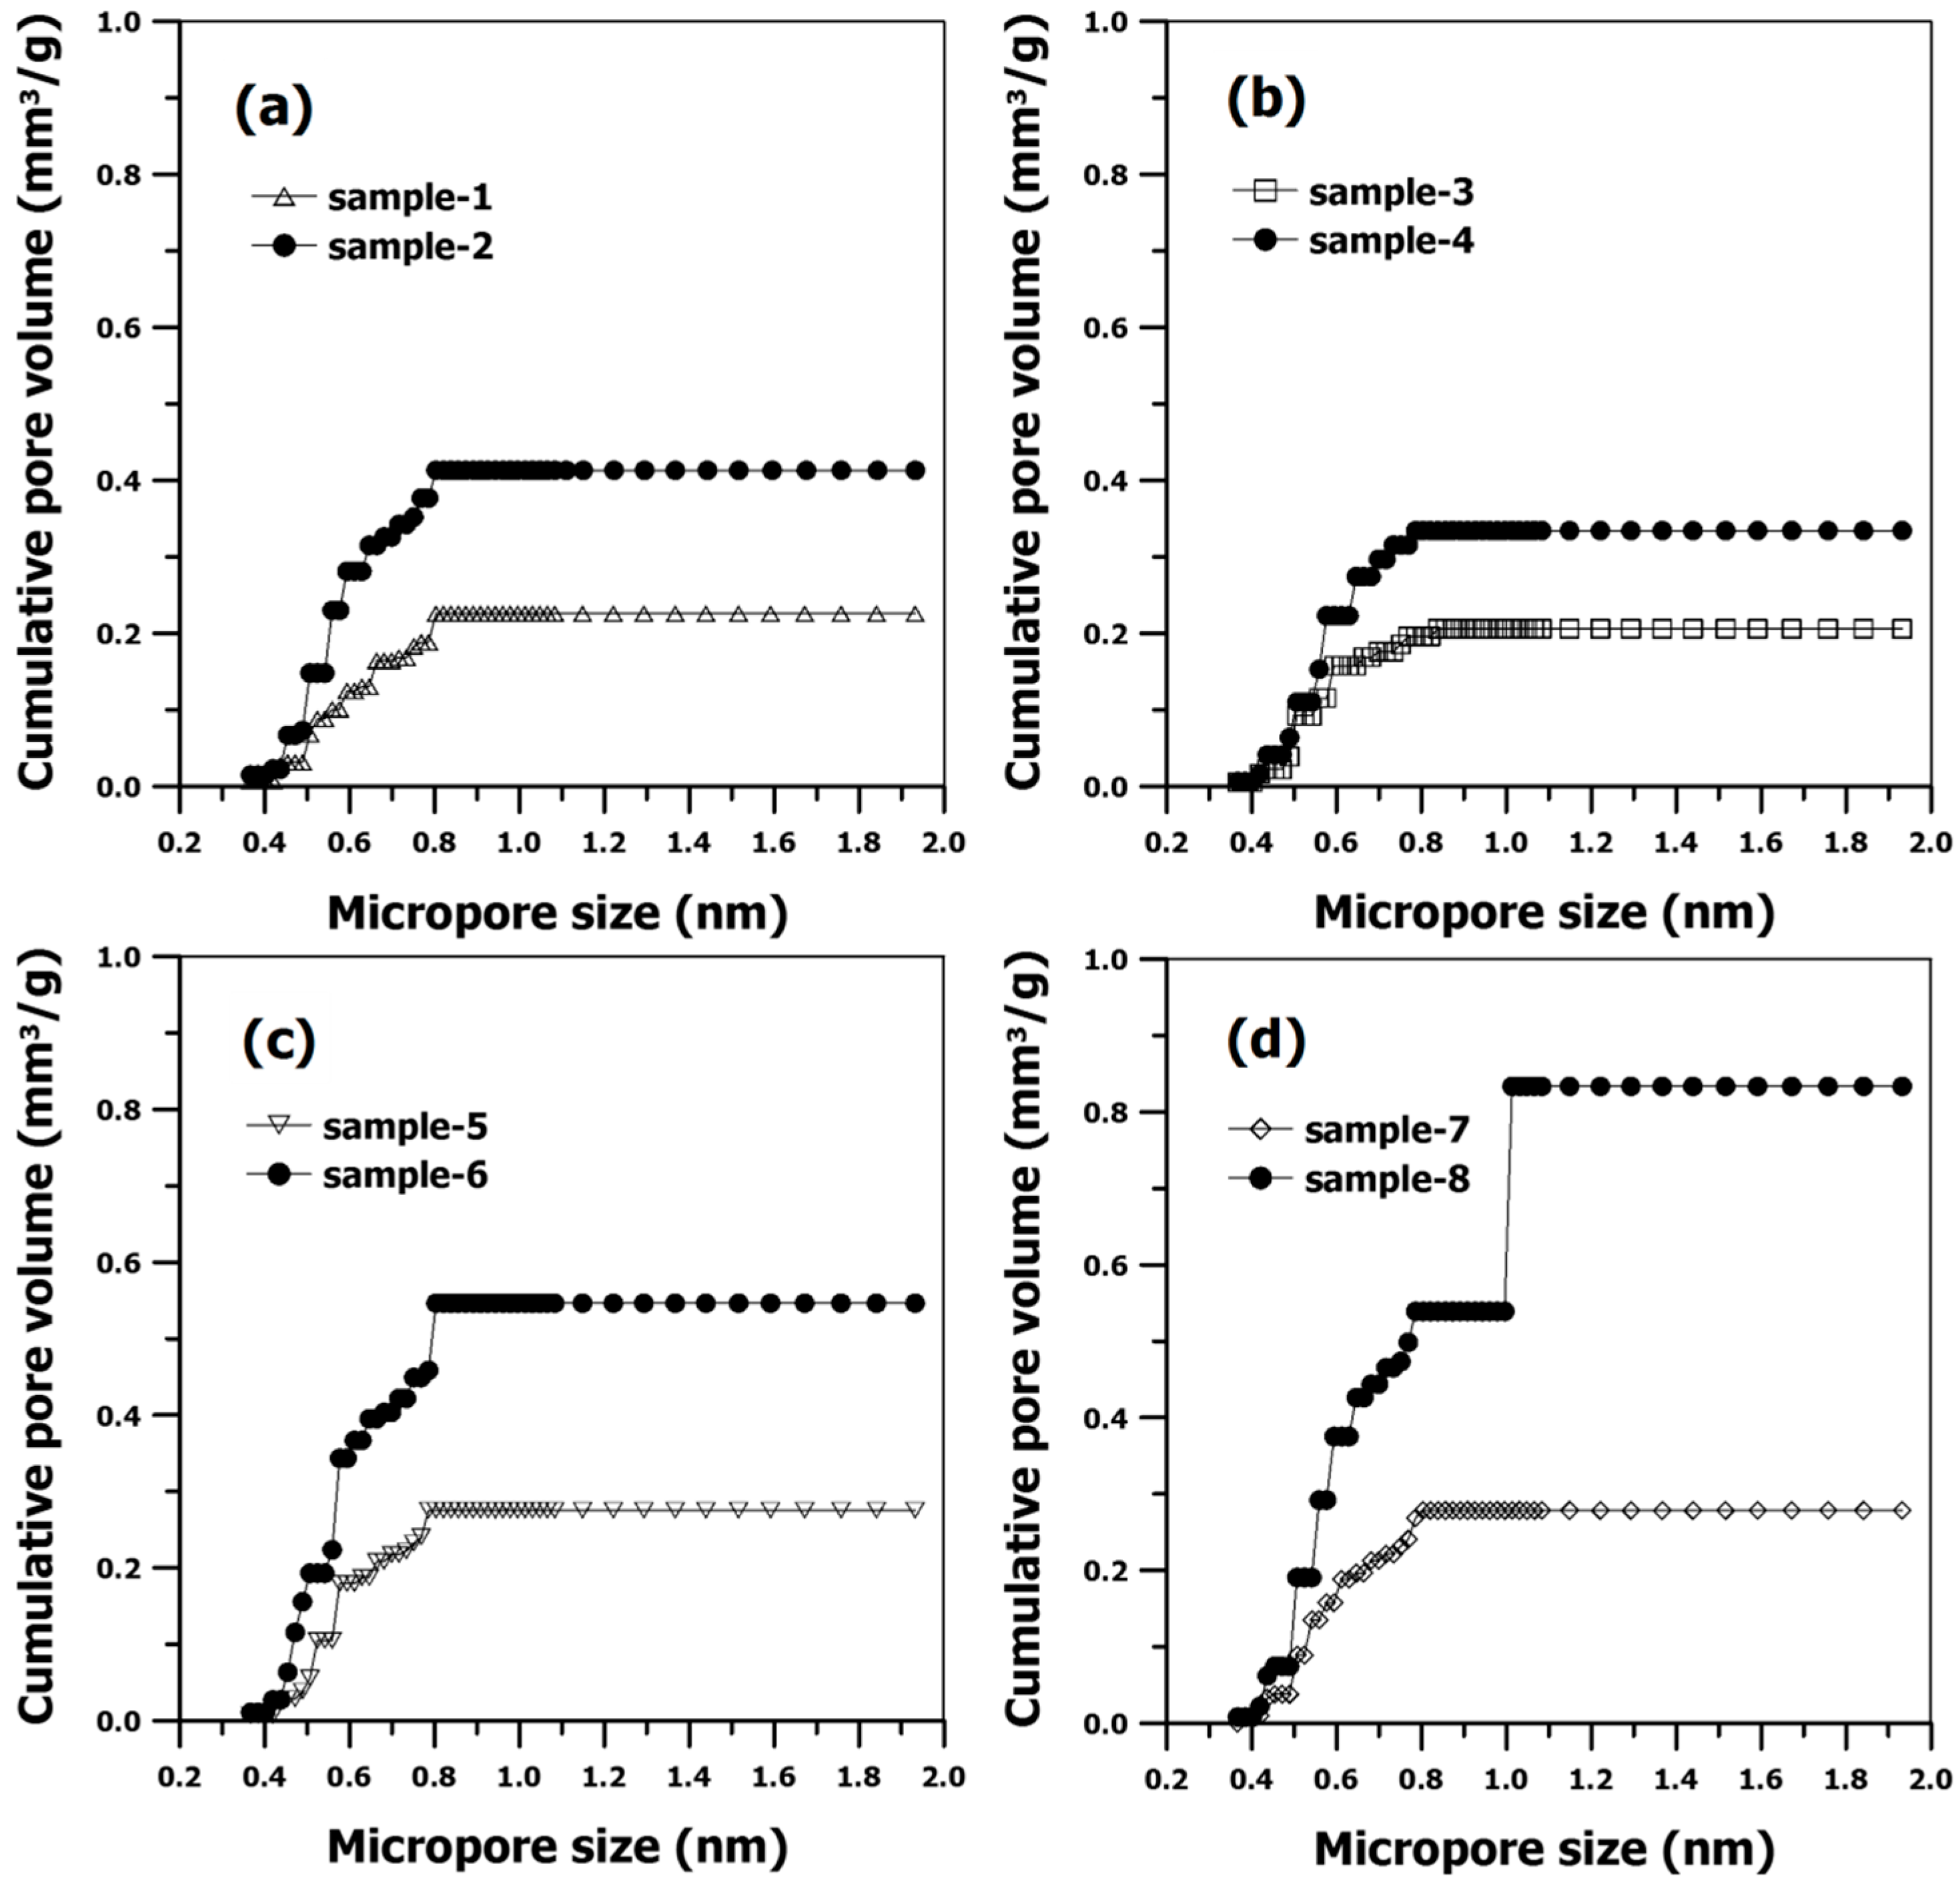
Figure 4 shows the carbon dioxide adsorption isotherms of all the samples with different chemical compositions. The corresponding micropore properties (i.e., micropore volume and micropore surface area) are also presented in Figure 5 and Table 2. Unlike the observations for the specific surface area and total pore volume, the clay-rich siliceous shale samples (sample-5 and 6) exhibited the greatest values compared with the silica-rich carbonate shale (sample-1 and 2) and carbonate-siliceous shale (sample-3 and 4) samples. Note that the mixed shale samples (sample-7 and 8) were excluded from this comparison, since no clear trend was observed at either the shallow or deep regions. Specifically, for the shallow region, the micropore volume of sample-5 was found to be 0.30 mm3/g, which is relatively greater than those for sample-1 and sample-3 (0.23 and 0.22 mm3/g, respectively).
A similar trend was observed for the micropore surface area, where a greater value for sample-5 (2.17 m2/g) was observed than that for sample-1 (1.51 m2/g) and sample-3 (1.98 m2/g). In addition, the differences in the two micropore properties became more obvious for the deep region. Sample-6 showed a 1.6–1.8 increase in the micropore volume and micropore surface area than that for sample-2 and sample-4. This suggests that the shales containing high amount of clay minerals (i.e., sample-5 and -6) show better development of micropore structures, an observation that could be explained by the unique crystalline structure of the clays (i.e., a layer structure with a stack of sheet) [30]. Overall, the results from the specific surface area, the total pore volume, the micropore volume, and the micropore surface area suggest that the nanopore formation of the Canadian shale samples used in this study is likely to be affected by the chemical composition.
3.3. Correlation of the Pore Structure of the Shale with Chemical Composition
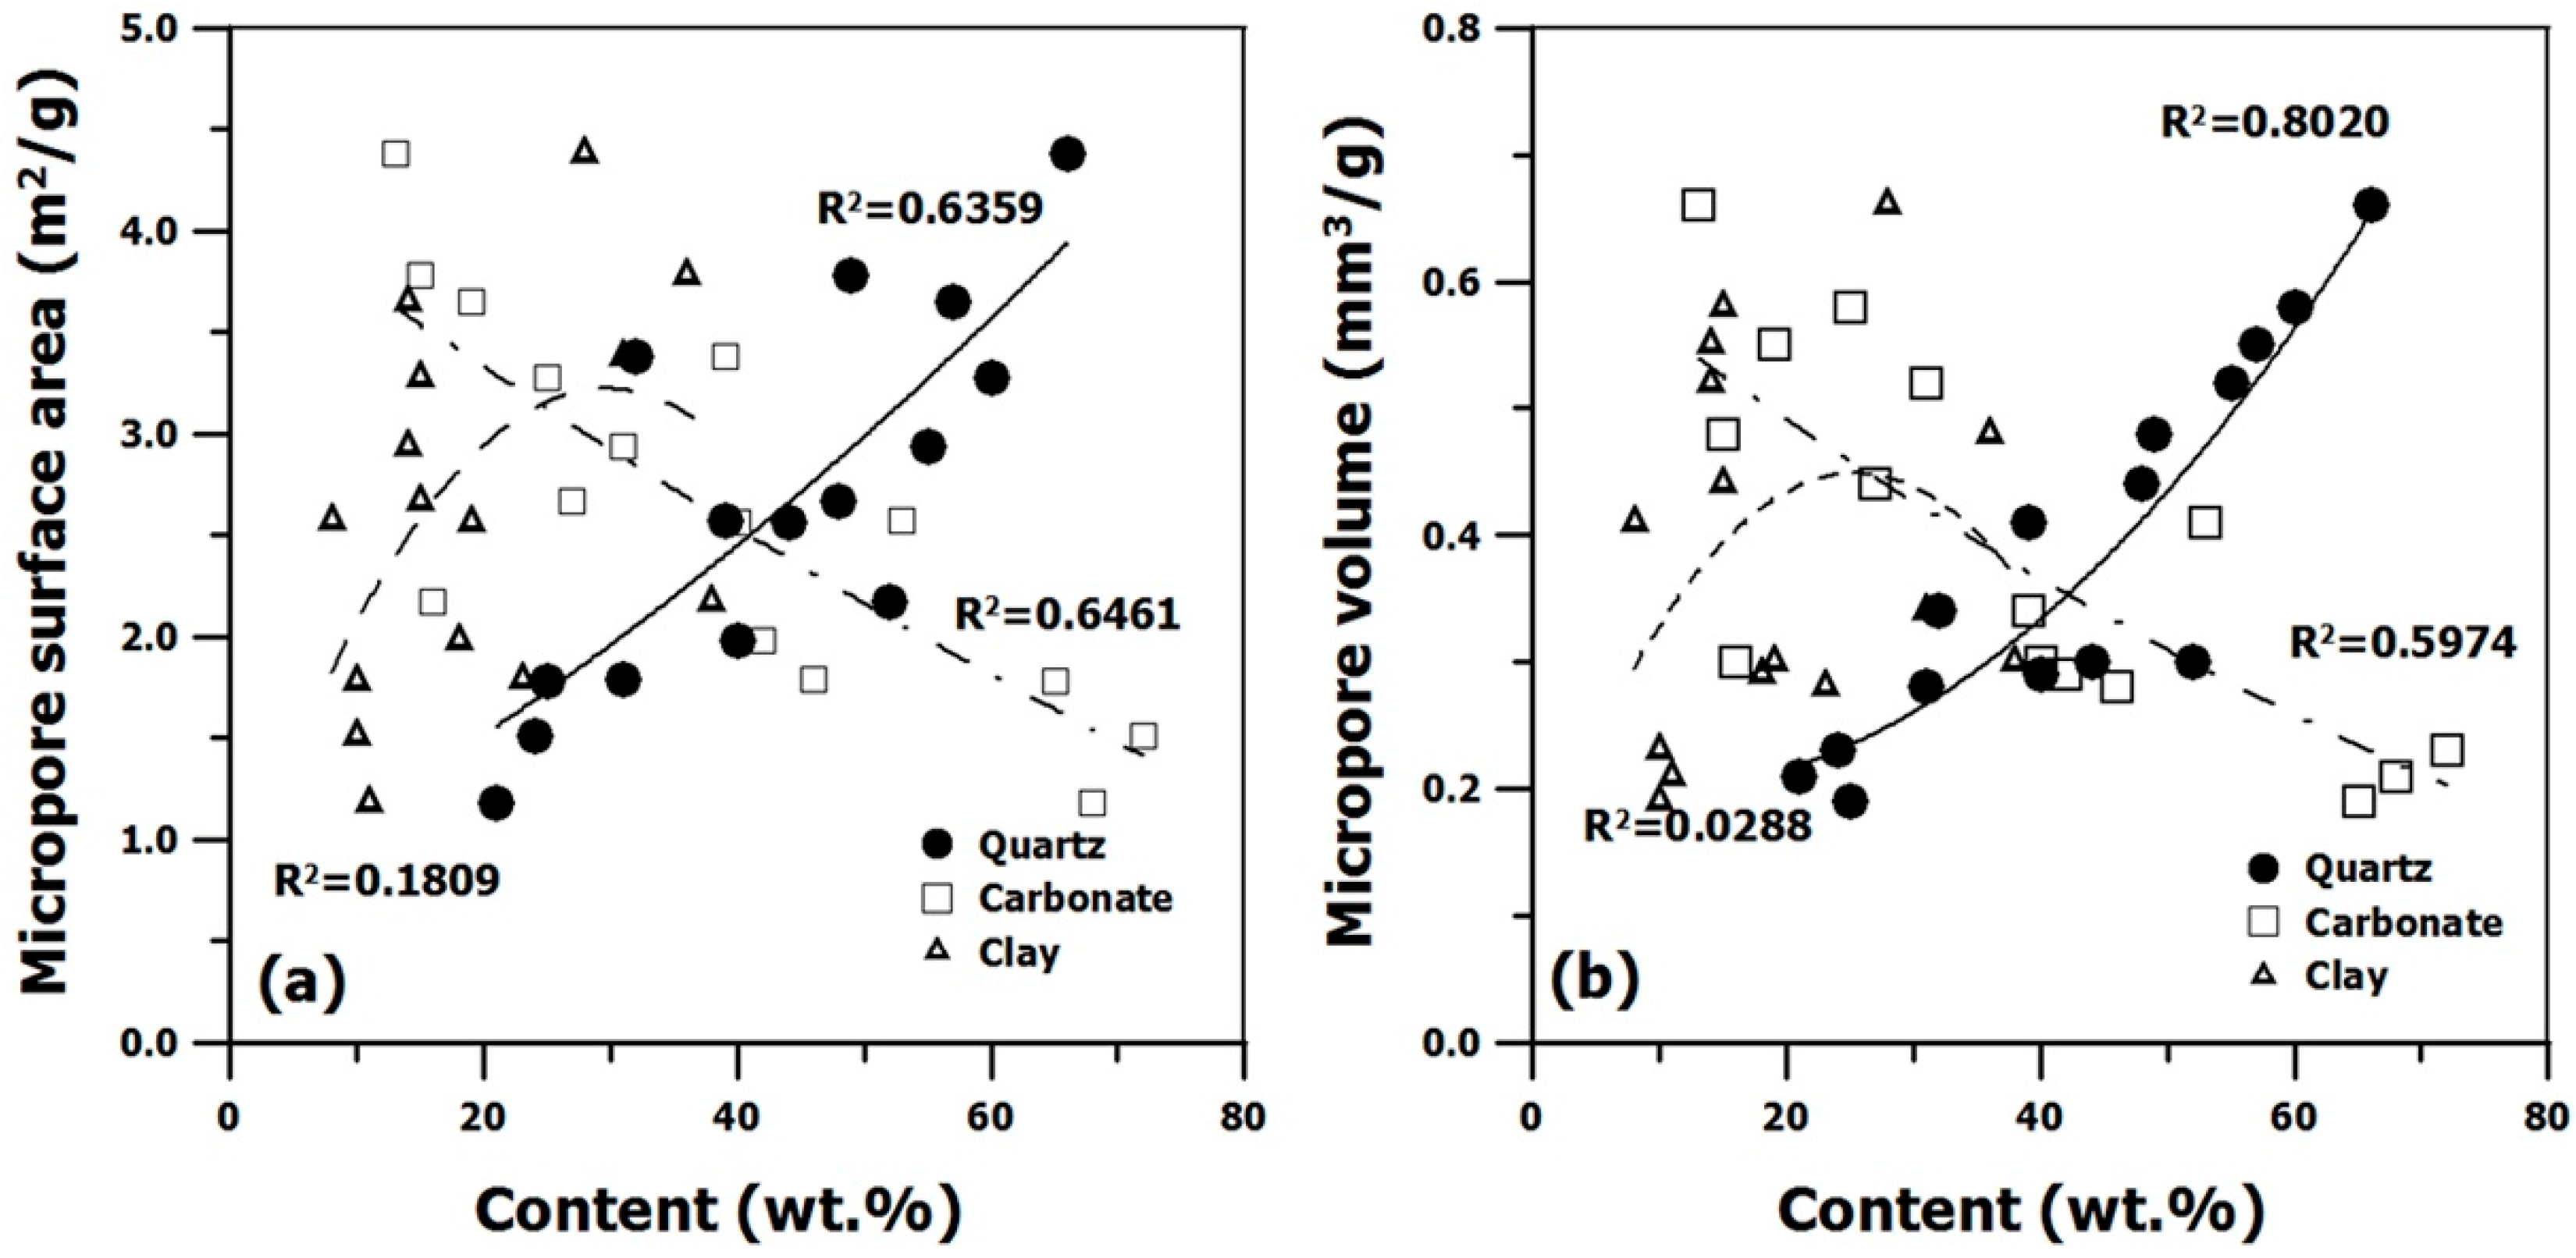
Since the purpose of the present study is to examine the correlation of both the micropore surface area and the micropore volume of shales with its chemical composition, we plotted each physical property as a function of the contents of quartz, carbonate, and clay. The results are presented in Figure 6. Figure 6a shows the correlation between the micropore surface area and the chemical composition. The coefficients of determination (R-squared value) for the fitting results as a function of quartz, carbonate, and clay were determined to be 0.6359, 0.6461 and 0.1809, respectively. This indicates that the quartz content has the strongest correlation with the micropore surface area of shales.
Also note that the carbonate content exhibits a similar coefficient of determination (~0.6461) with the quartz, but, unlike quartz, it shows a negative correlation. The correlation results between the micropore volume and the chemical composition of shales are also presented in Figure 6b. The coefficient of determination of the fitting results as a function of the quartz content was determined to be 0.8020, which was greater than those of the carbonate and clay contents. This result is consistent with that for the micropore surface area.
While the quartz content has a strong relationship with the micropore volume, the clay content shows even worse correlation than the micropore surface area (the coefficient of determination = 0.0288). The coefficient of determination of carbonate was 0.5974, indicating a negative tendency similar to the micropore surface area. Accordingly, overall results suggest that the quartz content might be a good indicator for estimating the amount of shale gas adsorbed compared to the carbonate and clay contents, and that the presence of clay clearly has no correlation with the two physical properties investigated herein.
Unlike our results, a previous study reported that no micropores or mesopores existed in siliceous/quartz-rich shale (high Si/Al), and that the porosity was as low as 1% [10]. Conversely, clay-rich shale (low Si/Al) had a high porosity. However, it should be noted that the reported results were not obtained from the CO2 adsorption but from Hg intrusion analysis. Additionally, the shale samples used in their study had a wide range of specific surface areas unlike those used in our study, which could lead to the difference in the correlation trend.
Since micropore volume has a positive correlation with specific surface area [8,10,31], our results have an important significance regarding the feasibility of assessing the amount of shale gas from ore-related properties of shales. Nevertheless, it may not be appropriate to generalize that the higher quartz content of shales results in the greater formation of micropores. To enhance the reliability of our outcomes, repetitive tests using a larger sample size are necessary. Additionally, diverse shale samples from various regions in Canada and other countries must be analyzed.
4. Conclusions
In the present study, pore-related physical properties such as the BET surface area, pore volume, and pore size of shales were thoroughly tested to examine the correlation with chemical composition of shales obtained from rock cuttings during drilling of the shale gas field located in Horn River basin. The key findings are presented below:
- The N2 and CO2 gas physisorption technique was found to be suitable for analyzing the pore-related properties of shales (e.g., BET surface area, pore volume, and pore size).
- Chemical composition did not play a critical role in the BJH pore size. However, the chemical composition was critical for the specific/micropore surface area and the total/micropore volume. The silica-rich carbonate shale showed the greatest specific surface area and total pore volume, while the micropore volume and micropore surface area was found to be the greatest for the clay-rich siliceous shale samples.
- Both the micropore surface area and micropore volume were found to be a strong function of the quartz content as compared to the carbonate and clay contents.
The outcomes from the present study suggest that pore-related properties (especially micropore properties) might be a good candidate for estimating shale gas adsorption characteristics. However, acquiring more datasets for shales samples with diverse chemical compositions and from different regions, as well as correlating their microscopic properties (e.g., total/micropore volume, specific/micropore surface area) with their macroscopic properties (e.g., core porosity, core permeability) is guaranteed for universal application.
Acknowledgments
This work was supported by the Energy Efficiency & Resources Core Technology Program of the Korea Institute of Energy Technology Evaluation and Planning (KETEP), granted financial resource from the Ministry of Trade, Industry & Energy, Republic of Korea (No. 20132510100060), the Ministry of Education, the Korea Energy and Mineral Resources Engineering Program (KEMREP), and the research funds of Chonbuk National University in 2013.
Author Contributions
Yosep Han conceived the idea and wrote the paper; Yosep Han and Daewoong Kwak performed experiments; Siyoung Q. Choi analyzed the numerical results. Changhoon Shin contributed to XRD analysis and provide samples; Youngsoo Lee reviewed the paper and gave feedback for improvement; and, Hyunjung Kim drafted the paper and supervised the entire research. All authors commented on the paper.
Conflicts of Interest
The authors declare no conflict of interest.
References
- Kuuskraa, V. United States energy information administration. In World Shale Gas Resources: An Initial Assessment of 14 Regions Outside the United States; US Department of Energy: Washington, DC, USA, 2011. [Google Scholar]
- Bustin, A.M.; Bustin, R.M. Importance of rock properties on the producibility of gas shales. Int. Coal Geol. 2012, 103, 132–147. [Google Scholar] [CrossRef]
- Chen, S.; Zhu, Y.; Wang, H.; Liu, H.; Wei, W.; Fang, J. Shale gas reservoir characterisation: A typical case in the southern sichuan basin of China. Energy 2011, 36, 6609–6616. [Google Scholar] [CrossRef]
- Hu, Q.-H.; Liu, X.-G.; Gao, Z.-Y.; Liu, S.-G.; Zhou, W.; Hu, W.-X. Pore structure and tracer migration behavior of typical American and Chinese shales. Pet. Sci. 2015, 12, 651–663. [Google Scholar] [CrossRef]
- Zhang, P.; Hu, L.; Meegoda, J.N. Pore-scale simulation and sensitivity analysis of apparent gas permeability in shale matrix. Materials 2017, 10, 104. [Google Scholar] [CrossRef]
- Clarkson, C.R.; Solano, N.; Bustin, R.; Bustin, A.; Chalmers, G.; He, L.; Melnichenko, Y.B.; Radliński, A.; Blach, T.P. Pore structure characterization of north american shale gas reservoirs using usans/sans, gas adsorption, and mercury intrusion. Fuel 2013, 103, 606–616. [Google Scholar] [CrossRef]
- Chalmers, G.R.; Bustin, R.M.; Power, I.M. Characterization of gas shale pore systems by porosimetry, pycnometry, surface area, and field emission scanning electron microscopy/transmission electron microscopy image analyses: Examples from the barnett, woodford, haynesville, marcellus, and doig units. AAPG Bull. 2012, 96, 1099–1119. [Google Scholar]
- Loucks, R.G.; Reed, R.M.; Ruppel, S.C.; Jarvie, D.M. Morphology, genesis, and distribution of nanometer-scale pores in siliceous mudstones of the mississippian barnett shale. J. Sediment. Res. 2009, 79, 848–861. [Google Scholar] [CrossRef]
- Kuila, U.; Prasad, M. Specific surface area and pore-size distribution in clays and shales. Geophys. Prospect. 2013, 61, 341–362. [Google Scholar] [CrossRef]
- Ross, D.J.; Bustin, R.M. The importance of shale composition and pore structure upon gas storage potential of shale gas reservoirs. Mar. Pet. Geol. 2009, 26, 916–927. [Google Scholar] [CrossRef]
- Zhang, T.; Ellis, G.S.; Ruppel, S.C.; Milliken, K.; Yang, R. Effect of organic-matter type and thermal maturity on methane adsorption in shale-gas systems. Org. Geochem. 2012, 47, 120–131. [Google Scholar] [CrossRef]
- Ji, L.; Zhang, T.; Milliken, K.L.; Qu, J.; Zhang, X. Experimental investigation of main controls to methane adsorption in clay-rich rocks. Appl. Geochem. 2012, 27, 2533–2545. [Google Scholar] [CrossRef]
- Yang, F.; Ning, Z.; Liu, H. Fractal characteristics of shales from a shale gas reservoir in the sichuan basin, China. Fuel 2014, 115, 378–384. [Google Scholar] [CrossRef]
- Kim, J.; Kim, D.; Lee, W.; Lee, Y.; Kim, H. Impact of total organic carbon and specific surface area on the adsorption capacity in Horn River shale. J. Pet. Sci. Eng. 2017, 149, 331–339. [Google Scholar] [CrossRef]
- Gasparik, M.; Ghanizadeh, A.; Bertier, P.; Gensterblum, Y.; Bouw, S.; Krooss, B.M. High-pressure methane sorption isotherms of black shales from the Netherlands. Energy Fuels 2012, 26, 4995–5004. [Google Scholar] [CrossRef]
- Yuan, W.; Pan, Z.; Li, X.; Yang, Y.; Zhao, C.; Connell, L.D.; Li, S.; He, J. Experimental study and modelling of methane adsorption and diffusion in shale. Fuel 2014, 117, 509–519. [Google Scholar] [CrossRef]
- Kam, P.; Nadeem, M.; Novlesky, A.; Kumar, A.; Omatsone, E.N. Reservoir characterization and history matching of the Horn River shale: An integrated geoscience and reservoir-simulation approach. J. Can. Pet. Technol. 2015. [Google Scholar] [CrossRef]
- Rietveld, H. Line profiles of neutron powder-diffraction peaks for structure refinement. Acta Crystallogr. 1967, 22, 151–152. [Google Scholar] [CrossRef]
- Lee, E.; Han, Y.; Park, J.; Hong, J.; Silva, R.A.; Kim, S.; Kim, H. Bioleaching of arsenic from highly contaminated mine tailings using Acidithiobacillus thiooxidans. J. Environ. Manag. 2015, 147, 124–131. [Google Scholar] [CrossRef] [PubMed]
- Barrett, E.P.; Joyner, L.G.; Halenda, P.P. The determination of pore volume and area distributions in porous substances. I. Computations from nitrogen isotherms. J. Am. Chem. Soc. 1951, 73, 373–380. [Google Scholar] [CrossRef]
- Han, Y.; Kim, H.; Park, J.; Lee, S.-H.; Kim, J.-Y. Influence of Ti doping level on hydrogen adsorption of mesoporous Ti-SBA-15 materials prepared by direct synthesis. Int. J. Hydrogen Energy 2012, 37, 14240–14247. [Google Scholar] [CrossRef]
- Brunauer, S.; Emmett, P.H.; Teller, E. Adsorption of gases in multimolecular layers. J. Am. Chem. Soc 1938, 60, 309–319. [Google Scholar] [CrossRef]
- Han, Y.; Choi, J.; Tong, M.; Kim, H. Synthesis and characterization of high-surface-area millimeter-sized silica beads with hierarchical multi-modal pore structure by the addition of agar. Mater. Charact. 2014, 90, 31–39. [Google Scholar] [CrossRef]
- Lowell, S.; Shields, J.E.; Thomas, M.A.; Thommes, M. Characterization of Porous Solids and Powders: Surface Area, Pore Size and Density; Springer Science & Business Media: Berlin, Germany, 2012; Volume 16. [Google Scholar]
- Rouquerol, J.; Avnir, D.; Fairbridge, C.; Everett, D.; Haynes, J.; Pernicone, N.; Ramsay, J.; Sing, K.; Unger, K. Recommendations for the characterization of porous solids (technical report). Pure Appl. Chem. 1994, 66, 1739–1758. [Google Scholar] [CrossRef]
- Dubinin, M.; Stoeckli, H. Homogeneous and heterogeneous micropore structures in carbonaceous adsorbents. J. Colloid Int. Sci. 1980, 75, 34–42. [Google Scholar] [CrossRef]
- Wang, G.; Carr, T.R. Marcellus shale lithofacies prediction by multiclass neural network classification in the appalachian basin. Math. Geosci. 2012, 44, 975–1004. [Google Scholar] [CrossRef]
- Ferri, F.; Hickin, A.S.; Reyes, J. Horn river basin–equivalent strata in besa river formation shale, northeastern british columbia (NTS 094K/15). Geosci. Rep. 2012, 1–15. [Google Scholar]
- Abbaszadeh, M.; Nasiri, M.; Riazi, M. Experimental investigation of the impact of rock dissolution on carbonate rock properties in the presence of carbonated water. Environ. Earth Sci. 2016, 75, 1–6. [Google Scholar] [CrossRef]
- Chiou, W.; Faas, R.; Kasprowicz, J.; Li, H.; Lomenick, T.; OBrien, N.; Pamukcu, S.; Smart, P.; Weaver, C.; Yamamoto, T. Microstructure of Fine-Grained Sediments: From Mud to Shale; Springer Science & Business Media: Berlin, Germany, 2012. [Google Scholar]
- Labani, M.M.; Rezaee, R.; Saeedi, A.; Al Hinai, A. Evaluation of pore size spectrum of gas shale reservoirs using low pressure nitrogen adsorption, gas expansion and mercury porosimetry: A case study from the perth and canning basins, western australia. J. Pet. Sci. Eng. 2013, 112, 7–16. [Google Scholar] [CrossRef]
Figure 1.
Ternary diagram of the shales. The plotting is based on the quartz–clay–carbonate system, and the plotted data were obtained by normalizing the weight percent information summarized in Table 1.
Figure 1.
Ternary diagram of the shales. The plotting is based on the quartz–clay–carbonate system, and the plotted data were obtained by normalizing the weight percent information summarized in Table 1.

Figure 2.
An average plot of nitrogen adsorption–desorption isotherms of the shale samples with different chemical compositions at two different depth regions: (a) silica-rich carbonate shale; (b) carbonate-siliceous shale; (c) clay-rich siliceous shale; and (d) mixed shale.
Figure 2.
An average plot of nitrogen adsorption–desorption isotherms of the shale samples with different chemical compositions at two different depth regions: (a) silica-rich carbonate shale; (b) carbonate-siliceous shale; (c) clay-rich siliceous shale; and (d) mixed shale.

Figure 3.
An average plot of Barrett–Joyner–Halenda (BJH) pore size distribution curves of the shale samples with different chemical compositions at two different depth regions: (a) silica-rich carbonate shale; (b) carbonate-siliceous shale; (c) clay-rich siliceous shale; and (d) mixed shale. The dV/dlog (D) represents the BJH differential pore volume of the shale samples.

Figure 4.
An average plot of carbon dioxide adsorption isotherms of the shale samples with different chemical compositions at two different depth regions: (a) silica-rich carbonate shale; (b) carbonate-siliceous shale; (c) clay-rich siliceous shale; and (d) mixed shale.
Figure 4.
An average plot of carbon dioxide adsorption isotherms of the shale samples with different chemical compositions at two different depth regions: (a) silica-rich carbonate shale; (b) carbonate-siliceous shale; (c) clay-rich siliceous shale; and (d) mixed shale.

Figure 5.
An average plot of cumulative micropore volume of the shale samples with different chemical compositions at two different depth regions: (a) silica-rich carbonate shale; (b) carbonate-siliceous shale; (c) clay-rich siliceous shale; and (d) mixed shale.
Figure 5.
An average plot of cumulative micropore volume of the shale samples with different chemical compositions at two different depth regions: (a) silica-rich carbonate shale; (b) carbonate-siliceous shale; (c) clay-rich siliceous shale; and (d) mixed shale.

Figure 6.
Correlation plots between two physical properties of shales ((a) micropore surface area and (b) micropore volume) and main, individual chemical components (quartz (black circle), carbonate (void square), and clay (void triangle)). Coefficient of determination (R2) values for each correlation plot are also presented for comparison.


Table 1.
Mineralogical composition and total organic carbon (TOC; wt %) of the shale with different sampling depths.
Table 1.
Mineralogical composition and total organic carbon (TOC; wt %) of the shale with different sampling depths.
| Sampling Depth (m) | Depth Index (m) | Quartz | Feldspar/Calcite | Dolomite/Plagioclase | Pyrite/Barite | Apatite/Illite | Layer | TOC |
|---|---|---|---|---|---|---|---|---|
| 2325–2330 | 2325 | 33 | 7/6 | 33/0 | 3/0 | 0/18 | Muskwa | 1.4 |
| 2335–2340 | 2335 | 40 | 6/2 | 4/6 | 4/0 | 0/38 | Muskwa | 0.8 |
| 2325–2360 | 2355 | 20 | 11/18 | 14/0 | 2/0 | 0/23 | Upper Otterpark | 1.2 |
| 2375–2380 | 2375 | 18 | 0/54 | 6/6 | 1/0 | 0/10 | Middle Otterpark | 0.5 |
| 2405–2410 | 2405 | 26 | 4/5 | 17/2 | 1/1 | 1/31 | Middle Otterpark | 1.6 |
| 2435–2440 | 2435 | 35 | 6/3 | 22/3 | 10/0 | 0/19 | Lower Otterpark | 1.3 |
| 2445–2450 | 2445 | 58 | 4/2 | 2/4 | 4/1 | 0/28 | Evie | 0.3 |
| 2465–2470 | 2465 | 37 | 2/50 | 2/0 | 1/0 | 0/8 | Evie | 1.7 |
Table 2.
Lithofacies and physical properties of the shales with different sampling depths.
| Depth Index (m) | Shale Lithofacies/Sample Name | Surface Area (m2/g) a | Total Pore Volume (cm3/g) b | BJH Pore Size (nm) c | Micropore Volume (mm3/g) d | Micropore Surface Area (m2/g) d |
|---|---|---|---|---|---|---|
| Shallow Region | ||||||
| 2375 | Silica-rich carbonate shale/sample-1 | 1.61 ± 0.12 | 0.0123 ± 0.0012 | 20.3 ± 1.1 | 0.23 ± 0.08 | 1.51 ± 0.21 |
| 2325 | Carbonate-siliceous shale/sample-3 | 0.82 ± 0.09 | 0.0045 ± 0.0008 | 24.5 ± 1.2 | 0.22 ± 0.04 | 1.98 ± 0.35 |
| 2335 | Clay-rich siliceous shale/sample-5 | 1.00 ± 0.20 | 0.0084 ± 0.0010 | 21.8 ± 0.9 | 0.30 ± 0.09 | 2.17 ± 0.32 |
| 2355 | Mixed shale/sample-7 | 1.25 ± 0.17 | 0.0074 ± 0.0009 | 18.3 ± 2.1 | 0.28 ± 0.11 | 1.79 ± 0.32 |
| Deep Region | ||||||
| 2465 | Silica-rich carbonate shale/sample-2 | 1.79 ± 0.13 | 0.0132 ± 0.0009 | 20.9 ± 1.7 | 0.41 ± 0.02 | 2.57 ± 0.39 |
| 2435 | Carbonate-siliceous shale/sample-4 | 1.28 ± 0.11 | 0.0094 ± 0.0006 | 19.8 ± 2.2 | 0.37 ± 0.05 | 2.56 ± 0.53 |
| 2445 | Clay-rich siliceous shale/sample-6 | 1.13 ± 0.22 | 0.0091 ± 0.0011 | 20.7 ± 1.5 | 0.66 ± 0.11 | 4.38 ± 0.28 |
| 2405 | Mixed shale/sample-8 | 1.65 ± 0.09 | 0.0101 ± 0.0005 | 18.6 ± 0.9 | 0.83 ± 0.09 | 3.88 ± 0.33 |
a Calculated from the N2 adsorption isotherms in Figure 2 using by BET model. b Determined at the relative pressure of 0.99 from the N2 adsorption isotherms in Figure 2. c Determined by averaging the BJH pore size distribution curve in Figure 3. The data in Figure 3 were determined by the BJH model from the adsorption branch of the N2 isotherm in Figure 2. d Determined at the micropore size of 2 nm from the cumulative pore volume-micropore size curve in Figure 5. The data in Figure 5 were calculated by the D–R method from the adsorption branch of CO2 isotherm in Figure 4.
© 2017 by the authors. Licensee MDPI, Basel, Switzerland. This article is an open access article distributed under the terms and conditions of the Creative Commons Attribution (CC BY) license (http://creativecommons.org/licenses/by/4.0/).
Share and Cite
MDPI and ACS Style
Han, Y.; Kwak, D.; Choi, S.Q.; Shin, C.; Lee, Y.; Kim, H. Pore Structure Characterization of Shale Using Gas Physisorption: Effect of Chemical Compositions. Minerals 2017, 7, 66. https://doi.org/10.3390/min7050066
AMA Style
Han Y, Kwak D, Choi SQ, Shin C, Lee Y, Kim H. Pore Structure Characterization of Shale Using Gas Physisorption: Effect of Chemical Compositions. Minerals. 2017; 7(5):66. https://doi.org/10.3390/min7050066
Chicago/Turabian StyleHan, Yosep, Daewoong Kwak, Siyoung Q. Choi, Changhoon Shin, Youngsoo Lee, and Hyunjung Kim. 2017. "Pore Structure Characterization of Shale Using Gas Physisorption: Effect of Chemical Compositions" Minerals 7, no. 5: 66. https://doi.org/10.3390/min7050066
Note that from the first issue of 2016, this journal uses article numbers instead of page numbers. See further details here.