Article

Physicochemical and Additive Controls on the Multistep Precipitation Pathway of Gypsum

by
Mercedes Ossorio
1,
Tomasz M. Stawski
2,*,
Juan Diego Rodríguez-Blanco
3,
Mike Sleutel
4,
Juan Manuel García-Ruiz
1,
Liane G. Benning
2,5,6 and
Alexander E. S. Van Driessche
1,7,*
1
LEC, IACT, CSIC, Universidad de Granada, 18100 Granada, Spain
2
GFZ German Research Centre for Geosciences, Telegrafenberg, 14473 Potsdam, Germany
3
Department of Geology, Museum Building, Trinity College Dublin, 2 Dublin, Ireland
4
Structural Biology Brussels, Flanders Interuniversity Institute for Biotechnology and Vrije Universiteit Brussel, 1050 Elsene, Belgium
5
Department of Earth Sciences, Free University of Berlin, 12249 Berlin, Germany
6
School of Earth and Environment, University of Leeds, LS2 9JT Leeds, UK
7
University Grenoble-Alpes, CNRS, ISTerre, F-38000 Grenoble, France
*
Authors to whom correspondence should be addressed.
Minerals 2017, 7(8), 140; https://doi.org/10.3390/min7080140
Submission received: 6 July 2017 / Revised: 2 August 2017 / Accepted: 3 August 2017 / Published: 9 August 2017

Abstract

:
Synchrotron-based small- and wide-angle X-ray scattering (SAXS/WAXS) was used to examine in situ the precipitation of gypsum (CaSO4·2H2O) from solution. We determined the role of (I) supersaturation, (II) temperature and (III) additives (Mg2+ and citric acid) on the precipitation mechanism and rate of gypsum. Detailed analysis of the SAXS data showed that for all tested supersaturations and temperatures the same nucleation pathway was maintained, i.e., formation of primary particles that aggregate and transform/re-organize into gypsum. In the presence of Mg2+ more primary particle are formed compared to the pure experiment, but the onset of their transformation/reorganization was slowed down. Citrate reduces the formation of primary particles resulting in a longer induction time of gypsum formation. Based on the WAXS data we determined that the precipitation rate of gypsum increased 5-fold from 4 to 40 °C, which results in an effective activation energy of ~30 kJ·mol−1. Mg2+ reduces the precipitation rate of gypsum by more than half, most likely by blocking the attachment sites of the growth units, while citric acid only weakly hampers the growth of gypsum by lowering the effective supersaturation. In short, our results show that the nucleation mechanism is independent of the solution conditions and that Mg2+ and citric acid influence differently the nucleation pathway and growth kinetics of gypsum. These insights are key for further improving our ability to control the crystallization process of calcium sulphate.

1. Introduction

Three crystalline phases are known in the CaSO4–H2O system, distinguishable by their degree of hydration: gypsum (CaSO4·2H2O), bassanite (CaSO4·0.5H2O), and anhydrite (CaSO4). Natural calcium sulphate deposits, predominantly composed of gypsum and anhydrite, are found throughout the geological record [1], and these minerals are an important source material for the building industry (e.g., plaster of Paris) [2]. Furthermore, calcium sulphate minerals are among the most common scalants [3], causing serious reduction in the efficiency of for example desalination plants [4]. Due to their prominent role in both natural and industrial environments, the precipitation behaviour of CaSO4 phases has been a much-studied topic (e.g., [5]). Until recently, the formation of gypsum from solution (the stable phase < 60 °C) was assumed to proceed via a single-step pathway (e.g., [6]). But, new experimental evidence has revealed that gypsum precipitation does not proceed via a direct nucleation pathway. Instead, a variety of multi-step pathways have been proposed including amorphous calcium sulphate and bassanite as possible precursor phases [7,8,9,10]. However, all these studies are mainly based on ex situ characterization of the precipitation reaction (e.g., electron microscopic imaging combined with quenching techniques to isolate the precipitates from solution for their subsequent characterization). But, the inherent instability of the precursor phases in solution and the rapid kinetics of crystallization make it difficult to define the early-stages of the precipitation of calcium sulphate. Thus, in order to fully characterize the precipitation products and kinetics, and to eliminate possible quenching artifacts, the application of in situ monitoring of the reaction is paramount.
Synchrotron-based time-resolved X-ray scattering is a powerful method for in situ characterization of the reaction products of solution based precipitation processes [11]. When the measured angular range is further extended to wide-angles (WAXS), the diffraction patterns of crystalline materials can be recorded allowing identification, and quantification of the formed phases and their evolution. In a previous study, using in situ SAXS/WAXS, we observed the initial stages of calcium sulphate nucleation and found that nanosized primary particles are formed immediately after a supersaturated solution is created. These particles aggregate and transform/re-organize into gypsum [12]. Building upon this initial study, we again used in situ SAXS/WAXS to follow the precipitation behavior of calcium sulphate phase(s) over a broad range of temperatures (4–40 °C) and initial calcium sulphate concentrations (50–150 mM). In addition, the influence of two inhibitors (Mg2+ and citric acid) on the precipitation behavior was studied. SAXS provided us with information on the precursor stage of the reaction, while reaction rates and the activation energy for calcium sulphate precipitation were derived from the WAXS data.

2. Materials and Methods

Three different calcium sulphate precipitation scenarios were designed to obtain a representative set of data: (I) The role of supersaturation was tested (at 21 °C) by carrying out experiments at four initial calcium sulphate concentrations (50, 75, 100 and 150 mmol·L–1 CaSO4, solutions were obtained by mixing equimolar stock solutions of Na2SO4 and CaCl2). (II) The influence of temperature on the precipitation behavior was analyzed by conducting experiments at five temperatures (4, 12, 21, 30, 40 °C) for a 50 mmol·L−1 CaSO4 solution. (III) Finally, the effect of additives on the precipitation of calcium sulphate was studied for 50, 75, 100 and 150 mmol·L−1 CaSO4 solutions at 21 °C. One additive, Mg, which enhances the solubility of CaSO4, was introduced, replacing the Na+ ions with Mg2+ ions in stoichiometric conditions (MgSO4·7H2O and CaCl2·2H2O were used as reactants, and a 1:1 Ca2+/Mg2+ ratio was maintained for all cases). The second additive that was used, citric acid (C6H8O7), is known to retard the nucleation/growth kinetics of calcium sulphate [13,14], and its effect was tested by adding 2.6 mmol·L−1 C6H8O7 to the CaSO4 solutions.
The initial solution saturation index, SIgyp, for each experimental condition was calculated using the PHREEQC code [15] with the minteq.v4 database (Table 1). In the case of the experiments with inhibitors, their effect on the solubility of gypsum was taken into account.

2.1. Turbidity Experiments

Previous to small- and wide-angle X-ray scattering (SAXS/WAXS) experiments extensive testing of the experimental conditions was undertaken. Making use of a UV-vis spectrophotometer (Uvikon XL, SCHOTT Instruments, Mainz, Germany) the precipitation process was monitored measuring the change in the ratio of incident light/transmitted light (≈turbidity) passing through the solution over time. Changes in turbidity of the solution were followed at λ = 520 nm for all experimental conditions and turbidity values were recorded every 0.017 s. Two experimental setups were employed: (I) equimolar solutions of the reactants, CaCl2·2H2O (Sigma, pure) and Na2SO4 (Sigma, >99%), were mixed in polystyrene cuvettes and stirred at a constant rate of 350 rpm, (II) 50 mL of each reactant (1:1 ratio) were added to a reaction beaker, positioned next to the spectrophotometer, and continuously stirred at 350 rpm. Immediately after the reactants were mixed the resulting solution was continuously circulated between the reaction beaker and a flow-through cuvette located inside of the spectrophotometer, using a peristaltic pump. The temperature of the beaker was maintained constant using a temperature controlled water bath and reactants were pre-heated before mixing. The cuvettes inside of the spectrophotometer where located inside of a temperature controlled holder.

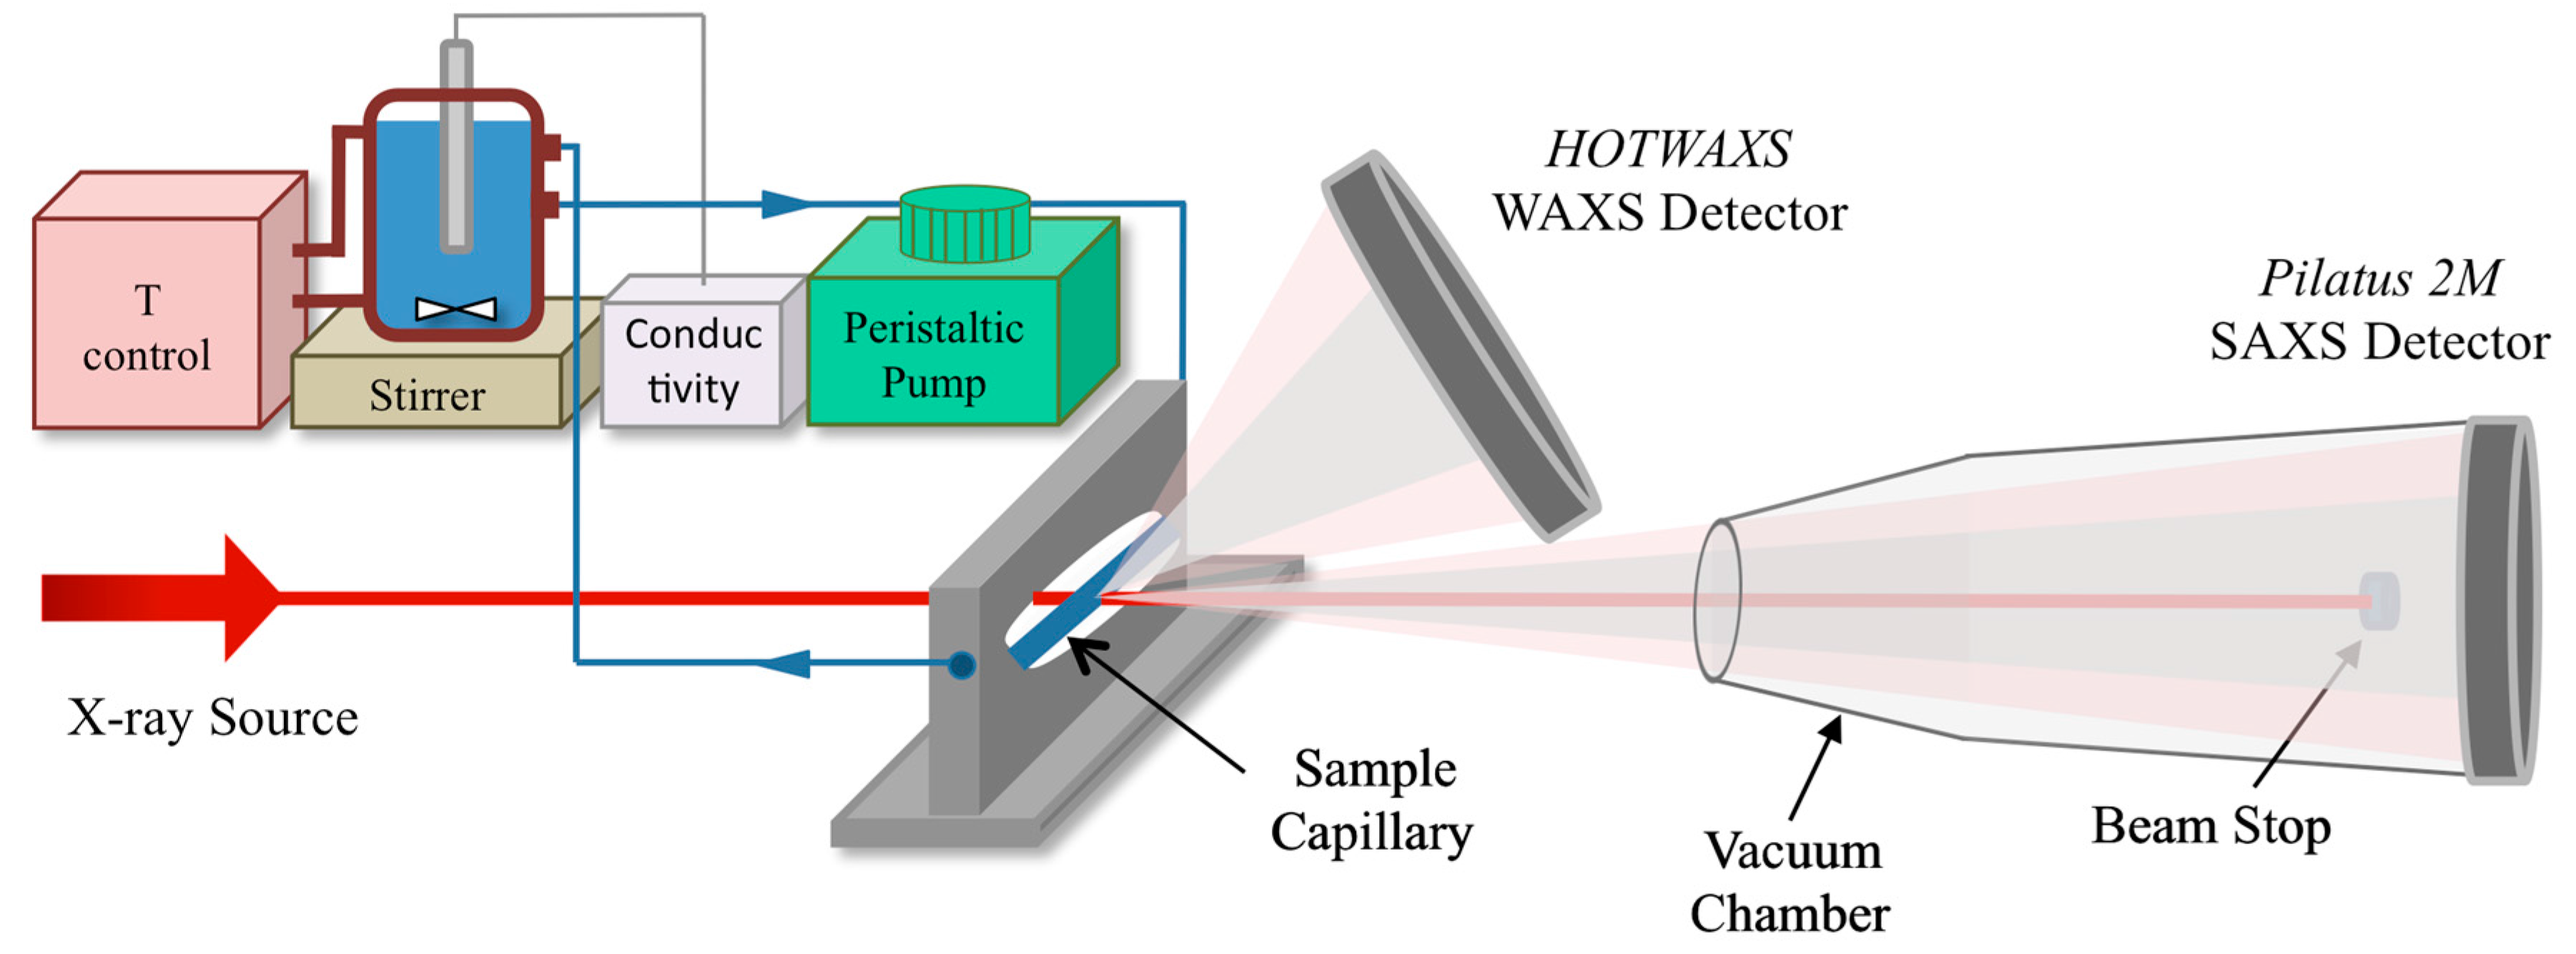
2.2. Synchrotron In Situ Small- and Wide-Angle X-ray Scattering

In situ SAXS/WAXS measurements were conducted at the I22 beamline of the Diamond Light Source (UK). In Figure 1, a schematic representation of the experimental setup employed at the synchrotron facility is shown.
First, 40 mL of a CaCl2·2H2O solution stirred (350 rpm) in a reaction beaker was circulated using a peristaltic pump through a thin-walled capillary (GLAS, quartz glass capillaries, 1.5 mm diameter) aligned with the incoming X-ray beam. Then, 40 mL of a Na2SO4 solution (with or without additive) was injected by means of remotely controlled stopped-flow device (BioLogic SFM400, Bio-Logic Science Instruments, Seyssinet-Pariset, France). Reactants were preheated before mixing and the temperature during the precipitation reaction was controlled in the same way as in the off-line experiments.
Samples flowing (pump rate ~10 mL/s) through the capillary were measured in transmission mode, using a monochromatic X-ray beam at 12.4 keV, and two-dimensional scattered intensities were collected at small angles with a Pilatus 2M (2D large area pixel-array detector, Dectris AG, Baden-Daettwil, Switzerland) and at wide angles with a HOTWAXS detector (a photo-counting 1D microstrip gas chamber detector). Transmission was measured with a photodiode installed in the beam-stopper of the SAXS detector. A sample-to-detector distance of 4.22 m was used, and the q-range at small angles was calibrated using silver behenate [16] and dry collagen standards [17], while for the WAXS detector a highly crystalline Si standard (NIST 640c) was used.
SAXS/WAXS measurements were started just before mixing of the reactants, and lasted for a maximum of 4 h/experiment, collecting 5–60 s/scan. The triggering of SAXS and WAXS frame acquisition was synchronized between the two detectors so that a given frame in SAXS corresponded to the one in WAXS. The scattered intensity was calibrated to absolute units using water as a reference. Diffraction patterns of commercial CaSO4·2H2O (Sigma Aldrich, ≥99%, St. Louis, MO, USA) were collected and used as standard for comparison with the reaction products. Prior to each new experimental run, a pattern of the capillary filled with water was taken in order to ensure that all CaSO4 was removed from the previous experimental run.

SAXS and WAXS Data Processing

Typically the recorded 2D SAXS patterns were circular in shape, and thus independent of the in-plane azimuthal angle with respect to the detector, showing that the investigated systems could be considered isotropic. For those isotropic patterns, pixels corresponding to similar q regardless of their azimuthal angle where averaged together, reducing the 2D patterns to 1D curves. SAXS data processing and reduction included masking of undesired pixels, normalizations and correction for transmission, background subtraction and data integration to 1D. These steps were performed using the Data Analysis WorkbeNch (DAWN) software package (v. 1.3 and 1.4) according to I22 guidelines [18]. A more detailed account of the SAXS analysis strategy can be found in our previous works [12,19].
The initial WAXS data reduction consisted in the subtraction of the background (pattern of the cell filled with water or filled with a CaCl2·2H2O solution) from each of the datasets. Typically water and diluted salt solutions produced the same background characteristics. Subsequently, all the datasets were normalized with respect to the intensity of the incident beam (i.e., the incoming beam measured before the sample).
The diffraction patterns of commercial gypsum powder and those from the solid phase formed from a 50 mmol·L−1 CaSO4 solution at 21 °C after 3.3 h of reaction (i.e., the final stage of the experiment) were compared and the reflections of both solid phases were identified as gypsum using the CIF PDF2: 33–311 (Figure S1). Diffraction patterns obtained during precipitation were added (maintaining the same proportion of added frames for the total course of the experiment) for each dataset in order to increase the signal-to-noise ratio. Whole-pattern-fitting was applied, using XFit Koalariet [20], to obtain time-resolved information about the precipitation of gypsum. Reaction rates of precipitation, k, were derived for each experimental condition by fitting the experimental data with a mathematical expression extracted from the kinetic model of Kolmogorov-Johnson-Mehl-Avrami (KJMA), commonly referred to as the Avrami equation:
α = 1 e ( k ( t t i n d ) ) n
where α is the time-resolved peak area (i.e., the degree of crystallization of the precipitate at time t), k is the rate constant, tind is the induction time of reaction, and n is a parameter that varies according to the nucleation and growth mechanism defined within the KJMA kinetic model. This model applies to specific solid-state phase transformations. However, it has also been used to fit other nucleation-and-growth processes exhibiting sigmoidal conversion kinetics, such as crystal formation from solution and melts [21,22]. For solid-state phase transformations, the value of n is usually related to the mechanism of nucleation and the dimensionality of growth. But, since the application of the KJMA model to precipitation from solution is nonrigorous, no physical interpretation of the fitted values of this exponent is done. Similarly, k lacks a true physical definition for our system, but it is still useful for comparing growth rates among similar precipitation processes, and allows us to estimate the activation barrier for crystal growth.
The determination of the reaction rate k was subject to the adjustment of the induction time, tind, and of the time exponent n to fixed values in Equation (1) for fitting of the experimental data; tind for each experimental condition was taken as the time at which the WAXS signal started to develop. The time exponent n was obtained through the fitting of the experimental data with Equation (1), with n as an unfixed parameter. For all the experimental series, the obtained values of n were approximate 1, thus for the calculation of the reaction rate n was fixed at 1.
For the experiments (50 mmol·L−1 CaSO4) performed at different temperatures (4–40 °C) the activation energy (EA) for CaSO4 formation was derived using the Arrhenius’s equation:
k = A · e x p E A / R T
where k is the reaction rate estimated from our experimental data, A is an pre-exponential factor, R is the ideal gas constant, and T is the temperature. WAXS patterns were also used to estimate the crystallite size of gypsum, but on average particles sizes were outside the application range of the Scherrer equation (For details see Supplementary Section S2, Tables S1 and S2, Figure S2 and [23]).

2.3. AFM Experiments

In situ atomic force microscopy (AFM) observations were carried out to characterize the surface topography of growing {010} faces of gypsum in the presence of Mg2+ and Citric Acid. Measurements were done with a commercial microscope equipped with a closed liquid cell with an inlet and outlet (Nanoscope IIIa, Bruker, Billerica, MA, USA). AFM images were obtained in Tapping mode using silicon cantilevers (Tap-300, BudgetSensors, Sofia, Bulgaria).
Freshly cleaved gypsum samples were immobilized using vacuum grease on a glass disc glued to a metal puck and mounted onto the AFM scanner. The gypsum surface was first observed in air in order to locate areas with low edge density. Thereafter the fluid cell was filled with a supersaturated CaSO4 solution (with and without additives) using a syringe. Directly after injection of a solution the evolution of the surface topography was monitored over time. In order to avoid evaporation effects during the measurements, the solution of the liquid cell was changed every 5 to 10 min. During imaging, the temperature inside of the liquid-cell was ~30 ± 1 °C.

3. Results

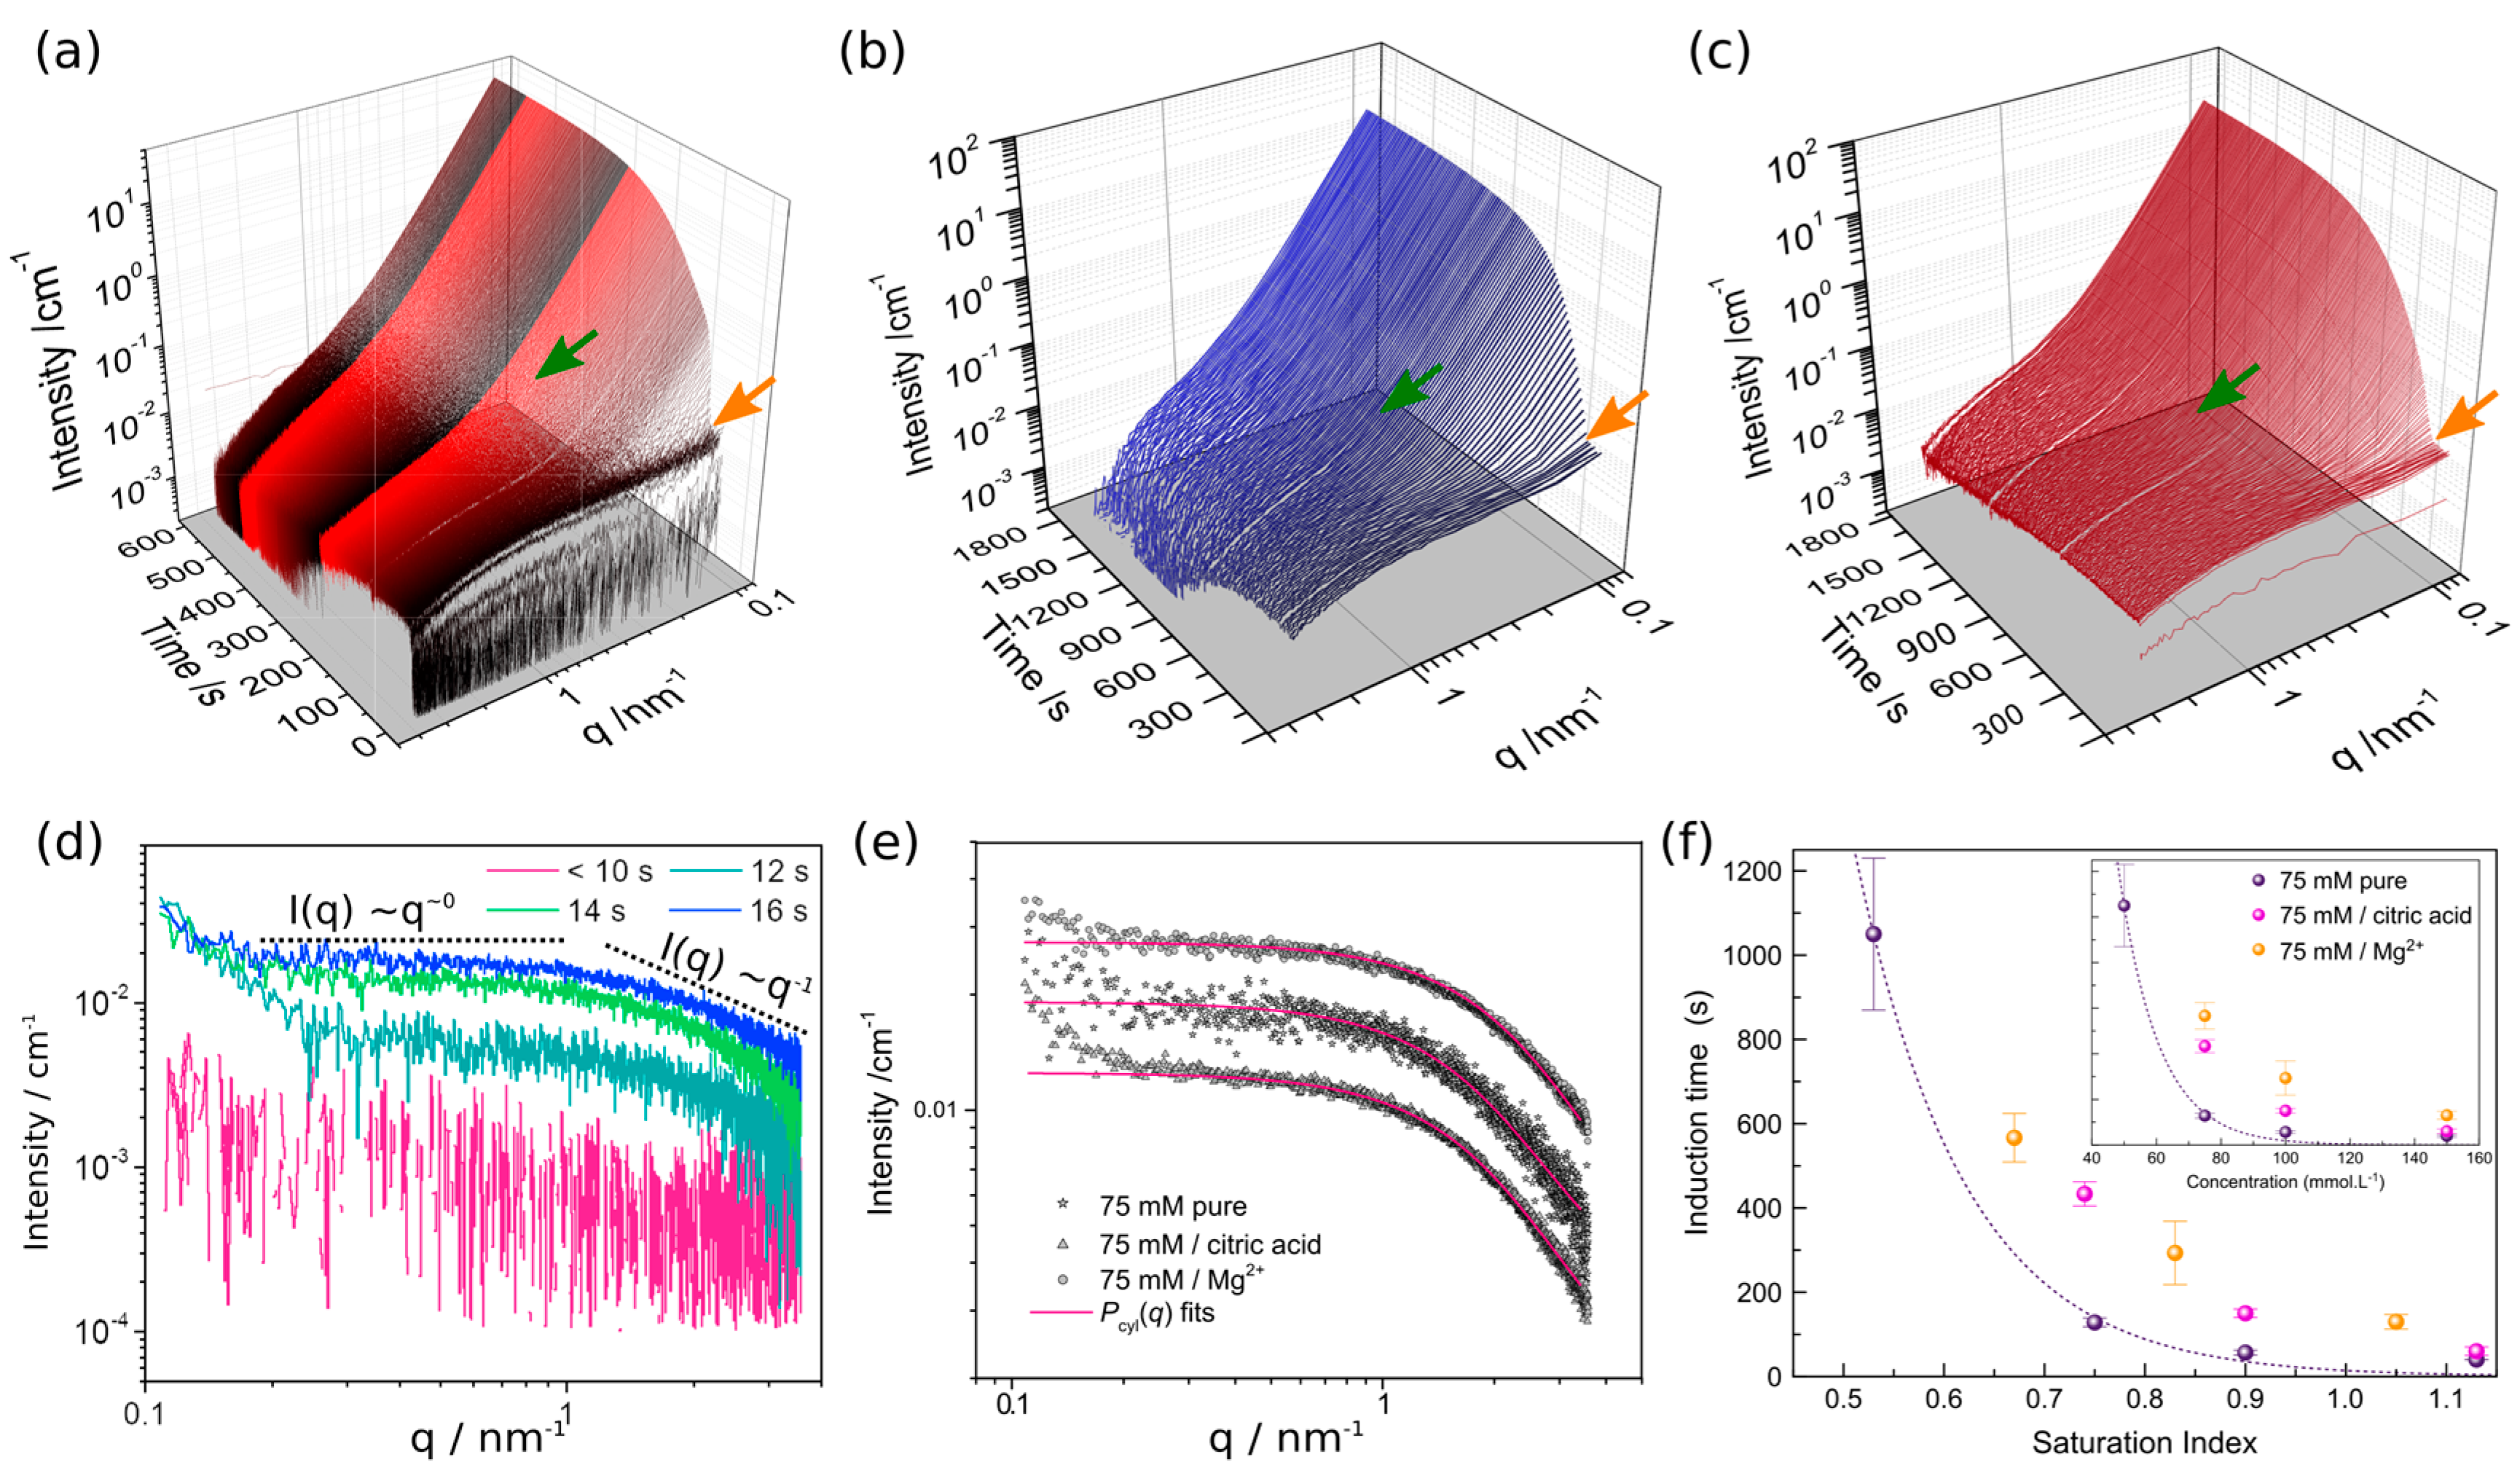
3.1. The Initial Stages of Gypsum Formation

For all experimental conditions, diffraction peaks started to develop in the time-resolved WAXS patterns after a certain induction time. The length of this period is a function of supersaturation, temperature and the presence/concentration of additives (Figure 2 and Figure 3). Regardless of the induction time derived from the WAXS signal, our time-resolved SAXS patterns indicated that as soon as a supersaturated solution was created, i.e., after mixing of both stock solutions, the presence of small scatterers beyond the size of ions/ion pairs (Figure 2) were immediately observed. This is in line with the precipitation pathway of gypsum discussed in our previous works [12,19], where the following stages leading to the crystallization of gypsum from a 50 mmol·L−1 CaSO4 solution (at 12 °C) are distinguished: (I) formation of nanosized (<3 nm) primary species composed of Ca–SO4 cores, (II) assembly of these primary species into loose domains (the interparticle distance is larger than 2 times the radius of gyration of the primary species), (III) densification of the loose domains into aggregates of primary species, and finally (IV) growth and reorganization of the primary units within the aggregates. Simultaneously with the onset of stage IV, diffraction peaks start to appear in the WAXS patterns, indicating that gypsum is being formed.
In Figure 2a time-resolved SAXS patterns (1 s time-frames) of a 75 mmol·L−1 CaSO4 solution at 21 °C are shown. SAXS/WAXS measurements were triggered when the Na2SO4 solution was injected (~15 s) into the CaCl2 solution and thus the first patterns show scattering from the solution followed by a rapid increase in intensity and the formation of scattering features evidenced through I(q) q−1 for q > ~1.0 nm−1 and I(q) q0 for q < ~1.0 nm−1 (Figure 3d). Almost simultaneously with their formation, these primary species start to aggregate forming larger scattering features (denoted by an increase of the intensity at q < ~1.0 nm−1 leading to I(q) q−4 (orange arrow Figure 2a). Eventually, after ~140 s the primary particles start to grow/rearrange (green arrow Figure 2a). This moment coincides with the appearance of the first diffraction peaks in the WAXS patterns, and thus the formation of gypsum. For the experiments at 4 °C no proper SAXS analysis was possible, due to technical problems with the background subtraction and data normalization.
For the experiments with additives, i.e., 75 mmol·L−1 CaSO4 + citric acid/Mg2+ at 21 °C, the general precipitation pathway described above remains valid (Figure 3b,c), but some noteworthy differences exist with respect to the additive free experiments. Figure 2e shows the scattering pattern for the three different types of 75 mmol·L−1 solutions at 30 s. At these early stages we already observe a small increase in intensity at q > 0.3 nm−1 indicating the onset of the aggregation processes. However, because the increase was rather minor we obtained the best fit using a cylindrical form factor [12], from which the following geometrical parameters were extracted for the primary species: pure 75 mmol·L−1 CaSO4, R = 0.22 nm and L = 2.55 nm; 75 mmol·L−1 CaSO4 + Mg2+, R = 0.24 nm and L = 2.03 nm; 75 mmol·L−1 CaSO4 + citric acid, R = 0.26 nm and L = 2.45 nm. Since a similar size of the primary species was obtained for all conditions, we can use direct extrapolation of the scaling parameter of the form factor (Figure 2e) towards q = 0 as an approximate indication of the volume fraction (i.e., concentration) of the primary species, assuming that the density of these particles did not change in the presence of additives. Thus, the higher the intensity of the plateau I(q) ∝ q0 for 0.3 < q < ~0.4 nm−1, the more primary species are present in the solution. For precipitation in the presence of 2.6 mmol·L−1 of citric acid, the intensity of the plateau is significantly lower than in the pure case (0.0125 cm−1 vs. 0.0191 cm−1, Figure 2e). This directly indicates that fewer primary species are formed when citric acid is present in the solution. In addition, the onset of stage IV is delayed with respect to the pure case, from ~140 to ~450 s (green arrows Figure 2a,b,f). On the other hand when Mg2+ is present, we find that the intensity of the plateau I(q) ∝ q0 for q < ~1 nm−1, is considerably higher than that in the pure case (0.0274 cm−1 vs. 0.0191 cm−1, Figure 3e). Notwithstanding the higher concentration of primary species the onset of stage IV (i.e., transformation/rearrangement of the primary species) is delayed compared to the pure case (green arrows Figure 2a,c,f) from ~140 s to ~575 s.
Thus, for all the tested conditions in this study, our SAXS data indicate the presence of nanosized particles, <3 nm, prior to the formation of crystalline gypsum, conforming our previously reported results [12]. When precipitation dynamics are slower, i.e., 50 mmol·L−1 CaSO4 and 12 °C, the pathway leading to gypsum formation can be divided into 4 stages as was mentioned before. While, at faster reaction rates, i.e., >12 °C and ≥50 mmol·L−1 CaSO4, the time-resolved SAXS patterns revealed that stages I to III are merged into one continuous stage, although the nanosized primary species can be recognized in the SAXS patterns until the onset of stage IV. Thus, for the range of experimental conditions explored in this work, neither temperature nor the initial CaSO4 concentration alter the intrinsic characteristics of the pathway; only the temporal persistence of the different pre-gypsum stages is a function of these parameters. Likewise, the presence of additives in the solution does also not alter the pathway. But, citric acid reduces the number of primary particles (Figure 2e), which eventually leads to a delay in the onset of stage IV (Figure 2b). This seems to indicate that the volume fraction of primary particles plays a key role in determining the induction period of gypsum formation. Contrary to citric acid, the presence of Mg2+ increases the concentration of primary species and also delays the onset of stage IV. This suggests that Mg2+ ions/complexes hamper the transformation/re-organization of the primary particles needed for the crystallization of gypsum. Despite these insights gained from our in situ experiments, the molecular mechanisms by which citric acid and Mg2+ reduce/promote primary particle formation is not clear yet, and will be the subject of a forthcoming detailed study.

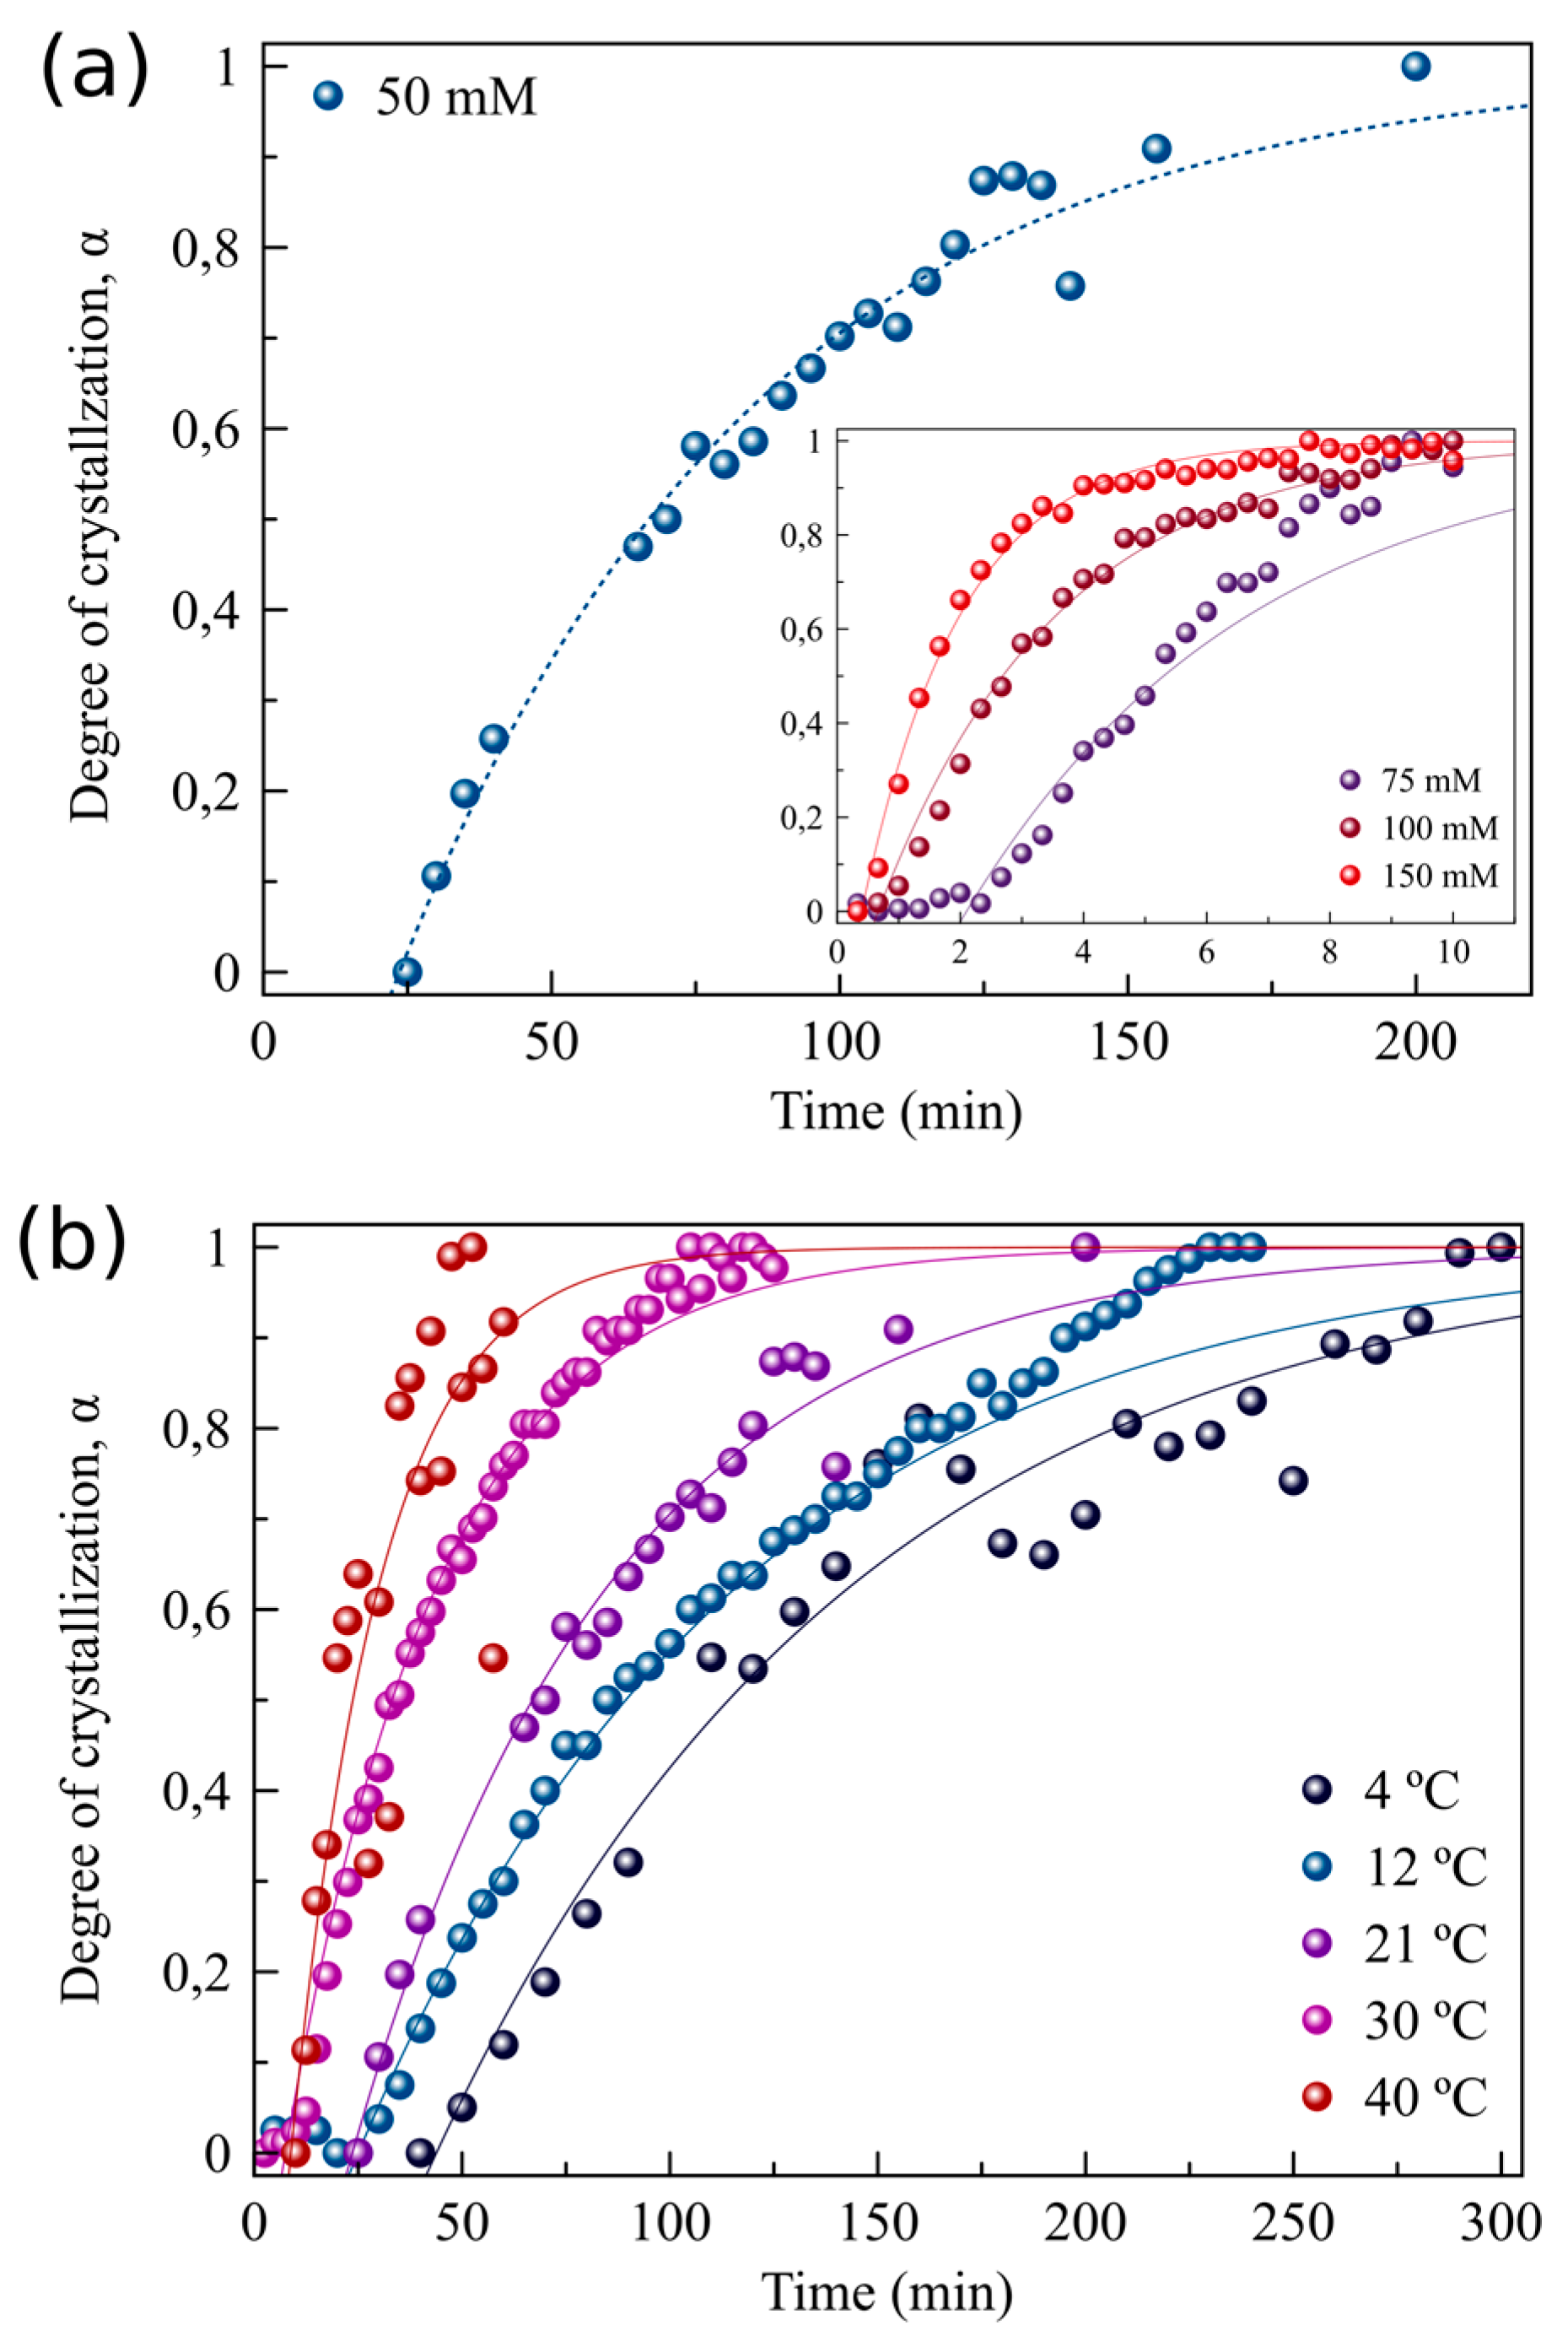
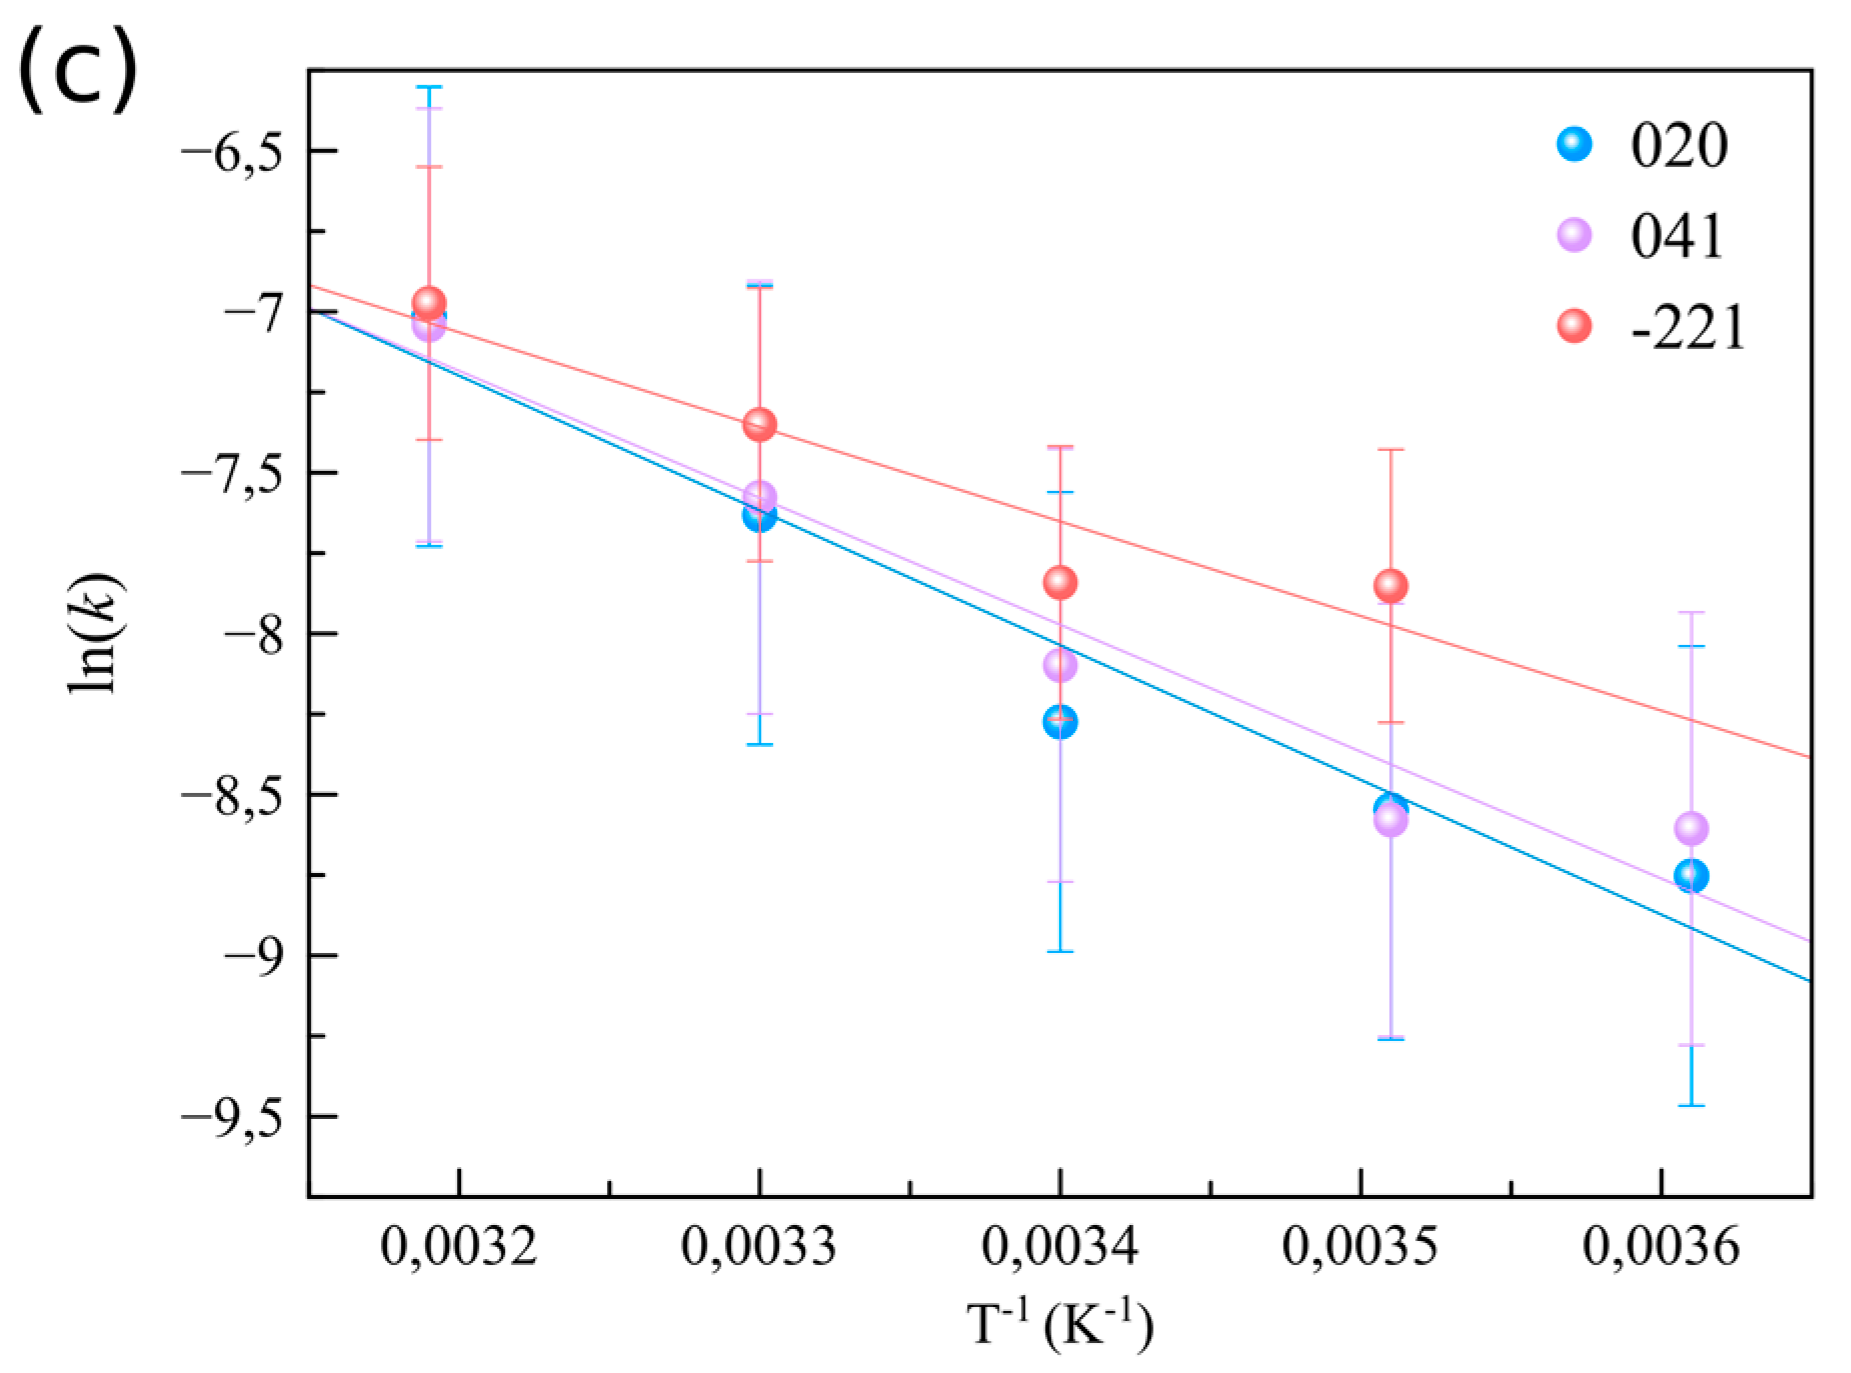
3.2. The Effect of Supersaturation and Temperature on the Crystallization Kinetics

Gypsum was the only crystalline phase that could be identified from the time-resolved WAXS patterns. Even though SAXS data indicated the presence of nanoparticles prior to the formation of gypsum as well as large aggregates of those particles (>100 nm), neither these nano-sized scatterers nor their aggregates led to any characteristic peaks in the WAXS patterns. Hence, WAXS data do not allow us to reveal the precise nature of this precursor phase. As such, the WAXS data were used to study the crystallization kinetics of gypsum as a function of (i) initial calcium sulphate concentration (from 50 to 150 mmol·L−1 CaSO4) at 21 °C and (ii) as a function of temperature (4–40 °C) for a 50 mmol·L−1 CaSO4 solution. Figure 3a shows the evolution of the normalized peak area for the (020) reflection of gypsum as a function of reaction time for different concentrations. As expected, the precipitation rate of gypsum increases with increasing CaSO4 concentration. This same trend is found for the (041) and (−221) reflections. From all three reflections the precipitation rate was derived through fitting the experimental data using Equation (1) and a summary of the results is shown in Supplementary Section S3 (Tables S3–S6).
The second series of experiments probed the precipitation kinetics of a 50 mmol·L−1 CaSO4 solution at five different temperatures (4, 12, 21, 30, and 40 °C). Figure 3b shows the evolution of the normalized peak area as a function of the reaction time for the (020) reflection. Despite the fact that the supersaturation with respect to gypsum slightly decreases with increasing temperature, from SIGp = 0.59 at 4 °C down to 0.46 at 40 °C, the precipitation rate significantly increased at higher temperatures (from 1.58 × 10⁻⁴ s−1 at 4 °C to 8.98 × 10⁻⁴ s−1 at 40 °C, Figure 3c and Figure S3, Table S3). This is also reflected in the tind for gypsum formation, which decreased with increasing temperature, from ~2000 s at 4 °C to ~200 s at 40 °C (Supplementary Section S3, Table S3).
By applying the Arrhenius equation (Equation (2)) the effective activation energies, EA, for gypsum crystallization were determined considering the reaction rates k obtained from the three main gypsum reflections, (020), (041) and (−221), observed in the WAXS patterns. The resulting effective EA for gypsum crystallization ranged between ~25–35 kJ·mol−1, depending on the reflection of gypsum chosen for its calculation (Figure 3c and Supplementary Section S4). These values are approximately half of the previously reported activation energies determined by different methods (Table 2). Previous studies mainly used seeded experiments, monitoring the growth of micrometer-sized crystal seeds, where growth was controlled by the advancement of single steps on the different faces due to ion-by-ion addition to kink sites. In our study growth kinetics were recorded from the very beginning of the formation of gypsum, which, based on our SAXS data, are formed by the transformation/re-organization of primary particles in the already existing aggregates. It is generally assumed that desolvation/rearrangement of water molecules is the dominant barrier upon incorporation of ions into a crystal (e.g., [24]). Hence, if we take into account that the reorganization/transformation of the precursor phase is dominant during the early stages of gypsum growth, and that the ions inside of this precursor phase are already partially desolvated, compared to dissolved ions, it follows that during the early stages the activation barrier for growth should be lower than during the latter stages of gypsum growth that will be controlled by the attachment rate of fully solvated Ca2+ and SO42– ions. This hypothesis is supported by the activation energy obtained from in situ measurements of the advancement rate of steps on the {010} face of gypsum. This study showed that steps grow by the incorporation of ions and resulted in an effective activation barrier of ~70 kJ·mol−1 [25]. A similar observation was made for the growth of the {120} face [26], leading to an effective barrier of ~55–63 kJ·mol−1.

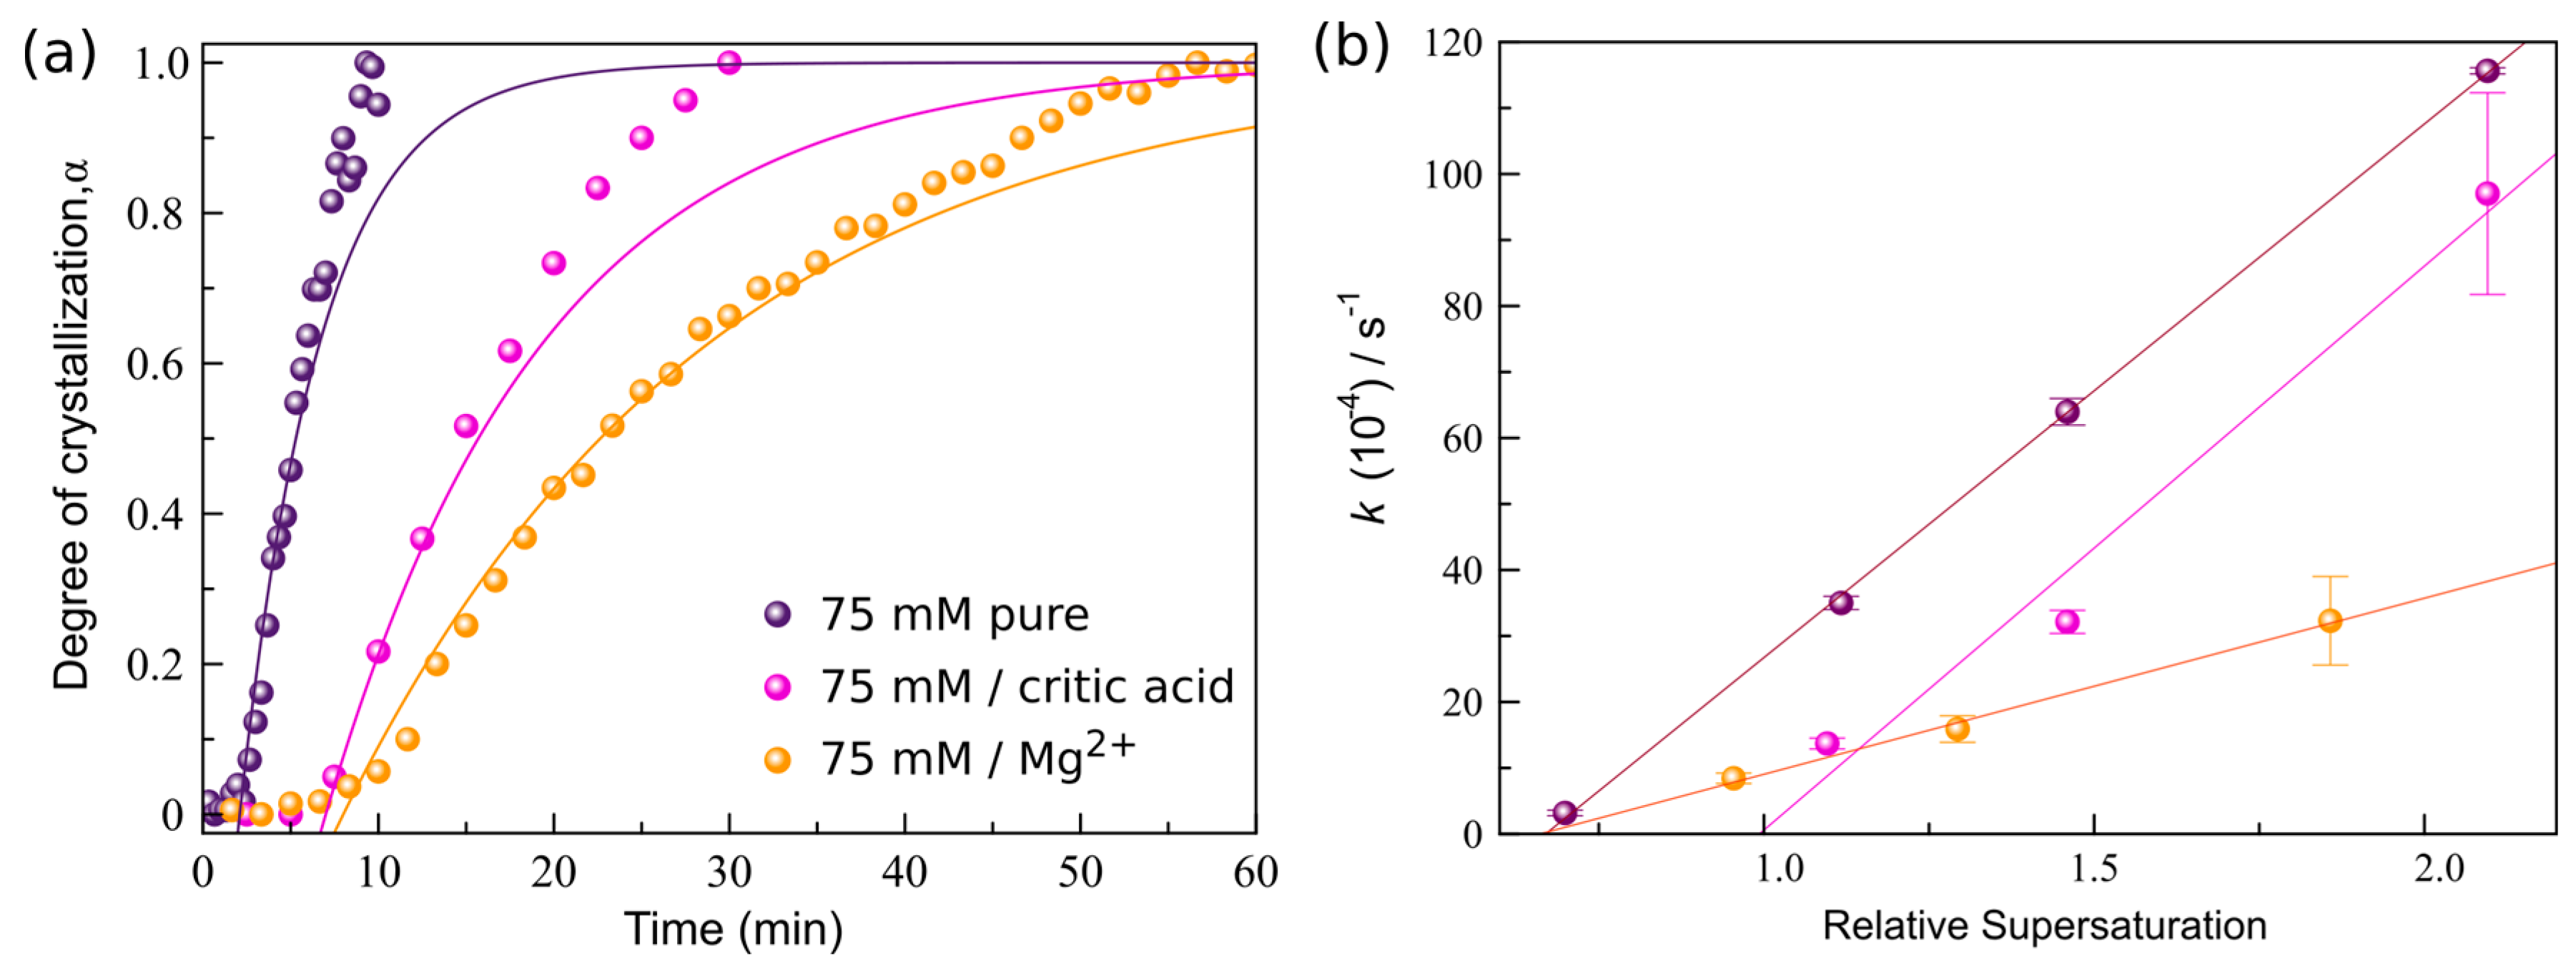
3.3. Crystallization Kinetics in the Presence of Additives

We extended our study also to explore the precipitation kinetics of gypsum in the presence of two additives at 21 °C: citric acid (2.6 mmol·L−1, 75 to 150 mmol·L−1 CaSO4) and Mg2+ (75 to 150 mmol·L−1 Mg2+ for 75 to 150 mmol·L−1 CaSO4). In Figure 4a the evolution of the normalized peak area α of the (020) reflection of gypsum is plotted for the three experimental conditions. Both additives significantly slowed down the formation of gypsum, which is evidenced by the lower reaction rates (Figure 4b) and the longer induction times (Figure 3f) for all studied supersaturations (SIGyp was calculated taking into account the additives, Table 1).
The plot of k versus SIGyp (Figure 4b) indicates that the effect of Mg2+ on the reaction rate was more pronounced than that of citric acid. For all precipitation scenarios the dependence of the reaction rate on supersaturation is reasonably well fitted using a linear dependence (Figure 4b). From those fits, different trends for each additive can be inferred:
(I) In the case of citric acid, the slope of the linear fit remains constant with respect to that of the pure case, but the intersection at k = 0 is shifted to a significantly higher relative supersaturation value ~1.0. These very similar slopes indicate that citrate does not reduce the growth kinetics of gypsum through directly impeding crystal growth, but rather through the lowering of the effective driving force [33]. This occurs when for example additive molecules are incorporated into the growing crystals. Typically, these molecules will distort the crystal structure and thereby increase the internal energy of the solid through an enthalpic contribution [33, and references therein]. The resulting increase in free energy is manifested as an increase in the effective solubility (Ksp) of the crystal, leading to a lower supersaturation. This will lead to a shift of the growth curves to higher equilibrium activities and the growth velocity will always remain below that of the pure system at the same supersaturation value. However, the unchanged slope of the reaction rate versus saturation index (SI) implies that there is no direct impact on the attachment kinetics at the attachment sites [33]. This is further corroborated by in situ AFM experiments performed on growing {010} faces of gypsum crystals in the presence of 2.6 mmol·L−1 citric acid. No significant change in the step morphology is observed compared to those of steps growing from a pure solution (Figure 5a,b), i.e., citrate molecules do not induce step pinning. Similar observations were made by Bosbach and Hochella [34] for Na-citrate, who did not find any pinning of growth steps on the {010} face of gypsum. They argued that the retarding effect of Na-citrate on the precipitation of gypsum is caused by the formation of complexes between the –COO groups and the Ca2+ present in solution. But based on PHREEQC calculation this complexation is only minor for citric acid and cannot account for the observed reduction in the growth rate (in Figure 4b, supersaturation was calculated taking into account this complexation).
(II) For the Mg2+ experiments, the slope of the reaction rate dependence on supersaturation is strongly reduced compared to that of the pure case, but the intersection at k = 0 occurs at roughly the same value (relative supersaturation ~0.35, supersaturation was calculated based on the Ksp of gypsum in the presence of Mg2+). This pronounced change in the slope indicates that Mg2+ ions/complexes lower the growth kinetics of gypsum, probably through the temporarily blocking of kink sites (e.g., [33]). From IC analyses (Supplementary Section S5) it can be inferred that no significant quantities of Mg2+ are removed from solution during gypsum precipitation, and thus but Mg2+ does not get incorporated into the crystal structure. This is further corroborated by a previous work, which studied the induction times of gypsum formation in the presence of different ions, and showed that Mg2+ only adsorbs to the newly forming surfaces of the growing gypsum crystals [35]. In situ AFM observations show that the presence of Mg2+ ions in the solution does not change the morphology of step on growing {010} faces of gypsum compared to the those formed in pure solutions (Figure 5a,c). This also concurs with the hypothesis that these ions mainly block kink sites (for kink blocking no obvious step pinning is expected (e.g., [33])).

4. Concluding Remarks

Our SAXS data confirm the presence of precursor CaSO4 species in supersaturated gypsum solutions, which aggregate and eventually transform/re-organize leading to the formation of gypsum for a broad range of supersaturations and temperatures. These experimental observations demonstrate the generality of our previously reported nucleation pathway [12]. Moreover, simultaneously collected WAXS data indicate that the reaction rate for the precipitation of gypsum increases with increasing supersaturation and temperature. The estimated activation energy for gypsum precipitation from solution accounts for ~30 kJ·mol−1. This value is lower than previously reported values and seems to indicate that gypsum growth during the early stages is partially controlled by a particle-based mechanism. During the latter stages ion-by-ion addition would then become the dominant mechanism.
Importantly, in this work we have also shown that two types of additives, Mg2+ and citric acid, increase and decreases, respectively, the concentration of precursor particles through which the formation of gypsum is delayed. Both additives also influenced the growth of gypsum: Mg2+ hampered crystal growth most likely by directly blocking kink sites, while citric acid seems to reduce the effective supersaturation during gypsum growth. But, despite the insights obtained on the role of additives during gypsum precipitation in this work, the precise molecular retardation mechanisms of these additives are still unclear and further experiments are warranted.

Supplementary Materials

The following are available online at www.mdpi.com/2075-163X/7/8/140/s1, Figure S1: Diffraction patterns of commercial gypsum (gray) used as standard, together with a diffraction pattern (blue) of the solid phase formed from a 50 mmol·L−1 CaSO4 solution at 21 °C after 3.3 h of reaction. The analyzed reflections of gypsum (black; pattern PDF2: 33–311) are indicated, Figure S2: Relation between peak broadening and crystallite size for two of the main reflections of gypsum; (020) at 2θ = 11.59°, and (021) at 2θ = 20.72°. The variations in the slope (°/nm) of these curves with increasing crystallite size are also indicated (in red). Figure S3: Variation in the concentration of Ca2+ and Mg2+ ions analyzed by IC (dots), during the off-line precipitation from a 50 mmol·L1 CaSO4 solution at 21 °C, Table S1: Estimation of the approximate errors associated to crystallite sizes from 10 to 85 nm, Table S2: Estimation of the crystallite size for the (020) reflection of gypsum, Table S3: 50 mmol·L1 CaSO4·2H2O. Precipitation from pure aqueous solution, Table S4: 75 mmol·L1 CaSO4·2H2O, at 21 °C. Precipitation in pure aqueous solution and in presence of additives in solution, Table S5: 100 mmol·L1 CaSO4·2H2O, at 21 °C. Precipitation in pure aqueous solution and in presence of additives in solution, Table S6: 150 mmol·L1 CaSO4·2H2O, at 21 °C. Precipitation from a pure solution and in the presence of additives.

Acknowledgments

This work has been carried out within the framework of the project CGL2010-16882 of the Spanish MINECO. Mercedes Ossorio acknowledges the JAE-Predoc fellowship. This work was partially supported by a Marie Curie grant from the European Commission in the framework of the MINSC ITN (Initial Training Research network), Project No. 290040. We thank Diamond Light Source for access to beamline I22 through a grant to Liane G. Benning, Alexander E.S. Van Driessche, Mercedes Ossorio and Juan Diego Rodríguez-Blanco This research was partially made possible by Marie Curie grant from the European Commission in the framework of NanoSiAl Individual Fellowship, Project No. 703015 to Tomasz Stawski. Tomasz Stawski and Liane G. Benning also acknowledge the financial support of the Helmholtz Recruiting Initiative. Mike Sleutel acknowledges financial support by the FWO under project G0H5316N.

Author Contributions

A.E.S.V.D., L.G.B. and J.M.G.-R. conceived and designed the experiments; M.O., J.D.R.-B., M.S., A.E.S.V.D. and L.G.B. performed the experiments; M.O. and T.M.S. analyzed the data; M.O., A.E.S.V.D. and T.M.S. wrote the paper; all authors discussed the results and commented on the manuscript.

Conflicts of Interest

The authors declare no conflict of interest.

References

  1. Warren, J.K. Evaporites: Sediments, Resources and Hydrocarbons; Springer: Berlin, Germany, 2006. [Google Scholar]
  2. Sharpe, R.; Cork, G. Gypsum and Anhydrite. In Industrial Minerals & Rocks, 7th ed.; Kogel, J.E., Ed.; Society for Mining, Metallurgy and Exploration Inc.: Englewood, CO, USA, 2006; p. 519. [Google Scholar]
  3. Stumm, W.; Morgan, J.J. Aquatic Chemistry: Chemical Equilibria and Rates in Natural Waters, 3rd ed.; Wiley: New York, NY, USA, 1995. [Google Scholar]
  4. Mi, B.; Elimelech, M. Gypsum scaling and cleaning in forward osmosis: Measurements and mechanisms. Environ. Sci. Technol. 2010, 44, 2022–2028. [Google Scholar] [CrossRef] [PubMed]
  5. Van Driessche, A.E.S.; Stawski, T.M.; Benning, L.G.; Kellermeier, M. New Perspectives on Mineral Nucleation and Growth; Van Driessche, A.E.S., Kellermeier, M., Benning, L.G., Gebauer, D., Eds.; Springer: Berlin, Germany, 2017; pp. 227–256. [Google Scholar]
  6. Singh, N.B.; Middendorf, B. Calcium sulphate hemihydrate hydration leading to gypsum crystallization Prog. Cryst. Growth Charact. Mater. 2007, 53, 57–77. [Google Scholar] [CrossRef]
  7. Wang, Y.W.; Kim, Y.Y.; Christenson, H.K.; Meldrum, F.C. A new precipitation pathway for calcium sulfate dihydrate (gypsum) via amorphous and hemihydrate intermediates. Chem. Commun. 2012, 48, 504–506. [Google Scholar] [CrossRef] [PubMed]
  8. Van Driessche, A.E.S.; Benning, L.G.; Rodríguez-Blanco, J.D.; Ossorio, M.; Bots, P.; García-Ruiz, J.M. The Role and Implications of Bassanite as a Stable Precursor Phase to Gypsum Precipitation. Science 2012, 336, 69–72. [Google Scholar] [CrossRef] [PubMed]
  9. Jones, F. Infrared investigation of barite and gypsum crystallization: Evidence for an amorphous to crystalline transition. Cryst. Eng. Commun. 2012, 14, 8374–8381. [Google Scholar] [CrossRef]
  10. Saha, A.; Lee, J.; Pancera, S.M.; Bräeu, M.F.; Kempter, A.; Tripathi, A.; Bose, A. New Insights into the transformation of calcium sulfate hemihydrate to gypsum using time-resolved cryogenic transmission electron microscopy. Langmuir 2012, 28, 11182–11187. [Google Scholar] [CrossRef] [PubMed]
  11. Stawski, T.M.; Benning, L.G. SAXS in Inorganic and Bioispired Research. Methods Enzymol. 2013, 532, 95–127. [Google Scholar] [PubMed]
  12. Stawski, T.M.; Van Driessche, A.E.S.; Ossorio, M.; Rodriguez-Blanco, J.D.; Besselink, R.; Benning, L.G. Formation of calcium sulfate through the aggregation of sub-3 nanometre primary species. Nat. Commun. 2016, 7, 11177. [Google Scholar] [CrossRef] [PubMed]
  13. Tadros, M.E.; Mayes, I.J. Linear growth rates of calcium sulfate dihydrate crystals in the presence of additives. J. Colloid Interf. Sci. 1979, 72, 245–254. [Google Scholar] [CrossRef]
  14. Prisciandaro, M.; Lancia, A.; Musmarra, D. The Retarding Effect of Citric Acid on Calcium Sulfate Nucleation Kinetics. Ind. Eng. Chem. Res. 2003, 42, 6647–6652. [Google Scholar] [CrossRef]
  15. Parkhurst, D.L.; Appelo, C.A.J. User’s Guide to PHREEQC: A Computer Program for Speciation, Reaction-Path, 1D-Transport, and Inverse Geochemical Calculations; Water-Resources Investigations Report 99-4259; U.S. Geological Survey: Denver, CO, USA, 1999.
  16. Huang, T.C.; Toraya, H.; Blanton, T.N.; Wu, Y. X-ray Powder Diffraction Analysis of Silver Behenate, a Possible Low-Angle Diffraction Standard. J. Appl. Crystallogr. 1993, 26, 180–184. [Google Scholar] [CrossRef]
  17. Fratzl, P.; Misof, K.; Zizak, I.; Rapp, G.; Amenitsch, H.; Bernstorff, S. Fibrillar structure and mechanical properties of collagen. J. Struct. Biol. 1998, 122, 119–122. [Google Scholar] [CrossRef] [PubMed]
  18. Smith, A. Software Manuals for SAXS. Available online: http://confluence.diamond.ac.uk/display/SCATTERWEB/Software+Manuals+for+SAXS (accessed on 3 November 2013).
  19. Besselink, R.; Stawski, T.M.; Van Driessche, A.E.S.; Benning, L.G. Not just fractal surfaces, but surface fractal aggregates: Derivation of the expression for the structure factor and its applications. J. Chem. Phys. 2016, 145, 211908. [Google Scholar] [CrossRef]
  20. Cheary, R.W.; Coelho, A.A. Programs XFIT and FOURYA, Deposited in CCP14 Powder Diffraction Library; Engineering and Physical Sciences Research Council: Swindon, UK; Daresbury Laboratory: Warrington, UK, 1996. [Google Scholar]
  21. Yee, N.; Shaw, S.; Benning, L.G.; Nguyen, T.H. The rate of ferrihydrite transformation to goethite via the Fe (II) pathway. Am. Mineral. 2006, 91, 92–96. [Google Scholar] [CrossRef]
  22. Wang, F.; Richards, V.N.; Shields, S.P.; Buhro, W.E. Kinetics and Mechanisms of Aggregative Nanocrystal Growth. Chem. Mat. 2014, 26, 5–21. [Google Scholar] [CrossRef]
  23. Liebrecht, L.J.H. Sol-Gel Derived Barium Titanate Thin Films. Maste’s Thesis, University of Twente, Enschede, The Netherlands, 2006. [Google Scholar]
  24. Chernov, A.A. Modern Crystallography III, Crystal Growth; Springer: Berlin, Germany, 1984. [Google Scholar]
  25. Van Driessche, A.E.S.; García-Ruiz, J.M.; Delgado-López, J.M.; Sazaki, G. In Situ Observation of Step Dynamics on Gypsum Crystals. Cryst. Growth Des. 2010, 10, 3909–3916. [Google Scholar] [CrossRef]
  26. Linnikov, O.D. Investigation of the initial period of sulphate scale formation Part 2. Kinetics of calcium sulphate crystal growth at its crystallization on a heat-exchange surface. Desalination 2000, 128, 35–46. [Google Scholar] [CrossRef]
  27. Liu, S.; Nancollas, G.H. The kinetics of crystal growth of calcium sulfate dihydrate. J. Cryst. Growth 1970, 6, 281–289. [Google Scholar] [CrossRef]
  28. Smith, B.R.; Sweett, F. The crystallization of calcium sulfate dehydrate. J. Colloid Interf. Sci. 1971, 37, 612–618. [Google Scholar] [CrossRef]
  29. Nancollas, G.H.; Reddy, M.M.; Tsai, F. Calcium sulfate dihydrate crystal growth in aqueous solution at elevated temperatures. J. Cryst. Growth 1973, 20, 125–134. [Google Scholar] [CrossRef]
  30. Witkamp, G.J.; Van der Eerden, J.P.; Van Rosmalen, G.M. Growth of gypsum: I. Kinetics. J. Cryst. Growth 1990, 120, 281–289. [Google Scholar] [CrossRef]
  31. Klepetsanis, P.G.; Koutsoukos, P.G. Spontaneous precipitation of calcium sulfate at conditions of sustained supersaturation. J. Colloid Interf. Sci. 1991, 143, 299–308. [Google Scholar] [CrossRef]
  32. Klepetsanis, P.G.; Dalas, E.; Koutsoukos, P.G. Role of Temperature in the Spontaneous Precipitation of Calcium Sulfate Dihydrate. Langmuir 1999, 15, 1534–1540. [Google Scholar] [CrossRef]
  33. De Yoreo, J.J.; Vekilov, P.G. Principles of Crystal Nucleation and Growth. Mineral. Soc. Am. 2003, 54, 57–93. [Google Scholar] [CrossRef]
  34. Bosbach, D.; Hochella, M.F. Gypsum growth in the presence of growth inhibitors: A scanning force microscopy study. Chem. Geol. 1996, 132, 227–236. [Google Scholar] [CrossRef]
  35. Rabizadeh, T.; Stawski, T.M.; Morgan, D.J.; Peacock, C.L.; Benning, L.G. The effects of inorganic additives on the nucleation and growth kinetics of calcium sulfate dihydrate crystals. Cryst. Growth Des. 2017, 17, 582–589. [Google Scholar] [CrossRef]
Figure 1. Experimental setup employed in synchrotron facility.
Minerals 07 00140 g001
Figure 2. Time-resolved SAXS patterns during gypsum precipitation at 21 °C from: (a) a 75 mmol·L−1 CaSO4 solution, (b) a 75 mmol·L−1 CaSO4 solution with 75 mmol·L−1 of Mg2+ and, (c) a 75 mmol·L−1 CaSO4 solution with 2.6 mmol·L−1 citric acid. Orange and green arrows indicate the onset of aggregation and transformation of primary species, respectively. (d) SAXS patterns during the mixing of 150 mmol·L−1 stock solutions of Na2SO4 and CaCl2. (e) SAXS patterns after 30 s of mixing, fitted using a cylindrical form factor [12]. (f) Induction times for gypsum formation as a function of supersaturation, for pure and additive containing solutions. The inset shows the induction time as a function of initial CaSO4 concentration.
Minerals 07 00140 g002
Figure 3. Precipitation kinetics of gypsum as function of initial CaSO4 concentration and temperature. (a) Evolution of the normalized peak area α of the (020) reflection of gypsum for 50–150 mmol·L−1 CaSO4 solutions at 21 °C, (b) α evolution for 50 mmol·L−1 CaSO4 solutions from 4 to 40 °C. Solid lines correspond to fittings of the experimental data using Equation (1). (c) ln(k) versus (1/T) for a 50 mmol·L−1 CaSO4 solution corresponding to three reflections of gypsum: (020), (041) and (−221).
Minerals 07 00140 g003aMinerals 07 00140 g003b
Figure 4. The effect of Mg2+ and citric acid on the precipitation of gypsum at 21 °C. (a) Evolution of the normalized peak area α of the (020) reflection of gypsum growth from a pure 75 mmol·L−1 CaSO4 solution (purple dots), in the presence of 75 mmol·L−1 Mg2+ (orange dots) and 2.6 mmol·L−1 citric acid (pink dots). (b) Averaged reaction rates as a function of the relative supersaturation (IAP/Ksp).
Minerals 07 00140 g004
Figure 5. In situ AFM height deflection images of steps on the {020} face of gypsum crystals growing from (a) pure 50 mmol·L−1 CaSO4 solutions, (b) 50 mmol·L−1 CaSO4 solutions with 2.6 mmol·L−1 Citric Acid and (c) 50 mmol·L−1 CaSO4 solutions with 50 mmol·L−1 Mg2+.
Minerals 07 00140 g005
Table 1. Initial solution saturation index of gypsum, SIgyp calculated with PHREEQC using the minteq.v4 database.
[CaSO4] (mmol·L−1)[Mg2+] (mmol·L−1)[C6H8O7] (mmol·L−1)T (°C)SIgyp
50 40.59
50 120.56
50 210.53
50 300.49
50 400.46
75 210.75
7575 210.67
75 2.6210.74
100 210.90
100100 210.83
100 2.6210.9
150 211.13
150150 211.05
150 2.6211.13
Table 2. An overview of activation energies EA for gypsum reported in the literature.
ReferenceEA/kJ·mol−1Observations
[27]62.8Crystallization of gypsum on the addition of seed crystals to stable supersaturated solutions was studied from 15–45 °C.
[28]62.8Conductometric study of seeded crystallization at four temperatures and several ionic compositions
[29]58.6Growth of gypsum seed crystals from supersaturated solutions from 60–105 °C.
[30]60.0A suspension of gypsum crystals was grown from electrolyte solution using the constant composition technique
[31]184.2Potentiometric measurements in supersaturated solutions of calcium sulphate.
[32]46.0–67.0The spontaneous precipitation of calcium sulphate in supersaturated solutions over the temperature range between 25.0 and 80.0 °C was investigated by monitoring the solution specific conductivity during desupersaturation.
[26]55.0–63.0Experimental data of the growth rate of the (120) face from electrolytic solutions on a heated metal surface.
[25]70.7Step kinetics on the {010} face were measured as a function of supersaturation at different temperatures
This work25.0–35.0(020) EA = 35.2 ± 0.6 kJ·mol−1; (041) EA = 33.1 ± 0.6 kJ·mol−1; (−221) EA = 24.9 ± 0.7 kJ·mol−1

