One-Step Synthesis of Hydroxysodalite Using Natural Bentonite at Moderate Temperatures


1
School of National Defence Science and Technology, Southwest University of Science and Technology, Mianyang 621010, Sichuan, China
2
Key Laboratory of Ministry of Education for Solid Waste Treatment and Resource Recycle, Southwest University of Science and Technology, Mianyang 621010, Sichuan, China
*
Authors to whom correspondence should be addressed.
Minerals 2018, 8(11), 521; https://doi.org/10.3390/min8110521
Submission received: 19 September 2018
/
Revised: 2 November 2018
/
Accepted: 6 November 2018
/
Published: 9 November 2018
(This article belongs to the Special Issue Nanomineralogy)
Abstract
:Ca-bentonite was used as the feedstock material for the synthesis of hydroxysodalite due to its high Al, Si content, good chemical reactivity, and natural abundance. A one-step method is proposed here to fabricate hydroxysodalite in a water bath at moderate temperature. The effects of the Na/Si molar ratio, Si/Al molar ratio, reaction time, and reaction temperature on the synthesis of hydroxysodalite have been systematically investigated here. The crystallizing phases and morphology of the synthetic products were characterized using X-ray diffraction (XRD) and scanning electron microscopy (SEM), respectively. The results showed that the Na/Si molar ratio and reaction temperature both played important roles in controlling the degree of crystallinity of the synthetic hydroxysodalite. The Si/Al molar ratio and reaction time both affect the purity of the synthetic hydroxysodalite. Optimum conditions for synthesizing hydroxysodalite using a one-step water-bath method at moderate temperature are as follows: a Na/Si molar ratio of 12, a Si/Al molar ratio of 1.0, a reaction temperature of 90 °C, and a reaction time of 12 h.
1. Introduction
Sodalite is a microporous tectosilicate with the chemical formula Na8[AlSiO4]6(Cl, OH, I)2·nH2O [1]. It has a framework with a cubic symmetry that is constructed from the vertex-linking of SiO4 and AlO4 tetrahedrons into four- and six-membered oxygen-rings that form β cages [2]. Owing to its framework flexibility, sodalite can accommodate anions with different geometries, leading to the formation of different types of sodalities, which are each suited to different applications [3,4].
An interesting member of the sodalite family is hydroxysodalite, a porous hydrophilic functional mineral with the same framework structure as sodalite. When inserting non-stoichiometric amounts of metal ions into the β cages, hydroxysodalite could be invoked as the photochromic material [5,6]. Due to its small aperture size (0.28 nm), hydroxysodalite can be used to separate small molecules such as helium, hydrogen and water [7]. In addition, due to its desirable antioxidation properties, moisture resistance, and chemical stability, hydroxysodalite can also serve as a substrate for catalyst carriers and membrane materials [8,9]. However, the storage of natural hydroxysodalite is quite low, and it is difficult to obtain sufficient amounts to meet the demands of industry. Therefore, the synthesis of hydroxysodalite is of great practical significance.
There are numerous literature reports on the synthesis of hydroxysodalite by a variety of different methods. Xu et al. [10] used aluminum foil and a silica sol as the raw materials to synthesize a high-quality, pure hydroxysodalite membrane via a microwave-assisted hydrothermal method. Nabavi et al. [11] obtained a hydroxysodalite membrane via a hydrothermal method using sodium aluminate and silica foam that was then used for the separation of H2/CH4. Jiang et al. [12] synthesized sub-micron crystals of hydroxysodalite from natural palygorskite clay via a two-step approach. Passos et al. [13] used kaolin as a source of aluminium and silicon to perform a hydrothermal synthesis of hydroxysodalite, and discussed the optimization of the synthesis conditions. Golbad et al. [14] employed fly ash to synthesize hydroxysodalite using a hydrothermal activation process for the removal of lead ions from water. Based on the above research, the chemical materials or organic additives that were used were not economically-viable for industrial-scale production. The use of kaolin minerals or fly ash for synthesis of hydroxysodalite requires further activation with calcination and acid activation. Therefore, it is urgent to seek a straightforward and economical method to synthesize hydroxysodalite.
Bentonite is considered to have a high potential for use as an industrial raw material due to its large-scale availability and good physicochemical characteristics [15]. Bentonite is essentially composed of Al2O3 and SiO2, in addition to other oxides such as MgO, Fe2O3, Na2O, and CaO. The relatively high Al2O3 and SiO2 content in bentonite makes it an inexpensive raw material for the synthesis of hydroxysodalite. In this paper, a one-step water-bath method at moderate temperatures was used to obtain the hydroxysodalite, and batch experiments were conducted. This research focused on evaluating how the Na/Si molar ratio, Si/Al molar ratio, reaction time, and reaction temperature each affected the synthesis of hydroxysodalite.
2. Experiments and Methods
2.1. Materials
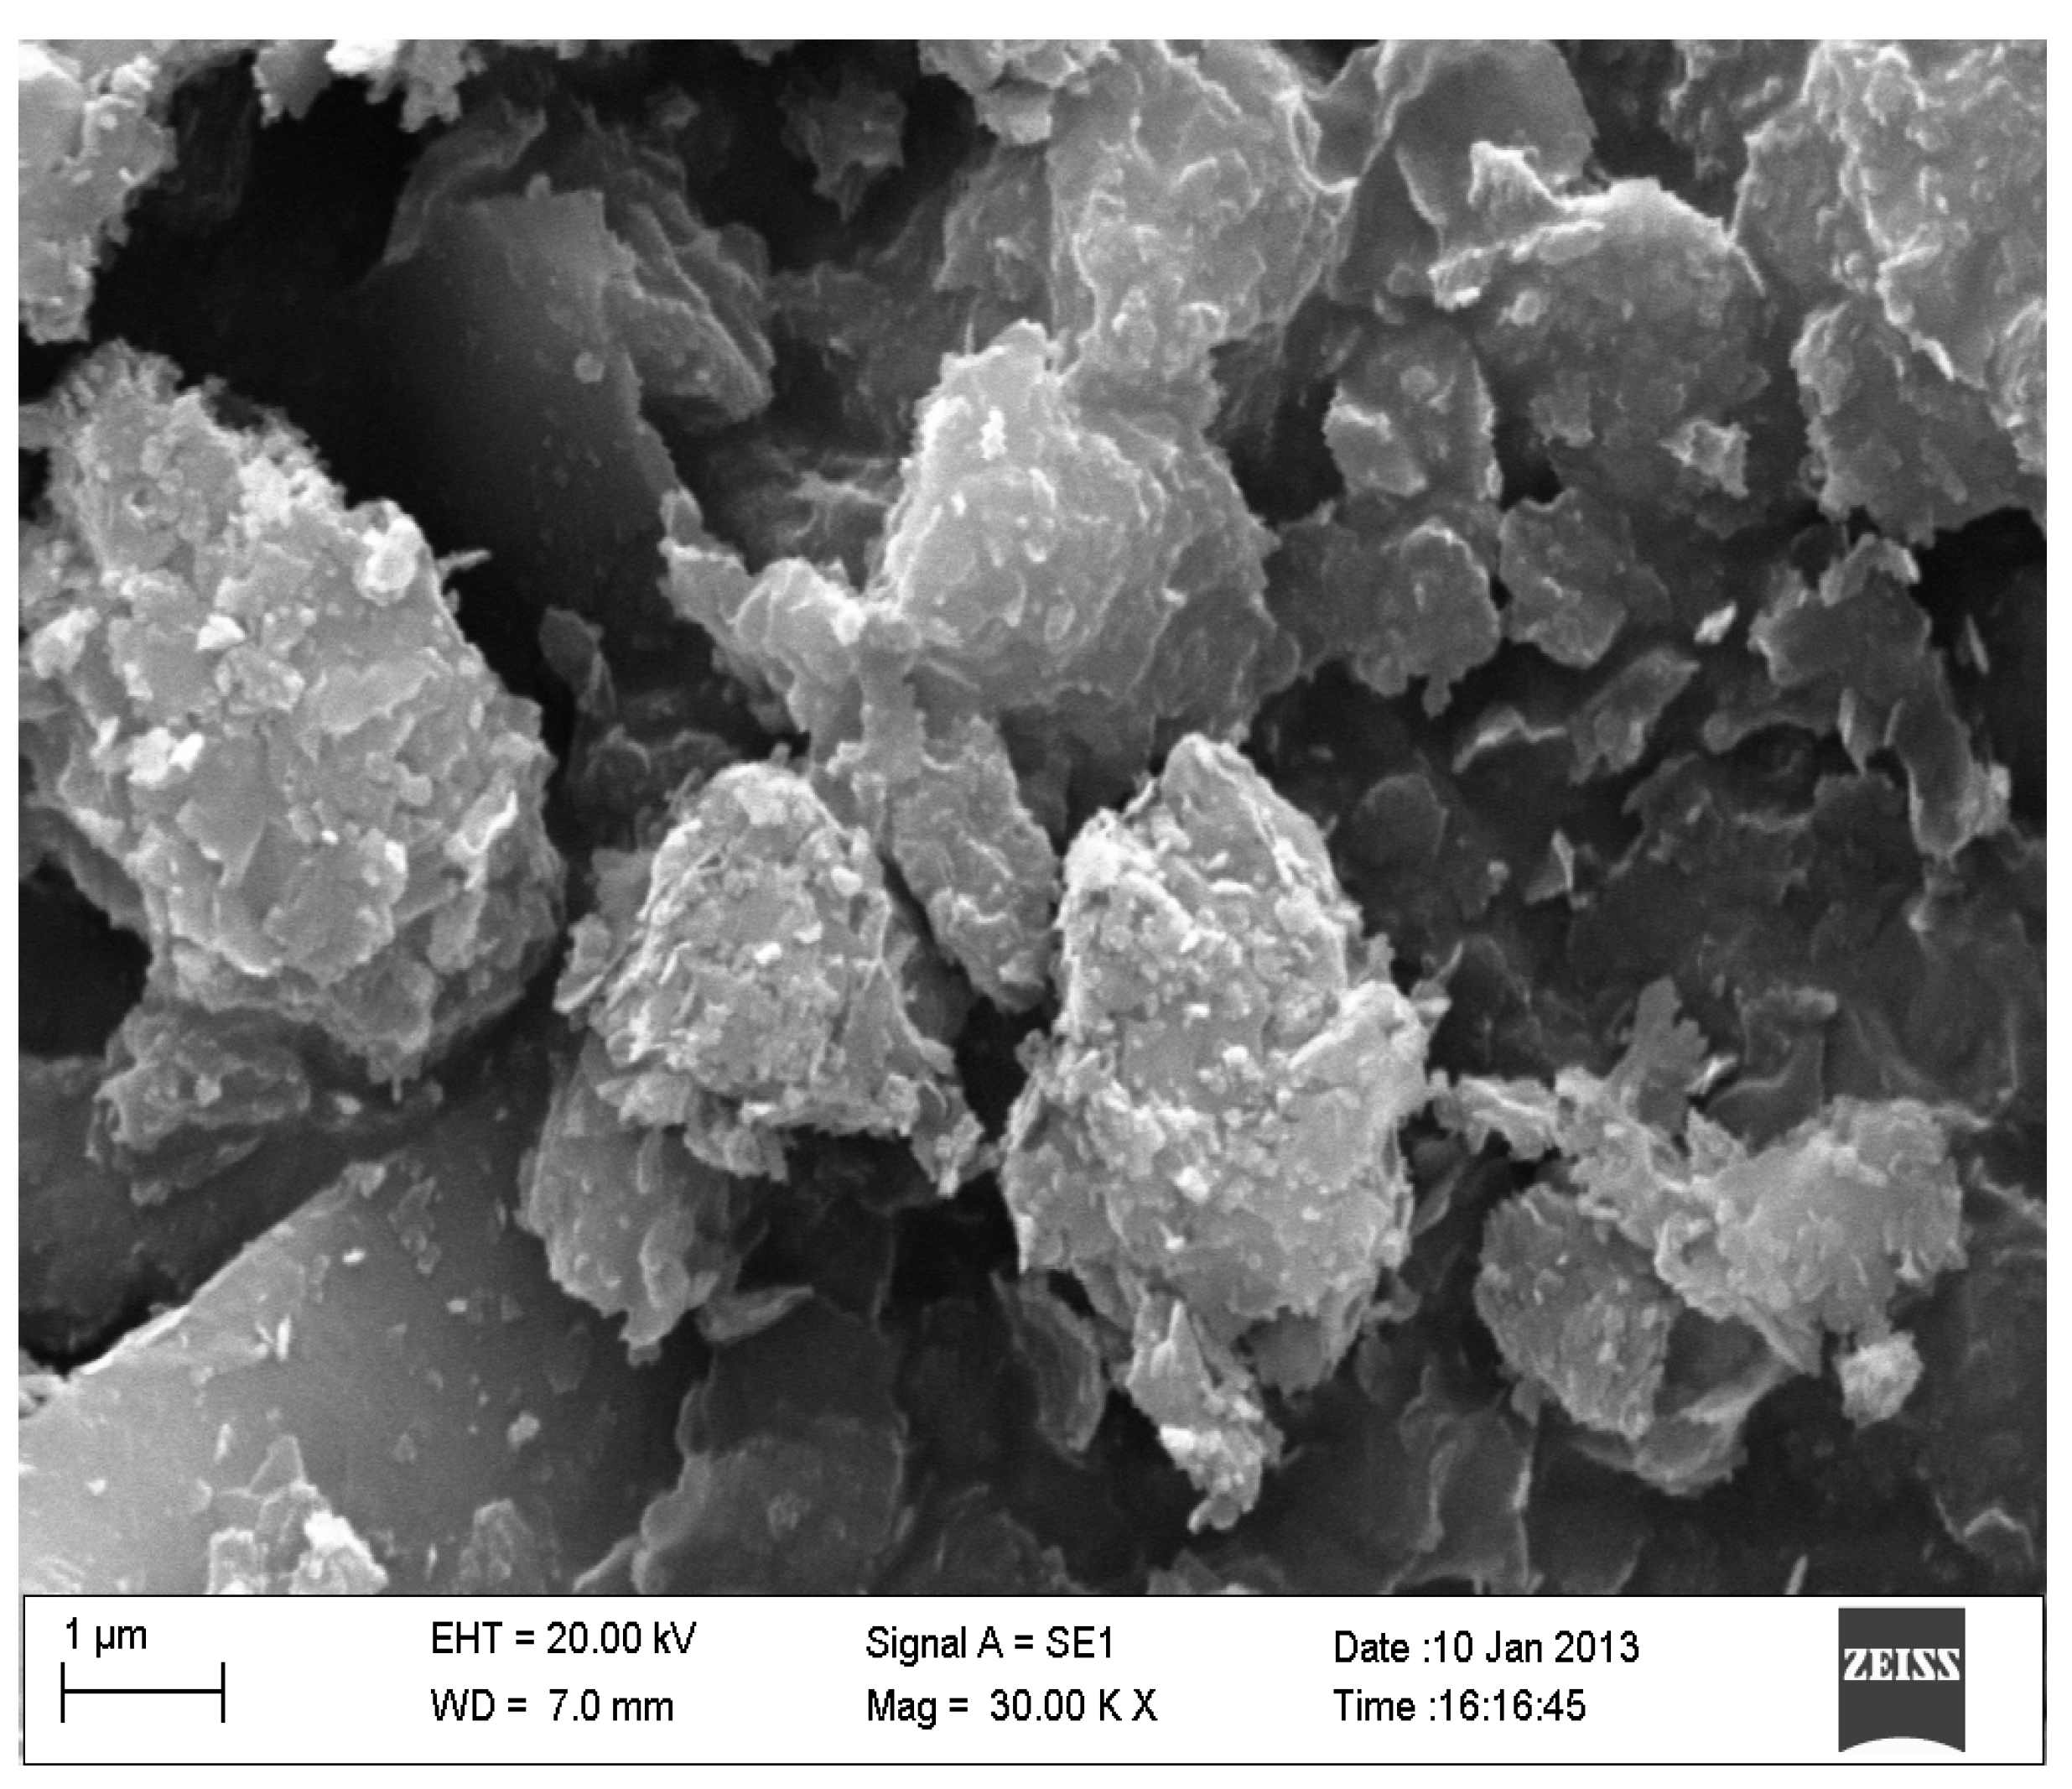
Raw bentonite collected from bentonite deposits in the city of Fuxin, China was used as a starting material for synthesis of hydroxysodalite. From the XRD pattern (Figure 1), the essential mineral components were found to be Ca-montmorillonite, cristobalite, and albite. The SEM images (Figure 2) revealed that the dominant morphological forms occurring in bentonite were primarily flake accumulations. The major oxides were found to be SiO2, Al2O3, Fe2O3, MgO, CaO, Na2O, and TiO2 and are listed in Table 1.
The bentonite samples were crushed and dried at 100 °C overnight and then ground to an average particle size less than 150 microns as determined according to the standard sieving analysis. According to the data in Table 1, the molar ratio of Si/Al in the bentonite samples is about 4.98, which is higher than that of the theoretical Si/Al molar ratio of hydroxysodalite. Therefore, additional NaAlO2 was added.
All reagents such as NaOH and NaAlO2 used for synthesis were all analytical purity and were purchased from the Chengdu Kelong Chemical Reagent Company (Chengdu, China). They were used as received without any further purification. The water used in the experiment was ultrapure water with a resistivity of 18.25 mΩ·cm.
2.2. Synthesis
Four groups of bentonite-based hydroxysodalite samples were synthesized in this work with different Na/Si molar ratios, Si/Al molar ratios, reaction times, and reaction temperatures, respectively. The hydroxysodalite was synthesized via the route shown in Figure 3. One gram of bentonite was added to 35 mL of ultrapure water. Then, certain dosages of NaOH and NaAlO2 were added to the mixture with continuous stirring for 3 h at a certain temperature, according to the synthetic scheme (Table 1). After a certain reaction time at a constant temperature, the sample was filtered and washed repeatedly with ultrapure water until the solution pH was less than 8. Finally, the washed sample was dried at 90 °C for 24 h. Each experiment was conducted in triplicate.
2.3. Characterization
X-ray diffraction (XRD) analysis of the samples was conducted using a PANalytical X’Pert PrO multifunctional powder diffractometer with an X’Celerator scintillation detector (PANalytical B.V., Almelo, The Netherlands) operating at 30 mA and 40 kV with Cu Kα radiation (λ = 0.154060 nm), with a recording range of 3–80°. The crystallinity was estimated by comparing the sum of typical characteristic peak intensities (d110 at 13.89°, d211 at 24.30°, d310 at 31.74°, d222 at 34.83°, and d330 at 43.06°) of samples and the reference hydroxysodalite synthesized with analytically pure sodium silicate and sodium aluminate. The crystallinity was calculated by Equation (1):
The chemical compositions of the sample were determined using an Axios Panalytical X-ray fluorescence (XRF) spectrometer (PANalytical B.V., Almelo, The Netherlands) fitted with an X-ray tube containing Rh anode. The maximum power of the X-ray tube was 2.4 kW, with a maximum voltage of 60 kV and a maximum current of 100 mA. The samples were prepared by mixing them with a flux material and melting into glass beads. To determine the loss on ignition (LOI), the samples were heated to 1000 °C for 3 h. The morphology of the samples was examined using a ZEISS Ultra 55 scanning electron microscope (SEM). Prior to SEM analysis, the surface of the samples was sputtered with gold. The thermal analysis (TG) of the materials was performed using a TA SDT-Q6000 thermal analyzer by flowing nitrogen and heating sample from room temperature to 1000 °C at a ramp rate of 10 °C/min. Raman spectra were obtained using a RM 2000 Renishaw InVia Raman spectrometer with a scanning range of 1000–4000 cm−1. Fourier transform infrared (FTIR) spectra were obtained using a Nicolet-5700 Fourier transform infrared spectrometer. The KBr pellet compression method was used, and the scanning range was 400–4000 cm−1.
3. Results and Discussion
3.1. Effect of Na/Si Molar Ratio
To determine the influence of the Na/Si molar ratio on the synthesis of hydroxysodalite, the Si/Al molar ratio was chosen to be 1.0 at a reaction temperature of 90 °C, and a reaction time of 12 h. The XRD patterns of the obtained samples and the crystallinity of hydroxysodalite are shown in Figure 4 and Figure 5, respectively.
Due to the fixed Si/Al molar ratio and water content, the Na/Si molar ratio was modified by adding different amounts of NaOH (Table 2). Therefore, the Na/Si molar ratio also represents the alkalinity of the reaction system, which influenced the activation of bentonite and controlled the polymerization of SiO4 and AlO4 monomer in the reaction system [16,17,18]. When the Na/Si molar ratio was 3, the diffraction peaks of Ca-montmorillonite, cristobalite, and albite in bentonite were remarkably reduced, and the main crystalline phase in the product was 4A zeolite. 4A zeolite was a type of crystalline aluminosilicate with uniform micro-channels and it had a pore size of 4 Å [19]. The pore framework of 4A zeolite was composed of sodalite cages and Na+, which was used to compensate the negative charge of the skeleton [20,21]. When the Na/Si molar ratio was increased to 6, the diffraction peaks of hydroxysodalite appeared. Further increasing the Na/Si molar ratio to 10, hydroxysodalite became the predominant phase in the obtained sample, indicating that 4A zeolite was transformed to hydroxysodalite as the amount of NaOH increased, which can be ascribed to the high structural stability and framework density. When the Na/Si molar ratio reached 12, the diffraction peaks of 4A zeolite vanished, and only the diffraction peaks of hydroxysodalite were observed, indicating that the strong alkalinity was helpful for the formation of hydroxysodalite. As shown in Figure 5, the crystallinity of hydroxysodalite was gradually increased as the Na/Si molar ratio increased, which is similar to a result reported by Hu et al. [6].
Figure 6 displays the SEM images of the products synthesized under different Na/Si molar ratios. As shown in Figure 6a, the morphology of the products synthesized under a Na/Si molar ratio of 3 was mainly composed of cubes with a particle size of 1–2 μm, which conformed to the crystal structure of 4A zeolite. The generation of 4A zeolite was attributed to the dissolution of the bentonite and the polymerization of SiO4 and AlO4 monomers which occurred under the weakly alkaline conditions [22]. When the Na/Si molar ratio reached 6, some spherical agglomerates of hydroxysodalite started to form on the surface of the 4A zeolite, as shown in Figure 6b, which was in agreement with XRD results. Notably, when the Na/Si molar ratio reached 10, spherical agglomerates with less imperfect cubes appeared, as shown in Figure 6c, suggesting that the main phase of the product was hydroxysodalite, with similar trends having been reported in the literature [23,24]. By further increasing the Na/Si molar ratio to 12, nearly all of the pseudo-cubic grains of 4A zeolite were destroyed, and only spherical agglomerates appeared (Figure 6d). Fan et al. [25] reported that nano-sized hydroxysodalite crystals could be synthesized at high NaOH concentrations in the absence of organic additives. Based on the aforementioned analysis, it was considered that low alkalinity was not conducive to the crystallinity of hydroxysodalite, and high alkalinity could promote the transformation of 4A zeolite (metastable phase) into hydroxysodalite (stable phase). Therefore, relatively pure hydroxysodalite could be synthesized when the Na/Si molar ratio was fixed to 12.
3.2. Effect of Si/Al Molar Ratio
As indicated by the XRD patterns of the synthetic products with different Si/Al molar ratios in Figure 7, hydroxysodalite could be synthesized when the Si/Al molar ratio was 0.5 or 0.75. However, an obvious 4A zeolite phase was detected, which indicated that the synthesized products from bentonite were a mixture of 4A zeolite and hydroxysodalite. When the Si/Al molar ratio reached the ratio of theoretical hydroxysodalite (Si/Al = 1), the diffraction peaks of 4A zeolite disappeared, and hydroxysodalite became the predominant phase in the synthetic products. Hydroxysodalite could be also synthesized by further increasing Si/Al molar ratio to 1.5, but a small number of diffraction peaks from 4A zeolite was detected, suggesting that high Si/Al molar ratios were unfavorable for the crystalline phase of hydroxysodalite. The crystallinity of the synthetic products in Figure 8 showed that the crystallinity of the prepared hydroxysodalite reached the optimal yield of around 72.1% with a Si/Al molar ratio of 1.0.
Figure 9 presents the SEM images of the synthetic products obtained from different Si/Al molar ratios. When the Si/Al molar ratio was 0.5, the synthetic product exhibited both pseudo-cubic agglomerates (4A zeolite phase) and small spherical agglomerates (hydroxysodalite), shown in Figure 9a, which is in agreement with XRD results (Figure 7). When the Si/Al molar ratio reached 0.75, pseudo-cubic agglomerates were collapsed and decreased with the addition of the spherical agglomerates. By further increasing the Si/Al molar ratio to 1.0, most of the pseudo-cubic 4A zeolite was converted to hydroxysodalite with a spherical morphology (Figure 9c). However, when the Si/Al molar ratio exceeded 1, the spherical particle agglomerates of hydroxysodalite were not uniform, indicating a lower crystallinity of hydroxysodalite, which is also confirmed by the crystallinity results shown in Figure 8.
3.3. Effect of Reaction Temperature
The reaction temperature has a strong influence on the nucleation and the crystal growth process of hydroxysodalite [26]. To determine the influence of temperature, individual synthetic experiments were run at 60, 70, 80, 90, and 100 °C, respectively. The Na/Si molar ratio was chosen to be 12, at a reaction time of 12 h, and the Si/Al molar ratio was chosen to be 1.0. The XRD patterns of the synthetic products obtained from reactions run at these different temperatures are displayed in Figure 10.
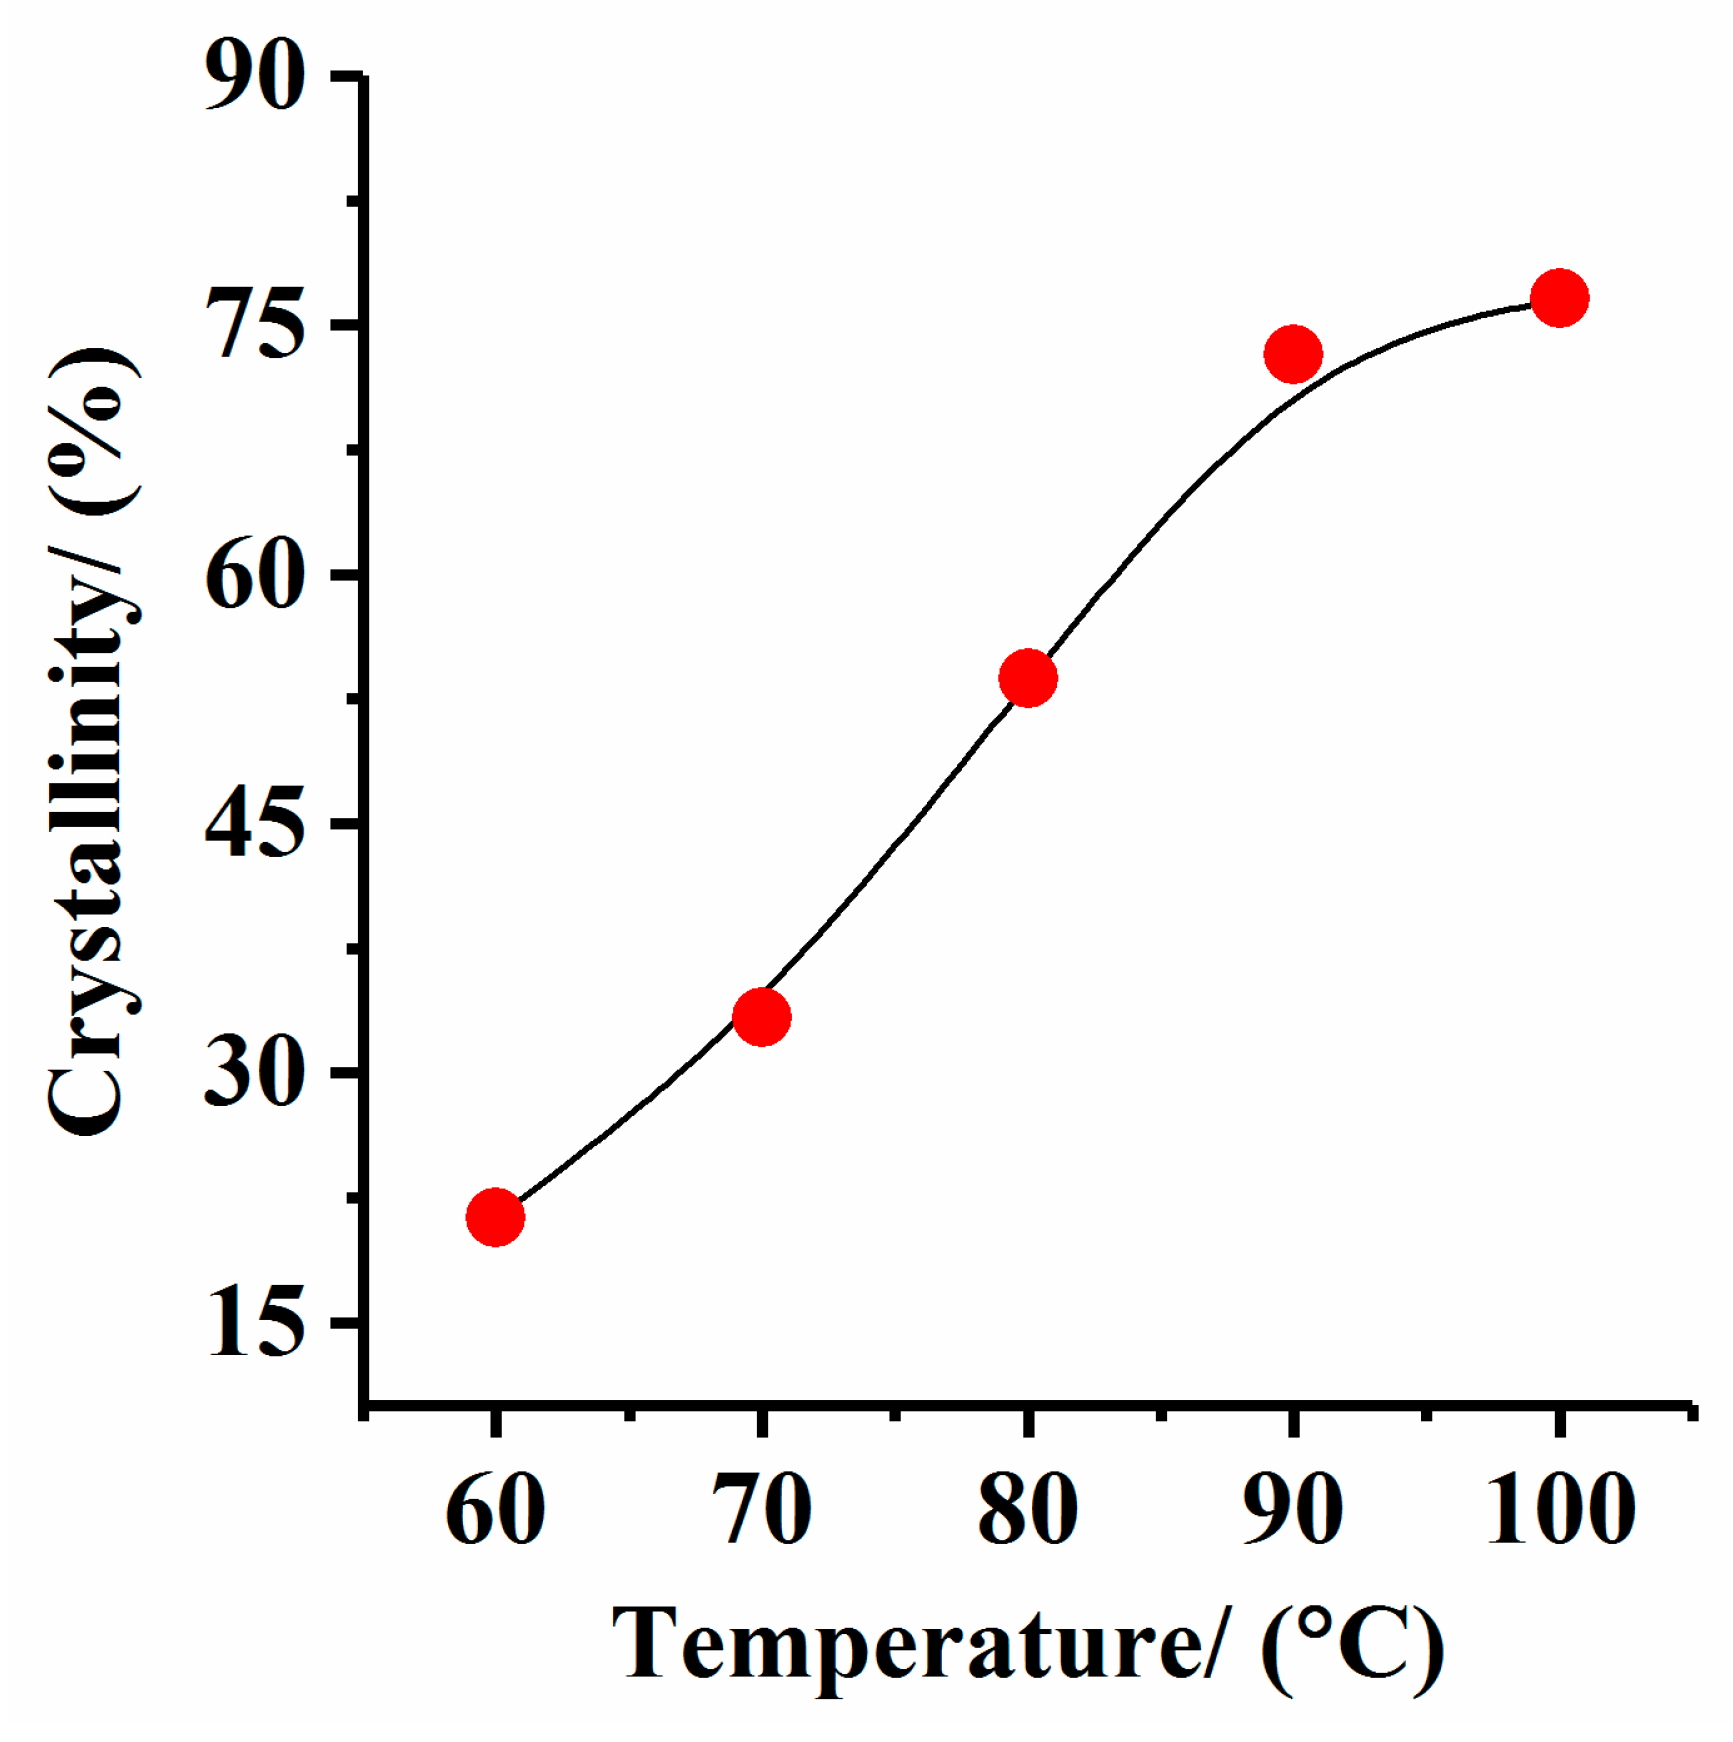
As shown in Figure 10, a well-crystallized 4A zeolite was formed when the reaction temperature was 60 °C. With an increase of temperature, the intensity of the diffraction peaks of hydroxysodalite gradually increased, which agrees with a similar result reported by Li et al. [27]. Increasing the temperature to 90 °C caused the diffraction peaks of 4A zeolite to vanish, leaving only the diffraction peaks of hydroxysodalite, suggesting that relatively pure hydroxysodalite was prepared at this temperature. In addition, the crystallinity of hydroxysodalite gradually increased as the reaction temperature increased, as shown in Figure 11. The crystallinity of the prepared hydroxysodalite reached the optimal yield with reaction temperature of 90 °C.
Figure 12 shows the SEM images of the synthetic products obtained at different reaction temperatures. When the reaction temperature was 60 °C, a greater amount of 4A zeolite with a pseudo-cubic morphology was identified in Figure 12a. As the temperature increased, the pseudo-cubic morphology was reduced, and more spherical aggregates began to appear, as shown in Figure 12b. This could be attributed to the 4A zeolite having a lower thermodynamic stability compared to hydroxysodalite, and increasing the reaction temperature appears to promote the transformation of 4A zeolite into the more thermodynamically stable hydroxysodalite [28]. Further increasing the reaction temperature to 90 °C caused the morphology of the synthetic product to exhibit uniform spherical aggregates with an average particle size of 2 μm, as shown in Figure 12d.
3.4. Effect of Reaction Time
To determine the influence of reaction time on hydroxysodalite synthesized from bentonite, the samples were synthesized with reaction times of 4, 8, 10, 12, 16, 20, and 24 h. The Na/Si molar ratio was chosen to be 12, at a reaction temperature of 90 °C, and the Si/Al molar ratio was chosen to be 1.0. The XRD patterns of the synthetic products obtained from different reaction times are displayed in Figure 13.
It was found that hydroxysodalite was the predominant crystalline phase with a small amount of the 4A zeolite phase in the product synthesized at 90 °C for 4 h. Further increasing the reaction time to 8 h, the diffraction peaks of 4A zeolite disappeared, and only diffraction peaks ascribed to hydroxysodalite remained in the XRD patterns. In addition, the crystallinity of synthetic hydroxysodalite increased as the reaction time increased (Figure 14).
Figure 15 shows the SEM images of the synthetic products obtained from the different reaction times. The final products exhibited spherical aggregates and a small amount of pseudo-cubic aggregates as shown in Figure 16a when the reaction time was 4 h. When the reaction time was prolonged, the amount of pseudo-cubic crystals decreased, along with a significant increase of spherical aggregates (Figure 15b–d), which was consistent with the XRD results. Although prolonging the reaction time could potentially further improve the crystallinity of hydroxysodalite, the optimal reaction time for synthesizing hydroxysodalite was fixed to 12 h based on economic cost.
3.5. Characterization of Hydroxysodalite in Optimum Conditions
The FTIR spectrum of hydroxysodalite is displayed in Figure 16a. The bands at 437 cm−1 and 464 cm−1 are attributed to the bending vibration of O-T-O (T = Al, Si). The bands at 664 cm−1 and 732 cm−1 are caused by the symmetric stretching of T-O-T, while the band at 989 cm−1 is caused by the antisymmetric stretching of T-O-T. The bands at 3644, 3434, 1643, and 1629 cm−1 are assigned to the stretching vibration of OH and bending vibration of water in the synthetic hydroxysodalite. This FTIR spectrum is in good agreement with previously-reported spectra [4]. In addition, the Raman spectrum (Figure 16b) of the synthetic product is consistent with the experimental and theoretical results of hydroxysodalite [29]. The combined FTIR and Raman results confirm that the hydroxysodalite was successfully synthesized.
Thermal analysis was performed, and, in Figure 16c, a total mass loss of 11.79% was observed in three stages. The mass loss of 0.93% in the range from room temperature to 85 °C was attributed to the elimination of adsorbed water. The mass loss of 7.52% in the range of 85 °C to 445 °C corresponded to the elimination of structural water molecules of hydroxysodalite, indicating the formation of anhydrous hydroxysodalite Na8[AlSiO4]6(OH)2 [30]. Above 445 °C, the mass loss was 3.24%, which could be due to the decomposition of hydroxysodalite [31,32].
4. Conclusions
Hydroxysodalite was synthesized via a one-step water-bath method at a moderate temperature by controlling the synthesis parameters such as the Na/Si molar ratio, Si/Al molar ratio, reaction time, and reaction temperature. Hydroxysodalite could be synthesized at a high Na/Si molar ratio and a high reaction temperature. On the contrary, a low Na/Si molar ratio at a temperature of 90 °C was beneficial for the synthesis of 4A zeolite. Both the Na/Si molar ratio and reaction temperature played important roles in controlling formation of the crystalline phase of the synthetic hydroxysodalite. The Si/Al molar ratio and reaction time were shown to influence the purity of the synthetic hydroxysodalite. The optimum synthesis conditions were determined to be a Na/Si ratio of 12, an Si/Al ratio of 1.0, a reaction temperature of 90 °C, and a reaction time of 12 h. The one-step water-bath method, when performed at moderate temperatures, can potentially be a promising method for the synthesis of other zeolites derived from bentonite clay.
Author Contributions
B.L. and H.S. conceived and designed the experiments; Q.H. performed the experiments; B.L. analyzed the data; T.P. contributed reagents and materials; B.L. and Q.H. wrote the paper.
Funding
This research was funded by the doctoral foundation of Southwest University of Science and Technology (Grant No. 18zx7104), the National Natural Science Foundation of China (Grant: 41372052) and the Sichuan innovation team project (Grant: 14TD0012).
Conflicts of Interest
The authors declare no conflict of interest.
References
- Bibby, D.M.; Dale, M.P. Synthesis of silica-sodalite from non-aqueous systems. Nature 1985, 317, 157. [Google Scholar] [CrossRef]
- Li, J.; Zeng, X.; Yang, X.; Wang, C.; Luo, X. Synthesis of pure sodalite with wool ball morphology from alkali fusion kaolin. Mater. Lett. 2015, 161, 157–159. [Google Scholar] [CrossRef]
- Yao, J.; Zhang, L.; Wang, H. Synthesis of nanocrystalline sodalite with organic additives. Mater. Lett. 2008, 62, 4028–4030. [Google Scholar] [CrossRef]
- Naskar, M.K.; Kundu, D.; Chatterjee, M. Effect of process parameters on surfactant-based synthesis of hydroxy sodalite particles. Mater. Lett. 2011, 65, 436–438. [Google Scholar] [CrossRef]
- Johnson, G.M.; Mead, P.J.; Weller, M.T. Synthesis of a range of anion-containing gallium and germanium sodalites. Microporous Mesoporous Mater. 2000, 38, 445–460. [Google Scholar] [CrossRef]
- Hu, T.; Qiu, J.; Wang, Y.; Wang, C.; Liu, R.; Meng, C. Synthesis of low Si/Al ratio hydroxysodalite from oil shale ash without pretreatment. J. Chem. Technol. Biotechnol. 2015, 90, 208–212. [Google Scholar] [CrossRef]
- Van den Berg, A.W.C.; Bromley, S.T.; Jansen, J.C. Thermodynamic limits on hydrogen storage in sodalite framework materials: A molecular mechanics investigation. Microporous Mesoporous Mater. 2005, 78, 63–71. [Google Scholar] [CrossRef]
- Khajavi, S.; Jansen, J.C.; Kapteijn, F. Application of hydroxy sodalite films as novel water selective membranes. J. Membr. Sci. 2009, 326, 153–160. [Google Scholar] [CrossRef]
- Khajavi, S.; Jansen, J.C.; Kapteijn, F. Application of a sodalite membrane reactor in esterification-coupling reaction and separation. Catal. Today 2010, 156, 132–139. [Google Scholar] [CrossRef]
- Xu, X.; Bao, Y.; Song, C.; Yang, W.; Liu, J.; Lin, L. Microwave-assisted hydrothermal synthesis of hydroxy-sodalite zeolite membrane. Microporous Mesoporous Mater. 2004, 75, 173–181. [Google Scholar] [CrossRef] [Green Version]
- Nabavi, M.S.; Mohammadi, T.; Kazemimoghadam, M. Hydrothermal synthesis of hydroxy sodalite zeolite membrane: Separation of H2/CH4. Ceram. Int. 2014, 40, 5889–5896. [Google Scholar] [CrossRef]
- Jiang, J.; Gu, X.; Feng, L.; Duanmu, C.; Jin, Y.; Hu, T.; Wu, J. Controllable synthesis of sodalite submicron crystals and microspheres from palygorskite clay using a two-step approach. Powder Tech. 2012, 217, 298–303. [Google Scholar] [CrossRef]
- Passos, F.A.C.M.; Castro, D.C.; Ferreira, K.K.; Simões, K.M.A.; Bertolino, L.C.; Barbato, C.N.; Garrido, F.M.S.; Felix, A.A.S.; Silva, F.A.N.G. Synthesis and characterization of sodalite and cancrinite from Kaolin. In Characterization of Minerals Metals and Materials; Springer: Berlin, Germany, 2017; pp. 279–288. [Google Scholar]
- Golbad, S.; Khoshnoud, P.; Abu-Zahra, N. Hydrothermal synthesis of hydroxy sodalite from fly ash for the removal of lead ions from water. Int. J. Environ. Sci. Technol. 2017, 14, 135–142. [Google Scholar] [CrossRef]
- Bouberka, Z.; Kacha, S.; Kameche, M.; Elmaleh, S.; Derriche, Z. Sorption study of an acid dye from an aqueous solutions using modified clays. J. Hazard. Mater. 2005, 119, 117–124. [Google Scholar] [CrossRef] [PubMed]
- Karnland, O.; Olsson, S.; Nilsson, U.; Sellin, P. Experimentally determined swelling pressures and geochemical interactions of compacted Wyoming bentonite with highly alkaline solutions. Phys. Chem. Earth Parts A/B/C 2007, 32, 275–286. [Google Scholar] [CrossRef]
- Simonsen, M.E.; Sonderby, C.; Sogaard, E.G. Synthesis and characterization of silicate polymers. J. Sol-Gel Sci. Technol. 2009, 50, 372. [Google Scholar] [CrossRef]
- Simonsen, M.E.; Sonderby, C.; Li, Z.; Søgaard, E.G. XPS and FT-IR investigation of silicate polymers. J. Mater. Sci. 2009, 44, 2079. [Google Scholar] [CrossRef]
- Tang, W.; Han, J.; Zhang, S.; Sun, J.; Li, H.; Gu, X. Synthesis of 4A zeolite containing La from kaolinite and its effect on the flammability of polypropylene. Polym. Compos. 2018, 39, 3461–3471. [Google Scholar] [CrossRef]
- Wu, Z.; Chen, T.; Liu, H.; Wang, C.; Cheng, P.; Chen, D.; Xie, J. An insight into the comprehensive application of opal-palygorskite clay: Synthesis of 4A zeolite and uptake of Hg2+. Appl. Clay Sci. 2018, 165, 103–111. [Google Scholar] [CrossRef]
- Meng, Q.; Chen, H.; Lin, J.; Lin, Z.; Sun, J. Zeolite A synthesized from alkaline assisted pre-activated halloysite for efficient heavy metal removal in polluted river water and industrial wastewater. J. Environ. Sci. 2017, 56, 254–262. [Google Scholar] [CrossRef] [PubMed]
- Itani, L.; Liu, Y.; Zhang, W.; Bozhilov, K.N.; Delmotte, L.; Valtchev, V. Investigation of the physicochemical changes preceding zeolite nucleation in a sodium-rich aluminosilicate gel. J. Am. Chem. Soc. 2009, 131, 10127–10139. [Google Scholar] [CrossRef] [PubMed]
- Barnes, M.C.; Addai-Mensah, J.; Gerson, A.R. The mechanism of the sodalite-to-cancrinite phase transformation in synthetic spent Bayer liquor. Microporous Mesoporous Mater. 1999, 31, 287–302. [Google Scholar] [CrossRef]
- Liu, Q.; Navrotsky, A. Synthesis of nitrate sodalite: An in situ scanning calorimetric study. Geochim. Cosmochim. Acta 2007, 71, 2072–2078. [Google Scholar] [CrossRef]
- Fan, W.; Morozumi, K.; Kimura, R.; Yokoi, T.; Okubo, T. Synthesis of nanometer-sized sodalite without adding organic additives. Langmuir 2008, 24, 6952–6958. [Google Scholar] [CrossRef] [PubMed]
- Geon, J.K.; Wha, S.A. Synthesis and characterization of iron-modified ZSM-5. Appl. Catal. 1991, 71, 55–68. [Google Scholar] [CrossRef]
- Li, Y.; Peng, T.; Man, W.; Ju, L.; Zheng, F.; Zhang, M.; Guo, M. Hydrothermal synthesis of mixtures of NaA zeolite and sodalite from Ti-bearing electric arc furnace slag. RSC Adv. 2016, 6, 8358–8366. [Google Scholar] [CrossRef]
- Tounsi, H.; Mseddi, S.; Djemel, S. Preparation and characterization of Na-LTA zeolite from Tunisian sand and aluminum scrap. Phys. Procedia 2009, 2, 1065–1074. [Google Scholar] [CrossRef]
- Mofrad, A.M.; Peixoto, C.; Blumeyer, J.; Liu, J.; Hunt, H.K.; Hammond, K.D. Vibrational spectroscopy of sodalite: Theory and experiments. J. Phys. Chem. C 2018, 122, 24765–24779. [Google Scholar] [CrossRef]
- Khajavi, S.; Kapteijn, F.; Jansen, J.C. Synthesis of thin defect-free hydroxy sodalite membranes: New candidate for activated water permeation. J. Membr. Sci. 2007, 299, 63–72. [Google Scholar] [CrossRef]
- Sharp, Z.D.; Helffrich, G.R.; Bohlen, S.R.; Essene, E.J. The stability of sodalite in the system NaAlSiO4-NaCl. Geochim. Cosmochim. Acta 1989, 53, 1943–1954. [Google Scholar] [CrossRef]
- Gaidoumi, A.E.; Benabdallah, A.C.; Bali, B.E.; Kherbeche, A. Synthesis and characterization of zeolite HS using natural pyrophyllite as new clay source. Arabian J. Sci. Eng. 2018, 43, 191–197. [Google Scholar] [CrossRef]
Figure 1.
XRD of bentonite samples.
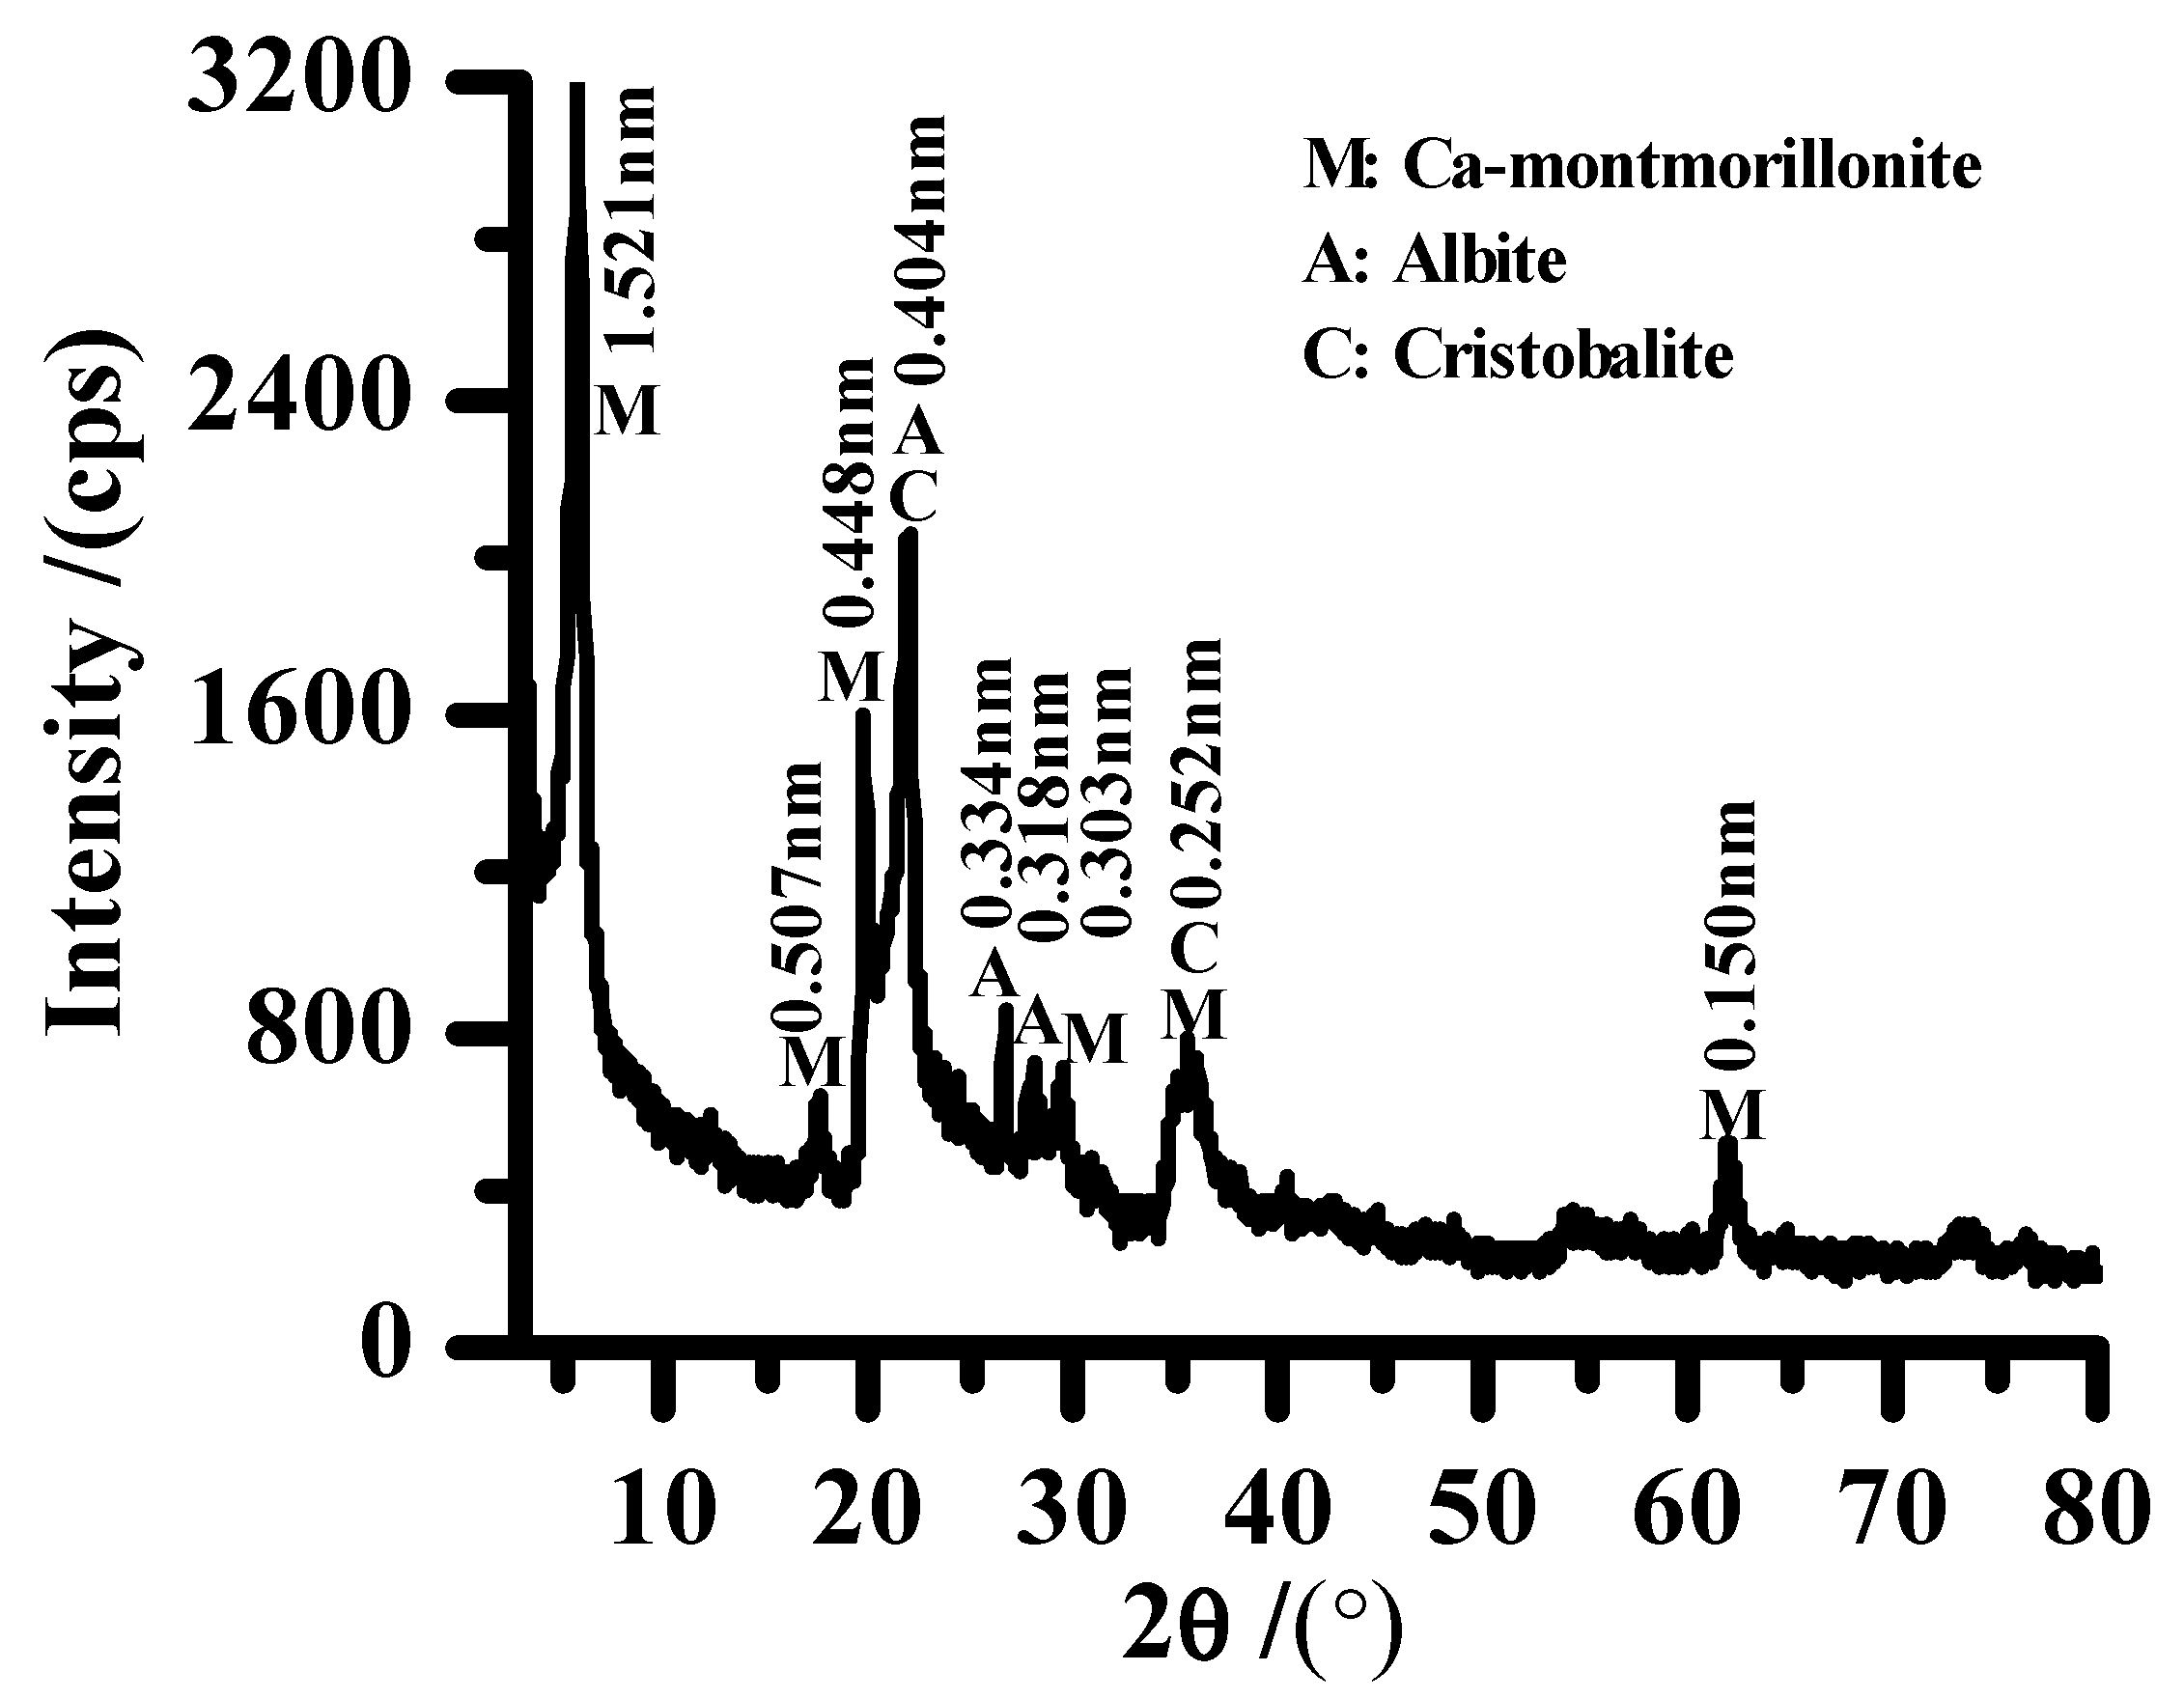
Figure 2.
SEM of bentonite samples.

Figure 3.
The flow diagram for the synthesis of hydroxysodalite.
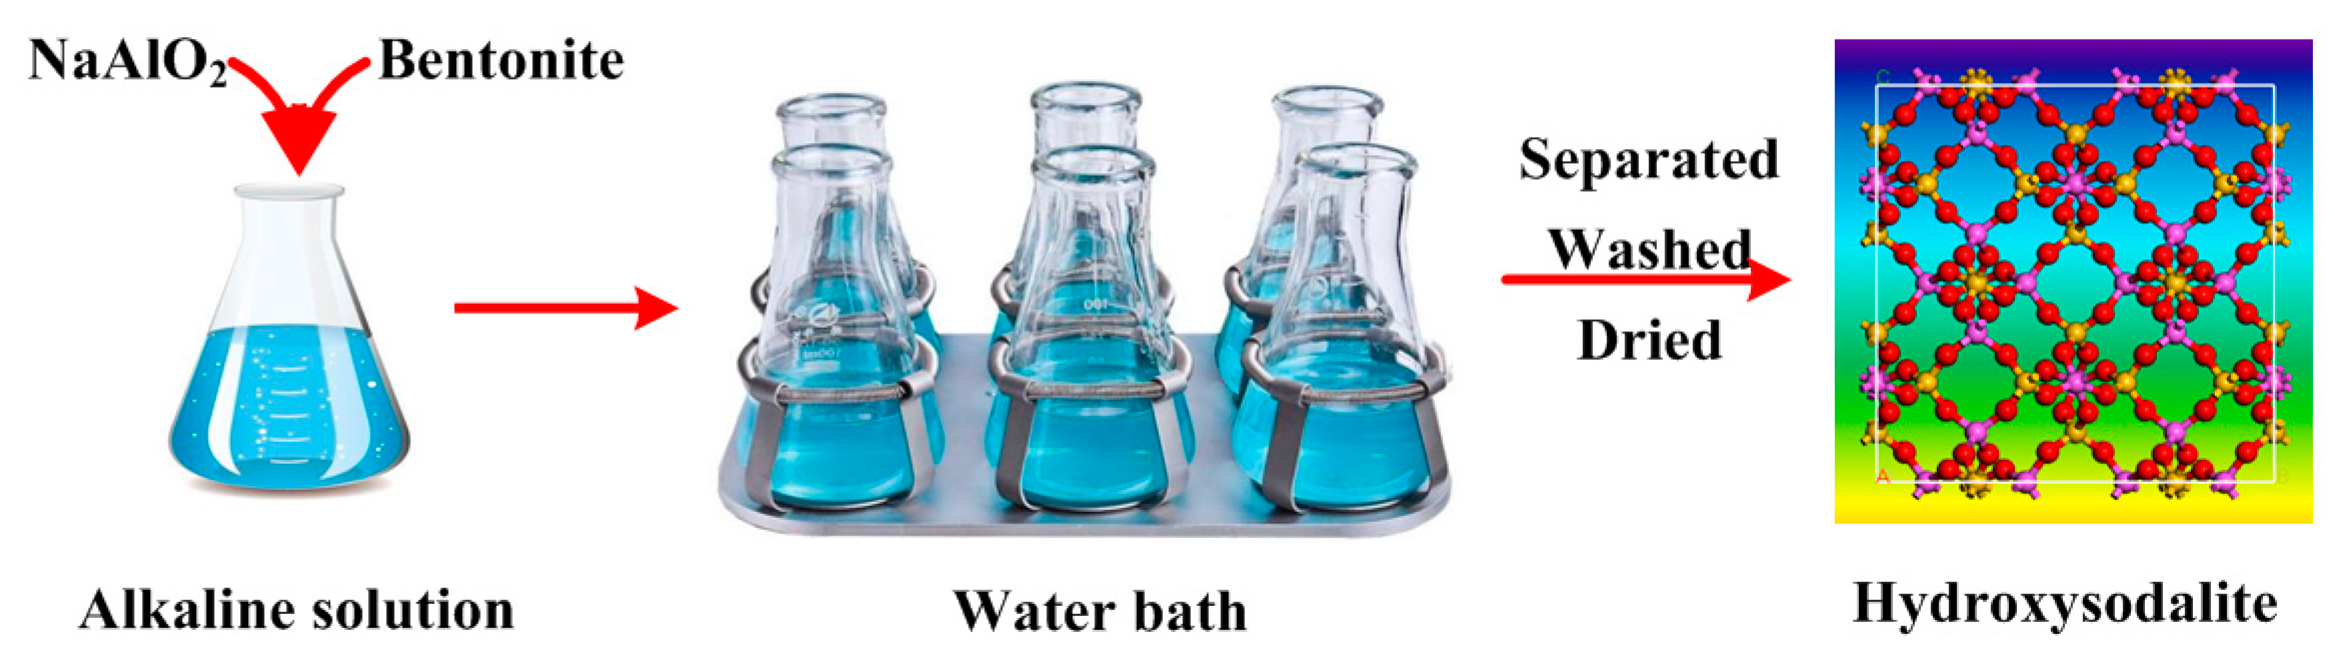
Figure 4.
XRD of synthetic products obtained from different Na/Si molar ratios.
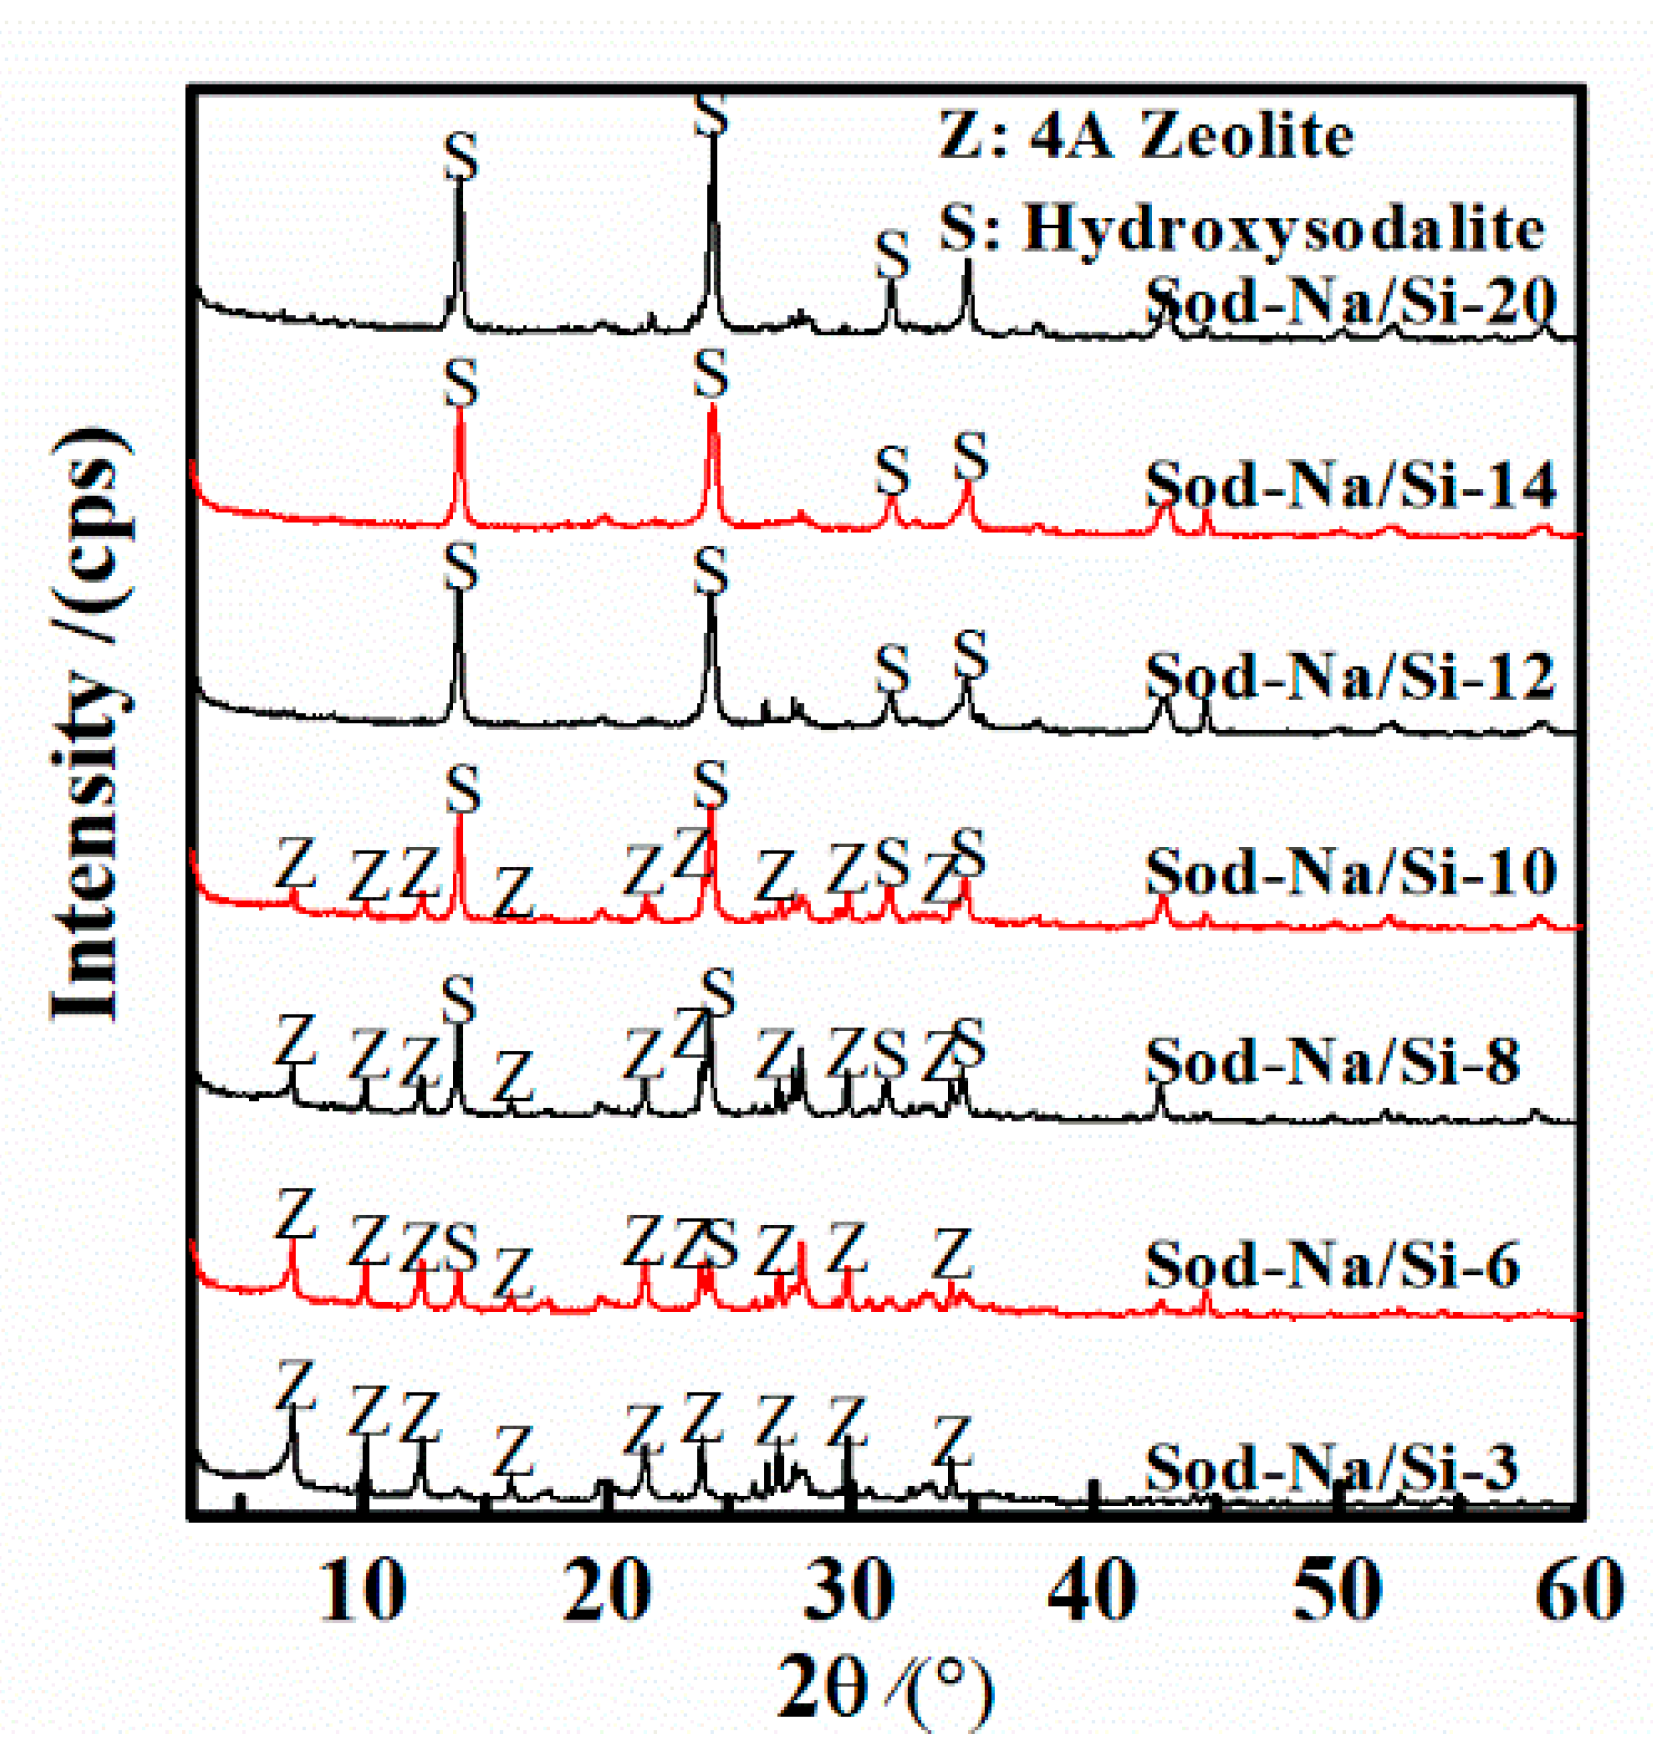
Figure 5.
Crystallinity of synthetic products obtained from different Na/Si molar ratios.
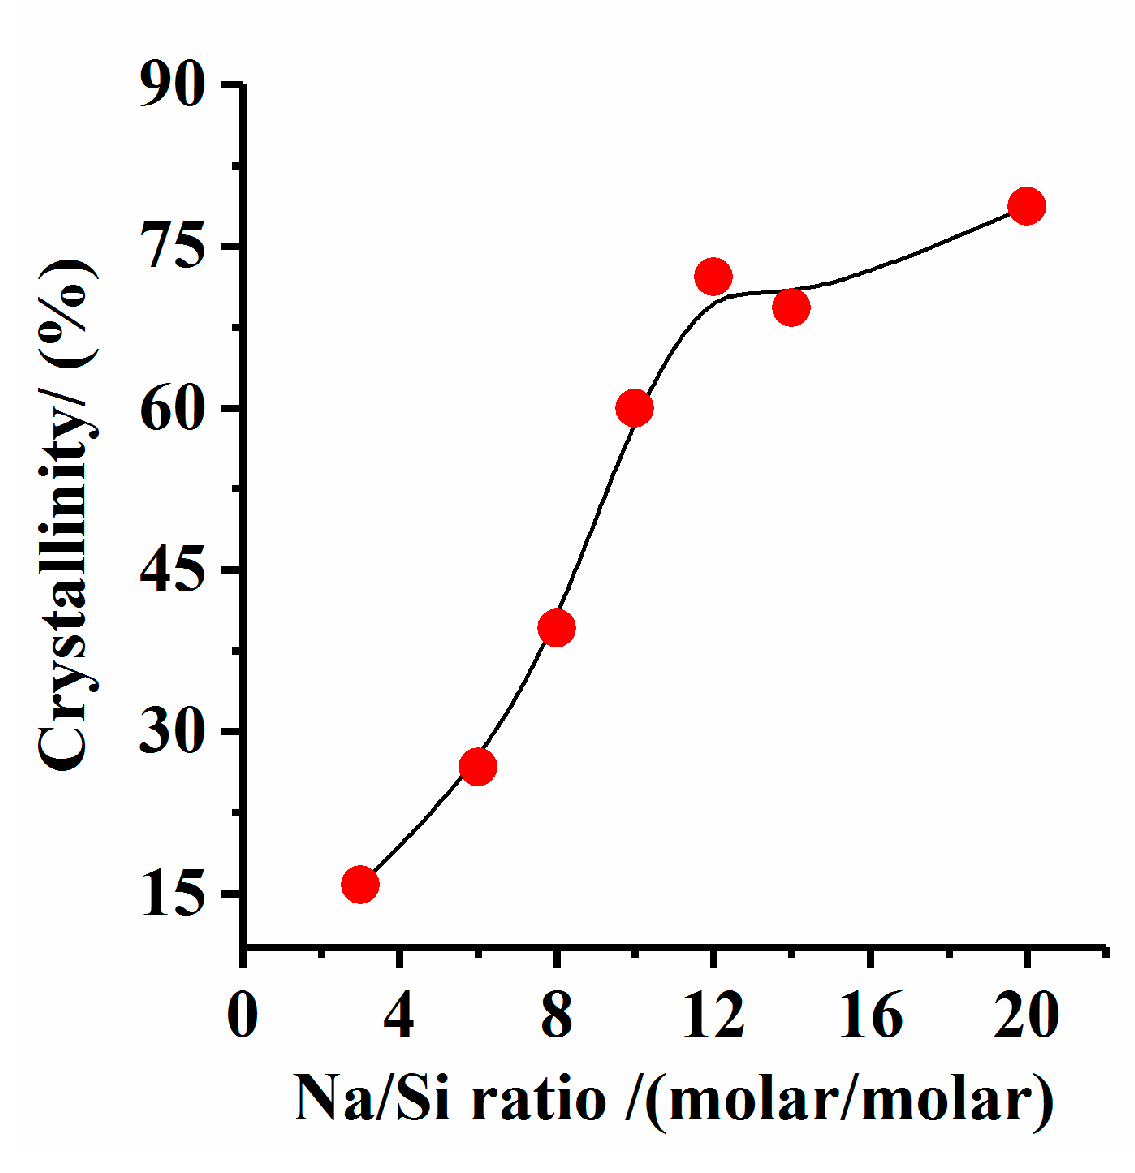
Figure 6.
SEM of synthetic products obtained from different Na/Si molar ratios. (a) Na/Si = 3; (b) Na/Si = 6; (c) Na/Si = 10; (d) Na/Si = 12.
Figure 6.
SEM of synthetic products obtained from different Na/Si molar ratios. (a) Na/Si = 3; (b) Na/Si = 6; (c) Na/Si = 10; (d) Na/Si = 12.
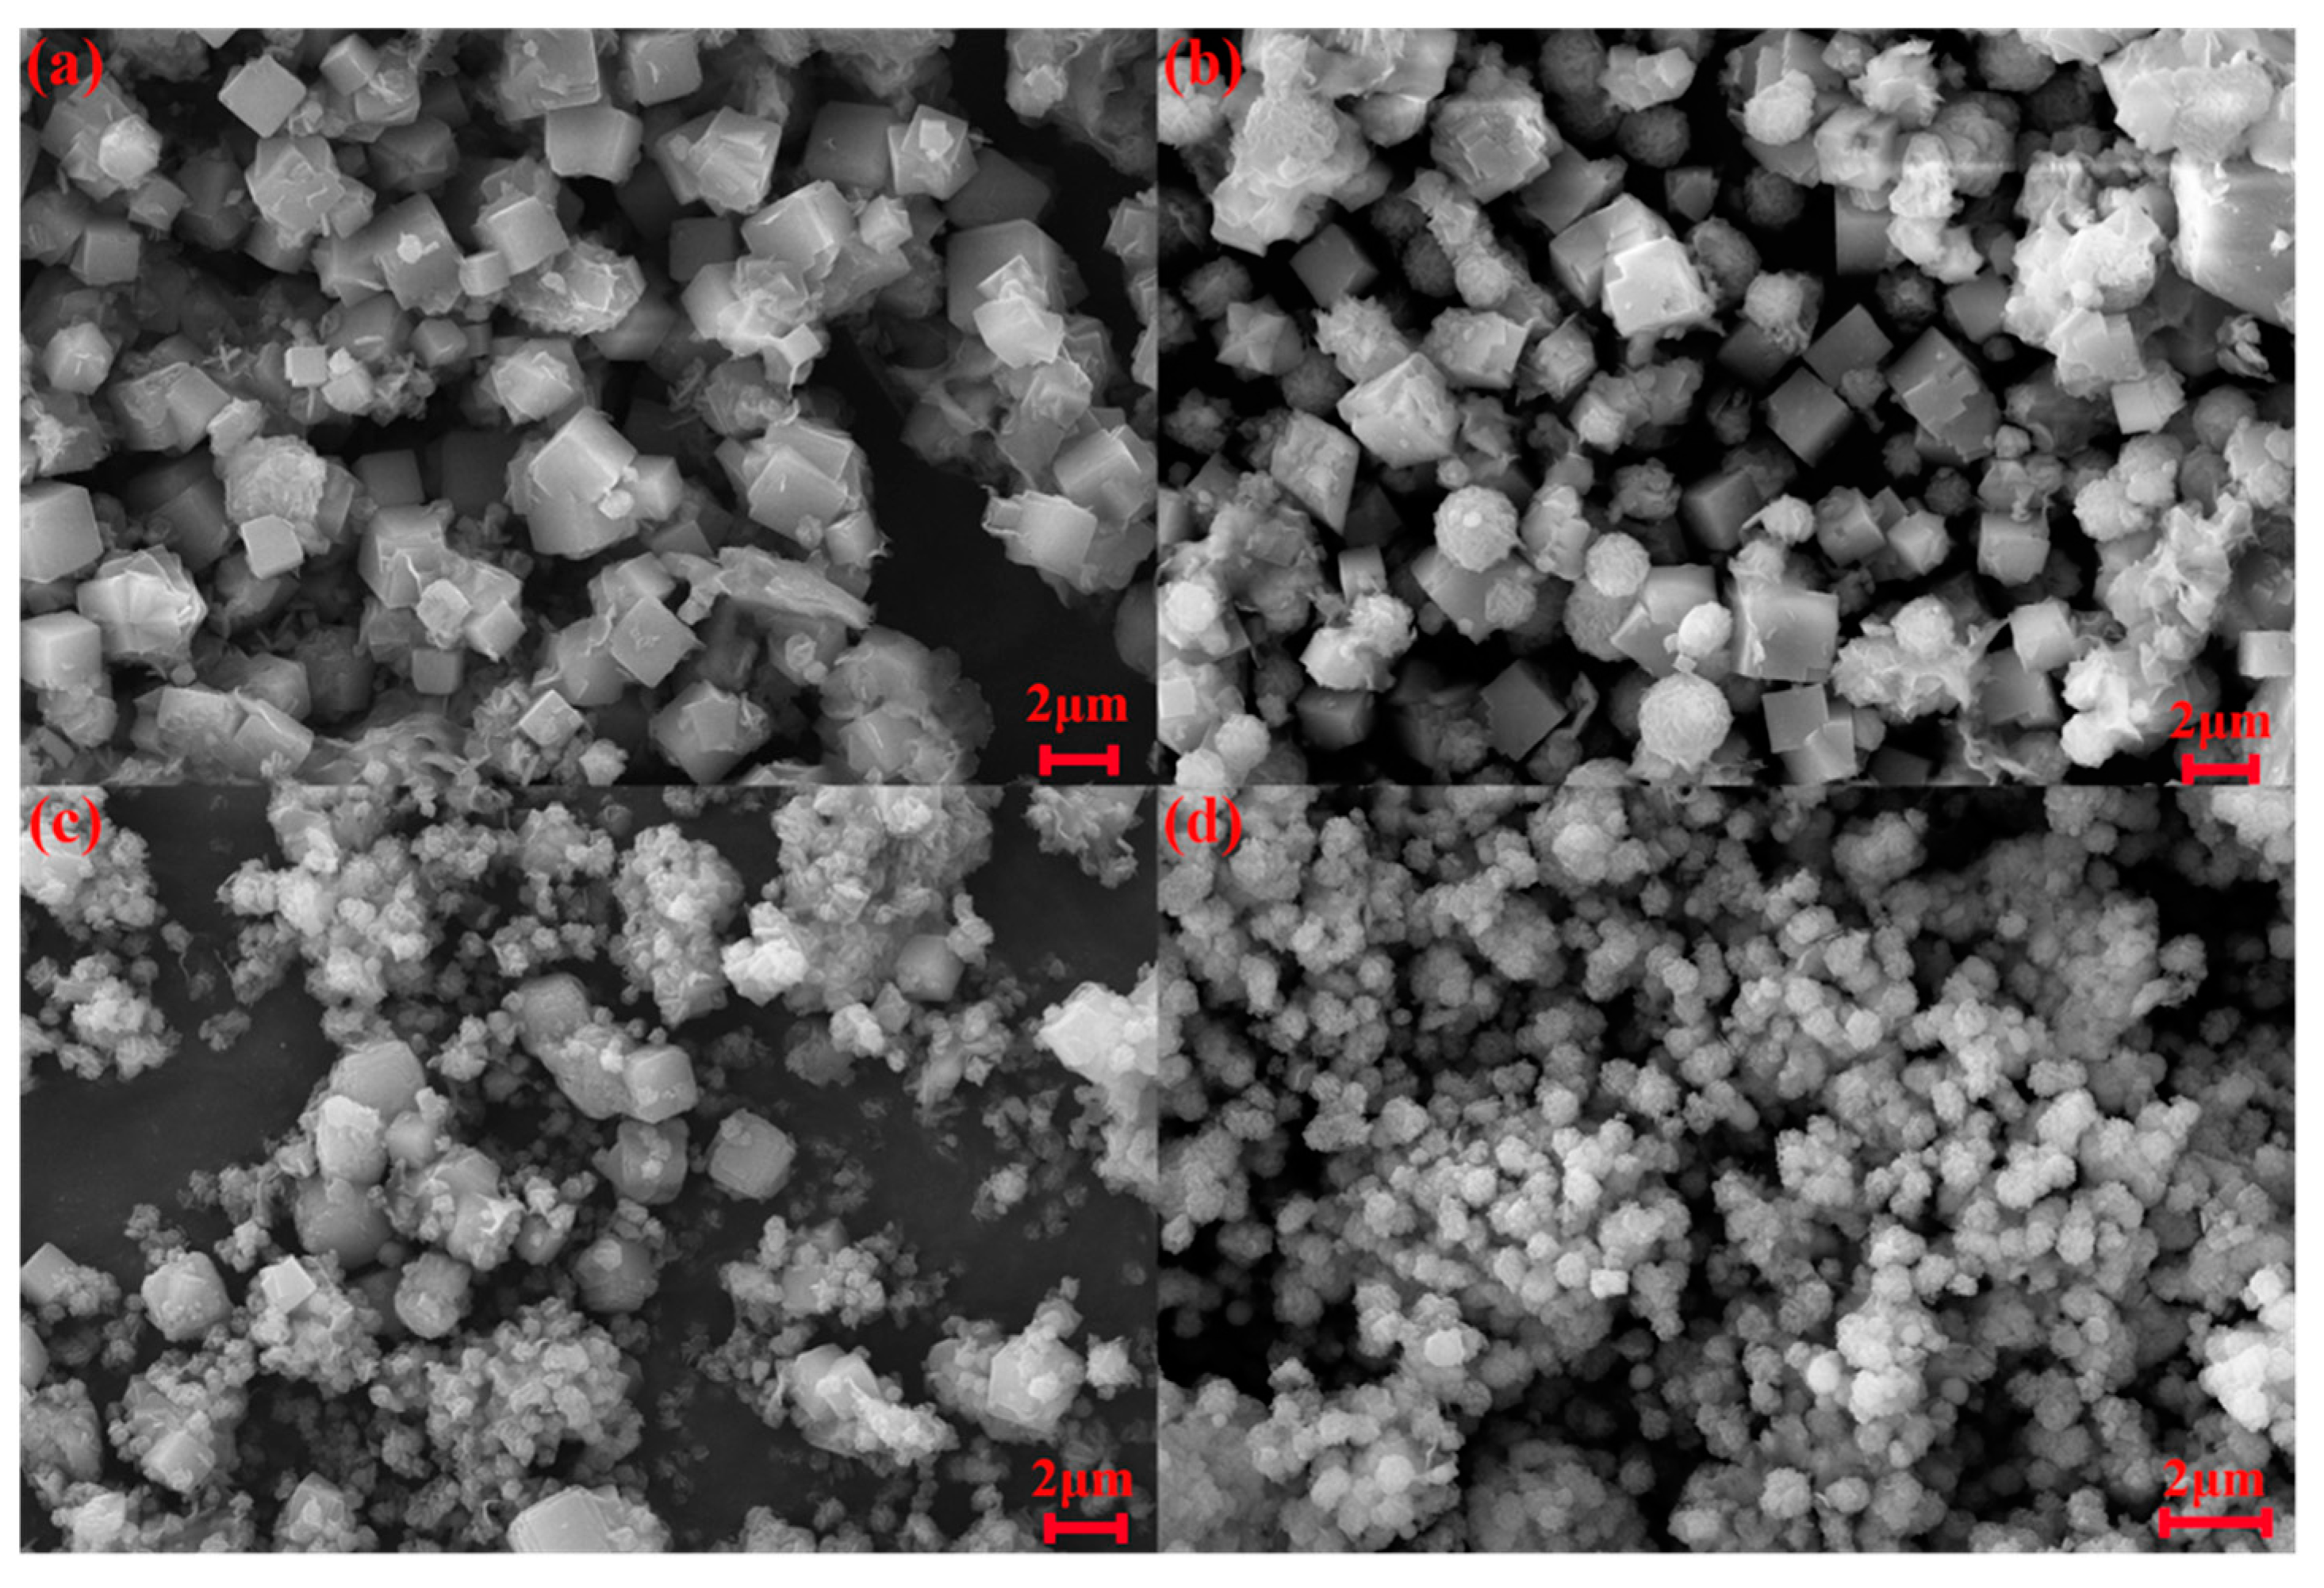
Figure 7.
XRD of synthetic products obtained from different Si/Al molar ratios.
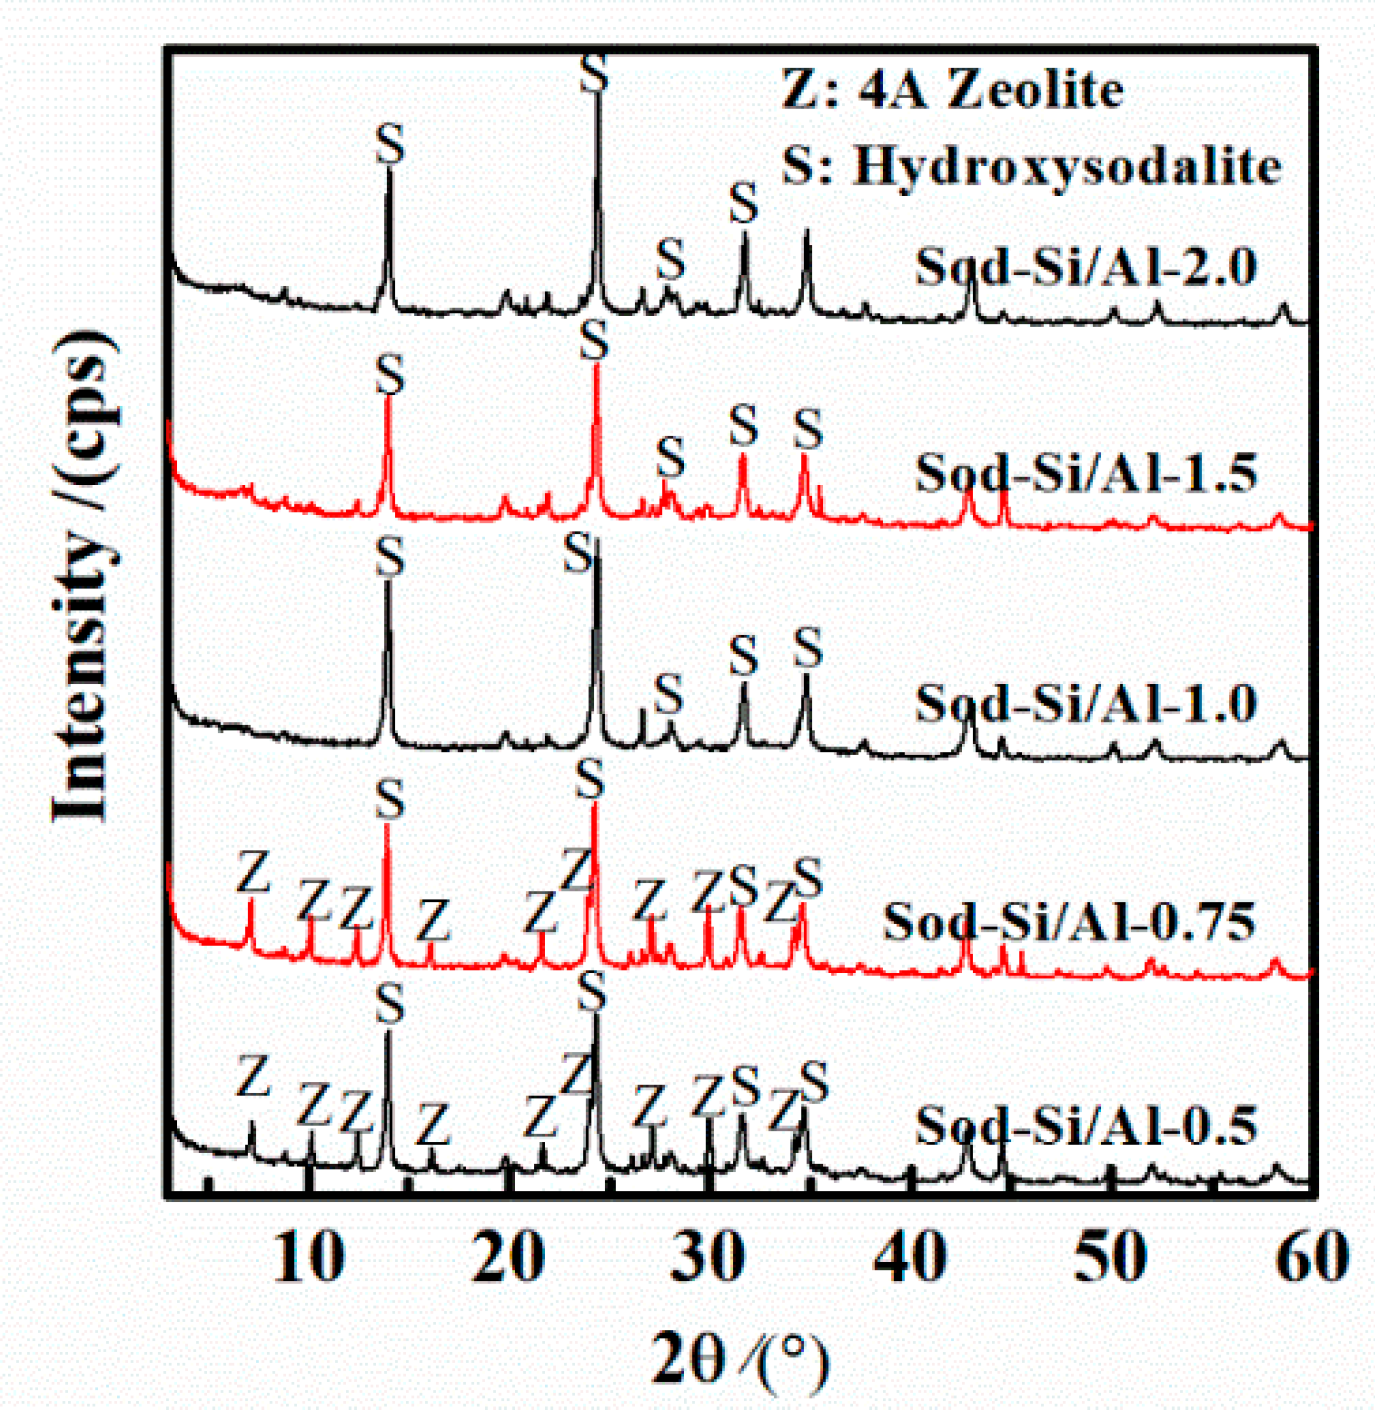
Figure 8.
Crystallinity of synthetic products obtained from different Si/Al molar ratios.
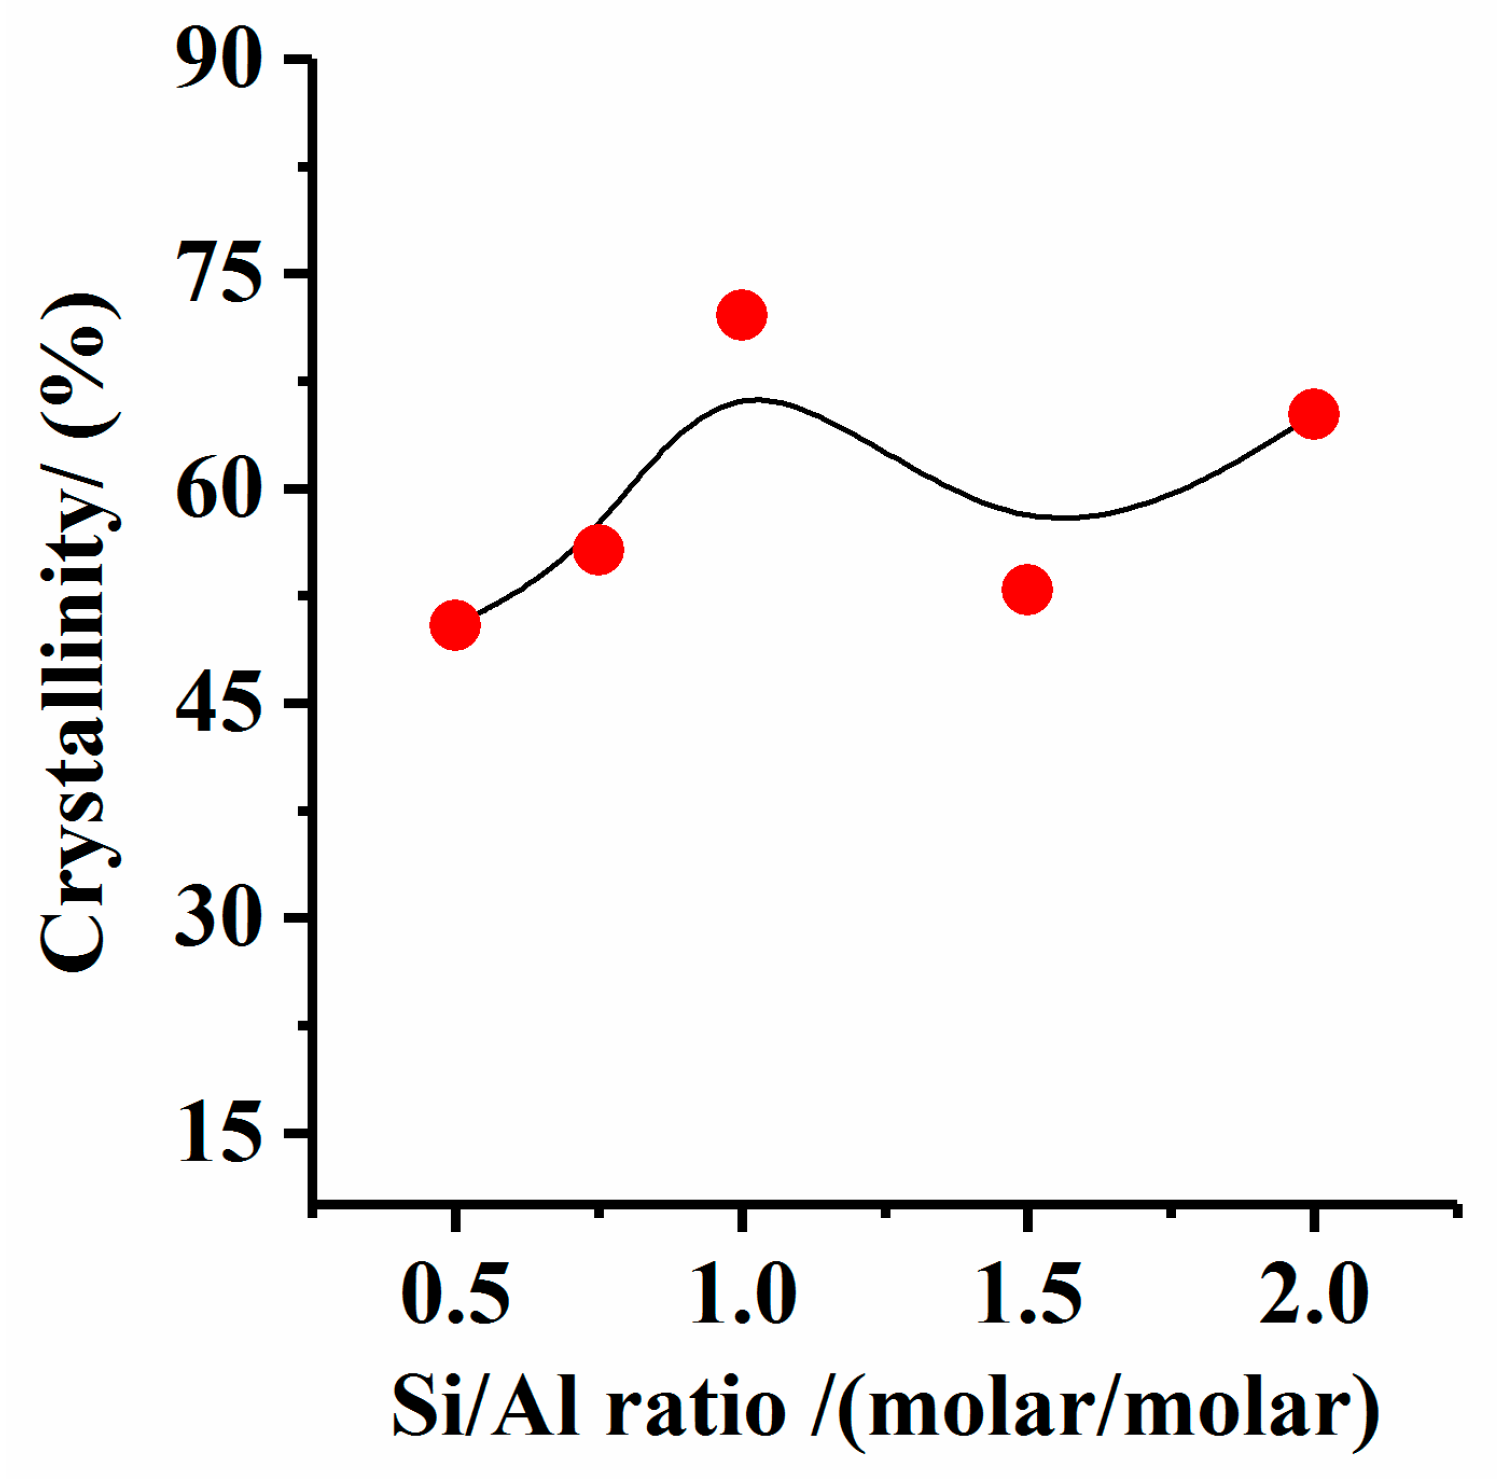
Figure 9.
SEM of synthetic products obtained from different Si/Al molar ratios. (a) Si/Al = 0.5; (b) Si/Al = 0.75; (c) Si/Al = 1.0; (d) Si/Al = 1.5.
Figure 9.
SEM of synthetic products obtained from different Si/Al molar ratios. (a) Si/Al = 0.5; (b) Si/Al = 0.75; (c) Si/Al = 1.0; (d) Si/Al = 1.5.
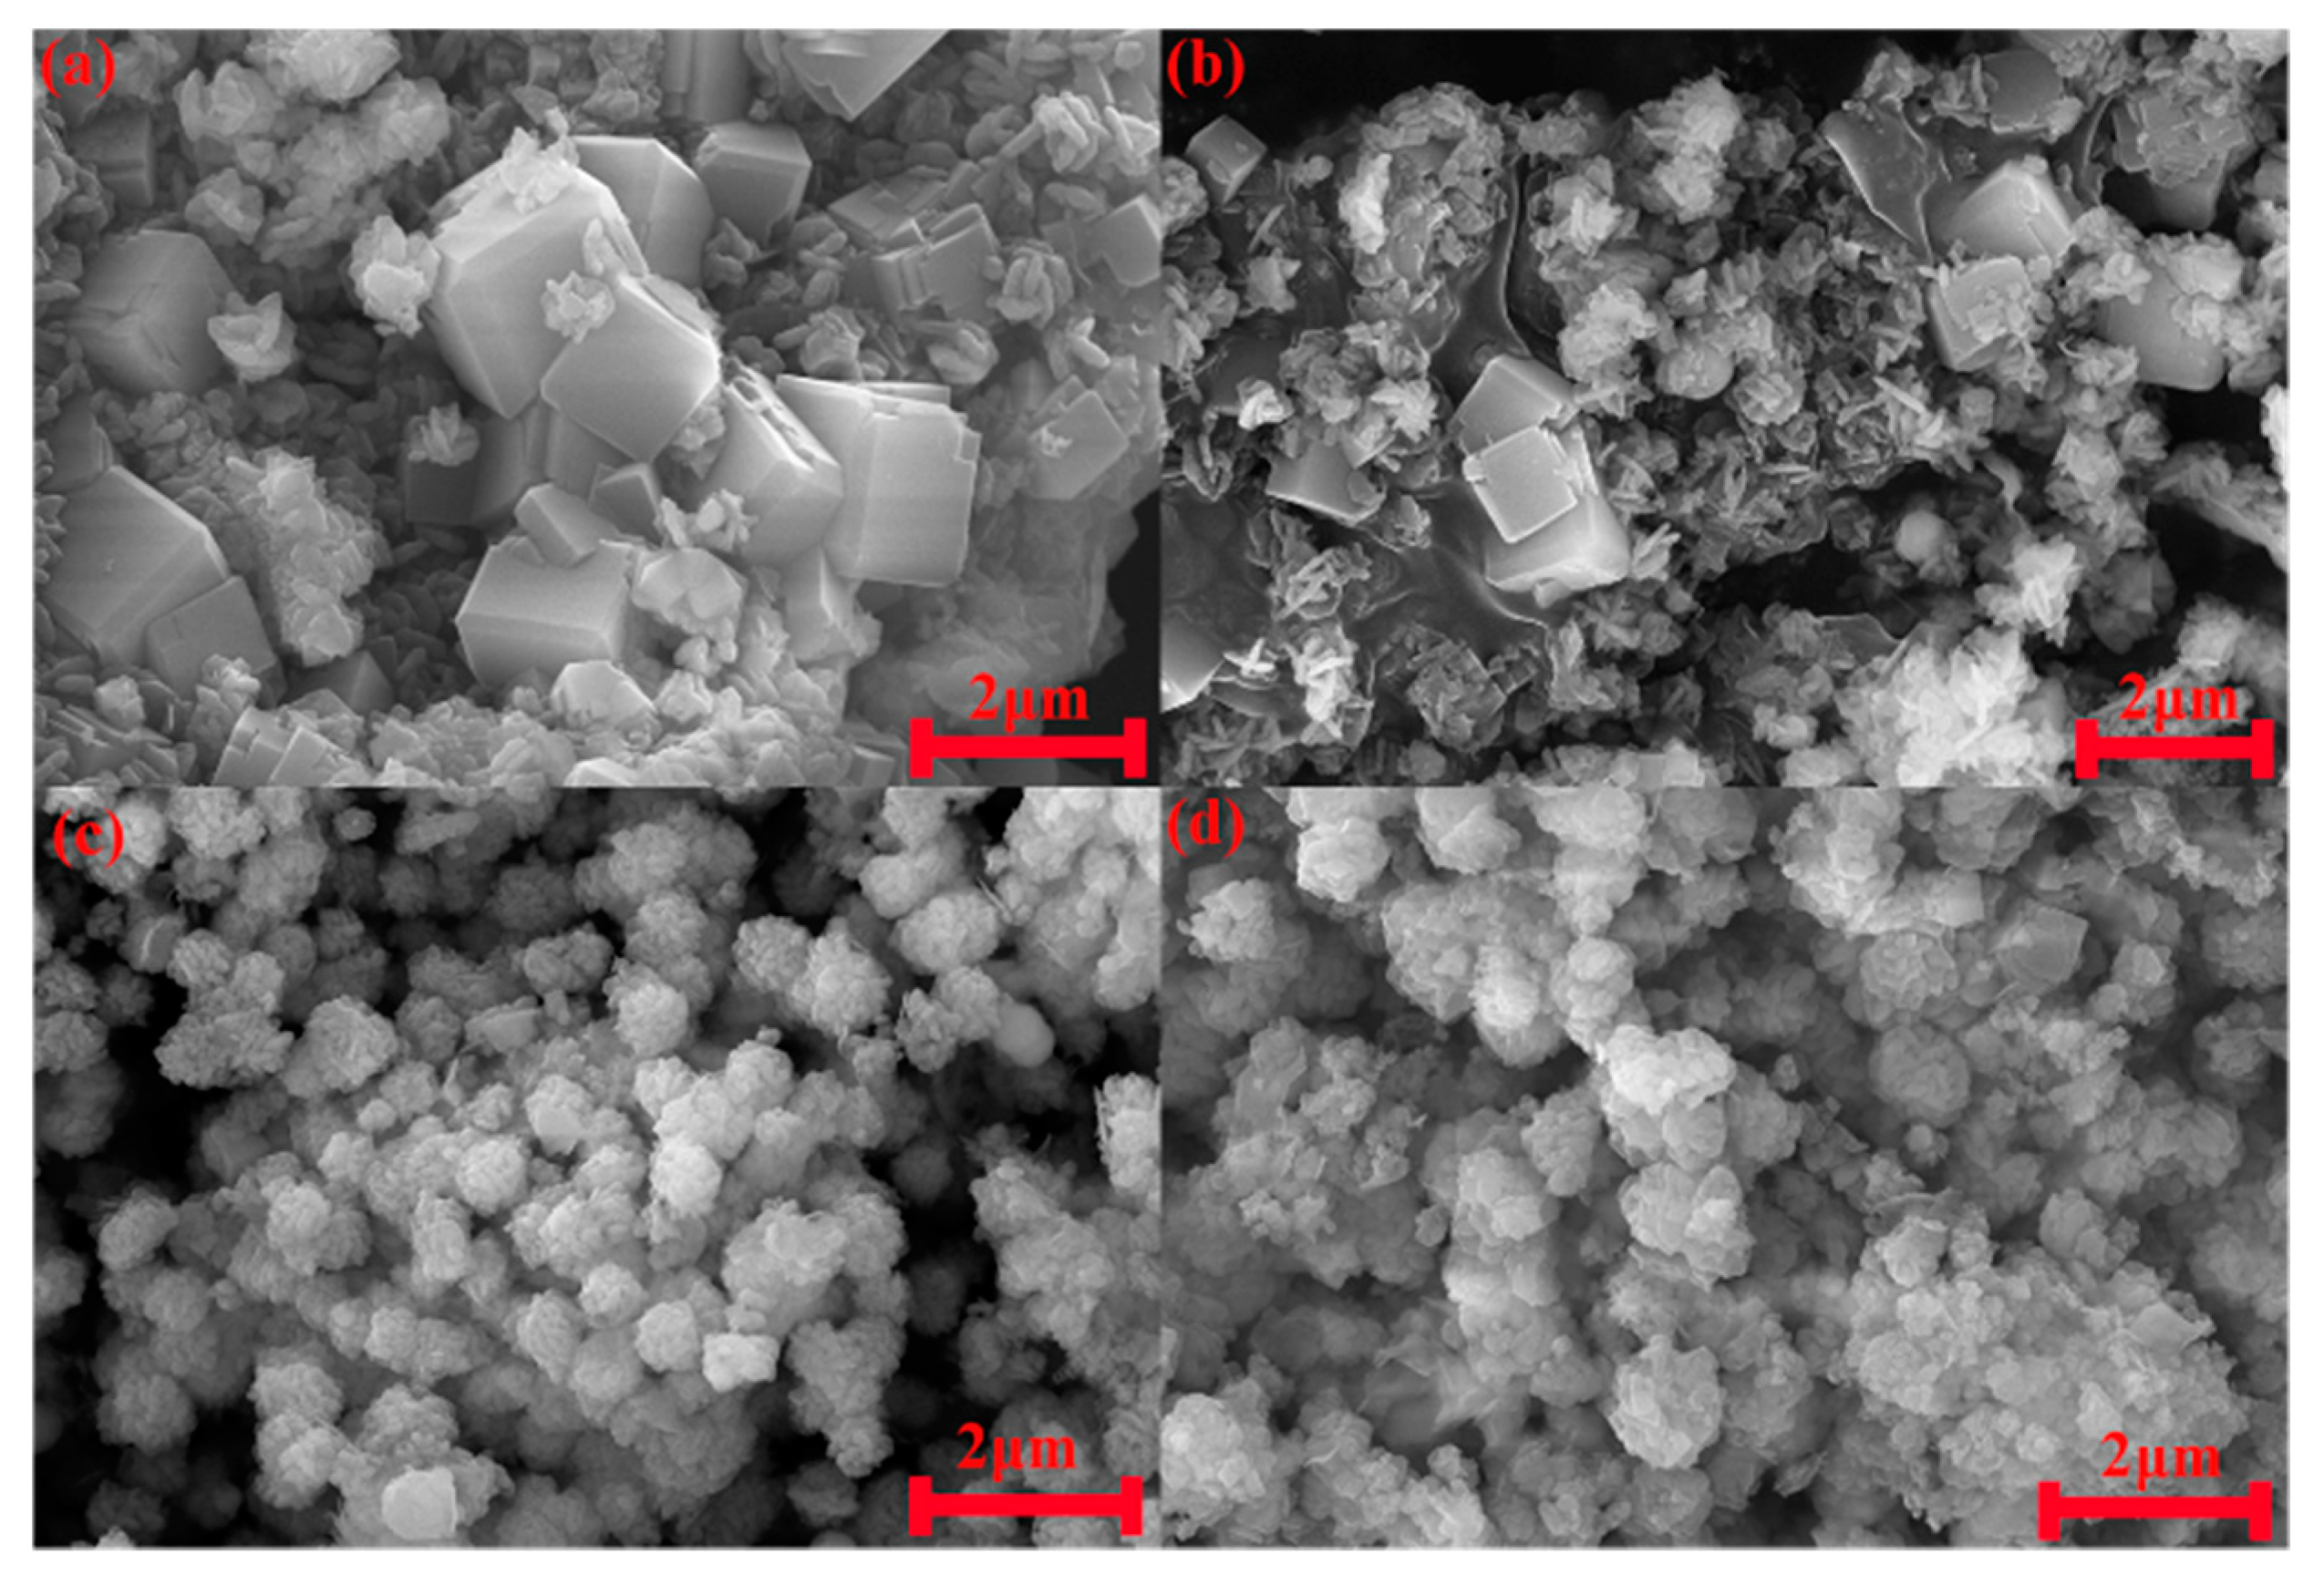
Figure 10.
XRD of synthetic products obtained from different reaction temperatures.
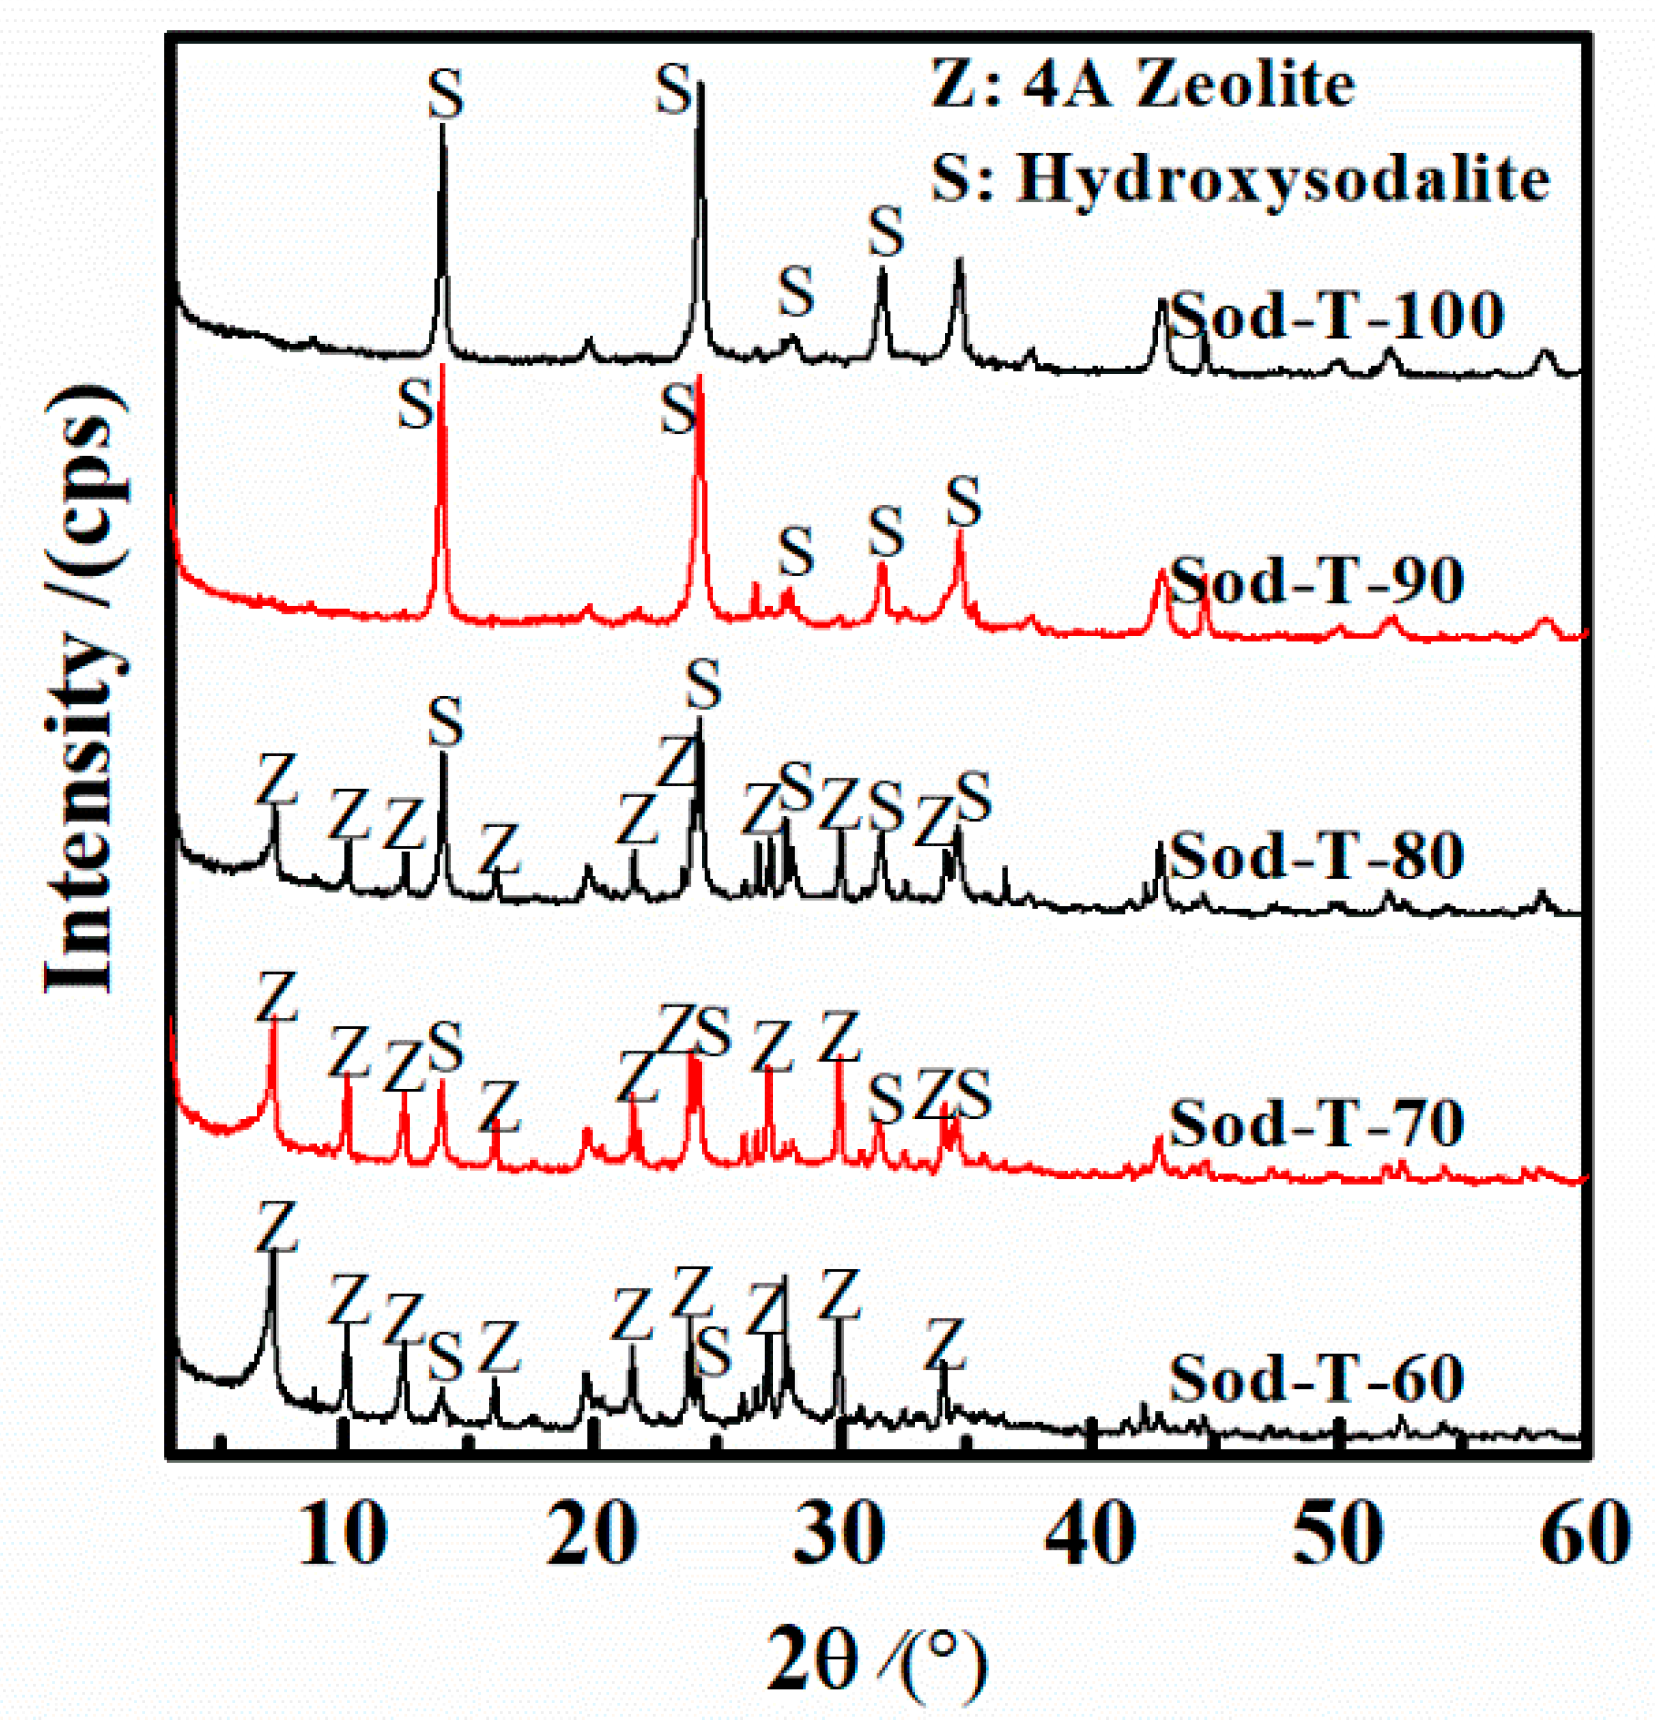
Figure 11.
Crystallinity of synthetic products obtained from different reaction temperatures.

Figure 12.
SEM of synthetic products obtained from different reaction temperatures. (a) reaction temperature = 60 °C; (b) reaction temperature = 70 °C; (c) reaction temperature = 80 °C; (d) reaction temperature = 90 °C.
Figure 12.
SEM of synthetic products obtained from different reaction temperatures. (a) reaction temperature = 60 °C; (b) reaction temperature = 70 °C; (c) reaction temperature = 80 °C; (d) reaction temperature = 90 °C.
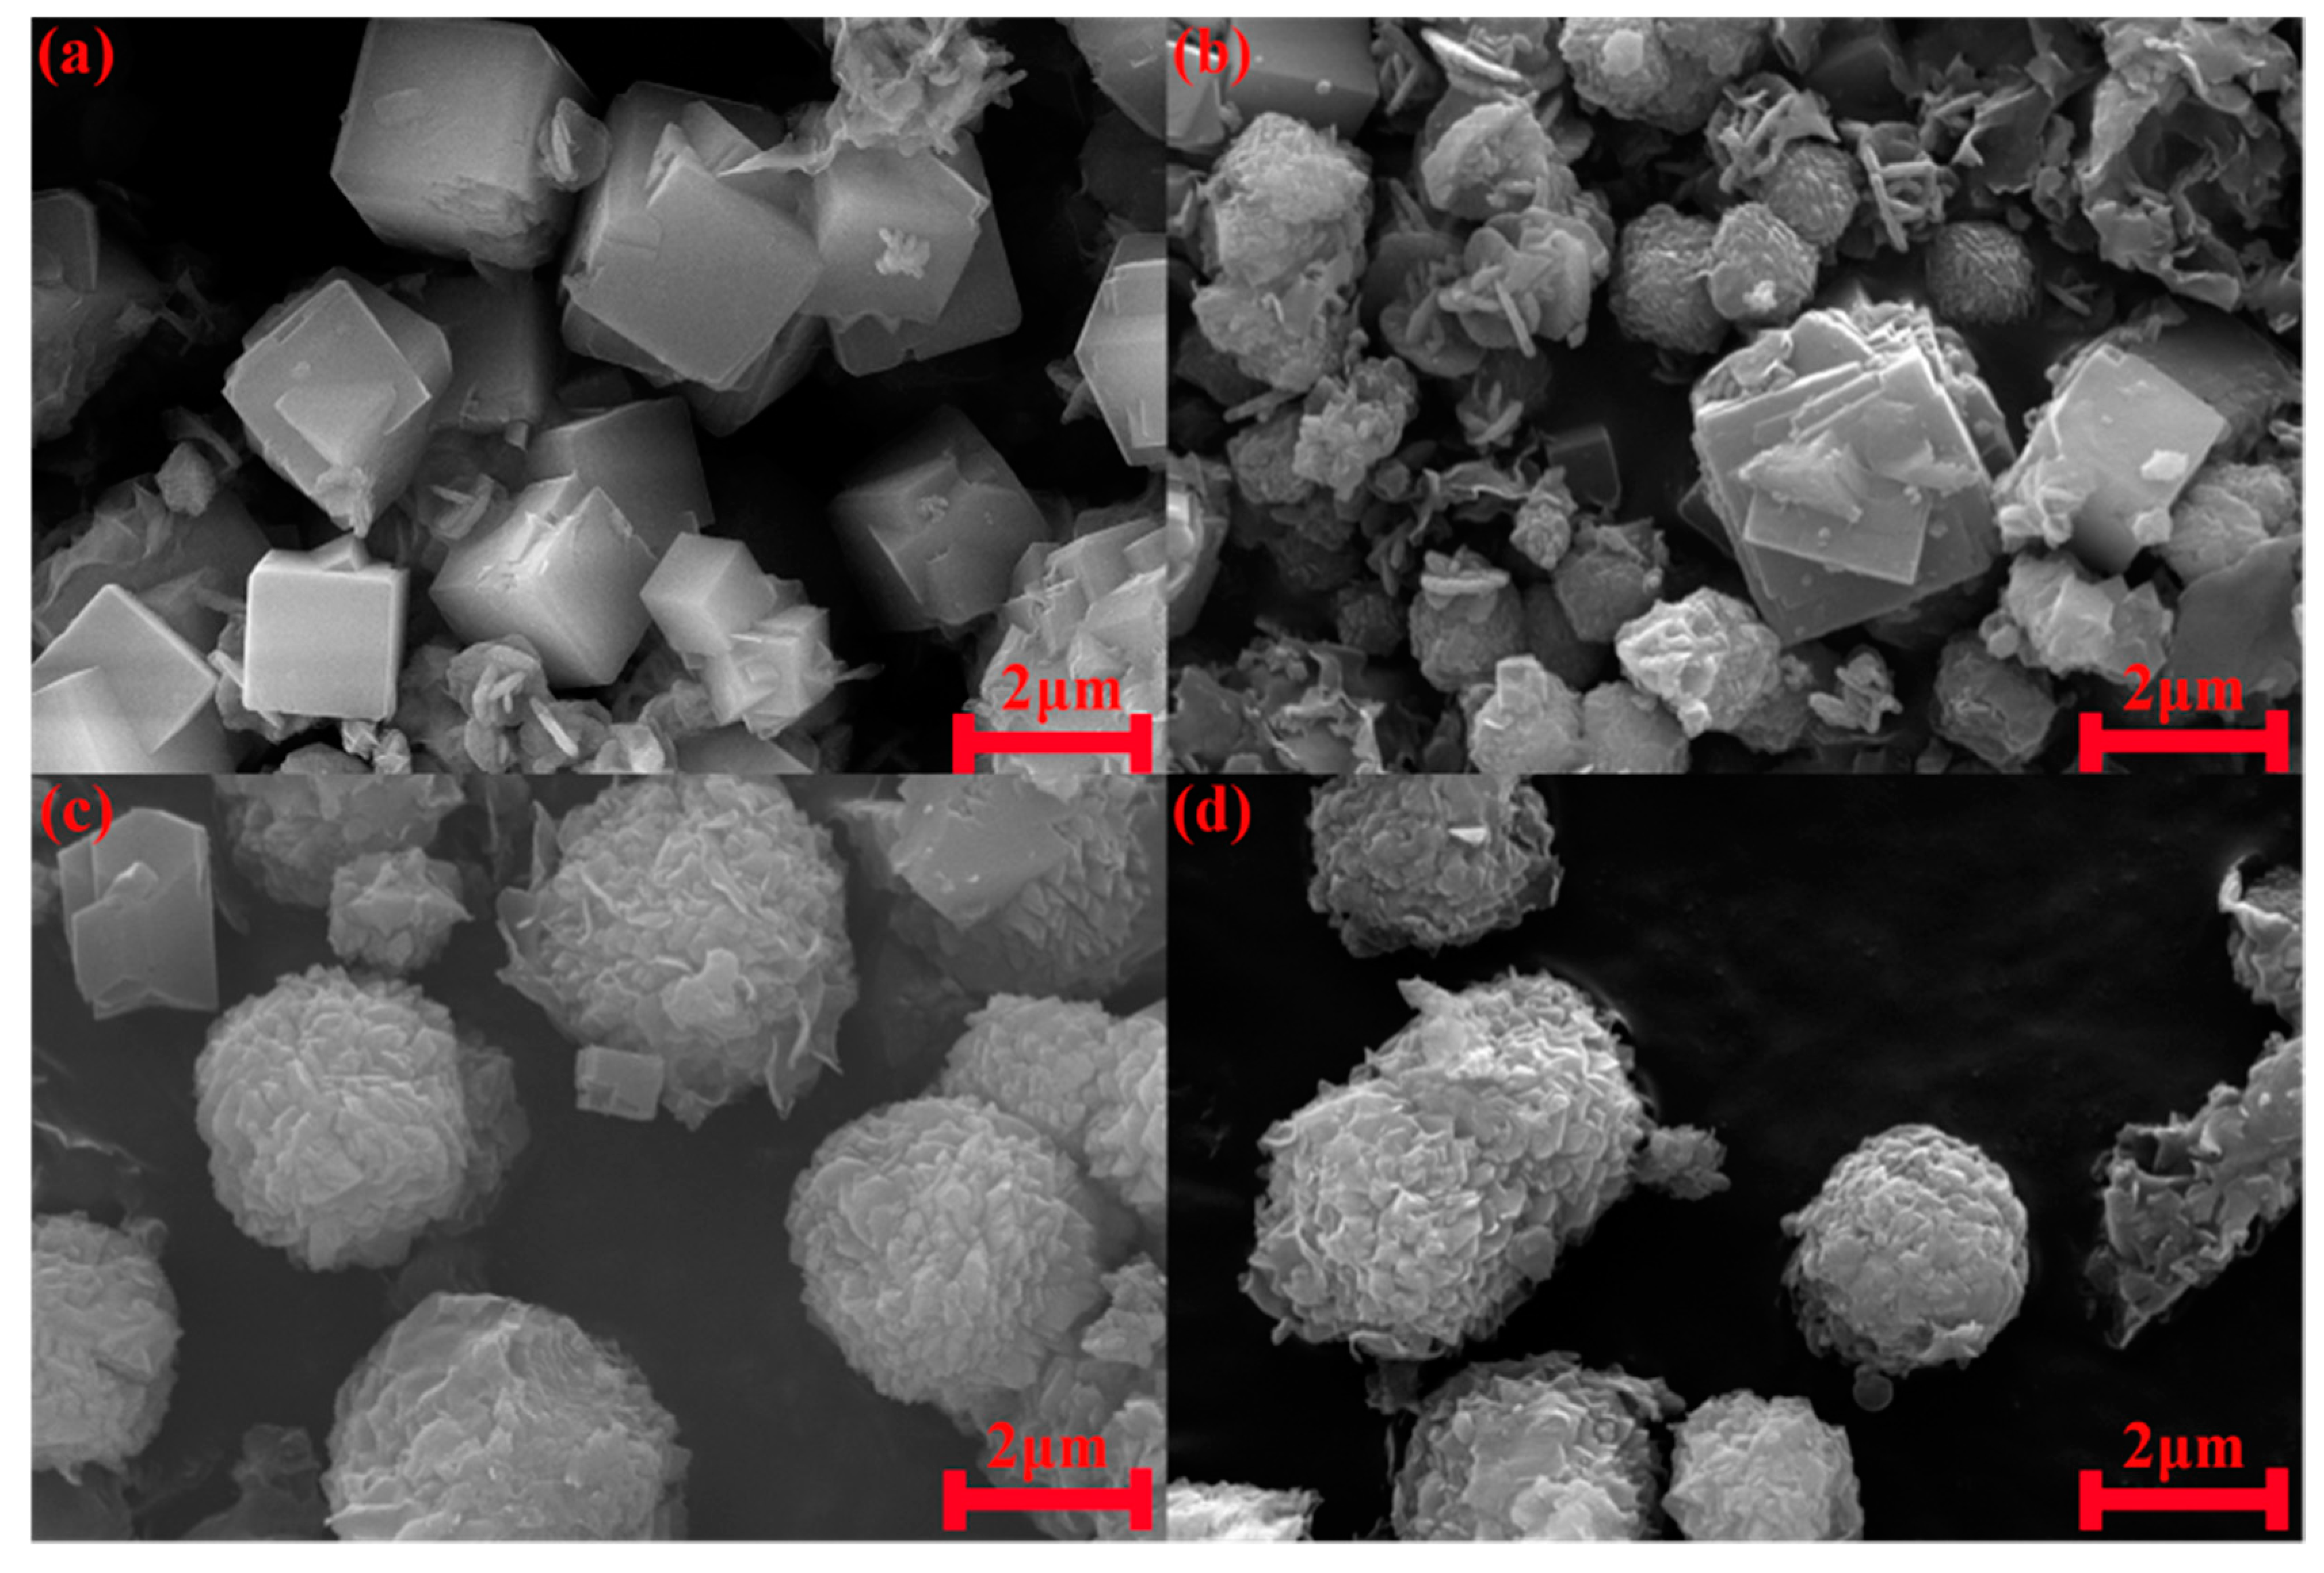
Figure 13.
XRD of synthetic products obtained from different reaction times.
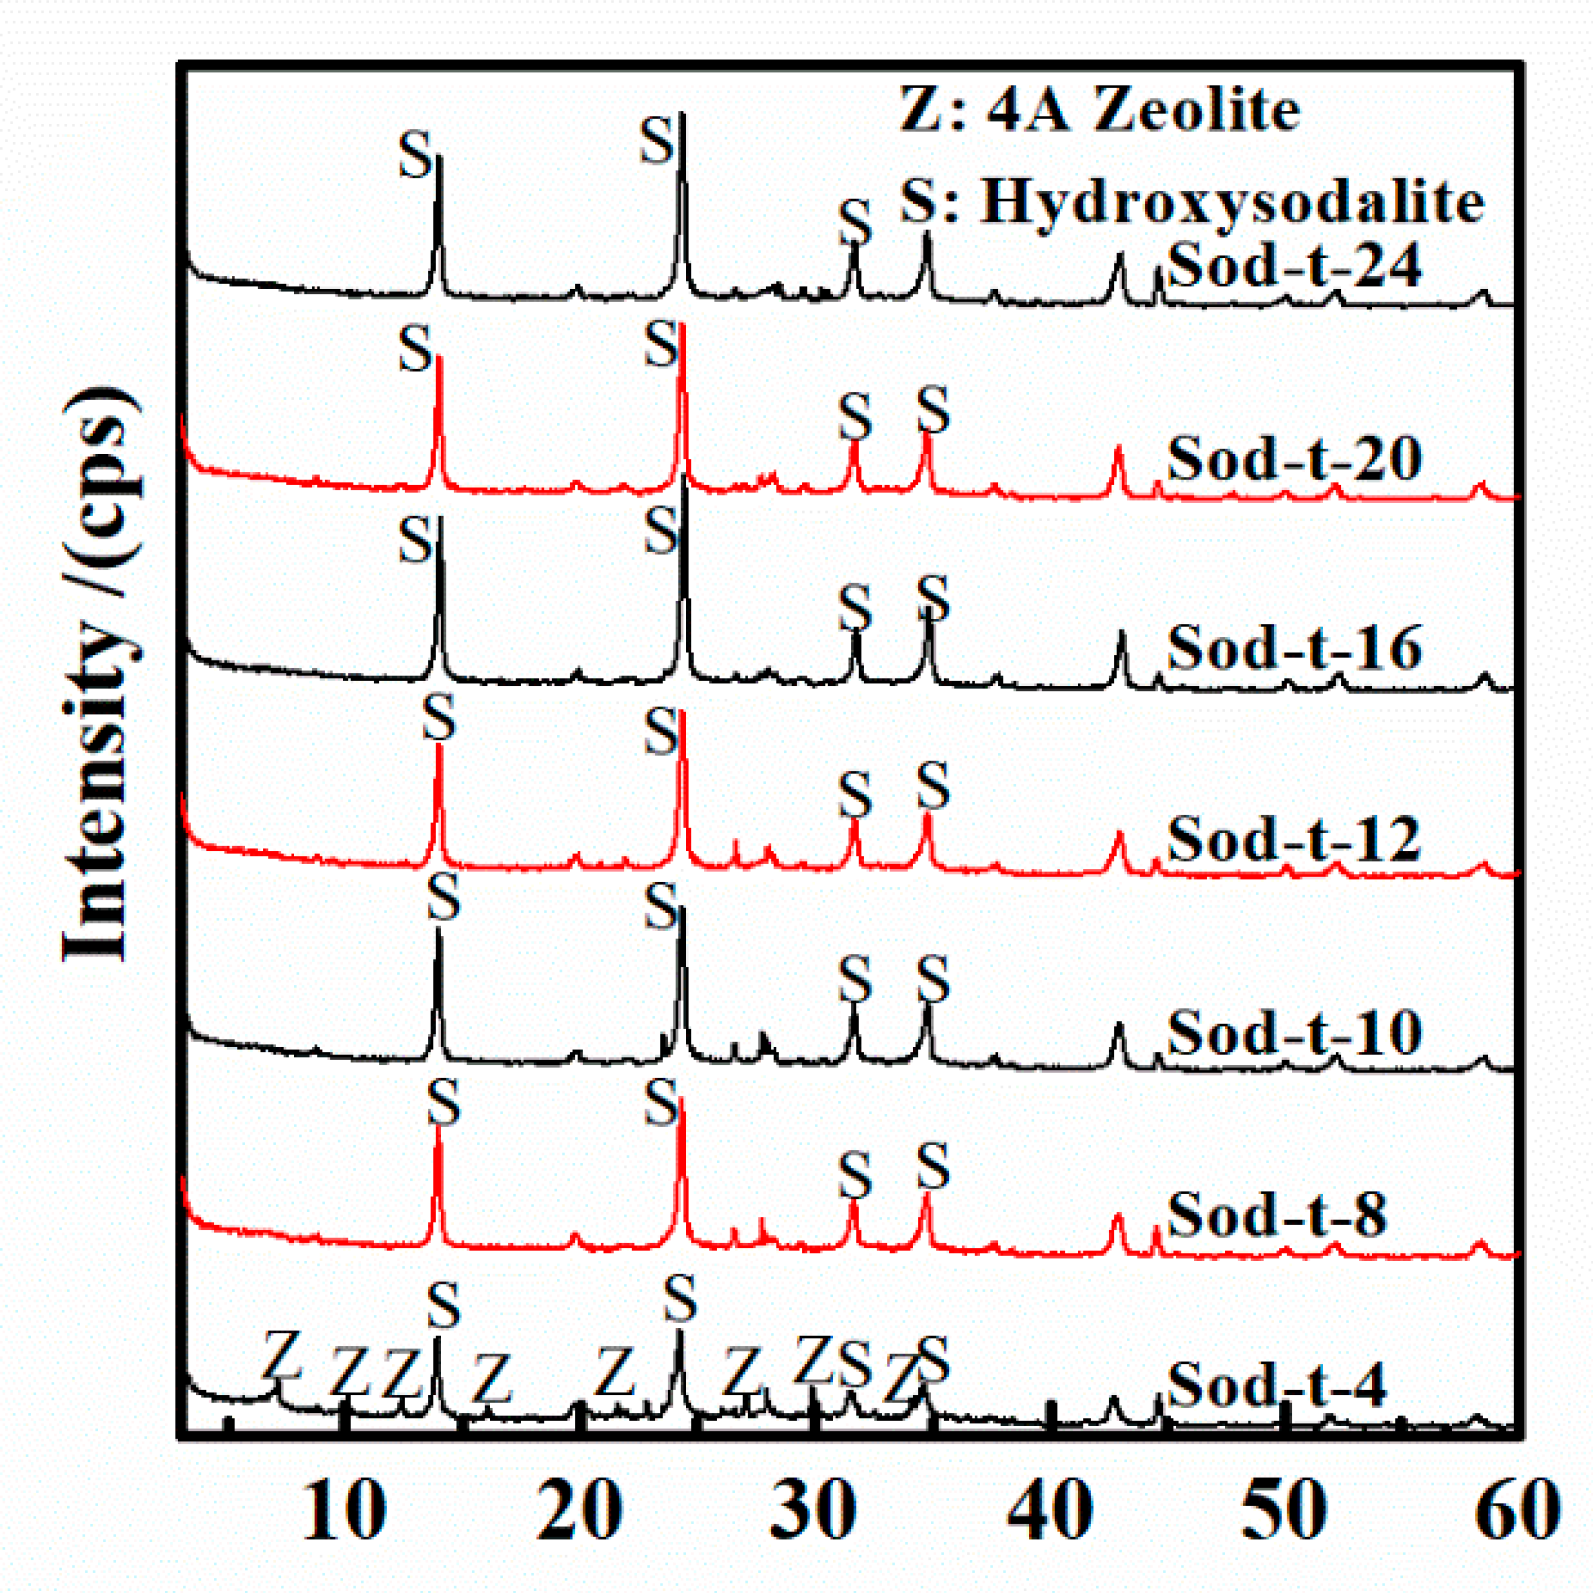
Figure 14.
Crystallinity of synthetic products obtained from different reaction times.
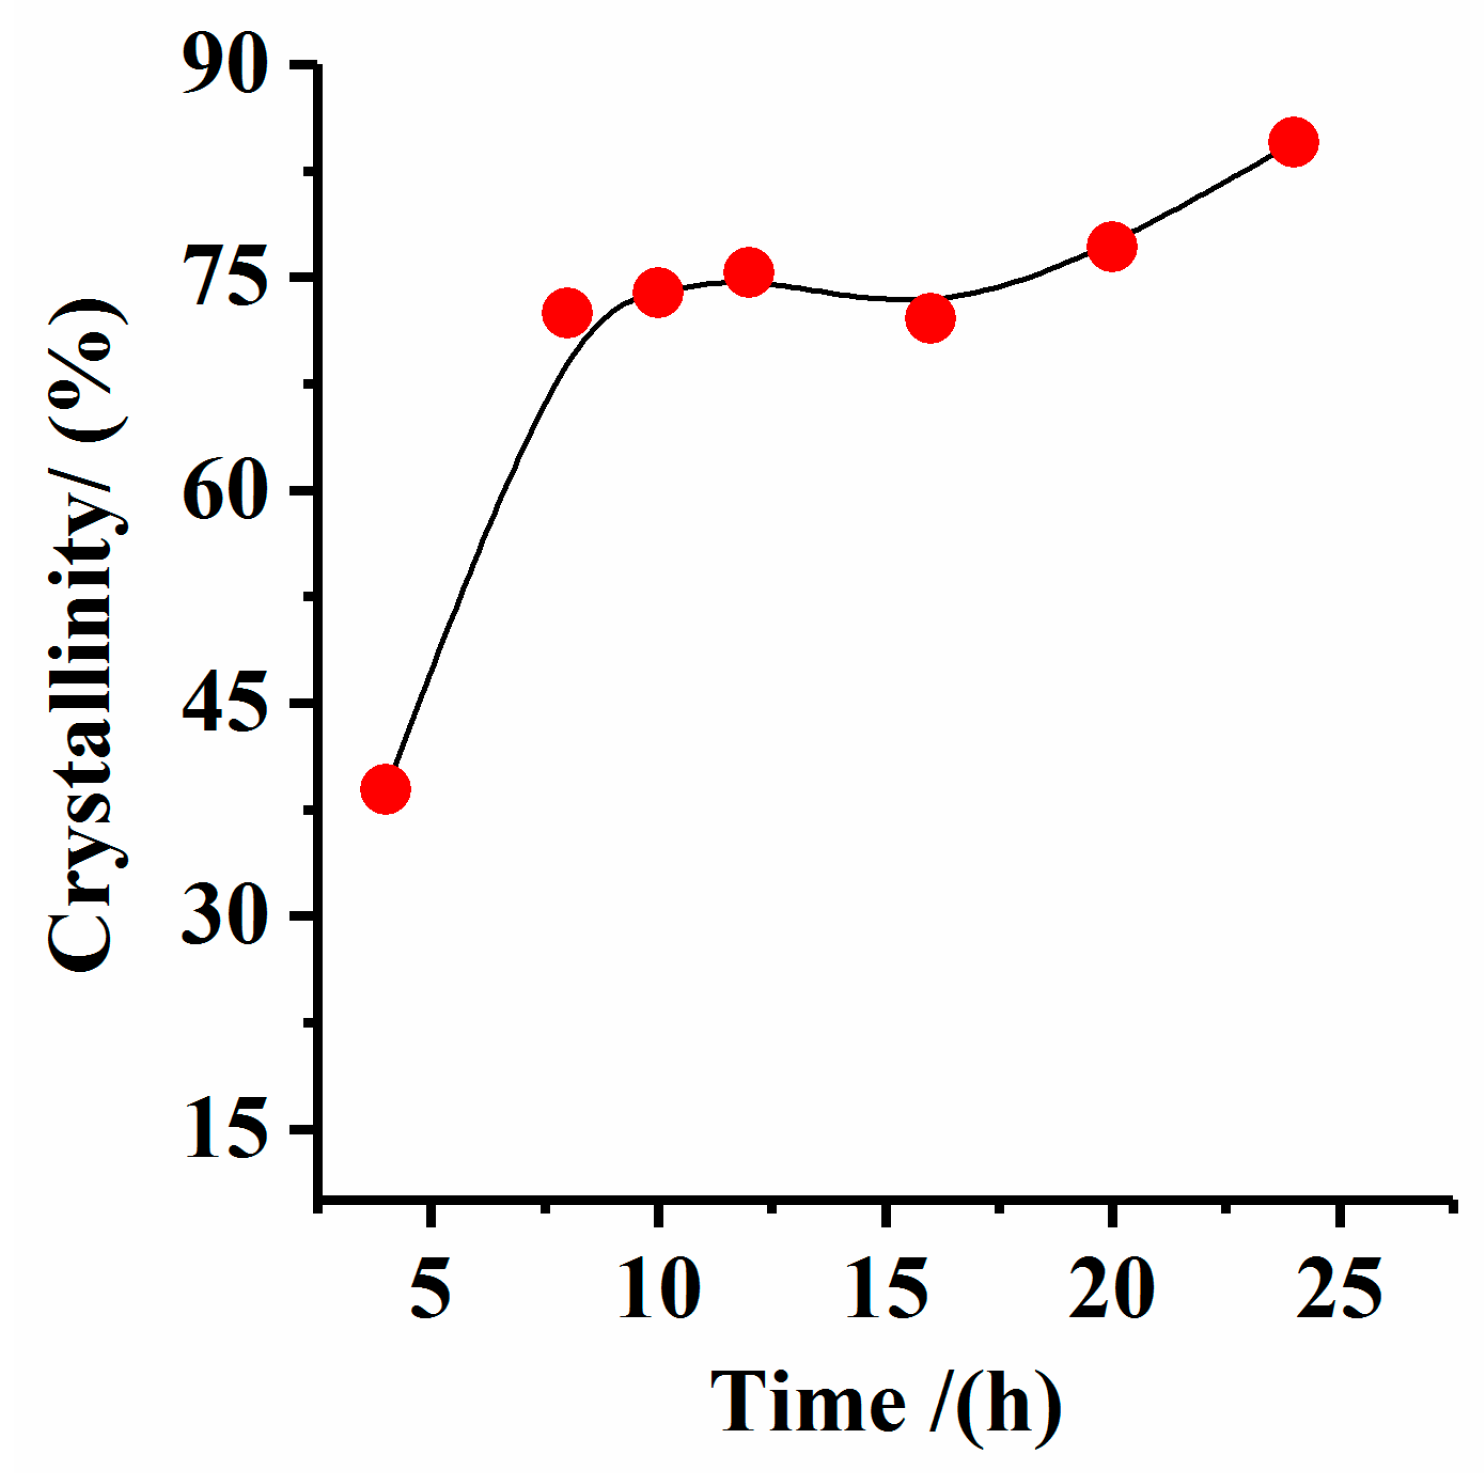
Figure 15.
SEM of synthetic products obtained from different reaction times. (a) reaction time = 4 h; (b) reaction time = 8 h; (c) reaction time = 10 h; (d) reaction time = 12 h.
Figure 15.
SEM of synthetic products obtained from different reaction times. (a) reaction time = 4 h; (b) reaction time = 8 h; (c) reaction time = 10 h; (d) reaction time = 12 h.
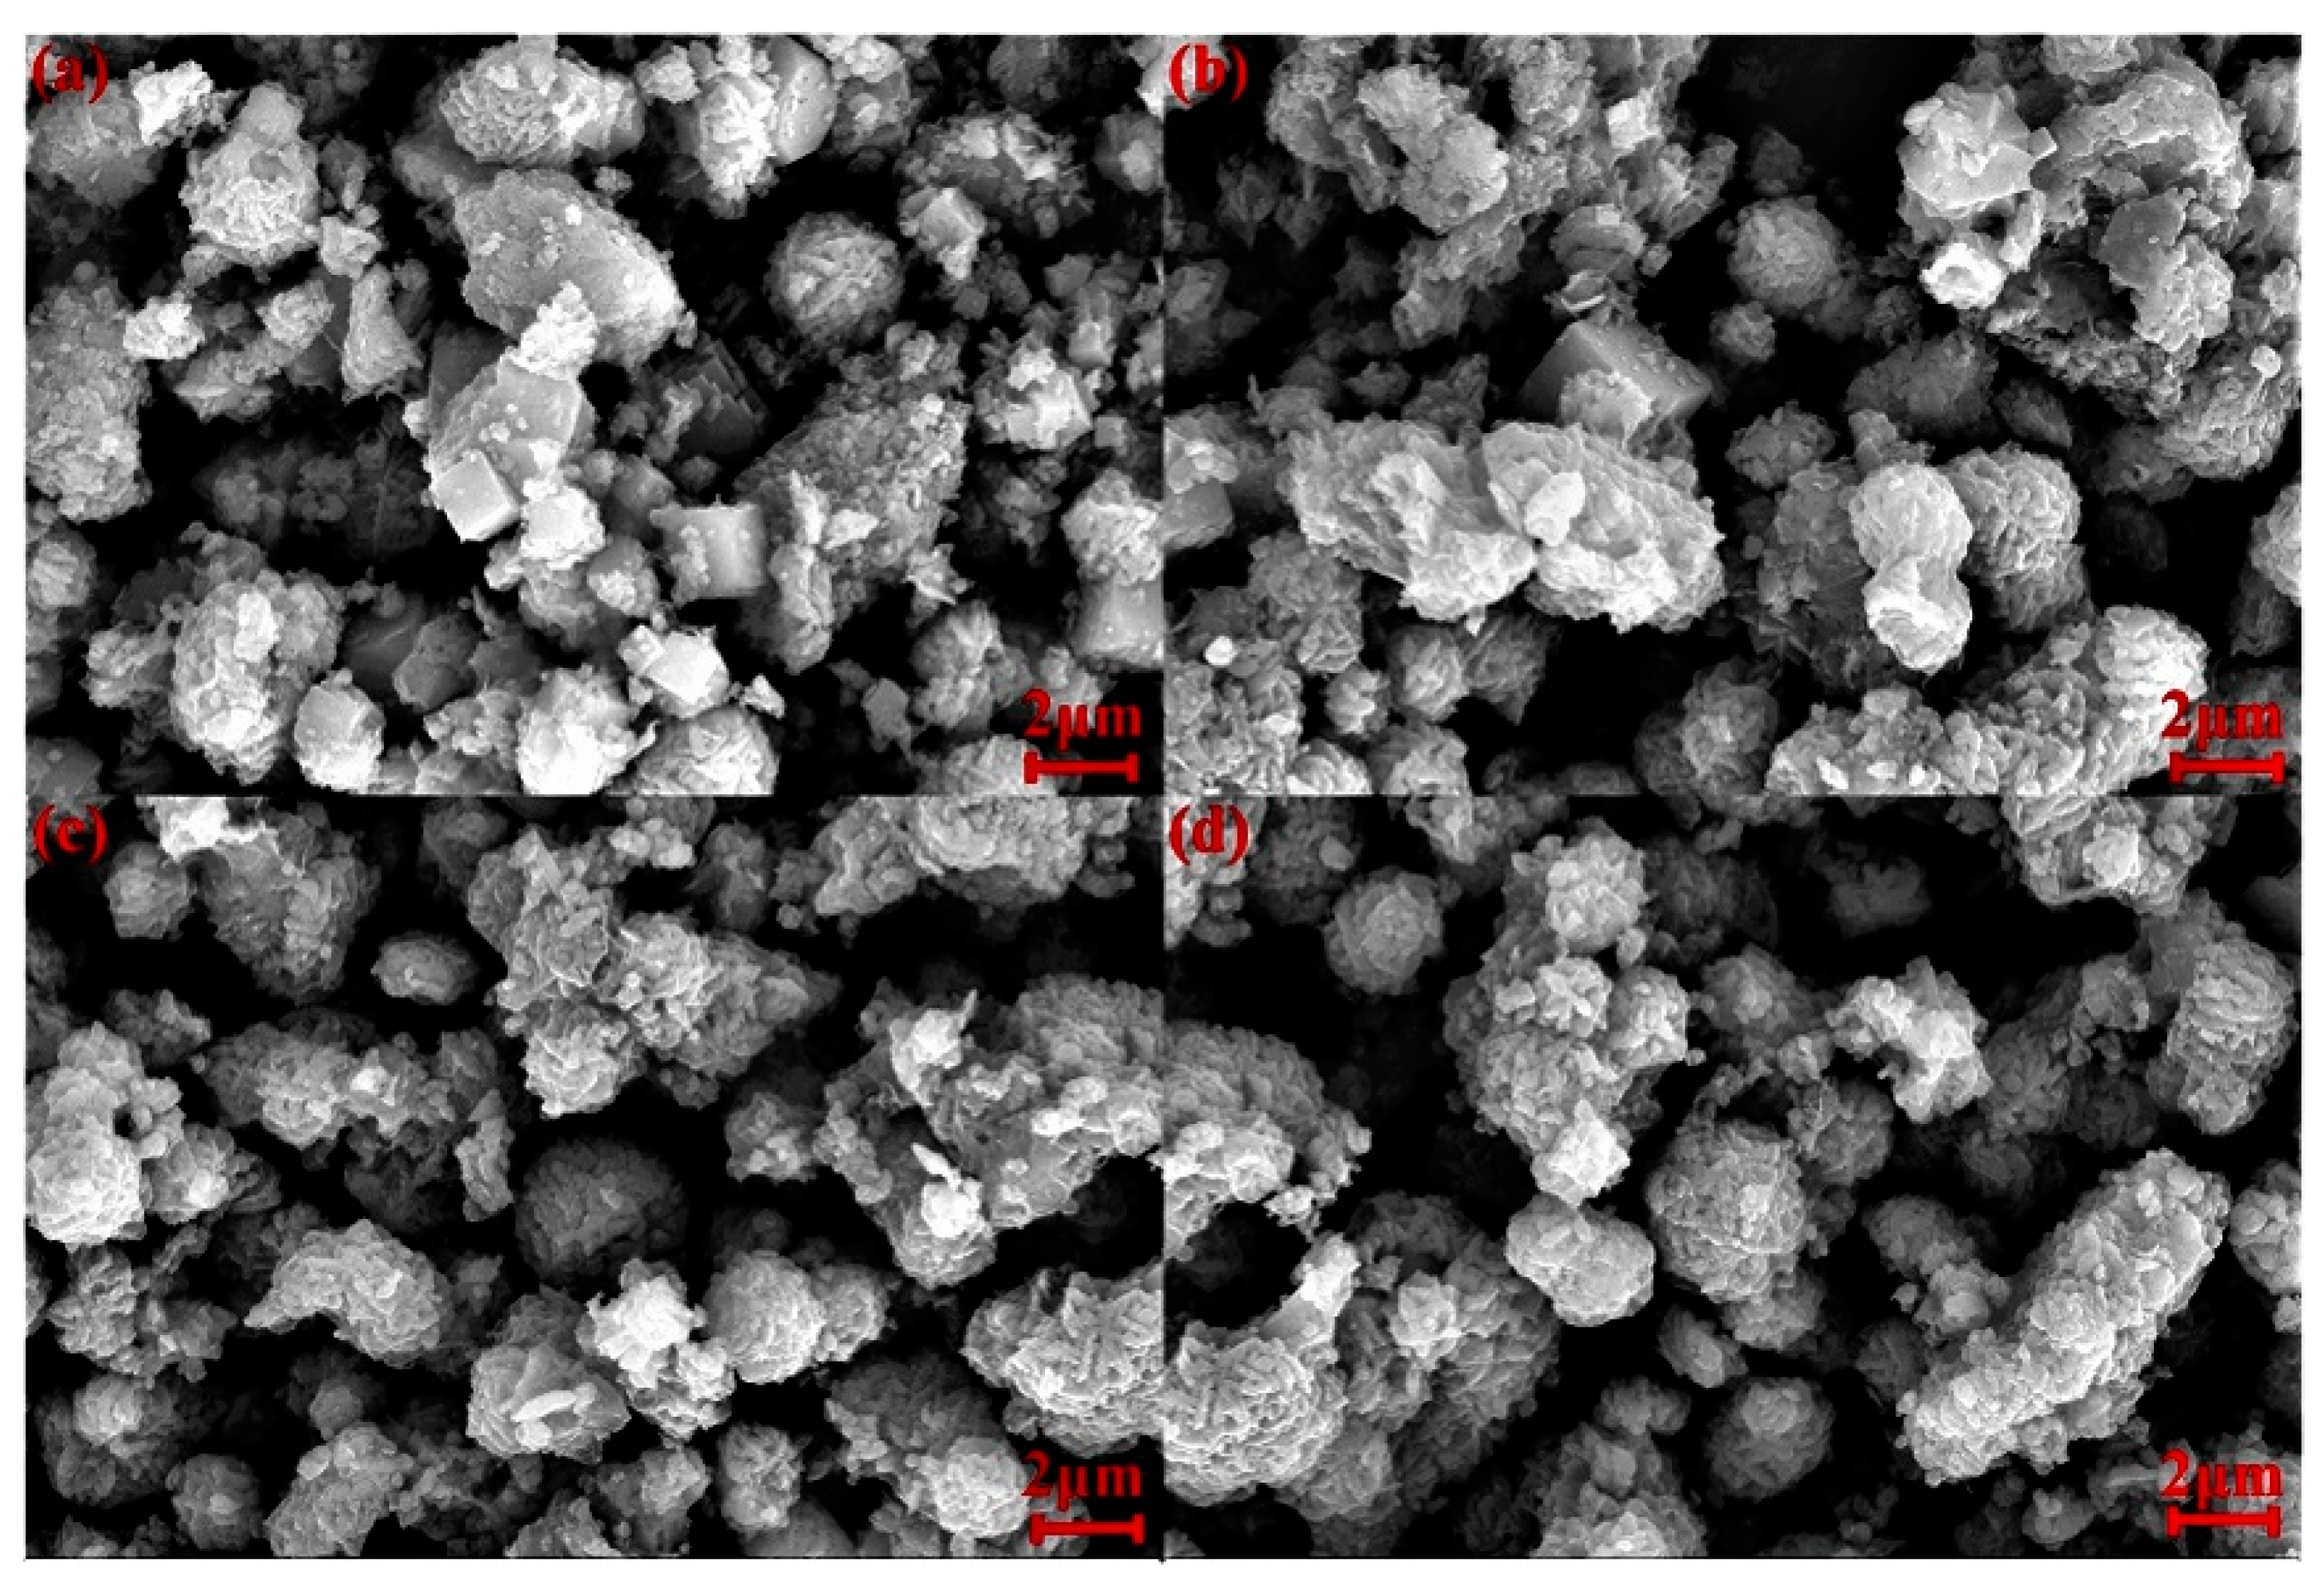
Figure 16.
Characterization of synthetic hydroxysodalite. (a) Fourier transform infrared (FTIR) spectrum; (b) Raman spectrum; (c) Thermogravimetry (TG) curve.
Figure 16.
Characterization of synthetic hydroxysodalite. (a) Fourier transform infrared (FTIR) spectrum; (b) Raman spectrum; (c) Thermogravimetry (TG) curve.


Table 1.
X-ray fluorescence (XRF) data of bentonite samples after normalizing (wt. %).
| Sample | SiO2 | Al2O3 | Fe2O3 | MgO | CaO | Na2O | TiO2 | K2O | LOI |
|---|---|---|---|---|---|---|---|---|---|
| Bentonite | 67.73 | 11.54 | 1.75 | 1.64 | 1.74 | 0.01 | 0.09 | 0.28 | 15.30 |
Table 2.
Synthetic scheme of hydroxysodalite.
| NO. | Bentonite (g) | NaOH (g) | NaAlO2 (g) | T (°C) | t (h) | H2O (mL) |
|---|---|---|---|---|---|---|
| Sod-Na/Si-3 | 1 | 0.99 | 0.74 | 90 | 12 | 35 |
| Sod-Na/Si-6 | 1 | 2.35 | 0.74 | 90 | 12 | 35 |
| Sod-Na/Si-8 | 1 | 3.25 | 0.74 | 90 | 12 | 35 |
| Sod-Na/Si-10 | 1 | 4.15 | 0.74 | 90 | 12 | 35 |
| Sod-Na/Si-12 | 1 | 5.06 | 0.74 | 90 | 12 | 35 |
| Sod-Na/Si-14 | 1 | 5.96 | 0.74 | 90 | 12 | 35 |
| Sod-Na/Si-20 | 1 | 8.67 | 0.74 | 90 | 12 | 35 |
| Sod-Si/Al-0.5 | 1 | 4.61 | 1.67 | 90 | 12 | 35 |
| Sod-Si/Al-0.75 | 1 | 4.91 | 1.05 | 90 | 12 | 35 |
| Sod-Si/Al-1.0 | 1 | 5.06 | 0.74 | 90 | 12 | 35 |
| Sod-Si/Al-1.5 | 1 | 5.21 | 0.43 | 90 | 12 | 35 |
| Sod-Si/Al-2.0 | 1 | 5.28 | 0.28 | 90 | 12 | 35 |
| Sod-T-60 | 1 | 5.06 | 0.74 | 60 | 12 | 35 |
| Sod-T-70 | 1 | 5.06 | 0.74 | 70 | 12 | 35 |
| Sod-T-80 | 1 | 5.06 | 0.74 | 80 | 12 | 35 |
| Sod-T-90 | 1 | 5.06 | 0.74 | 90 | 12 | 35 |
| Sod-T-100 | 1 | 5.06 | 0.74 | 100 | 12 | 35 |
| Sod-t-4 | 1 | 5.06 | 0.74 | 90 | 4 | 35 |
| Sod-t-8 | 1 | 5.06 | 0.74 | 90 | 8 | 35 |
| Sod-t-10 | 1 | 5.06 | 0.74 | 90 | 10 | 35 |
| Sod-t-12 | 1 | 5.06 | 0.74 | 90 | 12 | 35 |
| Sod-t-16 | 1 | 5.06 | 0.74 | 90 | 16 | 35 |
| Sod-t-20 | 1 | 5.06 | 0.74 | 90 | 20 | 35 |
| Sod-t-24 | 1 | 5.06 | 0.74 | 90 | 24 | 35 |
© 2018 by the authors. Licensee MDPI, Basel, Switzerland. This article is an open access article distributed under the terms and conditions of the Creative Commons Attribution (CC BY) license (http://creativecommons.org/licenses/by/4.0/).
Share and Cite
MDPI and ACS Style
Liu, B.; Sun, H.; Peng, T.; He, Q. One-Step Synthesis of Hydroxysodalite Using Natural Bentonite at Moderate Temperatures. Minerals 2018, 8, 521. https://doi.org/10.3390/min8110521
AMA Style
Liu B, Sun H, Peng T, He Q. One-Step Synthesis of Hydroxysodalite Using Natural Bentonite at Moderate Temperatures. Minerals. 2018; 8(11):521. https://doi.org/10.3390/min8110521
Chicago/Turabian StyleLiu, Bo, Hongjuan Sun, Tongjiang Peng, and Qian He. 2018. "One-Step Synthesis of Hydroxysodalite Using Natural Bentonite at Moderate Temperatures" Minerals 8, no. 11: 521. https://doi.org/10.3390/min8110521
Note that from the first issue of 2016, this journal uses article numbers instead of page numbers. See further details here.