Total Porosity Measured for Shale Gas Reservoir Samples: A Case from the Lower Silurian Longmaxi Formation in Southeast Chongqing, China


1
School of Geosciences, China University of Petroleum (East China), Qingdao 266580, China
2
State Key Laboratory of Oil and Gas Reservoir Geology and Exploitation, Chengdu University of Technology, Chengdu 610059, China
3
College of Earth Science, University of Chinese Academy of Sciences, Beijing 100049, China
*
Authors to whom correspondence should be addressed.
Minerals 2019, 9(1), 5; https://doi.org/10.3390/min9010005
Submission received: 22 November 2018
/
Revised: 18 December 2018
/
Accepted: 21 December 2018
/
Published: 22 December 2018
(This article belongs to the Special Issue Nanomineralogy)
Abstract
:Measuring total porosity in shale gas reservoir samples remains a challenge because of the fine-grained texture, low porosity, ultra-low permeability, and high content of organic matter (OM) and clay mineral. The composition content porosimetry method, which is a new method for the evaluation of the porosity of shale samples, was used in this study to measure the total porosity of shale gas reservoir samples from the Lower Silurian Longmaxi Formation in Southeast Chongqing, China, based on the bulk and grain density values. The results from the composition content porosimetry method were compared with those of the Gas Research Institute method. The results showed that the composition content porosimetry porosity values of shale gas reservoir samples range between 2.05% and 5.87% with an average value of 4.04%. The composition content porosimetry porosity generally increases with increasing OM and clay content, and decreases with increasing quartz and feldspar content. The composition content porosimetry results are similar to the gas research institute results, and the differences between the two methods range from 0.05% to 1.52% with an average value of 0.85%.
1. Introduction
Total porosity is the key parameter for resource evaluation and petroleum reserve calculation, especially for shale gas reservoirs. Porosity is defined as the percentage of pore or void volume of the porous sample in the bulk volume. A pore is the part of rock occupied by fluids. This definition is complicated in shale due to the presence of clay minerals and the variability in organic matter (OM). For shale samples, total porosity is the water content having molecular interaction with clay minerals, plus the free fluid (water, gaseous, and liquid hydrocarbons) in the relatively larger open pore and capillary spaces [1]. The total porosity measurement for shale gas reservoir samples is a particular problem because shale gas reservoir samples are organic-rich, low porosity and ultra-low permeability with strong heterogeneity [2,3,4]. Routine core analyses and traditional methods for measuring the porosity of shale gas reservoir samples have unreliable accuracy and suitability [5,6,7]. The pore systems in shale gas reservoirs are complex and diverse due to different sedimentation and diagenesis processes with different contents, types, and maturities of OM [8,9,10,11]. Pores in shale gas reservoir samples are much smaller than those in conventional carbonate and sandstone reservoirs [12,13,14]. The pore types include microfracture, microchannel, intraparticle pore, intercrystal pore, organopore, and fossil fragment pore [15]. At present, the techniques available for the measurement of micro-pore characteristics of shale samples are divided into two categories: the radiation method and the penetration fluids method [16].
The radiation methods include scanning electron microscopy (SEM), field emission scanning electron microscopy (FE-SEM), backscatter mode (BS), transmission electron microscopy (TEM), small-angle neutron scattering (SANS), ultra-small-angle neutron scattering (USANS), three-dimensional (3D) reconstruction technology, and computed tomography (CT). Most provide direct visual observation of microscopic features in shale samples [17,18,19,20,21]. 3D image reconstruction technology can be used to investigate shale microstructure and analyze the characteristics of pores. For the radiation methods, a higher resolution corresponds to a smaller sample size [22], and the smaller samples are less representative given shale’s heterogeneity [16,19]. The penetration fluid methods include low temperature nitrogen adsorption/desorption (LTNA), mercury intrusion porosimetry (MIP), and nuclear magnetic resonance (NMR). The first two methods refer to injecting non-wetting fluid into a shale sample and recording the fluid volume and injection pressure. Then, the pore size distribution and specific surface area are calculated using several theoretical models [17,23,24,25]. Due to the differences in experimental environment (temperature and pressure) and injected fluid properties, LTNA and MIP methods have different detection ranges. The nanometer- to micrometer-scale pore systems in shale samples were evaluated by combining their results [17,23]. However, LTNA and MIP methods can only reflect interconnected pores, as the injected fluids cannot access isolated pores [16]. The result of the MIP method reflects the pore volumes connected by throats, corresponding to the pressure of injecting, which are much smaller than pore size [26,27]. NMR technology is used for evaluating the pore size distribution in saturated liquid samples [24], which can show the pore size and pore volume filling liquid regardless of the pores being connected or isolated.
Porosity measurement for shale is still challenging because of its fine-grained texture, low porosity, ultra-low permeability, and high content of OM and clay mineral. The Gas Research Institute (GRI) method is commonly used to evaluate the total porosity of shale gas reservoir samples. The GRI method uses the grain density and bulk density to calculate the total porosity of a shale gas reservoir sample [1,28]. There are several significant uncertainties in grain density measurement: (1) the crushing process is without standard, (2) the relative humidity (RH) of the measurement environment may change the gas saturation of the sample, (3) the pretreatment of hot toluene may dissolve macromolecular hydrocarbons and part of the solid bitumen [1], and (4) the matrix volume is underestimated because of the gas adsorbed by nanoscale pores.
A method using the results of quantitative X-ray diffraction (XRD) to calculate the total porosity of shale gas reservoir sample is introduced in this study. A systematic study of the method, including experimental uncertainty and the relationship between total porosity and content of various minerals, was performed on the Lower Silurian Longmaxi Shale in Southeast Chongqing, China. The results were compared with those of the GRI method on a series of parallel samples from the same depth.
2. Materials and Methods
2.1. Samples
Twenty-seven shale core samples from the Lower Silurian Longmaxi Shale of the Py1 well in Southeast Chongqing, China, were selected for measuring total porosity. Southeast Chongqing belongs to the Yangtze tectonic plate and is located in the Wuling Drape Zone and Western Hunan-Hubei Thrust Belt. The Xuefengshan Uplift and Sichuan Basin lie to the east and northwest of Southeast Chongqing, respectively (Figure 1). The sub-samples from these core samples were crushed to <425 µm (<40 mesh) powder to obtain representative homogeneous samples [29], which were used for the following experiments.
2.2. TOC, Maturity and XRD Analyses
OM characterization, such as total organic carbon (TOC) content, type, and thermal maturity, were obtained using the Leco TOC and the Rock Eval II methodology. OM content is determined by TOC value divided by carbon element weight percentage in OM [18]. The mineralogical compositions of the samples were obtained based on XRD patterns measured on randomly oriented powder preparations using an Ultima IV X-ray diffractometer (Rigaku, Tokyo, Japan) at 40 kV and 30 mA with Cu Kα radiation (λ = 1.5406 for CuKα1). The crystalline mineral proportions were calculated based on the areas under the peaks corresponding to each mineral and corrected using Lorentz Polarization [30]. In this measurement, we recorded the content of non-clay minerals, the total content, and the relative content of clay minerals.
2.3. CCP Method
The composition content porosimetry (CCP) method uses the grain density and bulk density to calculate the total porosity of a shale gas reservoir sample. The bulk density (ρB) of the sample is calculated using Equation (1). The bulk volume was measured by mercury immersion at less than 6.6 Pa (50 µm Hg) using Archimedes’ principle on a block sample of approximately 20 g without crushing. The bulk mass and grain mass were measured by balance set-up (Mettler Toledo AL104, readability 0.1 mg).
The grain density (ρG) of the sample is calculated using Equation (2):
where M is the unit mass of shale gas reservoir sample; m1, m2, …, mn−1, and mn are the masses of various mineral and organic matter components in terms of unit mass of shale gas reservoir sample; ρ1, ρ2, …, ρn−1, and ρn are the true density values of various minerals and OM; and n is the number of components in the shale gas reservoir sample (Table 1) [31,32]. The true density of the illite-smectite mixed layer was calculated by using the true density values of illite and smectite according to their relative content in the illite-smectite mixed layer.
The porosity (ΦCCP) of a shale gas reservoir sample measured by CCP is calculated using Equation (3):
The total porosity measured by CCP is the total porosity, including the contributions of microfractures, microchannels, intercrystal pores, intracrystalline pores, and organopores.
2.4. GRI Method
In the GRI method, the bulk density was calculated using the bulk mass and the bulk volume, and the grain density was calculated using the grain mass and the grain volume. The bulk volume was measured by mercury immersion at less than 6.6 Pa (50 µmHg) using Archimedes’ principle on a block sample of approximately 20 g without crushing. The grain volume was measured using He pycnometry and Boyle’s law on the crushed sample, which was pretreated in an oven for 12–16 h at 80 °C to drive off any pore fluids such as water, oil and adsorbed gas. The bulk mass and grain mass were measured by balance set-up (Mettler Toledo AL104, readability 0.1 mg).
3. Results
3.1. Composition of Sample
The TOC content of the samples ranged from 0.11% to 4.12% with an average value of 1.58% (Table 2). The δC13 of organic carbon ranged from –32.04‰ to –28.78‰, which indicates that the kerogen is type I–II1. Vitrinite reflectance (Ro) ranged from 1.91% to 3.09% with an average value of 2.66%, which indicates that the organic matter is in the stage of high thermal maturity [33]. The mineralogical compositions of the samples are composed of illite and smectite (14.0–49%), quartz (20.3–50.3%), orthoclase + plagioclase (5.9–18.3%) and carbonate minerals (2.3–31.5%, including calcite and dolomite). The content of smectite in illite-smectite mixed-layer ranged from 5% to 15%.
3.2. Sample Density
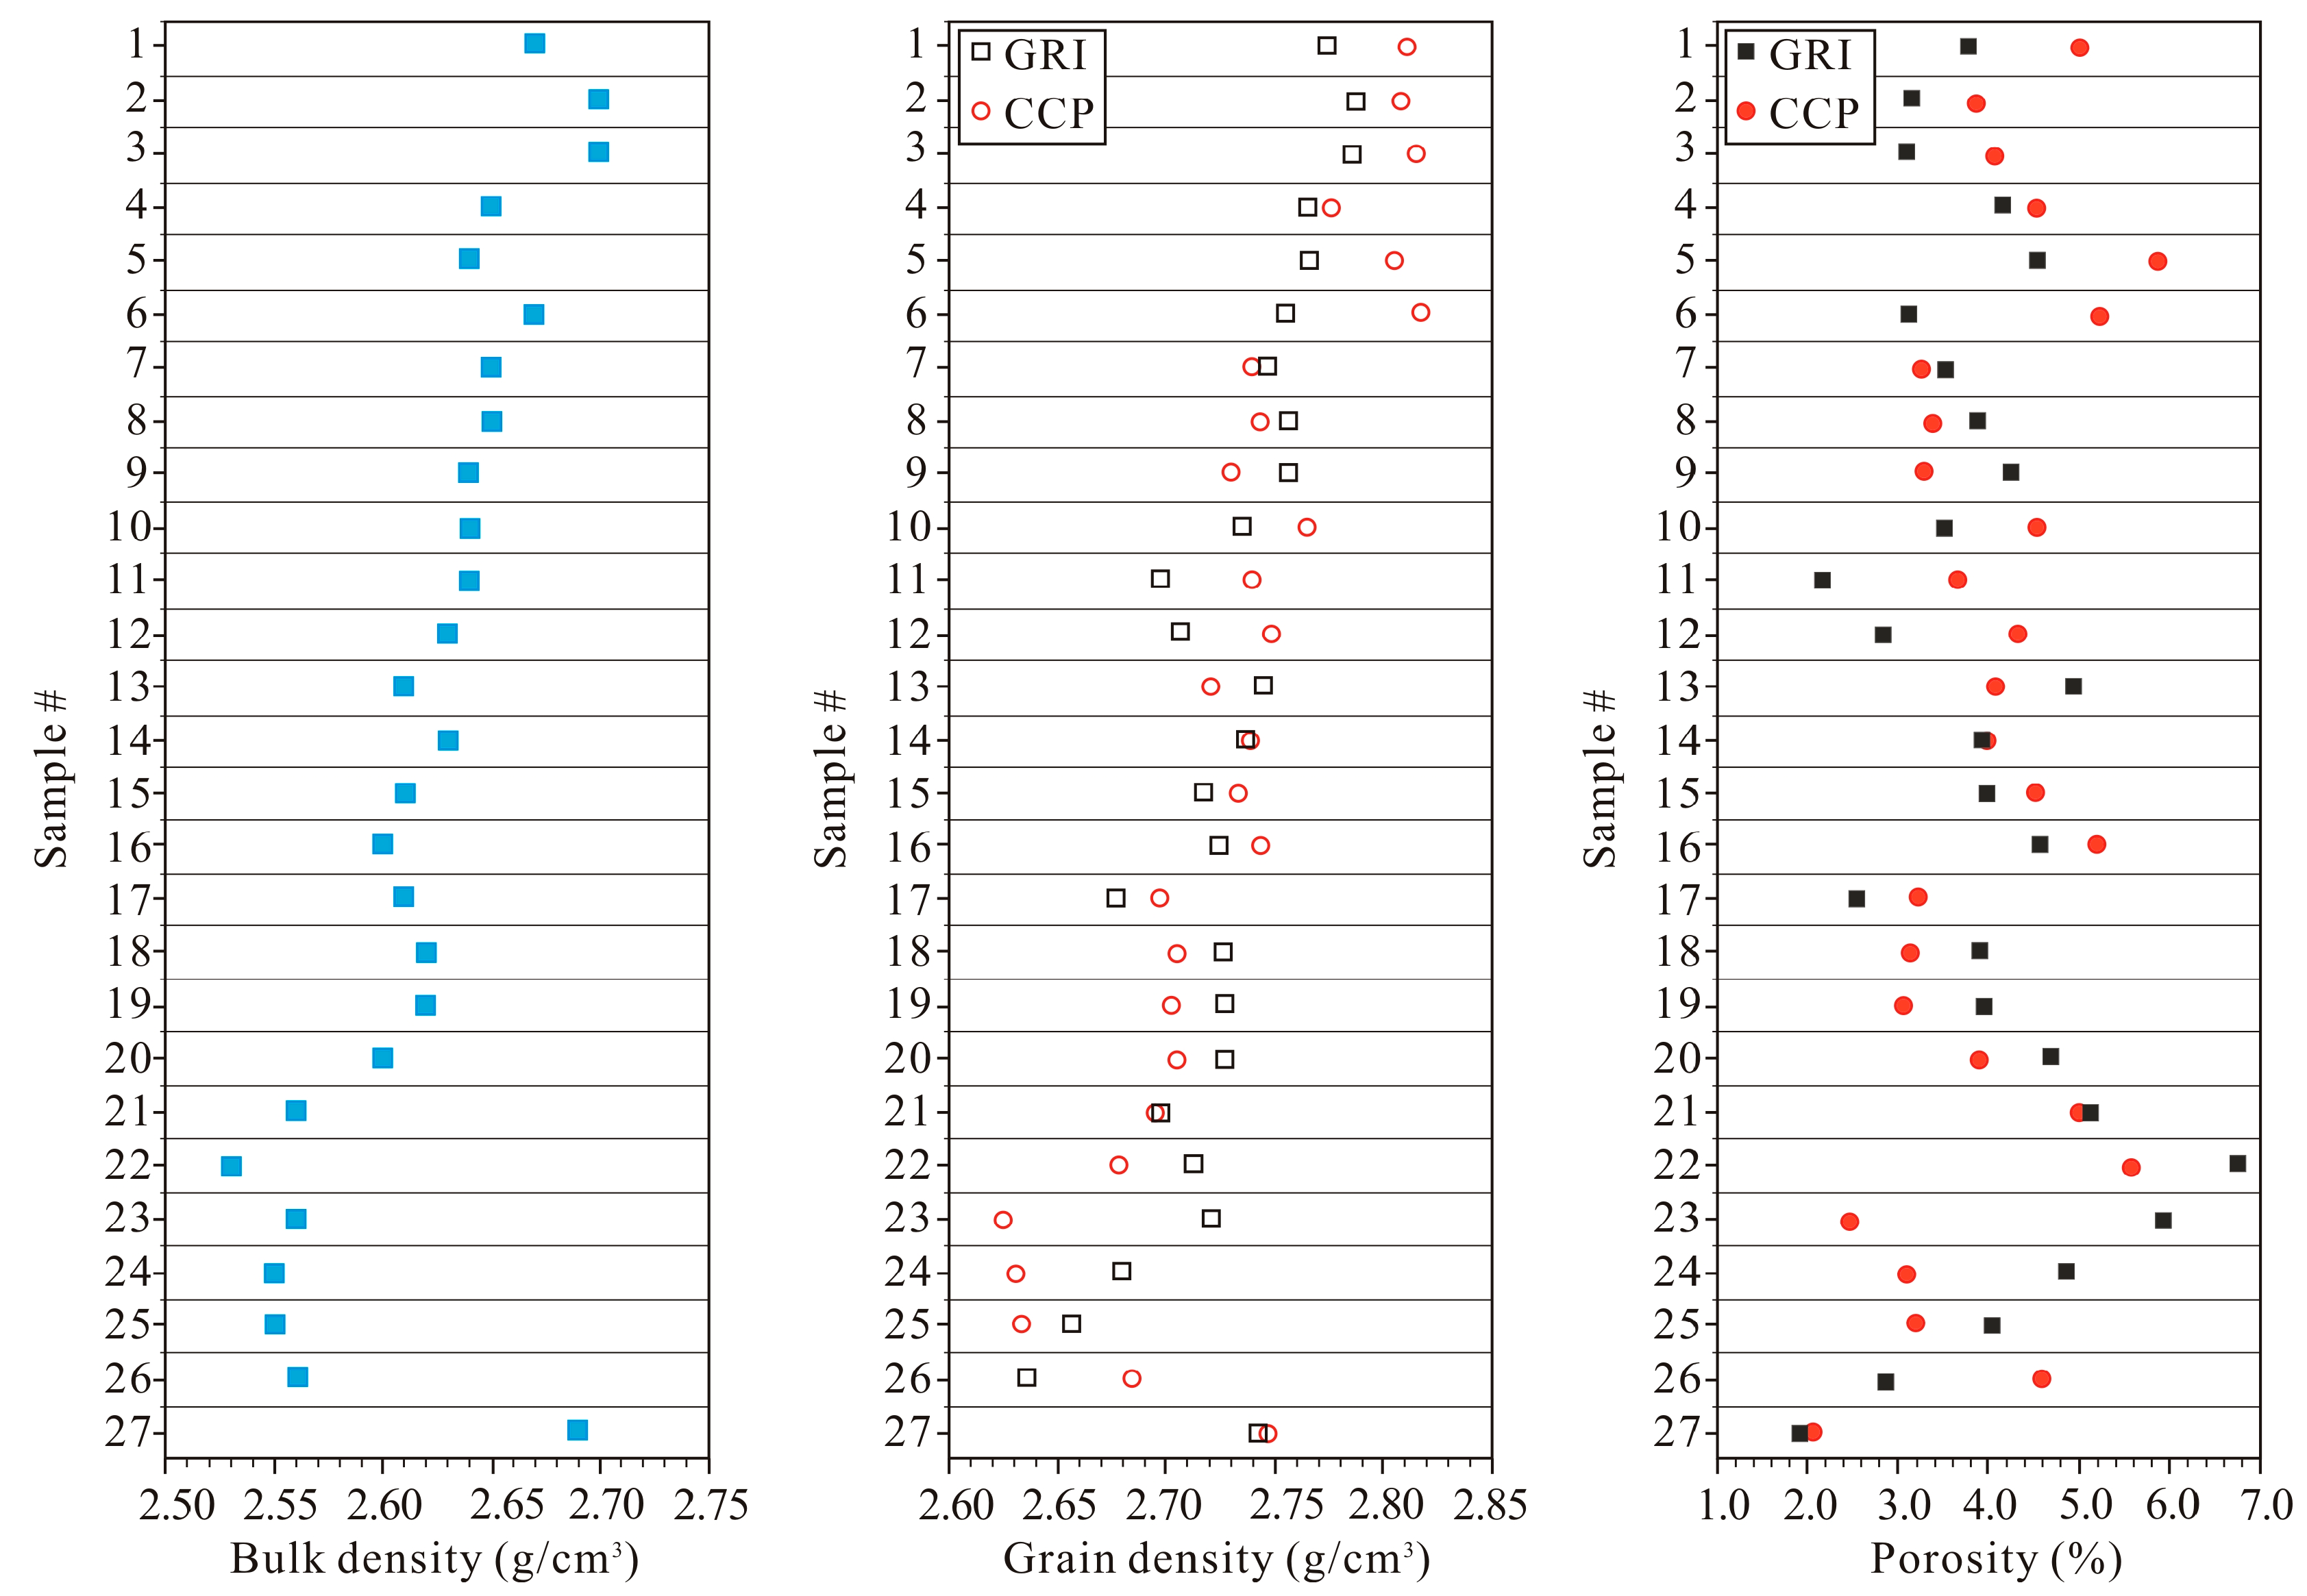
The CCP grain density values of the samples were calculated using Equation (2). The bulk density, GRI grain density, and CCP grain density values ranged from 2.525 to 2.701 g/cm3, 2.636 to 2.787 g/cm3, and 2.625 to 2.824 g/cm3 with average values of 2.622 g/cm3, 2.728 g/cm3, and 2.731 g/cm3, respectively (Figure 2).
3.3. Porosity Values from CCP and GRI Methods
The CCP porosity values of the 27 shale gas reservoir samples were calculated using Equation (3). The CCP porosity and GRI porosity values of these samples ranged from 2.05% to 5.87% and 1.90% to 6.75% with average values of 4.04% and 3.91%, respectively (Figure 2). The difference in the maximum and minimum GRI porosity ranged from 0.01 to 1.08% with a mean of 0.40%.
4. Discussion
4.1. Relationship between Compositions and CCP Porosity
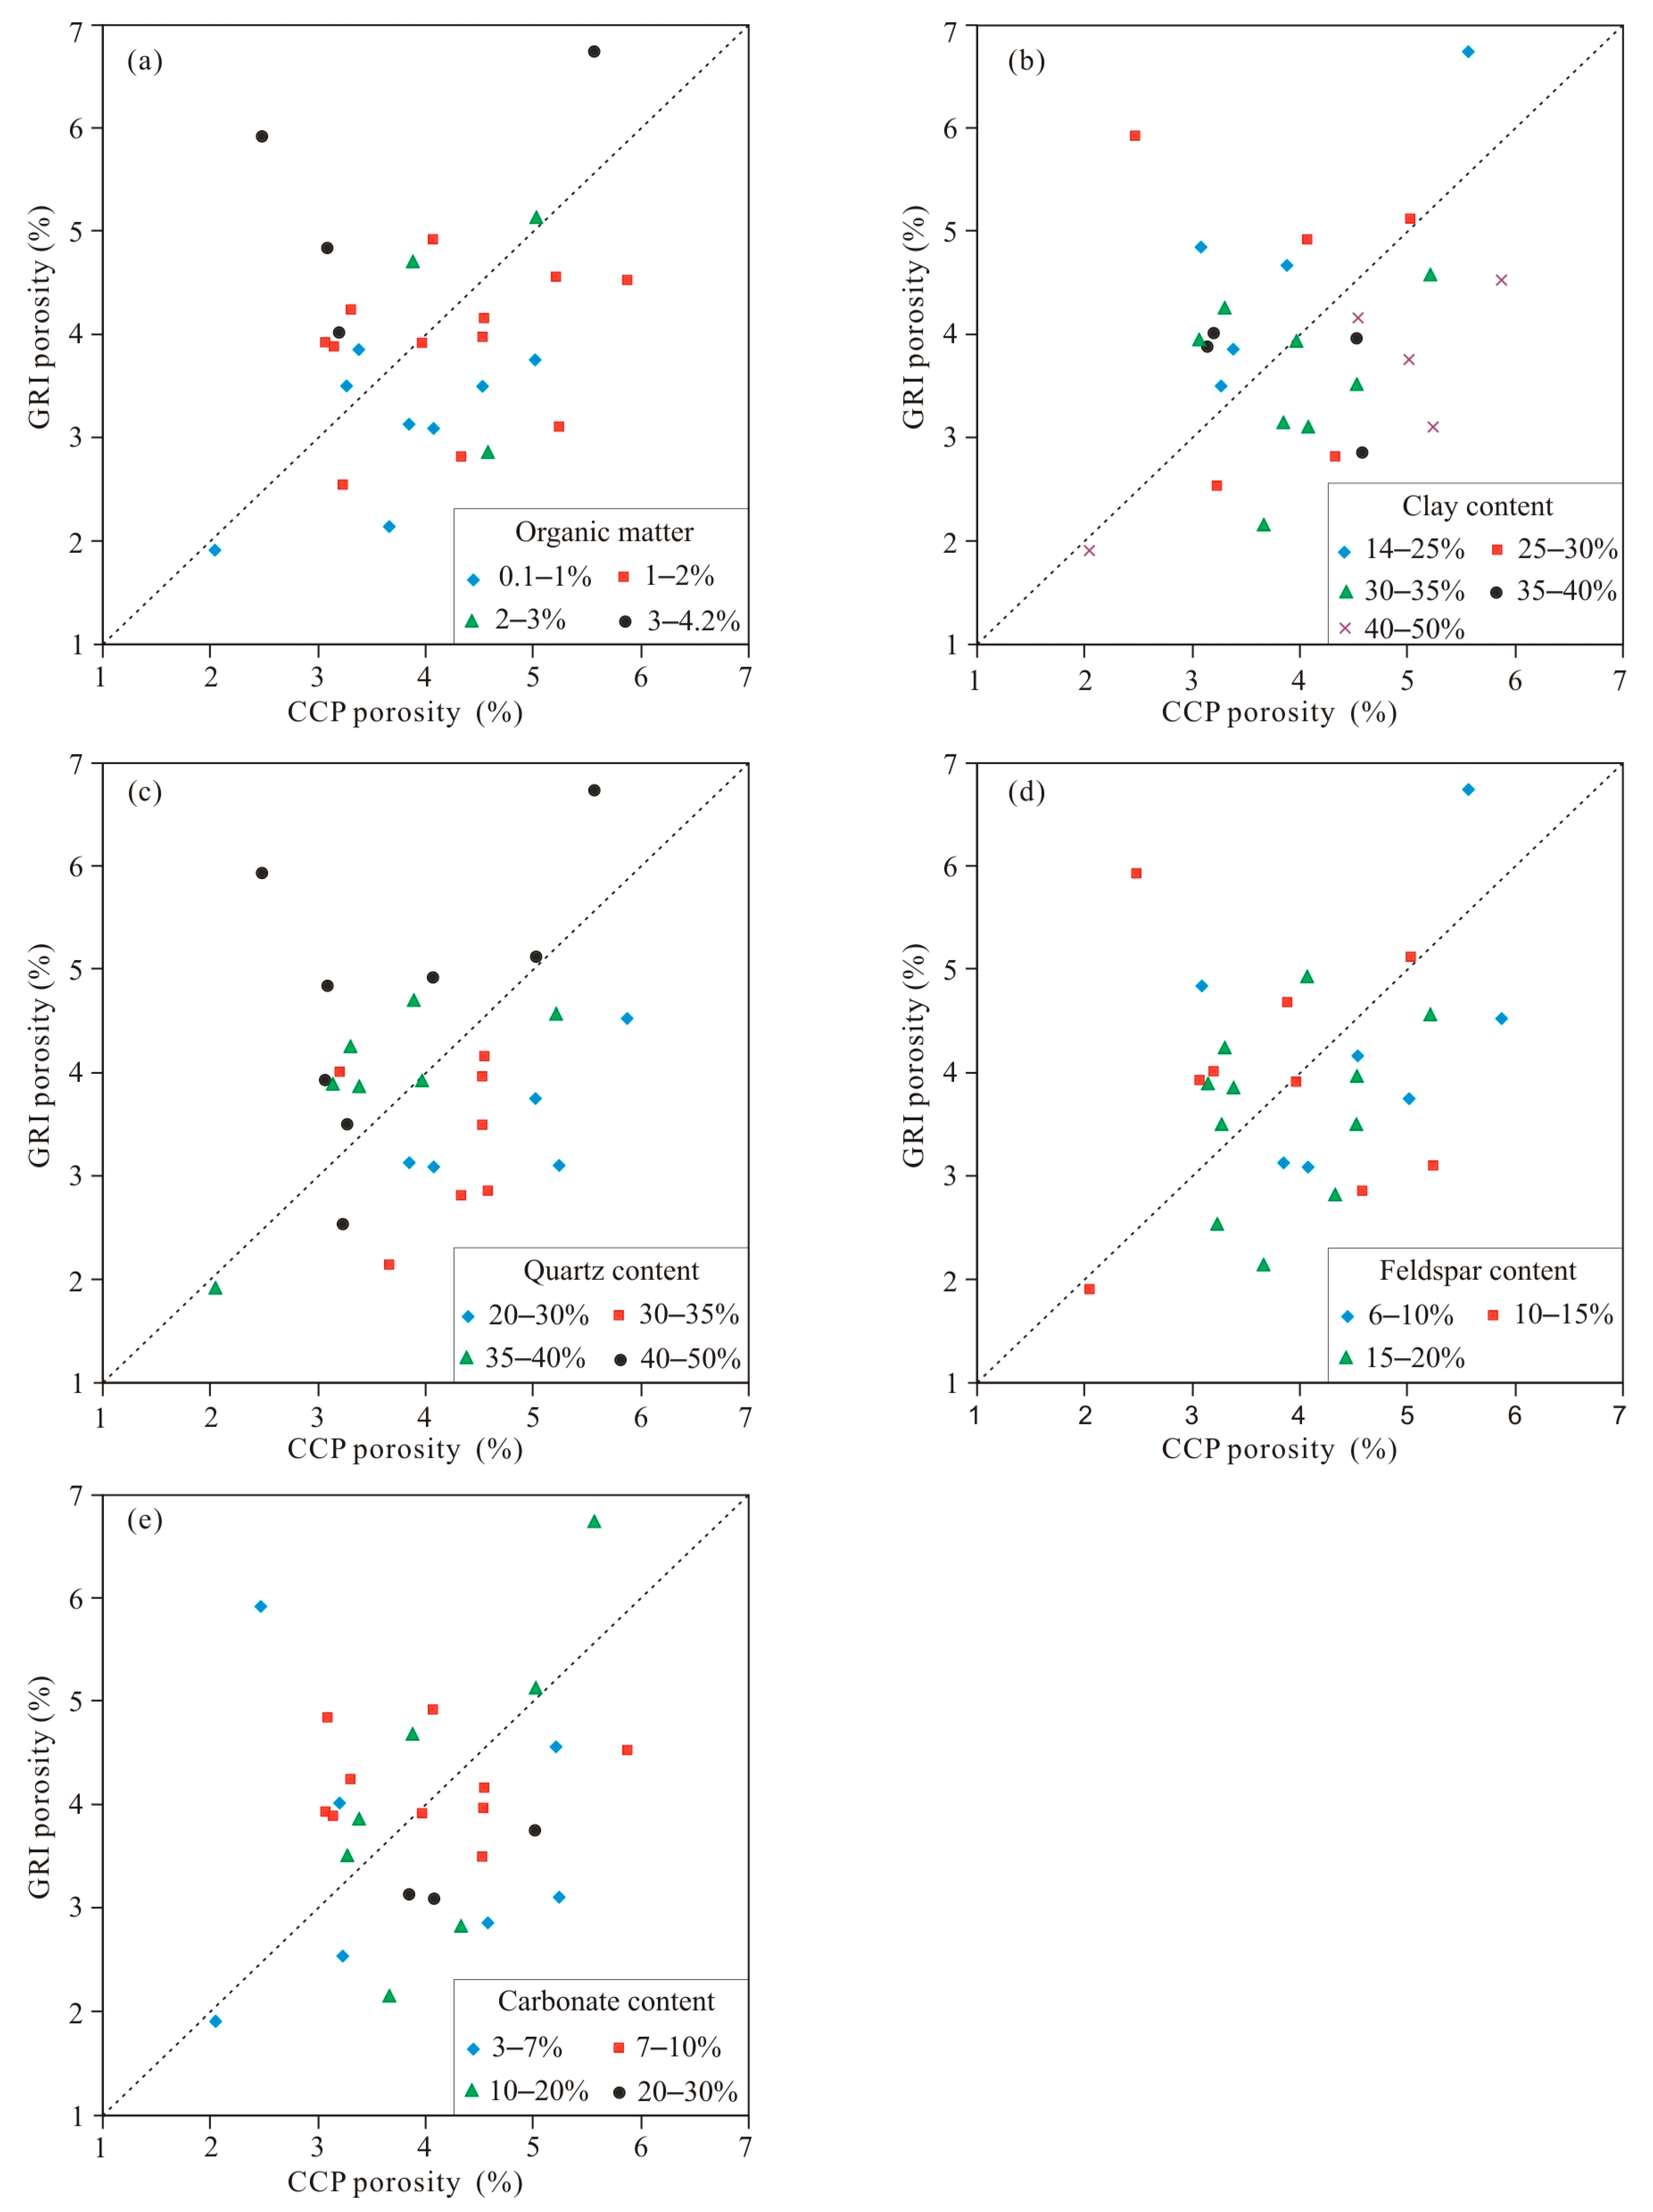
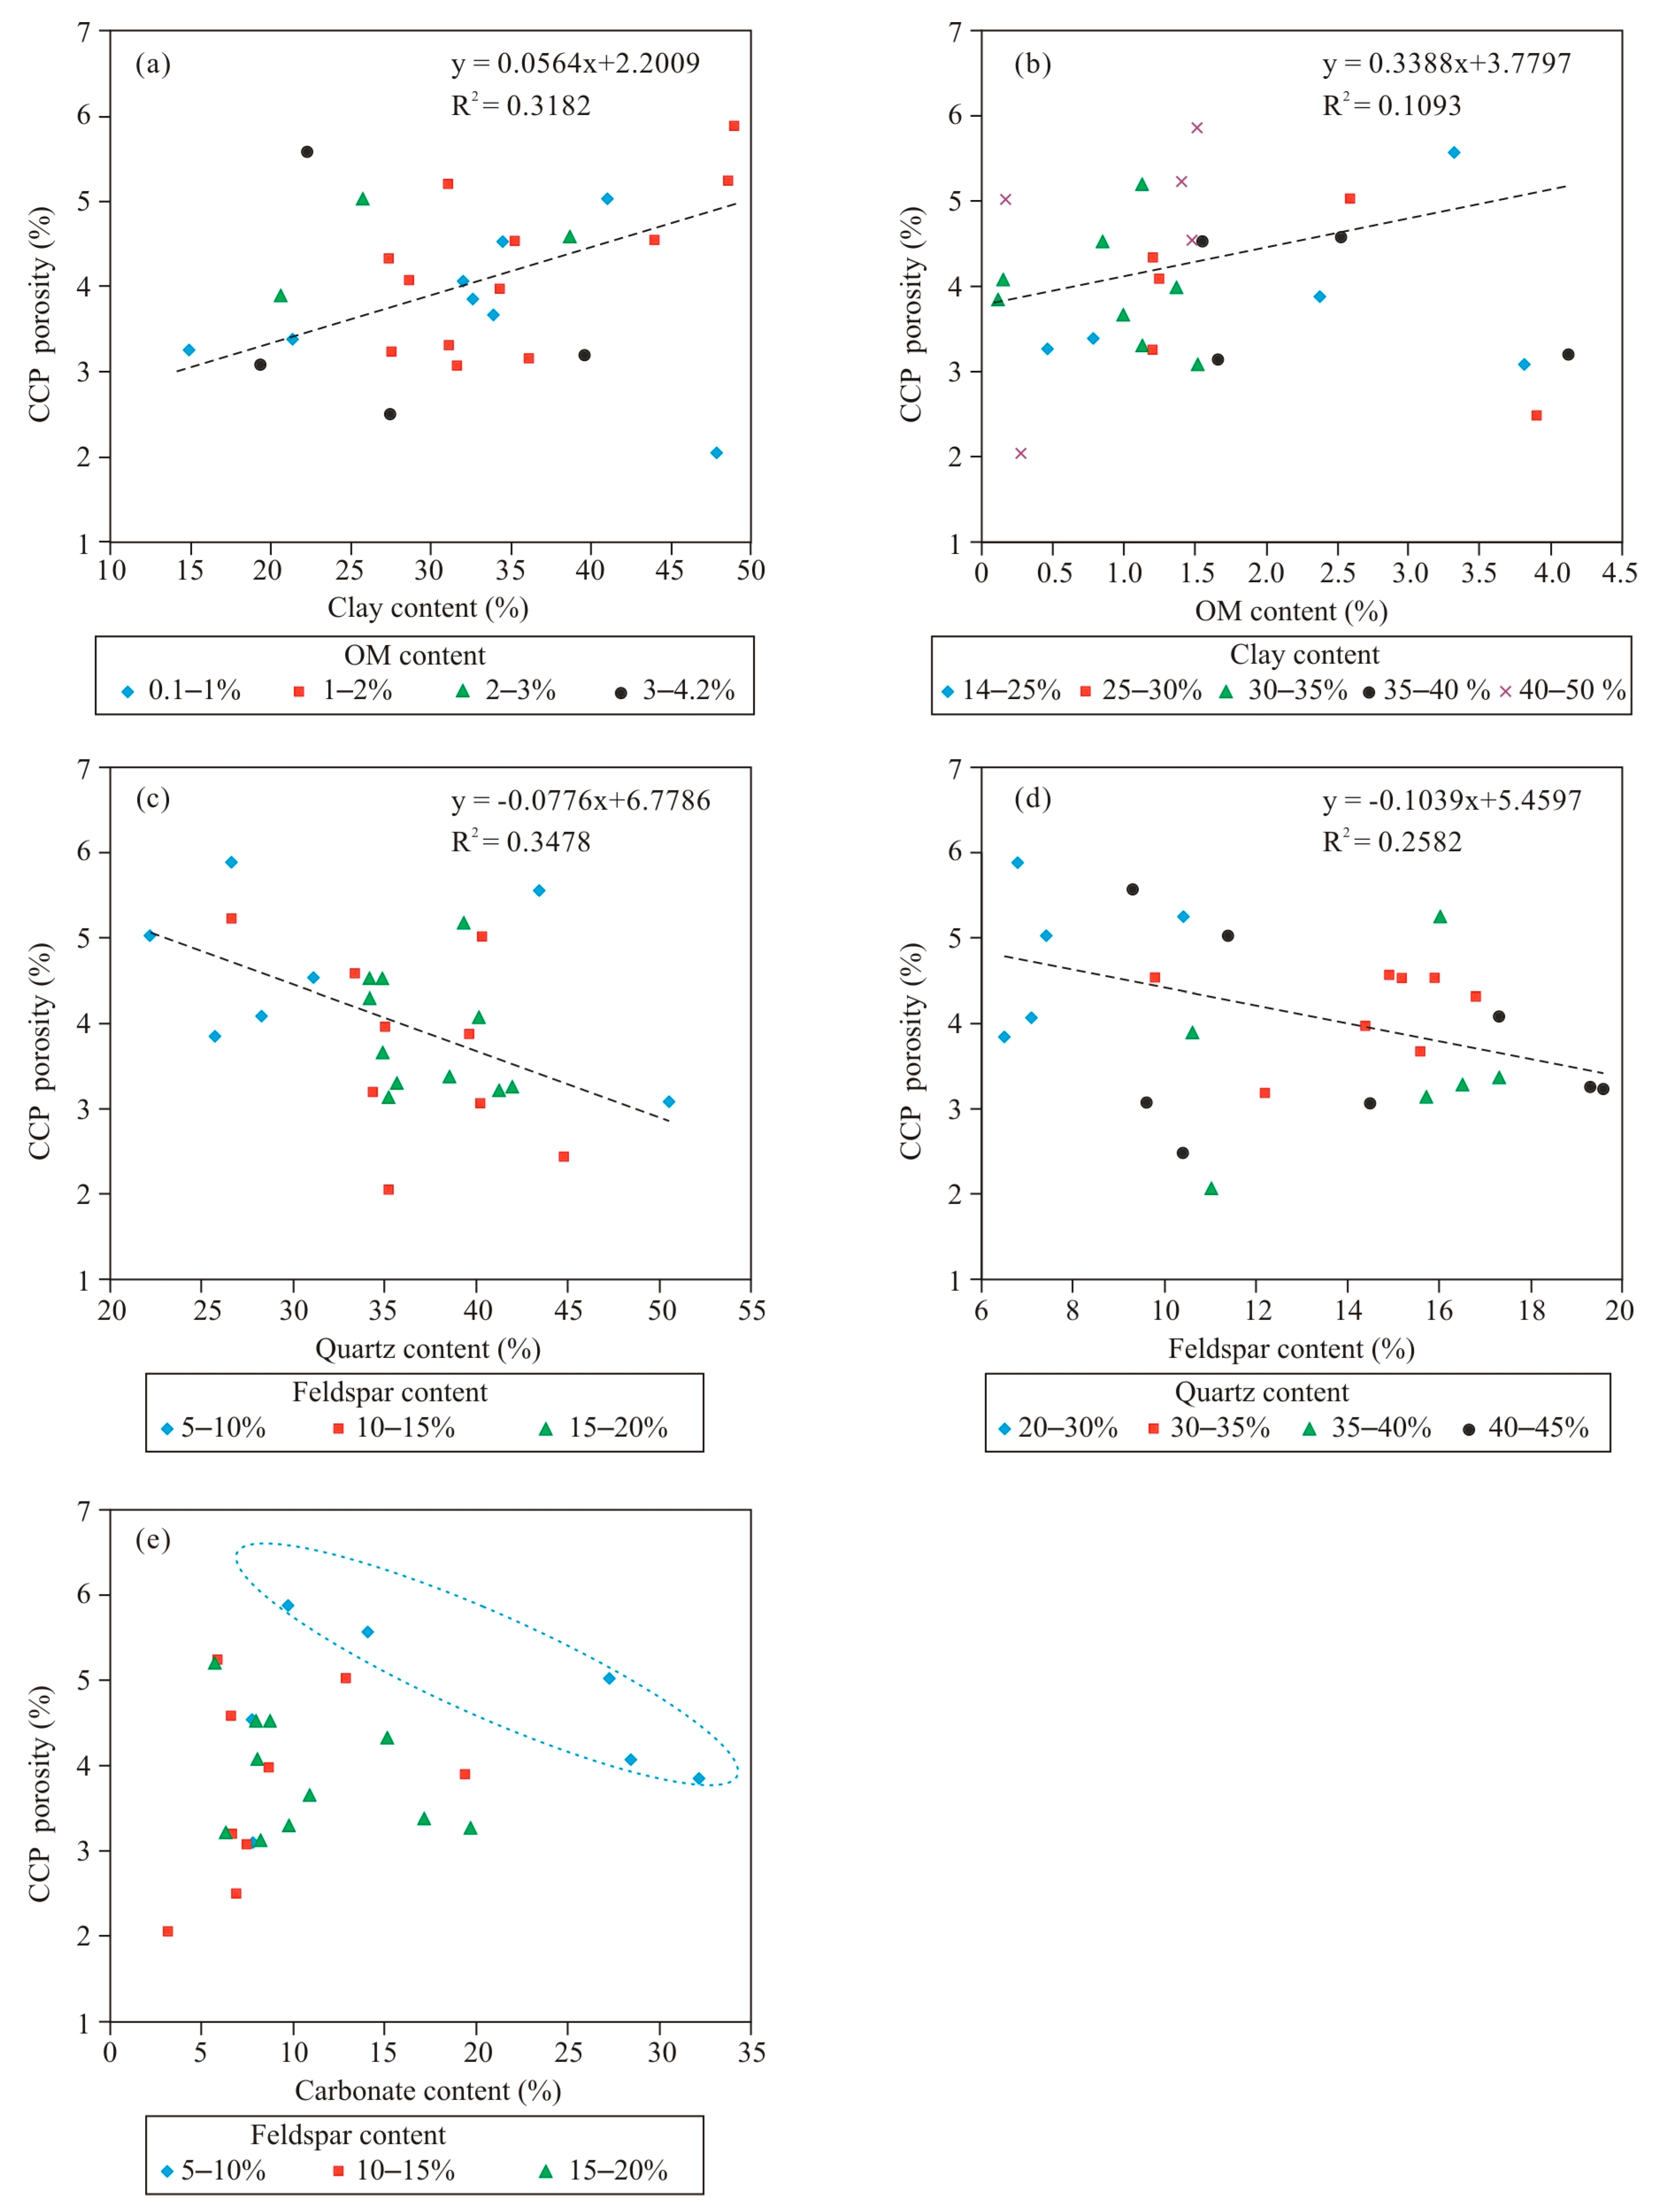
The CCP porosity values generally increased with increasing clay and OM content, except for a few samples (Figure 3a,b), and decreased with increasing quartz and feldspar content (Figure 4c,d). In samples with low OM content (<3%), the CCP porosity increased appreciably with total clay content (Figure 3a). CCP porosity also increased with OM content when the total clay content was less than 30% (Figure 3b). The OM and clay content significantly affect pore volume in shale samples. OM is the contributor of organic pores derived from hydrocarbon generation process via consuming OM. For high-maturity shale, the more the OM, the more the organic pores. Clay interparticle pores are among the major contributors to pore volumes with widths <100 nm [25]. Clay swelling may produce natural fractures in the shale sample and create additional pore volume [34]. In samples with low feldspar content (<10%), the total porosity decreased with carbonate content (Figure 3e). The organopores and clay intercrystal pores are important contributors to the total porosity due to the high thermal maturity of the Longmaxi shale [33,35]. Therefore, when the content of one of the two compositions is low, the porosity values increase obviously with the other composition content. The quartz and feldspar content increases with decreasing clay and OM content. Hence, the porosity values decrease with increasing quartz and feldspar content (Figure 3c,d).
4.2. Comparison of the Results of CCP and GRI Methods
To evaluate the precision of the CCP method, the CCP results were compared with those of the GRI method. The differences between the CCP and GRI results ranged from less than 0.01% to 3.27%. The trends in CCP and GRI porosity values were nearly the same for sample 1 to sample 27 (Figure 2). Several trends were identified in the comparison of CCP and GRI results, including grain density and porosity. The grain density values measured by the CCP and GRI methods declined with increasing OM and quartz content (Figure 4a,c), and increased with increasing carbonate content (Figure 4e). In the sample with high OM content, CCP grain density was lower than GRI grain density (Figure 4a). This behavior was the opposite in the sample with high total clay mineral content, low quartz content, and high carbonate content (Figure 4b,c,e). Grain density did not demonstrate any clear relationship with the feldspar content (Figure 4d). The CCP porosity values were larger than the GRI results in the sample with low OM and quartz content and high total clay mineral content, and were smaller than the GRI results in other samples with high OM and quartz content and low total clay mineral content (Figure 5a–c). The CCP porosity values did not exhibit a clear relationship between the feldspar content or carbonate content (Figure 5d,e).
4.3. Advantages of the CCP Method
The benefits of the CCP method include: (1) no standard core plug (2.5 cm diameter) is required; (2) it is based on some conventional measurements such as XRD analysis and organic carbon content analysis; and (3) the total porosity of shale gas reservoir samples can be measured, including the unconnected pores. Volumetric measurements based on gas are not only affected by leaks and temperature variation but also overestimate pore volume due to gas adsorbed by the organic-rich shale gas reservoir sample. The bulk density calculated from the bulk mass and bulk volume can be well controlled in the CCP methodology. The content of various minerals measured by XRD are less affected by different measurement environments. The CCP experiment is operable and credible, which makes it applicable to measuring porosity in shale gas reservoir samples. In addition, compared with other penetration fluid methods, such as GRI porosity, LTNA, MIP, and MNR methods, the CCP method is less affected by fluid (gas or water) adsorption. For the shale reservoir samples, the porosities derived from the penetration fluid methods are apparent porosities because of adsorption of OM and clay, as well as the permeability behaviors [36,37,38].
4.4. Disadvantages of the CCP Method
There are two disadvantages of the CCP method. The first is that XRD analysis only measures common minerals such as quartz, feldspars, and carbonates. It ignores uncommon minerals in the samples because of their low content. The other disadvantage is that the true density values of various minerals used in this paper are the average values of their maximum and minimum true density values. Although the differences between the average true density values and the actual density values are less than 0.35 g/cm3, the precision of the CCP result will be affected. The largest differences are due to the true density values of smectite and barite.
5. Conclusions
The results suggest that the CCP porosity values of shale gas reservoir samples range between 2.05% and 5.87% with an average value of 4.04%. The CCP method does not require a standard core plug and is based on conventional experiments. The CCP porosity generally increases with increasing OM and clay content, and decreases with increasing quartz and feldspar content. The CCP results were similar to the GRI results, and the differences between the two methods range from 0.05% to 1.52% with an average value of 0.85%. The disadvantages of the CCP method include ignoring content of uncommon minerals and the uncertainty in the true density values of various minerals.
Author Contributions
Conceptualization, F.C. and S.L.; methodology, F.C. and Y.J.; software, X.D.; validation, F.C., S.L., X.D., H.Z. and Y.J.; formal analysis, F.C. and H.Z.; investigation, F.C.; resources, F.C.; data curation, F.C. and H.Z.; writing—original draft preparation, F.C.; writing—review and editing, S.L. and Y.J.; visualization, X.D.; supervision, S.L.; project administration, S.L.; funding acquisition, F.C. and Y.J.
Funding
This research was funded by the Open Fund of State Key Laboratory of Oil and Gas Reservoir Geology and Exploitation (Chengdu University of Technology) (grant number PLC20180202), the National Natural Science Foundation of China (grant number 41530315), the National Science and Technology Major Project of China (grant number 2016ZX05061), and the Fundamental Research Funds for the Central Universities (grant number 18CX02071A).
Conflicts of Interest
The authors declare no conflict of interest.
References
- Kuila, U.; McCarty, D.K.; Arkadiusz, D.; Fischer, T.B.; Prasad, M. Total porosity measurement in gas shales by the water immersion porosimetry (WIP) method. Fuel 2014, 117, 1115–1129. [Google Scholar] [CrossRef]
- Pan, Z.J.; Ma, Y.; Connell, L.D.; Down, D.I.; Camilleri, M. Measuring anisotropic permeability using a cubic shale sample in a triaxial cell. J. Nat. Gas Sci. Eng. 2015, 26, 336–344. [Google Scholar] [CrossRef]
- Ma, Y.; Pan, Z.J.; Zhong, N.N.; Connell, L.D.; Down, D.I.; Lin, W.L.; Zhang, Y. Experimental study of anisotropic gas permeability and its relationship with fracture structure of Longmaxi Shales, Sichuan Basin, China. Fuel 2016, 180, 106–115. [Google Scholar] [CrossRef]
- Wang, L.; Wang, S.H.; Zhang, R.L.; Wang, C.; Xiong, Y.; Zheng, X.S.; Li, S.R.; Jin, K.; Rui, Z.H. Review of multi-scale and multi-physical simulation technologies for shale and tight gas reservoirs. J. Nat. Gas Sci. Eng. 2017, 37, 560–578. [Google Scholar] [CrossRef]
- Jiang, F.J.; Chen, D.; Wang, Z.F.; Xu, Z.Y.; Chen, J.; Liu, L.; Huyan, Y.Y.; Liu, Y. Pore characteristic analysis of a lacustrine shale: A case study in the Ordos Basin, NW China. Mar. Petrol. Geol. 2016, 73, 554–571. [Google Scholar] [CrossRef]
- Sun, J.M.; Dong, X.; Wang, J.J.; Schmitt, D.R.; Xu, C.L.; Mohammed, T.; Chen, D.W. Measurement of total porosity for gas shales by gas injection porosimetry (GIP) method. Fuel 2016, 186, 694–707. [Google Scholar] [CrossRef]
- Zolfaghari, A.; Dehghanpour, H.; Xu, M.X. Water sorption behaviour of gas shales: II Pore size distribution. Int. J. Coal Geol. 2017, 179, 187–195. [Google Scholar] [CrossRef]
- Chen, F.W.; Lu, S.F.; Ding, X. Organoporosity evaluation of shale: A case study of the Lower Silurian Longmaxi Shale in Southeast Chongqing, China. Sci. World J. 2014, 1–9. [Google Scholar] [CrossRef]
- Tuo, J.C.; Wu, C.J.; Zhang, M.F. Organic matter properties and shale gas potential of Paleozoic shales in Sichuan Basin, China. J. Nat. Gas Sci. Eng. 2016, 28, 434–446. [Google Scholar] [CrossRef]
- Zhang, H.; Zhu, Y.M.; Wang, Y.; Kang, W.; Chen, S.B. Comparison of organic matter occurrence and organic nanopore structure within marine and terrestrial shale. J. Nat. Gas Sci. Eng. 2016, 32, 356–363. [Google Scholar] [CrossRef]
- Chen, F.W.; Ding, X.; Lu, S.F. Organic porosity evaluation of lower cambrian Niutitang shale in Qiannan depression, China. Petrol. Sci. Technol. 2016, 34, 1083–1090. [Google Scholar] [CrossRef]
- Nelson, P.H. Pore-throat sizes in sandstones, tight sandstones, and shales. AAPG Bull. 2009, 93, 329–340. [Google Scholar] [CrossRef]
- Shi, M.; Yu, B.S.; Xue, Z.P.; Wu, J.S.; Yuan, Y. Pore characteristics of organic-rich shales with high thermal maturity: A case study of the Longmaxi gas shale reservoirs from well Yuye-1 in southeastern Chongqing, China. J. Nat. Gas Sci. Eng. 2015, 26, 948–959. [Google Scholar] [CrossRef]
- Chen, F.W.; Ding, X.; Lu, S.F.; Ju, Y.W. The pore characterization of the lower silurian Longmaxi shale in the southeast Chongqing, China using FE-SEM, LTNA and MIP methods. J. Nanosci. Nanotechnol. 2017, 17, 6482–6488. [Google Scholar] [CrossRef]
- Lu, S.F.; Chen, F.W.; Ju, Y.W. Type and quantitative evaluation of micropores in Longmaxi shale of southeast Chongqing, China. J. Nanosci. Nanotechnol. 2017, 17, 7035–7043. [Google Scholar] [CrossRef]
- Chen, F.W.; Lu, S.F.; Ding, X.; He, X.P.; Xing, H.L. The splicing of backscattered scanning electron microscopy method used on evaluation of microscopic pore characteristics in shale sample and compared with results from other methods. J. Petrol. Sci. Eng. 2018, 160, 207–218. [Google Scholar] [CrossRef]
- Clarkson, C.R.; Solano, N.; Bustin, R.M.; Bustin, A.M.M.; Chalmers, G.R.L.; Hec, L.; Melnichenko, Y.B.; Radlin´ski, A.P.; Blach, T.P. Pore structure characterization of north American shale gas reservoirs using USANS/SANS, gas adsorption, and mercury intrusion. Fuel 2019, 103, 606–616. [Google Scholar] [CrossRef]
- Chen, F.W.; Lu, S.F.; Ding, X. Pore types and quantitative evaluation of pore volumes in the Longmaxi shale of southeast Chongqing, China. Acta Geol. Sin.-Engl. 2018, 92, 342–353. [Google Scholar] [CrossRef]
- Slatt, R.M.; O’Brien, N.R. Pore types in the Barnett and Woodford gas shales: Contribution to understanding gas storage and migration pathways in fine-grained rocks. AAPG Bull. 2011, 95, 2017–2030. [Google Scholar] [CrossRef]
- Curtis, M.E.; Cardott, B.J.; Sondergeld, C.H.; Rai, C.S. Development of organic porosity in the Woodford shale with increasing thermal maturity. Int. J. Coal Geol. 2012, 103, 26–31. [Google Scholar] [CrossRef]
- Curtis, M.E.; Sondergeld, C.H.; Ambrose, R.J.; Rai, C.S. Microstructural investigation of gas shales in two and three dimensions using nanometer-scale resolution imaging. AAPG Bull. 2012, 96, 665–677. [Google Scholar] [CrossRef]
- Long, H.; Swennen, R.; Foubert, A.; Dierick, M.; Jacobs, P. 3D quantification of mineral components and porosity distribution in Westphalian C sandstone by microfocus X-ray computed tomography. Sediment. Geol. 2009, 220, 116–125. [Google Scholar] [CrossRef]
- Okolo, G.N.; Everson, R.C.; Neomagus, H.W.J.P.; Roberts, M.J.; Sakurovs, R. Comparing the porosity and surface areas of coal as measured by gas adsorption, mercury intrusion and SAXS techniques. Fuel 2015, 141, 293–304. [Google Scholar] [CrossRef]
- Li, J.; Wang, W.; Cao, Q.; Shi, Y.; Yan, X.; Tian, S. Impact of hydrocarbon expulsion efficiency of continental shale upon shale oil accumulations in eastern China. Mar. Pet. Geol. 2015, 59, 467–479. [Google Scholar] [CrossRef]
- Chen, F.W.; Zhao, H.Q.; Lu, S.F.; Ding, X.; Ju, Y.W. The effects of composition, laminar structure and burial depth on connected pore characteristics in a shale oil reservoir, the Raoyang Sag of the Bohai Bay Basin, China. Mar. Pet. Geol. 2019, 101, 290–302. [Google Scholar] [CrossRef]
- Kuila, U.; Prasad, M. Specific surface area and pore-size distribution in clays and shales. Geophys. Prospect. 2013, 61, 341–362. [Google Scholar] [CrossRef]
- Lin, B.T.; Chen, M.A.; Jin, Y.; Pang, H.W. Modeling pore size distribution of southern Sichuan shale gas reservoirs. J. Nat. Gas Sci. Eng. 2015, 26, 883–894. [Google Scholar] [CrossRef]
- Luffel, D.L.; Guidry, F.K.; Curtis, J.B. Evaluation of devonian shale with new core and log analysis methods. J. Petrol. Technol. 1992, 44, 1192–1198. [Google Scholar] [CrossRef]
- Omotoso, O.; McCarty, D.K.; Hillier, S.; Kleeberg, R. Some successful approaches to quantitative mineral analysis as revealed by the 3rd Reynolds Cup contest. Clays Clay Miner. 2006, 54, 748–760. [Google Scholar] [CrossRef]
- Chalmers, G.R.L.; Bustin, R.M. Lower Cretaceous gas shales in northeastern British Columbia, Part I: Geological controls on methane sorption capacity. Bull. Can. Petrol. Geol. 2008, 56, 1–21. [Google Scholar] [CrossRef]
- Pan, Z.L. Crystallography and Mineralogy, 3rd ed.; Geological Press: Bejing, China, 2006; pp. 130–174. [Google Scholar]
- Okiongbo, K.S.; Aplin, A.C.; Larter, S.R. Changes in type II kerogen density as a function of maturity: Evidence from the Kimmeridge Clay Formation. Energy Fuels 2005, 19, 2495–2499. [Google Scholar] [CrossRef]
- Löhr, S.C.; Baruch, E.T.; Hall, P.A.; Kennedy, M.J. Is organic pore development in gas shales influenced by the primary porosity and structure of thermally immature organic matter? Org. Geochem. 2015, 87, 119–132. [Google Scholar] [CrossRef]
- Zolfaghari, A.; Dehghanpour, H.; Holyk, J. Water sorption behaviour of gas shales: I. Role of clays. Int. J. Coal Geol. 2017, 179, 130–138. [Google Scholar] [CrossRef]
- Guo, H.J.; Jia, W.L.; Peng, P.A.; Zeng, J.; He, R.L. Evolution of organic matter and nanometer-scale pores in an artificially matured shale undergoing two distinct types of pyrolysis: A study of the Yanchang Shale with Type II kerogen. Org. Geochem. 2017, 105, 56–66. [Google Scholar] [CrossRef]
- Jia, B.; Tsau, J.S.; Barati, R. A workflow to estimate shale gas permeability variations during the production process. Fuel 2018, 220, 879–889. [Google Scholar] [CrossRef]
- Cui, X.; Bustin, A.M.; Bustin, R.M. Measurements of gas permeability and diffusivity of tight reservoir rocks: Different approaches and their applications. Geofluids 2009, 9, 208–223. [Google Scholar] [CrossRef]
- Jia, B.; Tsau, J.S.; Barati, R. Different flow behaviors of low-pressure and high-pressure carbon dioxide in shales. SPE J. 2018, 23, 1452–1468. [Google Scholar] [CrossRef]
Figure 1.
The stratigraphic column of the Py1 well and location of Southeast Chongqing, China.
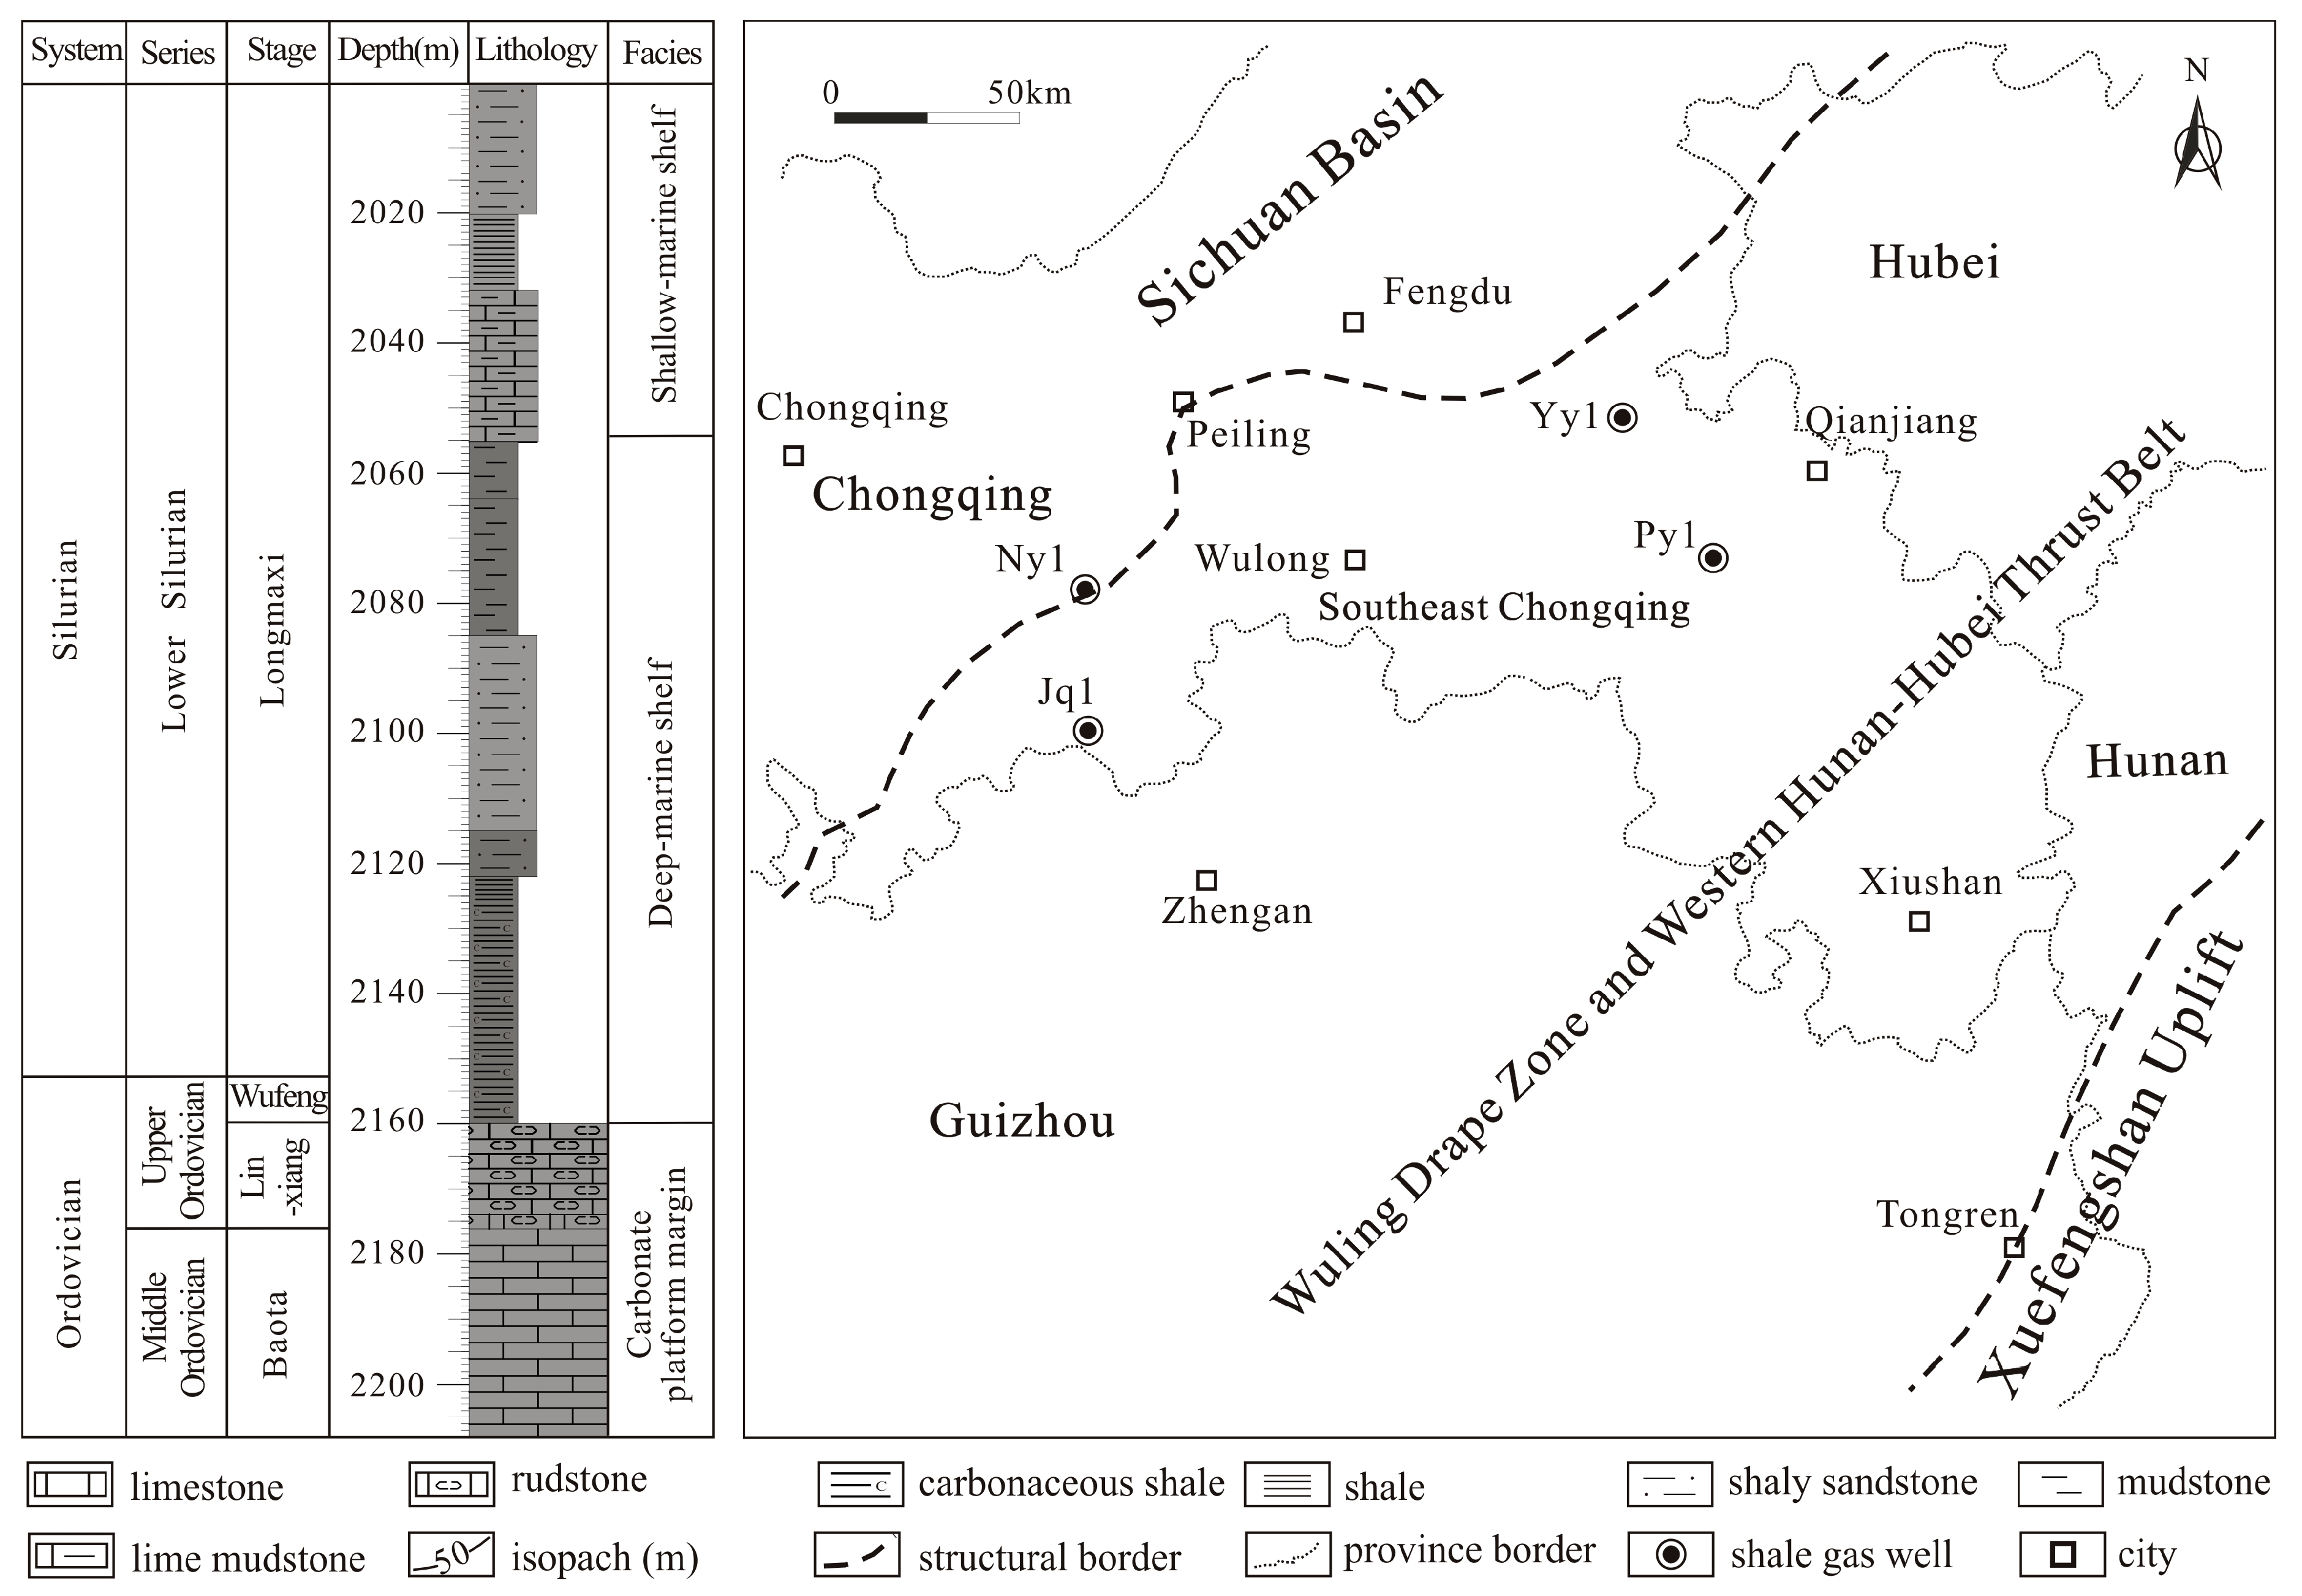
Figure 2.
The bulk density, grain density and porosity values of the samples using the composition content porosimetry (CCP) and the Gas Research Institute (GRI) methods.
Figure 2.
The bulk density, grain density and porosity values of the samples using the composition content porosimetry (CCP) and the Gas Research Institute (GRI) methods.

Figure 3.
The relationships between CCP porosity values and composition: (a) clay content, (b) organic matter content, (c) quartz content, (d) feldspar content, (e) carbonate content.
Figure 3.
The relationships between CCP porosity values and composition: (a) clay content, (b) organic matter content, (c) quartz content, (d) feldspar content, (e) carbonate content.

Figure 4.
Comparison of the CCP grain density and GRI grain density values (variance σ2 = 0.0012): (a) clay content, (b) organic matter content, (c) quartz content, (d) feldspar content, (e) carbonate content.
Figure 4.
Comparison of the CCP grain density and GRI grain density values (variance σ2 = 0.0012): (a) clay content, (b) organic matter content, (c) quartz content, (d) feldspar content, (e) carbonate content.

Figure 5.
Comparison of the CCP porosity and GRI porosity values (variance σ2 = 0.0143): (a) clay content, (b) organic matter content, (c) quartz content, (d) feldspar content, (e) carbonate content.
Figure 5.
Comparison of the CCP porosity and GRI porosity values (variance σ2 = 0.0143): (a) clay content, (b) organic matter content, (c) quartz content, (d) feldspar content, (e) carbonate content.

Table 1.
The true density values of various minerals and organic matter (OM).
| Density (g/cm3) | Quartz | Orthoclase | Plagioclase | Calcite | Dolomite | Pyrite |
| Max true density | 2.65 | 2.57 | 2.76 | 2.80 | 3.20 | 5.20 |
| Min true density | 2.22 | 2.54 | 2.61 | 2.60 | 2.86 | 4.90 |
| Average true density | 2.44 | 2.56 | 2.69 | 2.70 | 3.03 | 5.05 |
| Density (g/cm3) | Barite | Marcasite | Smectite | Chlorite | Illite | OM |
| Max true density | 4.60 | 4.90 | 2.70 | 3.60 | 2.90 | 1.20 |
| Min true density | 4.00 | 4.80 | 2.00 | 3.60 | 2.60 | 1.20 |
| Average true density | 4.30 | 4.85 | 2.35 | 3.60 | 2.75 | 1.20 |
Table 2.
The results of total organic content (TOC), maturity, and mineralogical composition of the samples.
Table 2.
The results of total organic content (TOC), maturity, and mineralogical composition of the samples.
| Sample No. | TOC (%) | Ro (%) | Quartz | Orthoclase | Plagioclase | Calcite | Dolomite | Aragonite | Pyrite | Barite | Clay | I | C | I/S | %S |
|---|---|---|---|---|---|---|---|---|---|---|---|---|---|---|---|
| 1 | 0.17 | 2.54 | 22.2 | 1.2 | 6.2 | 24.2 | 3.1 | 0.5 | 1.4 | 22.2 | 41.0 | 49 | 17 | 34 | 5 |
| 2 | 0.11 | 2.47 | 25.7 | 1.1 | 5.4 | 27.3 | 4.9 | 1.0 | 1.9 | 25.7 | 32.6 | 36 | 18 | 46 | 5 |
| 3 | 0.13 | 2.73 | 28.3 | 1.5 | 5.6 | 21.7 | 6.7 | 2.1 | 1.9 | 28.3 | 32.1 | 39 | 20 | 41 | 5 |
| 4 | 1.48 | 2.70 | 31.1 | 1.6 | 8.2 | 7.8 | / | 3.0 | 2.8 | 31.1 | 44.0 | 38 | 15 | 47 | 5 |
| 5 | 1.51 | 2.83 | 26.6 | 2.1 | 4.7 | 6.1 | 3.6 | 4.1 | 2.3 | 26.6 | 49.0 | 45 | 13 | 42 | 5 |
| 6 | 1.40 | 2.78 | 26.6 | 1.8 | 8.6 | 2.6 | 3.3 | 3.7 | 3.4 | 26.6 | 48.6 | 35 | 16 | 49 | 5 |
| 7 | 0.46 | 3.09 | 42.0 | 2.1 | 17.2 | 9.0 | 10.7 | 1.4 | 2.2 | 42.0 | 14.9 | 50 | 11 | 39 | 5 |
| 8 | 0.78 | 2.75 | 38.5 | 5.0 | 12.3 | 10.4 | 6.7 | 2.9 | 2.1 | 38.5 | 21.3 | 40 | 10 | 50 | 5 |
| 9 | 1.12 | 2.48 | 35.6 | 3.7 | 12.8 | 6.5 | 3.2 | 3.5 | 2.4 | 35.6 | 31.2 | 47 | 5 | 48 | 10 |
| 10 | 0.84 | 2.55 | 34.2 | 3.7 | 12.2 | 5.1 | 3.6 | 2.2 | 3.7 | 34.2 | 34.5 | 48 | 12 | 40 | 5 |
| 11 | 0.99 | 2.31 | 34.9 | 3.6 | 12.0 | 6.4 | 4.5 | 2.3 | 1.4 | 34.9 | 33.9 | 34 | 14 | 52 | 5 |
| 12 | 1.21 | 2.81 | 34.2 | 4.1 | 12.7 | 8.9 | 6.2 | 3.2 | 2.1 | 34.2 | 27.4 | 39 | 11 | 50 | 5 |
| 13 | 1.25 | 1.91 | 40.1 | 4.7 | 12.6 | 3.8 | 4.2 | 3.2 | 1.5 | 40.1 | 28.7 | 45 | 15 | 40 | 10 |
| 14 | 1.37 | 2.90 | 35.0 | 3.4 | 11.0 | 5.9 | 2.8 | 2.7 | 3.5 | 35.0 | 34.3 | 40 | 10 | 50 | 10 |
| 15 | 1.55 | / 1 | 34.8 | 3.3 | 11.9 | 5.9 | 2.0 | 3.5 | 1.8 | 34.8 | 35.3 | 48 | 14 | 38 | 10 |
| 16 | 1.12 | 2.91 | 39.3 | 3.9 | 12.1 | 3.8 | 1.9 | 2.4 | 4.4 | 39.3 | 31.1 | 40 | 13 | 47 | 10 |
| 17 | 1.21 | / | 41.2 | 5.6 | 14.0 | 3.4 | 3.0 | 2.0 | 2.0 | 41.2 | 27.6 | 47 | 12 | 41 | 10 |
| 18 | 1.66 | 2.66 | 35.2 | 4.0 | 11.7 | 5.3 | 2.5 | 1.8 | 1.7 | 35.2 | 36.1 | 44 | 13 | 43 | 10 |
| 19 | 1.51 | 2.59 | 40.2 | 3.5 | 11.0 | 4.1 | 3.4 | 1.7 | 2.9 | 40.2 | 31.7 | 50 | 11 | 39 | 15 |
| 20 | 2.38 | 2.76 | 39.6 | 4.0 | 6.6 | 14.7 | 4.7 | 5.0 | 2.4 | 39.6 | 20.6 | 56 | 7 | 37 | 5 |
| 21 | 2.59 | 2.50 | 40.3 | 3.6 | 7.8 | 7.2 | 5.7 | 5.0 | 2.1 | 40.3 | 25.7 | 59 | 9 | 32 | 10 |
| 22 | 3.32 | 2.81 | 43.4 | 2.7 | 6.6 | 8.5 | 5.6 | 5.1 | 2.5 | 43.4 | 22.3 | 43 | 14 | 43 | 5 |
| 23 | 3.90 | 2.68 | 44.8 | 2.8 | 7.6 | 4.8 | 2.1 | 3.6 | 2.9 | 44.8 | 27.5 | 65 | 9 | 26 | 10 |
| 24 | 3.81 | 2.87 | 50.5 | 3.0 | 6.6 | 5.5 | 2.2 | 4.2 | 4.8 | 50.5 | 19.4 | 45 | 8 | 47 | 10 |
| 25 | 4.12 | 2.57 | 34.3 | 1.5 | 10.7 | 2.3 | 4.4 | / | 3.1 | 34.3 | 39.6 | 35 | 14 | 51 | 5 |
| 26 | 2.52 | 2.79 | 33.4 | 5.1 | 9.8 | 0.0 | 6.6 | 2.2 | 1.7 | 33.4 | 38.7 | 36 | 7 | 57 | 5 |
| 27 | 0.27 | 2.49 | 35.2 | 2.6 | 8.4 | 1.1 | 2.1 | 1.1 | 1.4 | 35.2 | 47.8 | 46 | 8 | 46 | 10 |
1 / represents no data. I represents illite. C represents chlorite. I/S represents illite/smectite. %S represents the weight percentage of smectite in the illite/smectite.
© 2018 by the authors. Licensee MDPI, Basel, Switzerland. This article is an open access article distributed under the terms and conditions of the Creative Commons Attribution (CC BY) license (http://creativecommons.org/licenses/by/4.0/).
Share and Cite
MDPI and ACS Style
Chen, F.; Lu, S.; Ding, X.; Zhao, H.; Ju, Y. Total Porosity Measured for Shale Gas Reservoir Samples: A Case from the Lower Silurian Longmaxi Formation in Southeast Chongqing, China. Minerals 2019, 9, 5. https://doi.org/10.3390/min9010005
AMA Style
Chen F, Lu S, Ding X, Zhao H, Ju Y. Total Porosity Measured for Shale Gas Reservoir Samples: A Case from the Lower Silurian Longmaxi Formation in Southeast Chongqing, China. Minerals. 2019; 9(1):5. https://doi.org/10.3390/min9010005
Chicago/Turabian StyleChen, Fangwen, Shuangfang Lu, Xue Ding, Hongqin Zhao, and Yiwen Ju. 2019. "Total Porosity Measured for Shale Gas Reservoir Samples: A Case from the Lower Silurian Longmaxi Formation in Southeast Chongqing, China" Minerals 9, no. 1: 5. https://doi.org/10.3390/min9010005
Note that from the first issue of 2016, this journal uses article numbers instead of page numbers. See further details here.