In Vivo X-ray Computed Tomography Investigations of Crack Damage Evolution of Cemented Waste Rock Backfills (CWRB) under Uniaxial Deformation


Abstract
:1. Introduction
2. Materials and Methods
2.1. Materials
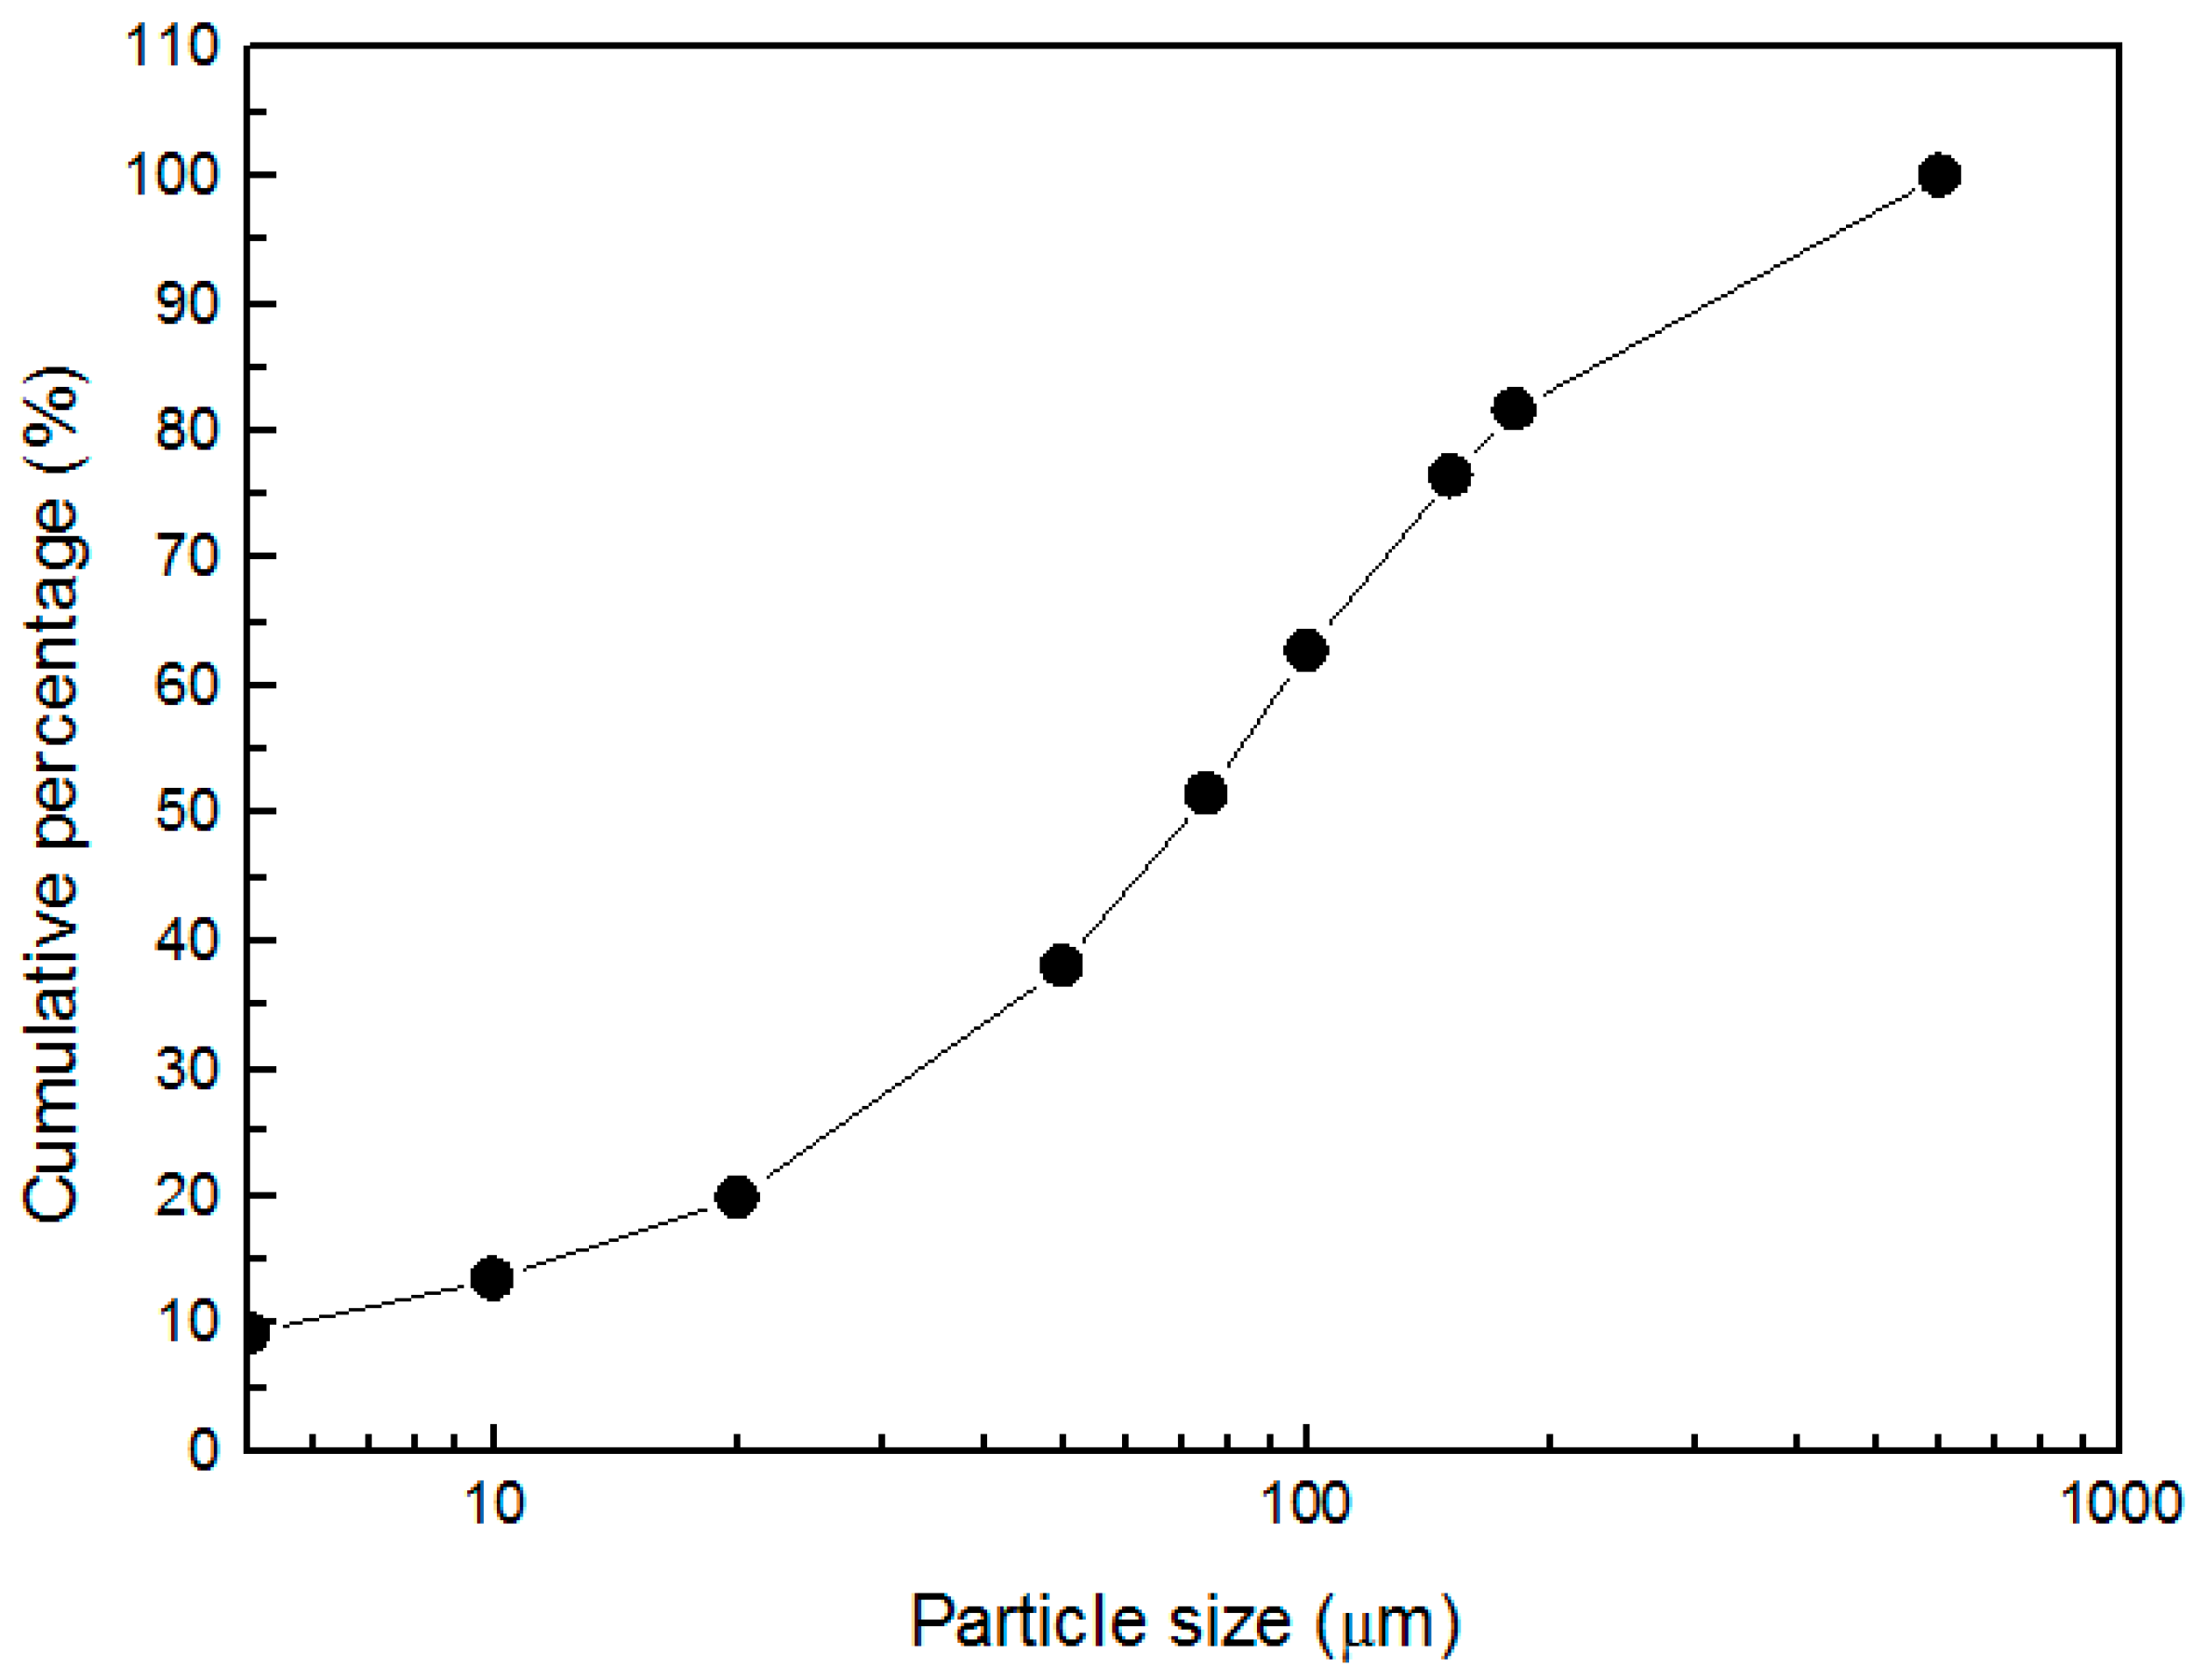
2.1.1. Full Tailings and Binder
2.1.2. Waste Rock
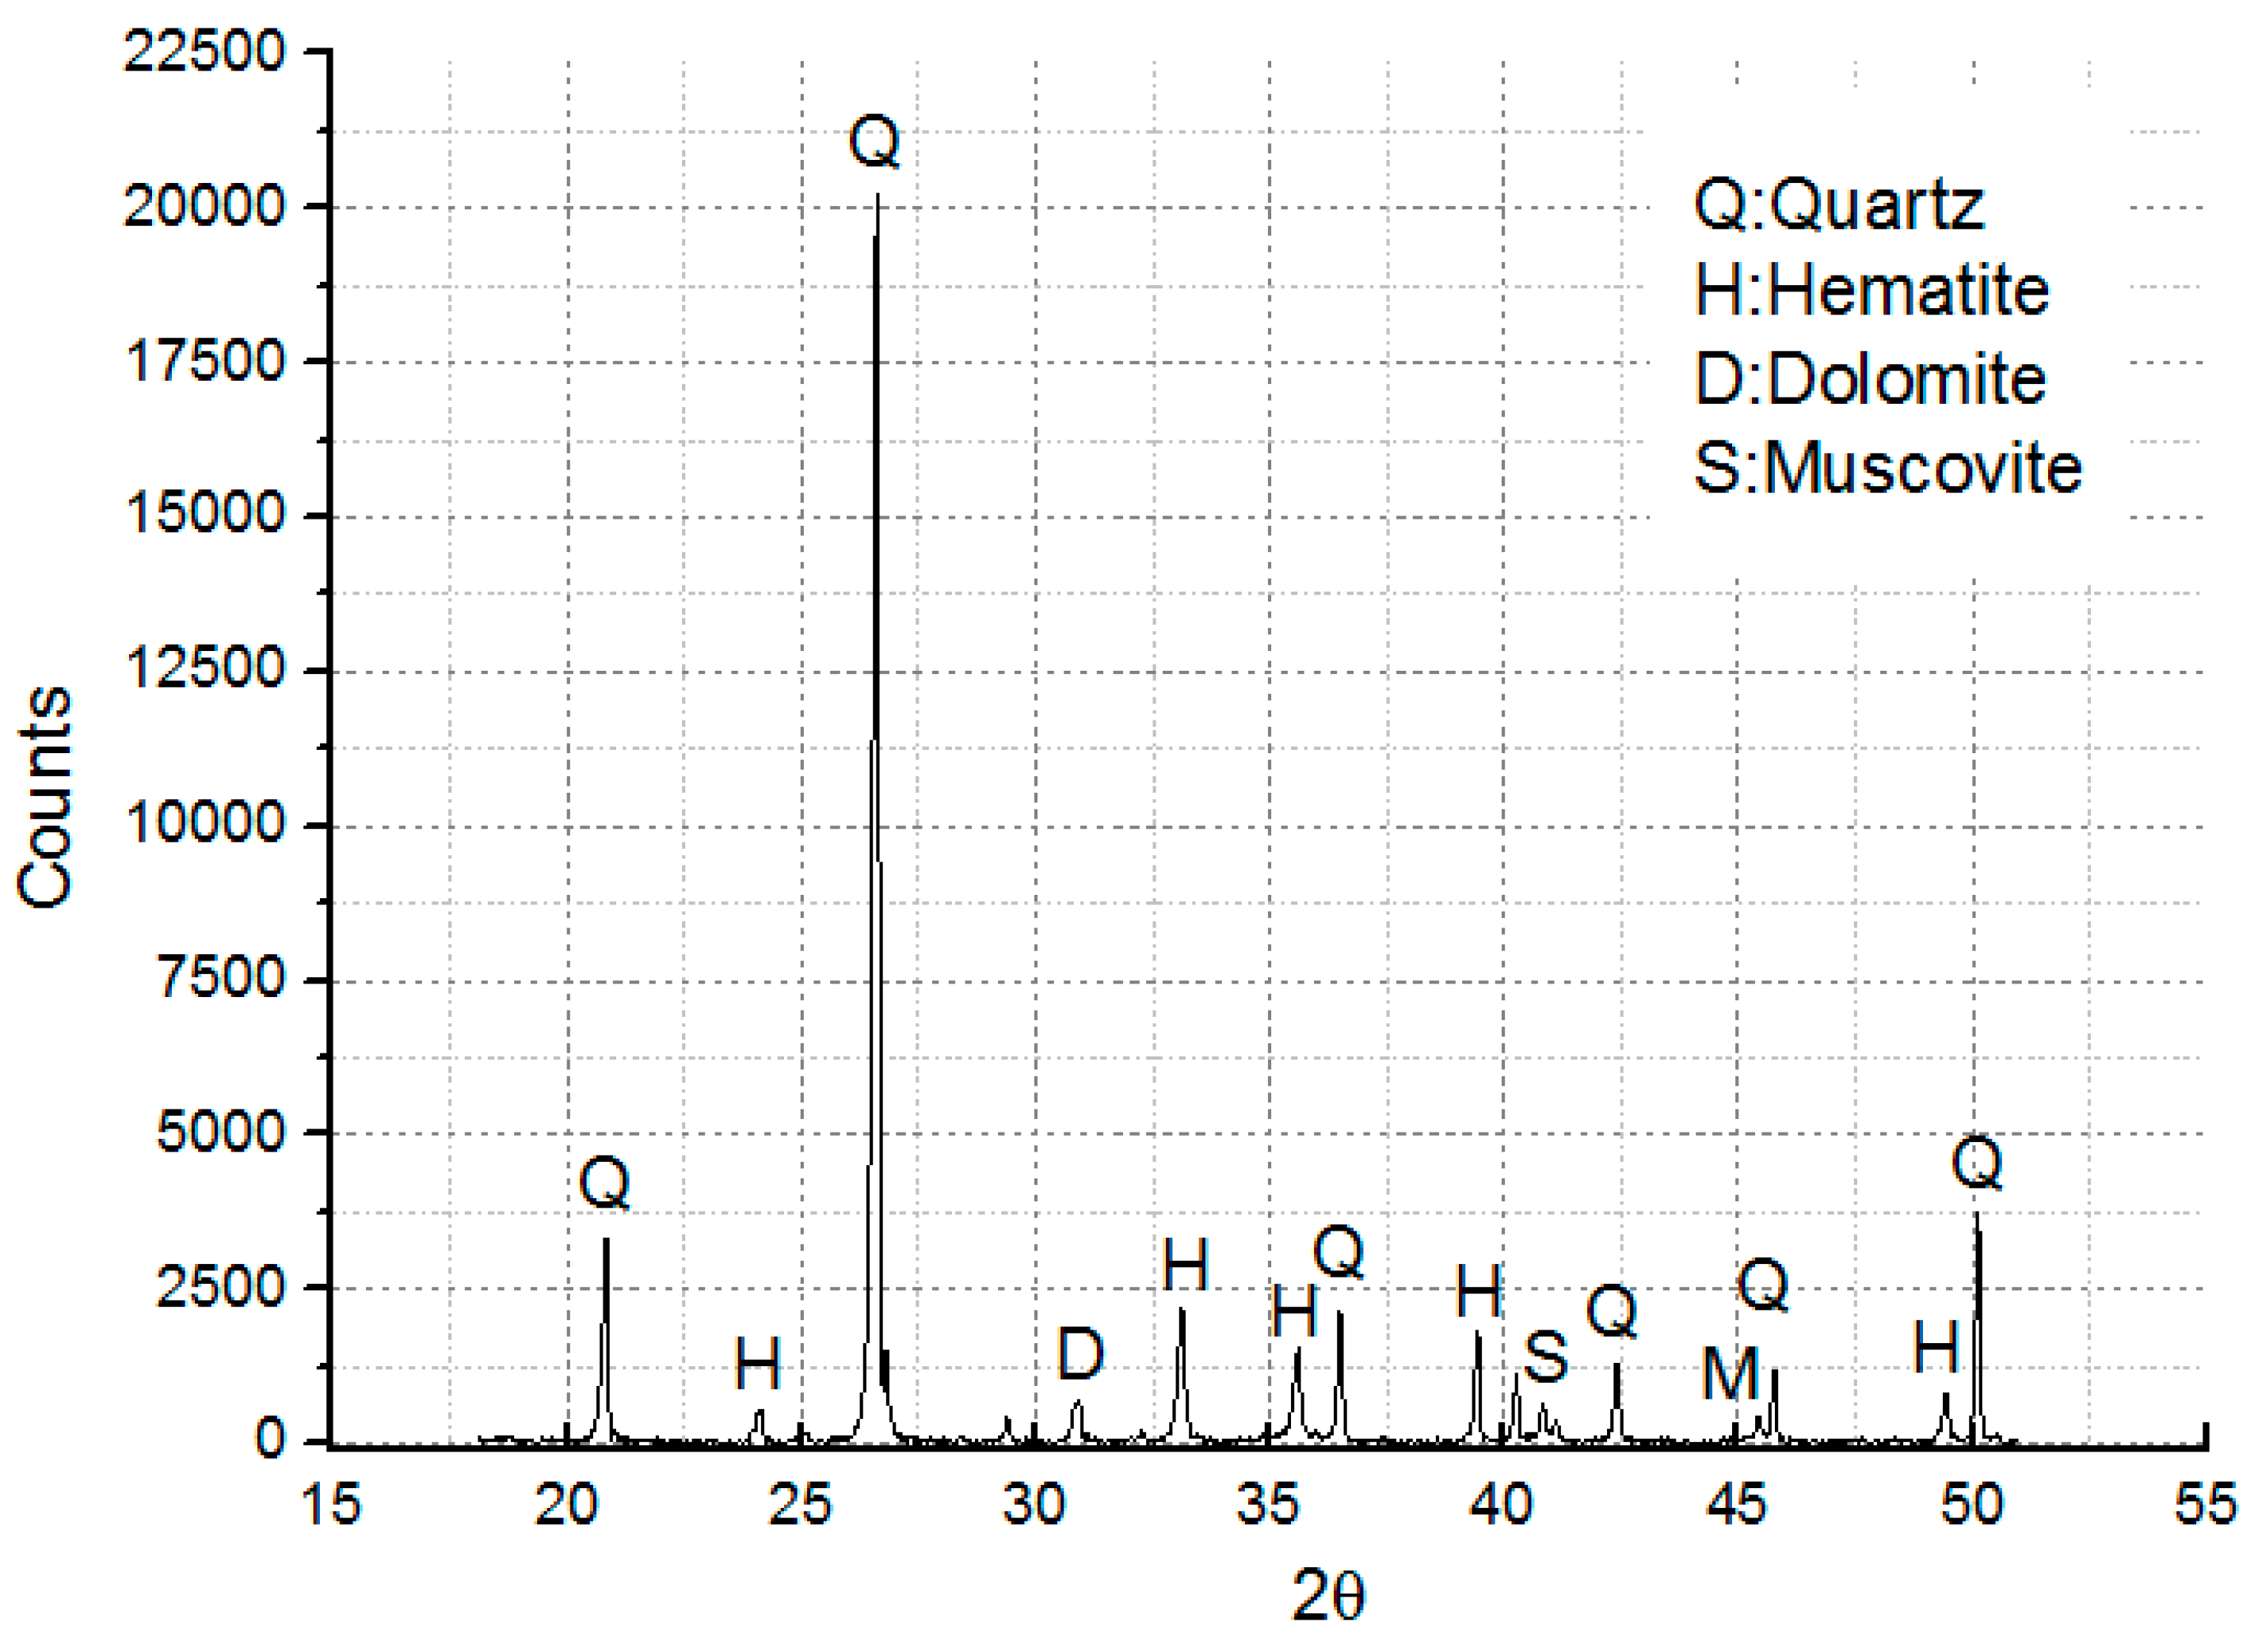
2.1.3. XRD Studies
2.1.4. Sample Preparation and Mix Proportion
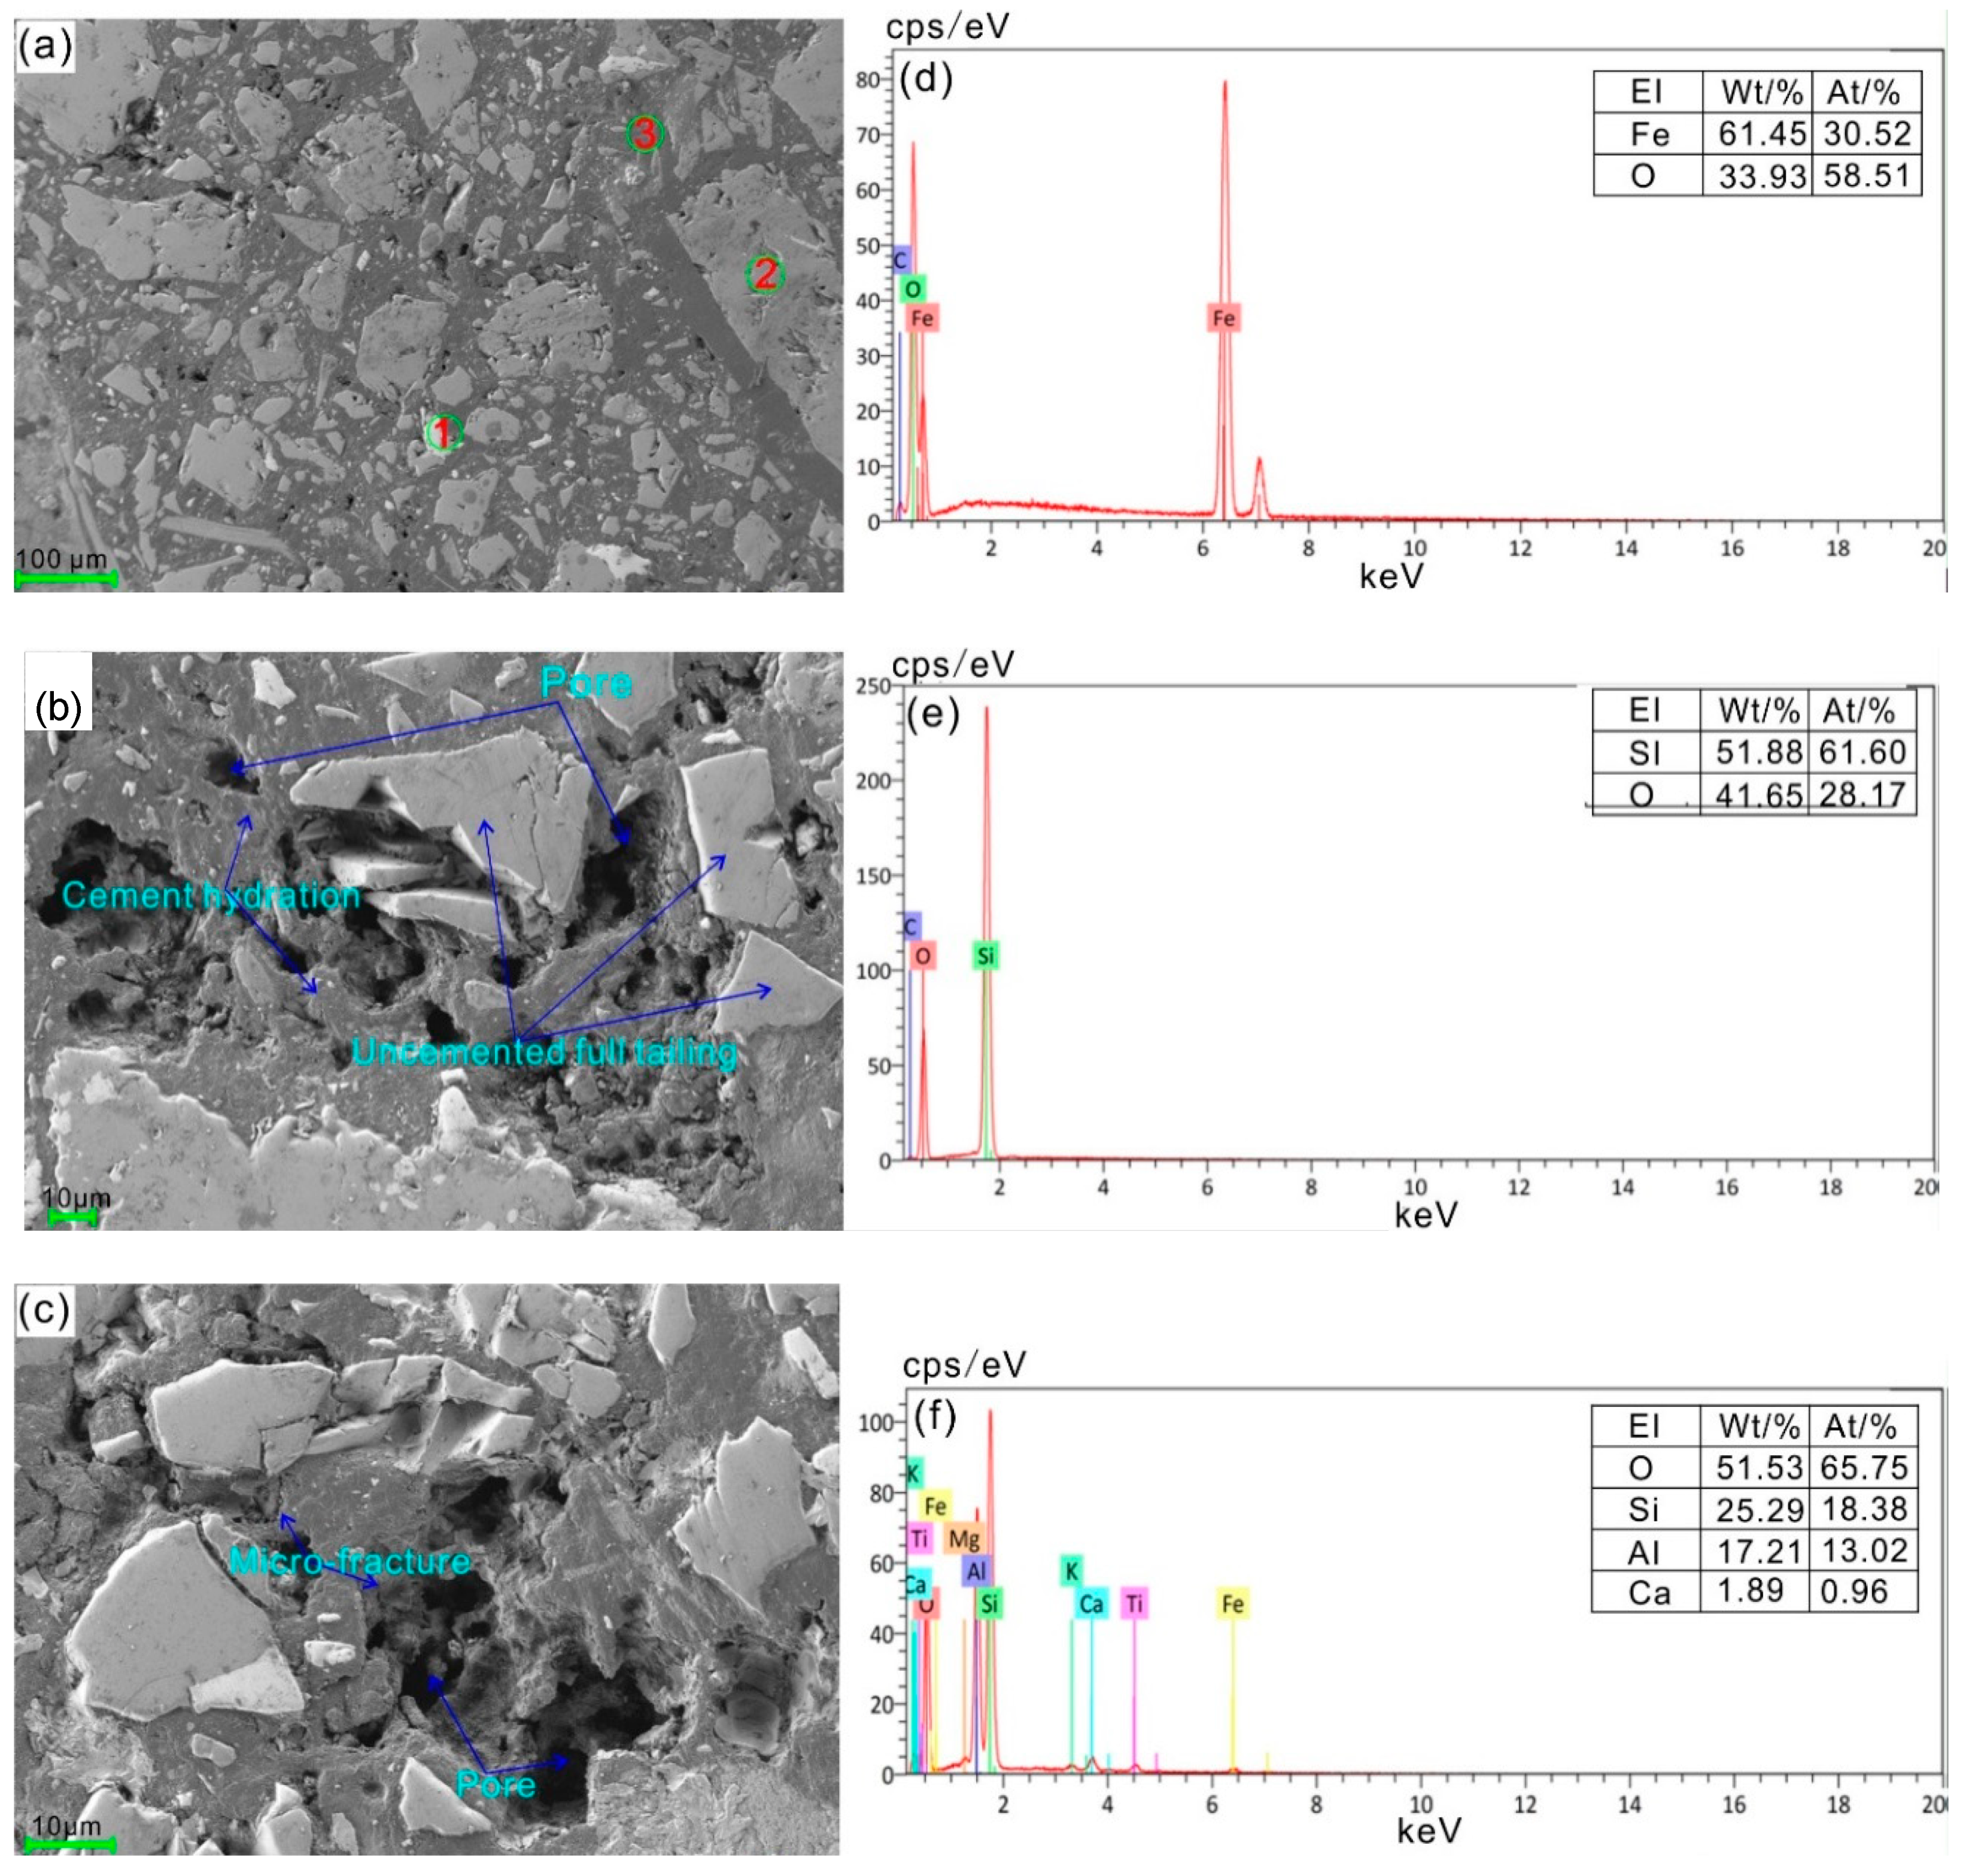
2.1.5. SEM Analysis
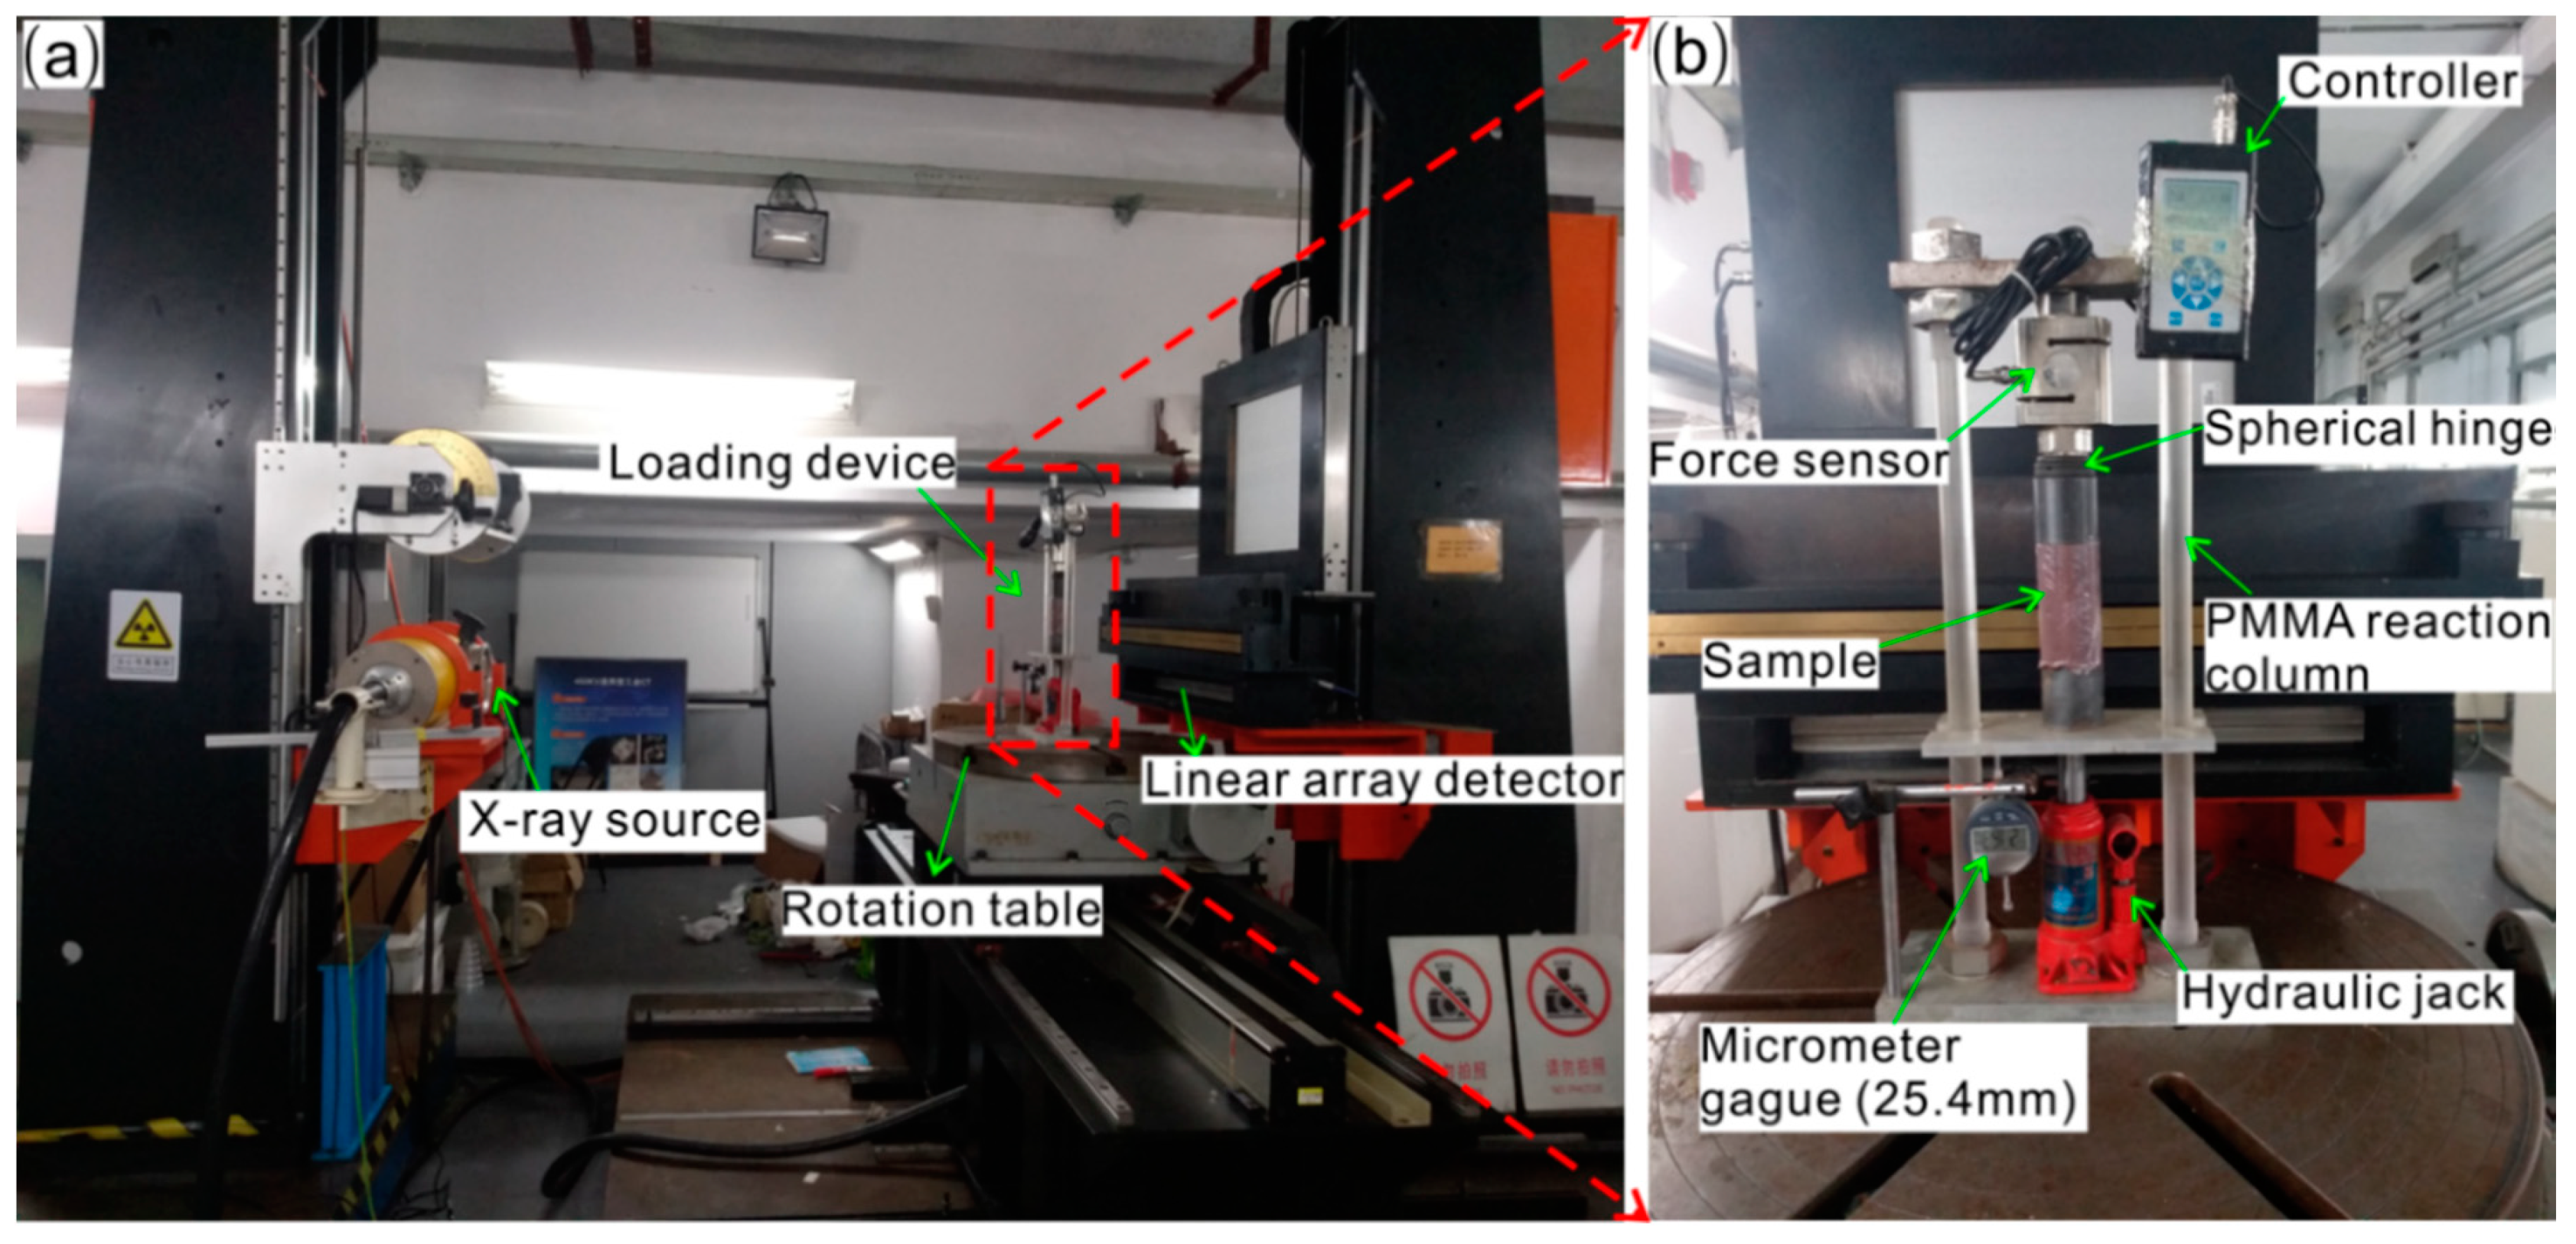
2.2. Experimental Apparatus
2.2.1. X-ray CT Device
2.2.2. Loading Device
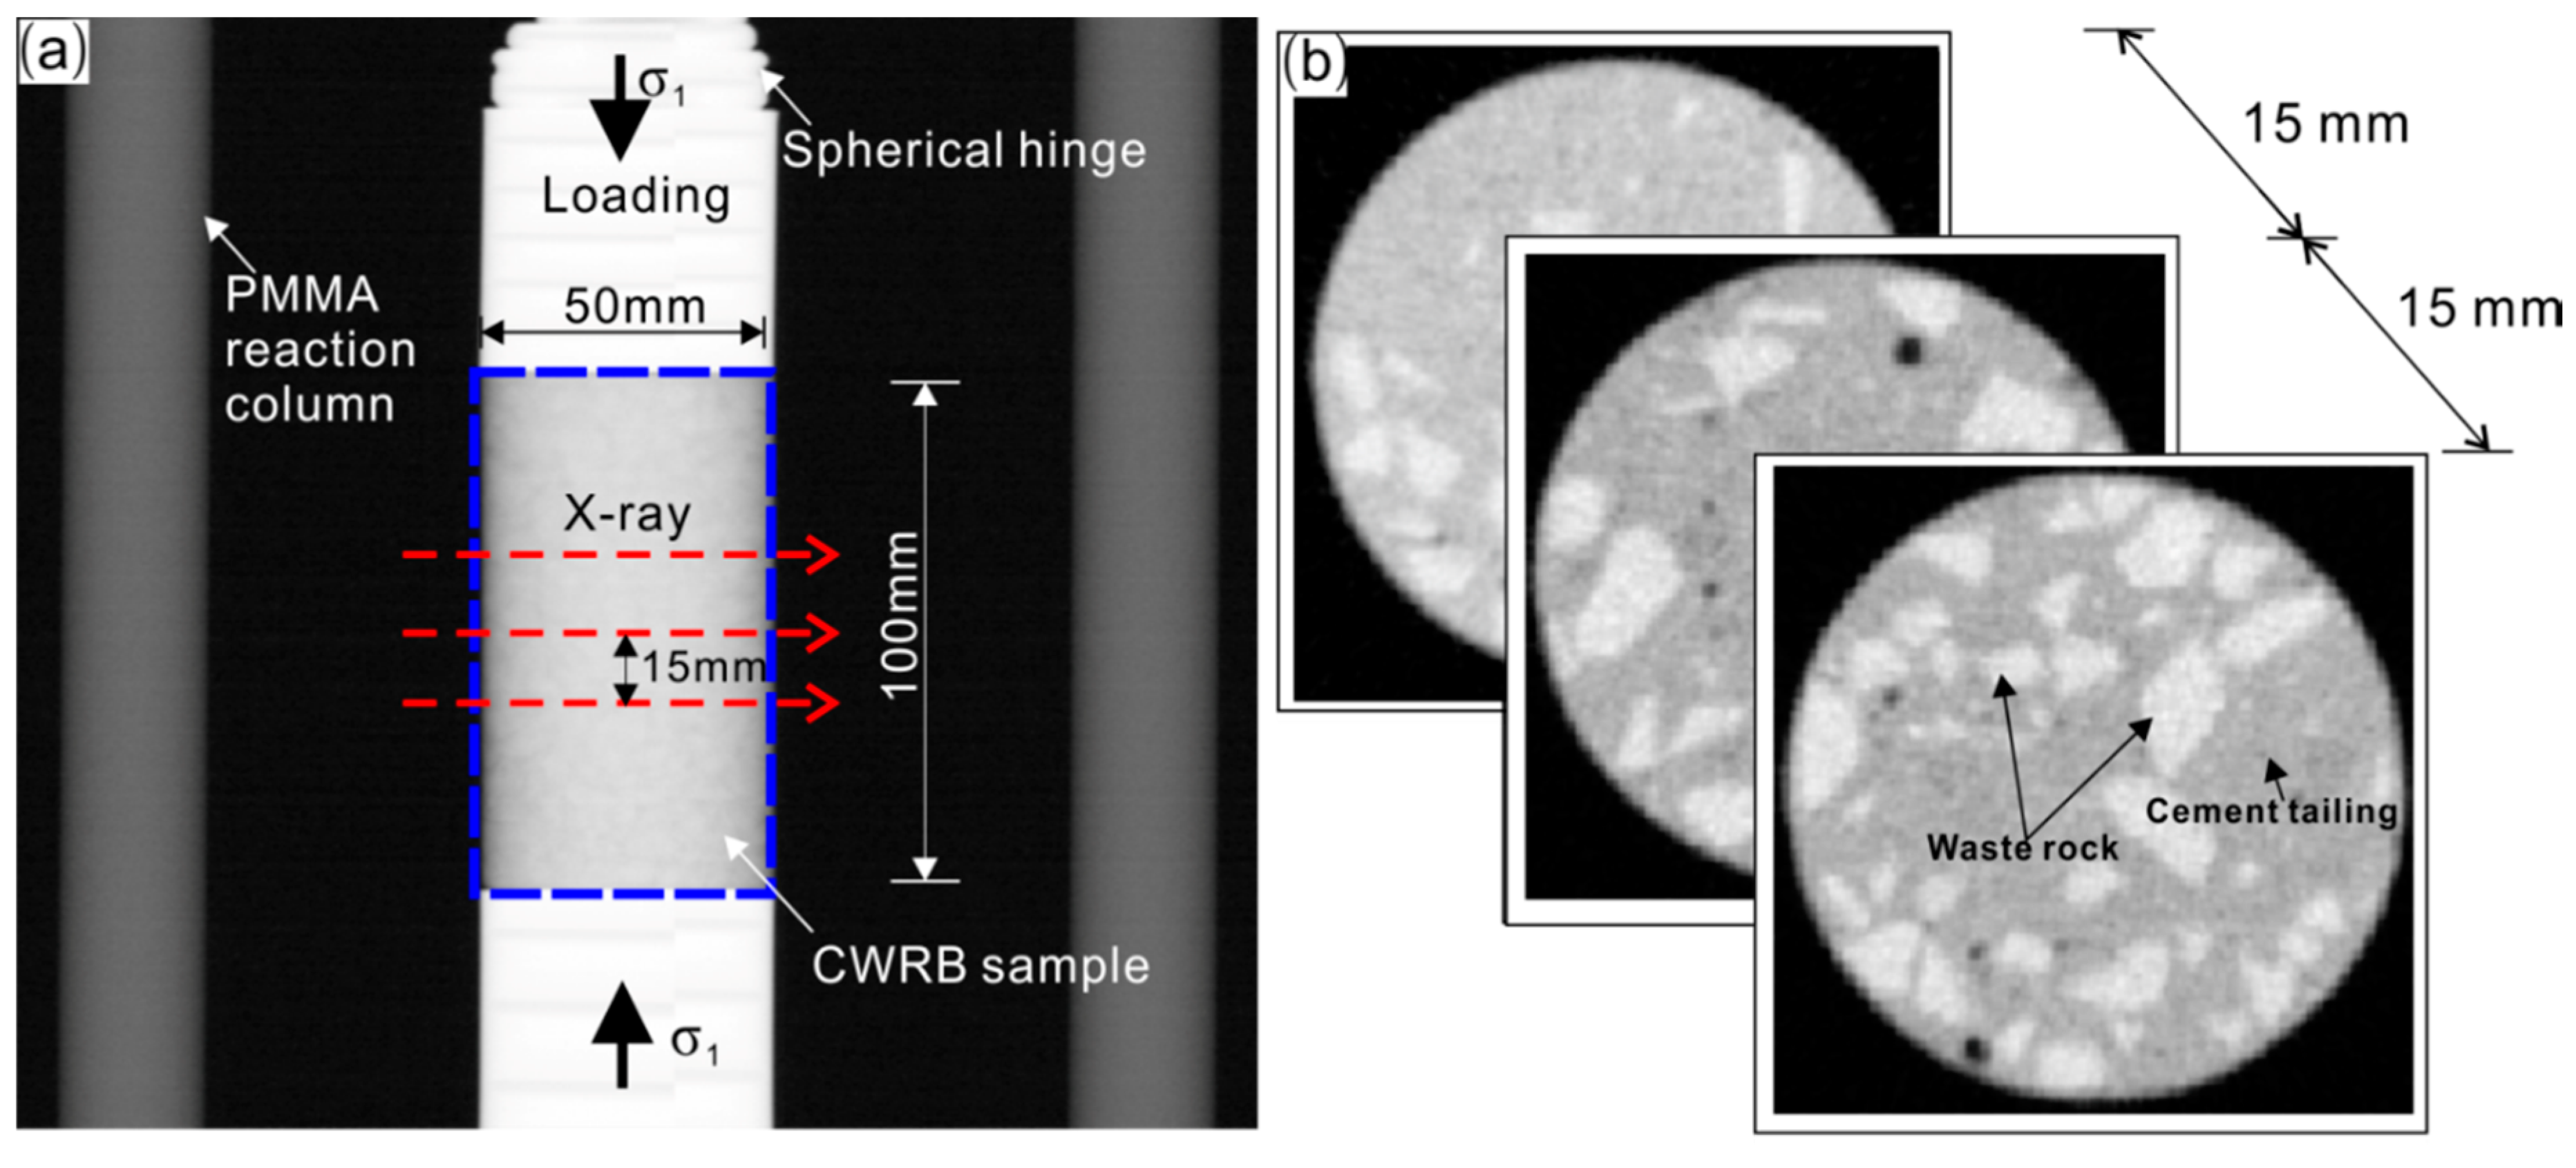
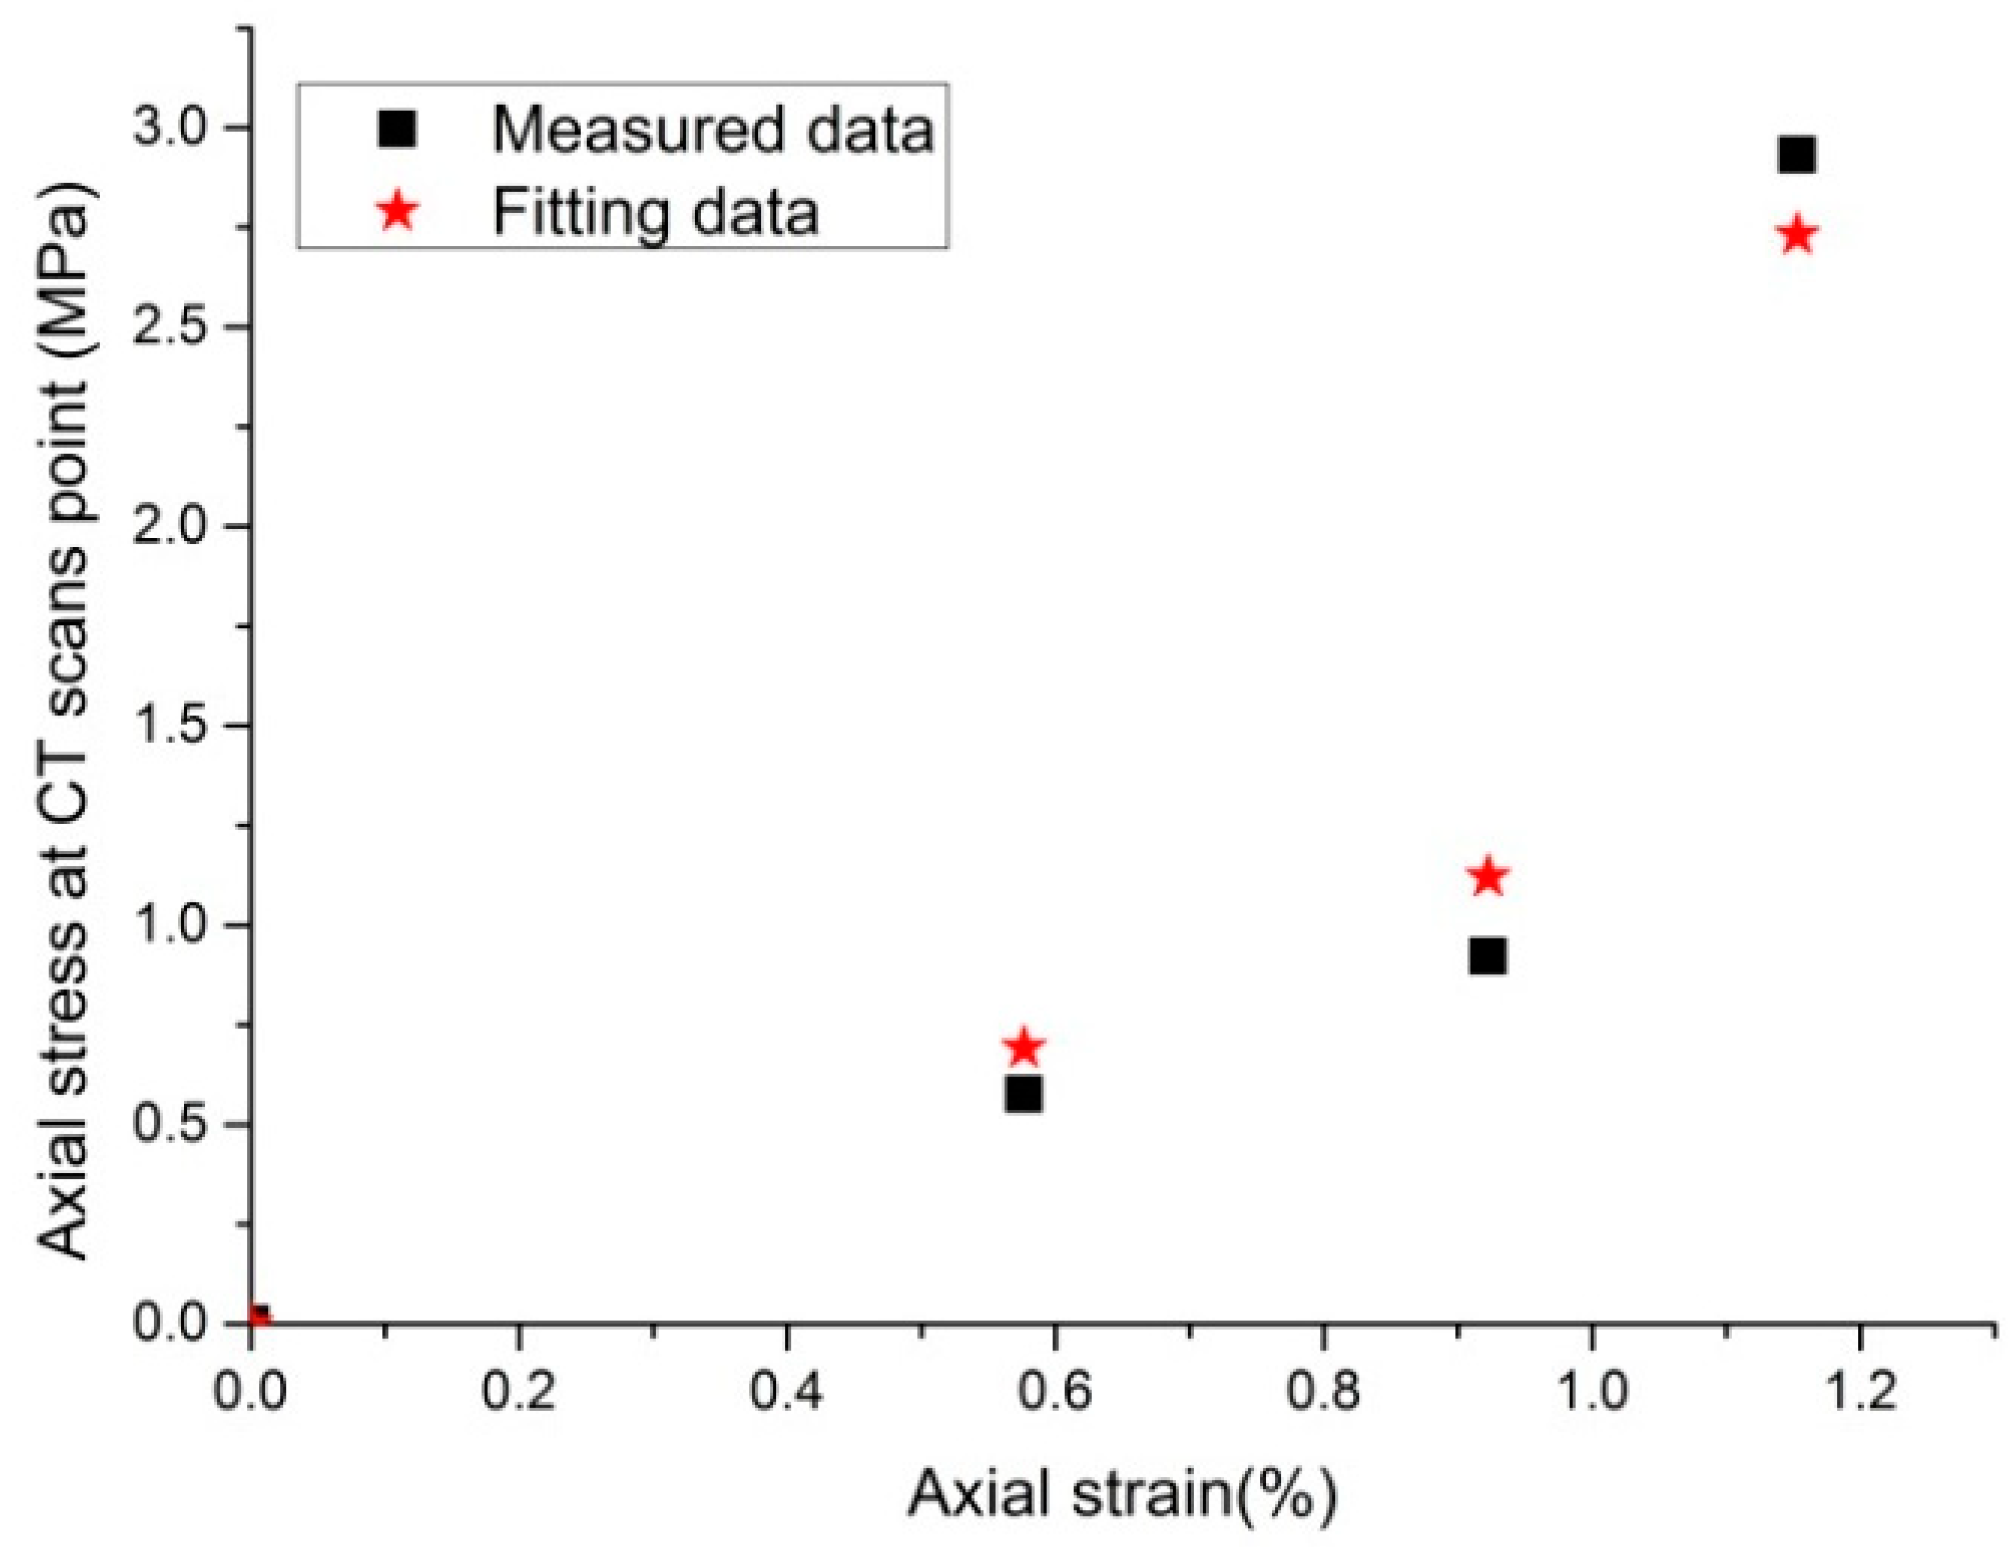
2.3. Testing Scheme
3. Results and Discussion
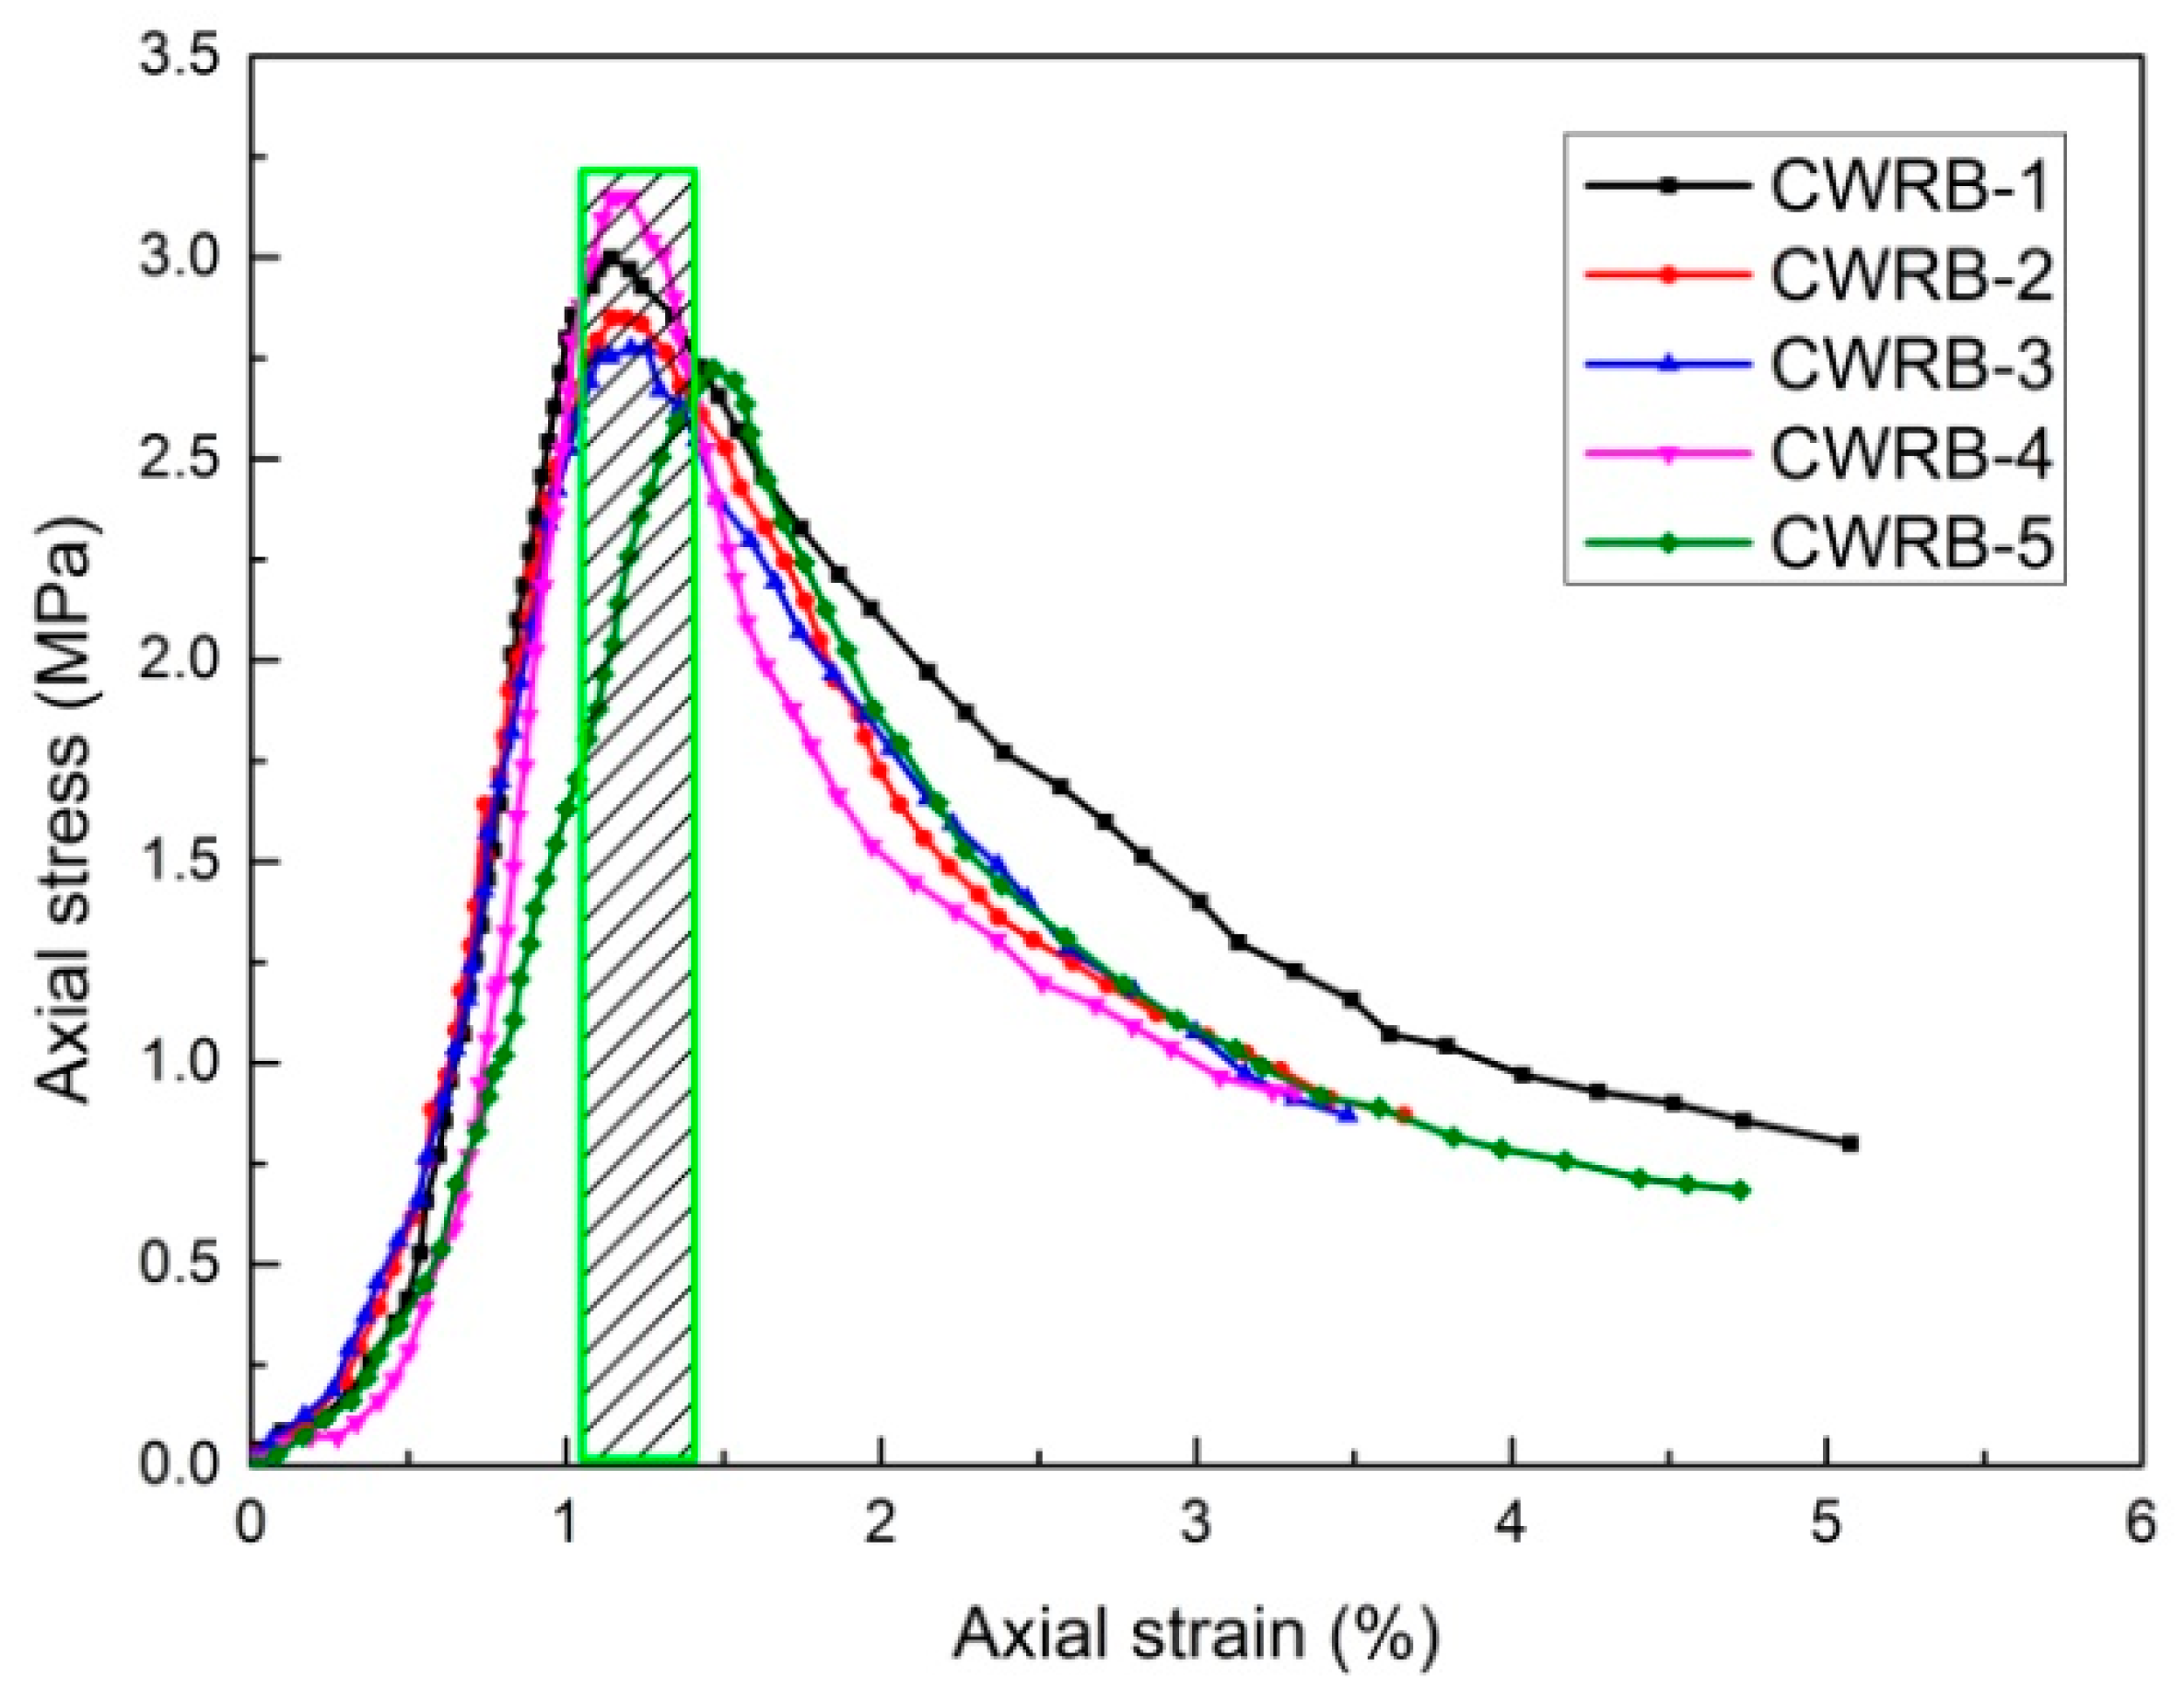
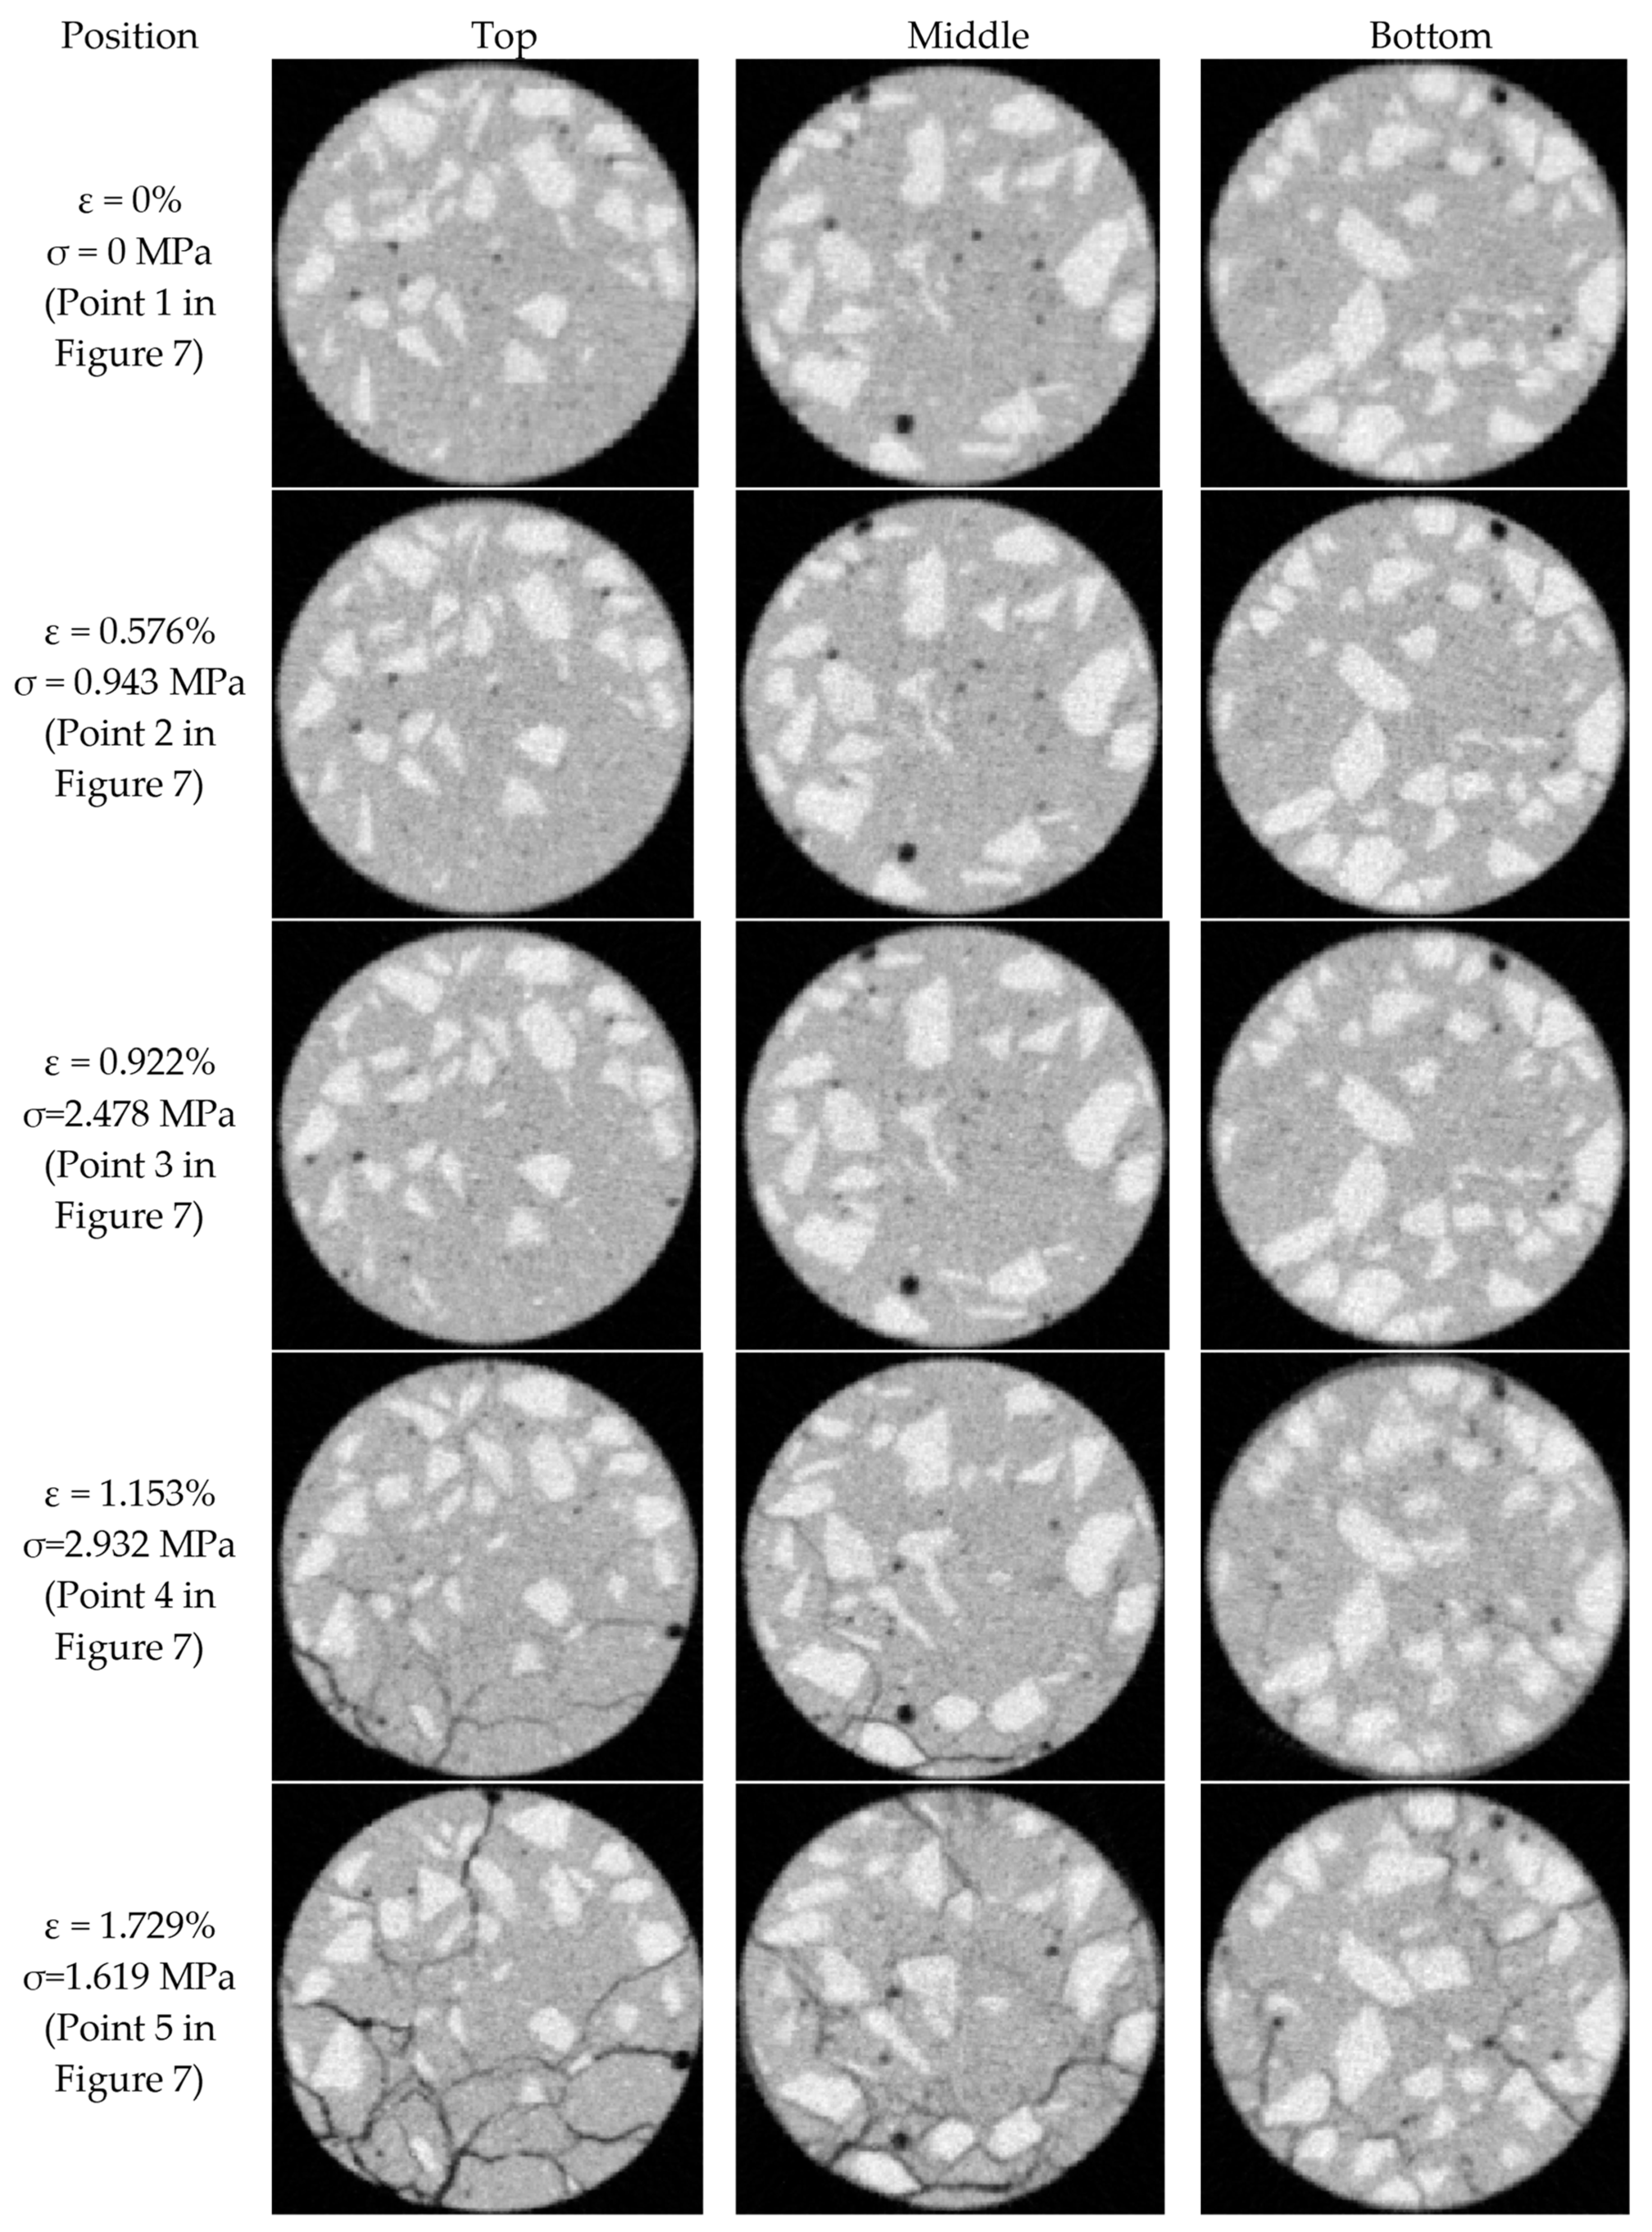
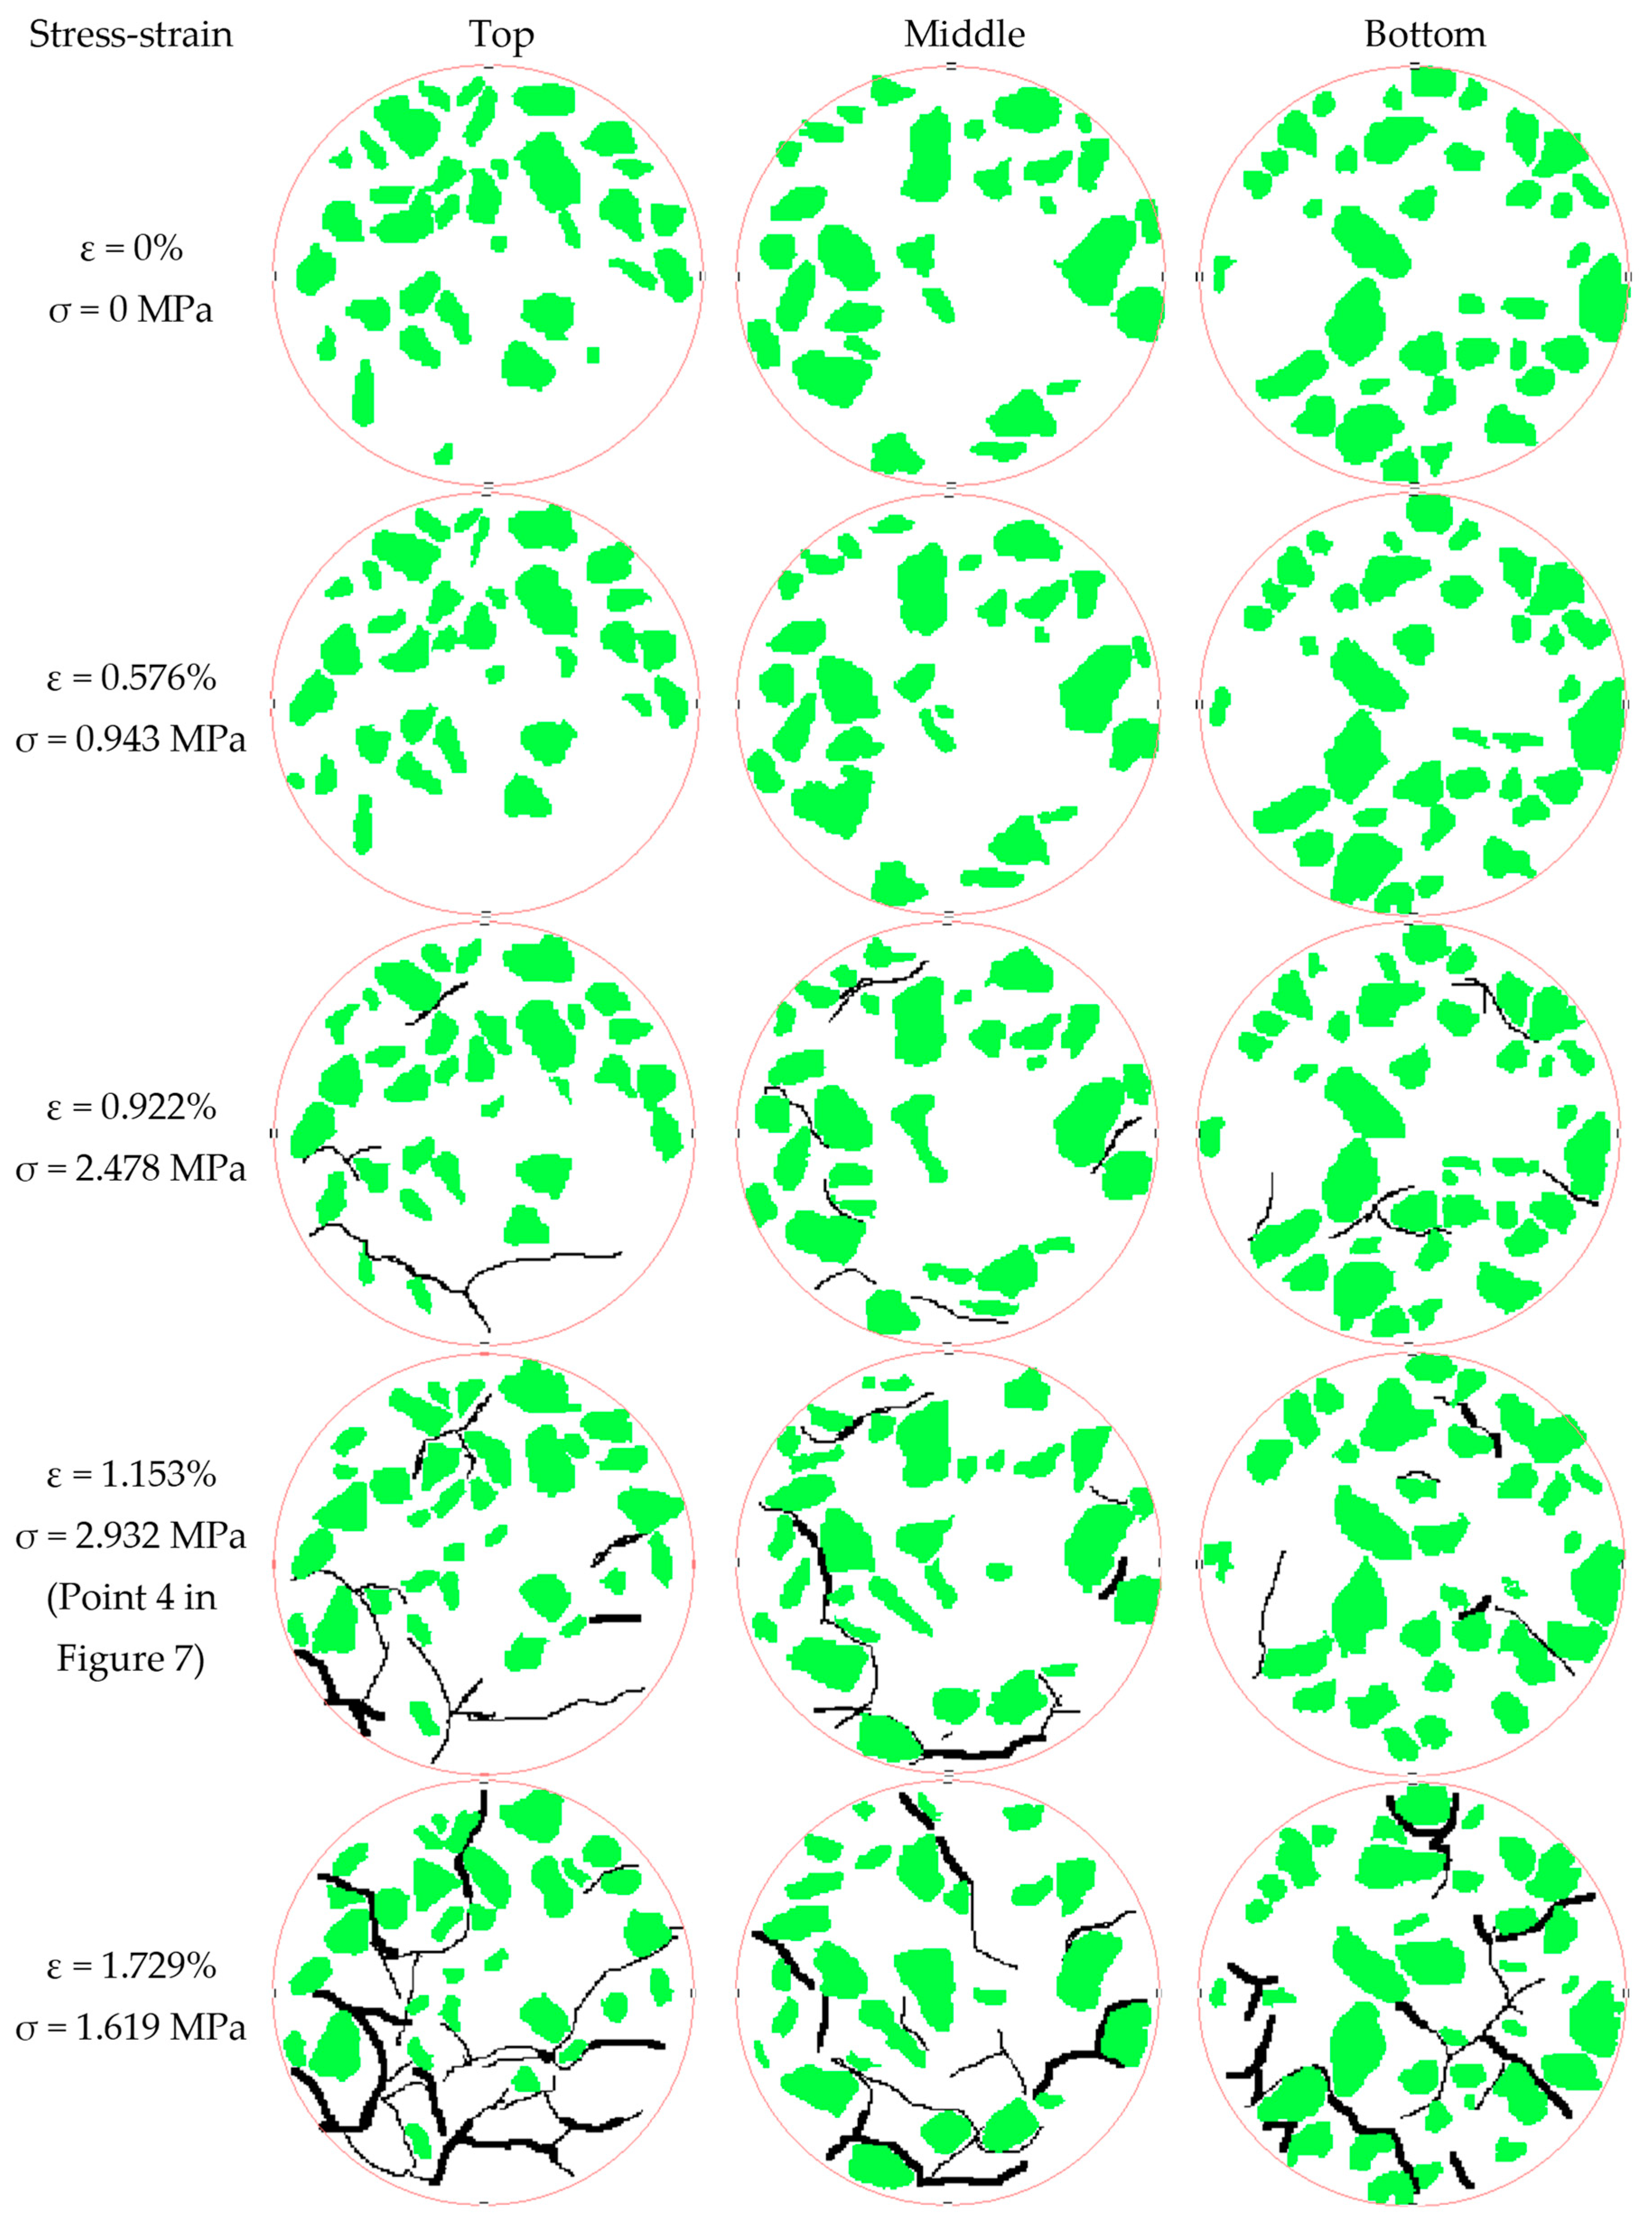
3.1. General Observations
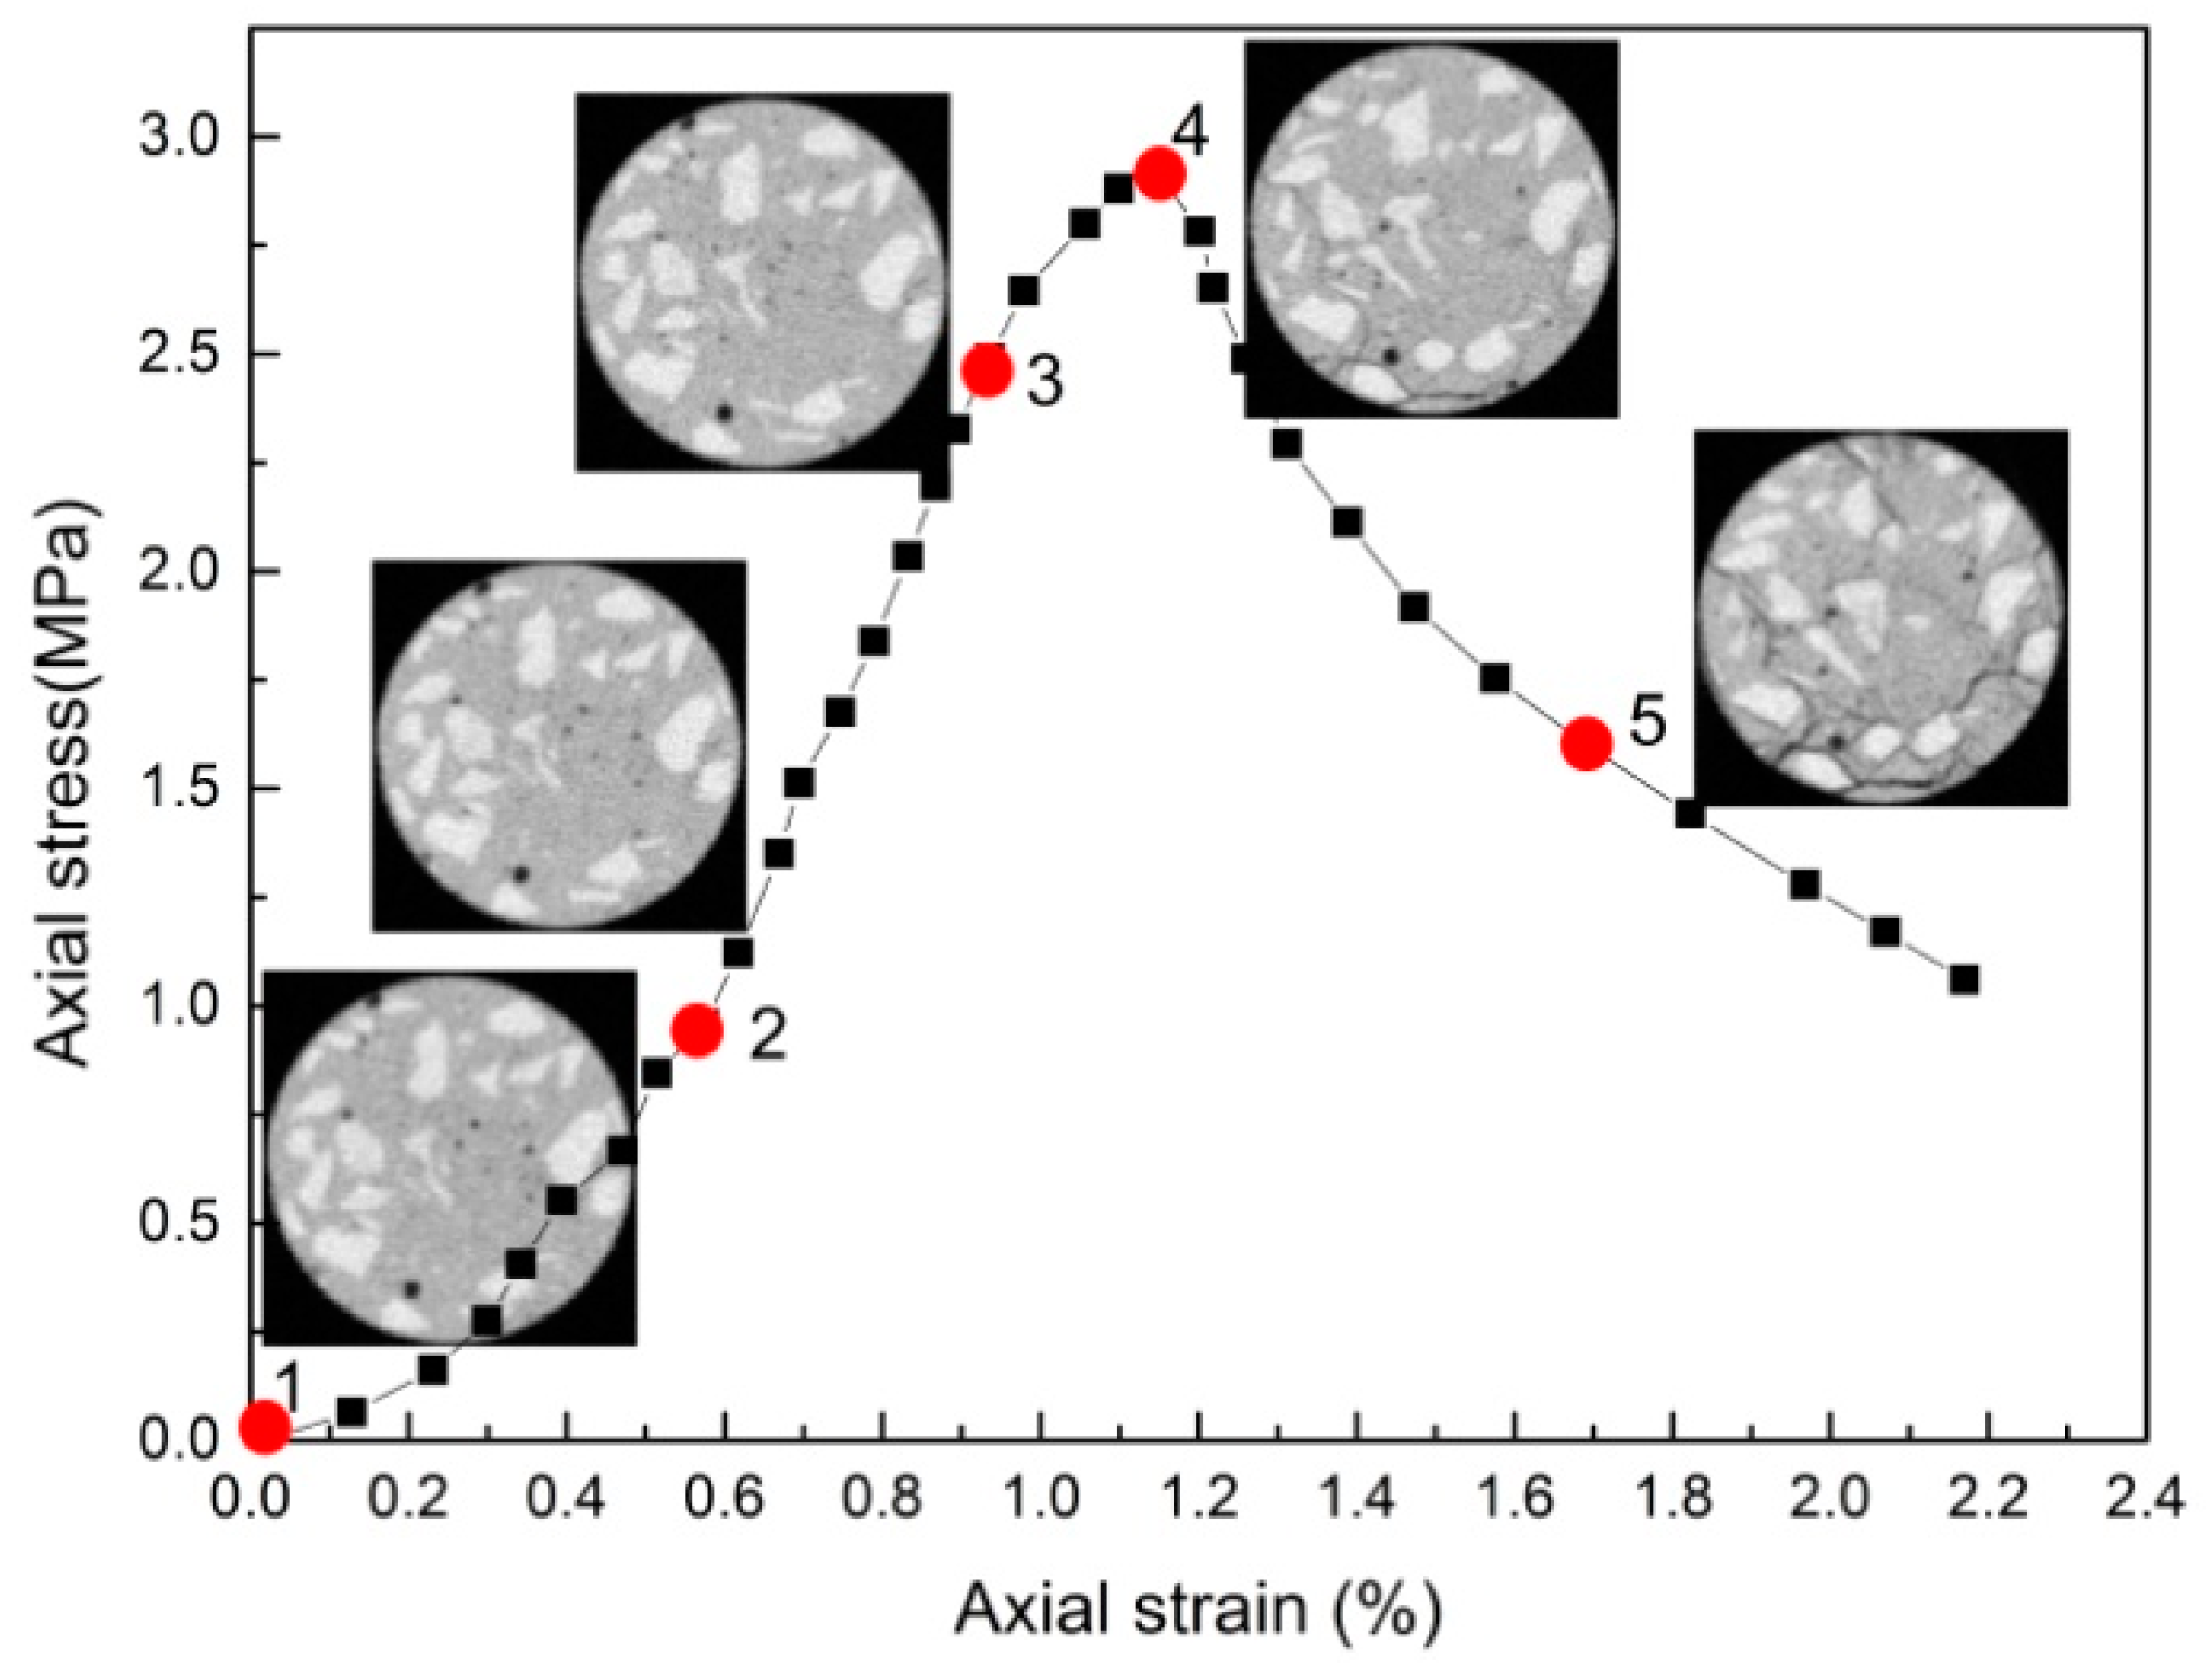
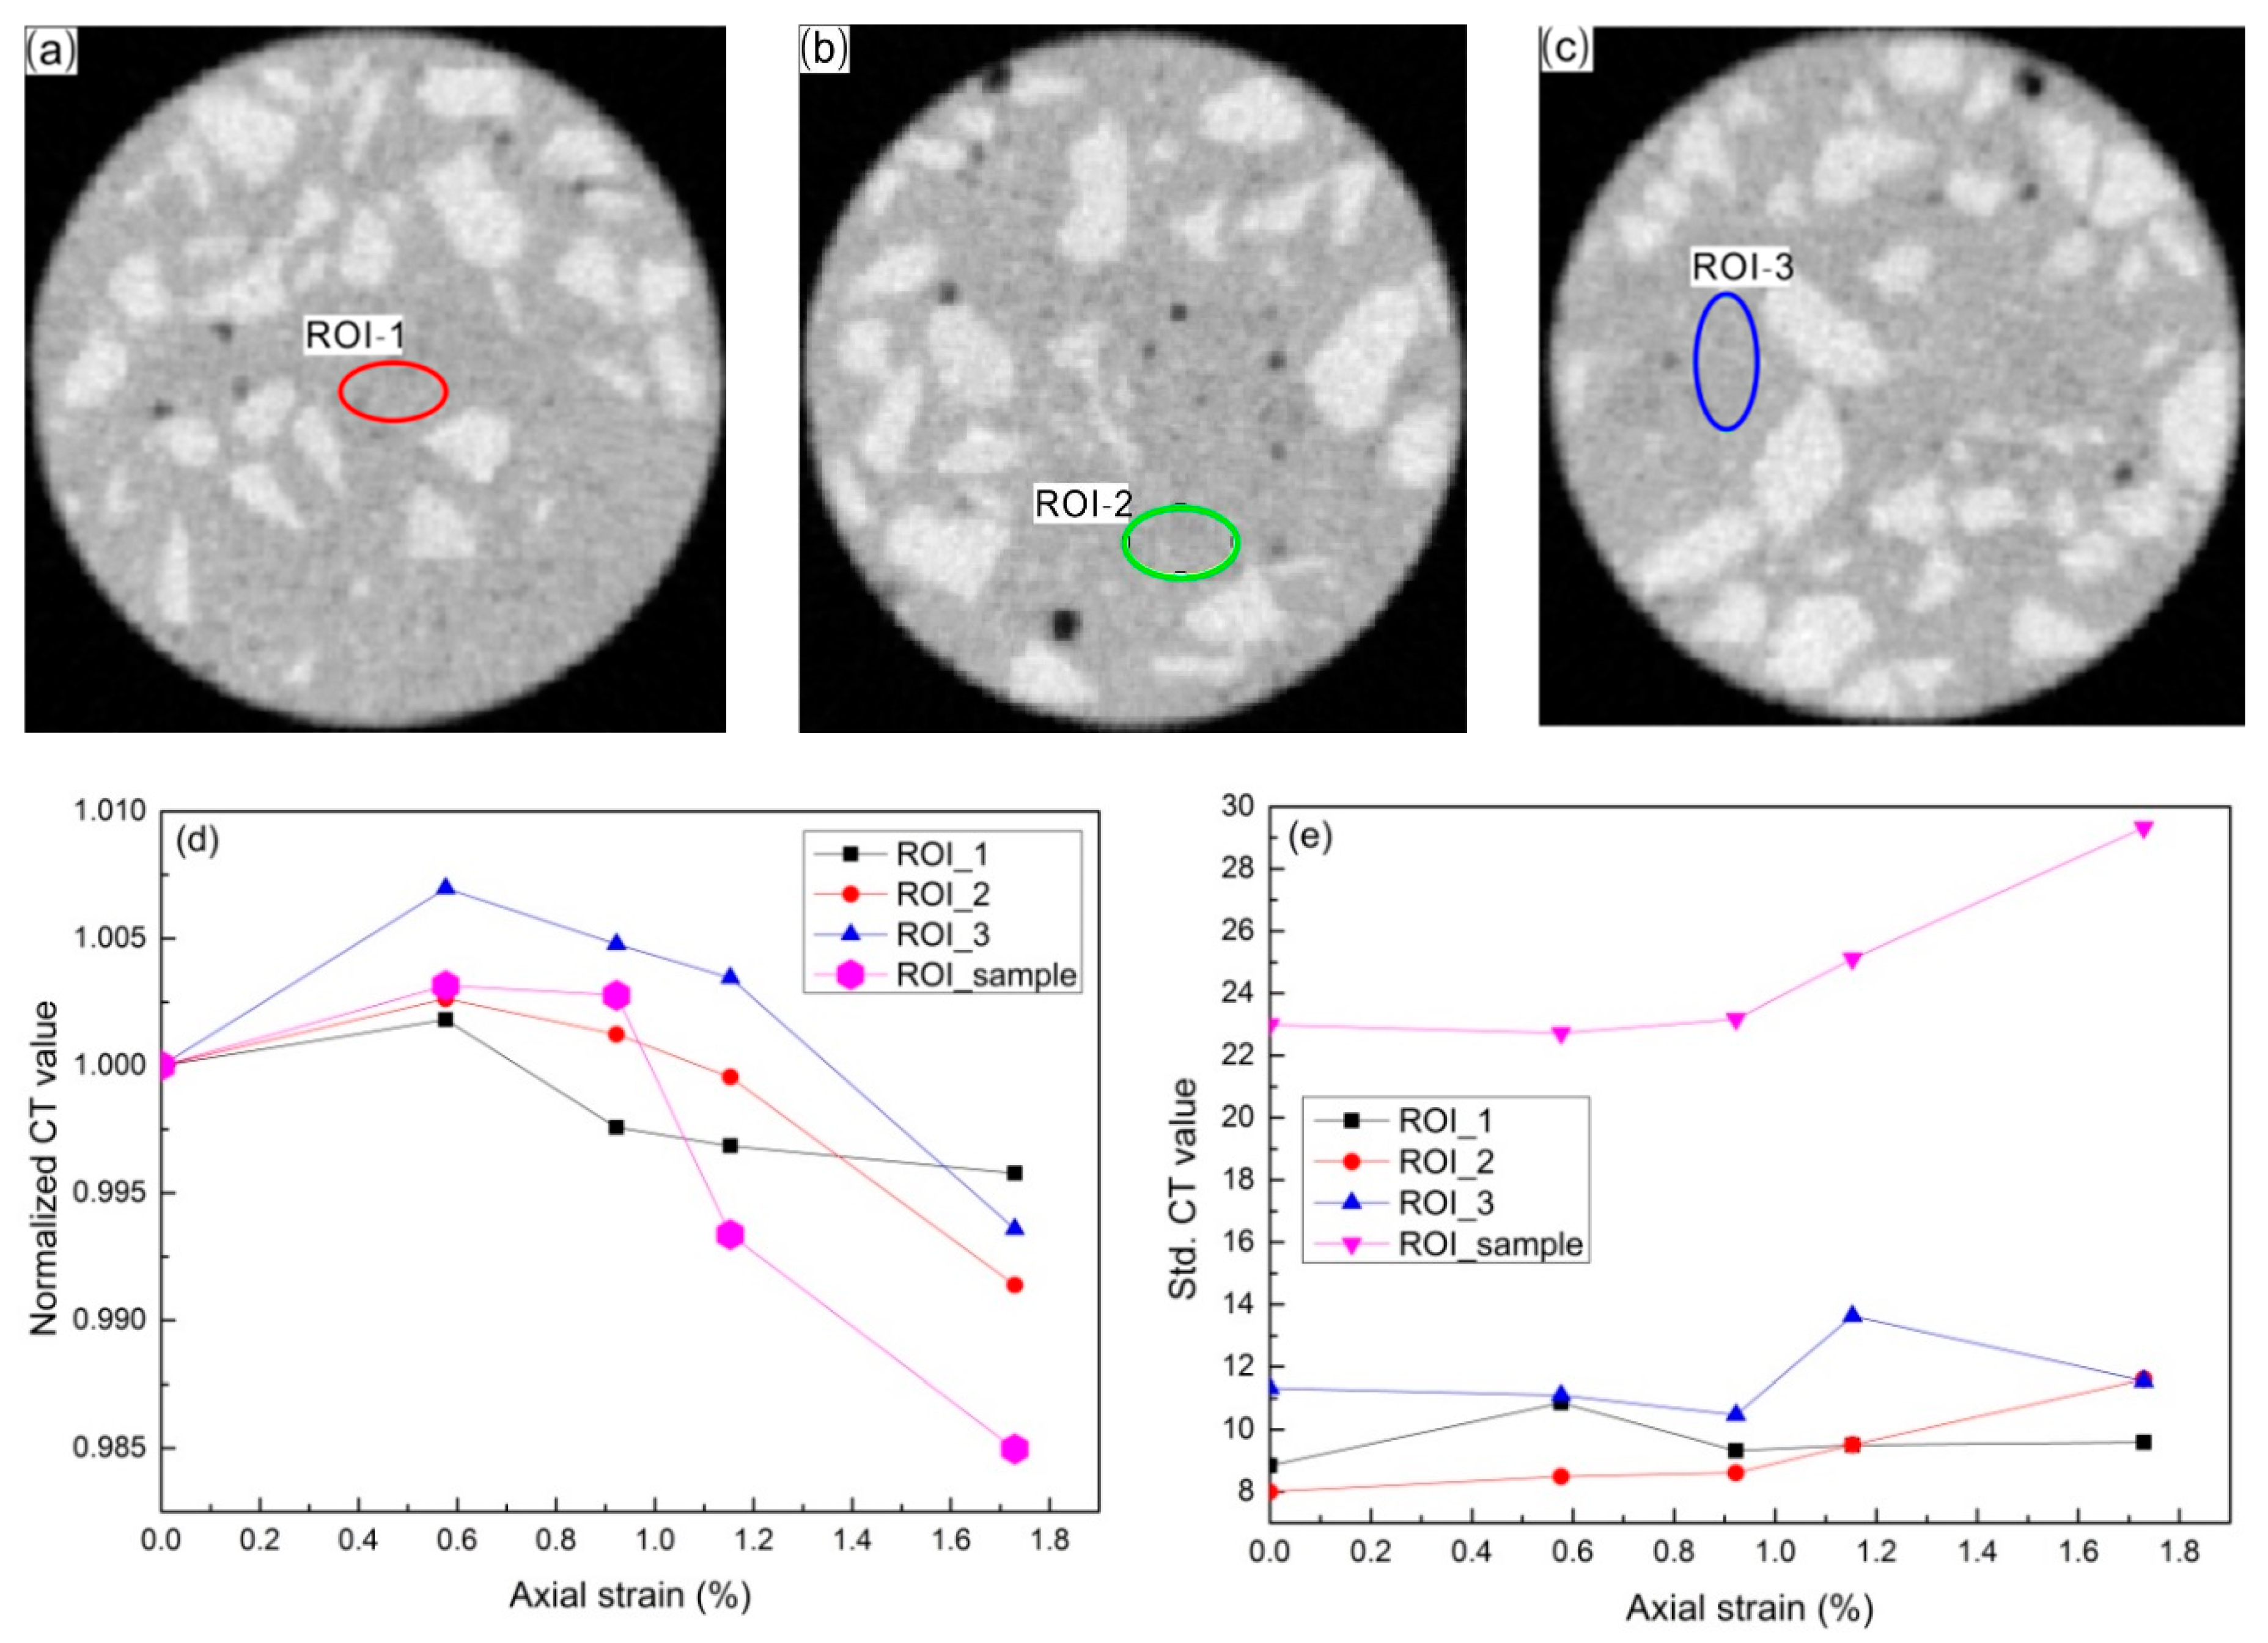
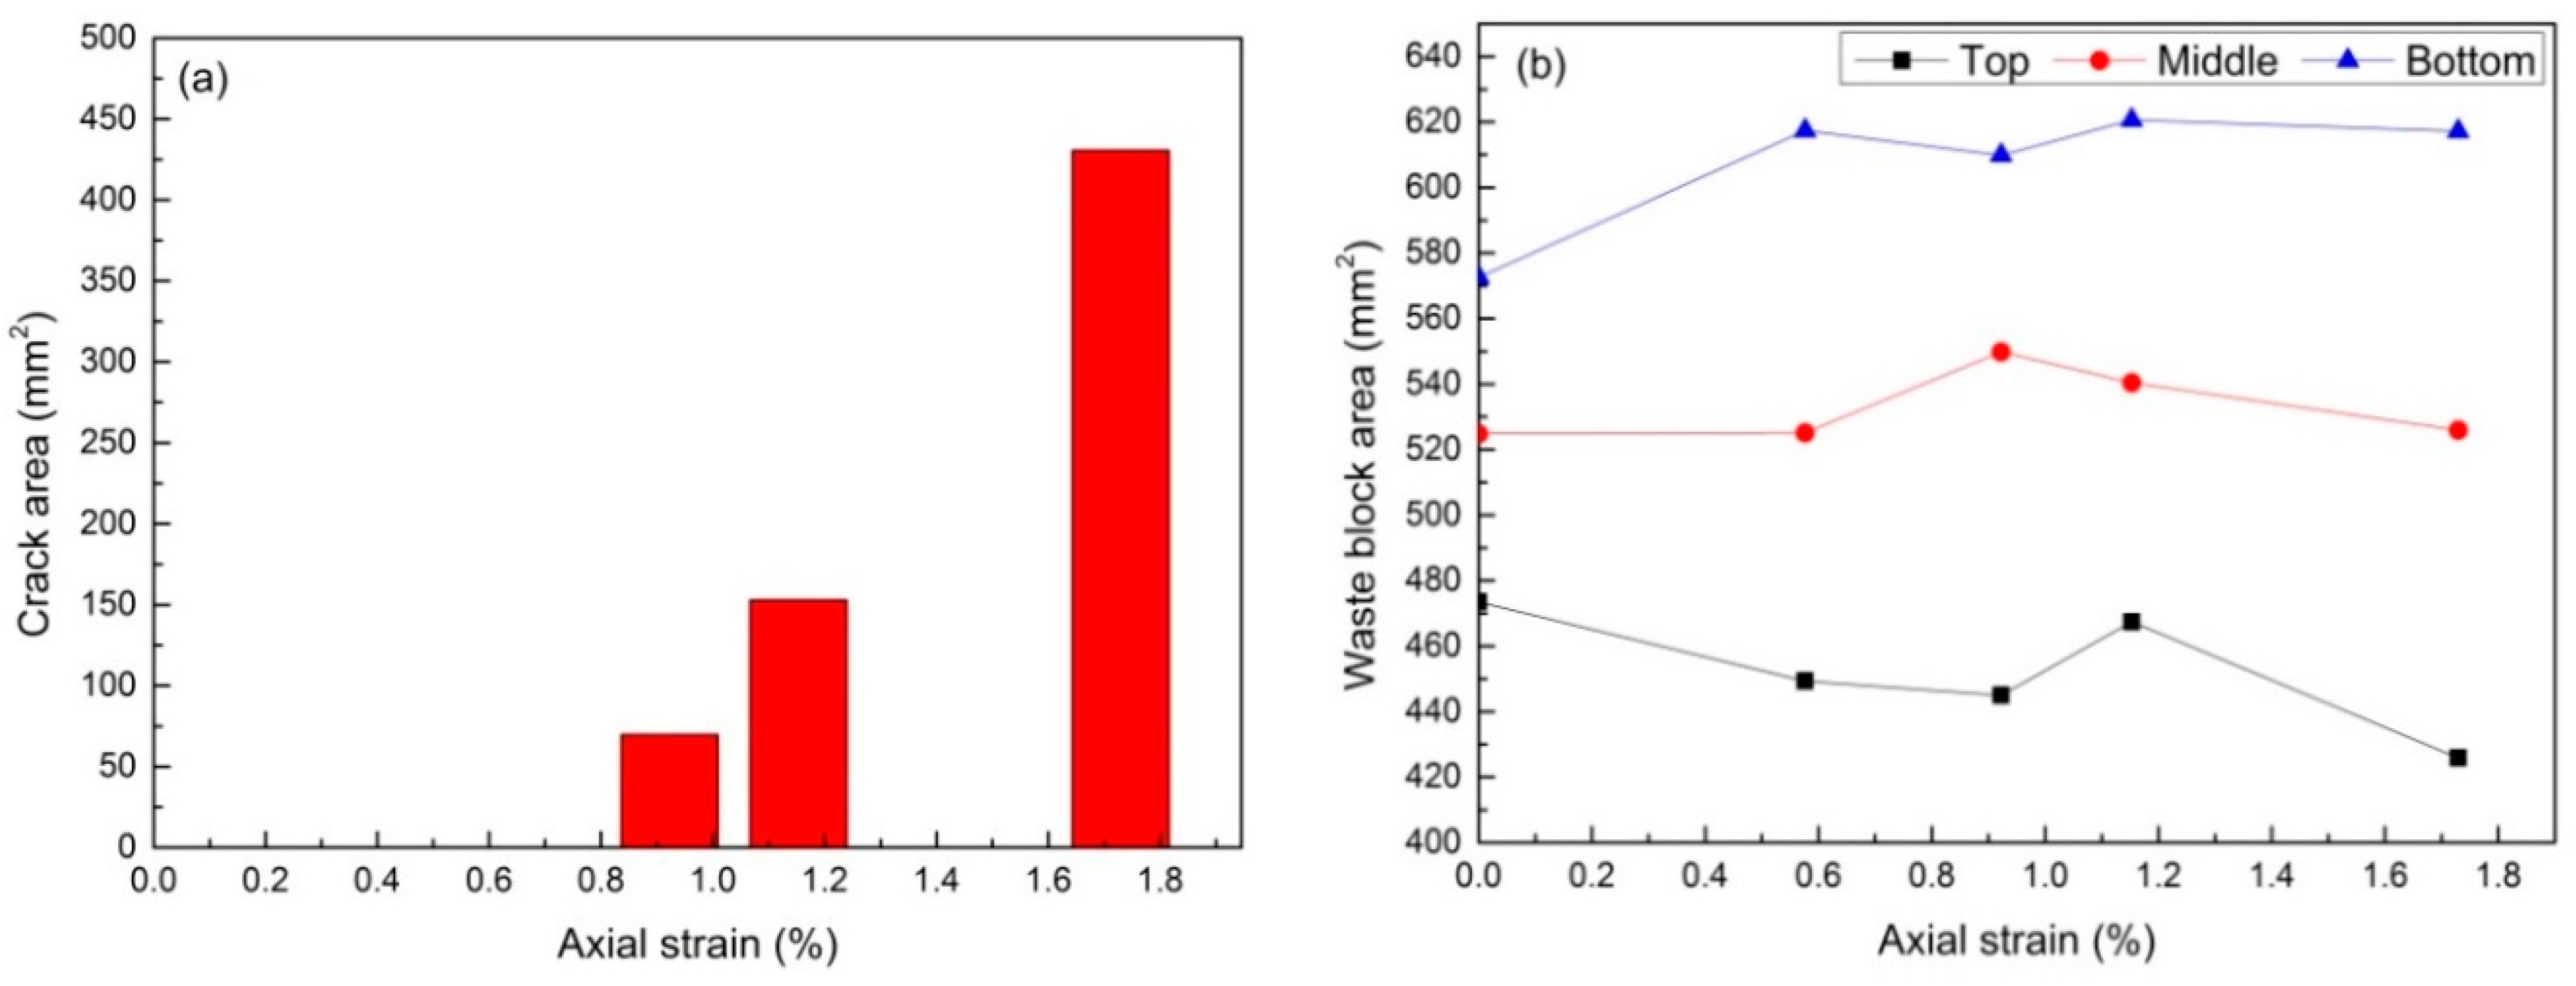
3.2. Meso-Damage Propagation
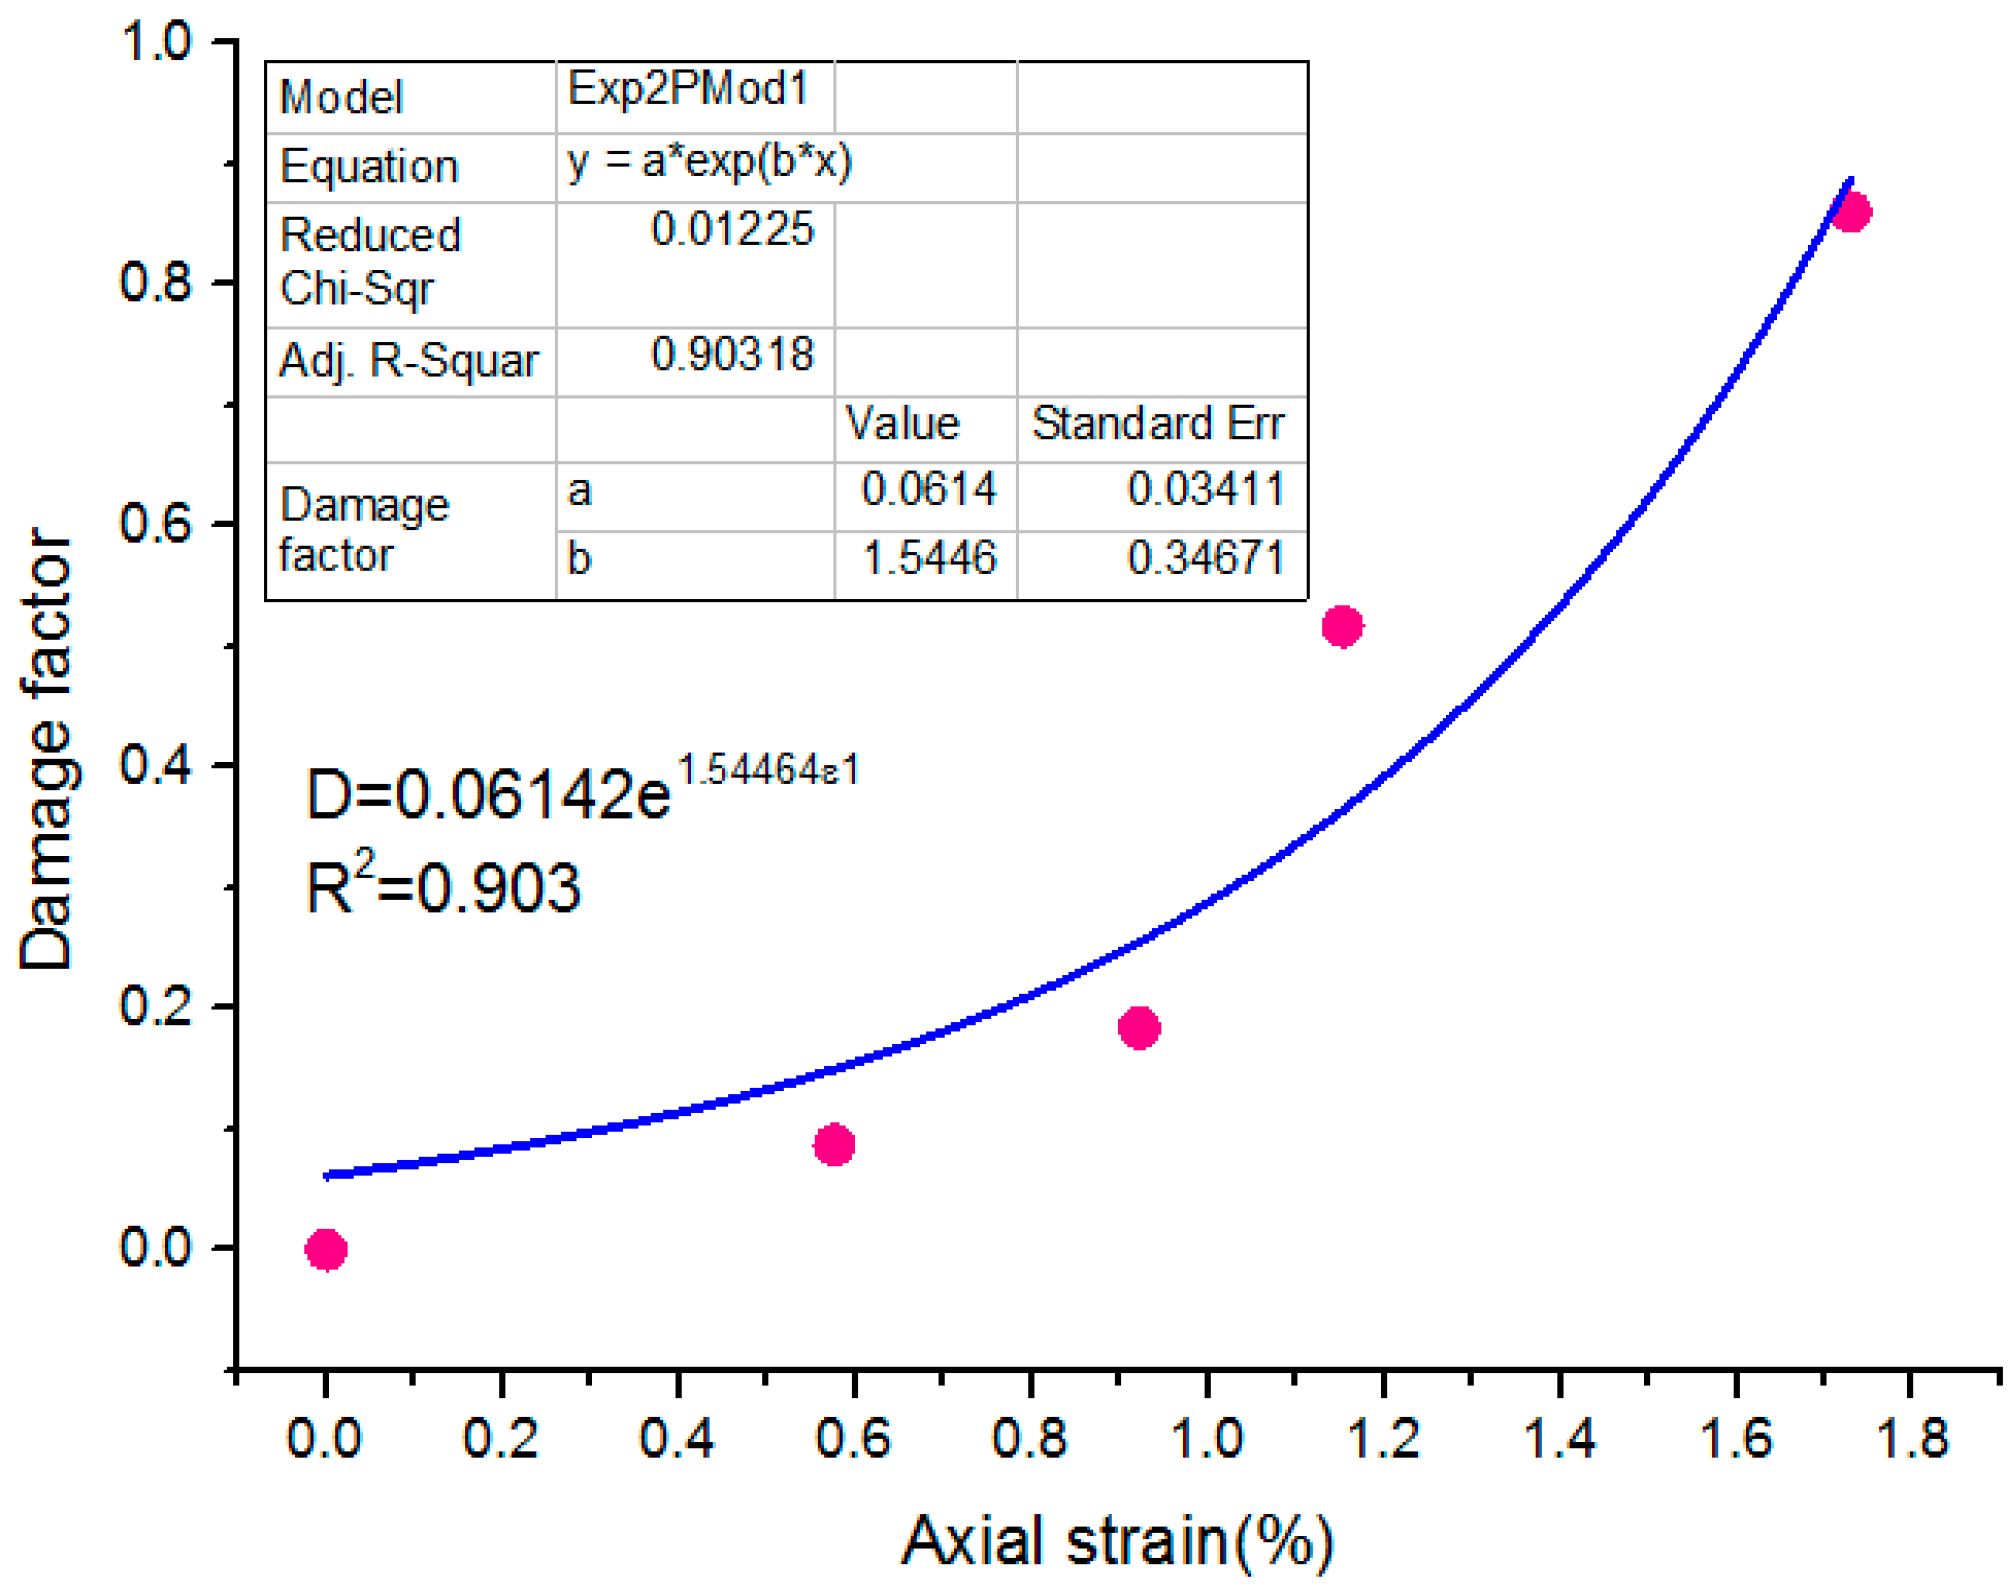
3.3. Damage Evolution Model for CWRB
3.4. Meso-Structural Changes Analysis
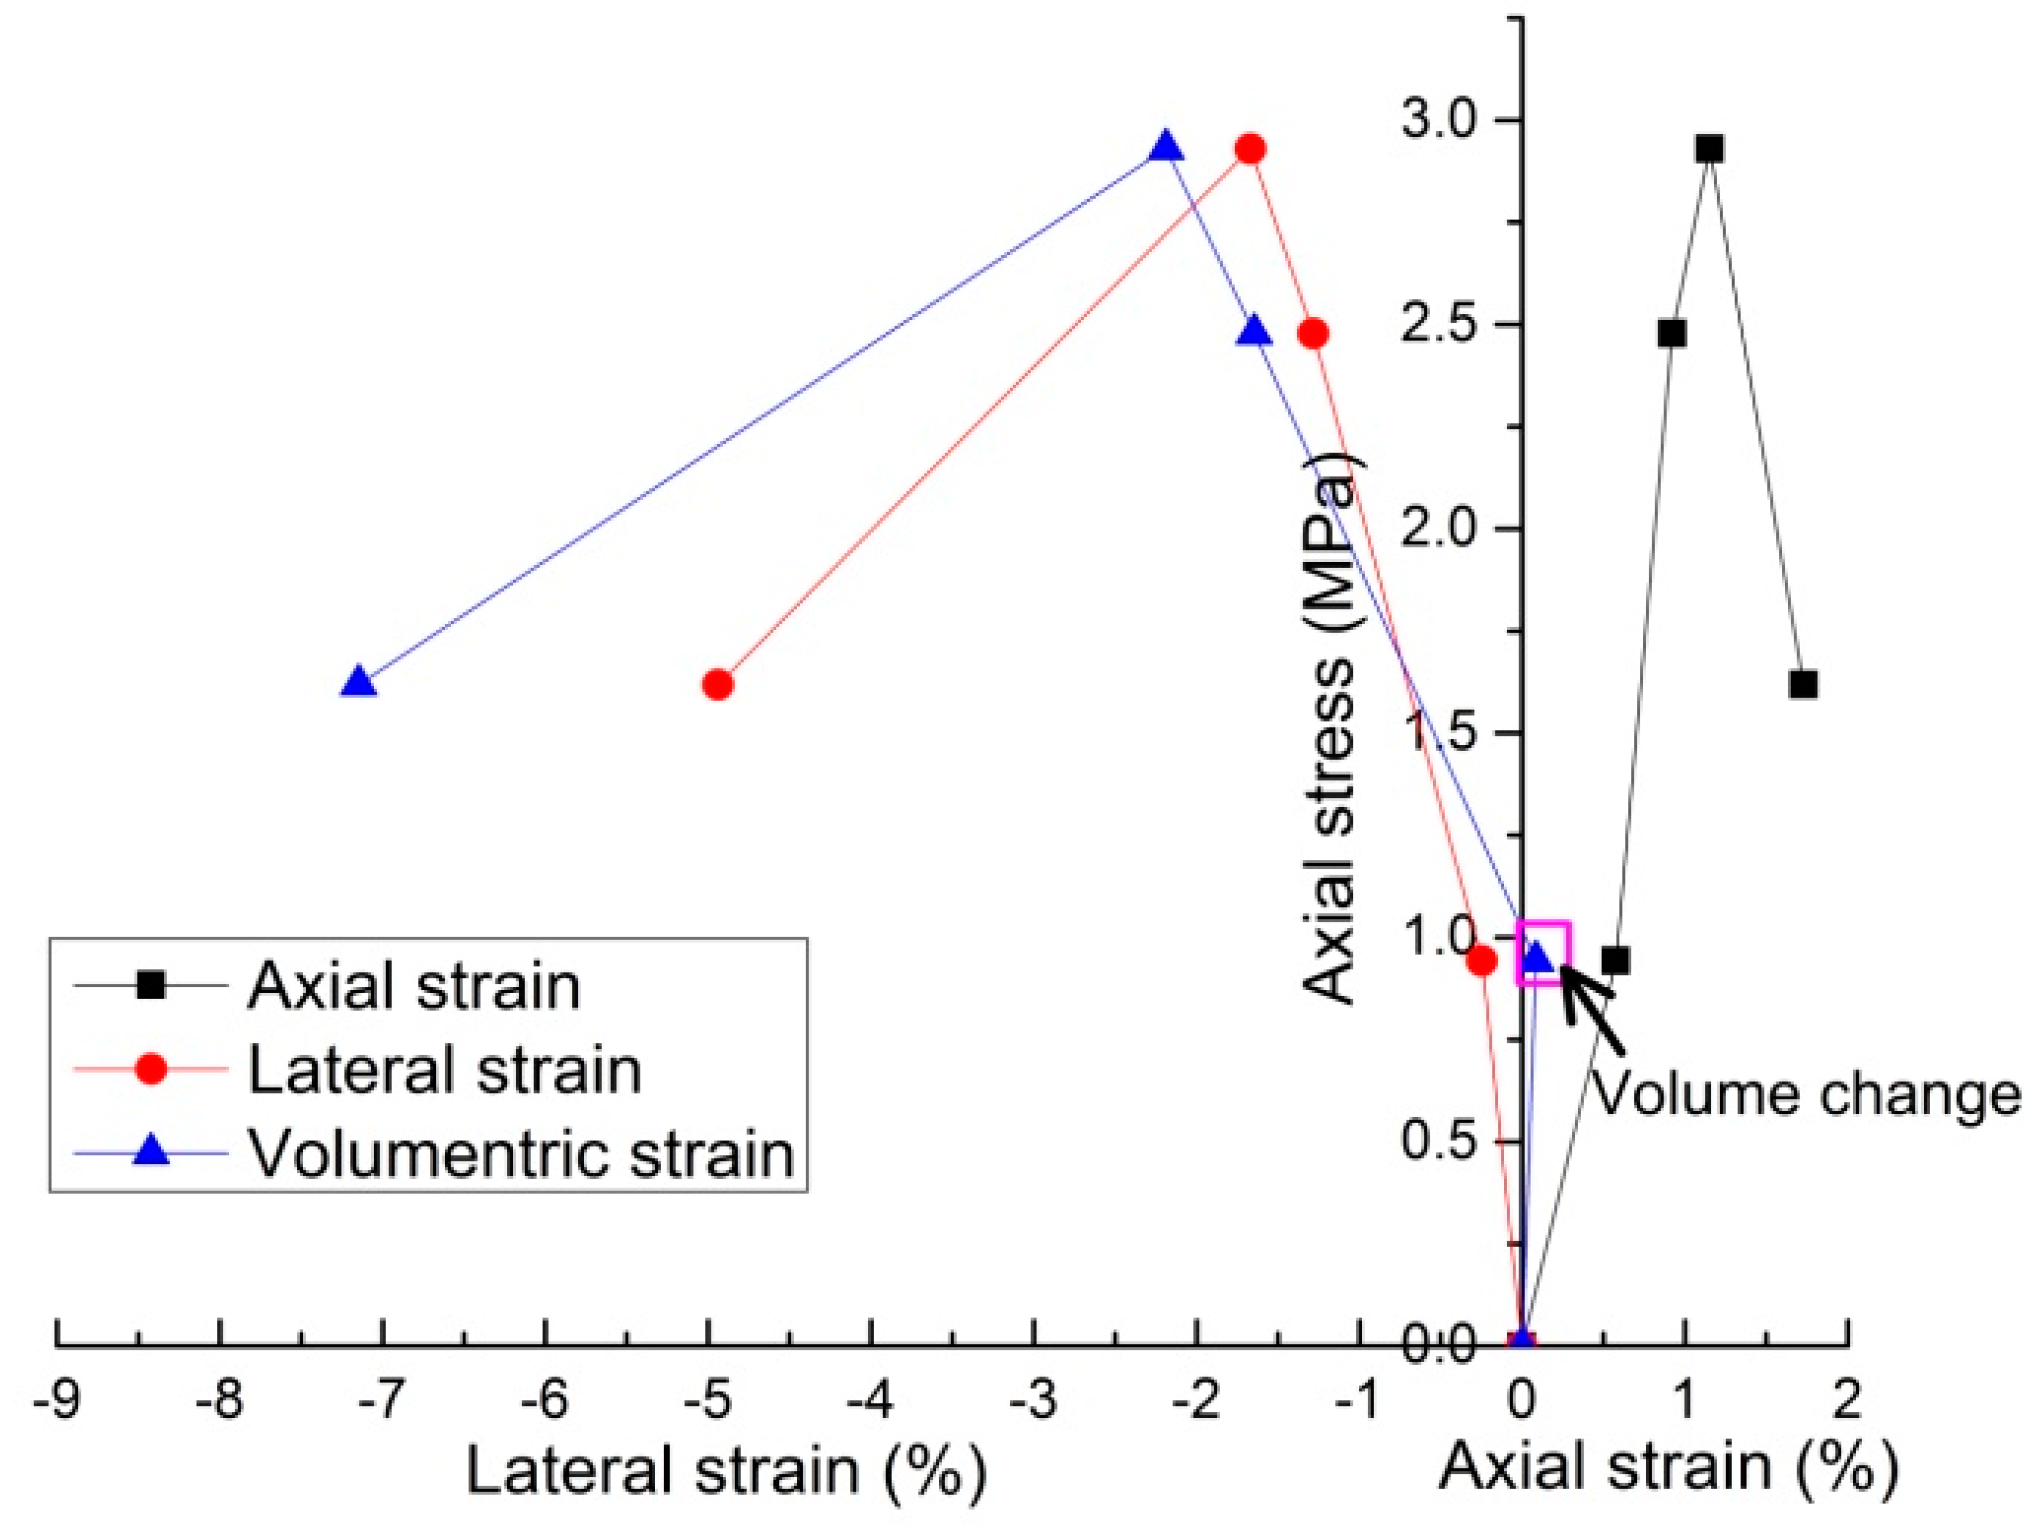
3.5. Dilatancy Characteristics
4. Conclusions
- (1)
- The experimental results indicated that the macroscopic mechanical behaviors of CWRB were affected by the meso-structural changes during sample deformation. The shape and distribution of the waste rocks influenced cracking distribution. Additionally, the crack propagation path was restricted by the waste rock size and shape.
- (2)
- Meso-damage evolution of CWRB using the CT value clarified the damage propagation characteristics. The most severe damaged regions were located at the interfaces because of the stiff contrast between waste rock and tailing paste. Low-density regions in the CT images evolved into cracks and dilatancy became severe as deformations grew. The strain localization phenomenon, especially at the interfaces, was strongly influenced by the relative positions of the waste rock in CWRB.
- (3)
- The X-ray CT data revealed that the damage evolution in CWRB was quite inhomogeneous. Stress dilatancy was an obvious phenomenon during the CWRB deformation because of the interactions between the waste rock and the cemented tailing paste. This may have influenced the stability of the pillar during mining activity, as its meso-mechanical behaviors were deeply studied.
- (4)
- Although many macroscopic mechanical tests have been conducted for CWRB, the in-situ CT test was performed for only one CWRB sample, with a waste rock proportion of 30%. In the further study, CWRB samples with different rock proportions should be studied, in order to compare the meso-damage characteristics and the associated stress dilatancy behaviors.
Author Contributions
Funding
Acknowledgments
Conflicts of Interest
References
- Kesimal, A.; Yilmaz, E.; Ercikdi, B. Evaluation of paste backfill mixture consisting of sulphide-rich mill tailings and varying cement content. Cem. Concr. Res. 2004, 34, 1817–1822. [Google Scholar] [CrossRef]
- Fall, M.; Benzaazoua, M.; Ouellet, S. Experimental characterization of the influence of tailings fineness and density on the quality of cemented paste backfill. Miner. Eng. 2005, 18, 41–44. [Google Scholar] [CrossRef]
- Fall, M.; Benzaazoua, M. Modeling the effect of sulphate on strength development of paste backfill and binder mixture optimization. Cem. Concr. Res. 2005, 35, 301–314. [Google Scholar] [CrossRef]
- Fall, M.; Pokharel, M. Coupled effects of sulphate and temperature on the strength development of cemented tailings backfills: Portland cement-paste backfill. Cem. Concr. Compos. 2013, 32, 819–828. [Google Scholar] [CrossRef]
- Huang, Y.; Zhang, J.; Zhang, Q.; Nie, S. Backfilling technology of substituting waste and fly ash for coal underground in China coal mining area. Environ. Eng. Manag. J. 2011, 10, 110–119. [Google Scholar] [CrossRef]
- Ke, X.; Hou, H.; Zhou, M.; Wang, Y.; Zhou, X. Effect of particle gradation on properties of fresh and hardened cemented paste backfill. Constr. Build. Mater. 2015, 96, 378–382. [Google Scholar] [CrossRef]
- Belem, T.; Benzaazoua, M. Design and application of underground mine paste backfill technology. Geotech. Geol. Eng. 2008, 26, 147–174. [Google Scholar] [CrossRef]
- Belem, T.; Benzaazoua, M. Predictive models for pre-feasibility cemented pastebackfill mix design. In Proceedings of the 3rd International Conference on Post-Mining, Nancy, France, 6–8 February 2008. [Google Scholar]
- Cui, L.; Fall, M. An evolutive elasto-plastic model for cemented paste backfill. Comput. Geotech. 2016, 71, 19–29. [Google Scholar] [CrossRef]
- Cayouette, J. Optimization of the paste backfill plant at Louvicourt mine. CIM Bull. 2003, 96, 51–57. [Google Scholar]
- Fahey, M.; Helinski, M.; Fourie, A. Development of specimen curing proceduresthat account for the influence of effective stress during curing on the strengthof cemented mine backfill. Geotech. Geol. Eng. 2011, 29, 709–723. [Google Scholar] [CrossRef]
- Chen, Q.S.; Zhang, Q.L.; Fourie, A.; Chen, X.; Qi, C.C. Experimental investigation on the strength characteristics of cement paste backfill in a similar stope model and its mechanism. Constr. Build. Mater. 2017, 154, 34–43. [Google Scholar] [CrossRef]
- Cao, S.; Yilmaz, E.; Song, W. Evaluation of viscosity, strength and microstructural properties of cemented tailings backfill. Minerals 2018, 8, 352. [Google Scholar] [CrossRef]
- Taheri, A.; Tatsuoka, F. Small-And large-Strain behaviour of a cement-treated soil during various loading histories and testing conditions. Acta Geotech. 2015, 10, 131–155. [Google Scholar] [CrossRef]
- Wu, J.; Feng, M.; Chen, Z.; Mao, X.; Han, G.; Wang, Y. Particle size distribution effects on the strength characteristic of cemented paste backfill. Minerals 2018, 8, 322. [Google Scholar] [CrossRef]
- Thomas, P.S.; Hirschausen, D.; White, R.E.; Guerbois, J.P.; Ray, A.S. Characterisation ofthe oxidation products of pyrite by thermogravimetric and evolved gas analysis. J. Therm. Anal. Calorim. 2003, 72, 769–776. [Google Scholar] [CrossRef]
- Yilmaz, E.; Benzaazoua, M.; Belem, T.; Bussière, B. Effect of curing under pressureon compressive strength development of cemented paste backfill. Miner. Eng. 2009, 22, 772–785. [Google Scholar] [CrossRef]
- Yilmaz, E.; Belem, T.; Bussière, B.; Benzaazoua, M. Relationships between microstructural properties and compressive strength of consolidated and unconsolidated cemented paste backfills. Cem. Concr. Compos. 2011, 33, 702–715. [Google Scholar] [CrossRef]
- Jiang, H.; Fall, M. Yield stress and strength of saline cemented tailings in sub-zero environments: Portland cement paste backfill. Int. J. Miner. Process. 2017, 160, 68–75. [Google Scholar] [CrossRef]
- Klein, K.; Simon, D. Effect of specimen composition on the strength development in cemented paste backfill. Can. Geotech. J. 2006, 43, 310–324. [Google Scholar] [CrossRef]
- Fall, M.; Belem, T.; Samb, S.; Benzaazoua, M. Experimental characterization of the stress–strain behaviour of cemented paste backfill in compression. J. Mater. Sci. 2007, 42, 3914–3922. [Google Scholar] [CrossRef]
- Zhang, J.; Deng, H.; Taheri, A.; Deng, J.; Ke, B. Effects of superplasticizer on the hydration, consistency, and strength development of cemented paste backfill. Minerals 2018, 8, 381. [Google Scholar] [CrossRef]
- Zheng, J.; Zhu, Y.; Zhao, Z. Utilization of limestone powder and water-reducing admixture in cemented paste backfill of coarse copper mine tailings. Constr. Build. Mater. 2016, 124, 31–36. [Google Scholar] [CrossRef]
- Xu, W.; Cao, P.; Tian, M. Strength development and microstructure evolution of cemented tailings backfill containing different binder types and contents. Minerals 2018, 8, 167. [Google Scholar] [CrossRef]
- Li, W.; Fall, M. Sulphate effect on the early age strength and self-desiccation of cemented paste backfill. Constr. Build. Mater. 2016, 106, 296–304. [Google Scholar] [CrossRef]
- Hane, I.; Belem, T.; Benzaazoua, M.; Maqsoud, A. Laboratory Characterization of Cemented Tailings Paste Containing Crushed Waste Rocks for Improved Compressive Strength Development. Geotech. Geol. Eng. 2017, 35, 645–662. [Google Scholar] [CrossRef]
- Taheri, A.; Tatsuoka, F. Stress–strain relations of cement–mixed gravelly soil from multiple–step triaxial compression test results. Soils Found. 2012, 52, 748–766. [Google Scholar] [CrossRef]
- Wu, J.Y.; Feng, M.M.; Yu, B.Y.; Chen, Z.Q.; Mao, X.B.; Han, G.S. Experimental study of strength and deformation characteristics of cemented waste rock backfills with continuous gradation. Rock Soil Mech. 2017, 38, 101–107. [Google Scholar]
- He, G.C.; Liu, Y.; Ding, D.X.; Zhang, Z.J. Strength characteristic of cemented waste rock backfills and its application. J. Min. Saf. Eng. 2013, 30, 75–79. [Google Scholar]
- He, G.C.; Liu, S.L.; Huang, B.X.; Zhang, Z.J.; Ding, D.X. Reasonable matching for cemented waste rock backfill and sand shale. J. Min. Saf. Eng. 2017, 34, 371–377. [Google Scholar]
- Liu, C.; Han, B.; Sun, W.; Wu, J.X.; Yao, S.; Hu, H.Y. Experimental study of strength of back fillings of cemented rock debris and its application under low temperature condition. Chin. J. Rock Mech. Eng. 2015, 34, 139–147. [Google Scholar]
- Du, X.J.; Feng, G.R.; Guo, Y.X.; Qi, T.Y.; Zhang, Y.J.; Guo, J. Failure analyses of unconfined CCWBM body in uniaxial compression based on central pressure variation. Waste Manag. Res. 2018, 36, 159–168. [Google Scholar] [CrossRef] [PubMed]
- Anay, R.; Soltangharaei, V.; Assi, L.; DeVol, T.; Ziehl, P. Identification of damage mechanisms in cement paste based on acoustic emission. Constr. Build. Mater. 2018, 164, 286–296. [Google Scholar] [CrossRef]
- Assi, L.; Anay, R.; Leaphart, D.; Soltangharaei, V.; Ziehl, P. Understanding Early Geopolymerization Process of Fly Ash–Based Geopolymer Paste Using Pattern Recognition. J. Mater. Civ. Eng. 2018, 30, 04018092. [Google Scholar] [CrossRef]
- Hirono, T.; Takahashi, M.; Nakashima, S. In situ visualization of fluid flow image within deformed rock by X-ray CT. Eng. Geol. 2003, 70, 37–46. [Google Scholar] [CrossRef]
- Cnudde, V.; Boone, M.N. High-resolution X-ray computed tomography in geosciences: A review of the current technology and applications. Earth Sci. Rev. 2013, 123, 1–17. [Google Scholar] [CrossRef] [Green Version]
- Wang, Y.; Li, C.H.; Hao, J.; Zhou, R.Q. X-ray micro-tomography for investigation of meso-structural changes and crack evolution in Longmaxi formation shale during compressive deformation. J. Pet. Sci. Eng. 2018, 164, 278–288. [Google Scholar] [CrossRef]
- Wang, Y.; Li, X.; Wu, Y.F.; Lin, C.; Zhang, B. Experimental study on meso-damage cracking characteristics of RSA by CT test. Environ. Earth Sci. 2015, 73, 5545–5558. [Google Scholar] [CrossRef]
- GB/T 208-94, Standard Test Method for Cement Density; State Bureau of Technical Supervision: Beijing, China, 1994.
- GB/T 175-2007, Common Portland Cement; SAI Global: Sydney, Australia, 2007.
- GB/T 50123-1999: Standard for Soil Test Method; MWRPRC (Ministry of Water Resources of the People’s Republic of China): Beijing, China, 1999.
- Singh, U.K.; Digby, P.J. A continuum damage model for simulation of the progressive failure of brittle rocks. Int. J. Solids Struct. 1989, 25, 647–663. [Google Scholar] [CrossRef]
- Lemaitre, J.; Chaboche, J.L. Mechanics of Solid Materials; Cambridge University Press: Cambridge, UK, 1990. [Google Scholar]
- Zhou, X.P.; Zhang, Y.X.; Ha, Q.L. Real-time computerized tomography (CT) experiments on limestone damage evolution during unloading. Theor. Appl. Fract. Mech. 2008, 50, 49–56. [Google Scholar] [CrossRef]
- Wang, Y.; Hou, Z.Q.; Hu, Y.Z. In situ X-ray micro-CT for investigation of damage evolution in black shale under uniaxial compression. Environ. Earth Sci. 2018, 77, 717. [Google Scholar] [CrossRef]


| Index | Full Tailing (%) | Binder (%) |
| Physical properties | ||
| Specific gravity (g/cm3) | 2.94 | 2.89 |
| Natural density(g/cm3) | 1.351 | N/A |
| Bulk density(g/cm3) | 1.732 | N/A |
| Natural water content (%) | 5.42 | N/A |
| Porosity (%) | 41.09 | N/A |
| Natural repose angle (°) | 41.5 | N/A |
| Coefficient of uniformity, Cu | 15.27 | N/A |
| Coefficient of curvature, Cc | 2.01 | N/A |
| Chemical composition | ||
| TFe | 10.67 | N/A |
| CaO | 0.19 | 44.87 |
| MgO | 0.85 | 6.32 |
| Al2O3 | 0.4 | 11.23 |
| Fe2O3 | 8.8 | 1.241 |
| SiO2 | 76.85 | 27.88 |
| SO3 | 0.045 | 6.71 |
| others | 2.195 | 1.749 |
| Performance Parameter of the CT Device | Parameter | Unit |
|---|---|---|
| Effective scanning height | Φ1000 | mm |
| Effective scanning diameter | Φ 800 | mm |
| Maximum scanned weight | 200 | kg |
| Penetrate thickness for Fe | 50 | mm |
| Spatial resolution | 0.07 × 0.07 × 0.07 | mm3 |
| Perspective of relative sensitivity | 1 | % |
| Density resolution | 0.1 | % |
| Minimum scanning thickness | 0.03 | mm |
| Fastest scanning time | 1 | min |
| Image reconstruction time | 30 | s |
| Resolution capacity for crack | 0.05×15 | mm2 |
| Stomata resolution | Φ 0.3 | mm |
| Resolution for inclusion | 0.1 | mm |
| Localization accuracy of the workbench | ±0.02 | mm |
| Accuracy of the turntable | ±5° | s−1 |
| Loading Stage | ε1 (%) | σ1(MPa) | Mean CT Value | Damage Factor | Damage Behavior |
|---|---|---|---|---|---|
| 1 | 0 | 0 | 714.52 | 0 | No |
| 2 | 0.576 | 0.943 | 716.77 | 0.087 | Compression |
| 3 | 0.922 | 2.478 | 716.78 | 0.184 | Damage |
| 4 | 1.153 | 2.932 | 709.78 | 0.517 | Cracking |
| 5 | 1.729 | 1.619 | 703.78 | 0.861 | Propagation |
| Loading Stage | Axial Strain (%) | Axial Stress (%) | Top Slice ∆s(mm2) | Middle Slice ∆s(mm2) | Bottom Slice ∆s(mm2) |
|---|---|---|---|---|---|
| 1 | 0 | 0 | N/A | N/A | N/A |
| 2 | 0.576 | 0.943 | 1.323 | 1.744 | 0.199 |
| 3 | 0.922 | 2.478 | 3.064 | 2.265 | 1.712 |
| 4 | 1.153 | 2.932 | 68.815 | 55.571 | 22.529 |
| 5 | 1.729 | 1.619 | 153.583 | 152.909 | 158.125 |
© 2018 by the authors. Licensee MDPI, Basel, Switzerland. This article is an open access article distributed under the terms and conditions of the Creative Commons Attribution (CC BY) license (http://creativecommons.org/licenses/by/4.0/).
Share and Cite
Wang, Y.; Li, C.; Hou, Z.; Yi, X.; Wei, X. In Vivo X-ray Computed Tomography Investigations of Crack Damage Evolution of Cemented Waste Rock Backfills (CWRB) under Uniaxial Deformation. Minerals 2018, 8, 539. https://doi.org/10.3390/min8110539
Wang Y, Li C, Hou Z, Yi X, Wei X. In Vivo X-ray Computed Tomography Investigations of Crack Damage Evolution of Cemented Waste Rock Backfills (CWRB) under Uniaxial Deformation. Minerals. 2018; 8(11):539. https://doi.org/10.3390/min8110539
Chicago/Turabian StyleWang, Yu, Changhong Li, Zhiqiang Hou, Xuefeng Yi, and Xiaoming Wei. 2018. "In Vivo X-ray Computed Tomography Investigations of Crack Damage Evolution of Cemented Waste Rock Backfills (CWRB) under Uniaxial Deformation" Minerals 8, no. 11: 539. https://doi.org/10.3390/min8110539