Environmental Implications of Resource Security Strategies for Critical Minerals: A Case Study of Copper in Japan


Graduate School of Energy Science, Kyoto University, Kyoto 606-8501, Japan
*
Author to whom correspondence should be addressed.
Minerals 2018, 8(12), 558; https://doi.org/10.3390/min8120558
Submission received: 9 October 2018
/
Revised: 22 November 2018
/
Accepted: 26 November 2018
/
Published: 1 December 2018
(This article belongs to the Special Issue Critical Minerals: Methodologies and Case Studies)
Abstract
:In the assessment of critical minerals, environmental impacts have been a focus of a number of methodologies. In the case of resource security for critical minerals, there are a variety of potential strategies that might be used to reduce criticality from the supply risk perspective, but the environmental consequences of these strategies need to be evaluated. Japan is a country with a heavy dependence on imported materials, and thus has examined various alternative resource supply strategies to improve resource security. This study examines these alternative strategies and evaluates the consequential environmental implications, focusing on the domestic impacts in Japan. Utilization of deep ocean mining and end-of-life home appliance recycling are examined as alternatives against the conventional, import-oriented process. From the obtained results, deep ocean mining, providing 30% of domestic copper demand with the remainder supplied from recycling, is the current optimal solution with regards to the environmental impact.
1. Introduction
While it has been an ongoing concern from the early days of human history, in recent years there have been growing concerns that resource supply in the future will be vulnerable to supply restrictions, particularly for materials deemed as critical for economies or societies. Supply restrictions can occur for various reasons such as strikes [1], price spikes, long-term ore grade decline or political issues. Therefore, many countries have considered strategies for improving resource security in the face of perceived growth in uncertainty over supply, including approaches to alternative resource supply.
Japan is a country that has widely been considered as particularly vulnerable to resource restriction, due to its heavy reliance on imported raw materials for fabricating metals to support its manufacturing export industries, with most of its historic mines having closed. For example, 100% of iron ore, copper, lead and zinc concentrates are imported [2]. These materials are processed into metals, from which a variety of products, such as automobiles, electrical and electronic equipment are produced. A certain proportion of these products are exported outside Japan, which leads to these metals not being 100% recoverable in the domestic material cycle by recycling. Japan has traditionally developed a range of strategies to improve resource security—including upstream development in resource-producing countries, recycling, stockpiling and research and development of alternative (substitute) materials [3]. However, these approaches still rely on a variety of uncontrollable factors, which leads to the conclusion that domestic mineral production would be attractive if the possibility arose.
Recent discussions regarding resource security, besides those focusing on commodity price, can be divided into four broad categories: supply stability, environmental impact, stockpiling and nationalism [4,5]. Supply stability includes consideration of self-sufficiency, import intensity or substitutability of materials and supplies, including recycling [6]. These discussions focus in part on the promotion of independence from external circumstances, with differentiation between short-term risk and long-term risk. One commonly cited example is China’s rare earth element (REE) export restrictions that occurred around 2010 [7]. At that time Japan was highly dependent on REE from China, and this restriction of supply from the dominant player in the market drove Japanese industries to reduce REE demand through a variety of measures. For example, Honda Motor Co. Ltd. started battery recycling to recover restricted metals, while Hitachi commercialized a rare metal-free motor [8,9]. This supply risk hit important minor metal components; however, if a similar restriction was to occur for base metals, the effects could be expected to be much broader and to last much longer. Environmental impact refers to factors related to reserves, ore grades, energy consumption or wastes. These are factors potentially affecting the long-term sustainable development of resource exporting countries, which have been posited as potentially reducing cumulative production through direct restrictions on environmental damage or loss of social license [10]. In recent years, climate change has also been seen as having a potential effect on resource supply [11], with unpredictability due to climate change possibly threatening resource security. Stockpiling indicates a temporary alternative to help buffer the impact of supply restriction, but is only valid for addressing short-term risks. Nationalism, in this article, refers to resource nationalism, which is the restriction of exports in order to ensure domestic supply, or increasing export tariffs or applying other measures in order to obtain higher domestic benefit from resources. Resource nationalism has been seen to occur in or among resource-rich countries, particularly developing countries. Resource nationalism factors indicate both risk and driving forces, affecting both short-term and long-term supply [12]. One recent example is the raw material export ban in Indonesia. Under this regulation, the export of unprocessed ores such as nickel or copper ores was prohibited, in order to improve their economy in 2014. Subsequently, nickel ore was not exported until 2017, while copper ore was exported under transition measures. This policy changed in 2017 and these materials could again be exported from 2017 [13].
Examining resource security indicators from another perspective, they can be divided into factors that are focused on either the importer or the exporter. Importers are able to deal with the aspects of stable supply and stockpiling, but environmental impacts in producing countries and resource nationalism are largely out of the control of importers. These various factors need to be considered when mineral supply and risk reduction strategies are proposed.
1.1. Raw Material Demand Perspective
It has widely been forecast that mineral demand will continue to increase across most categories of minerals, with the exception of certain minerals that are deleterious to the environment or health such as mercury or asbestos [14,15,16]. Demand increases in the future will be likely to exacerbate resource competition because reserve decline may, in some cases, mean that producers are not able to supply sufficient material to meet the total demand. Ore grade decline, has widely been discussed as a potential future issue as well, with implications for increases in energy and environmental costs [17,18]. Environmentally inefficient mining may be an operational limitation due to tougher regulations. From this point of view, ore grade may become a limiting factor in future. Demand increases will likely be caused by new technologies, especially renewable energy, electric vehicles or telecommunications, not only in the transition for developed countries but also in the rapid catch-up demand from developing nations. Renewable and clean energy technologies require a wide variety of metals, both rare and common [6,19], and it is important to consider the additional supply that low carbon technology might add to the conventional demand growth.
One example is global copper demand, which has been estimated elsewhere to increase by between 200% and 350% in 2050 compared to 2010 [19], or growth to 31,200 to 54,600 kt per annum based on the USGS [20]. Another estimate indicates growth to 34,000 ktpa in 2050 [21], which shows agreement with an increase of copper consumption of nearly double in the next few decades. The International Copper Association estimates that in 10 years, copper demand for electric vehicles will increase 9 times compared to the demand of 2017 [22], which is likely to exacerbate copper demand beyond historical trends.
1.2. Raw Material Supply Perspective
The global situation of the mineral industry indicates that average ore grades are declining, mined ores are tending to be more refractory, ore bodies are being mined at greater depths, whilst associated waste problems and processing prices are increasing [22,23,24,25,26,27]. There are a variety of social, geological and technical factors involved in these trends, but long-term ore grade has declined significantly [23,24]. Large-scale mines have in some cases been closed recently because of lower ore grade and the inability to economically mine and process it [25]. Low-grade ore extraction typically requires higher energy and/or reagent consumption, and results in larger quantities of wastes. This is in part attributable to the additional amount of material that must be treated in these stages. When processing lower grade, particularly refractory ore, removing waste requires significant energy consumption [27]. On the other hand, lower ore grades will not significantly increase the energy consumption of the downstream metal extraction and refining stages of many metals [26]. Mining lower grade ore requires greater energy since more tonnes of ore must be mined per tonne of metal. On the other hand, once the ore has been processed to concentrate, the difference between ore grade is no longer relevant. These factors together indicate that it is most likely to be largely the resource extracting countries are affected environmentally because of low-grade ore, whereas countries further down the supply chain are less affected (this may not be the case with some impurities contained in the concentrate). It is perceivable that ore exporting countries might consider regulating low-grade ore extraction due to the associated increased environmental impacts. Additionally, it has been estimated that many copper producing countries will not be able to sustain their production until 2050 [19].
Recently, unconventional deposits of minerals have grown in commercial interest as alternative mineral supply options. On land, waste from mining and processing is considered for potential reprocessing with new technology to extract metal [28,29]. Offshore, such unconventional ores include those found on the deep seabed, which have been an exploration target for decades but only recently come close to extraction, led by Nautilus Minerals in Papua New Guinea [30]. On a global scale, deep ocean resources including manganese nodules, and cobalt-rich ferromanganese crusts are estimated to be vast, but despite the smaller resource amount, seafloor massive sulfides (SMS) are likely to become the first mineral resources to be mined because of the shallower depth and presence of key target metals giving them commercial or domestic interest [31,32]. In Japan, the Okinawa Trough and Izu Ogasawara areas have deposits of seafloor massive sulfides [33,34] containing copper, lead, zinc, silver, gold and rarer elements, including REE in some cases [35]. It is expected that resources of such ores will be at least 7.4 million tonnes around the Okinawa area alone [34]. Deep-sea rare earth mud has also been a focus of attention—particularly in the period of Chinese export restrictions—with deposits around Minamitori Island, located in the Ogasawara area, which contains heavy rare-earth elements [36]. Developing these resources has become a key focus of the Japanese government because of their potential to help reduce metal supply risk, as well as the possible technology developments that could be capitalized-on by Japanese industries [37].
1.3. Japan’s Supply and Demand of Secondary Material
In a seeming paradox from the overall perspective of Japan’s raw material demand and supply situation, Japan exports a significant amount of mineral scrap [2,38,39]. For example, the major importer of Japan’s copper scrap up until 2017 was China, which shared around 95% of scrap exports over the 5 years to 2017 [38]. The volume of Japan’s exported scrap accounted for the equivalent of about 30% of its domestic demand [2,38]. While the export of a potentially valuable resource from a resource-poor country seems counter-intuitive, the reason for exporting copper scrap was purely economic—the availability of cheap labor costs in China. Scrap exported to China was too complex to recover copper with automated technology in Japan—power cables, motors, or other complex end-of-life products. This scrap was processed by hand in China. However, recently China placed restrictions on the import of waste from other countries, including copper, aluminium, and steel scrap including End-of-Life products (end of 2018) and magnesium (end of 2019) [40,41]. Because of this regulation, Japan has had to find alternative ways to treat its large quantities of metal scrap.
The way scrap is typically recycled in Japan is a process of down-cycling. Down-cycling is defined in this article as “a way of recycling whereby the quality of recycled materials is lower than that of the original scrap”. In the case of Japan’s current recycling process, copper wire which requires an extremely high purity of copper uses only wire scrap, while brass, which can absorb a certain amount of other materials, uses various types of copper scrap [39]. Brass recycling is categorized as down-cycling. Due to the increasing concentration of impurities, down-cycling reduces the quality of material over time [42]. In order to move from down-cycling, impurities should be removed to prevent down grading of recycled material.
It is possible to apply appropriate smelting and refining processes to avoid downgrading recycled material. Japan has 15 nonferrous smelters [43] which separate various materials during processing, including copper, lead, zinc, gold, silver, nickel, platinum and palladium, although they largely input primary concentrates. To prevent downgrading, separating impurities is vital. Without smelting facilities it would be difficult to recover metals from end-of-life products.
Some of the difficulties facing end of life product recycling are the level of dispersion across society and the complexity of products. In the case of household appliances such as microwave ovens, once the product is sold to consumers, manufacturers of that product do not know where it is located. While there are certain regulations and provisions for recycling through extended producer responsibility, it consumes a lot of energy to collect enough end-of-life products to recover the metals inside them economically.
1.4. Resource Security, Energy Security and Criticality
Although both energy and minerals can be categorized as resources, discussion of security in the context of each of these is different. Energy security has been discussed for a long period, particularly since the 1970’s oil crises [44], including reserves, choke points and geographical distribution. On the other hand, mineral resource security has not been discussed as thoroughly as energy security. There are many possible reasons that could be suggested for this, but primarily it may be that the variety of minerals is large, making such discussions complex—whereas for energy security the issues are relatively generalizable across countries for a limited number of commodities. Moreover, there has been little reason for concern over global mineral resource security until recently, leading to the issues being addressed largely on a country-by-country basis. The situation must be differentiated by mineral. For base metals, for example, supply distribution is geographically quite broad, and supplying countries are relatively politically stable compared to the centralized nature of certain energy resources, such as oil, making the potential for supply restriction theoretically lower. However, as non-renewable resources, mineral face the same resource limitations as fossil fuel-based energy. As a remedy to reliance on imports, energy security considers domestic production an important factor—with the key non-fossil fuel technologies of renewables and nuclear being the focus for countries with minimal conventional fuel reserves. Recycling can be considered as the closest mineral analogy to renewable energy. However, whereas renewable energy can be installed quickly and predictably so that there is minimum time lag between supply and demand, raw materials from recycling take time to come back after been consumed. (Copper produced at year t takes years or decades to reenter the supply chain as a secondary material). Likewise, while renewable energy may be focused on domestic supply to meet domestic demand (apart from certain interconnected regions such as Europe), materials are utilized to manufacture products, which may be exported—therefore creating a barrier to the recovery of those materials by recycling. Based on these characteristics, an alternative method for evaluation is required when it comes to discussion of mineral resource security.
In recent years the concept of material “criticality” has been developed, and can be considered the closest parallel between energy security analysis and resource security. The National Research Council refers to the key components of criticality of mineral resources as “importance in use” and “availability” [45]. The European Commission evaluate criticality by considering economic importance, supply risk, economic stability of resource producing countries and substitution/recycling rate, and environmental country risk [46]. In the Japanese context, studies evaluating criticality have discussed the following factors: supply risk, price risk, demand risk, recycling restrictions and potential risk (possibility of usage restrictions) [47]. According to Erdmann and Graedel, supply risk has two key aspects: raw material supply risk and real supply disruptions [48].
In the EU, securing resource supply is approached by improving resource diplomacy, resource efficiency, and research and development into both exploration and substitution [49]. Overall resource policy in EU relies on resource exporting countries for primary resources and intra-EU materials for secondary resources. Critical material strategy in the United States is composed of three key components: expanding global supply chains, developing substitute materials and efficient mineral use including recycling [50]. Japan’s resource policy is quite similar to the EU and United States. Domestic or internal mineral production, which improves resource security such as unconventional resource or redevelopment of closed mines, is one of the potential strategies. Importantly, in the EU and USA approaches to criticality, there is a growing consideration of the environmental implications of alternative mineral supplies. This has not yet been adequately addressed in the Japanese context.
1.5. Deep Ocean Resources in Japan
Deep ocean resources around Japan’s exclusive economic zone, such as seafloor massive sulfides, manganese nodules and rare earth rich deep sea muds, have been widely studied [36]. The key reason for this is Japan’s lack of commercial domestic mineral production, which makes importing the only way for Japan to supply its mineral concentrates. This supply system has vulnerabilities to supply restrictions from external parties. Supply restriction may produce significant economic damage to the manufacturing industry if it affects key mineral inputs. Modern-day deep ocean mining technology and deposits are not competitive with land-based mining; however, utilizing these resources may ease the potential for economic impact if supply restrictions were to occur.
Although there is a high degree of uncertainty about the potential environmental impacts of deep ocean mining, and there is inevitable local ecosystem damage, deep ocean mining may be environmentally and economically competitive with land-based conventional mining on certain indicators [51]. While not dismissing these localized environmental impacts, this study seeks to evaluate the quantifiable global environmental impacts of comparative mineral supply strategies. The strength of deep ocean mining is its lower footprint. Land-based mining requires land clearing and, removal of top soil and overburden before extraction of the valuable ore. On the other hand, deep ocean mining does not need to remove top soil for extraction. When deep ocean resources are extracted, waste rock is expected to be minimal [32]. Based on these strengths, deep ocean mining may be one option for Japan to supply raw material.
1.6. Purpose
This article aims to examine alternative resource supply strategies for Japan by assessing the primary domestic environmental implications, which are related to a potential risk factor for guaranteeing supply, but also have not placed sufficient attention on differentiated impacts of alternative production routes in Japan particularly. Alternative resource supply strategies aim to improve resource security. Copper is used as a case study to be discussed in this article, as it is a metal that is vital to many industries in Japan and globally. It has been examined as a potential critical mineral, and although the level of criticality is deemed to be low, it is an essential mineral to Japan’s economy. This assessment is part of on-going resource security framework development process.
2. Materials and Methods
2.1. Methodology
In order to clarify the rates and requirements of metal, and the environmental impacts of alternative metal production, material flow analysis and life cycle assessment are utilized as key methods. Through this methodology, the material flow of five alternative copper supply options have been analyzed. Reduction of material intensity, shifting production patterns or economic sectoral restructure, or use of substitute materials are all potential demand-side strategies to improve resource security; however, this study focuses on the supply-side alternatives, and assume no overall decrease in copper requirement for the economy. Options addressed are: (A) conventional process; (B) deep ocean mining; (C) recycling. A limited-scope life cycle assessment is used to evaluate energy consumption, waste output and CO2 emissions, which are compared on the basis of one tonne of copper.
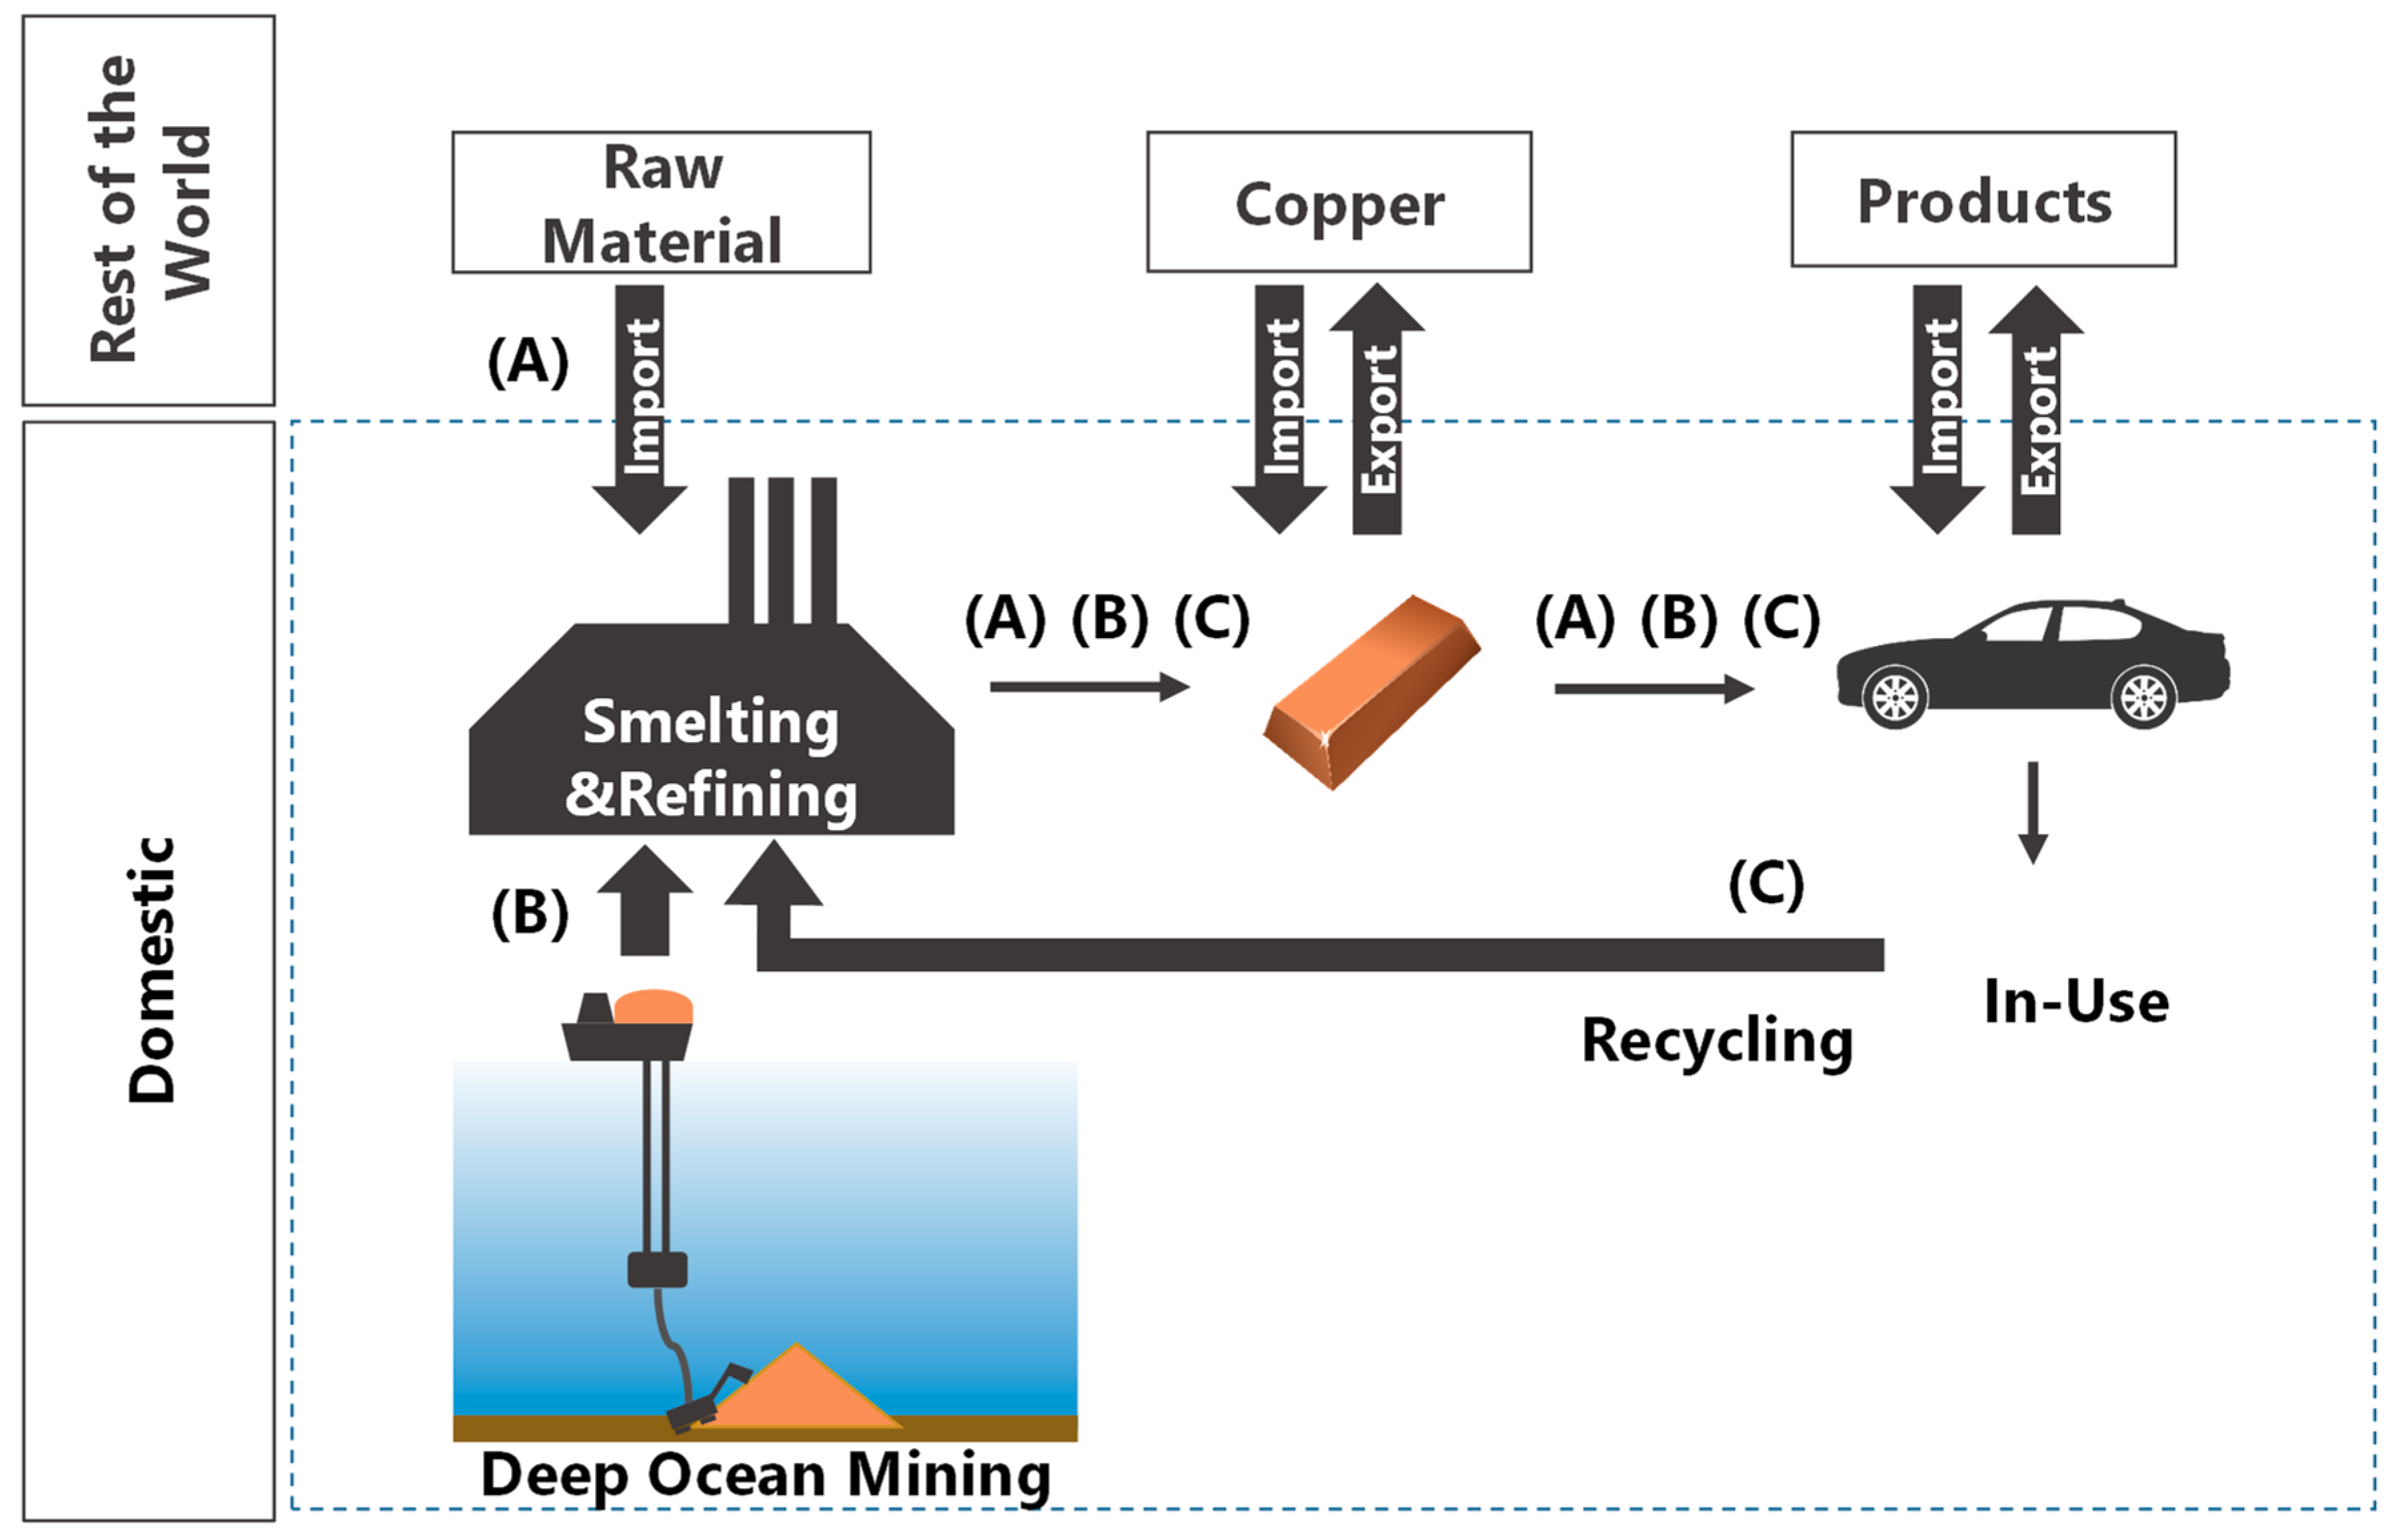
Figure 1 shows the overall system boundaries used in this study. The blue dashed box delineates the domestic processes and flows within Japan. Streams marked (A) occur only or primarily in the conventional copper processing situation; (B) occur in the deep ocean mining situation and (C) is the recycling scenario. Combined copper processing scenarios (discussed in Section 3.2) for identifying the optimum mix of copper from each process consisted effectively of combinations of (A) + (B) + (C). As discussed later in more detail, the potential collectable copper material for recycling is limited as the amount used in domestic demand (domestic production and imports minus exports). Import of concentrate is considered to be used to fill the remainder of demand.
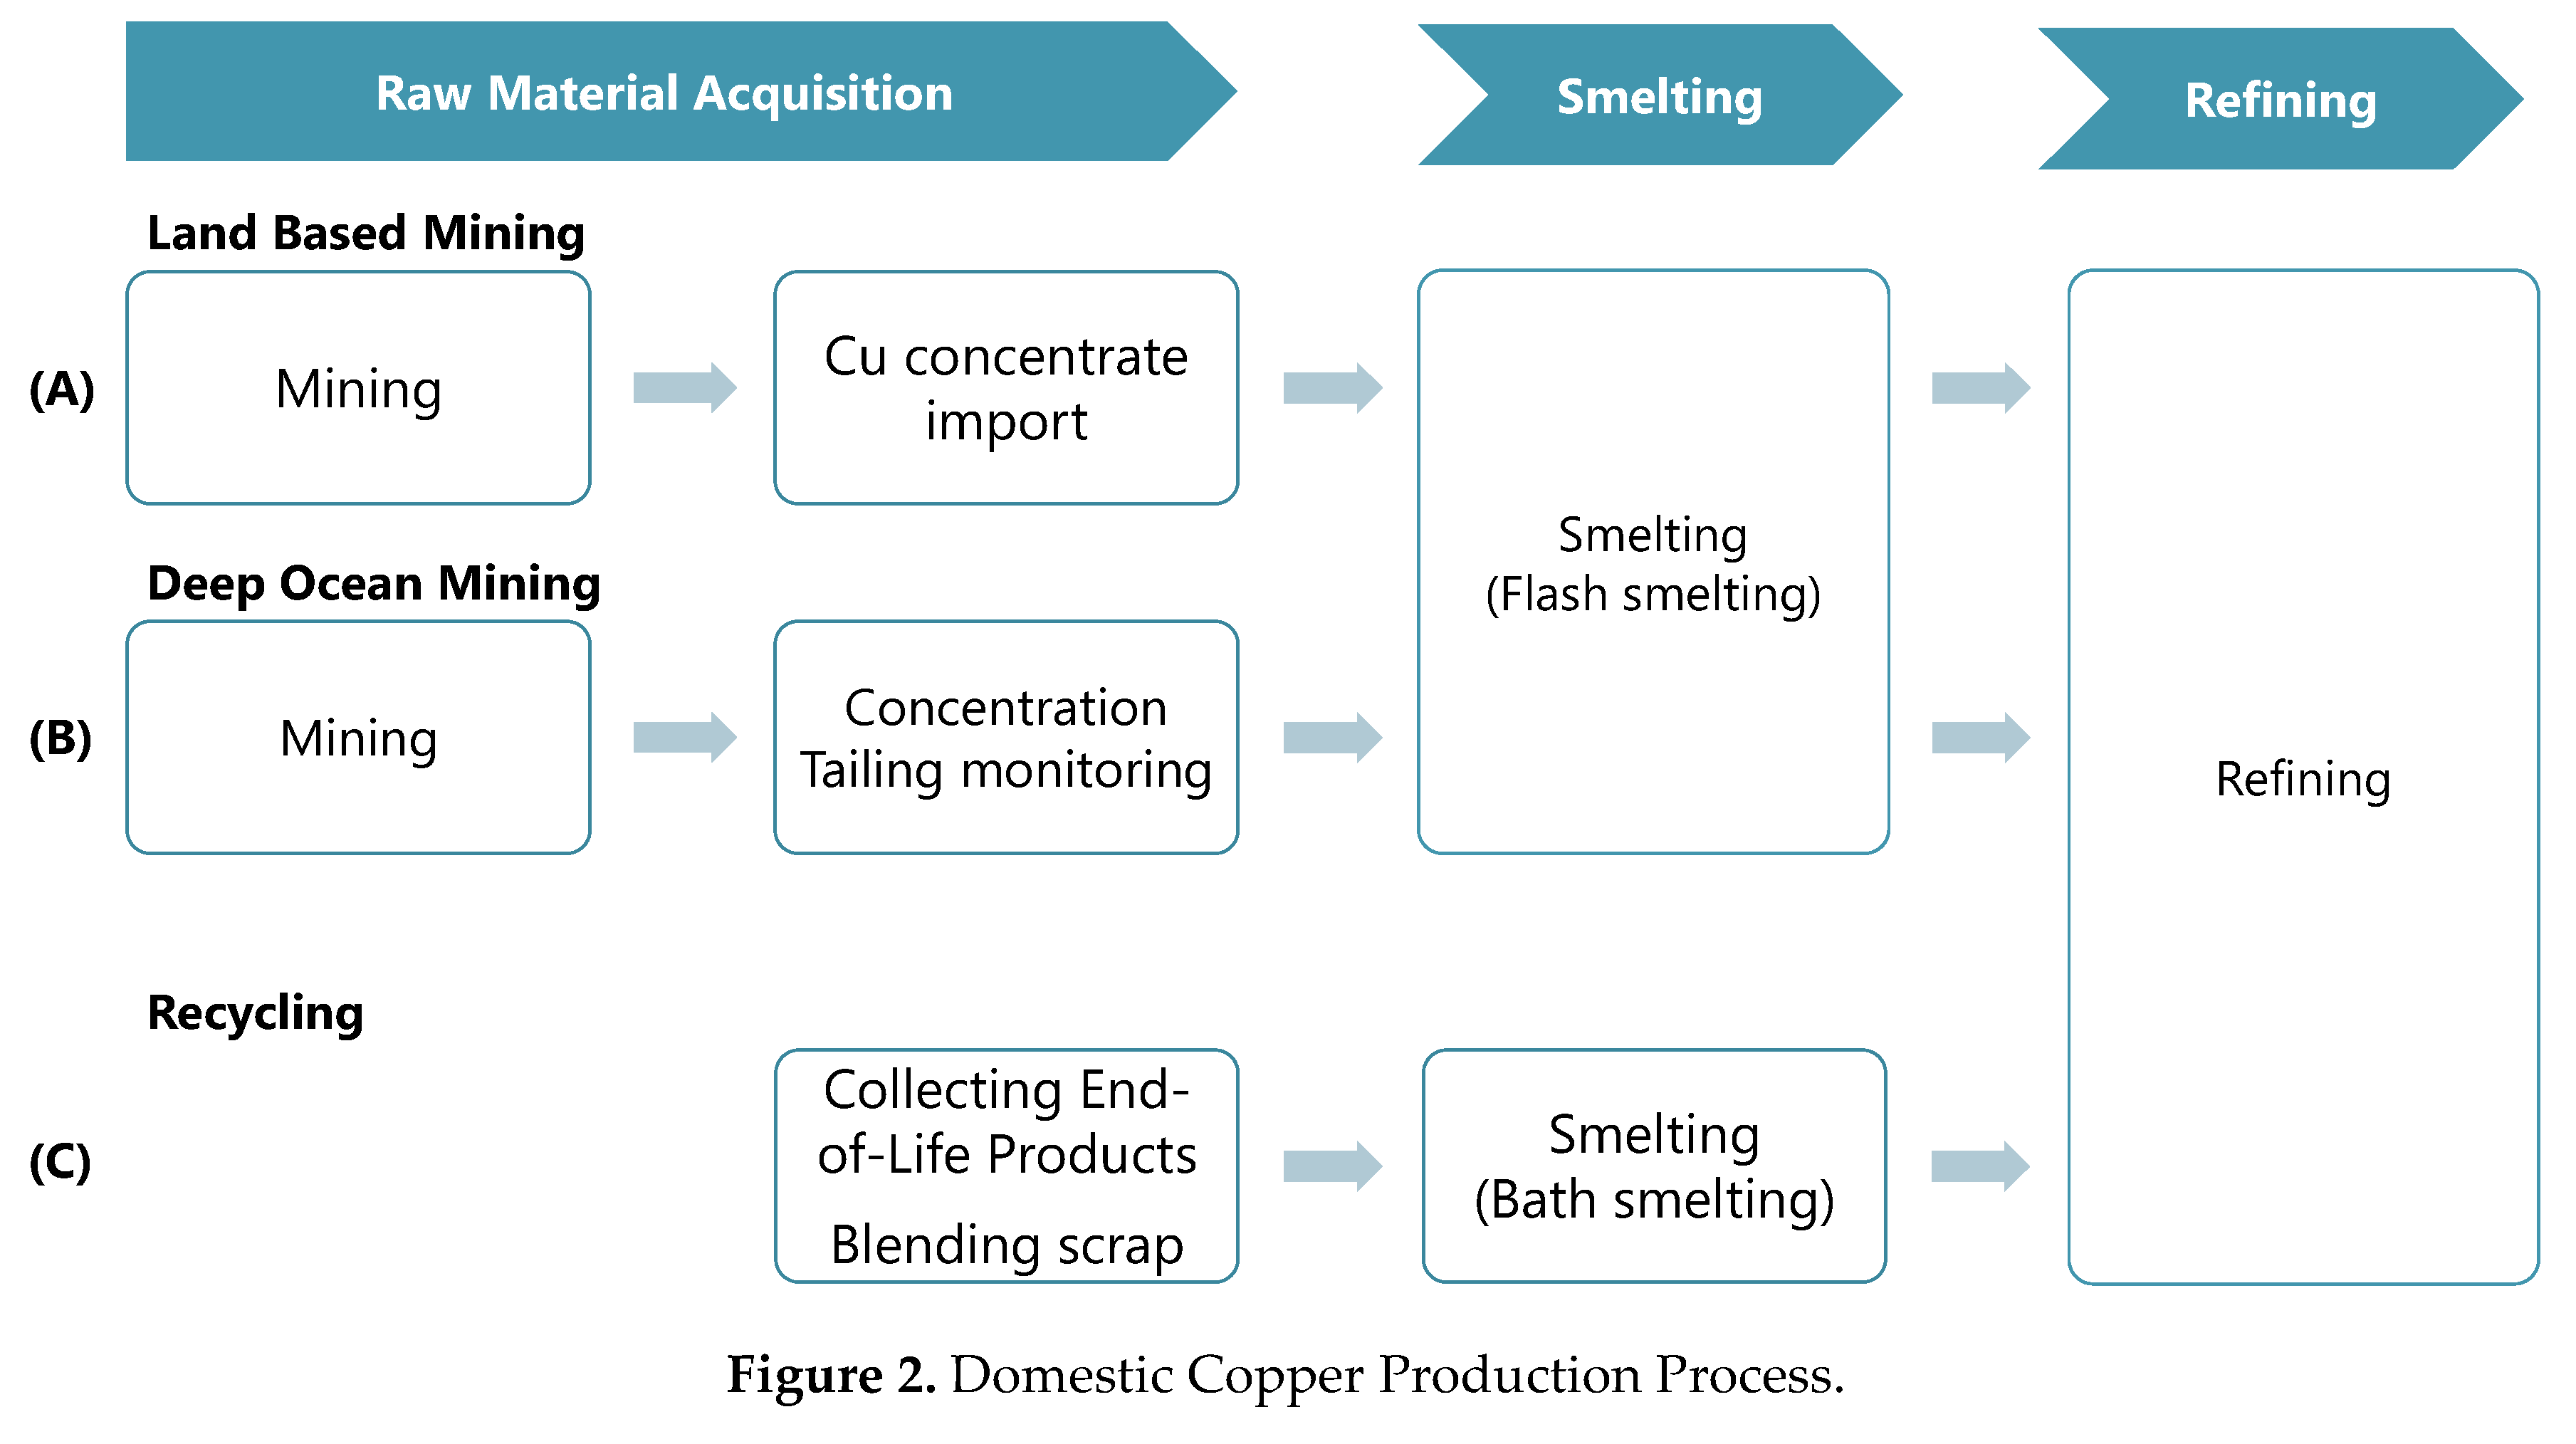
Figure 2 shows the copper processes evaluated in this study. The conventional copper process uses concentrate that is mined from land-based mines in other countries (Japanese mines are no longer operating). Concentrate is typically produced at or close to the mine site by processing the ore. Concentrate is then shipped to Japan (in this case) and electrolytic copper is produced by flash smelting and electro refining. On the contrary, deep ocean mining copper processing uses ore from the ocean around Japan (within its Exclusive Economic Zone, EEZ). Ore from the deep ocean requires concentration facilities and dams to store tailings, both of which are expected to operate domestically. Deep ocean mining and land-based mining are assumed to use the same type of facilities for smelting and refining. The recycling process for copper requires end-of-life products as raw material. End-of-life product is defined as end-of-life households’ electrical and electronic equipment in this article. Since the composition of raw materials for recycling is different from primary ore, an alternative type of smelting facility has typically been used [52]. Conventional smelters cannot typically absorb massive amount of scrap because the feed material should be very dry and fine [52]; therefore, recycling processes use bath smelting rather than flash smelting. The recycling process requires end-of-life product collection and sorting, and in this study estimates have been made for the latter using the energy for crushing and magnetic sorting processes, which were considered to have the largest impact. The impacts of land-based mining (mining and concentration stages) in resource exporting countries are included as well. The following sections provide more detailed descriptions of each of the copper supply alternatives.
(A) Conventional Process (CONV)
The conventional copper production process used for comparison here is from mining to electro-refining using a flash furnace and converting furnace. Although the energy and material consumed in Japan is only considered to be from transportation to refining, the impacts of mining and concentration processes are also evaluated for comparison with deep ocean mining. The distance between resource exporting countries and Japan is the total copper content weighted average of distances from major ports in source countries and is based on Japan’s imports from 2017 [53]. Electricity usage in mining, CO2 emissions intensity in mining and concentration processes are based on a Chilean case in this study, since Chile shares 44% on a mass basis, and 38% on a monetary basis of Japanese copper concentrate imports in 2017 [38]. Summary data for the conventional process route are shown in Table 1.
It should be noted that energy for crushing is generally included in the concentration process, but in deep ocean mining it is categorized as a mining process, as most crushing is done on the seafloor. This leads to some difference when comparing on a stage-by-stage basis but does not affect the overall values.
Waste from the conventional mining and concentration process, which is produced outside Japan, can be estimated by the following equations [17]. On the basis of 1 tonne of unmined ore;
where W is the stripping ratio, RM is the recovery rate for mining, GO is ore grade, RC is recovery rate for concentration, GC is the concentrate grade. These parameters are determined from reference [17].
(B) Deep Ocean Mining (DOM)
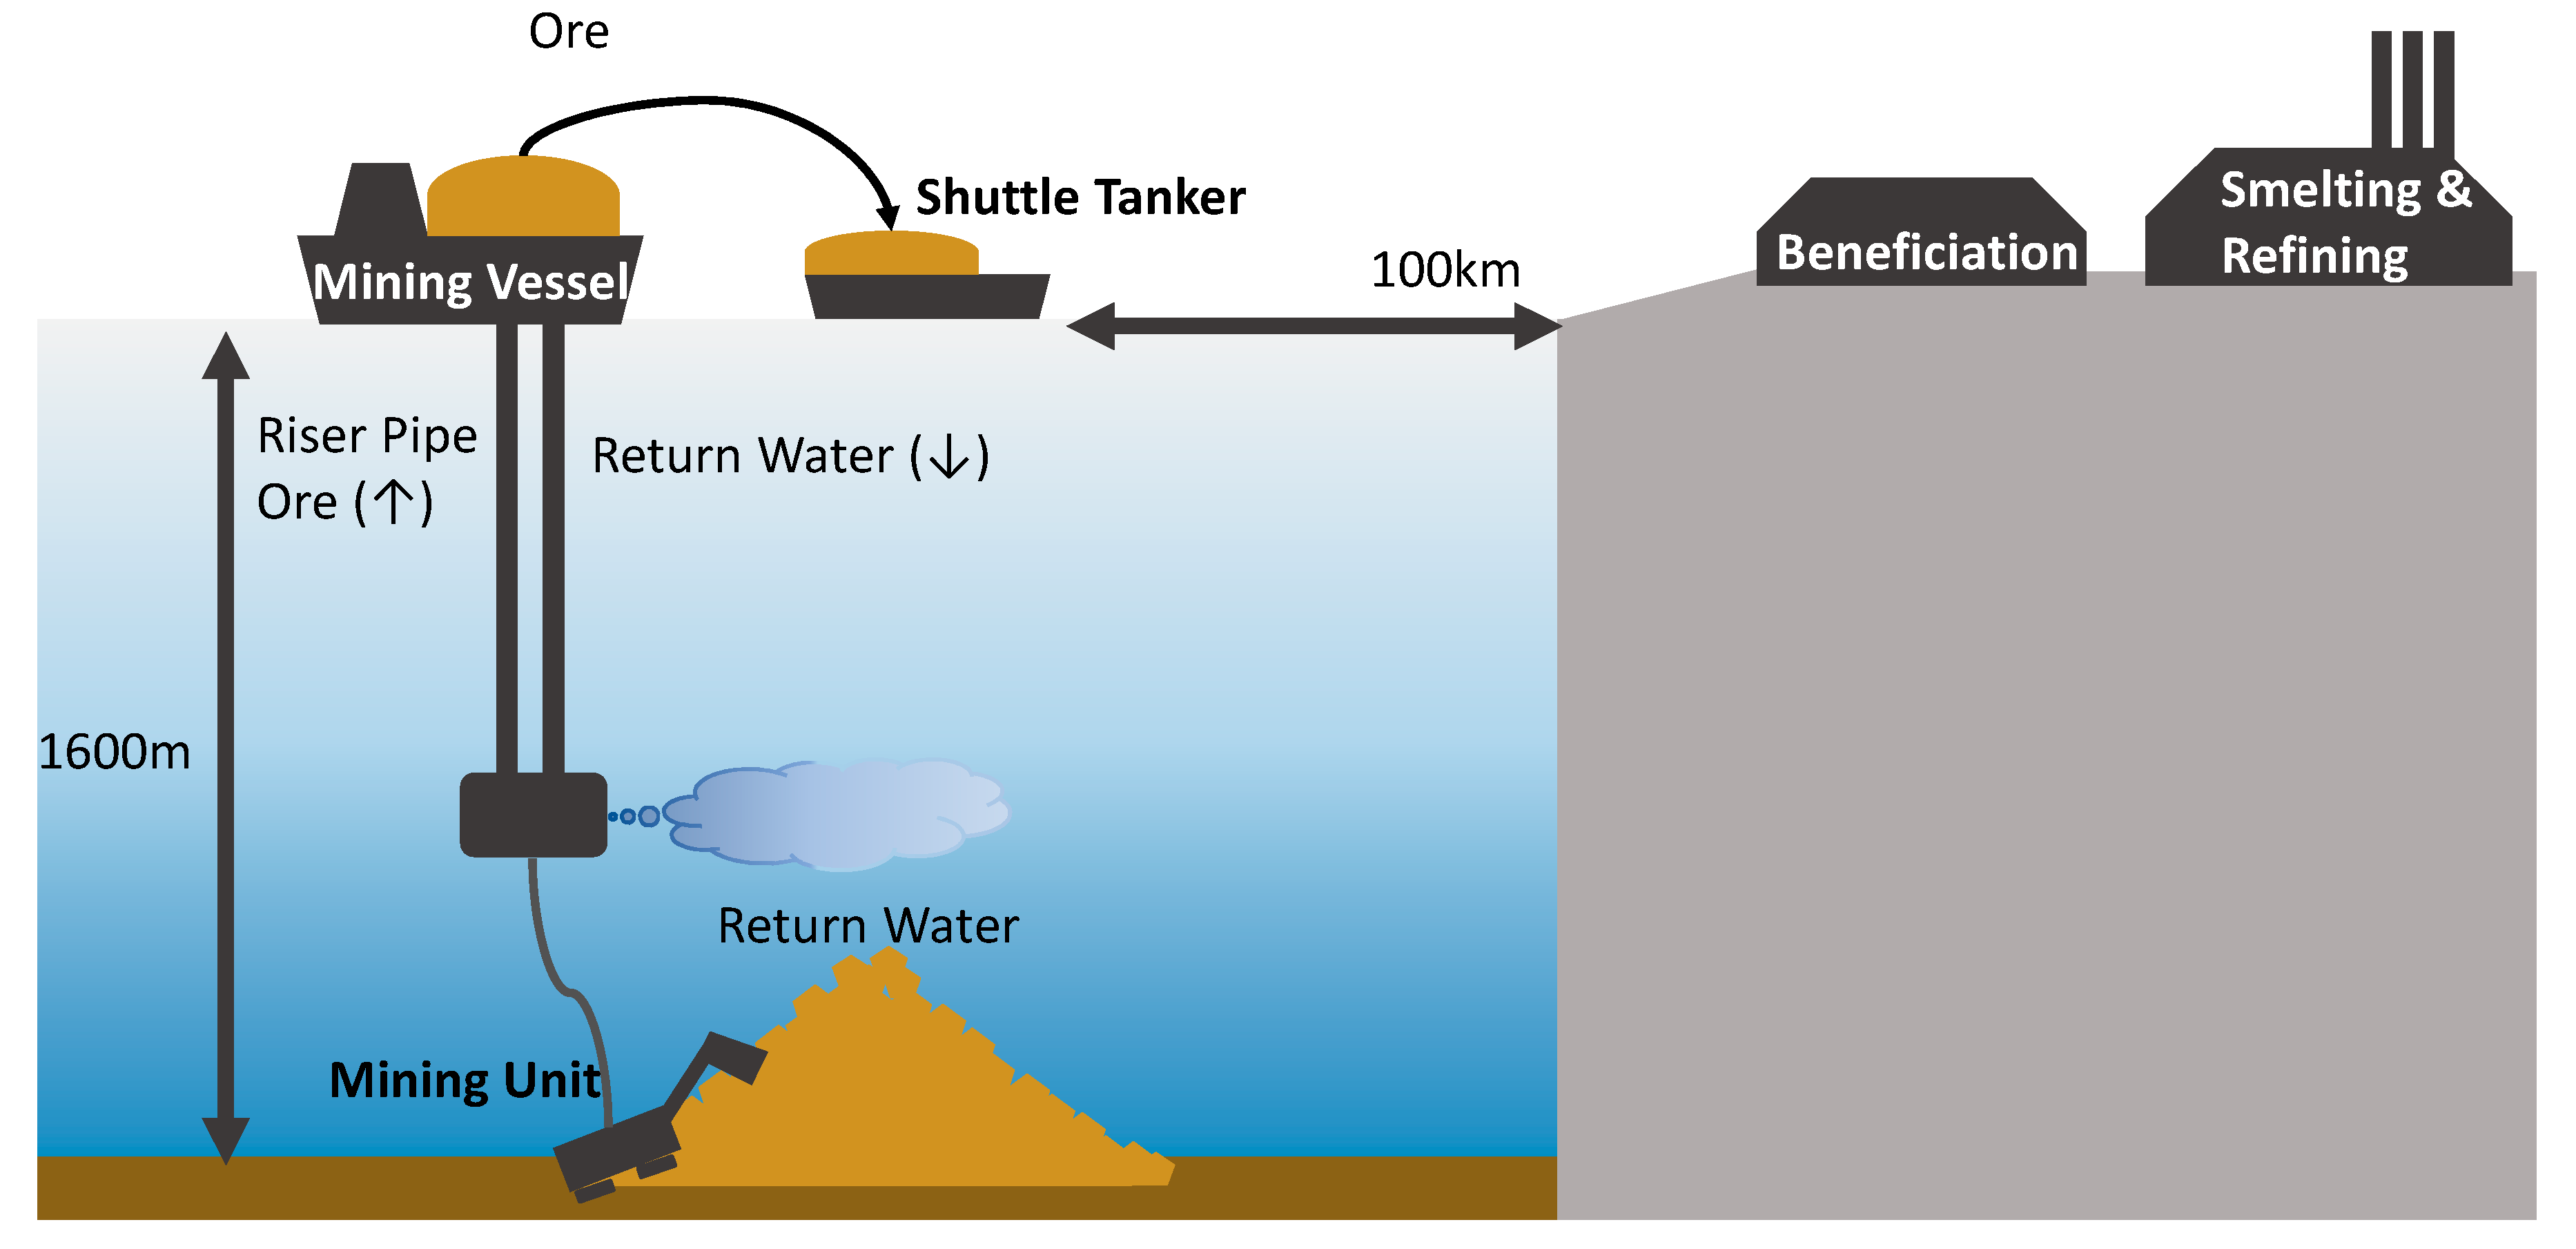
Deep ocean mining will provide virgin material from seafloor massive sulfide (SMS) ore, with initial focus on deposits within Japan’s EEZ. The ore produced by deep ocean mining will then be beneficiated and processed through to metal in Japan. Figure 3 shows the deep ocean mining process considered in this study, which is modelled on the basis of examples from the Agency for Natural Resources and Energy [59]. The SMS deposit lies at a depth of 1600 m of water [59]. Ore is mined by a mining unit, crushed and lifted to the surface through a riser pipe. On the mining vessel, ore is dewatered and transferred to a shuttle tanker. Dewatered ore is shipped to a concentration facility where copper concentrate is produced. Copper concentrate is then shipped to the smelting and refining facility and cathode copper is produced. Transportation between the concentration plant and smelting/refining plant is not considered in this study, as the locations are not certain. Water lifted up to the mining vessel with the ore is returned to the deep ocean as return water. Deep ocean mining may affect marine ecosystems in a variety of ways; mining activity may disturb benthos, and return water may be hazardous to marine animals due to the content of particulates, hazardous metals and dissolved oxygen and temperature differences that may affect deep water life [60,61,62]. However, these impacts are extremely different to quantify, as well as being very location-specific, making comparison with onshore mining difficult. This study therefore focuses on quantifiable global environmental impacts.
As SMS deposits are polymetallic, it is possible that mining can be specifically for copper recovery or for multiple mineral recovery—in fact, in many cases copper is more likely to be a coproduct. This article focuses on copper production, but we consider the allocation of mining and other processing activities that are shared across various potential mineral streams as per standard LCA procedures. In the ‘DOM Cu-Only’ case, all the impacts (energy consumed, etc.) are allocated to copper recovery, with no other metals assumed to be produced. This applies to the energy for mining, and transportation, as from concentration onwards, the energy for each metal is for dedicated processes so there is no need to consider allocation. In the smelting and refining stages, by-products produced from copper concentrate are produced (including other base metals as well as minor elements and slag). These are potentially of commercial interest, but are not considered as main product streams in this study, where the value of recovered metals is used, it is only for the purpose of allocation of shared processing stages. In the ‘DOM Multiple’ case, copper is produced in conjunction with zinc and lead as shown in Table 2. Energy for mining and transportation, and wastes are allocated according to mass balance. Energy for smelting and refining is also allocated considering by-products.
In both cases, energy for concentration is estimated as being composed of two parts: grinding and froth flotation. Energy for grinding can be estimated by using the Bond work index of 13.9 kwh/t-ore. This index is estimated as the average of the work index of grinding ores which contain pyrite, sphalerite and galena previously produced in Japan, and which have been considered to be similar to deep ocean sulfide ores [63]. Feed size and product size are 40 mm and 5 μm, respectively [64]. Froth flotation is assumed to consume 7.5 kwh/t-ore [27].
Ore from the deep ocean will be processed in pyro-metallurgical process plants which already exist in Japan. On the other hand, mining and concentration processes require new facilities since base metal mining ended decades ago in Japan. Reference data were obtained from literature [27,34,55,57,59,65]. Table 2 shows the energy requirement for concentration processes for deep ocean mining in this study. It should be noted that the literature on which this is based uses an initial copper ore grade of 0.5% although the actual surveyed DOM ore grade is closer to 0.4%. It is assumed that the energy requirement is not significantly different between 0.4% and 0.5%.
(C) Recycling (REC)
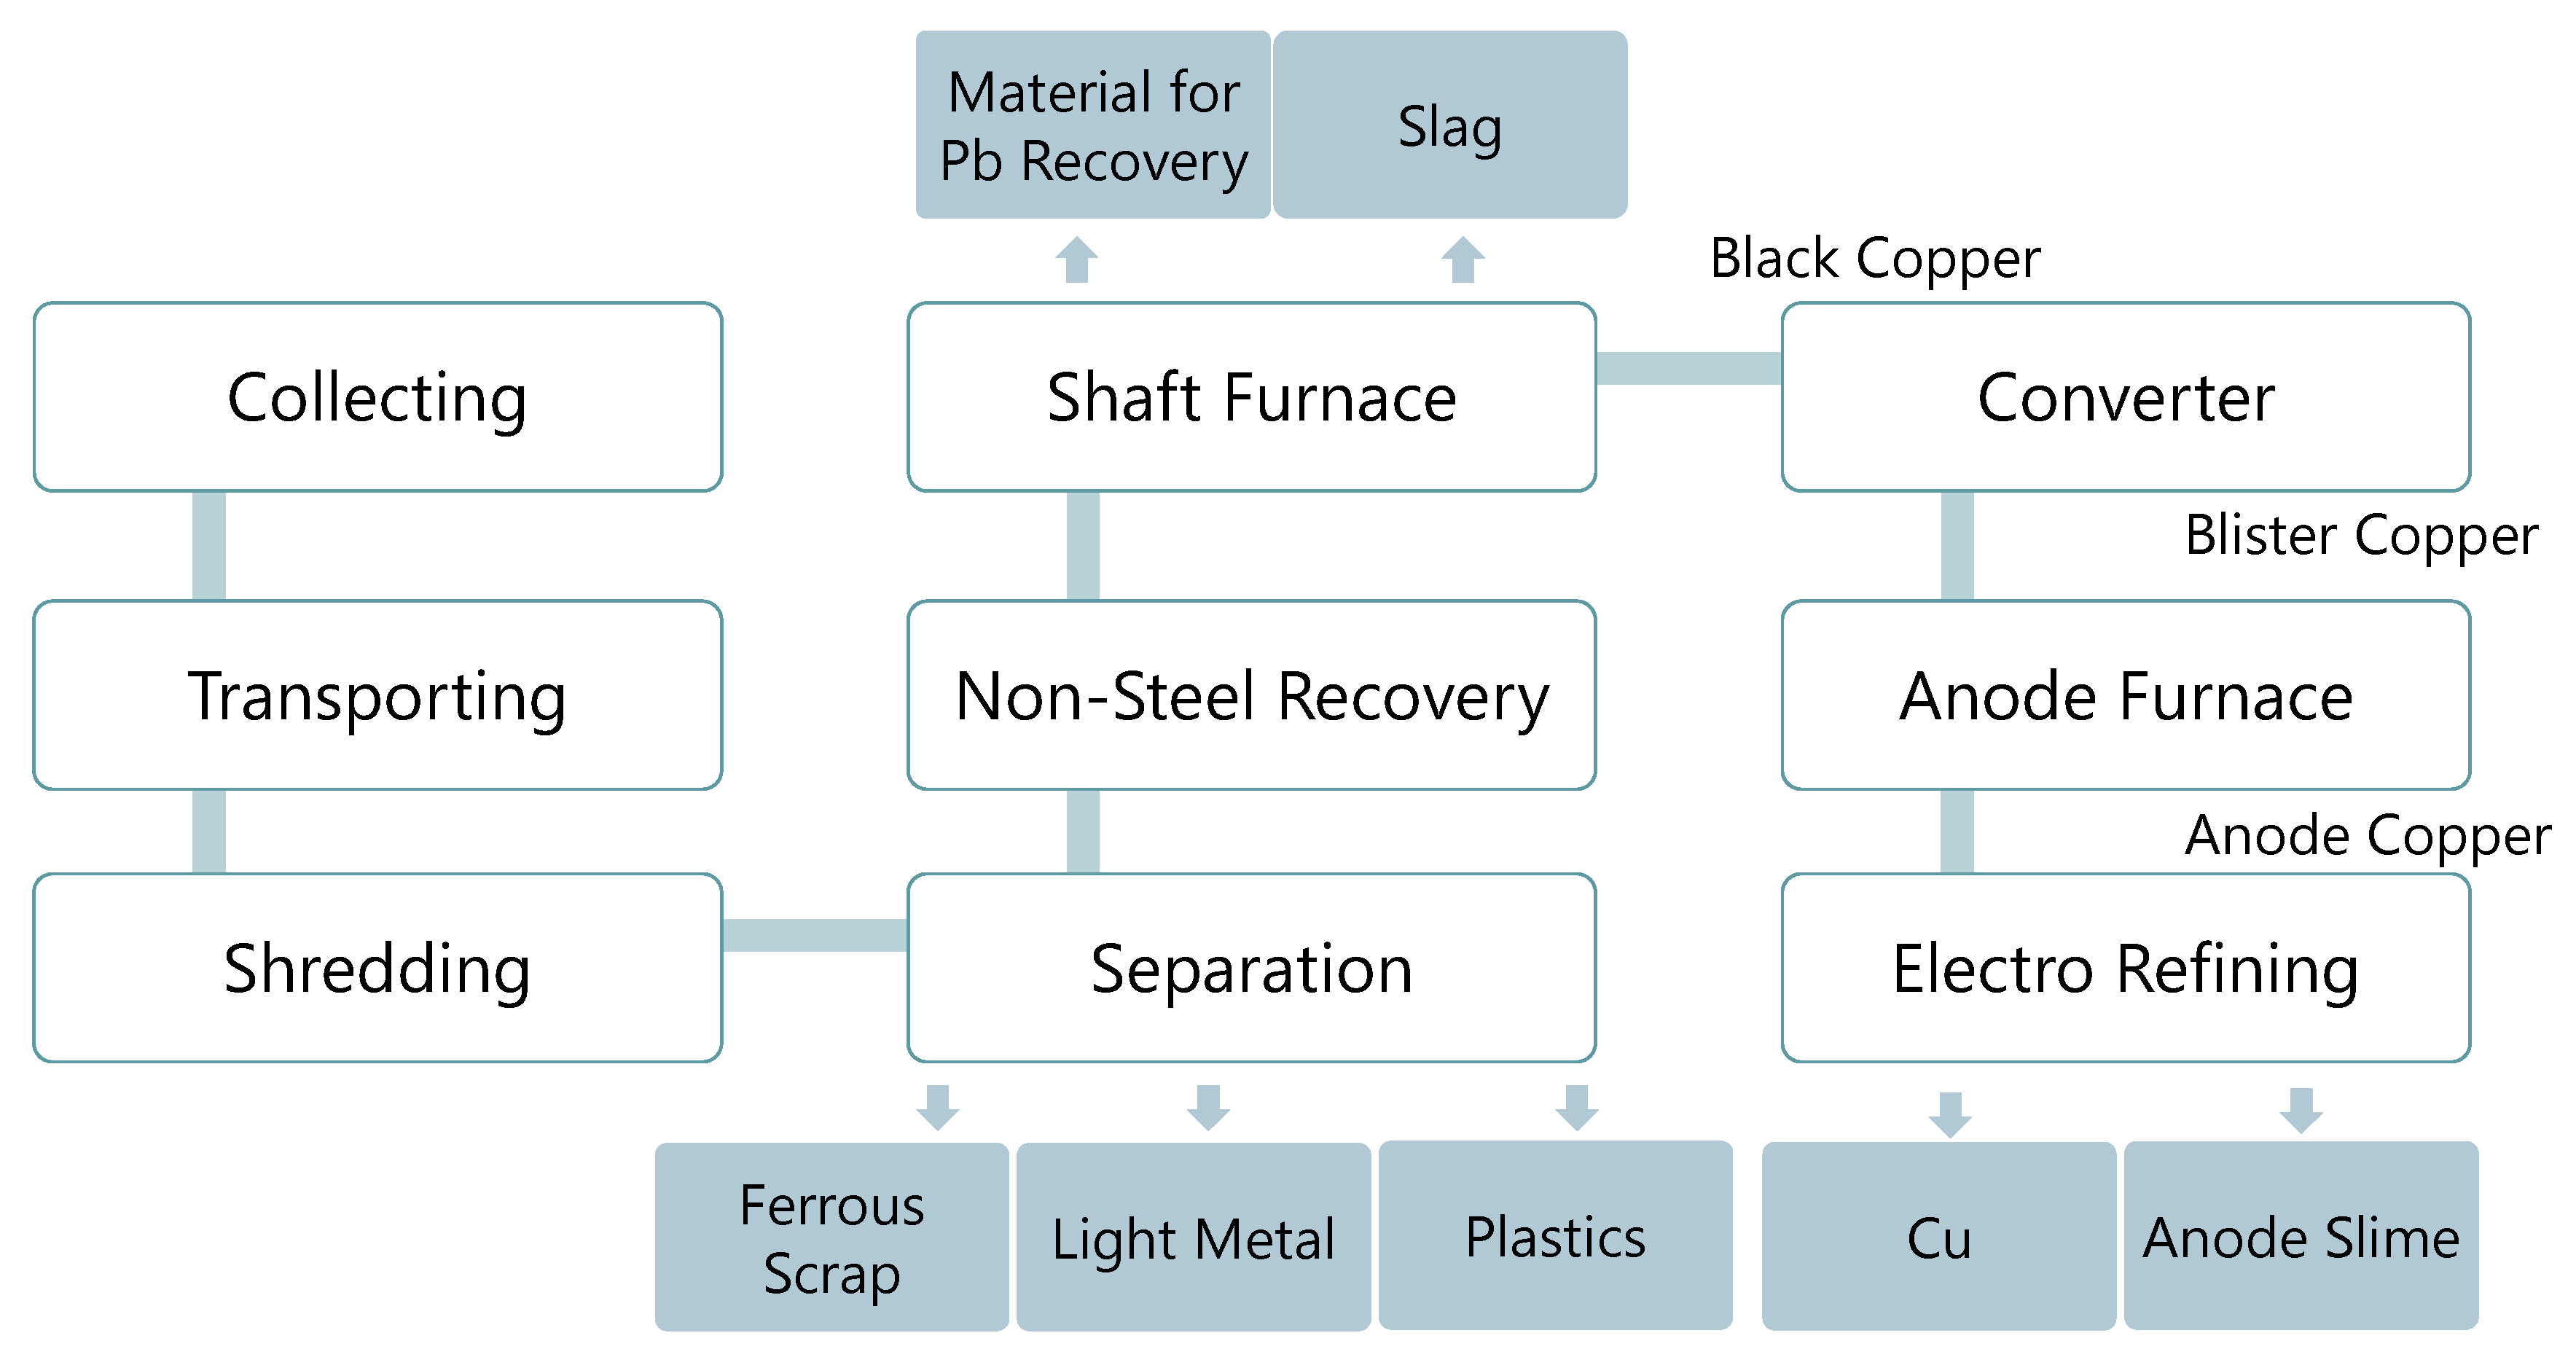
Materials considered for recycling in this study are copper scrap obtained from end-of-life home appliances. In this article, in order to avoid degradation of the quality of copper produced, all materials are processed to make copper cathode. No brass or wire will be produced in this recycling process. Product-to-product type recycling, or component reuse, is also not considered. The process flow is shown in Figure 1. In order to give a fair comparison, collection of end-of-life products through to refining copper is included. Data for the industrial processing steps are obtained from references [66,67,68]. Table 3 lists the materials and assumptions used to estimate the material flows in the recycling process. Figure 4 shows the recycling process modelled in this study. End-of-life products are assumed to be collected as follows: end-of-life products will be brought in by consumers to household appliance retail stores around Japan. Retailers will then transport these items to the closest smelter where they are recycled to produce electric copper. This process flow is similar to the practical recycling process that operates under extended producer responsibility regulations in Japan. The smelting facility information is acquired from corporate websites [69,70,71,72,73,74,75]. The smelting facilities are not always copper smelters, but are treated as such for the initial estimation. In real recycling processes, separation is an important component in ensuring quality and in terms of the energy and labor costs associated with the recycling process. According to the Ministry of Environment, end-of-life products contain a large amount of steel [67]. To remove steel from scrap, magnetic separation process is applied. Then non-ferrous metals and plastics are separated by air separation. Finally, light metals such as aluminum and heavy metals such as copper are separated by density separation [68]. Although the data in this reference are for construction and demolition waste, it is assumed that separating ferrous and non-ferrous materials use the same operations, which have been observed at recycling facilities.
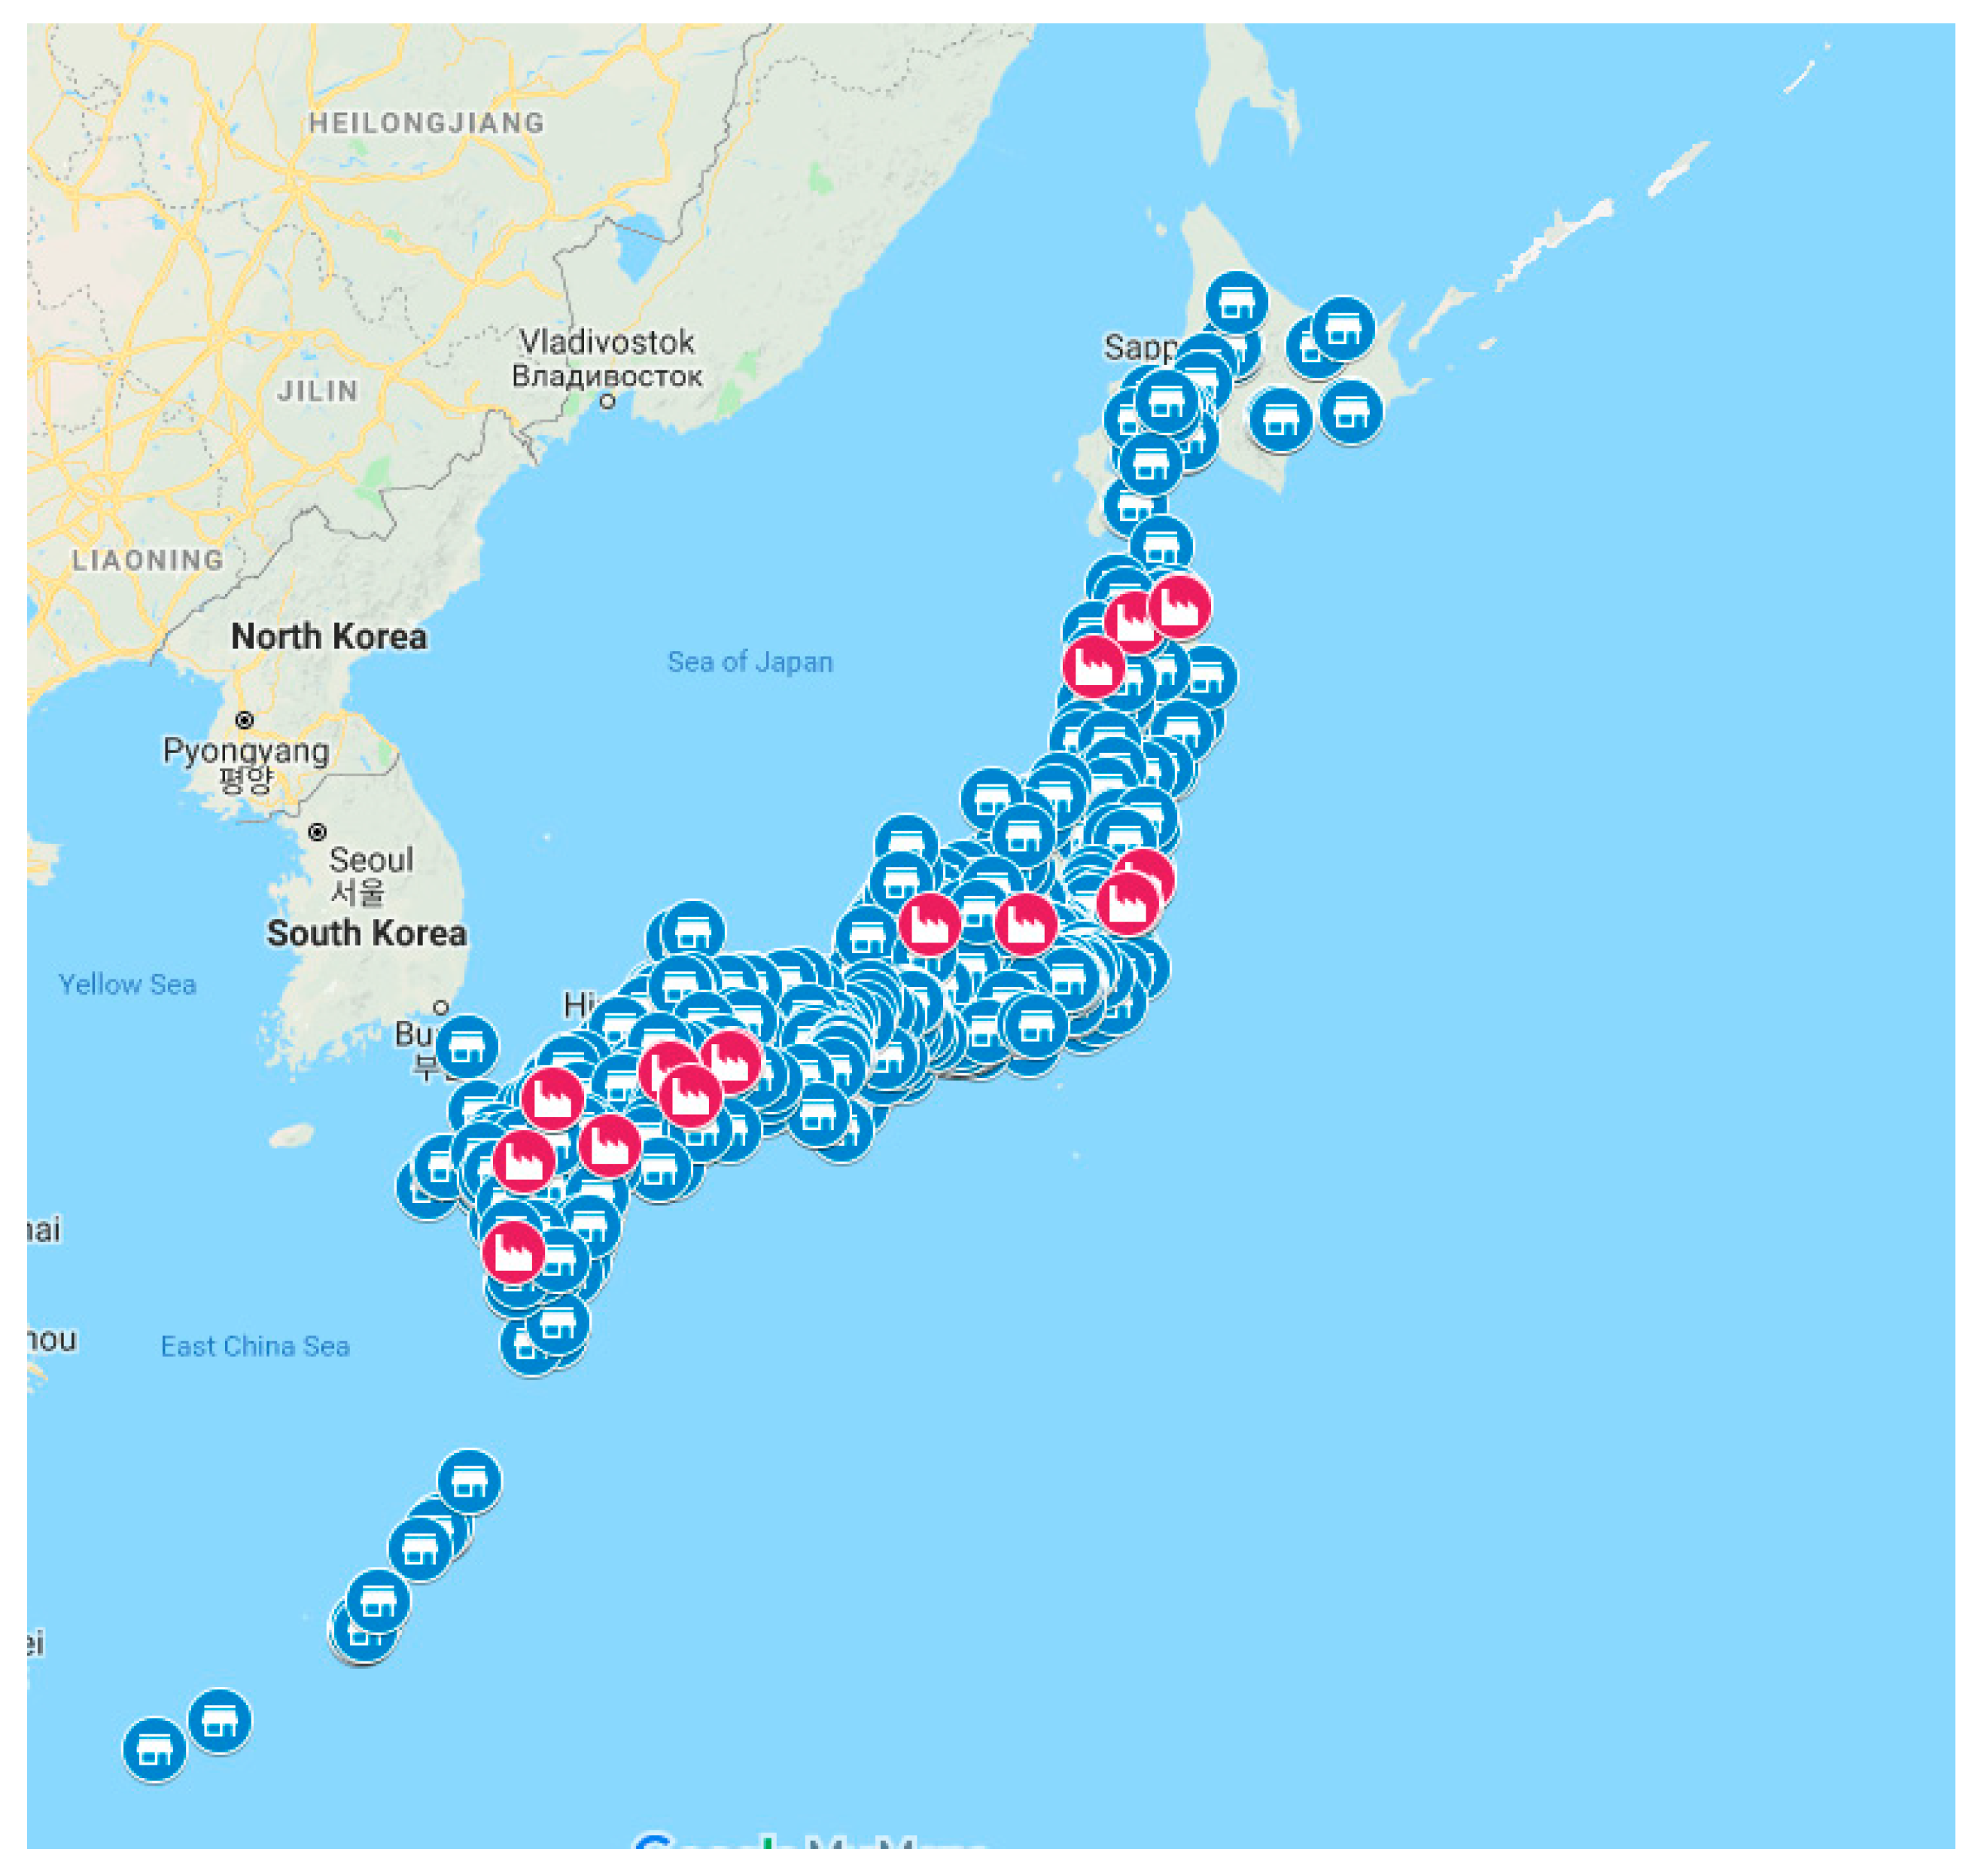
The average minimum distance (dmin) between retail shops and smelters across Japan. The distance between smelters and retailers was estimated using the Google Maps API Directions Matrix. This distance indicates actual road transportation. In total, 245 retail shops were sampled randomly (from over 4000 national shops) from the major cities in Japan. The closest smelters from each retailer were chosen and the average minimum distance calculated. These major cities are home to most of the population, thus the estimated distances are considered to be indicative (but not precise measures) of the actual weighted average of transportation. Non-ferrous metal processing smelters were chosen in this article. Smelters and retailers in Japan are shown in Figure A1.
Energy for transportation is estimated by applying energy consumption factors on the basis of net ton-kilometers (ntk). All transportation is assumed to be conducted by road using 4 t diesel trucks, and specific instances where sea transport would be a practical requirement (such as Okinawa) are not considered. Energy consumption for transportation is estimated by Equation (3):
where e is energy consumption, w is weight of end-of-life products, dmin is distance from retailer to the closest smelter, f is fuel use per unit (L/t-km). In this study, 0.0686 (L/t-km) which is typical of a 4 ton diesel truck with 80% loading rate is applied, while the fuel heating value per unit, h, is 38.2 GJ/kL with these values being based on Japan’s standard ton-kilometer method [76]. Energy consumption for households bringing their end-of-life products to the retail shop is not considered, as the variability in potential transportation modes and distances is very diverse. Actual energy consumption is therefore likely to be greater than this estimation, making it an optimistic estimate. It is assumed that copper is contained in end-of-life product by 2.5%, thus 40 t of end-of-life products need to be collected to produce 1 t of recycled copper (at 100% recovery rate) [67].
The recycling scenarios, like polymetallic ores, can be divided into two categories: copper recovery only (REC Cu Only) and all material recovery (REC All Materials). The two scenarios require different allocation of the environmental impacts, whereby in the former case all materials other than copper are categorized as waste, and thus have no energy or environmental impact allocated to them, with 100% of energy for transportation and concentration consumed for copper recovery. Energy for smelting and refining is used entirely for the production of copper since this study considered slag and anode slimes to be wastes. The REC All Materials scenario indicates the situation in which all materials will be recovered. Energy for all processes are therefore allocated according to the mass in the relevant feed stream. Recovered plastics are used as fuel and coke [66], and no material will be counted as waste in raw material collection. The heat value shown in Table 3 is calculated based on Japan’s plastic production in 2017 [77,78]. On the other hand, downstream energy for smelting and refining will not change due to allocation.
In both cases, the work referenced here assumed a copper content of 12.9%. In this case study, however, copper in the feed material is 7.8% after separating other materials [67]. This study assumes the material compositions of not only copper but also other materials are as per the referred work for input streams, thus some additional processes to concentrate copper content would practically be required, although these are not evaluated as it is assumed that they will not contribute significantly to overall energy consumption. The additional mass stream from this theoretical separation process is allocated as waste.
2.2. Resource Security
Based on previous research (discussed in Section 1.4), in this article, resource security for long-term sustainable supply is evaluated considering the following factors: substitutability, energy consumption, CO2 emissions, waste disposal. Substitutability in this context describes the ability to substitute the supply of raw material from imported material to domestic material. Environmental factors may become more significant in the future, especially considering low grade ore development, effecting energy use, waste and emissions. Waste disposal has not been a recent issue for metal production in Japan, but in the selection of alternative sources it may become a more prominent issue as the available land is scarce and the geological stability is uncertain.
2.3. Sensitivity Analysis
As a sensitivity analysis, various shares of deep ocean mining are considered. This analysis assumes that conventional copper processing and recycling fill any demand gap between the available production from deep ocean mining. “Demand” is estimated as the average copper demand in Japan from 2001 to 2016. Copper demand in Japan includes domestic demand and export demand. The potential collectable recycling material is assumed to be the same as average domestic demand in Japan from 2001 to 2016. The demand breakdown is shown in Table 4. Demand is provided for by DOM as a priority. For instance, when deep ocean mining produces 10% of demand, the remainder will be produced by conventional and recycling copper processes. Various mixes of supply, from 100% conventional to mixes containing primarily DOM are considered, and the range of energy consumption, CO2 emissions and waste disposal is examined. While it is assumed that DOM can supply up to 100% of demand, there is a limit on the amount that can be supplied by recycling (up to 100% of the domestic component of demand), so in cases where recycling cannot fill the total remaining demand, conventional supply is used to fill the gap.
3. Results
3.1. Process Energy and Mass Balances, CO2 and Waste
Table 5 shows the major overall material and energy inputs for each process. Step-by-step energy consumption is shown in Table A1 in the Appendix. It can be seen that conventional copper processing consumes more energy than deep ocean mining, although more than half the energy of conventional processing is consumed in resource exporting countries in the mining stage. Although raw material inputs are small in the recycling process, a large amount of energy is consumed for transportation to acquire end-of-life products.
Table 6 shows the waste output from the domestic stages of mineral production. In the conventional process, mill tailings including waste rock shown in red indicate waste produced outside Japan. Waste from end-of-life products in the recycling process is included as mill tailings here. The amount of waste which is produced in Japan is very high for deep ocean mining and quite high for recycling (if only Cu is recovered). Although where and how to store the tailings are not considered in this article, monitoring tailings that contain harmful materials is a major environmental issue for resource producing countries—and has been noted as a potential drawback of DOM [80].
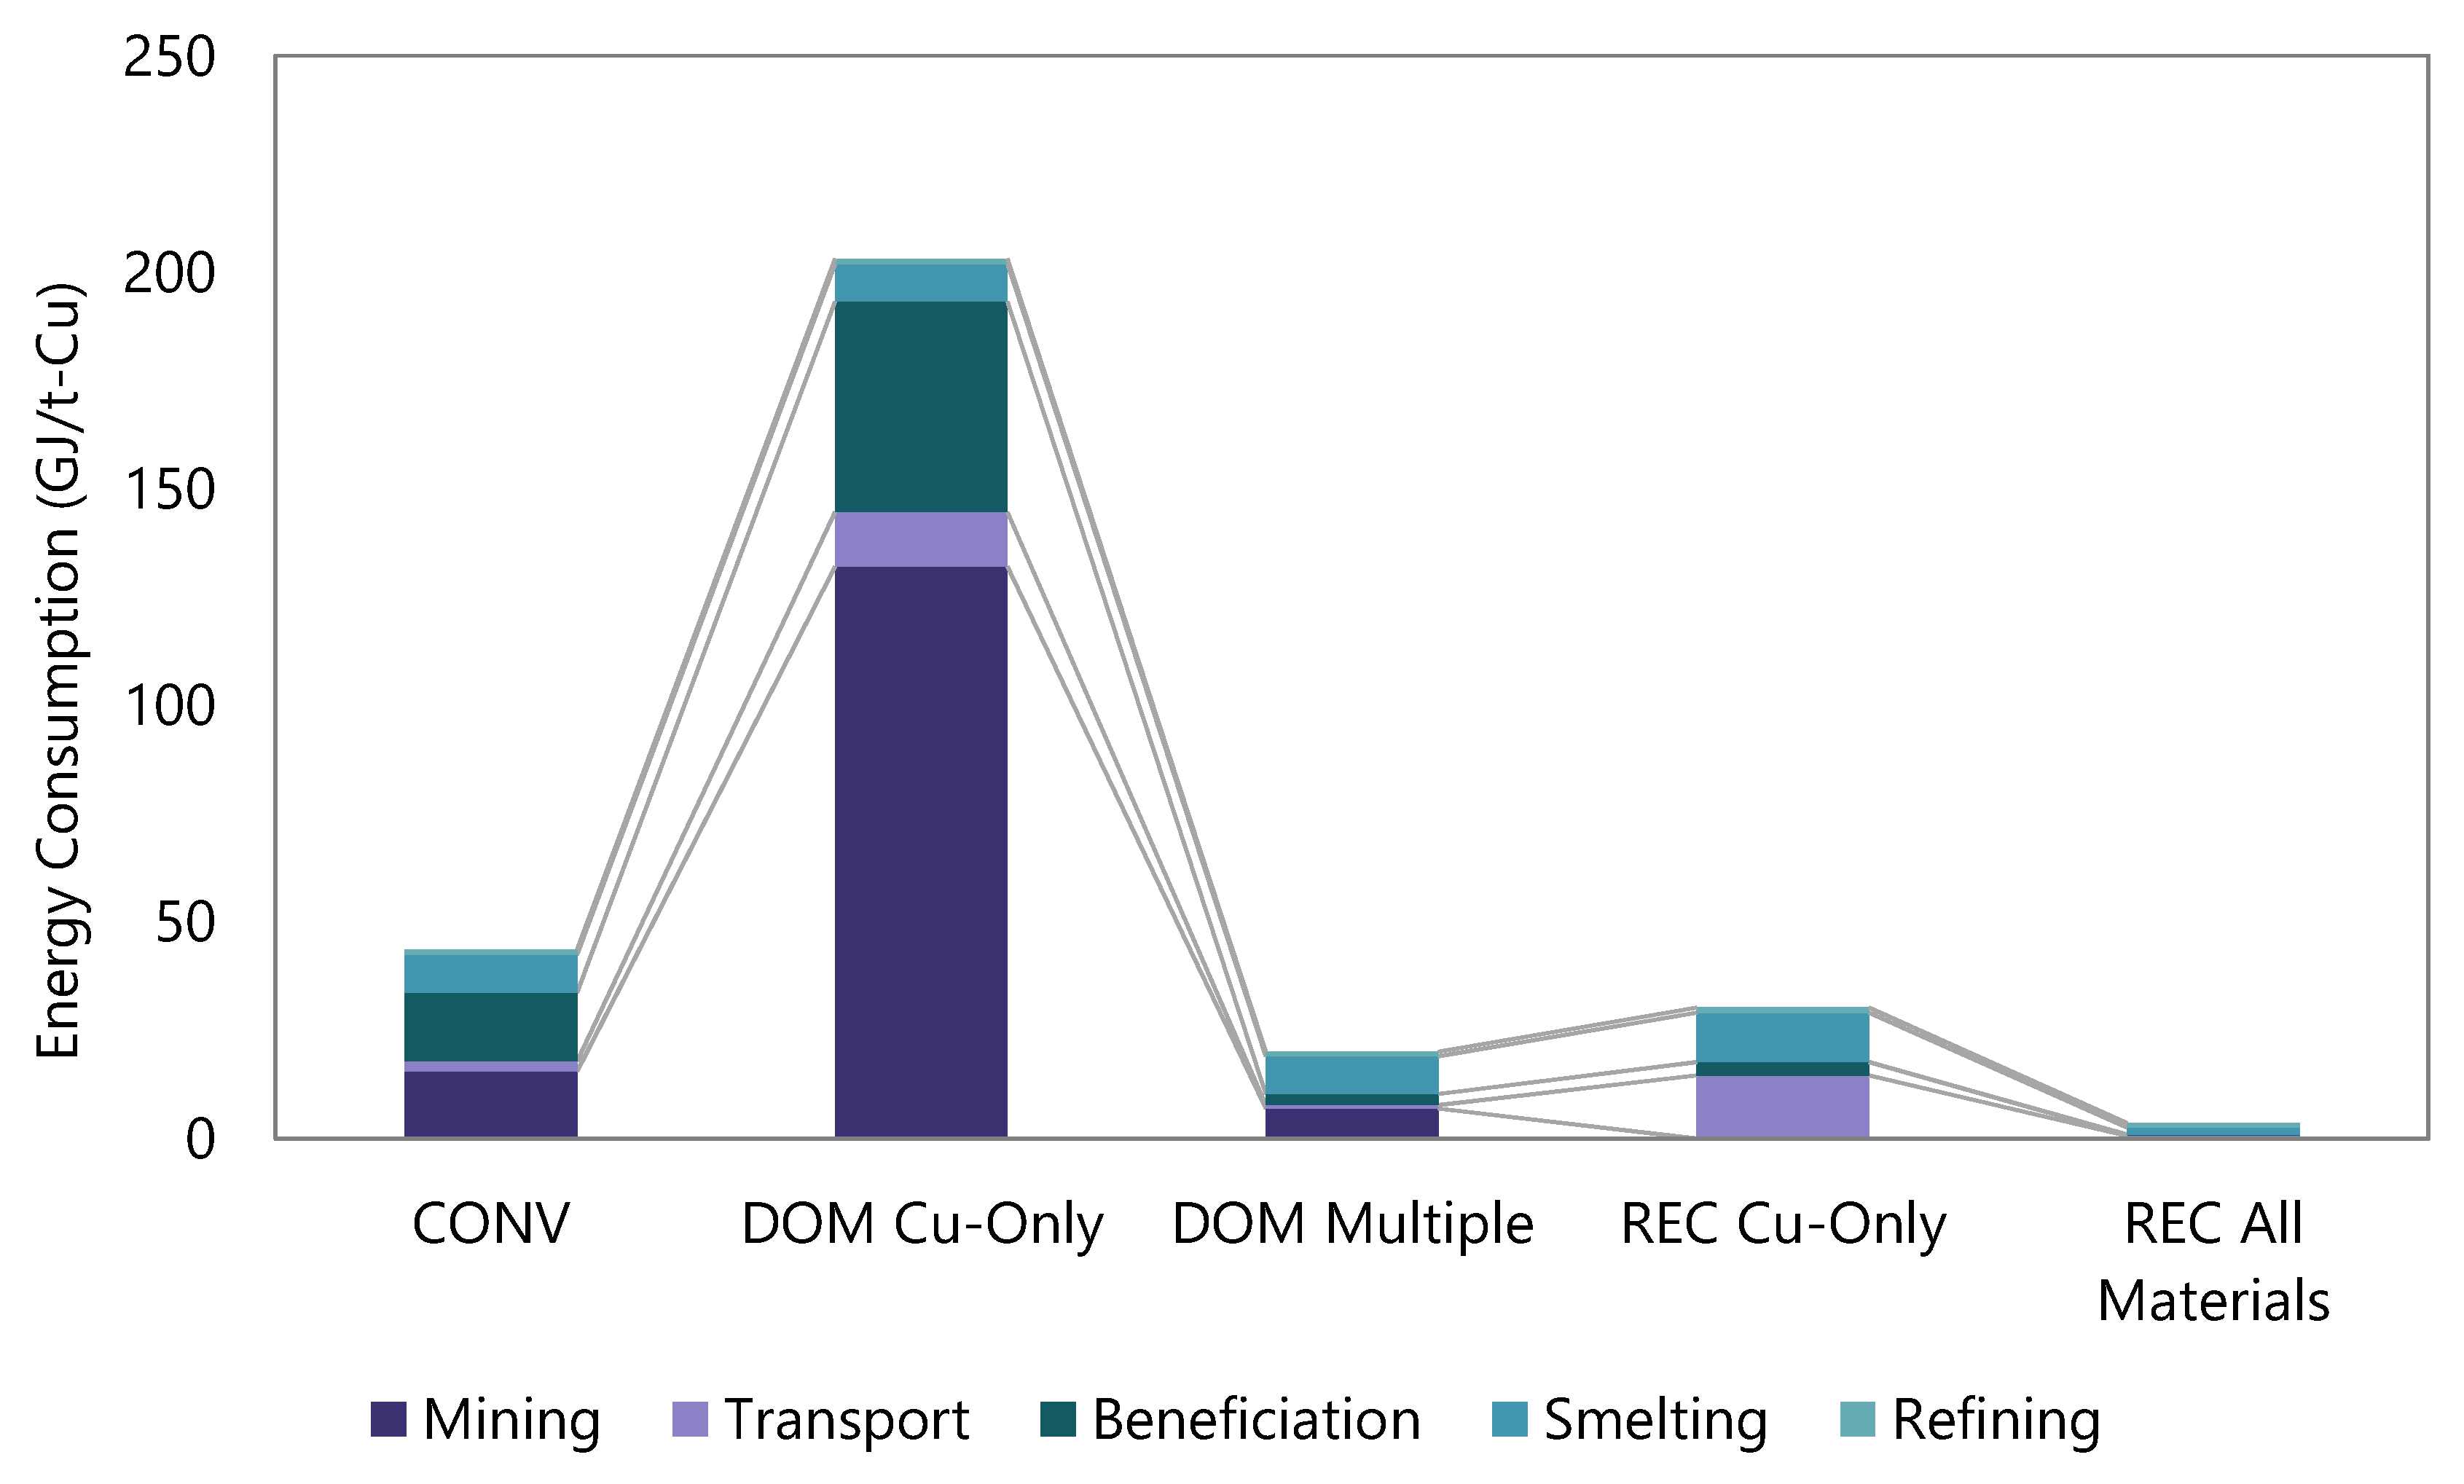
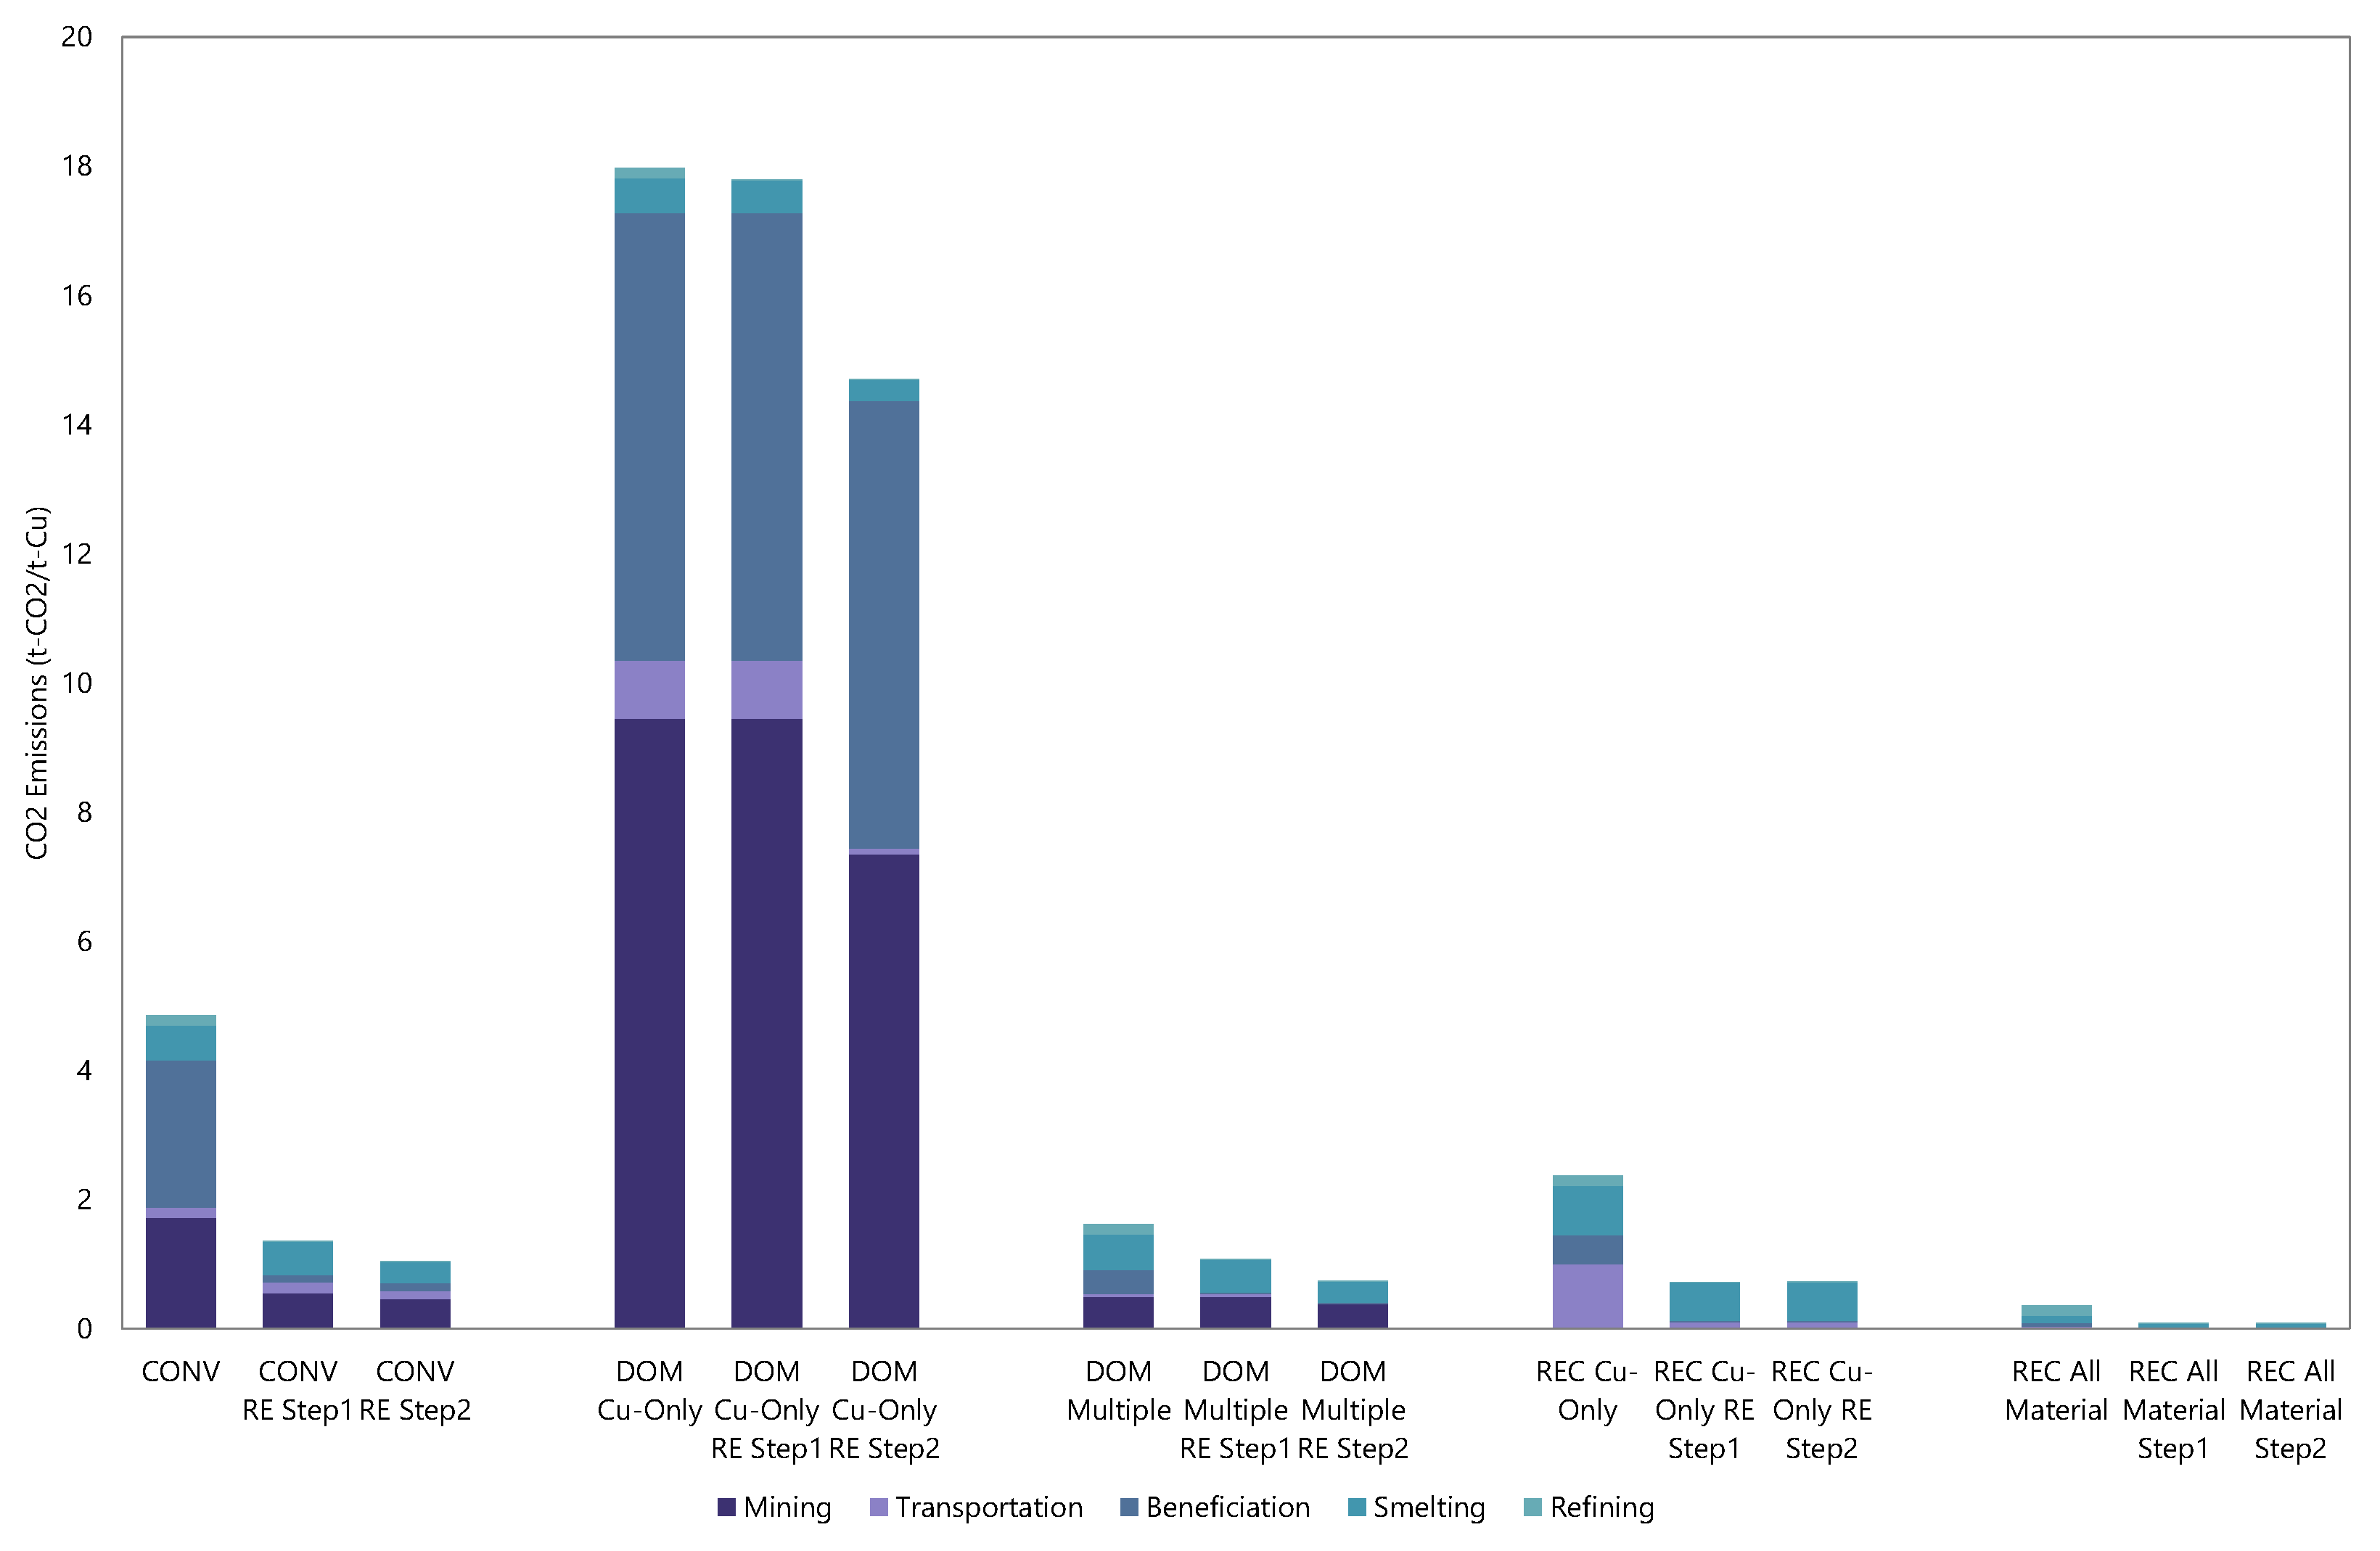
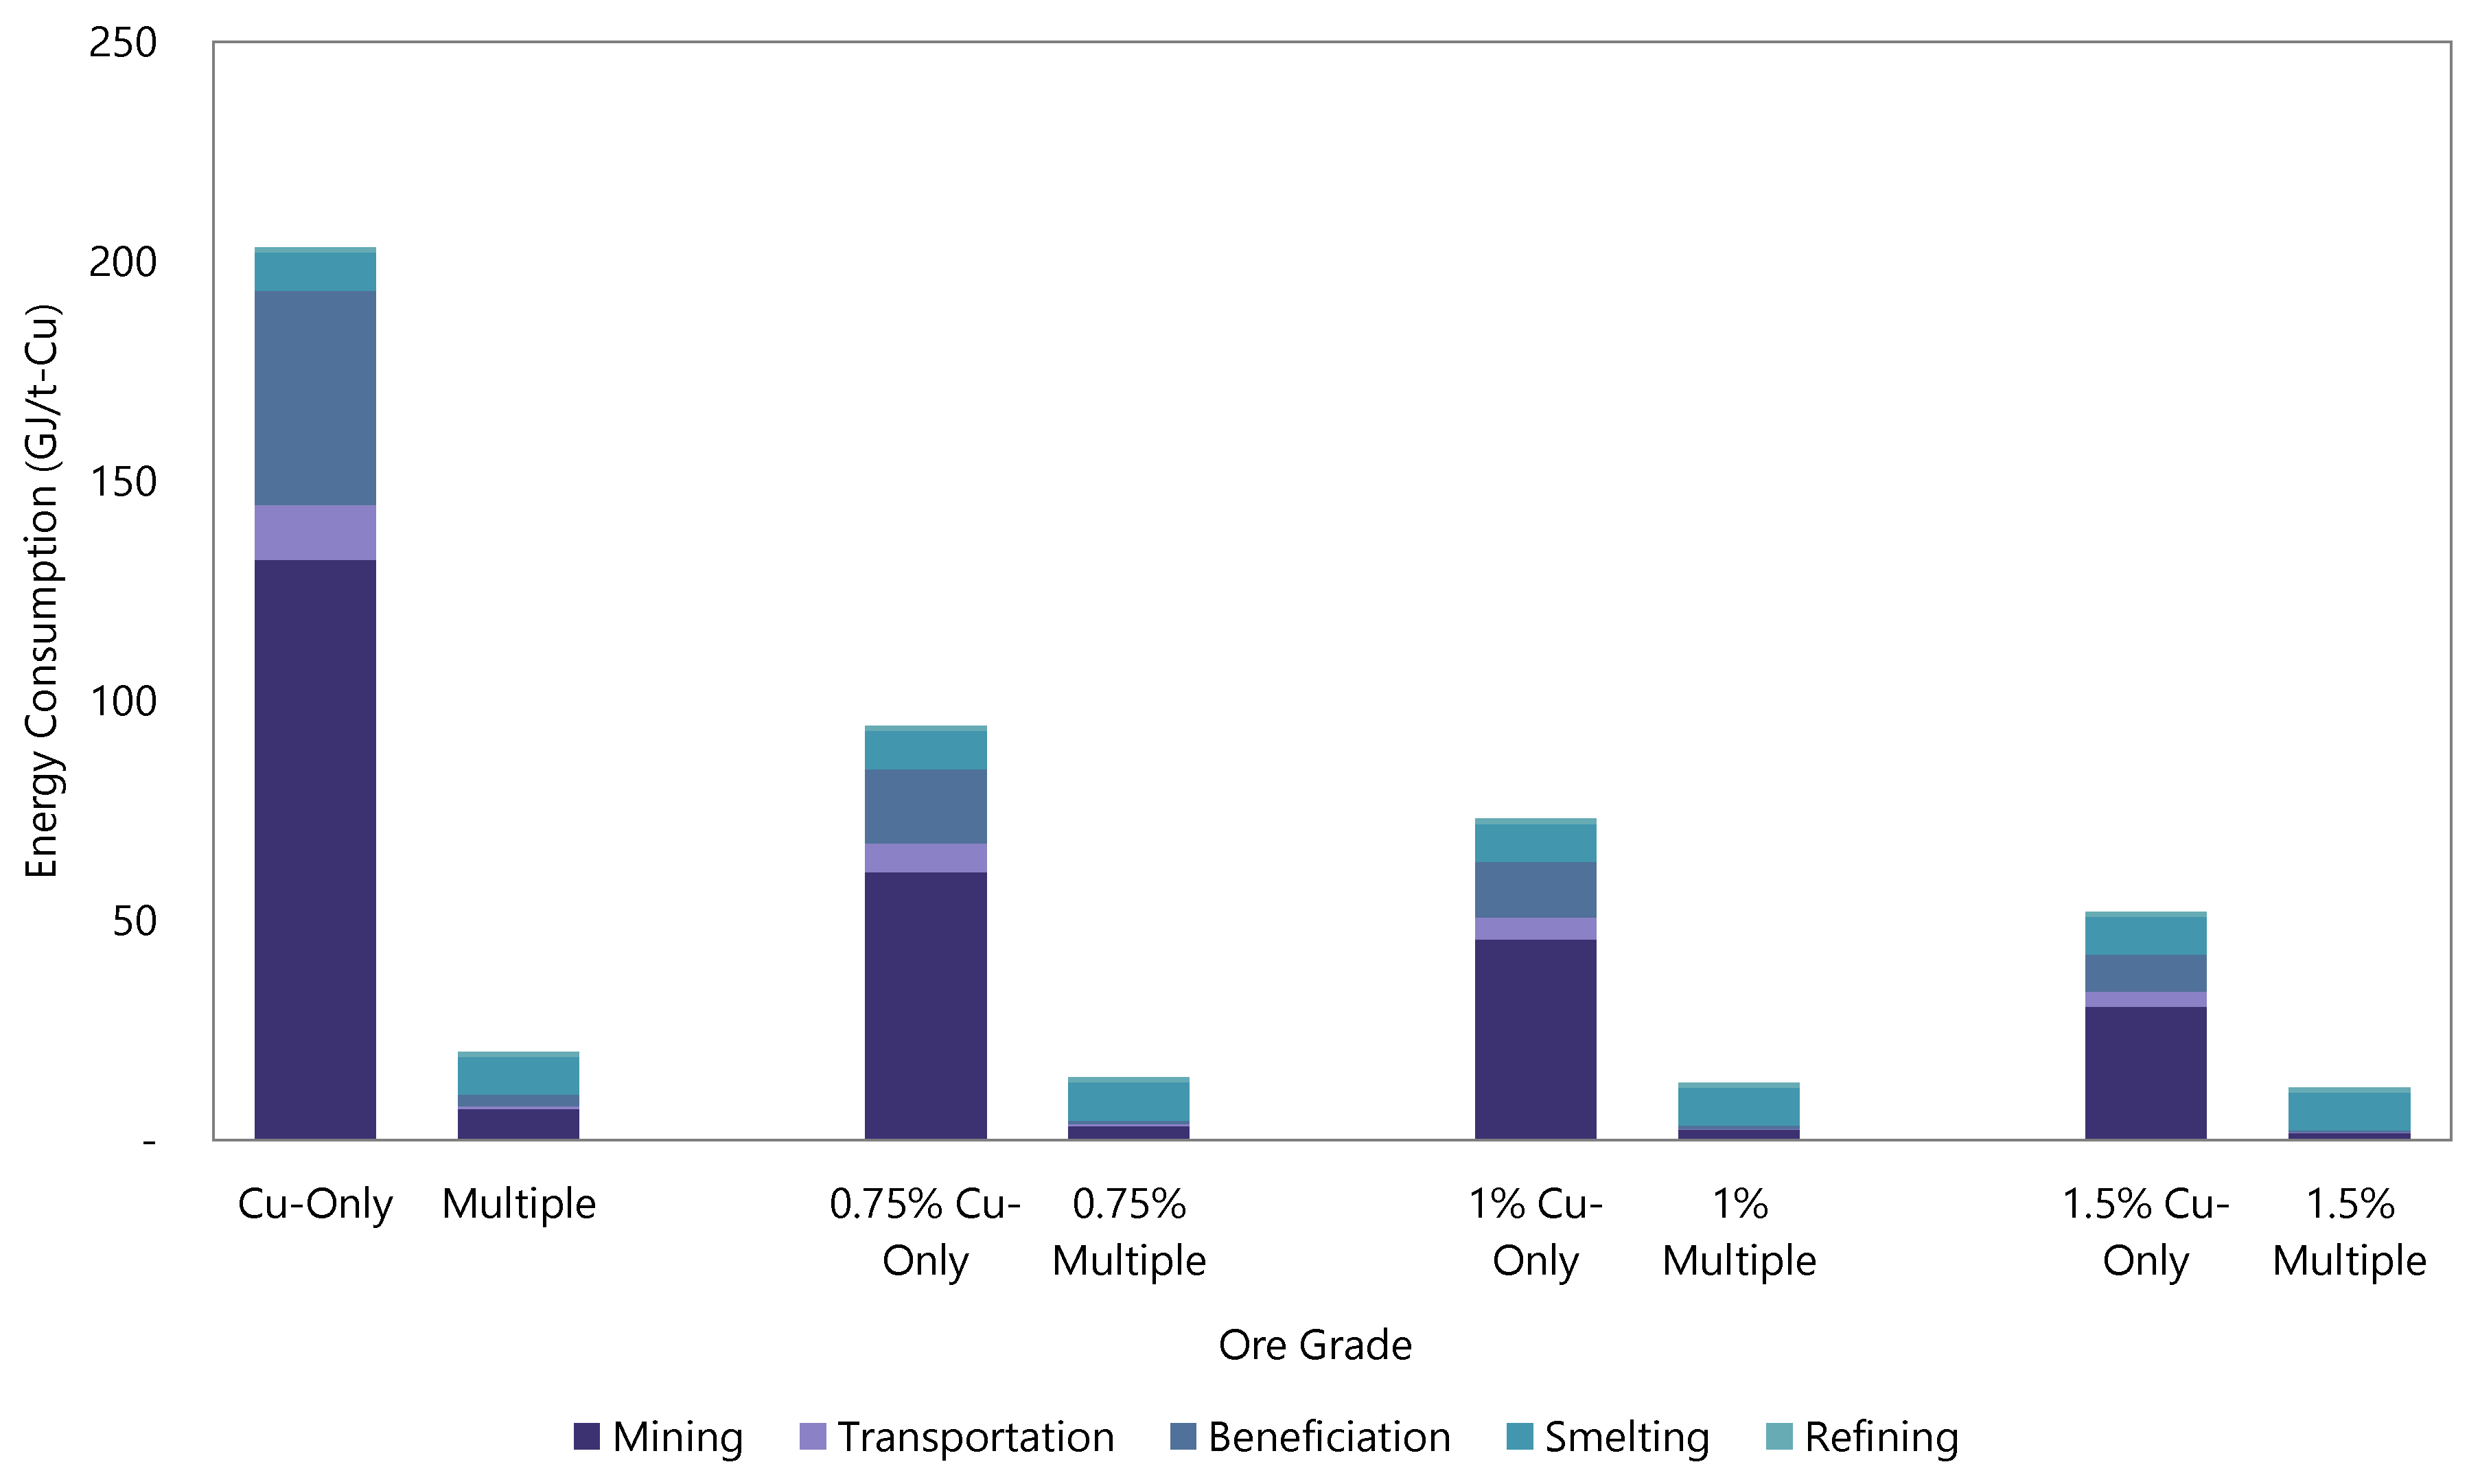
Figure 5 shows the energy consumption of the alternative mineral production routes. Cu-Only recovery from deep ocean mining consumes a very large amount of energy in the mining process, due to the low ore grade. When multiple materials are recovered (and thus the shared stage impacts are allocated across all target metals), less energy is consumed in mining and transportation process than conventional and the Cu-Only recycling copper process. According to the Agency for Natural Resources and Energy, deep ocean mining does not include crushing in the concentration stage, but rather it is accounted for in the mining process [59]. Thus, there is some interpretation required when examining the individual stage energy consumption, although the overall energy can be considered to be consistent. Deep ocean ores are often noted for having finer particle sizes, as well as being more refractory than terrestrial ores, thus potentially requiring finer grinding and subsequently more energy usage [27]. Based on the results, it can be stated that multiple material recovery will make deep ocean mining more competitive than the Cu-Only case. Smelting consumes less fuel energy in recycling partly because of the utilization of co-mingled plastics as a fuel source, as well as the fact that the reduction process is not needed for the recycled material. Note that only a very small amount of plastic is fed to the furnace while generally end-of-life products contain a large amount of plastics, which leaves the problem of how to deal with the remaining waste plastic stream. When the multiple-material recycling case is considered with allocation to the copper content, the energy consumption is quite small.
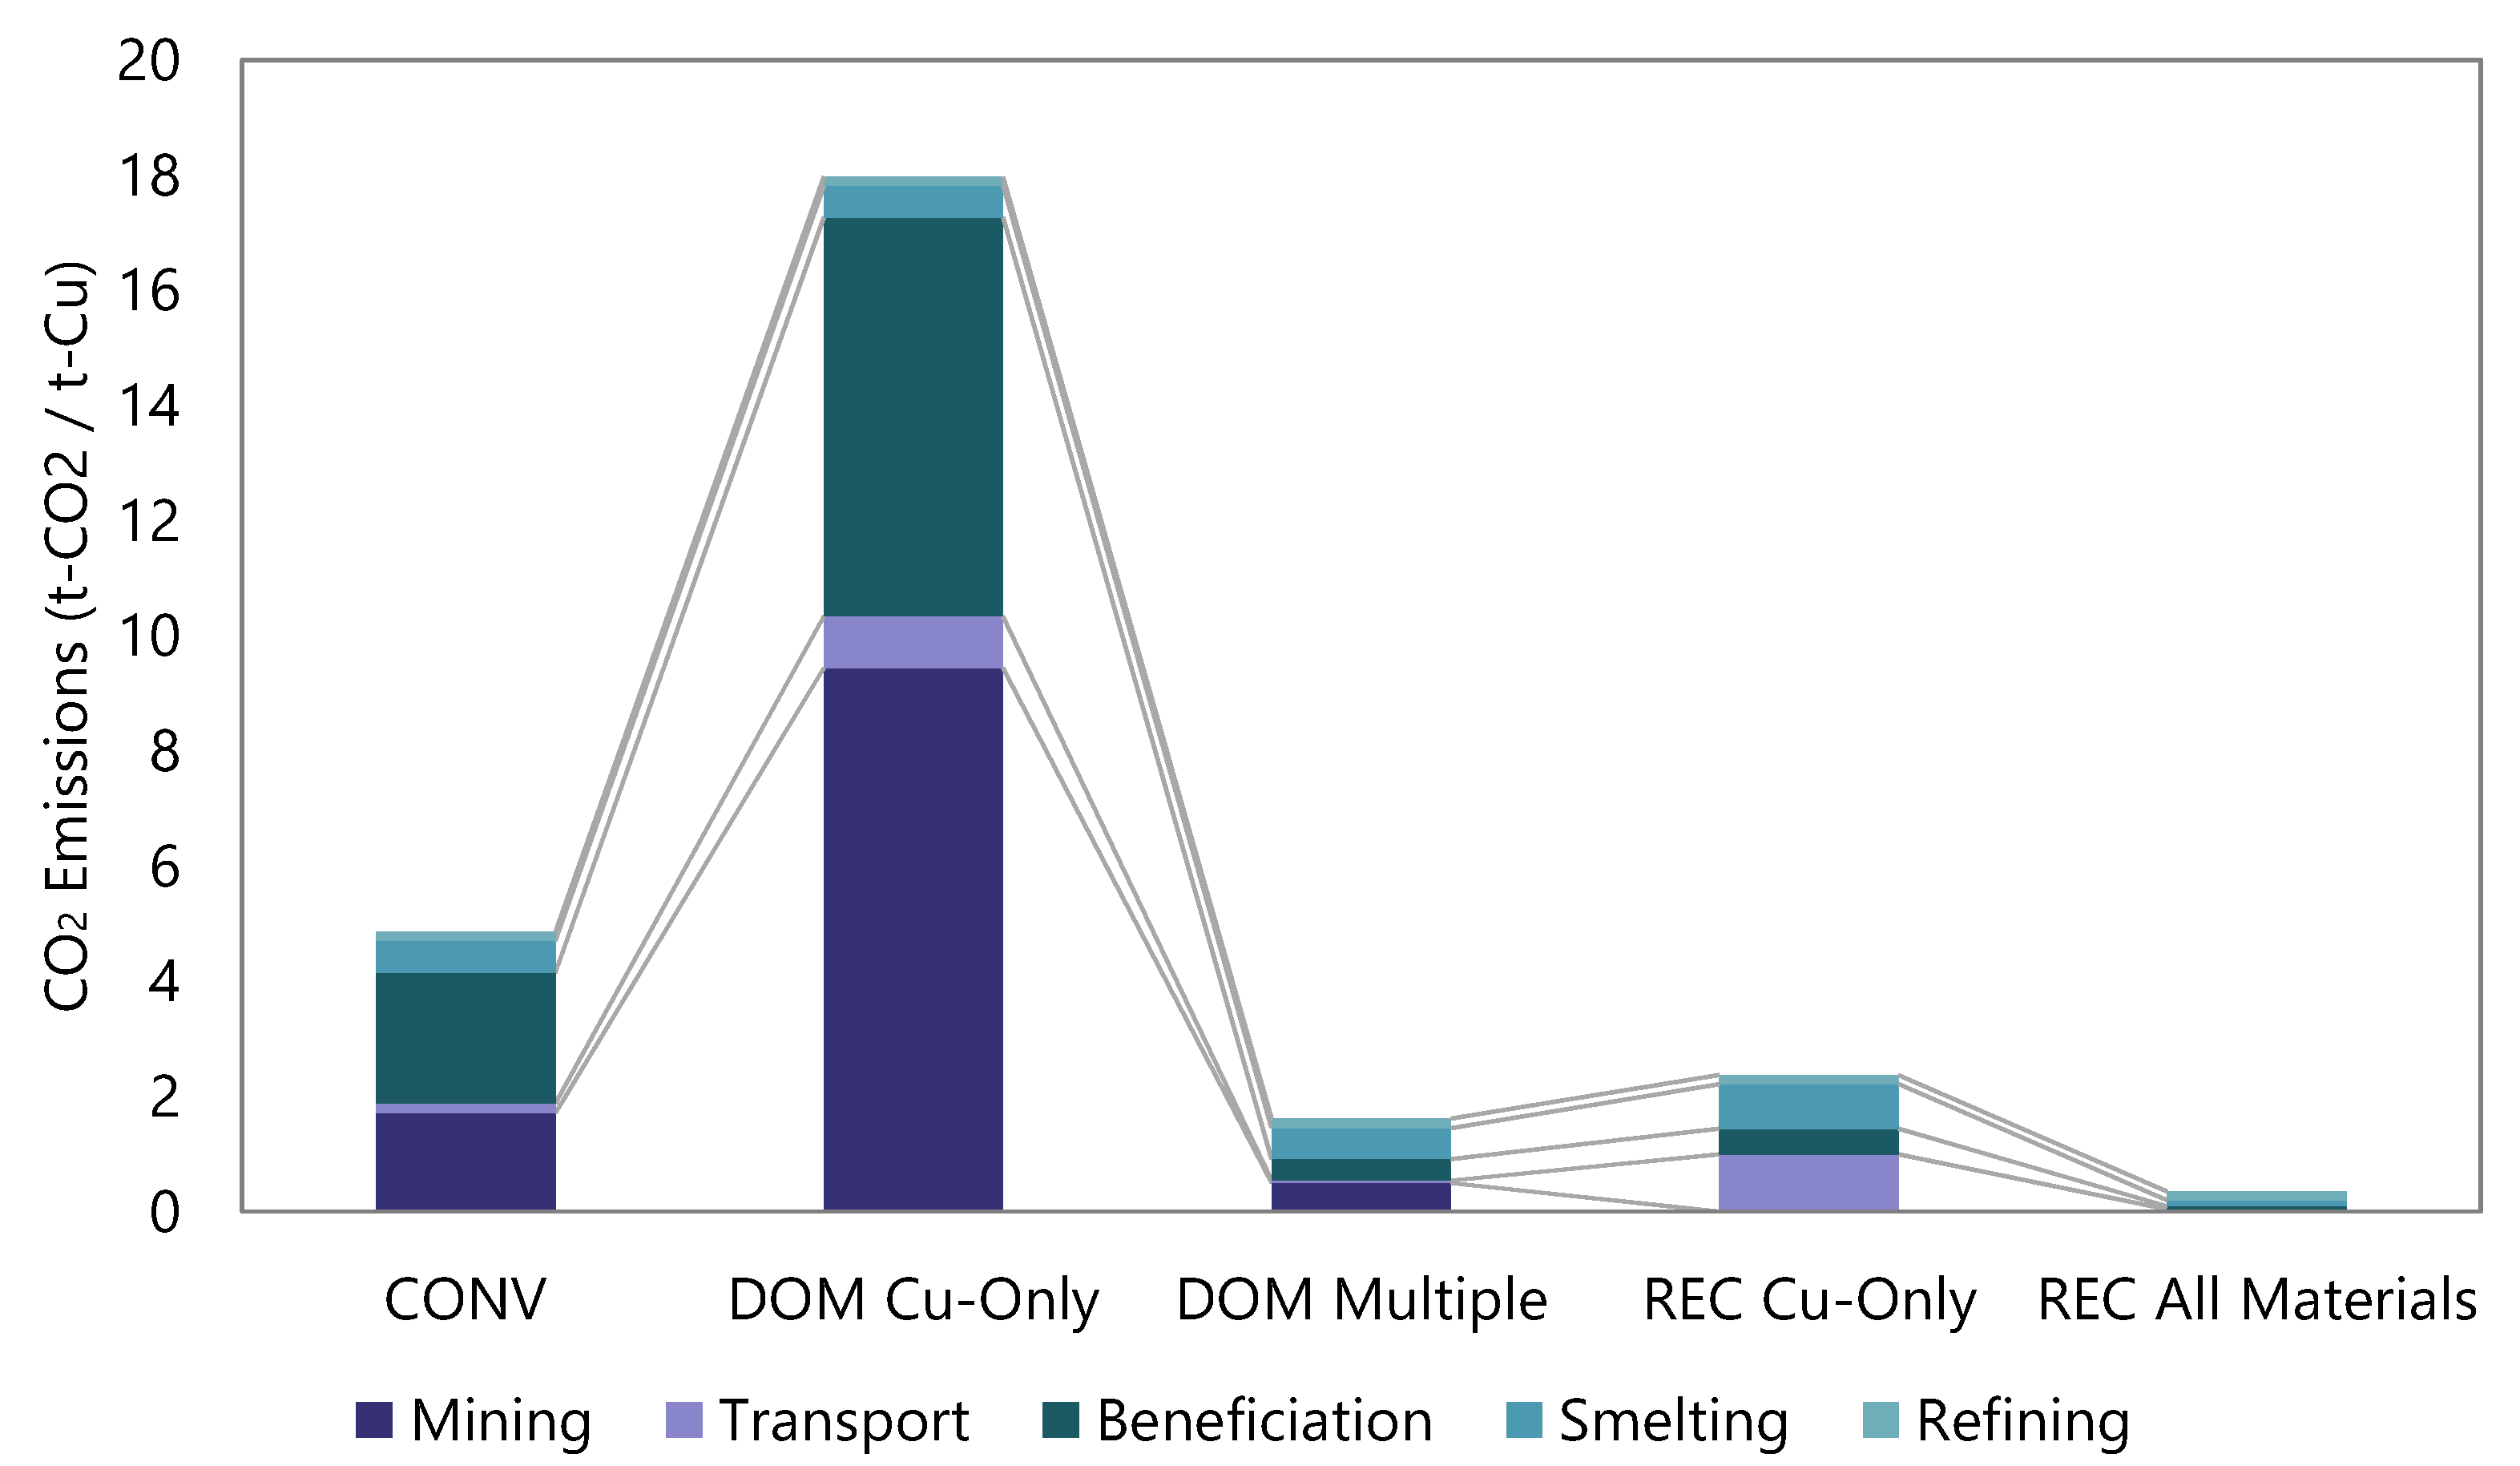
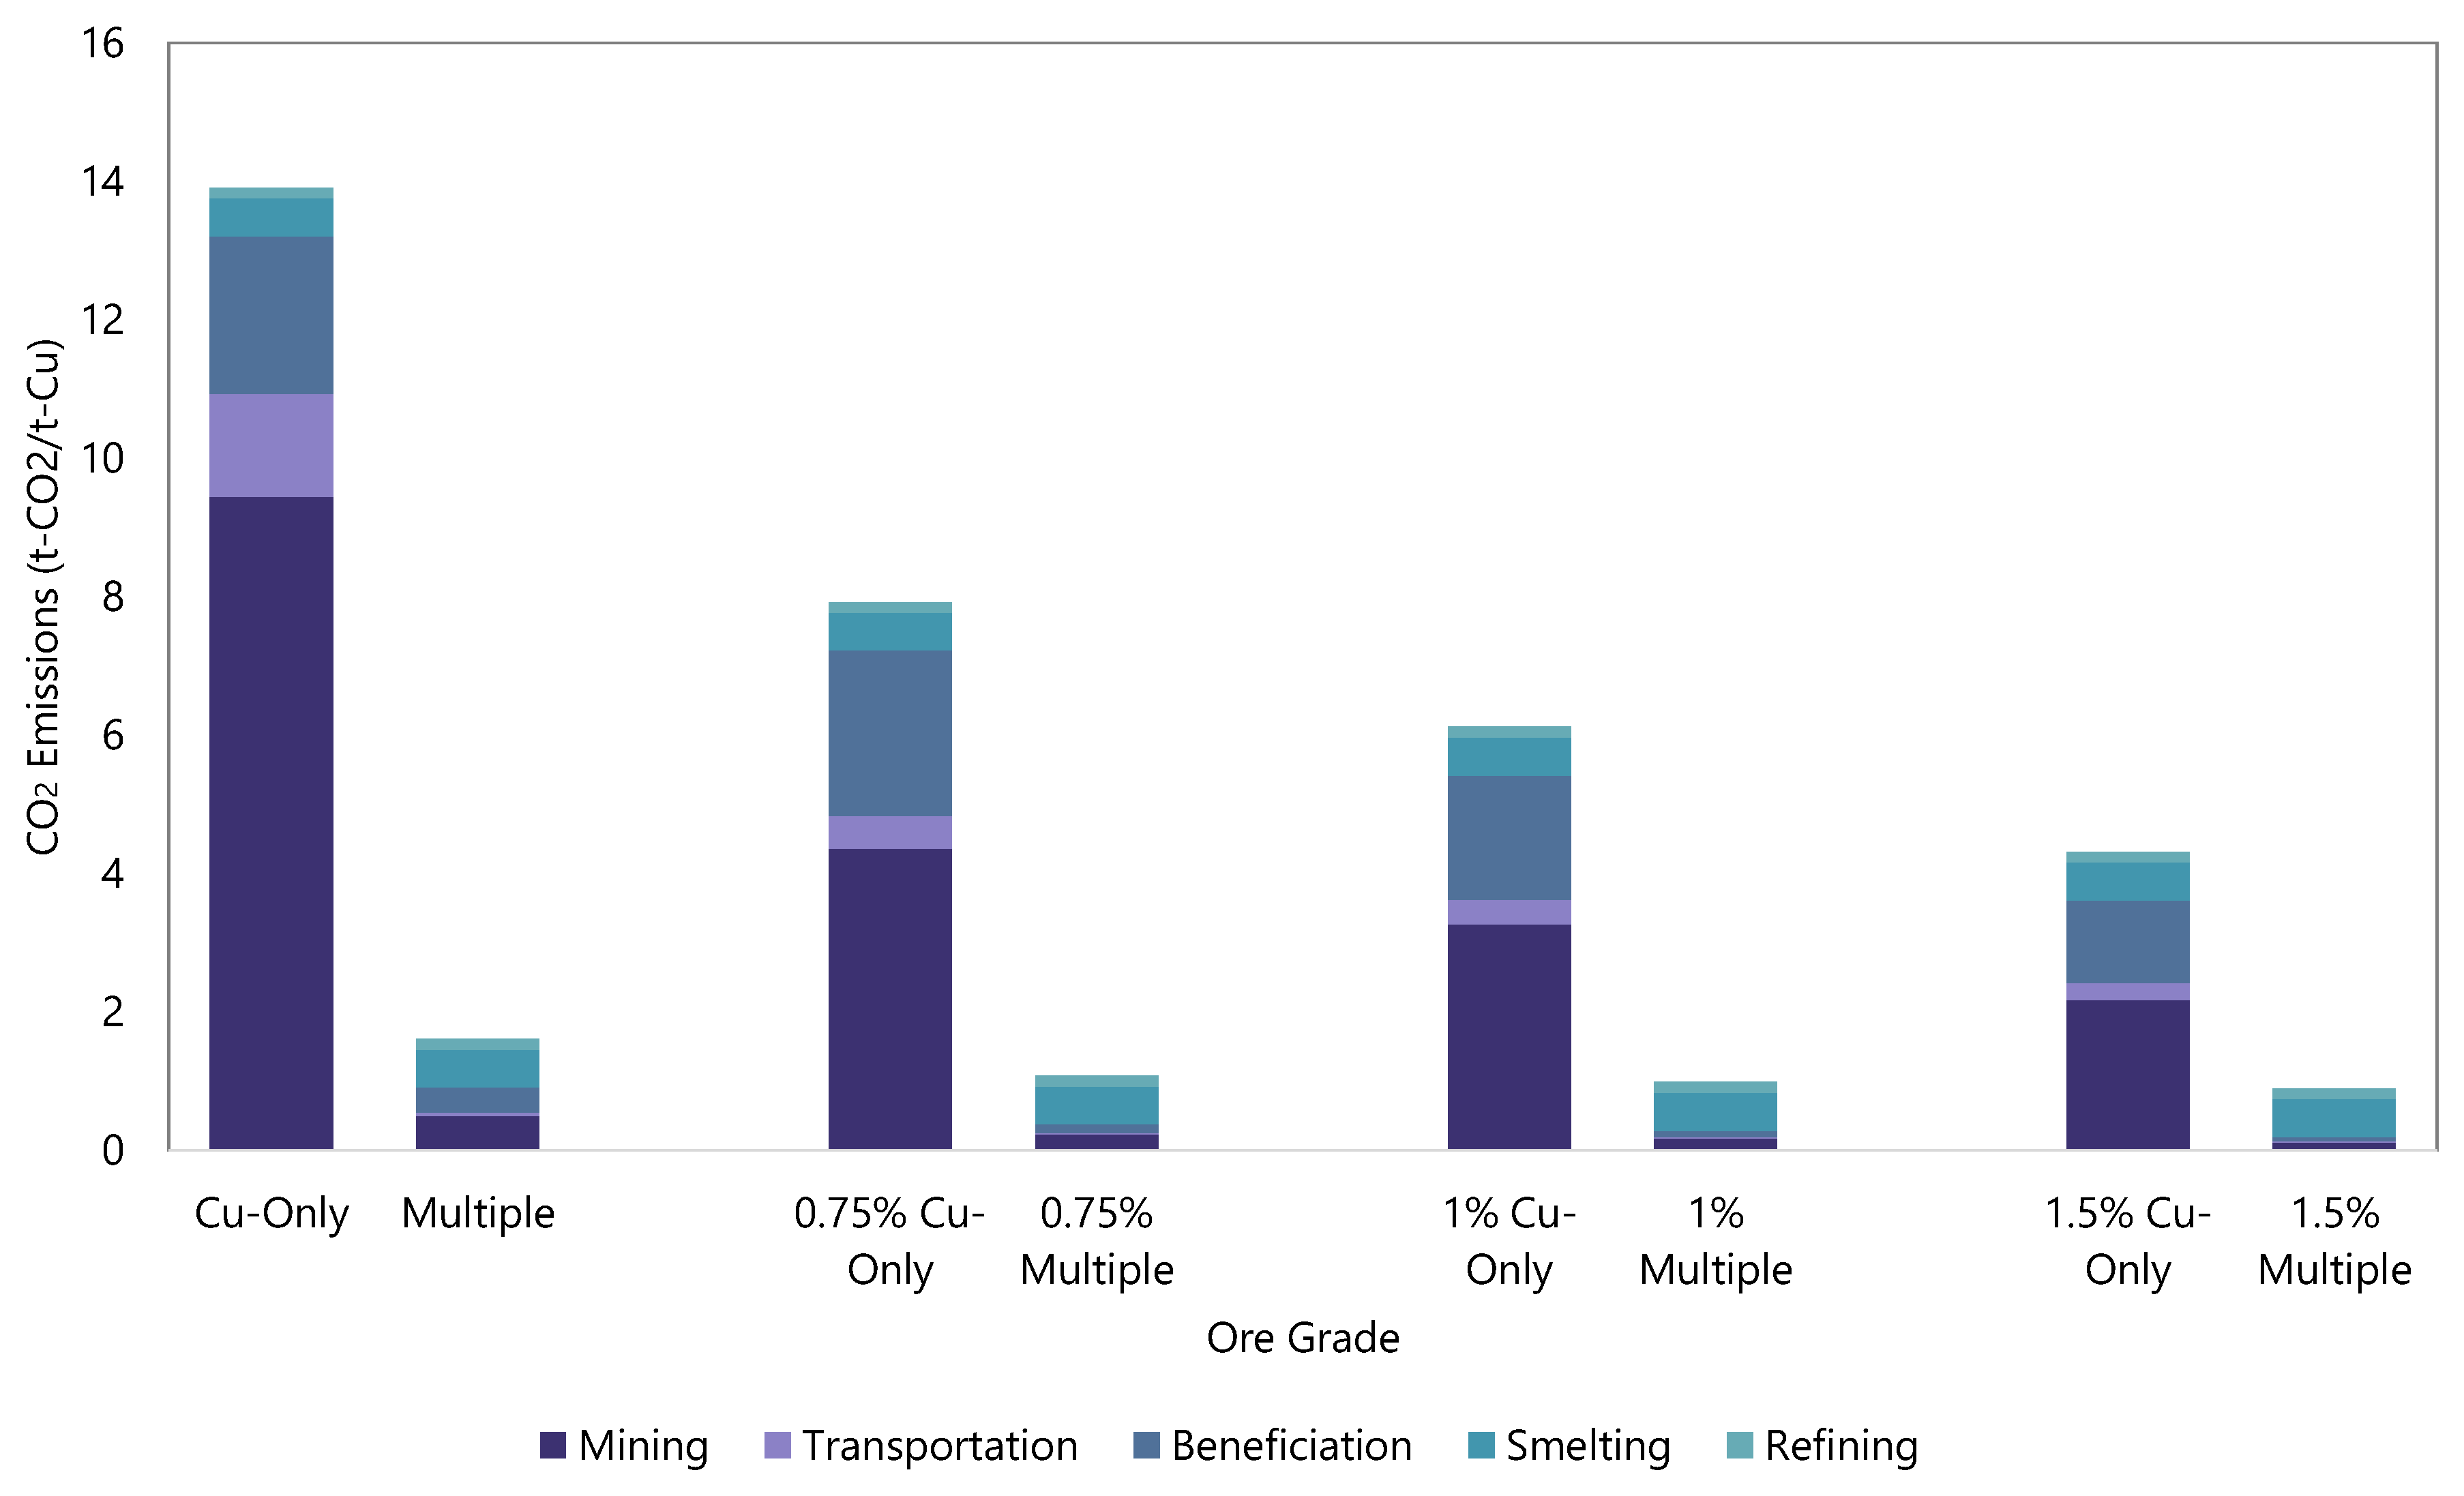
Figure 6 shows the CO2 emissions for each option. The trend is similar to energy consumption shown in Figure 5 as the energy mixes for most stages are similar, while those stages relying on more CO2-intensive energy sources are exacerbated. This has been noted as a weakness in the potential benefits of DOM [64].
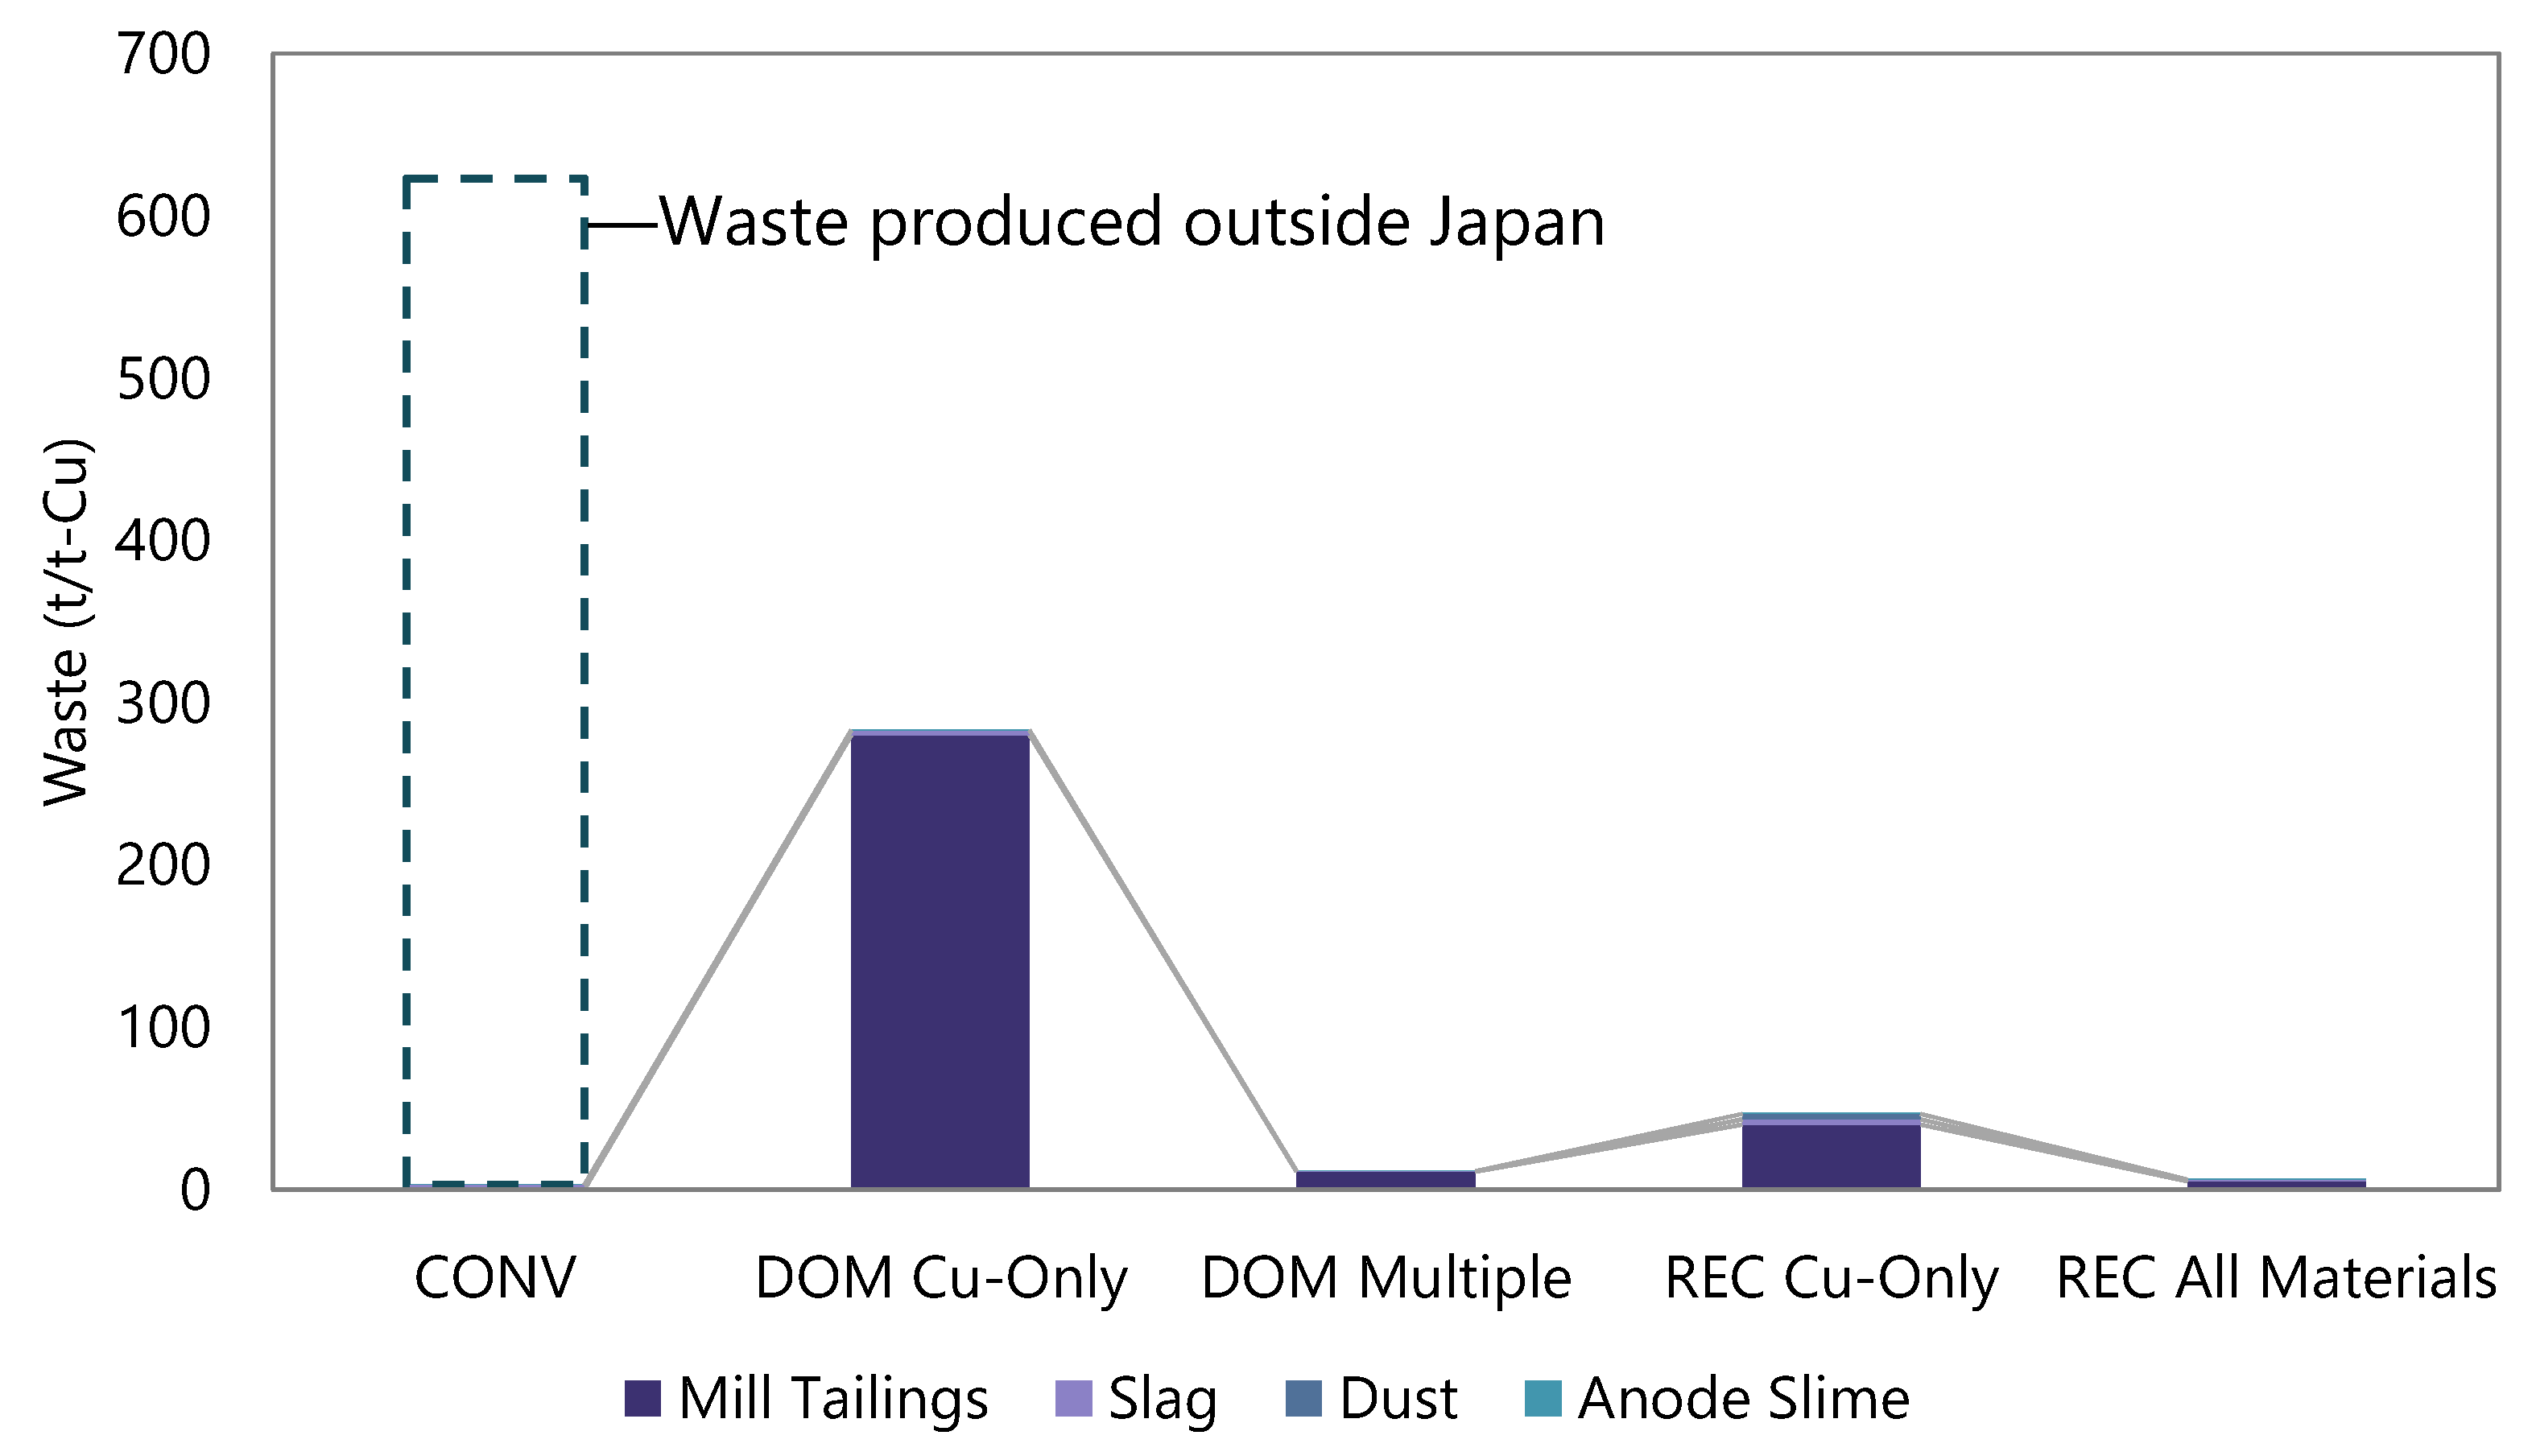
Figure 7 shows the waste from each option. Note that mill tailings or mine waste in resource exporting countries which is shown in the dotted line box does not count as waste in later analysis due to the focus on domestic environmental implications. In recycling, ‘mill tailings’ indicates non-copper materials as already mentioned. Waste from Cu-Only type deep ocean mining and recycling will be significant if materials excluding copper are dumped rather than valorised.
3.2. Optimal Solution of Resource Supply Strategy
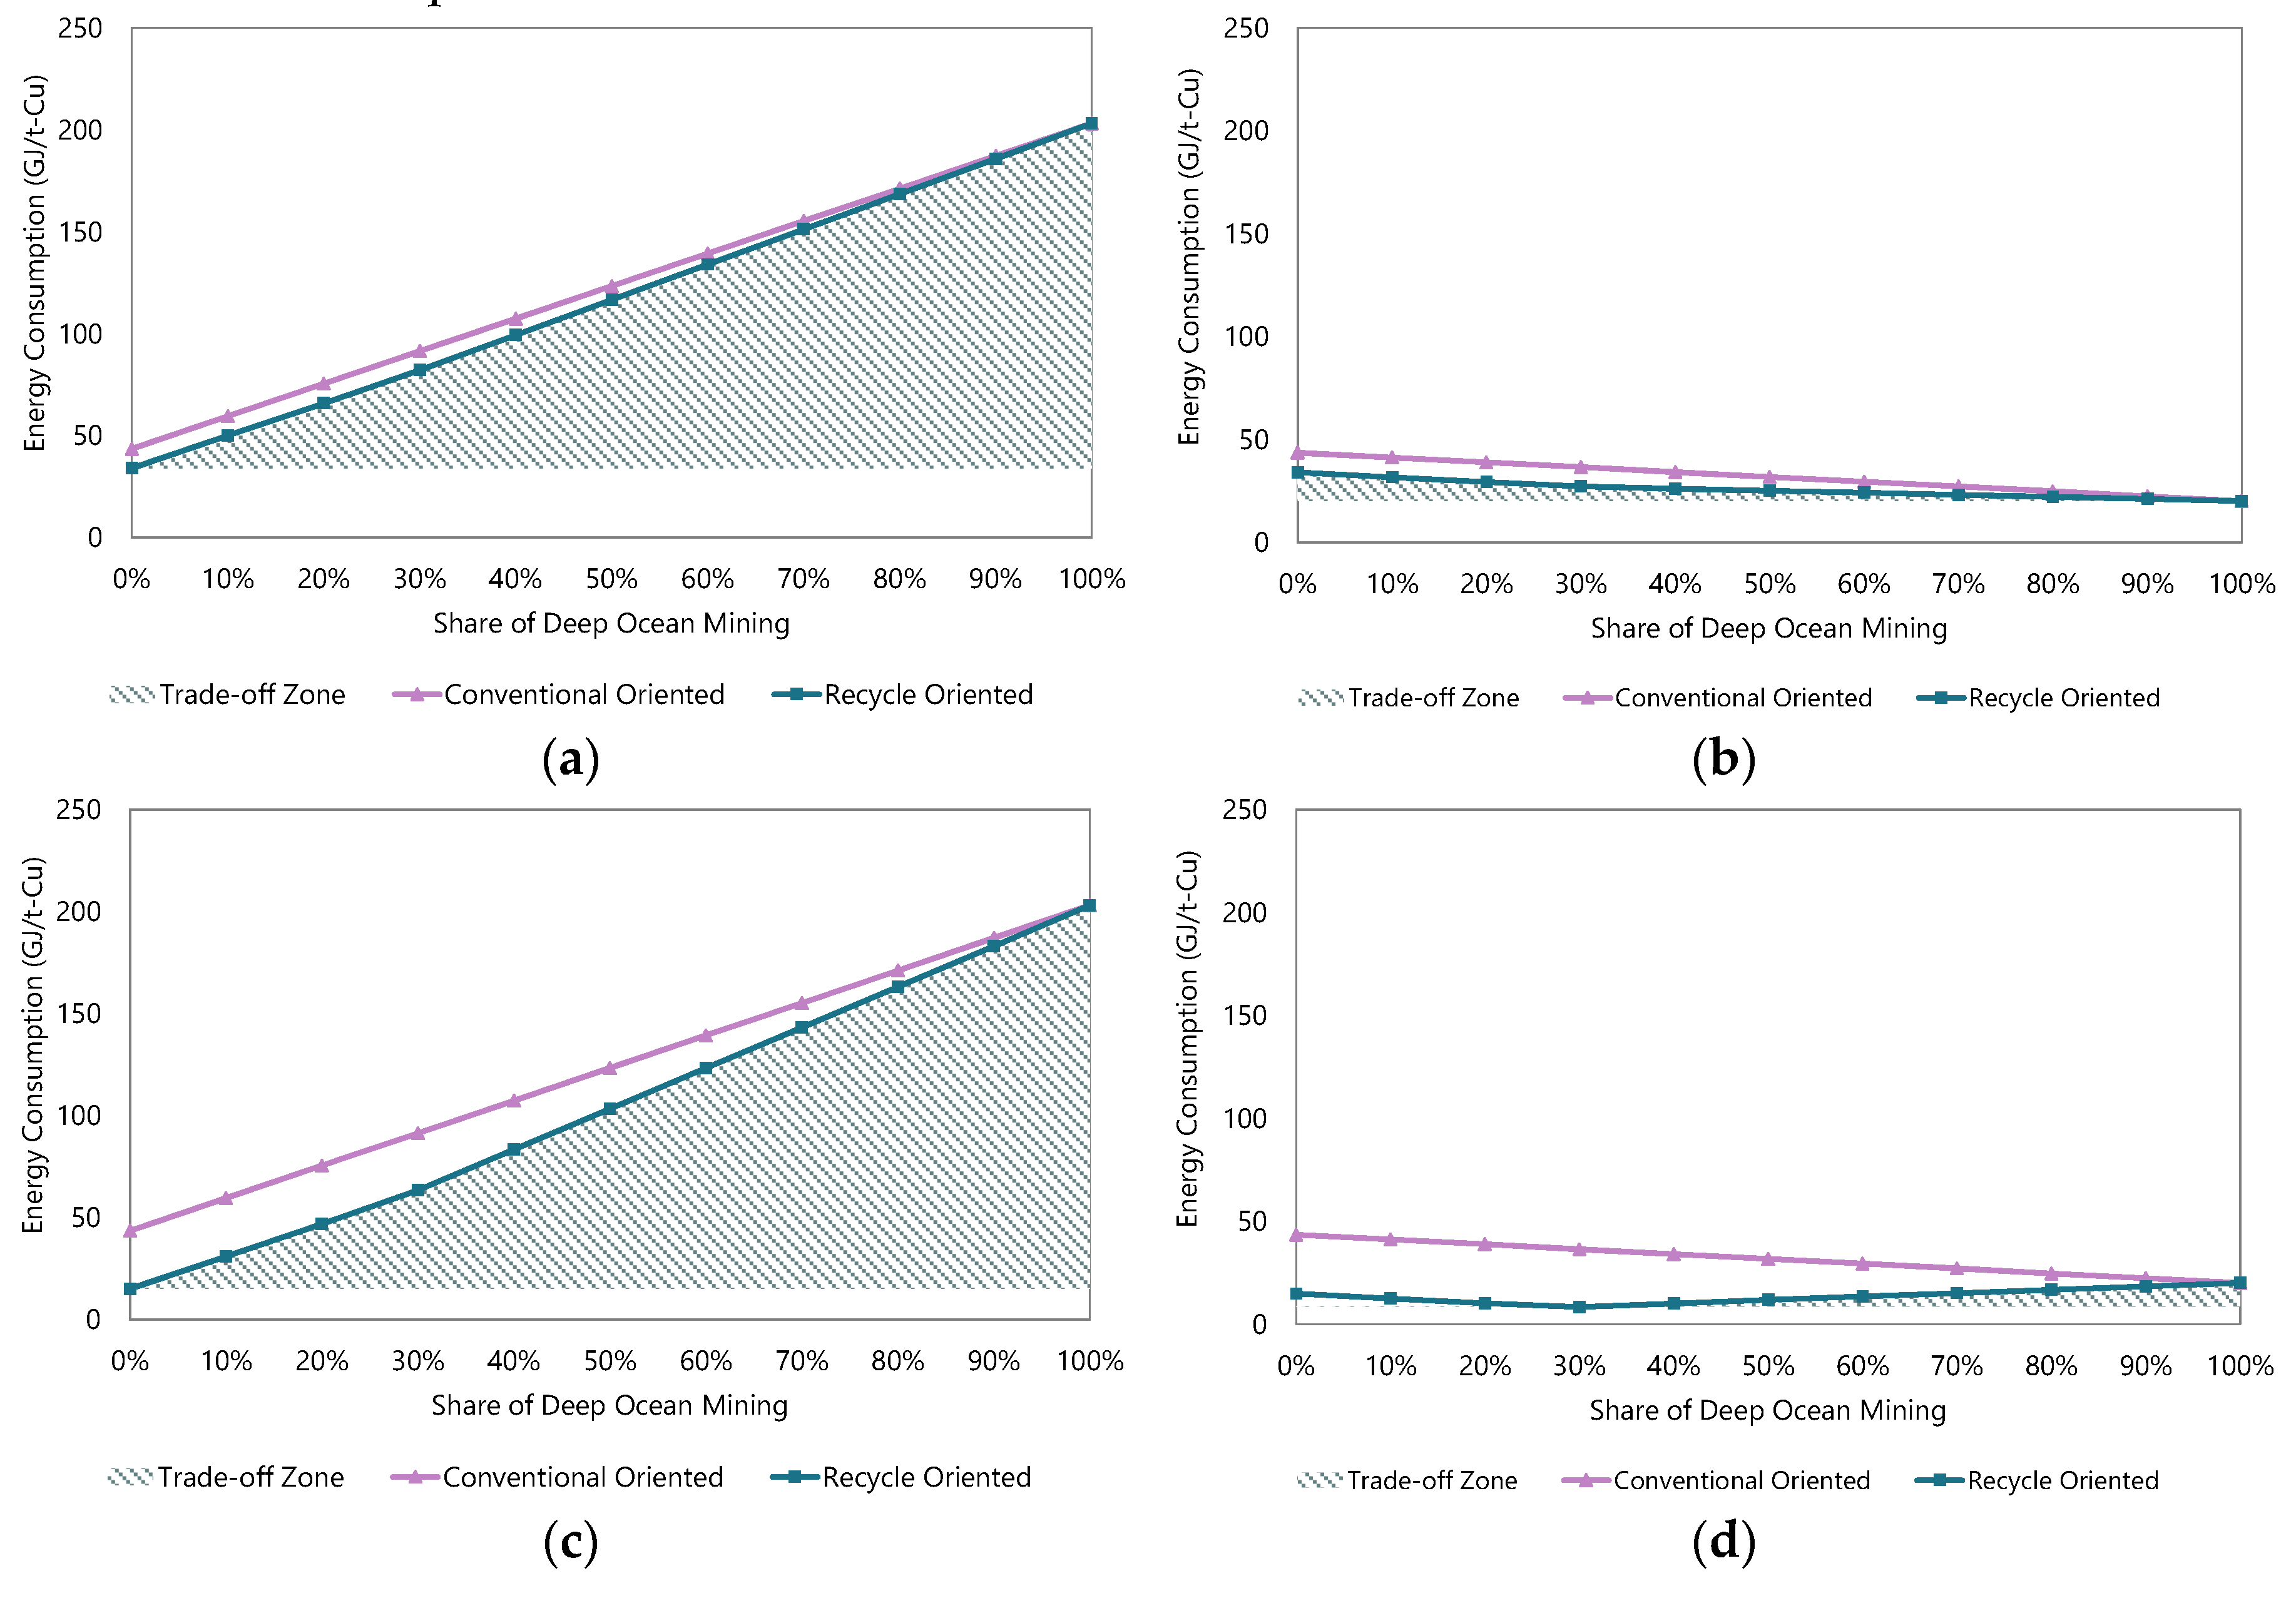
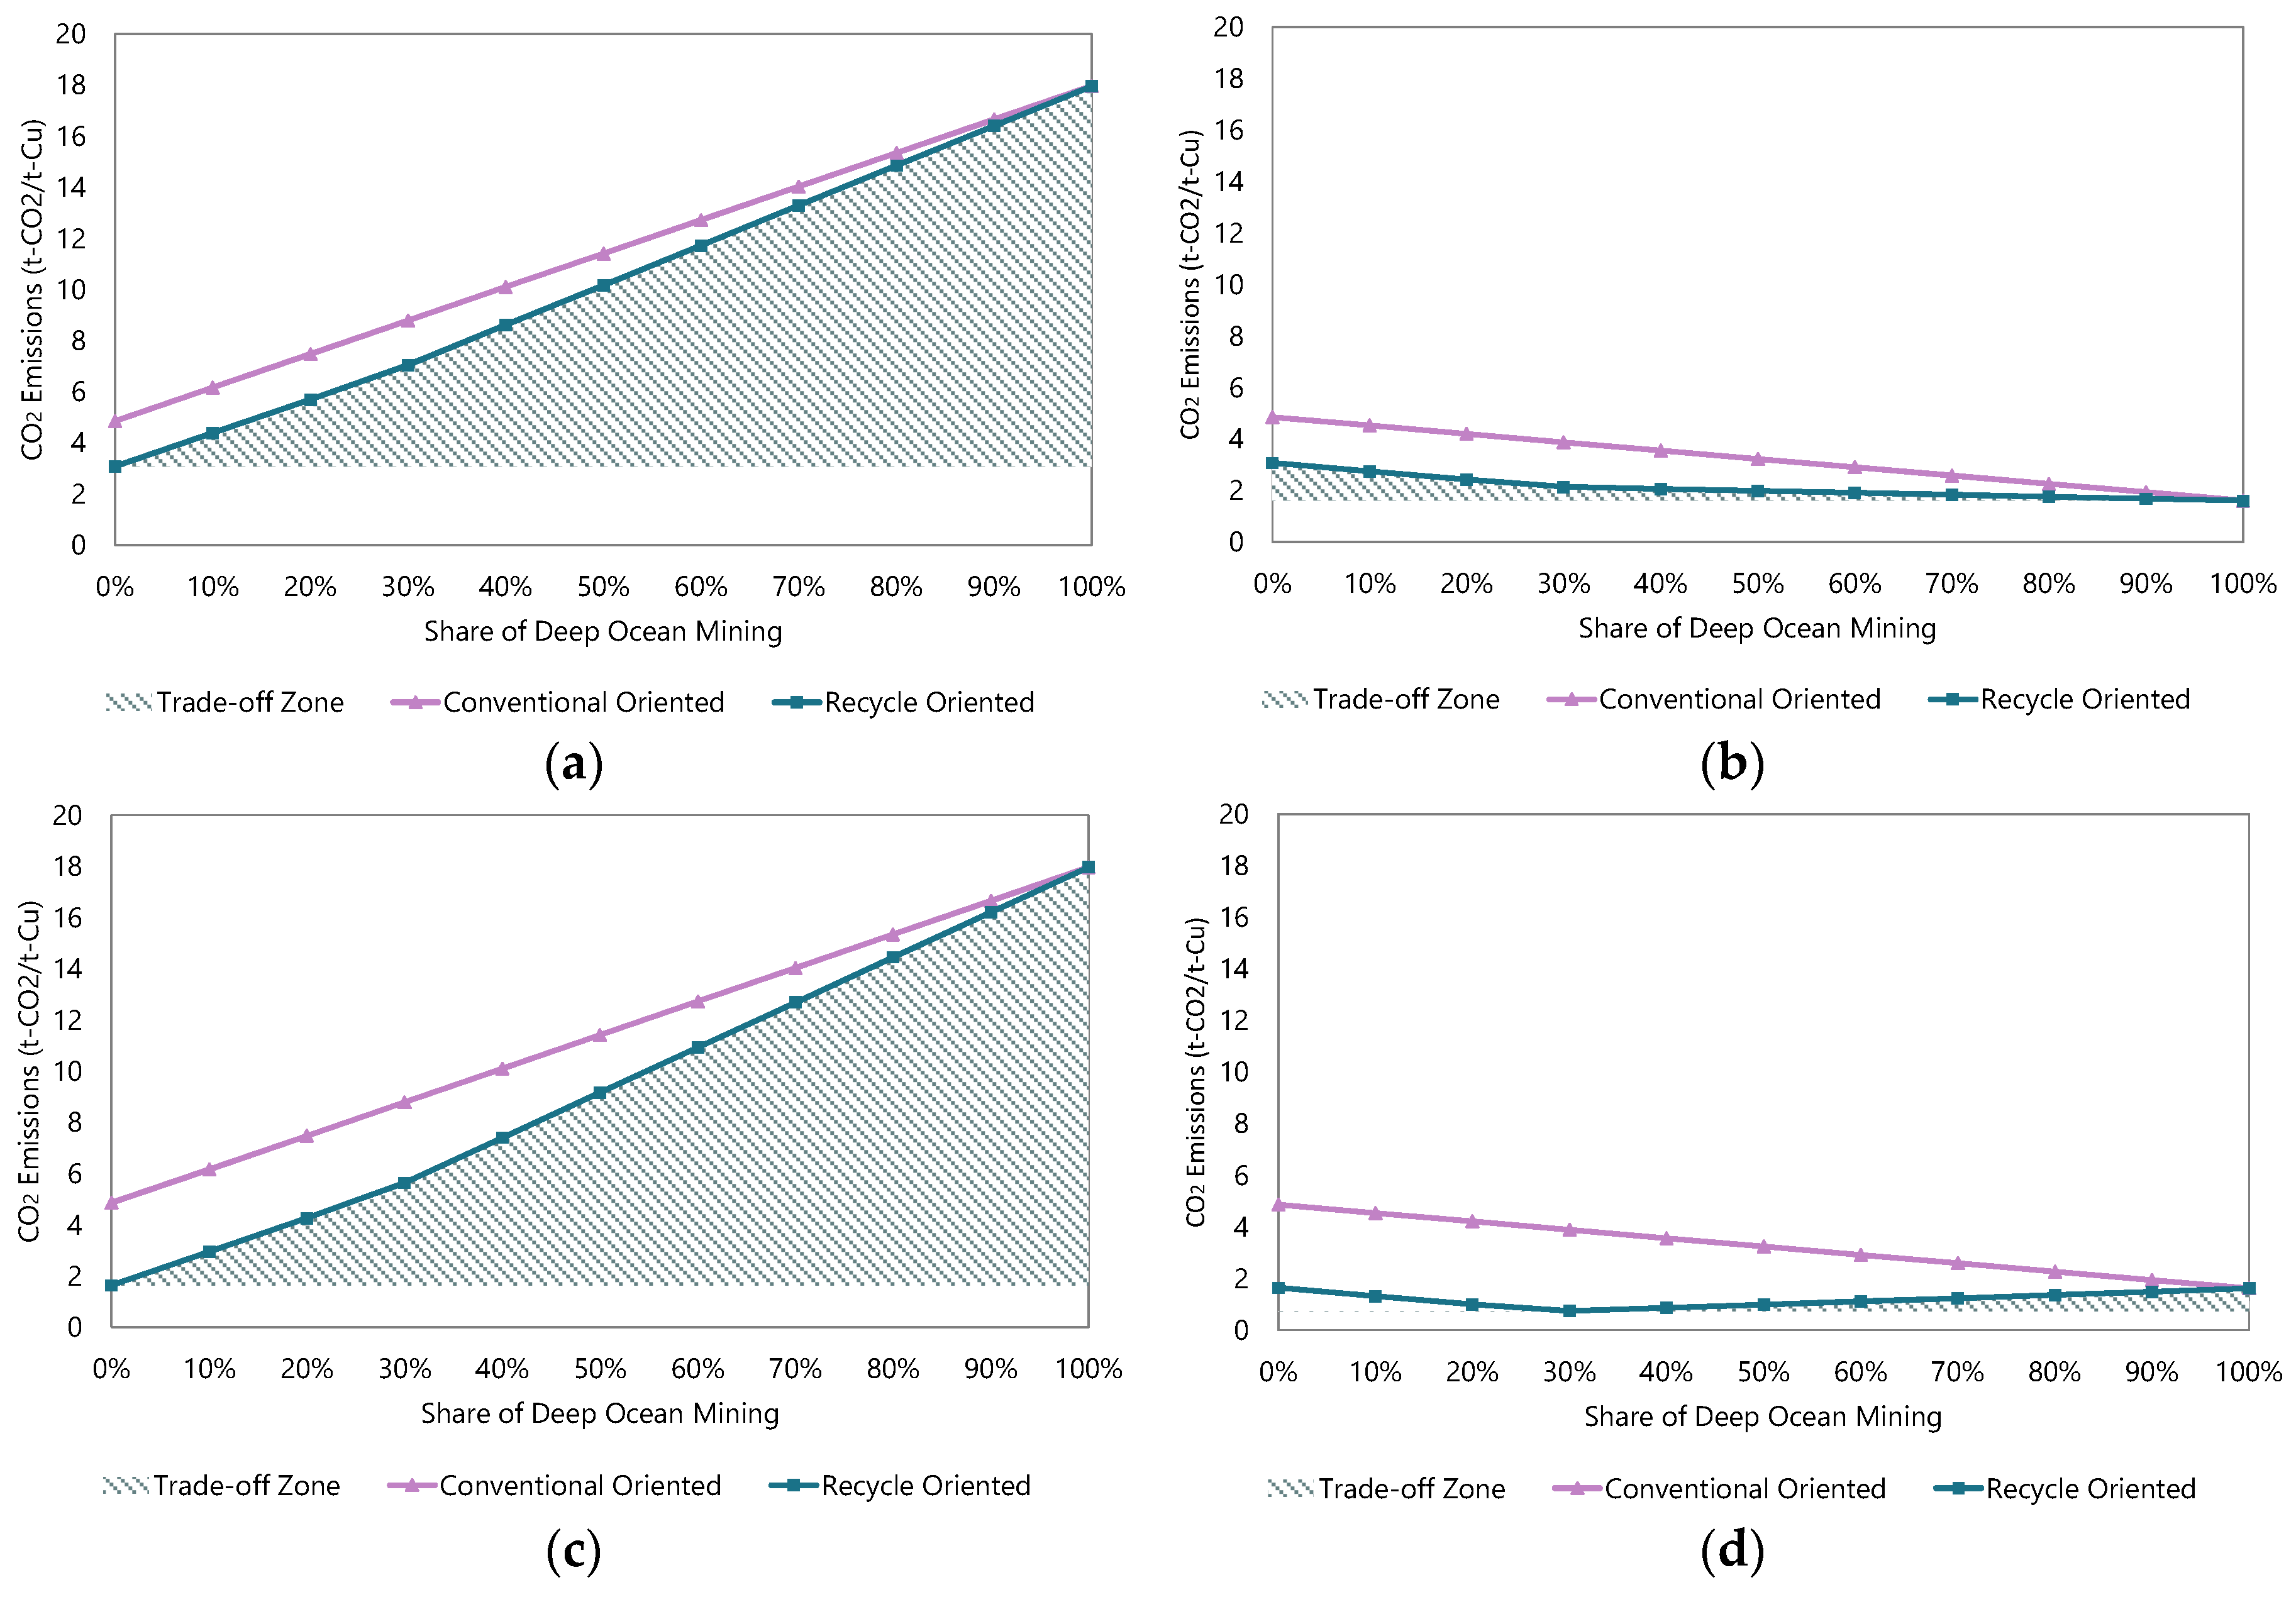
The currently considered SMS deposits in Japan are very limited when compared with the annual material demand for copper. The overall size of SMS deposits is reported as inferred mineral resources of 7.4 million tons [34]. However, it is possible that known resources may expand with further exploration. How energy consumption would change if deep ocean mining were able to supply a greater component of the material requirement is shown in Figure 8. ‘Conventional Oriented’ in the figures indicates that conventional copper supply is used to fill the gap between the production of copper from deep ocean mining and total consumption, while ‘Recycle Oriented’ is the case in which recycling is utilized as a priority up to the limits imposed by the use of copper in exported products which may not be recovered, so conventional copper processing also supplies raw materials in this case where necessary. The minimum amount of energy consumption in this figure can be considered as the optimal solution for domestic mineral production.
The meshed area in each of the graphs indicates the potential zone of choice in which Japan can choose alternative low energy mixes under energy restrictions—where there is potential excess supply capacity from recycling (the lowest energy option) that can be utilized to fulfil demand. In the cases where only copper is recovered (in Figure 8a,c), the minimum energy consumption point is at 0% of deep ocean mining. On the other hand, when multiple metals are recovered (in Figure 8b,d) less energy consumption occurs when deep ocean mining is in the mix. Recycle-oriented supply cannot meet domestic demand due to supply capacity restrictions (some demand is exported). Due to this, conventional processing, which is a higher energy consuming method, is introduced to fill the supply gap. When recycling and deep ocean mining can meet the total demand, the conventional supply is no longer needed. This result is largely due to the LCA approach to allocation, but it is likely that real reductions are present at the overall system level. The 30% deep ocean mining in case (d) consumes the least energy of the four options, and it can thus be said that this is the optimal solution for domestic mineral production in this study with regards to energy consumption. Due to the limits on the supply capacity from recycling, conventional copper processing which consumes more energy than REC All and DOM Multiple is introduced up until 30% production from deep ocean mining. From 30% of deep ocean mining onwards, conventional copper processing is not necessary to fill the demand and supply gap, so the lowest energy option of recycling can cover the remaining demand. For this reason, 30% deep ocean mining (in combination with 70% provision by recycling) can be considered as the optimal solution.
The results for CO2 emissions are shown in Figure 9, demonstrating, predictably, the same trends.
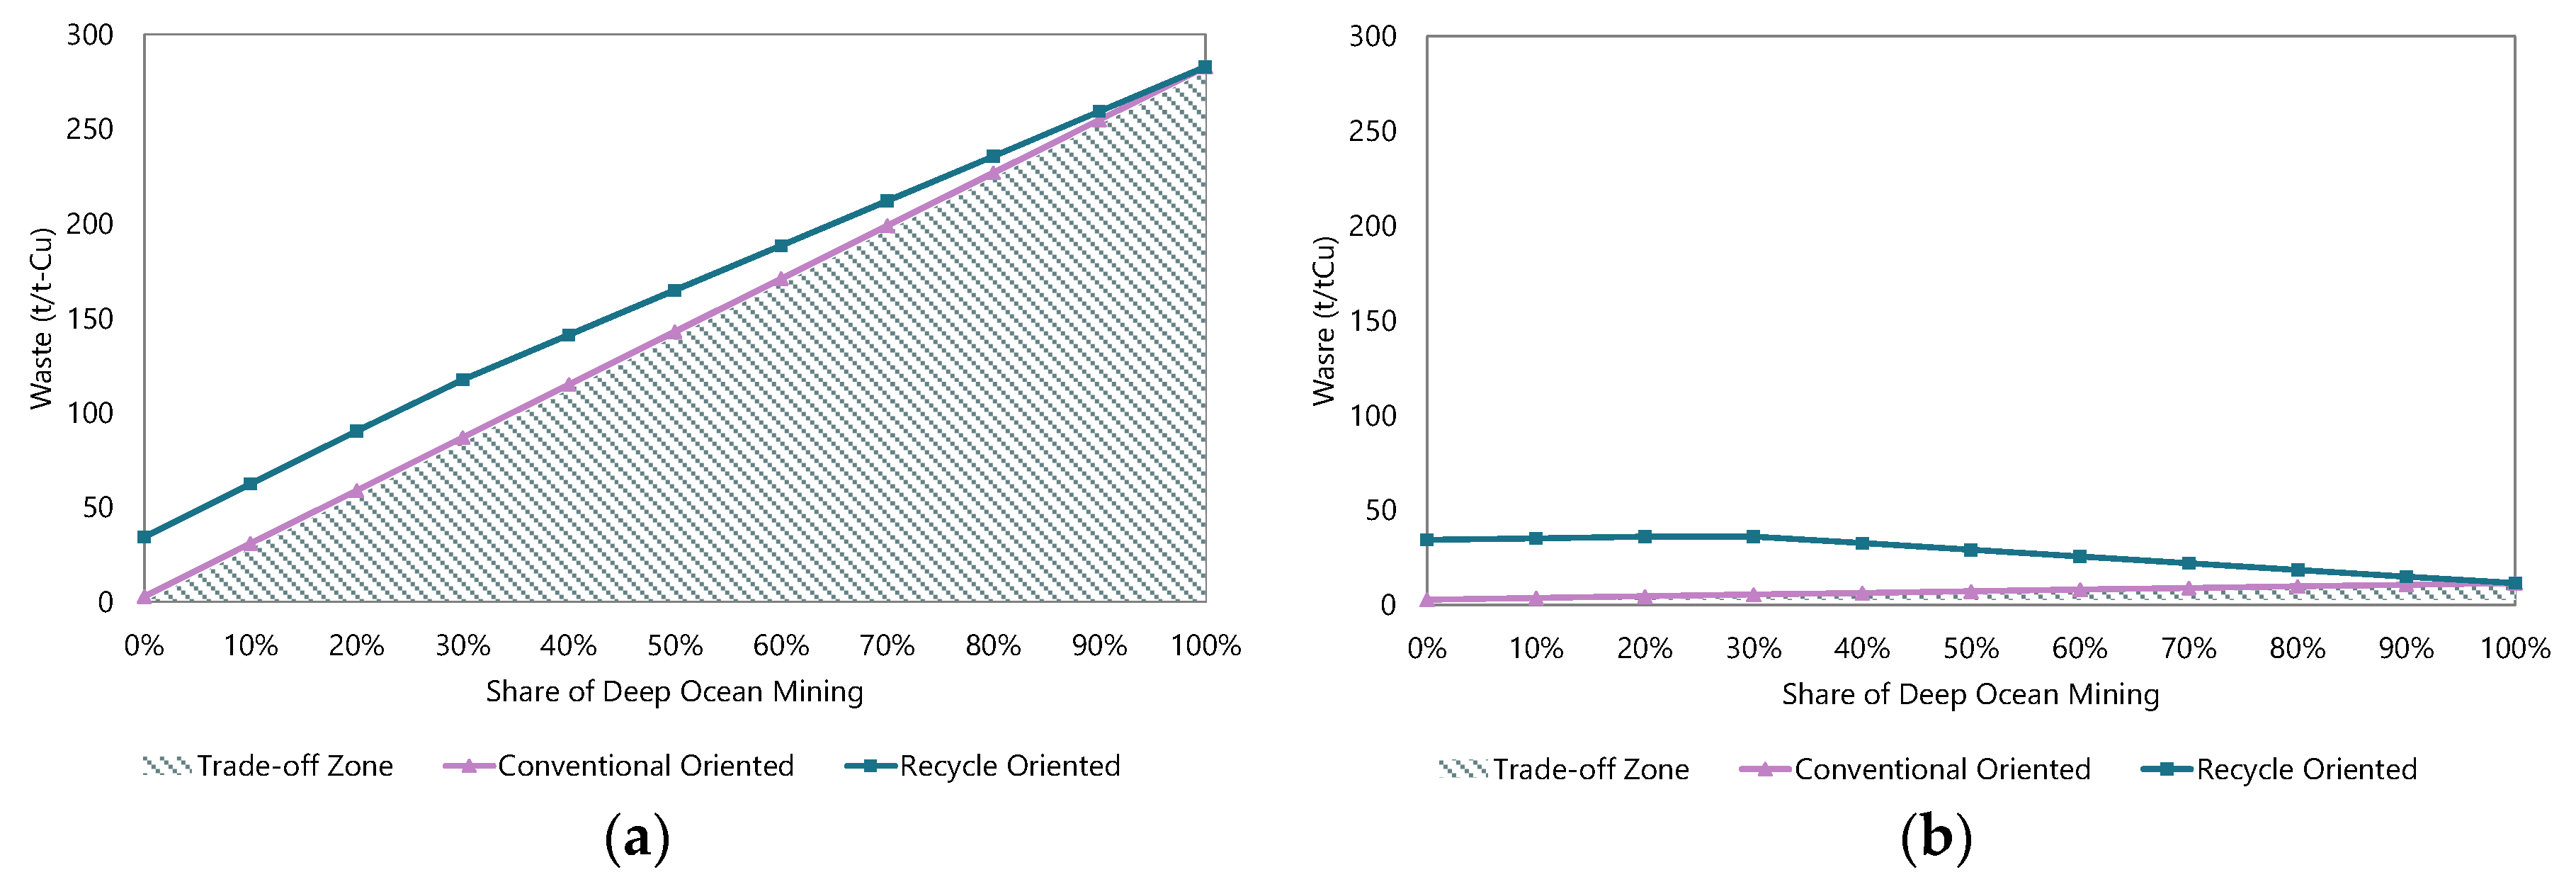
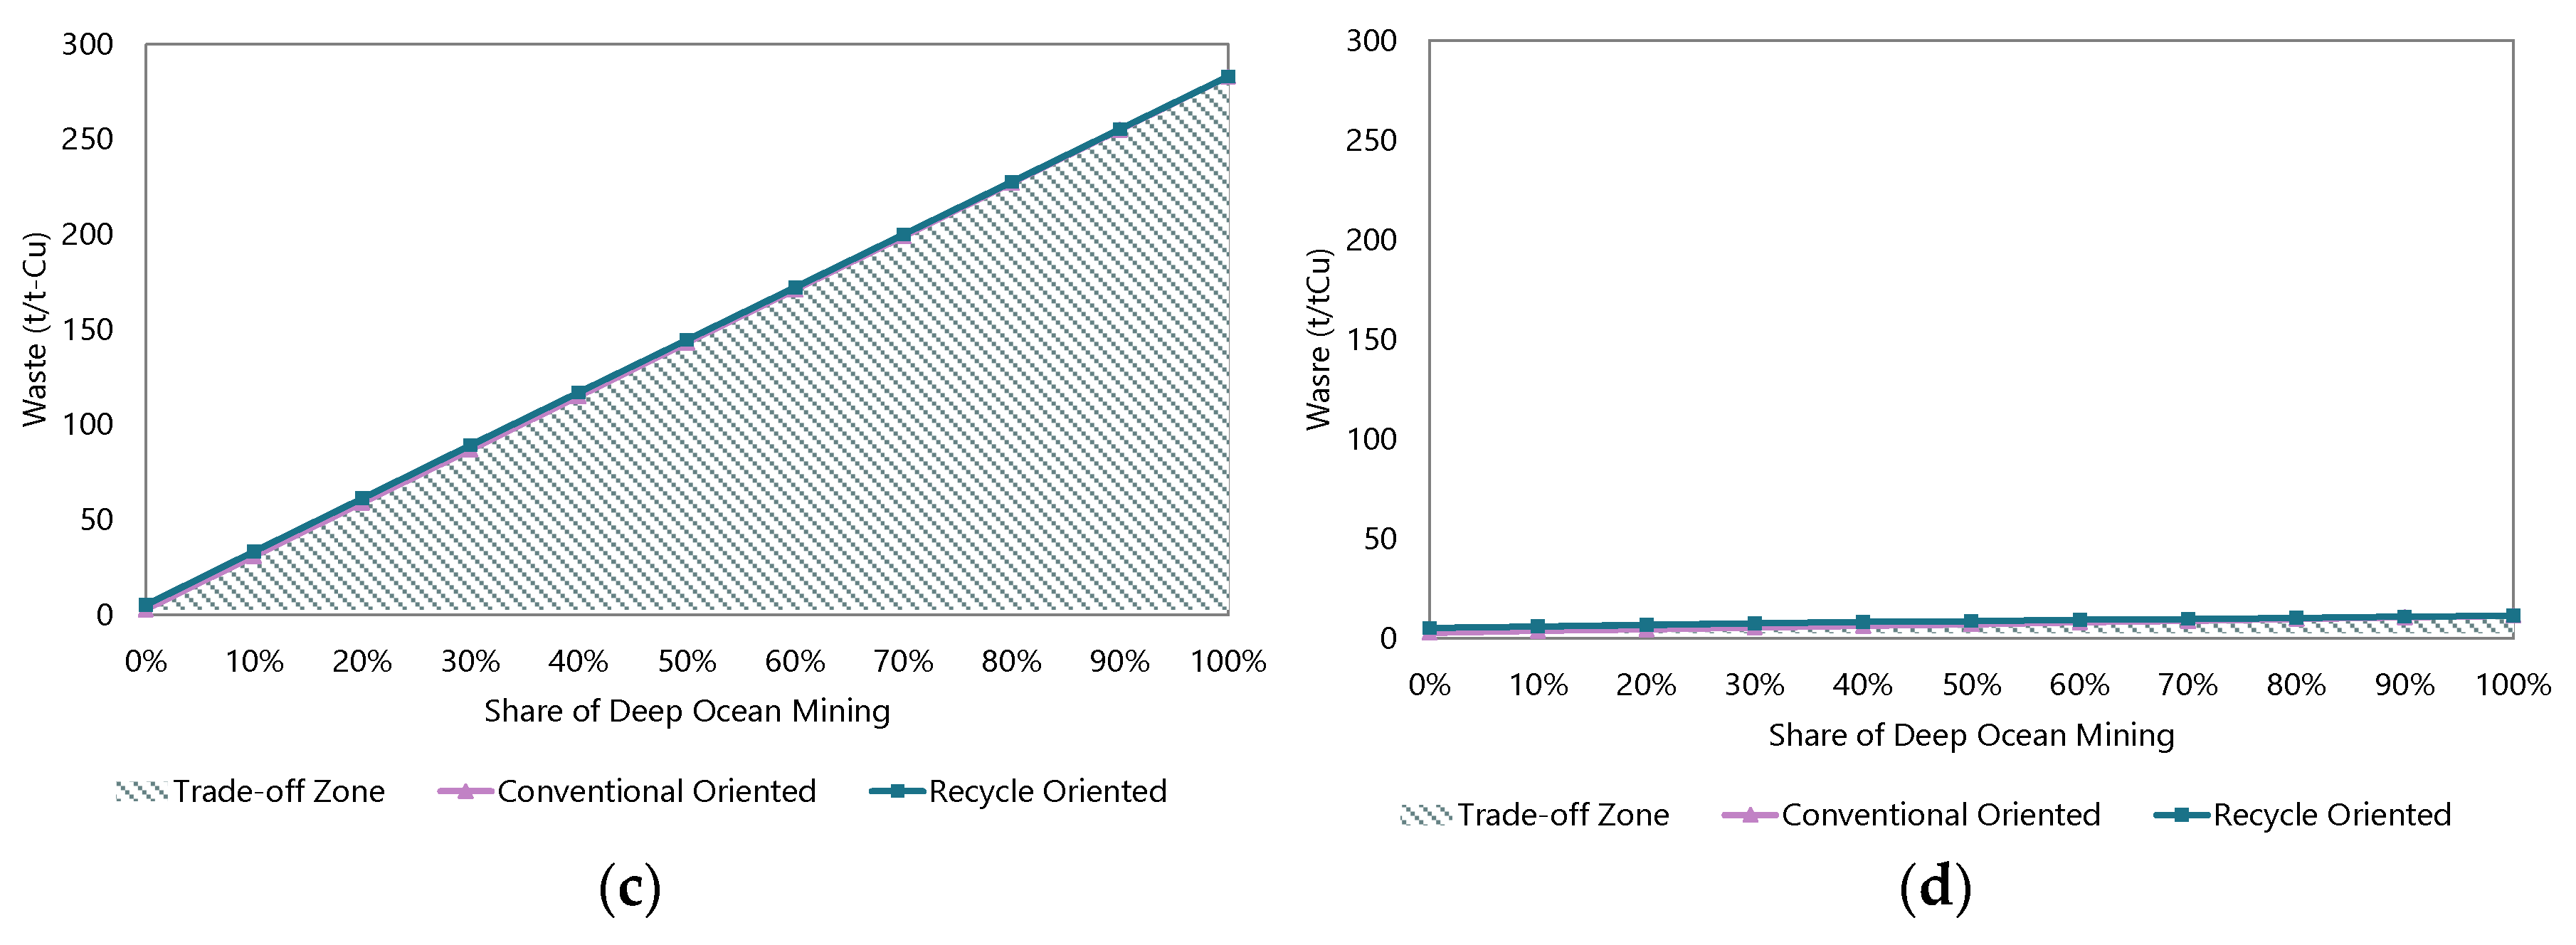
The trend for waste disposal is also similar to energy consumption, as Figure 10 shows. The trends for the Cu-Only recovery from DOM cases are similar to the previous two indicators, although the conventional-oriented and recycle-oriented curves have switched places since, when it comes to waste, conventional copper processing produces less waste domestically in Japan. The multiple metal recovery cases show different trends—in (b) which represents Cu-only recovery from recycling and multiple-metal recovery from deep ocean mining a large amount of waste is produced up until 30% deep ocean mining, which is driven by the amount of tailings from Cu-Only recycling.
3.3. Renewable Energy Installation
While considering the application of these technologies in the future, particularly in the context of national resource and energy security, the energy mix should also be discussed. Expanding the amount of renewable energy installed will affect the impacts from the mining sector—although there are limitations of renewable energy (denoted as RE from now on) usage. In this study, it is assumed that there are two steps to utilize renewable energy technology: the first is substituting conventionally produced electric energy to electric energy generated by renewables; the next is substituting fossil-fuel-based thermal energy to thermal energy generated by renewables. Table 7 shows which of the process stages are considered to have potential for conversion to renewables in the first step according to the utilized energy resources, with the substitution of thermal (T) and electrical (E) energy for the various processes in this study. Note that transportation in recycling originally uses oil products as a fuel but this is considered to be converted to electricity. This transition reflects recent expansion of electric vehicles, and their potential for greater utilization of RE [81,82]. Importantly, in the first step, not all shipboard energy use can be substituted for renewables—notably the long distance transport for conventional import of concentrate and the mining energy for DOM. This reflects the current reality, in which it is highly non-feasible for large boats to use alternative fuels. Table 8 shows the possibility of energy conversion in the second step. This step focuses on substituting oil for other resources. Transport in conventional processing and mining in deep ocean mining are assumed to utilize biofuel; transport in deep ocean mining is assumed to use electric vessels, which have batteries charged using wind power, due to its greater proximity to the shore. Table 9 shows emission factors in each technology.
RE is most readily utilized directly for electrical applications [87], while RE can also indirectly be converted to fuels (biofuel, hydrogen) which can be utilized in transportation or as thermal energy. This is relevant for understanding how much the results of emissions can be impacted by the energy mix. For example, the vessel for deep ocean mining does not have access to the electrical grid, and is likely to continue to use conventional fuels. Thus, it is assumed to be a non-RE process in the first step, with perhaps the only likely conversion being to the use of biofuel instead of oil. On the other hand, since conventional copper mines are land-based, it is easier for them to utilize RE. Based on this assumption, CO2 emissions can change significantly with increased RE and thereby shift the order of results. Biomass fuel is chosen as an applied technology for thermal energy, which has been previously estimated as having potential to mitigate up to 65% of CO2 emissions across the conventional minerals sectors [87]. Hydrogen could be another technology for consideration for thermal processes, but is not evaluated here, while solar and wind are the assumed renewable electricity technologies for other processes. Note that the smelting process in both recycling options already utilises electrical furnaces, so biofuel is assumed not to be required in this process.
The obtained results are shown in Figure 11. CO2 emissions from multiple metal recovery deep ocean mining are reduced by 54% while emissions from the conventional process are reduced by 28%.
3.4. Ore Grade Variation
Another element of the overall environmental impacts is the grade and complexity of mined ores. Generally, higher grade ore emits less waste during extraction and also affects energy consumption and CO2 emissions significantly. In this study, energy consumption in different ore grades is examined as a sensitivity analysis. Currently it is reported that ore grade in deep ocean hydrothermal ore is 0.4% [59]. When higher grade ore is developed, the energy consumption of deep ocean mining will change as shown in Figure 12 and Figure 13. This study examined copper ore grades of 0.75%, 1% and 1.5%, and energy consumption data for concentration are obtained from Marsden [88].
Energy consumption in concentration is reduced by 50% when ore grade becomes 1.5% compared to the base case, showing slightly less than direct proportionality. Higher grade ore does not need as much transport and separation as those of waste material, thereby requiring less energy to produce the same amount of product. CO2 emissions are also significantly reduced in higher grade ore extraction—especially in transportation.
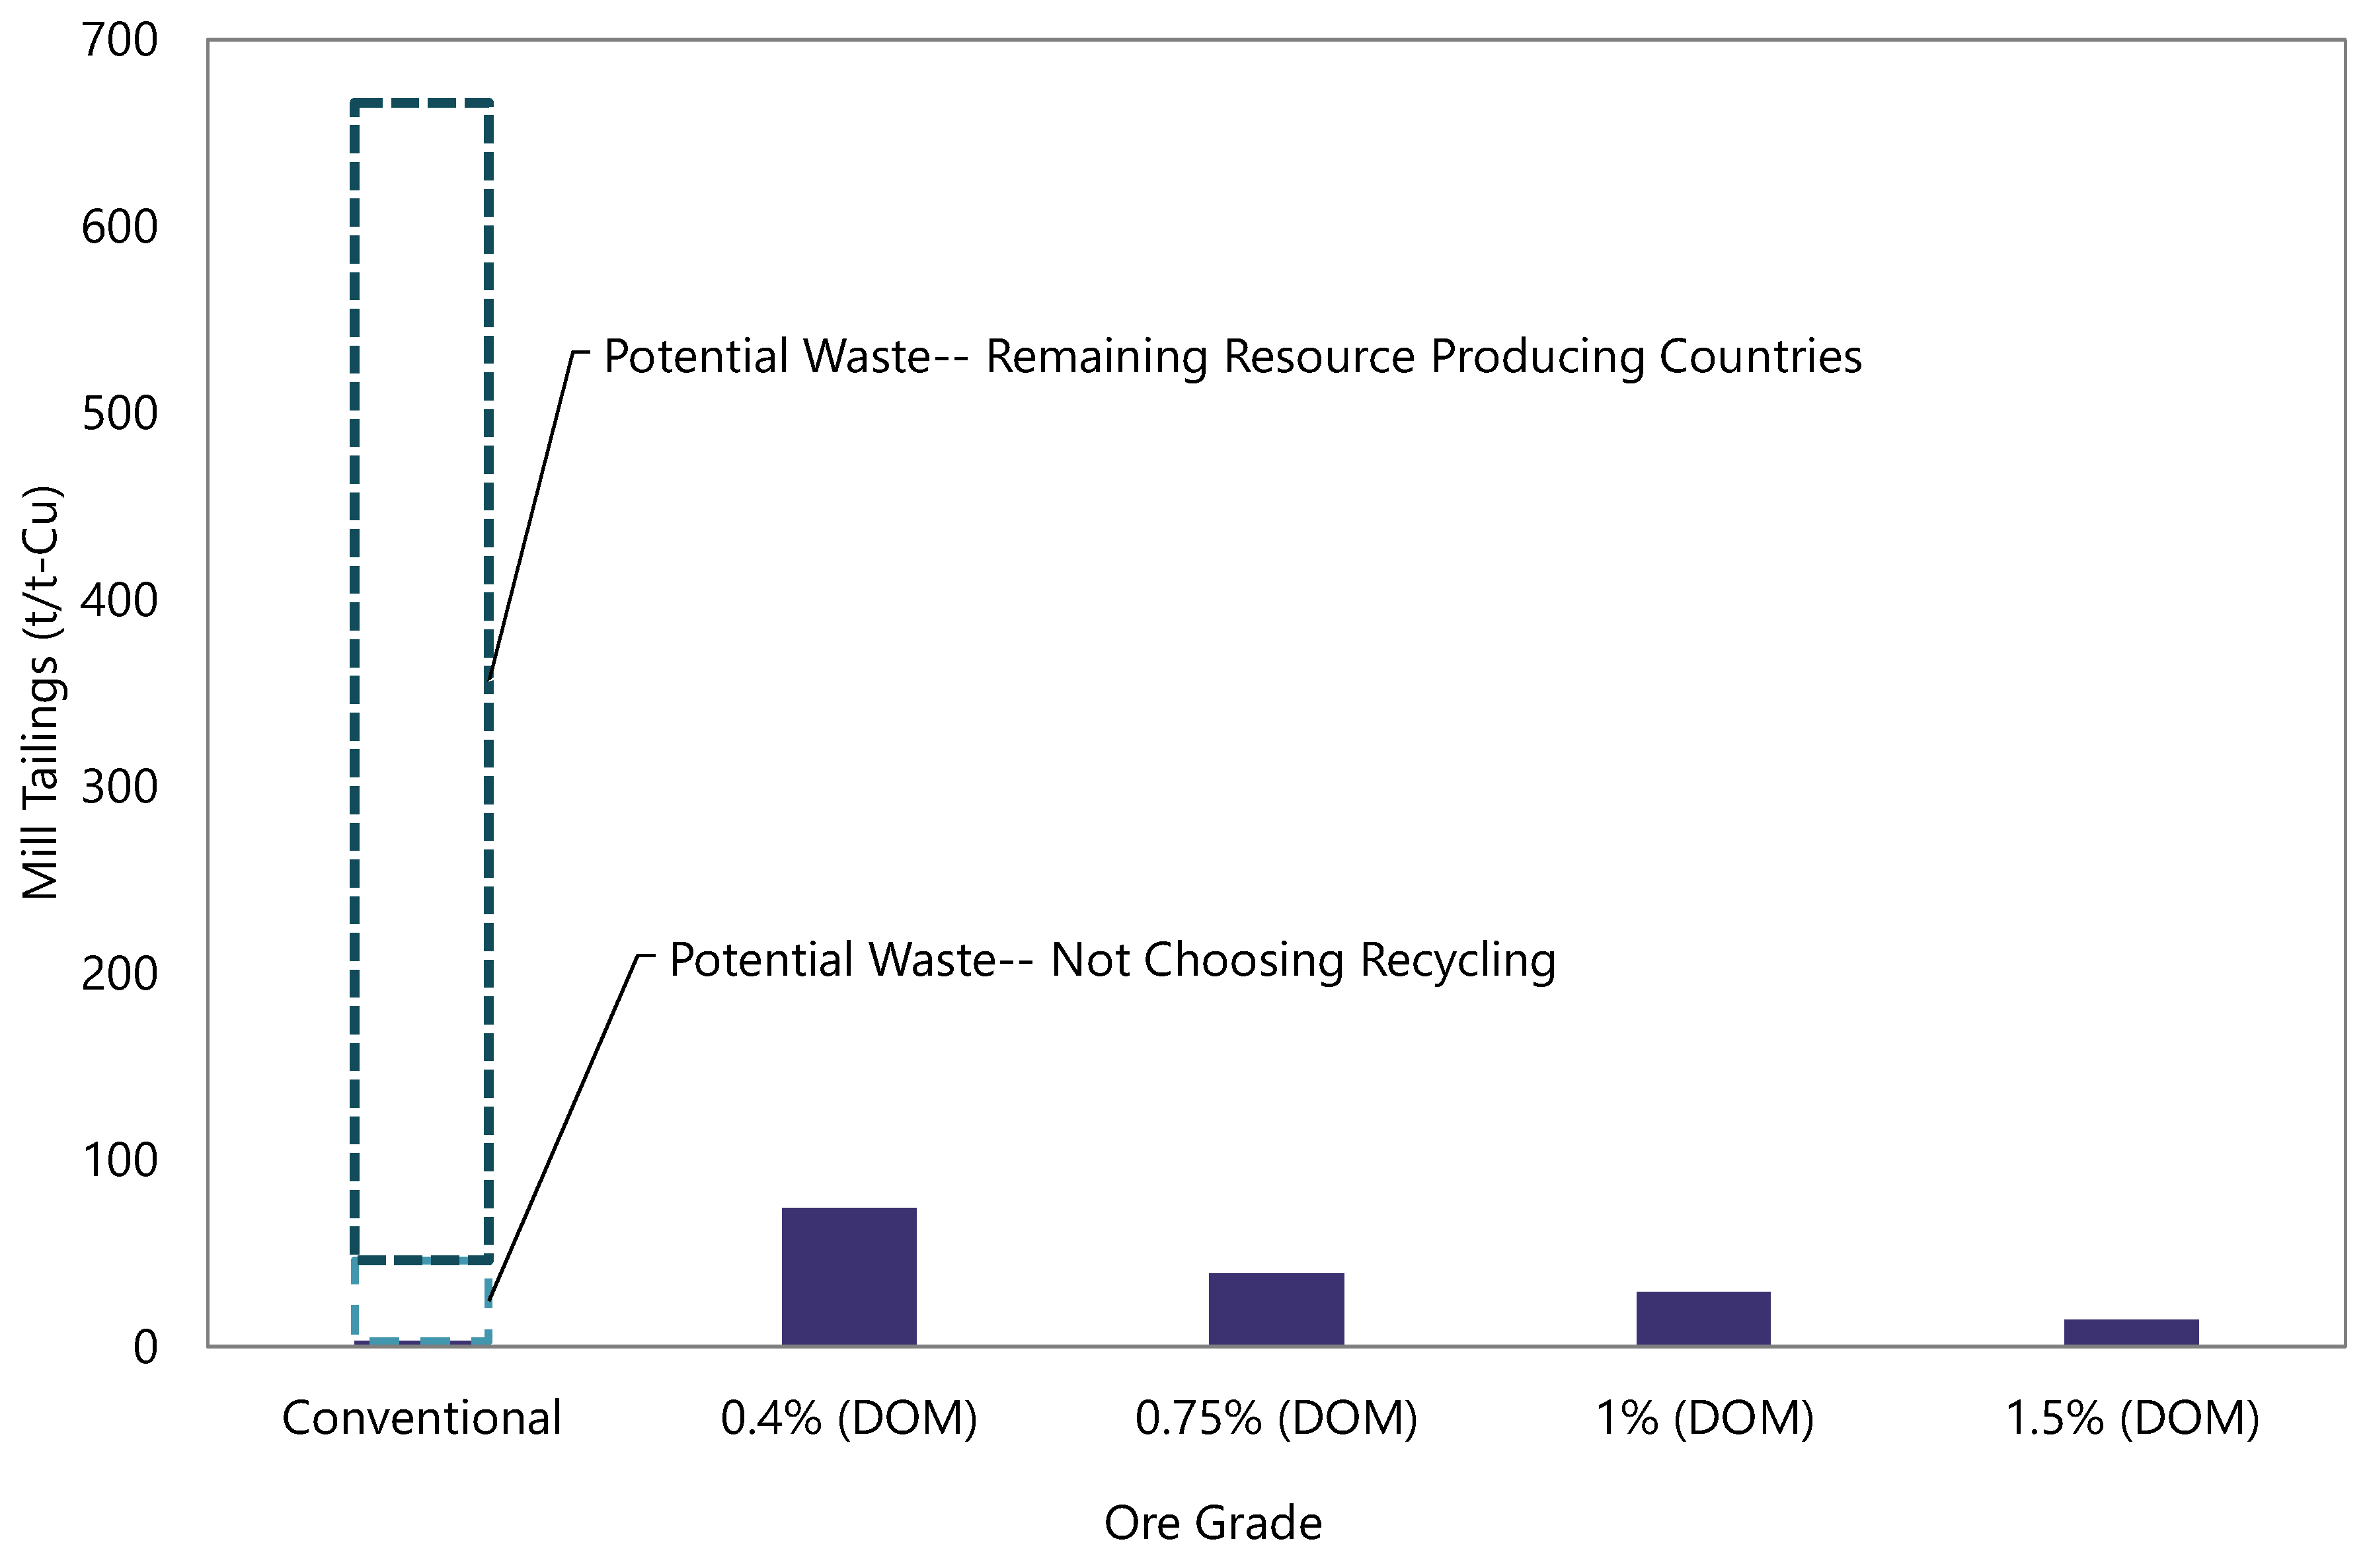
Figure 14 shows the change in mill tailings in higher grade ore extraction. The actual amount of mill tailings domestically produced would be expected to be higher in deep ocean mining even if higher grade ore is extracted; however, it should also be considered that if only conventional copper processing is undertaken, this implies that waste disposal at resource producing countries still remains and end-of-life products will not be recycled, leading to an increase in waste. Thus, from the whole system perspective, conventional copper processing potentially disposes more waste than deep ocean mining. Additionally, utilizing deep ocean mining to supply 30% of demand, with recycling contributing the rest, which is the optimal point in Figure 8, can maintain disposal levels as conventional copper processing without potential unrecycled waste.
3.5. Optimal Strategy Considering Resource Supply Capacity
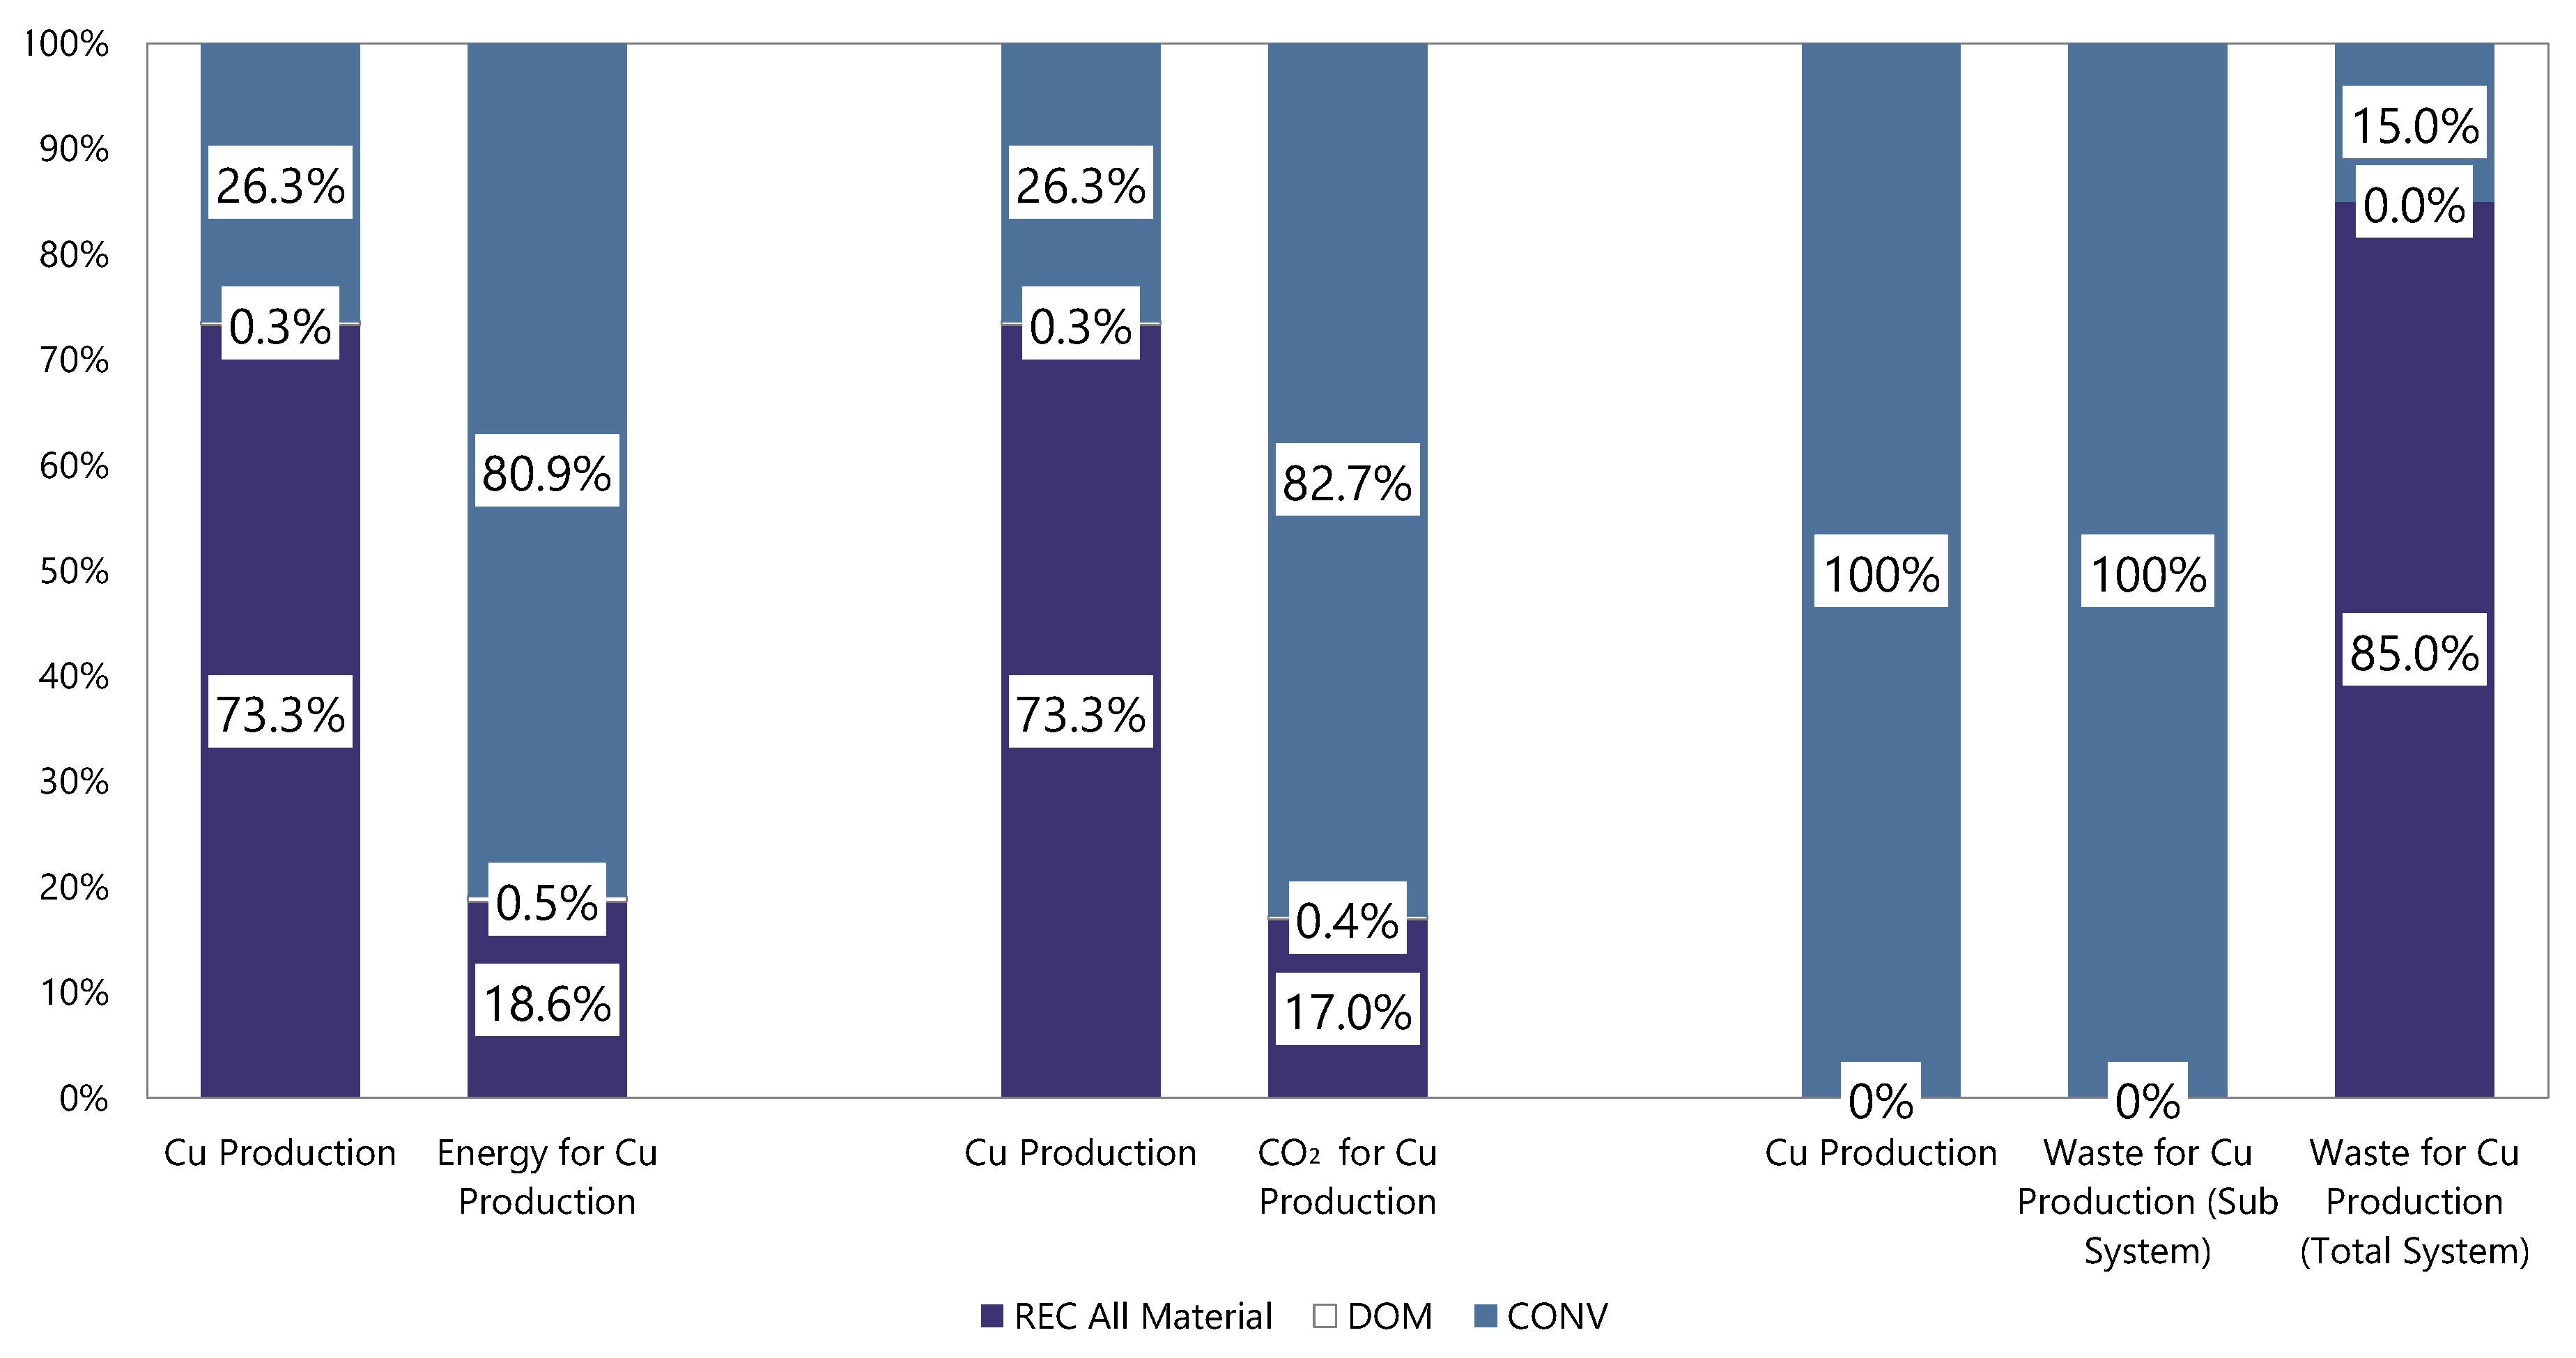
Energy consumption, CO2 emissions and waste disposal considering the practical supply capacity of raw materials in each strategy are shown in Figure 15. The results indicate the minimization of each impact by prioritizing the utilization of the minimum consumption/emission technology option based on production rate and limitation of raw material supply. Regarding waste, as discussed above, conventional copper processing disposes the smallest amount of waste and there is no practical limitation at this time. Thus, minimizing the waste results in 100% of raw material supply from conventional copper processing. However, examining the whole system, conventional copper processing includes approximately 40 t of waste due to not choosing end-of-life product recycling, which leads to recycling all material becoming the option producing the smallest amount of waste. The results indicate that prioritizing utilizing recycling material will result in the lowest energy consumption, CO2 emissions, and waste disposal.
Overall, from the results obtained this study it can be concluded that the greatest fraction of copper being supplied by recycling will best improve resource security, while simultaneously improving the environmental impacts of waste and emissions, and reducing energy usage. Waste disposal in the case of conventional copper processing itself is small domestically, but in the total copper supply chain, the indirect impact of waste produced in resource exporting countries and waste produced by end-of-life products not being recycled will occur. This waste problem can be a driver to promote recycling, and runs counter to utilizing imported concentrate. Installing deep ocean mining requires the disposal of a significant amount of waste; however, utilizing it with recycling for material supply will maintain the total domestic disposal level in line with conventional copper processing.
4. Discussion
Resource policy in resource importing countries has historically tended to focus on upstream development in resource producing countries and downstream improvements including research and development on substitute materials. Unconventional resources in the form of recycled materials have been focused on by some, but primary unconventional resources of deep ocean minerals remain beyond the practical scope of most resource security evaluation, due to the uncertainties in extractive economics. However, considering the uncertainty of resource supply in the future, relying on resource producing countries is not an optimal solution from the perspective of long-term resource security. In this context, domestic mineral production is an important alternative to consider for future supply.
Domestic mineral production in this study focused on deep ocean mining; however, there are other possible alternative resources for resource importing countries such as the reopening of mines that were previously closed due to ore grade decline, safety or economics under previous eras’ technology. It is possible that ore grades of closed mines may be higher than cut-off grades today, due to both the increase in prices and the improvement in technology. When countries whose resource policy previously changed from producing domestically to importing concentrate shift their policy again to restarting-mining, the issues of tailings, localized environmental impacts and energy consumption issues arise.
Since tailings, which possibly include harmful materials such as cadmium, arsenic or mercury, need to be stored in safe and stable environments and require long-term monitoring, this could be a significant issue to be traded-off against resource security benefits of domestic mining. The volume of tailings dams should be considered as well. Generally speaking, the lower the ore grade becomes, the more tailings are produced. When unconventional mining or redevelopment of closed mines occurs, ore grades are unlikely to be very high. Environmental impacts related to tailings storage need to be understood and evaluated. It should be noted that in the whole mineral supply chain, conventional processing produces more waste since deep ocean mining does not have waste rock. Because Japan does not import and process ore, waste rock and mill tailings from conventional mining become hidden waste streams. Considered from a global perspective, deep ocean mining may contribute to reduce waste from the mining process. Other solid wastes such as plastics or other minerals are not explicitly discussed in this study; however, how to deal with this kind of waste should also be considered—particularly when polymetallic ores or mingled recycling streams are considered. It is estimated that recycling will practically produce less waste than shown here, since this study does not consider recovery from waste except copper.
Energy consumption is another issue to be discussed. The results show that the conventional copper process consumes more energy than recycling or multiple metal recovery from deep ocean mining, when considering the whole supply chain. A key factor for developing a competitive strategy in terms of energy consumption is multiple metal production from either deep ocean mining or recycling. As shown in Figure 5, from the environmental perspective, only producing copper from deep ocean mining will never be a competitive option for domestic mineral production, but co-production with other metals from the polymetallic ores (e.g., zinc, lead, gold and silver) will not only reduce energy consumption allocated to each metal in mining, but also improve resource security. Energy consumption in resource importing countries includes transportation, smelting and refining, though roughly as much energy is consumed in resource exporting countries. As for recycling, since China will stop importing copper scrap by the end of 2018 [40], the necessity for copper scrap recycling in domestic facilities will increase in Japan. Japan has long been struggling to secure its energy supply—especially after the nuclear power plant shut down in 2011. As recycling is further improved, Japan has to find alternative, secure energy resources to maintain its mineral production, along with the remainder of its economy. Japan has been trying to reduce energy demand for a long time, and while promoting mineral recycling may result in energy consumption decrease, and continue Japan’s declining energy demand trend, deep ocean mining would impact adversely on energy consumption. On the other hand, even if recycling were to become a dominant raw material supply stream, it still consumes imported energy. Renewable energy technology installation is therefore one of the requirements to achieve a more resource-secure society.
By minimizing energy consumption, CO2 emissions and waste disposal based on the capacity limitations of each supply source, it is indicated that installing processes that recover all materials from recycling on a priority basis will reduce these impacts significantly. If large-scale deep ocean mining extraction is conducted, it is obvious that this type of material supply can improve resource security significantly. However, as shown in the results, the optimal solution found in this study was utilizing deep ocean mining at a level of 30% of raw material supply if all metals are recovered from the ore, with the rest of demand filled by recycling. Even though there are some challenges, such as how to find more deep ocean hydrothermal ore (particularly higher grade ore), it can be said that realizing domestic mineral production could help to achieve stable resource supply for Japan.
It can be concluded that: (1) domestic mineral production is one option to obtain resources so as to avoid vulnerability of external affairs. Supply controllability of domestic mineral production should be a key factor in evaluating the sustainability of supply; and (2), based on supply capacity, enterprises, installing recycling will improve resource security while also enabling better performance in terms of energy consumption, CO2 emissions and waste disposal. Considered within the framework of criticality, the combination of pressures from increasing demand globally with potential lags in primary supply could promote domestic mineral production. On the other hand, domestic production environmental implications could work to restrict their output or development, increasing the mineral criticality. For countries considering such options for reducing supply risk, the environmental considerations should also be factored in.
5. Conclusions
The main objective of this paper is to examine alternative resource supply strategies for Japan and their environmental impacts, in order to consider the implications of resource security approaches for critical minerals. Evaluating the extraction of copper (a critical mineral for Japan), especially including shifts further upstream in the supply chain in order to provide resource security in a resource importing country like Japan, and the environmental implications of resource security strategies is considered to be a point of novelty of this study. The key result of this study is that expansion of recycling to the largest extent possible is indicated to be the optimal option to improve resource security, while also enabling better performance in terms of energy consumption, CO2 emissions and waste disposal. The aspect of waste disposal may be a critical barrier for deep ocean mining in a country like Japan that is highly seismically active and has minimal available space for storing tailings.
Future supply of critical minerals is subject to various uncertainties, such as demand increase in developing countries or environmental regulations. This study focuses on domestic mineral production as a means of reducing vulnerability to import restrictions resulting from this kind of supply risk. The results show that deep ocean mining processes consume more energy than conventional copper processing, when only the production of copper is considered, and when only the domestic components of energy are taken into account. When recycling copper from end-of-life home appliances is conducted with the effective valorization of all materials, energy consumption and CO2 emissions are significantly lower than the other options examined in this study.
The optimal mix of domestic production regarding energy consumption and CO2 emissions will rely on 70% supply from recycling with deep ocean mining and co-production of all valuable metals making up as much as possible of the remainder, and conventional copper processing the remainder based on current production capacity. When recycling of all the materials is conducted, waste disposal from domestic mineral production is the same as introducing conventional copper processing if no waste is consequently recycled. Large-scale ore or higher grade ore extraction will change the priority of raw material supply of conventional copper processing but the optimum still remains at 30% deep ocean ore in terms of energy consumption and CO2 emissions.
Application of renewable energy is one solution to realize domestic mineral production in a way that also promotes energy security and reduces CO2 emissions. However, by maximizing deep ocean mining, there will be a consequent increase in solid waste unless conducting higher grade ore extraction.
Author Contributions
This article is elaborated with data gathered by R.M., under supervision of B.C.M. and T.T. All the authors have contributed to the writing and revision process of this paper.
Funding
This research received no external funding.
Conflicts of Interest
The authors declare no conflict of interest.
Appendix A
Figure A1.
Smelters and Retailers in Japan.


Table A1.
Step-by-Step Energy Consumption.
| Energy | CONV | DOM Cu-Only | DOM Multiple | REC Cu-Only | REC All Materials |
|---|---|---|---|---|---|
| Mining | 15,500 | 132,100 | 7000 | 0 | 0 |
| Transport | 2300 | 12,500 | 700 | 14,600 | 600 |
| Beneficiation | 16,000 | 48,700 | 2600 | 3100 | 400 |
| Smelting | 8700 | 8700 | 8700 | 11,400 | 1500 |
| Refining | 1100 | 1100 | 1100 | 1100 | 1100 |
| 43,600 | 203,100 | 20,100 | 30,200 | 3600 |
References
- Rosenau-Tornow, D.; Buchholz, P.; Riemann, A.; Wagner, M. Assessing the long-term supply risks for mineral raw materials—A combined evaluation of past and future trends. Resour. Policy 2009, 34, 161–175. [Google Scholar] [CrossRef]
- JOGMEC. Kobutsu Shigen Materiaru Furo 2017 [Mineral Resources Material Flow 2017]; JOGMEC: Tokyo, Japan, 2017; pp. 1–15.
- Government of Japan. Strategic Energy Plan 2018; Government of Japan: Tokyo, Japan, 2018; pp. 1–105.
- Lusty, P.A.J.; Gunn, A.G. Challenges to global mineral resource security and options for future supply. Geol. Soc. Lond. Spec. Publ. 2015, 393, 265–276. [Google Scholar] [CrossRef]
- Gunn, G.; Bloodworth, A. Briefing: Minerals security of supply: A geological perspective. Proc. ICE Waste Resour. Manag. 2012, 165, 171–173. [Google Scholar] [CrossRef]
- De Ridder, M. The Geopolitics of Mineral Resources for Renewable Energy Technologies; The Hague Centre for Strategic Studies: The Hague, The Netherlands, 2013. [Google Scholar]
- Bradsher, K. Amid Tension, China Blocks Vital Exports to Japan. New York Times, 22 September 2010. [Google Scholar]
- Honda Motor. Honda to Reuse Rare Earth Metals Contained in Used Parts. Available online: https://world.honda.com/news/2012/c120417eng.html (accessed on 10 November 2018).
- Hitachi. Highly Efficient Industrial 11 kW Permanent Magnet Synchronous Motor without Rare-Earth Metals. Available online: http://www.hitachi.com/New/cnews/120411.pdf (accessed on 10 November 2018).
- Prior, T.; Giurco, D.; Mudd, G.; Mason, L.; Behrisch, J. Resource depletion, peak minerals and the implications for sustainable resource management. Glob. Environ. Chang. 2012, 22, 577–587. [Google Scholar] [CrossRef]
- Pearce, T.D.; Ford, J.D.; Prno, J.; Duerden, F.; Pittman, J.; Beaumier, M.; Berrang-Ford, L.; Smit, B. Climate change and mining in Canada. Mitig. Adapt. Strat. Glob. Chang. 2011, 16, 347–368. [Google Scholar] [CrossRef]
- Bremmer, I.; Johnston, R. The rise and fall of resource nationalism. Survival 2009, 51, 149–158. [Google Scholar] [CrossRef]
- Warburton, E. Resource Nationalism in Post-Boom Indonesia: The New Normal? Lowy Institute: Sydney, Australia, 2017. [Google Scholar]
- Halada, K.; Shimada, M.; Ijima, K. Forecasting of the Consumption of Metals up to 2050. Mater. Trans. 2008, 49, 402–410. [Google Scholar] [CrossRef] [Green Version]
- United Nations Environment Programme. Global Mercury Supply, Trade and Demand; United Nations Environment Programme: Nairobi, Kenya, 2017; ISBN 978-92-807-3665-6. [Google Scholar]
- Virta, R.L. Mineral Commodity Profiles—Asbestos; US Geological Survey: Reston, VA, USA, 2005.
- Rankin, W.J. Minerals, Metals and Sustainability; CSIRO Publishing: Clayton, Australia, 2011; ISBN 9780643097278. [Google Scholar]
- Prior, T.; Daly, J.; Mason, L.; Giurco, D. Resourcing the future: Using foresight in resource governance. Geoforum 2013, 44, 316–328. [Google Scholar] [CrossRef]
- Elshkaki, A.; Graedel, T.E.; Ciacci, L.; Reck, B. Copper demand, supply, and associated energy use to 2050. Glob. Environ. Chang. 2016, 39, 305–315. [Google Scholar] [CrossRef]
- USGS. 2010 Minerals Yearbook; USGS: Reston, VA, USA, 2011; ISBN 2007091100.
- Matsuura, N. Sekai no hitetsu kinzoku shohiryo no choki mitoshi -kakucho seicho kyokusen de suikei shita todenro ni yoru tokeiteki yosoku—[A Study on Trends of World Base-Metal Consumption, and a Long Range Forecast of Demand]. J. MMIJ 2009, 125, 514–520. [Google Scholar] [CrossRef]
- International Copper Association Global Copper Substitution and Regulatory Trends. Available online: http://copperalliance.org/wordpress/wp-content/uploads/2017/05/2017.04-Substitution-and-Regulation-Factsheet.pdf (accessed on 10 November 2018).
- Consejo Minero Cifras Actualizadas de la Minería. Available online: http://dev.consejominero.cl/wp-content/uploads/2018/03/Cifras-actualizadas-de-la-minería-Marzo-2018.pdf (accessed on 10 November 2018).
- Mudd, G.M. The Sustainability of Mining in Australia: Key Production Trends and Their Environmental Implications for the Future; Monash University and Mineral Policy Institute: Melbourne, Australia, 2007. [Google Scholar]
- Kosugi, A.; Unei, A.; Nojiri, S. Aen no jukyu doko to [Trend of Supply and Demand of Zinc]. Kinzoku Shigen Rep. 2014, 44, 408–416. [Google Scholar]
- Norgate, T.; Jahanshahi, S. Low grade ores—Smelt, leach or concentrate? Miner. Eng. 2010, 23, 65–73. [Google Scholar] [CrossRef]
- Norgate, T.; Haque, N. Energy and greenhouse gas impacts of mining and mineral processing operations. J. Clean. Prod. 2010. [Google Scholar] [CrossRef]
- Kamradt, A.; Borg, G.; Schaefer, J.; Kruse, S.; Fiedler, M.; Romm, P.; Schippers, A.; Gorny, R.; Du Bois, M.; Bieligk, C.; et al. An Integrated Process for Innovative Extraction of Metals from Kupferschiefer Mine Dumps, Germany. Chem. Ing. Tech. 2012, 84, 1694–1703. [Google Scholar] [CrossRef]
- Falagán, C.; Grail, B.M.; Johnson, D.B. New approaches for extracting and recovering metals from mine tailings. Miner. Eng. 2017, 106, 71–78. [Google Scholar] [CrossRef]
- Nautilus Minerals. Offshore Production System Definition and Cost Study; Nautilus Minerals: Toronto, ON, Canada, 2010; Volume 1. [Google Scholar]
- Petersen, S.; Krätschell, A.; Augustin, N.; Jamieson, J.; Hein, J.R.; Hannington, M.D. News from the seabed—Geological characteristics and resource potential of deep-sea mineral resources. Mar. Policy 2016. [Google Scholar] [CrossRef]
- Hein, J.R.; Mizell, K.; Koschinsky, A.; Conrad, T.A. Deep-ocean mineral deposits as a source of critical metals for high- and green-technology applications: Comparison with land-based resources. Ore Geol. Rev. 2013, 51, 1–14. [Google Scholar] [CrossRef]
- Hannington, M.; Jamieson, J.; Monecke, T.; Petersen, S. Modern sea-Floor Massive Sulfides and Base Metal Resources: Toward an Estimate of Global Sea-Floor Massive Sulfide Potential; Society of Economic Geologists, Inc.: Littleton, CO, USA, 2010; pp. 317–338. [Google Scholar]
- JOGMEC. Okinawa Izena Kaiketsu No kaiteinessui Kosho No Shigenryo Wo 740 Man Ton to Kakunin [Resources at Izana Cauldron, Okinawa Is Confirmed to 7.4 Million Ton]. Available online: http://www.jogmec.go.jp/news/release/content/300313289.pdf (accessed on 15 November 2018).
- Masuda, N. Challenges toward the Sea-Floor Massive sulfide mining with more advanced technologies. In Proceedings of the 2011 IEEE Symposium on Underwater Technology and Workshop on Scientific Use of Submarine Cables and Related Technologies, Tokyo, Japa, 5–8 April 2011; pp. 1–4. [Google Scholar]
- Kato, Y.; Fujinaga, K.; Nakamura, K.; Takaya, Y.; Kitamura, K.; Ohta, J.; Toda, R.; Nakashima, T.; Iwamori, H. Deep-sea mud in the Pacific Ocean as a potential resource for rare-earth elements. Nat. Geosci. 2011, 4, 535–539. [Google Scholar] [CrossRef]
- Government of Japan. The Third Basic Plan on Ocean Policy 2018. Available online: http://www8.cao.go.jp/ocean/english/plan/pdf/plan03_gaiyou_e.pdf (accessed on 28 November 2018).
- Ministry of Finance of Japan. Boeki tokei [Trade Statistics of Japan]. Available online: http://www.customs.go.jp/toukei/info/index_e.htm (accessed on 28 November 2018).
- Nihon Metaru Keizai Kenkyusho. Do Oyobi Dogokin Risaikurugenryo No Genjo to Anteikakuho Katsuyo Eno Kadai [Current Situation of Copper and Copper Alloy Recycled Materials and the Challenges to Its Stability Ensured and Utilization]; 2015. [Google Scholar]
- Ministry of Ecology and Environment of the People’s Republic of China. Announcement on Adjusting “Catalogue of Imported Waste Management”. Available online: http://www.mee.gov.cn/gkml/sthjbgw/sthjbgg/201804/t20180419_434911.htm?COLLCC=3341996757& (accessed on 11 June 2018).
- Rauters. UPDATE 1-China Bans Imports of 16 More Scrap, Waste Products from End-2018—Ministry. Available online: https://www.reuters.com/article/china-waste-imports/update-1-china-bans-imports-of-16-more-scrap-waste-products-from-end-2018-ministry-idUSL3N1RW1UK (accessed on 11 November 2018).
- McDonough, W.; Braungart, M. Cradle to Cradle: Remaking the Way We Make Things; North Point Press: New York, NY, USA, 2002. [Google Scholar]
- Japan Mining Industry Association. Kokunai Shuyo Kinzoku Kozan/seireisho [Major Smelters in Japan]. Available online: http://www.kogyo-kyokai.gr.jp/image/201303_A1DAMAPA1DBB9F1C6E2BCE7CDD7B6E2C2B0B9DBBBB3A1A6C0BDCFA3BDEA2.pdf (accessed on 7 November 2018).
- Ogawa, J.; Noda, F.; Yamashita, Y. Wagakuni no enerugi kanriseisaku no keiken to tojokoku eno shisa [Experience of Japan’s Energy Management Policy and Suggestions to Developing Countries]. Available online: https://eneken.ieej.or.jp/data/3217.pdf (accessed on 11 November 2018).
- National Research Council of the US. Minerals, Critical Minerals, and the U.S. Economy; National Academies Press: Washington, DC, USA, 2008; ISBN 978-0-309-11282-6. [Google Scholar]
- European Commission. Report on Critical Raw Materials for the EU, Report of the Ad hoc Working Group on Defining Critical Raw Materials; European Commission: Brussels, Belgium; Luxembourg, 2014; p. 41. [Google Scholar]
- Hatayama, H.; Tahara, K. Criticality Assessment of Metals for Japan’s Resource Strategy. Mater. Trans. 2015, 56, 229–235. [Google Scholar] [CrossRef]
- Erdmann, L.; Graedel, T.E. Criticality of non-fuel minerals: A review of major approaches and analyses. Environ. Sci. Technol. 2011, 45, 7620–7630. [Google Scholar] [CrossRef] [PubMed]
- European Commission. The Raw Materials Initiative; European Commission: Brussels, Belgium; Luxembourg, 2008. [Google Scholar]
- U.S. Department of Energy. Critical Materials Strategy 2011; U.S. Department of Energy: Washington, DC, USA, 2011.
- Hoagland, P.; Beaulieu, S.; Tivey, M.A.; Eggert, R.G.; German, C.; Glowka, L.; Lin, J. Deep-sea mining of seafloor massive sulfides. Mar. Policy 2010, 34, 728–732. [Google Scholar] [CrossRef] [Green Version]
- Forsén, O.; Aromaa, J.; Lundström, M. Primary Copper Smelter and Refinery as a Recycling Plant—A System Integrated Approach to Estimate Secondary Raw Material Tolerance. Recycling 2017, 2, 19. [Google Scholar] [CrossRef]
- Koppelaar, R.H.E.M.; Koppelaar, H. The Ore Grade and Depth Influence on Copper Energy Inputs. BioPhys. Econ. Resour. Qual. 2016, 1, 11. [Google Scholar] [CrossRef]
- Chilean Copper Comission. Update Report on Energy Usage in Copper Mining for 2014; Chilean Copper Comission: Santiago, Chile, 2015. [Google Scholar]
- Davenport, W.; King, M.; Biswas, A. Extractive Metallurgy of Copper; Elsevier: Amsterdam, The Netherlands, 1996; ISBN 9780874216561. [Google Scholar]
- Japan Environmental Management Association for Industry CFP Santeiyo Niji Deta [Secondery Data for Calculating Carbon Foot Print]. Available online: https://www.cfp-japan.jp/calculate/verify/data.html (accessed on 19 November 2018).
- Gößling, S. Entropy Production as a Measure for Resource Use—Method Development and Application to Metallurgical Processes; University of Hamburg: Hamburg, Germany, 2001. [Google Scholar]
- International Energy Agency. World Energy Balances 2017; OECD: Paris, France, 2017; ISBN 9789264278097. [Google Scholar]
- Agency for Natural Resource and Energy of Japan. Kaitei Nessui Kosho Kaihatsu Keikaku Dai Ikki Saishu Hyoka Hokokusho [1st Term Final Evaluation Report of Deep Ocean Hydrothermal Ore Development Project]. Available online: https://www.jogmec.go.jp/content/300110684.pdf (accessed on 11 November 2018).
- Levin, L.A.; Mengerink, K.; Gjerde, K.M.; Rowden, A.A.; Van Dover, C.L.; Clark, M.R.; Ramirez-Llodra, E.; Currie, B.; Smith, C.R.; Sato, K.N.; et al. Defining “serious harm” to the marine environment in the context of deep-seabed mining. Mar. Policy 2016, 74, 245–259. [Google Scholar] [CrossRef]
- Boschen, R.E.; Rowden, A.A.; Clark, M.R.; Gardner, J.P.A. Mining of deep-sea seafloor massive sulfides: A review of the deposits, their benthic communities, impacts from mining, regulatory frameworks and management strategies. Ocean Coast. Manag. 2013, 84, 54–67. [Google Scholar] [CrossRef]
- Hiscock, K.; Tyler-Walters, H. Assessing the Sensitivity of Seabed Species and Biotopes—The Marine Life Information Network (MarLIN). Hydrobiologia 2006, 555, 309–320. [Google Scholar] [CrossRef]
- Fushimi, H.; Sakai, G.; Ishihara, H.; Harada, T.; Hirobe, R.; Yanai, S.; Ishihara, T.; Masuda, S.; Minami, T. Work Index ni kansuru chosa/shiken kenkyu hokoku [Investigation and Research Report of Work Index]. Nihon Kogyokaishi 1965, 81, 1059–1077. [Google Scholar] [CrossRef]
- Mclellan, B. Comparative life cycle impacts of deep ocean minerals and land-based counterparts. In Proceedings of the Third International Future Mining Conference, Sydney, Australia, 4–6 November 2015; pp. 1–8. [Google Scholar]
- Ministry of Land Infrastructure Transportation and Tourism of Japan. Naiko Sempaku Yuso Tokei Nempo Heisei 29 Nendo [Statistical Report on Coastwise Vessel Transport]. Available online: http://www.mlit.go.jp/k-toukei/09/annual/index.pdf (accessed on 11 November 2018).
- Valero Navazo, J.M.; Villalba Méndez, G.; Talens Peiró, L. Material flow analysis and energy requirements of mobile phone material recovery processes. Int. J. Life Cycle Assess. 2014, 19, 567–579. [Google Scholar] [CrossRef]
- Ministry of Environment of Japan. Kogata Denki Denshi Kiki Ni Fukumareru Yuyo Kinzoku Ganyuryo [List of Metals Contained in Small Electrical and Electronic Equipment (Board, Parts, Material Composition)]. Available online: http://www.env.go.jp/council/former2013/03haiki/y0324-05b.html (accessed on 11 November 2018).
- Coelho, A.; De Brito, J. Economic viability analysis of a construction and demolition waste recycling plant in Portugal—Part I: Location, materials, technology and economic analysis. J. Clean. Prod. 2013, 39, 338–352. [Google Scholar] [CrossRef]
- Sumitomo Metal Mining. Domestic Core Facilities. Available online: http://www.smm.co.jp/E/corp_info/outline/ (accessed on 10 November 2018).
- Mitsui Mining & Smelting. Core Business Locations in Japan. Available online: https://www.mitsui-kinzoku.co.jp/en/company/c_kyoten/japan/ (accessed on 11 November 2018).
- Mitsubishi Materials. Offices. Available online: http://www.mmc.co.jp/corporate/en/company/office.html (accessed on 10 November 2018).
- Pan Pasific Copper. Global Offices. Available online: http://www.ppcu.co.jp/eng/about_ppc/network.html (accessed on 10 November 2018).
- Toho Zinc. Operating Sites. Available online: http://www.toho-zinc.co.jp/eng/company/list.html (accessed on 11 November 2018).
- Onahama Smelting and Refining. Jigyosho Ichiran [List of Operating Sites]. Available online: http://group.mmc.co.jp/osr/03/03.html (accessed on 10 November 2018).
- DOWA Holdings. Where We Are. Available online: http://www.dowa.co.jp/en/about_dowa/group/japan.html (accessed on 11 November 2018).
- Agency for Natural Resource and Energy of Japan. About the Energy Conservation Law (Measures Pertaining to Shippers)—Calculation Method of Energy Consumption by Shippers. Available online: http://www.enecho.meti.go.jp/category/saving_and_new/saving/ninushi/law_3.html (accessed on 28 August 2018).
- The Japan Plastics Industry Federation. Production of Plastics Products 2017 Japan. Available online: http://www.jpif.gr.jp/english/statistics/monthly/2017/2017_production_products_e.htm (accessed on 26 September 2018).
- Plastic Waste Management Institute. An Introduction to Plastic Recycling; Plastic Waste Management Institute: Tokyo, Japan, 2016. [Google Scholar]
- METI. Yearbook of Current Production Statistics Iron and Steel, Non-ferrous Metals, and Fabricated Metals; METI Ministry of Economy, Trade and Industry: Tokyo, Japan, 2017.
- Motoori, R.; Mclellan, B.C.; Tezuka, T. Economic Feasibility Impacts of Waste and Waste Water Treatment Regulations for Deep Ocean Hydrothermal Ore Mining in Japan. In Proceedings of the ISOPE-2015 Conference, Kona, HI, USA, 21–26 June 2015; pp. 179–185. [Google Scholar]
- International Energy Agency. Global EV Outlook 2018; International Energy Agency: Paris, France, 2018. [Google Scholar]
- Iacobucci, R.; McLellan, B.; Tezuka, T. Modeling shared autonomous electric vehicles: Potential for transport and power grid integration. Energy 2018, 158, 148–163. [Google Scholar] [CrossRef]
- Ministry of Environment of Japan. Santei Hoho Oyobi Haishutsu Keisu Ichiranhyo [List of Calculation Methods and Emission Factors]. Available online: https://ghg-santeikohyo.env.go.jp/files/calc/itiran2015.pdf (accessed on 11 November 2018).
- Ministry of Environment of Japan; Ministry of Economics and Trade of Japan Denki Jigyosha Betsu Haishutsu Keisu (Tokutei Haishutsusha No Onshitsu Koka Gasu Haishutsuryo Santeiyo)-Heisei 28 Nendo Jisseki-[Emission Factor by Electric Power Supplier]. Available online: https://www.env.go.jp/press/files/jp/107786.pdf (accessed on 11 November 2018).
- Imamura, E.; Iuchi, M.; Bando, S. Nihon Ni Okeru Hatsudengijutu No Raihusaikuru CO2 Haishutsuryo Sogo Hyoka [Comprehensive Assessment of Life Cycle CO2 Emissions from Power Generation Technologies in Japan]; CRIEPI: Chiyoda, Japan, 2016; ISBN 978-4-7983-1535-5. [Google Scholar]
- IPCC Climate Change 2014: Mitigation of Climate Change; IPCC: Geneva, Switzerland, 2014; ISBN 9781107654815.
- McLellan, B.C.; Corder, G.D.; Giurco, D.P.; Ishihara, K.N. Renewable energy in the minerals industry: A review of global potential. J. Clean. Prod. 2012, 32, 32–44. [Google Scholar] [CrossRef]
- Marsden, J. Energy Efficiency and Copper Hydrometallurgy. In Hydrometallurgy 2008: Proceedings of the Sixth International Symposium; SME: Englewood, CO, USA, 2008. [Google Scholar]
Figure 1.
Overall Process of Domestic Mineral Production and Life Cycle Assessment System Boundary.

Figure 2.
Domestic Copper Production Process.

Figure 3.
Deep Ocean Mining. Note that the 100 km indicates the estimated distance between the mining site and the main island of Okinawa. It is possible that ores are processed at the closest island and transported to the existing smelters in Japan.
Figure 3.
Deep Ocean Mining. Note that the 100 km indicates the estimated distance between the mining site and the main island of Okinawa. It is possible that ores are processed at the closest island and transported to the existing smelters in Japan.

Figure 4.
Recycling Process-All Material Recovery.

Figure 5.
Energy Consumption of Domestic Mineral Production.

Figure 6.
CO2 Emissions of Domestic Mineral Production.

Figure 7.
Waste from Domestic Mineral Production.

Figure 8.
Deep Ocean Mining and Energy Consumption. (a) Cu-only recycling case; Cu-only recovery from DOM (b) Cu-only recycling case; Multiple recovery from DOM (c) All material recycling case; Cu-only recovery from DOM (d) All material recycling case; Multiple recovery from DOM.
Figure 8.
Deep Ocean Mining and Energy Consumption. (a) Cu-only recycling case; Cu-only recovery from DOM (b) Cu-only recycling case; Multiple recovery from DOM (c) All material recycling case; Cu-only recovery from DOM (d) All material recycling case; Multiple recovery from DOM.

Figure 9.
Deep Ocean Mining and CO2 Emissions. (a) Cu-only recycling case; Cu-only recovery from DOM (b) Cu-only recycling case; Multiple recovery from DOM (c) All material recycling case; Cu-only recovery from DOM (d) All material recycling case; Multiple recovery from DOM.
Figure 9.
Deep Ocean Mining and CO2 Emissions. (a) Cu-only recycling case; Cu-only recovery from DOM (b) Cu-only recycling case; Multiple recovery from DOM (c) All material recycling case; Cu-only recovery from DOM (d) All material recycling case; Multiple recovery from DOM.

Figure 10.
Deep Ocean Mining and Waste Disposal. (a) Cu-only recycling case; Cu-only recovery from DOM (b) Cu-only recycling case; Multiple recovery from DOM (c) All material recycling case; Cu-only recovery from DOM (d) All material recycling case; Multiple recovery from DOM.
Figure 10.
Deep Ocean Mining and Waste Disposal. (a) Cu-only recycling case; Cu-only recovery from DOM (b) Cu-only recycling case; Multiple recovery from DOM (c) All material recycling case; Cu-only recovery from DOM (d) All material recycling case; Multiple recovery from DOM.


Figure 11.
CO2 Emissions Reduction Utilizing Renewable Energy.

Figure 12.
Energy Consumption in Higher Grade Ore.

Figure 13.
CO2 Emissions in Higher Grade Ore.

Figure 14.
Waste Disposal from Higher Grade deep ocean Ore (Multiple Mineral Recovery).

Figure 15.
Optimized Energy Consumption, CO2 Emissions and Waste Disposal.

Table 1.
Materials and Assumptions for the Conventional Copper Process.
| Factor | Data | Units | Reference |
|---|---|---|---|
| Mining | |||
| Ore grade | 0.5 | % | [53] |
| Stripping ratio | 3 | - | [17] |
| Recovery rate | 90 | % | [17] |
| Energy | |||
| Mining (51% electricity) | 13,700 | MJ/t | [53,54] |
| Crushing (electricity) | 1800 | MJ/t | [53] |
| Concentration | |||
| Concentrate grade | 30 | % | [55] |
| Recovery rate | 85 | % | [17] |
| Energy (Electricity) (Cu-Only) | |||
| Grinding | 11,900 | MJ/t | [53] |
| Flotation | 4100 | MJ/t | [53] |
| Transportation | |||
| Distance | 12,400 | km | [38] * |
| Energy (Diesel) | |||
| Energy consumption | 0.00131 | L/t-km | [56] |
| Smelting (Flash Furnace, Convert Furnace, Anode Furnace) and Refining | |||
| Both energy and materials input data are obtained from Gößling (2001). | [57] | ||
| CO2 Emission Intensity | 0.00019 | t-CO2/kWh | [58] |
*: distance is the weighted average of Japan’s copper concentrate trade partners.
Table 2.
Materials for Deep Ocean Mining.
| Factor | Data | Units | Reference |
|---|---|---|---|
| Mining | |||
| Depth | 1600 | m | [59] |
| Vessel | |||
| Dynamic Positioning System | 25,200 | kW | [59] |
| Mining Unit | 1000 | kW | [59] |
| Water Pump | 2770 | kW | [59] |
| Hourly Mined Ore | 210 | t | [59] |
| Ore Grade | |||
| Copper | 0.4 | % | [34] |
| Lead | 1.4 | % | [34] |
| Zinc | 5.8 | % | [34] |
| Transportation | |||
| Distance | 100 | km | * |
| Energy consumption | 0.012 | L/t-km | [65] |
| Concentration | |||
| Concentrate Grade | 30 | % | [55] |
| Energy | |||
| Grinding | 41,000 | MJ/t | ** |
| Flotation | 7600 | MJ/t | [27] |
| Materials Input | Data of Bagdad Copper, Arizona State, USA | [55] | |
| Smelting (Flash Furnace, Convert Smelting, Anode Smelting) and Refining | |||
| Both energy and materials input data are obtained from Gößling (2001). | [57] | ||
*: distance indicates distance from the mining site to the closest island. **: based on the Bond work index.
Table 3.
Materials for Recycling.
| Factor | Data | Units | Reference |
|---|---|---|---|
| Transportation | |||
| Collected E-O-L products | 40 | t | [67] |
| Copper contained | 1 | % | [67] |
| Energy (diesel) | 14,600 | MJ/t-Cu | * |
| Distance | 170 | km | ** |
| Concentration | |||
| Energy (electricity) (Cu-Only case) | |||
| Shredding | 1100 | MJ/t-Cu | [66] |
| Magnetic Separation | |||
| Magnet | 1.5 | MJ/t-Cu | [68] |
| Air Separation | 5.0 | MJ/t-Cu | [68] |
| Metal Separation | 3.8 | MJ/t-Cu | [68] |
| Density Separation | 54.4 | MJ/t-Cu | [68] |
| Conveyor | 1.5 | MJ/t-Cu | [68] |
| Smelting(Reduction Furnace, Oxidation Furnace) and Refining | |||
| Energy and materials input data obtained from Navazo et al. (2016). | [66] | ||
| Heating value of plastics | 44.4 | MJ/kg | [77,78] |
*: Calculated by Equation (3). **: Calculated by Google Maps API.
Table 4.
Overall demand for materials—basis for analysis.
| Factor | Data (ktpa) | Data Range | Reference |
|---|---|---|---|
| Demand in Japan | 1500 | Average between 2001–2016 | [79] |
| Domestic demand | 1100 | Average between 2001–2016 | [79] |
| Export | 400 | Average between 2001–2016 | [79] |
Table 5.
Inputs to each process per ton of copper metal.
| Inputs | CONV | DOM Cu-Only | DOM All Material | REC Cu Only | REC All Material | ||
|---|---|---|---|---|---|---|---|
| Raw Material | Ore | (t) | - | 283.8 | 283.8 | - | |
| Concentrate | (t) | 3.8 | - | - | |||
| Scrap | (t) | - | - | 22.4 | 22.4 | ||
| Energy | Oil | (MJ) | 13,700 | 149,300 | 12,300 | 146,000 | 600 |
| Natural Gas | (MJ) | 3800 | 3800 | 3800 | 10,100 | 1300 | |
| Electricity | (MJ) | 26,100 | 50,000 | 3900 | 5500 | 1700 | |
| Total | (MJ) | 43,600 | 203,100 | 20,100 | 21,000 | 3200 | |
Table 6.
Waste outputs of each process.
| Outputs | CONV | DOM Cu-Only | DOM All Material | REC Cu Only | REC All Material | ||
|---|---|---|---|---|---|---|---|
| Metal | Cathode Copper | (t) | 1 | 1 | 1 | 1 | 1 |
| Solid Waste | Mill Tailings | (t) | (620) | 280.1 | 11.1 | 40 | 5.2 |
| Slag | (t) | 2.7 | 2.7 | 0.1 | 3.2 | 0.4 | |
Note: Mill tailings (including overburden) in the conventional process are produced in the resource exporting countries. These are not brought to Japan, but are included for comparison.
Table 7.
Substituted Processes in Domestic Mineral Production Step 1 (* indicates solar-power-based electricity supplied for this operation, ** indicates wind power-based electricity supplied for this operation).
Table 7.
Substituted Processes in Domestic Mineral Production Step 1 (* indicates solar-power-based electricity supplied for this operation, ** indicates wind power-based electricity supplied for this operation).
| Transition | Option | Process |
|---|---|---|
| Electricity → Renewable Electricity | Conventional processing | Mining * |
| Concentration ** | ||
| Smelting ** | ||
| Refining ** | ||
| Deep ocean mining | Concentration ** | |
| Smelting ** | ||
| Refining ** | ||
| Recycling | Concentration ** | |
| Smelting ** | ||
| Refining ** | ||
| Oil → Renewable Electricity | Recycling | Transport ** |
Table 8.
Substituted Processes in Domestic Mineral Production Step 2(** indicates wind power-based electricity supplied for this operation).
Table 8.
Substituted Processes in Domestic Mineral Production Step 2(** indicates wind power-based electricity supplied for this operation).
| Transition | Option | Process |
|---|---|---|
| Oil → Biofuel | Conventional process | Mining |
| Transport | ||
| Smelting | ||
| Deep ocean mining | Mining | |
| Smelting | ||
| Natural Gas → Biofuel | Conventional process | Smelting |
| Deep ocean mining | Smelting | |
| Recycling | Smelting | |
| Oil → Electricity | Deep ocean mining | Transport ** |
© 2018 by the authors. Licensee MDPI, Basel, Switzerland. This article is an open access article distributed under the terms and conditions of the Creative Commons Attribution (CC BY) license (http://creativecommons.org/licenses/by/4.0/).
Share and Cite
MDPI and ACS Style
Motoori, R.; McLellan, B.C.; Tezuka, T. Environmental Implications of Resource Security Strategies for Critical Minerals: A Case Study of Copper in Japan. Minerals 2018, 8, 558. https://doi.org/10.3390/min8120558
AMA Style
Motoori R, McLellan BC, Tezuka T. Environmental Implications of Resource Security Strategies for Critical Minerals: A Case Study of Copper in Japan. Minerals. 2018; 8(12):558. https://doi.org/10.3390/min8120558
Chicago/Turabian StyleMotoori, Ran, Benjamin C. McLellan, and Tetsuo Tezuka. 2018. "Environmental Implications of Resource Security Strategies for Critical Minerals: A Case Study of Copper in Japan" Minerals 8, no. 12: 558. https://doi.org/10.3390/min8120558
Note that from the first issue of 2016, this journal uses article numbers instead of page numbers. See further details here.