Article

The Significant Roles of Mg/Ca Ratio, Cl and SO42− in Carbonate Mineral Precipitation by the Halophile Staphylococcus epidermis Y2

1
Shandong Provincial Key Laboratory of Depositional Mineralization and Sedimentary Minerals, College of Earth Science and Engineering, Shandong University of Science and Technology, Qingdao 266590, China
2
Laboratory for Marine Mineral Resources, Qingdao National Laboratory for Marine Science and Technology, Qingdao 266237, China
3
Department of Bioengineering, College of Chemical and Environmental Engineering, Shandong University of Science and Technology, Qingdao 266590, China
4
School of Earth Sciences, University of Bristol, Bristol BS8 1RJ, UK
5
Cabot Institute, University of Bristol, Cantock’s Close, Bristol BS8 1UJ, UK
*
Authors to whom correspondence should be addressed.
Zuozhen Han, Wenwen Yu and Hui Zhao worked as the co-first authors.
Minerals 2018, 8(12), 594; https://doi.org/10.3390/min8120594
Submission received: 6 November 2018 / Revised: 10 December 2018 / Accepted: 11 December 2018 / Published: 14 December 2018

Abstract

:
Carbonate precipitation induced by microorganisms has become a hot topic in the field of carbonate sedimentology, although the effects of magnesium on biomineral formation have rarely been studied. In experiments described here, magnesium sulfate and magnesium chloride were used to investigate the significant role played by Mg2+ on carbonate precipitation. In this study, Staphylococcus epidermidis Y2 was isolated and identified by 16S ribosomal DNA (rDNA) homology comparison and ammonia, pH, carbonic anhydrase, carbonate, and bicarbonate ions were monitored during laboratory experiments. The mineral phase, morphology, and elemental composition of precipitates were analyzed by XRD and SEM-EDS. Ultrathin slices of bacteria were analyzed by HRTEM-SAED and STEM. The results show that this bacterium releases ammonia and carbonic anhydrase to increase pH, and raise supersaturation via the large number of carbonate and bicarbonate ions that are released through carbon dioxide hydration catalyzed by carbonic anhydrase. The crystal cell density of monohydrocalcite is lower in a magnesium chloride medium, compared to one of magnesium sulfate. Crystals grow in the mode of a spiral staircase in a magnesium sulfate medium, but in a concentric circular pattern in a magnesium chloride medium. There was no obvious intracellular biomineralization taking place. The results presented here contribute to our understanding of the mechanisms of biomineralization, and to the role of Mg2+ in crystal form.

Graphical Abstract

1. Introduction

Microbialites are an important feature of many carbonate rocks, and they are currently widely distributed in marine shoreline and lake environments [1,2,3,4]. Biomineralization research has demonstrated that microorganisms play a significant role in microbialite formation [5,6], and this has changed the view that the microbialites were mainly formed by physical and chemical processes [7,8]. Thus, there is a close relationship between microorganisms and carbonate precipitation, which has also become a hot research topic in the field of geomicrobiology and sedimentology [9]. Many researchers have undertaken experiments on carbonate precipitation induced by various microorganisms in the laboratory and natural environments, in order to explore the mechanisms of biomineralization more deeply [10,11,12,13].
Microorganisms that are reported to induce the precipitation of carbonate minerals include cyanobacteria [14,15], alkalophilic and halophilic microorganisms [16,17], sulfate-reducing bacteria [18,19], methanogenic archaea [20,21], and other bacteria such as like Bacillus [16]. It has been suggested that primitive life on Earth may have originated in highly saline environments [22,23,24,25]. Thus, the study of the viability and adaptability of microorganisms in modern saline environments could contribute to our understanding of the evolution of the biosphere in the early Earth.
In the field of geomicrobiology, experiments have demonstrated the importance of halophilic bacteria in precipitating carbonate minerals at various salt concentrations [26,27]. Rivadeneyra et al. [28,29] utilized Halmonas eurihalina and Nesterenkonia halobia in their experiments, with the former bacteria precipitating magnesium calcite, aragonite, and monohydrocalcite, and the latter bacteria calcite, aragonite, and dolomite; the proportions of the various minerals were related to the type and salt concentration of the culture medium and the cultivation time. Halophilic bacteria isolated from soil by Párraga et al. [30] precipitated calcite pellets with a diameter of 20 to 50 µm. Sánchez-Román et al. [17], using 19 species of moderately halophilic bacteria to precipitate carbonate and phosphate minerals in a culture medium with controllable Mg/Ca molar ratios, recorded calcite, magnesium calcite, and struvite (MgNH4PO4·6H2O). Mg2+ has been shown to influence the formation of carbonate minerals, including their morphology and nucleation rate, when microorganisms are involved [31]. Dolomite has also been precipitated via halophilic bacteria. For example, Qiu et al. [32] used Haloferax volcanii DS52, a halophilic archaeon, to induce dolomite precipitation under various salinities (from 120‰ to 360‰). Qiu et al. [33] demonstrated that extracellular polymers (EPS) of living cells can chelate calcium and magnesium ions, which can maintain a higher ratio of magnesium and calcium ions around the cell surface, to facilitate the formation of carbonate minerals. Deng et al. [34] isolated the aerobic halophilic bacterium Halomonas marina from Qinghai Lake sediments and precipitated dolomite in low-salinity conditions. Although these studies show the importance of halophilic bacteria in carbonate mineral precipitation, many questions remain unclear and need further exploration.
There are different opinions concerning the mechanism of carbonate precipitation that is induced by halophilic bacteria. For example, it has been claimed that the pH increase frequently recorded in the culture medium during experimentation has been due to ammonia released by bacteria [35,36]. However, it has been suggested that bacteria cannot produce enough ammonia to raise pH to nearly 9 [37], and so there must be other factors. One possibility is carbonic anhydrase (CA), an enzyme that is commonly secreted by cyanobacteria, which can promote the hydration reaction of carbon dioxide to release a large number of bicarbonate and carbonate ions; this would increase the pH [37,38]. In addition to raising pH, the presence of CA would also elevate the supersaturation of some carbonate minerals, and so promote their precipitation. Without CA, the rate of producing the bicarbonate and carbonate ions is very slow [39]; if there is CA present, the typical catalytic rate can reach 104–106/s [40]. There are few references reporting on the precipitation of minerals closely related to CA activity [41,42]. Also significant in mineral precipitation is the composition of the solution and the concentrations of ions therein [16]. In addition to CA, a significant role has been suggested for the Mg/Ca molar ratio in the formation of carbonate minerals, although the actual sources of the Mg2+ have been neglected. In the experiments reported here, different sources of magnesium ions reflecting different conditions in sedimentary environments, are used to form carbonate minerals [43]. It is shown here that different sources of magnesium have a significant role in the morphology and mineralogy of carbonate minerals, although this has rarely been reported. Li et al. [16] induced mineral precipitation by halophilic bacteria with different sources of magnesium, but they did not investigate the mode of growth and crystal structure of the minerals, nor did they determine the elemental distribution on/in the EPS/surface and inside of the cell by scanning transmission electron microscopy (STEM). They did not analyze the amino acid composition of the bacterial EPS either. At the same time, many researchers have focused on extracellular biomineralization, and have neglected intracellular biomineralization. In fact there are few references to intracellular biomineralization. Benzerara et al. [15] examined the intracellular biomineralization of cyanobacteria, and found that there are amorphous carbonate inclusions inside the cell, but their research only considered cyanobacteria. Zhuang et al. [37] also found amorphous nanospheres inside cells; however, the bacteria used to perform the experiments were the alkali-tolerant Bacillus cereus MRR2, not halophilic bacteria. Perri et al. [44] described nanospheres within cells and interpreted these as permineralized viruses, which may act as nuclei for the later precipitation of crystals. In addition to intracellular biomineralization, other unsolved problems in the biomineralization field include the detailed molecular biomineralization mechanism, the true reason for the pH increase, and the criteria for assessing the biogenicity of carbonate minerals. In our study, we have further considered the precipitation of carbonate minerals that are induced by halophilic bacteria by using different sources of magnesium.
In order to further explore the biomineralization mechanism of carbonate minerals induced by halophilic bacteria, experiments were performed by using magnesium chloride and magnesium sulfate, with different Mg/Ca molar ratios, 10% sodium chloride, and the halophilic bacterium Staphylococcus epidermidis Y2, which was isolated and identified by 16S ribosomal DNA (rDNA) homology analysis. The ammonia, CA activity, concentration of bicarbonate and carbonate ions, and the amino acid composition of EPS were also analyzed, respectively, in order to understand the biomineralization mechanisms in more detail. The characteristics of carbonate minerals, namely their morphology, elemental composition and mineralogy, were determined by means of scanning electron microscope (SEM), energy dispersive spectrometer (EDS) and X-ray powder diffraction (XRD). Super-thin slices of S. epidermidis Y2 were also prepared to further analyze the nucleation sites on the EPS/surface, the distribution of calcium and magnesium ions outside and inside cells, and whether the intracellular nanospheres have crystal structures (using high resolution transmission electron microscopy (HRTEM) and selected-area electron diffraction (SAED) and STEM). This study further elucidates the detailed biomineralization mechanisms induced by S. epidermidis Y2.

2. Materials and Methods

2.1. Isolation and Preservation of S. epidermidis Y2 Bacteria

A liquid enrichment culture medium with the following composition was used (g L−1): beef extract 5.0, tryptone 10.0, and NaCl 100 [16]. The above reagents were all dissolved in deionized water, and the pH of the culture medium was adjusted to 7.2. The solid medium was prepared by adding 20 g L−1 agar powder into the above liquid culture medium. All mediums were sterilized by an autosterilizer (LDZX-50KBS, Shanghai Shen’an Medical Device Factory, Shanghai, China) at 110 °C for 25 min. Y2 bacteria were isolated from pickle purchased from a supermarket. Ten grams of pickle were cut into small pieces and inoculated into liquid medium for seven days of enrichment culture in a constant temperature shaker (HZQ-F160, Harbin Donglian Electronic Technology Development Co., Ltd., Harbin, China) with a speed of 110 rpm at 30 °C. Twenty microliters of 10−1, 10−2, 10−3, 10−4, 10−5-fold diluent of the bacterial liquid culture medium was spread on the surface of the solid culture medium and cultivated for two days in a constant temperature incubator (DHP-9050B, Shanghai Langgan Laboratory Equipment Co., Ltd., Shanghai, China) until single colonies could be observed by the naked eye. A single colony was selected to be inoculated into the liquid culture medium and cultivated for 24 h in a constant temperature shaker with a speed of 110 rpm at 30 °C, and then the liquid bacterial culture medium was diluted, and the above process was performed again. A purified bacterium was obtained by three cycles of the solid–liquid process. The concentration of Y2 bacteria was measured by a spectrophotometer (721, Shanghai Aoxi Scientific Instrument Co., Ltd., Shanghai, China) at a wavelength of 600 nm. Once the optical density at 600 nm (OD600) value reached 1.0, the above fermented liquid culture medium could be called the liquid seed and be preserved by 30% sterilized glycerin (v/v), according to a ratio of 1:1 (v/v). The preserved Y2 bacteria were then stored at −20 °C.

2.2. 16S rDNA Identification of S. epidermidis Y2 Bacteria

A purified bacterium was sent to Bioengineering Co. Ltd. (Shanghai, China) for 16S rDNA sequencing, and 16S rDNA splicing was processed by using DNAMAN software (version 5.1, Lynnon Biosoft, Vaudreuil, QC, Canada) [38]. The complete 16S rDNA sequence of Y2 bacteria was uploaded to the GenBank/NCBI database [37], and an accession number obtained. The identity between the 16S rDNA sequence of Y2 and those of other bacteria preserved in the GenBank/NCBI database was also obtained by BLAST analysis. The phylogenetic tree of the Y2 bacterium was constructed by the neighbor-joining method in MEGA 7 software (version 3.1) [43].

2.3. Qualitative Test of Ammonia Released by S. epidermidis Y2 Bacteria

The culture medium that was used to test the presence of ammonia was composed of the following components: peptone 0.5%, K2HPO4 0.05%, and MgSO4 0.05%. The pH of this culture medium was adjusted to 7.0~7.2. Nessler’s reagent was then prepared with 7.0 g KI, 10.0 g HgI2, and 16.0 g NaOH, with 100 mL of water, and stored in a brown bottle [37]. After that, two tubes inoculated with 10 mL of the above culture medium were prepared, one was inoculated with 100 µL of the liquid seed and set as the experimental group, and the other was inoculated with the same volume of sterilized distilled water and set as the control group. After being cultivated for 24–48 h at 30 °C, three to five drops of Nessler’s reagent were added to the two tubes to observe the color changes. If the experimental group showed a dark yellow (or brownish red) color, the result of ammonia test was positive; if a light yellow, which is the color of Nessler’s reagent, the result was negative.

2.4. Growth Curve of S. epidermidis Y2 Bacteria and pH Changes in the Culture Medium

To determine the optimal salt concentration for S. epidermidis Y2 bacteria, these bacteria were inoculated into the culture medium with 5%, 10%, 15%, 20%, 25%, and 30% sodium chloride at a 10% volume ratio. After being cultivated for 24 h in a constant temperature shaker with a speed of 150 rpm at 30 °C, the concentration of S. epidermidis Y2 bacteria was measured by a spectrophotometer at 600 nm. The optimal salt concentration for S. epidermidis Y2 bacteria was determined by the highest cell concentration.
The liquid seed was inoculated into the liquid culture medium at a volume ratio of 1%, and fermented in a constant temperature shaker with a speed of 150 rpm at 30 °C. Three milliliters of the fermentation liquid were taken out and the cell concentration was measured by a spectrophotometer at 600 nm at specific times. With time as the abscissa and cell concentration as the ordinate, the growth curve of S. epidermidis Y2 bacteria could be drawn. The pH value of fermented liquid was measured by a pH meter (PHS-25, Shanghai INESA Scientific Instrument Co., Ltd., Shanghai, China) at specific times. With time as the abscissa and pH value as the ordinate, the pH curve of S. epidermidis Y2 bacteria could be obtained.
To determine the effect of carbonate ions released by CA on pH increase, pH values were calculated according to the concentration of carbonate ions if there was only a first-order reaction. The concentration of carbonate ions in the liquid culture medium was measured as shown in Section 2.6. Thus, pH curve based on carbonate ion concentration could be obtained.

2.5. Activity of CA Released by S. epidermidis Y2 Bacteria

CA activity was measured according to the modified method described by Zhuang et al. [37]. First, a phosphate buffer (0.2 mol/L, pH 6.8) was prepared by mixing 250 mL of KH2PO4 solution (0.2 mol/L) with 118 mL of NaOH solution (0.2 mol/L), and adding deionized water to a volume of 1 L. The pH of the phosphate buffer was adjusted to 6.8 by using hydrochloric acid solution (1 mol/L). One millimolar of p-nitrophenol standard solution was prepared by dissolving 0.0139 g of p-nitrophenol into 100 mL of phosphate buffer. Solution A was prepared by dissolving 0.0181 g of p-nitrophenyl acetate into 0.5 mL of anhydrous ethanol; solution B was prepared by dissolving 0.156 g of diethyl diethylmalonate diethyl into 99.5 mL of phosphate buffer; the working liquid could be obtained by mixing solution A and solution B. The standard solution with a volume of 0.35, 0.3, 0.25, 0.2, 0.15, 0.1, 0.05, and 0 mL was added into a 4 mL centrifuge tube, respectively, then deionized water was added up to 3 mL, and at last, the OD value of the mixture was measured by a spectrophotometer at a wavelength of 400 nm. Taking the concentration as abscissa and the OD value as ordinate, a standard curve was obtained. The determination of CA activity was as follows: the fermented bacterial liquid was mixed with the working liquid at a volume ratio of 1:1, the absorbance of mixture was measured at a wavelength of 400 nm by a spectrophotometer. The mixture was then placed in a water bath at 35 °C for 30 min, quickly transferred to an icy bath to deactivate the enzyme, after that, the absorbance of the mixture was measured again at the same wavelength. The activity of the CA enzyme was calculated according to the above standard equation and the obtained optical absorption value.

2.6. Determination of the Concentration of CO32− and HCO3 Ions

The concentrations of carbonate and bicarbonate ions in the fermented liquid were measured according to the method described by Zhuang et al. [37].

2.7. Amino Acid Composition of EPS

The EPS of S. epidermidis Y2 bacteria were extracted by the heating method according to Morgan et al. [45]. Fermented liquid (OD600 = 1.0) was centrifuged at 2000 rpm for 10 min. Then, the supernatant was discarded, and deionized water was added to the original volume. The mixture was centrifuged again at 2000 rpm for 3 min. In order to wash the cells thoroughly, the above process was repeated twice. The above bacterial suspension was put in a water bath at 60 °C for 30 min, centrifuged at 10,000 rpm for 10 min, and then the supernatant was filtered by a 0.22 µm-pore sized filter membrane. The obtained colorless transparent EPS solution was dried in a lyophilizer (FD-1A-50, Shanghai Bilang instrument Manufacturing Co. Ltd., Shanghai, China) at −60 °C. Finally, the dried EPS powder was sent to Jiangsu Coast Chemical Analysis & Technological Service Ltd., and the amino acid composition of EPS was analyzed by an amino acid analyzer (Hitachi L-8900, Hitachi Co., Tokyo, Japan).

2.8. Carbonate Minerals Induced by S. epidermidis Y2 Bacteria with Different Sources of Magnesium

In the culture medium used to induce the carbonate minerals, the Ca2+ ion concentration was 0.01 M, and the Mg/Ca molar ratio was set as 0, 2, 4, 6, and 8. Mg2+ ions were from two different magnesium sources, namely MgSO4 and MgCl2. The culture medium was sterilized at 121 °C for 30 min. NaHCO3 (1 mol/L) and Na2CO3 (1 mol/L) solutions were sterilized by a sterilized filter with sterilized 0.22 µm-pore sized membrane. Six milliliters of NaHCO3 solution and 3 mL of Na2CO3 solution were added into 150 mL of culture medium, respectively. The pH of the culture medium was adjusted to 7.2. The liquid seed was inoculated into the culture medium with different sources of Mg2+ ions at a volume ratio of 1%, and then was incubated in a constant temperature shaker at 110 rpm and 30 °C.

2.9. Analysis of Carbonate Minerals Induced by S. epidermidis Y2 in the MgSO4 Group and the MgCl2 Group

The minerals in the MgSO4 group and the MgCl2 group were analyzed by XRD (D/Max-RC, Rigaku Co., Tokyo, Japan), with a scanning angle from 10° to 80°, a step size of 0.02, and a count of 8°/min [46,47,48,49,50,51,52]. The microscopic morphology, size, and elemental composition of the minerals in the MgSO4 group and the MgCl2 group were studied by SEM (Hitachi S-4800, Hitachi, Tokyo, Japan) and EDS (Apollo XLT SDD, EDAX, New York, NY, USA) [53,54,55,56], respectively. Minerals soaked in anhydrous ethanol were transferred to an aluminum support and dried naturally, and then sprayed with platinum (Pt) powder and analyzed by SEM-EDS [57,58,59].

2.10. Analysis of the Nanometer Spheres and Element Distribution Outside and Inside of S. epidermidis Y2 Cells

Ten milliliters of S. epidermidis Y2 bacterial liquid was centrifuged at 3000 rpm for 5 min; the pellet was washed three times with phosphate buffer (Na2HPO4·12H2O 20.7472 g L−1, NaH2PO4·2H2O 3.1167 g L−1, pH 7.2) to remove the ingredients from the culture medium. The pellet was fixed by glutaraldehyde (2.5%, v/v) for a night, then dehydrated gradually by acetone solution: 30% (15 min), −50% (15 min), −70% (15 min), −80% (15 min), −90% (15 min), −95% (15 min), −100% (15 min), −100% (15 min) and −100% (15 min). Finally, a 30% epoxy resin solution was added to embed the cells. The ultra-thin slices were analyzed with TEM (JEM-2100, JEOL, Tokyo, Japan) [60,61,62,63], HRTEM (H-7650, Hitachi, Tokyo, Japan) [64,65,66], SAED [58] and STEM (Tecnai G2 F20, FEI, Hillsboro, OR, USA) [67].

3. Results

3.1. Identification of S. epidermidis Y2 Bacteria

The 16S rDNA sequence of the S. epidermidis Y2 strain uploaded to GenBank (accession number MG725753.1) is 1405 bp long. The 16S rDNA of S. epidermidis Y2 strain shares 99% homology with 99 strains of S. epidermidis bacteria by BLAST in Genbank. A phylogenetic tree of S. epidermidis Y2 bacteria, shown in Figure 1, indicates that the Y2 strain has the closest genetic relationship with S. epidermidis species. Therefore, Y2 strain belongs to a species of S. epidermidis.

3.2. Qualitative Ammonia Experiment

After seven days of culture on an agar plate, a single colony of bacteria with a diameter of 2–3 mm was formed. The white colonies had round convex shapes, tidy edges, and a smooth and moist surface (Figure 2a).
Before adding Nessler’s reagent, the control group was clear and transparent, and the experimental group was turbid, due to the existence of S. epidermidis Y2 bacteria (Figure 2b). After adding Nessler’s reagent, the control group showed a yellow color, which was the original color of Nessler’s reagent, and the experimental group was brown, which was different from the original color of the experimental group and the color of Nessler’s reagent (Figure 2c). The ammonia test results showed that ammonia was released by S. epidermidis Y2 bacteria. That is to say, S. epidermidis Y2 bacteria could make full use of the amino acids coming from organic compounds such as beef extract and tryptone in the culture medium by transamination and deamination, to produce a certain amount of ammonia gas. The released ammonia could dissolve into the liquid culture medium to produce a large number of hydroxyl ions. The chemical reaction occurred according to the following Equation (1):
NH 3 + H 2 O NH 4 + + OH
The produced hydroxyl ions increased the pH values of the culture medium, providing favorable conditions for the precipitation of carbonate minerals.

3.3. Growth Curve and pH Curve of S. epidermidis Y2

Figure 3a shows the growth curve of S. epidermidis Y2 bacteria under different salt concentrations. It can be seen from Figure 3a that the optimum salt concentration for bacterial growth was 10%; the optimum range of salt concentration was 5–15%, and there were almost no bacteria at 30% salt concentration. That is to say, S. epidermidis Y2 bacteria belongs to the moderate halophile group, not the extreme halophiles. In order to explore the relationship between the growth of S. epidermidis Y2 bacteria and the increasing pH value in the liquid culture medium, the growth curve and pH value curve were examined.
As shown in Figure 3b, the growth of S. epidermidis Y2 can be divided into four main phases: the delay (adaption) phase, the logarithmic growth phase, the stationary phase, and the delay phase. The range of the adaption phase was 0–18 h; over this period of time, there was almost no change in the concentration of the S. epidermidis Y2 bacterial cells, and only a small decrease in the pH values of the liquid culture medium. The exponential growth period was over a time range of 18–37 h, during which there was a sharp increase in bacterial concentration. pH values increased to nearly 8.0, due to the ammonia released by S. epidermidis Y2 bacteria. The third stage was a stable phase in a time range of 37–44 h; the cell concentration of S. epidermidis Y2 bacteria was almost unchanged, while the pH still increased. The last stage was a decline phase from 44–123 h; the cell concentration decreased due to the fact that a large consumption of nutrients led to a shortage of carbon and nitrogen, which limited the proliferation of bacteria [68]; the cell decrease also indicates that some metabolic activities of S. epidermidis Y2 bacteria declined. However, pH values still increased from 8.0 to 8.7. Figure 3b also showed that there was a great difference in pH values between the control group and the experimental group. The experimental group could make the pH increase to 8.7, with an extension of the incubation time, creating an alkaline environment for the precipitation of carbonate minerals. However, the pH value in the control group was almost unchanged, and kept at 7.0 or so. This significant difference reveals the important role played by S. epidermidis Y2 bacteria in pH increase, which can help to elevate the alkalinity in the culture medium; this also suggests that the S. epidermidis Y2 bacteria play an important role in biomineralization.

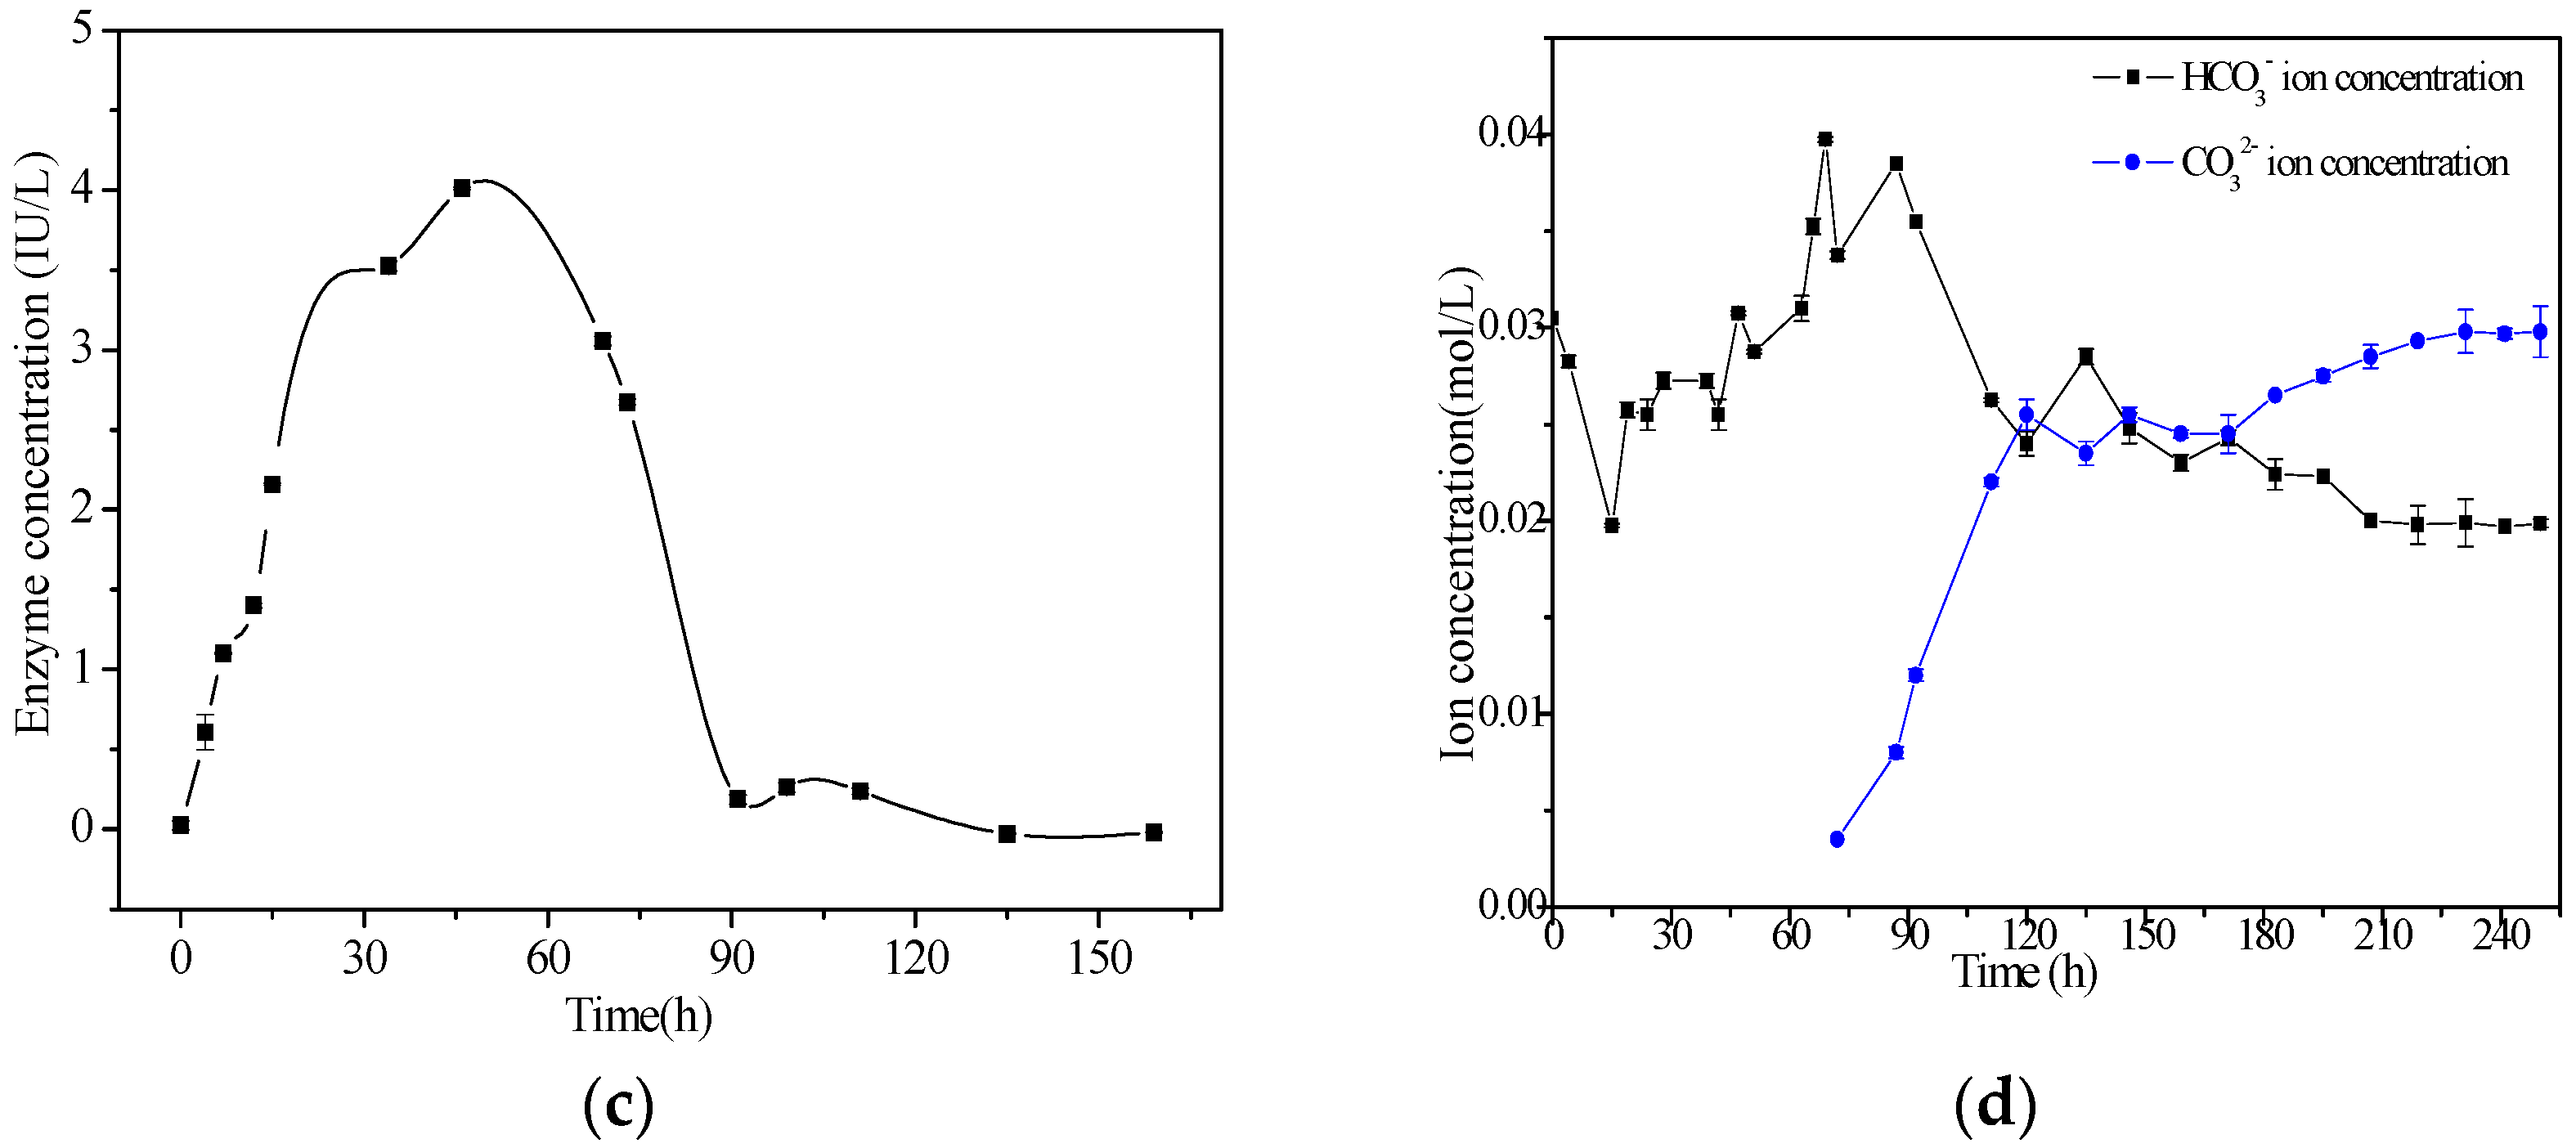
3.4. Determination of CA Activity

It has been reported that CA coming from the microorganisms and bovine extract promotes Ca2+ precipitation in the biomineralization process [41,42,69], due to the fact that CA can catalyze the hydration of carbon dioxide to release a large number of bicarbonate and carbonate ions to further elevate the supersaturation of the carbonate minerals. Thus, CA activity of S. epidermidis Y2 bacteria was also investigated in this study. The CA activity of S. epidermidis Y2 bacteria is shown in Figure 3c. The result shows that this bacterium can produce CA, and that its activity can reach up to a peak (4 IU/L) in the time range of 30–75 h and that it becomes very low after 90 h. The change in CA activity coincides with that of the growth curve, indicating that CA released from S. epidermidis Y2 bacteria belongs to the synchronic synthesized enzyme or the growth-coupled type. That is to say, CA activity can increase with the increase in cell concentration of S. epidermidis Y2 bacteria, and also decrease correspondingly with the aging of S. epidermidis Y2 bacteria.

3.5. Determination of Carbonate and Bicarbonate Ions in the Liquid Culture Medium

Figure 3d shows the changes of bicarbonate and carbonate ion concentrations in the liquid culture medium. It can be seen from Figure 3d that the concentration of bicarbonate increased in the time range of 0–69 h, that CA activity was high, and that it decreased rapidly from 69 to 120 h, and then decreased slowly after 120 h; the carbonate ion concentration increased sharply from 69 to 120 h; in the first 69 h, the carbonate ions did not show up, and after 69 h, the carbonate ions began to appear. With the decrease of the bicarbonate, the carbonate increased. The concentration of bicarbonate decreased to 0.01 mol/L or so, while the concentration of carbonate increased to above 0.03 mol/L.
The pH based on the carbonate ion concentration can be obtained by measuring the pH value of the sodium carbonate solution (Table 1, Figure 2b). Thus, the pH curve in Figure 2b shows that the pH value was higher than that in the experimental group. We have concluded that the pH increase in the experimental group was also related to the carbonate ions released by CA, not only the ammonia released by S. epidermidis Y2 bacteria.

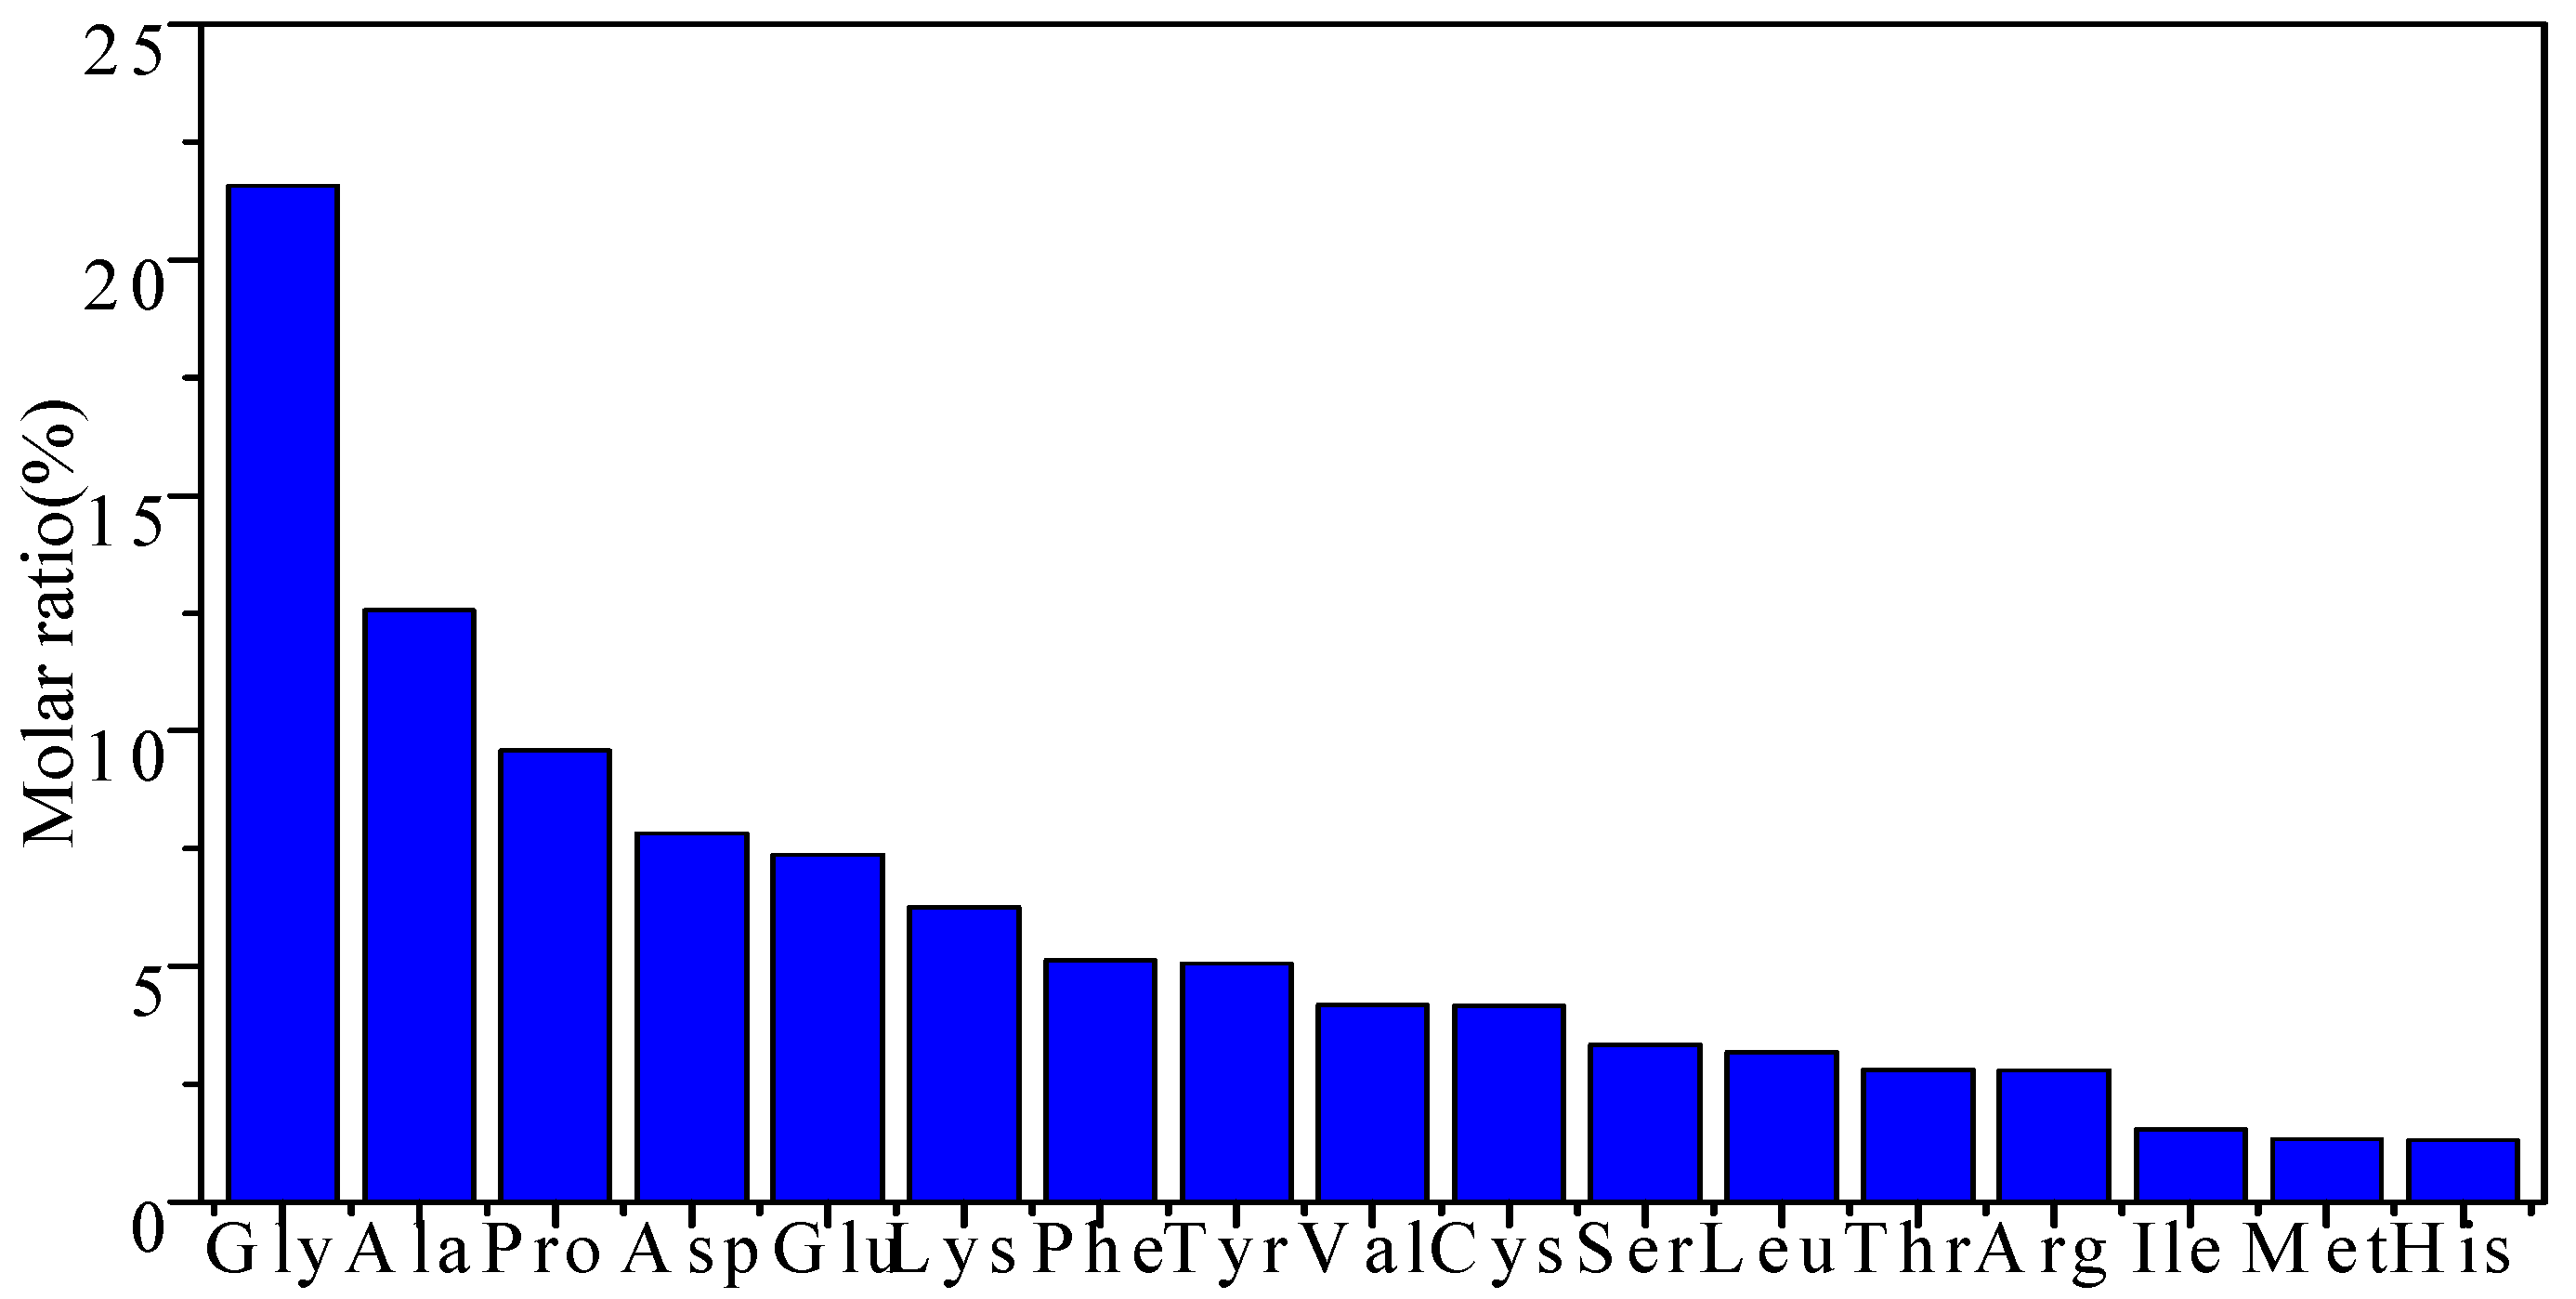
3.6. Amino Acid Compositions of EPS

EPS were extracted from S. epidermidis Y2 bacteria to analyze their amino acid composition. Seventeen types of amino acid were obtained (Figure 4). The content of glycine (Gly) was the highest among these amino acids, and the molar ratio of alanine (Ala) and proline (Pro) was less than that of Gly. Glutamic acid (Glu) and aspartic acid (Asp) are acidic amino acids, and the contents of Asp and Glu were next to those of Gly, Ala, and Pro. Basic amino acids such as lysine (Lys), arginine (Arg), and histidine (His) were far less abundant than the acidic amino acids. S. epidermidis Y2 bacteria belongs to the moderate halophile group, and it can tolerate a certain degree of osmosis caused by the presence of a high concentration of sodium chloride. The special ability of S. epidermidis Y2 bacteria to tolerate a high concentration of sodium chloride has a close relationship with the components and structures of EPS. It has been reported that Gly can be transformed into betaine by methylation reactions catalyzed by methyltransferases, and betaine accumulation can improve salt tolerance of the heterologous organisms [70]. In this study, the ability of the moderate halophile S. epidermidis Y2 bacteria to tolerate 10% sodium chloride may have been due to the abundance of Gly. There are four groups in Gly: two hydrogen atoms, a NH2 group and a COO group. The NH2 group and COO group can form a peptide bond, and two hydrogen atoms are free; thus, EPS rich in Gly have some certain hydrophobic properties. This property has the effect of preventing salt ions from entering the cell, and it has a protective effect on the S. epidermidis Y2 bacterial cell.

3.7. XRD Analysis of Minerals in the Culture Medium with Different Sources of Magnesium

There were no minerals precipitated in the control group; all of the minerals analyzed were from the experimental group. From Figure 5, it can be seen that the mineral phases in the MgSO4 medium were the same as those in MgCl2 group at each value of the Mg/Ca molar ratio. The mineral phase was calcite at a Mg/Ca molar ratio of 0, and monohydrocalcite at Mg/Ca molar ratios of 2, 4, 6, and 8. The cell density of monohydrocalcite in the MgCl2 group (2.3981) was much lower than that in the MgSO4 medium (2.4406). It was also lower than that in the XRD standard database (2.4105), suggesting that the presence of MgSO4 could make monohydrocalcite much denser. It could be that the changes in density resulted in the crystallinity changes in the minerals. There was a significant difference in the crystallinity of minerals between the MgSO4 medium and the MgCl2 group. As shown in Figure 5, there were significantly more small peaks in the XRD pattern of the MgCl2 group than those in the MgSO4 group (Figure 5a), indicating that the minerals in the MgSO4 medium had a higher crystallinity than those in the MgCl2 group (Figure 5b). The result reveals that the crystallinity of minerals can be affected differently by different salts of magnesium. Thus, the results showed that the crystal cell density and the crystallinity become higher in the presence of MgSO4, indicating that these minerals had a better crystal structure in the MgSO4 group than in the MgCl2 group of experiments.

3.8. SEM and EDS Analyses of Minerals Induced by S. epidermidis Y2 in the MgCl2 Group and the MgSO4 Group

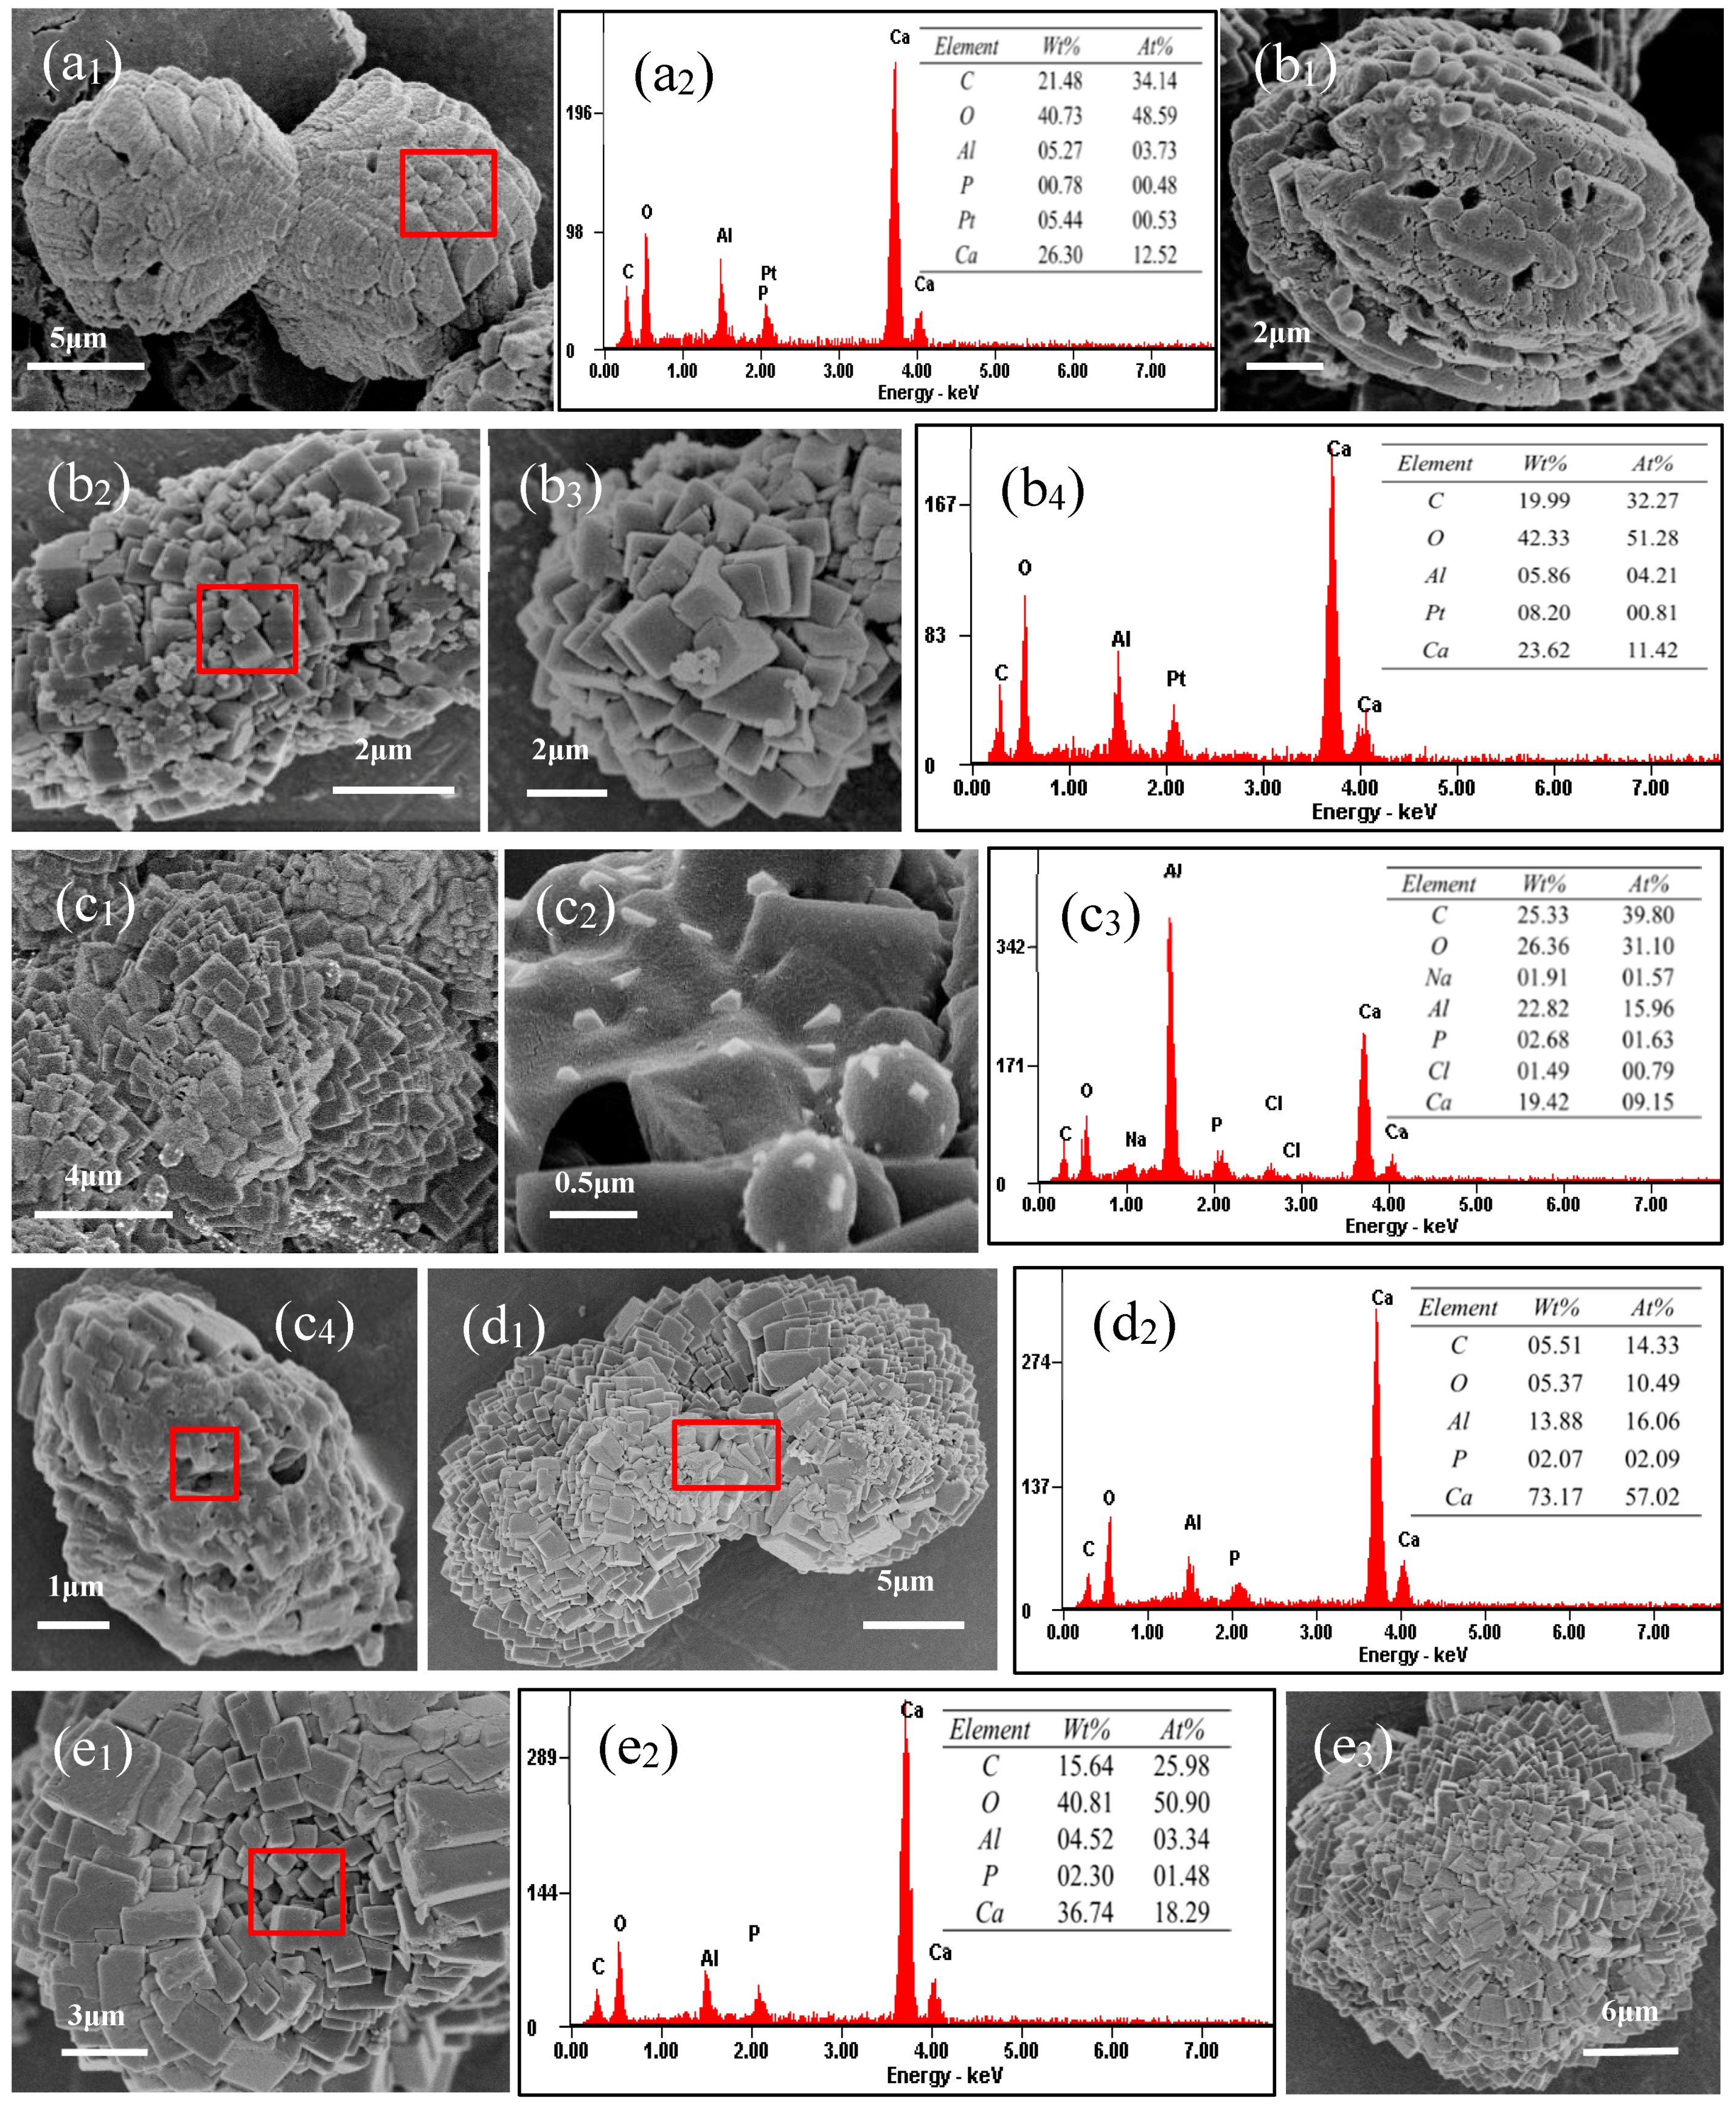
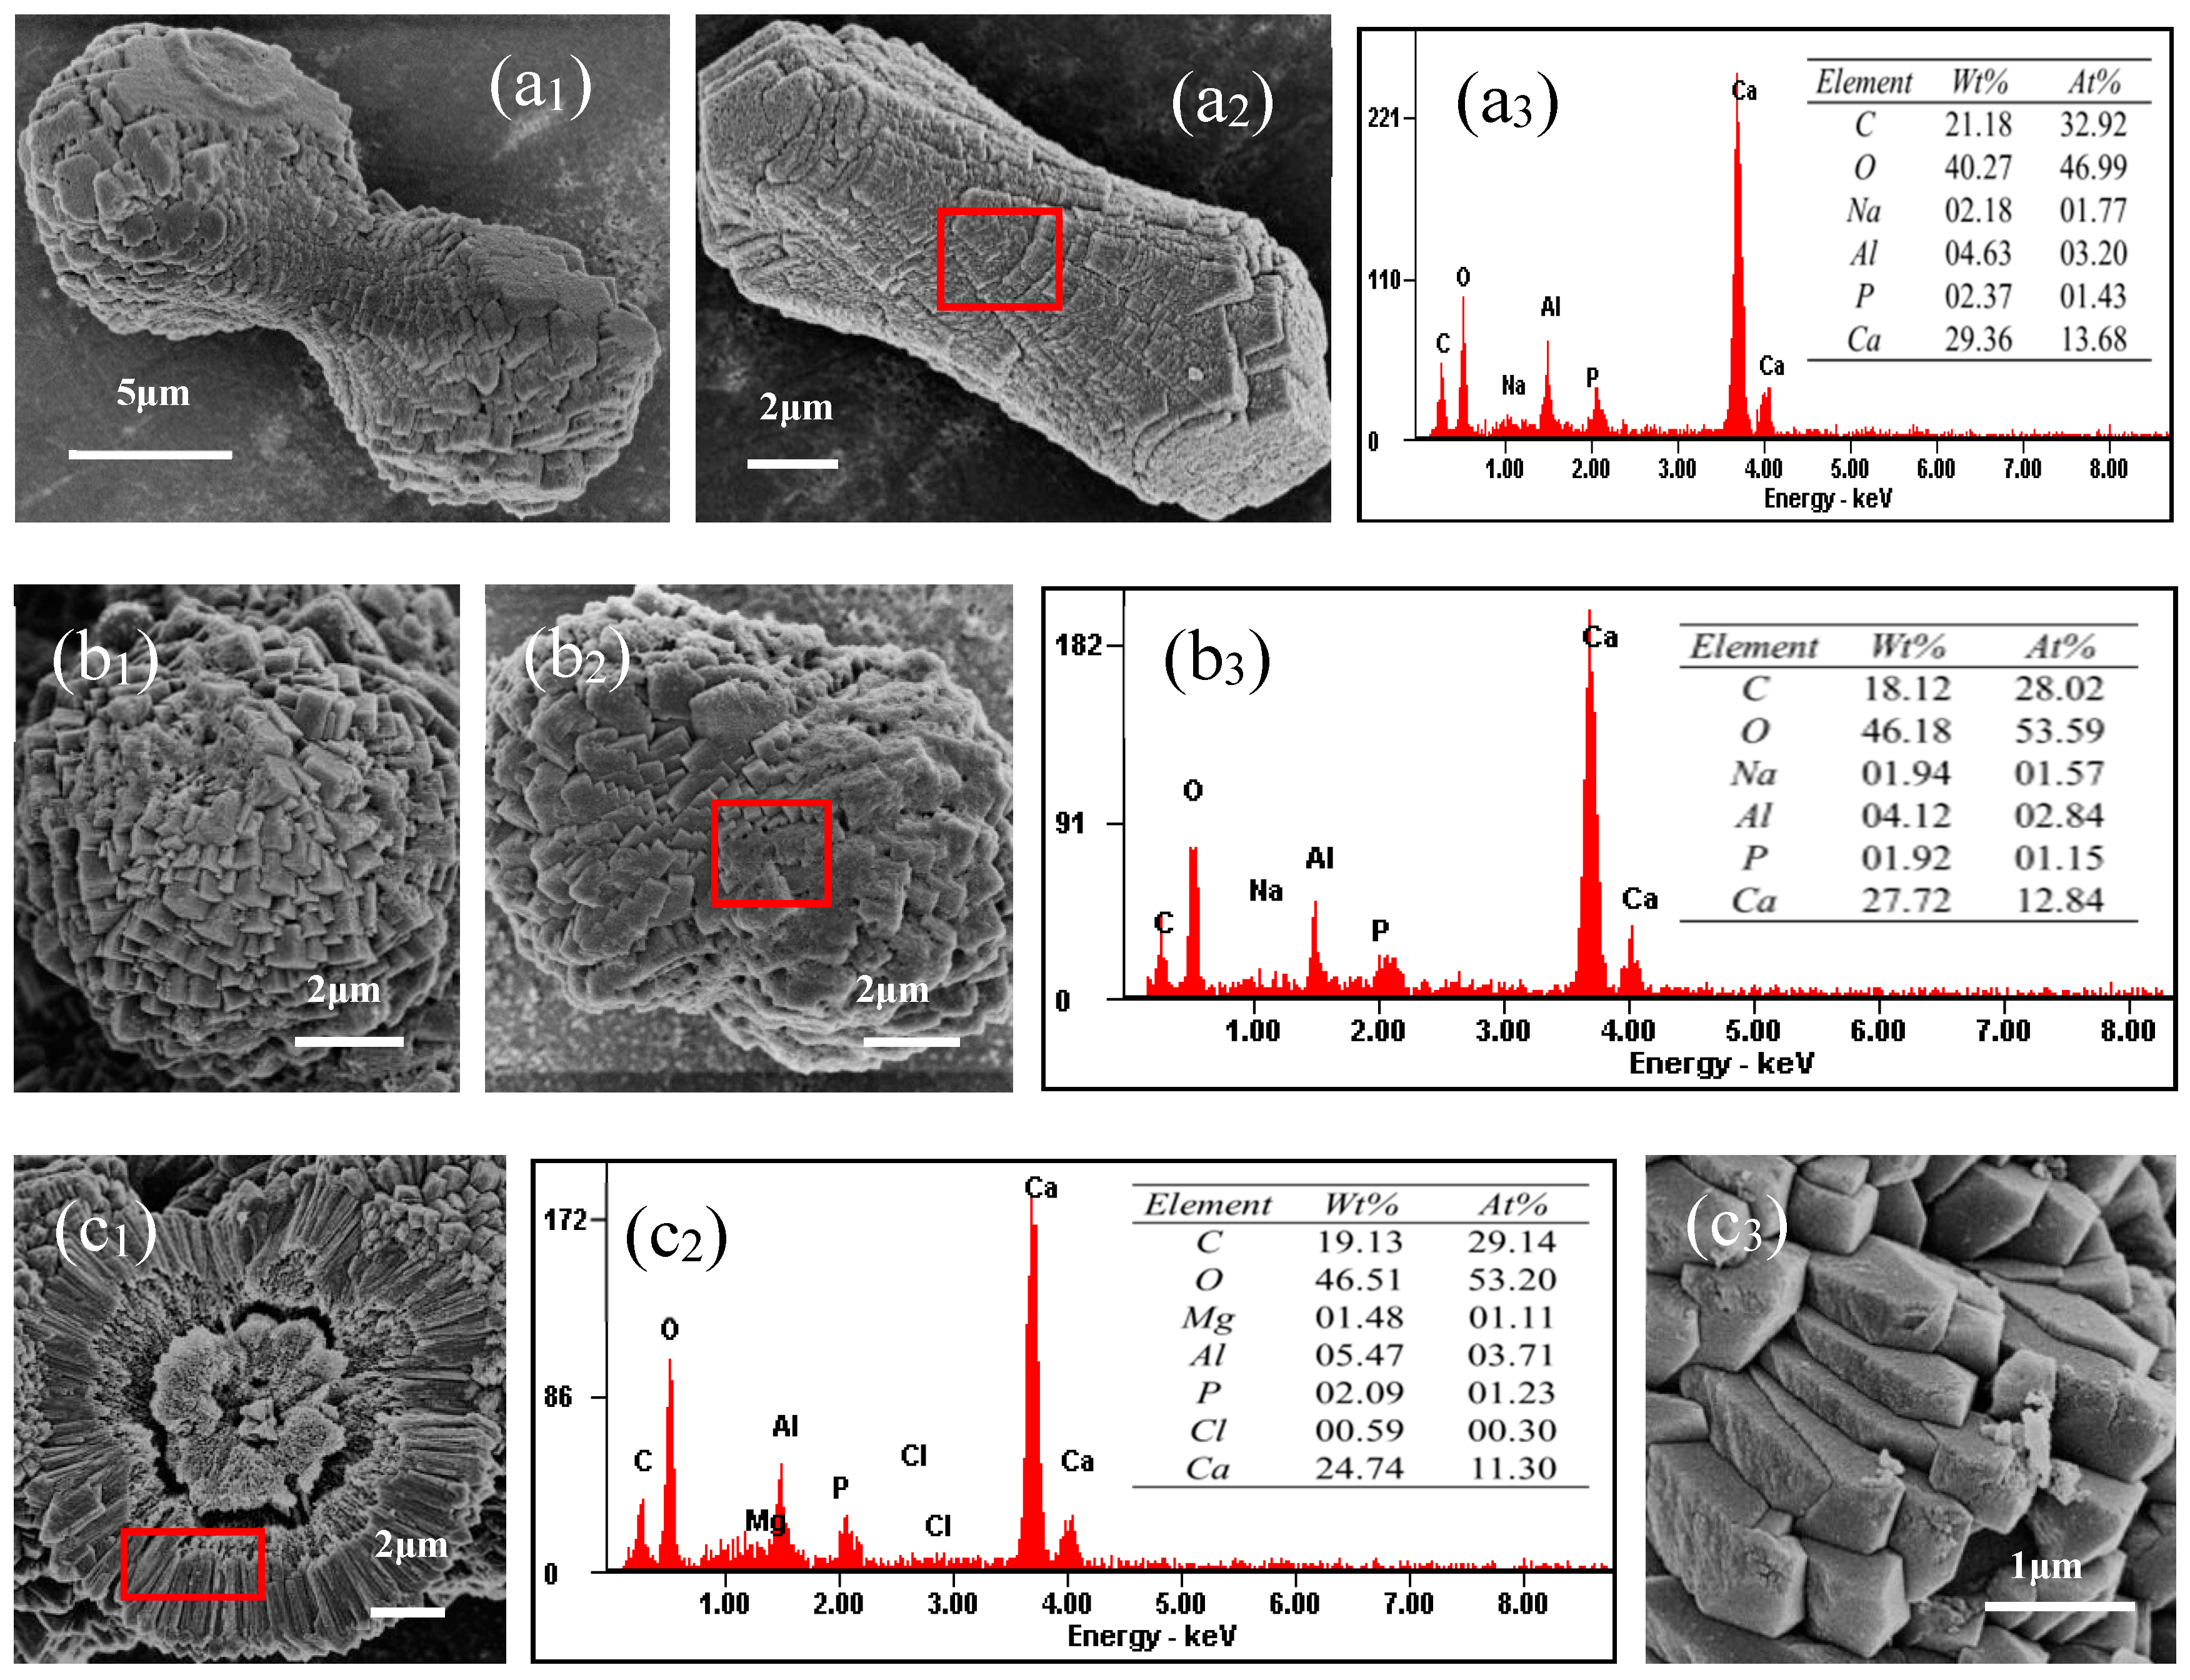
3.8.1. SEM and EDS Analyses of Minerals in the MgSO4 Medium

SEM images and EDS analyses of minerals precipitated in the MgSO4 medium at different Mg/Ca ratios are shown in Figure 6. It can be seen from Figure 6a1 that the minerals were dumbbell shaped, approximately 25 μm in length, and grew symmetrically along a central axis of symmetry. The mineral surface was rougher, and some holes in the surface could be observed, which could be interpreted as marks being left by the shedding of microbial cells from the mineral surface. Figure 6a2 shows that the elements of the minerals included C, O, Ca, Al, P, and Pt. Pt originates from the coating operation performed during sample preparation. Al is derived from the aluminum sample mount. The presence of the element P indicates the involvement of bacteria in the crystal growth process. Figure 6b1 shows the fusiform minerals growing symmetrically along the central axis, on which there are not only some holes but also some S. epidermidis Y2 bacteria. Figure 6b2 shows the irregular mineral formed by the interlacing growth of square minerals (Figure 6b3). The mineral shown in Figure 6b2 contained C, O, Ca, Al, P, and Pt (Figure 6b4). The mineral in Figure 6c1 grew in spiral steps along the central axis, also composed of a large number of square minerals. Figure 6c2 shows that some microcrystals grew in the organic matter, similar to the EPS, and some nanocrystals with a regular geometry and morphology were also present on/within some S. epidermidis Y2 bacterial EPS; this illustrates that the EPS of S. epidermidis was one of the nucleation sites. Cells with nanocrystals precipitated at the bottom of the medium, which explains why these minerals contained so many cells. Figure 6c3 shows that the minerals shown in Figure 6c1 contained C, O, Ca, Al, Na, Cl, and P. Na and Cl elements came from the medium itself.
Figure 6c4 shows that there was still a fusiform mineral at a Mg/Ca molar ratio of 4, which was the same as that in Figure 6b1. The rotation step growth pattern of the mineral aggregates, composed of many minute square minerals, is more clearly shown in Figure 6d1. The EDS analysis indicated that the main elements were C, O, Ca, P, and Al (Figure 6d2). Figure 6e1 reveals that the crystals also grew spirally around a central axis. The main elements were C, O, Ca, P, and Al (Figure 6e2). Figure 6e3 shows an ellipsoidal mineral growth form with spiral steps along the central axis.

3.8.2. SEM and EDS Analyses of Minerals in the MgCl2 Medium

Although the mineral phase was the same as that of the MgSO4 medium, there were significant differences in the micromorphology and growth pattern of the minerals. It can be seen from Figure 7a1,a2 that the mineral was dumbbell-shaped (Figure 7a1) or rod-like (Figure 7a2), and covered with many minute rhombohedral crystals. The length of the dumbbell-shaped mineral was about 20 μm, and the rod-like mineral was about 15 μm. Figure 7a3 shows that the main elements of the mineral were C, O, Ca, Al, Na, and P. Figure 7b1,b2 shows that a spheroidal mineral and a uniquely shaped mineral like an “8” appeared, whose surface was covered with small rectangular minerals. The elements in the mineral (Figure 7b3) were the same as those shown in Figure 7a3. There was a significant difference in the crystal growth pattern between the MgSO4 group and the MgCl2 group. It can be seen from Figure 7c1 that the mineral showed a concentric circular growth pattern in the MgCl2 group. The inner concentric circular minerals were composed of many small irregular minerals, while the outer concentric circular minerals consisted of many closely-arranged, larger, elongate columnar minerals. Figure 7c2 shows that the mineral contained the elements C, O, Ca, Mg, Al, Cl, and P. Figure 7c3 shows the micromorphology of the outer concentric circular minerals. It was found that the minute minerals composed of the concentric circular minerals were long columnar, and not square minerals, which were significantly different from those of the MgSO4 group. Figure 7d1 shows that the mineral at a Mg/Ca molar ratio of 6 was formed by irregular rhombohedral crystals. The minerals had a round-cake shape (Figure 7d2) and a spheroidal shape (Figure 7d4). Figure 7d3 shows that the mineral contained the elements C, O, Ca, Mg, Al, and P. With the increase in Mg2+ concentration, the micromorphology of minerals changed significantly. It can be seen from Figure 7e1–e3 that the minute minerals covering the surface of dumbbell-shaped (Figure 7e1), triangular (Figure 7e2) and irregular minerals (Figure 7e3) became much smaller. The EDS analyses (Figure 7e4,e5) showed many elements present in the minerals, including Na, Mg, Al, Cl, and P elements, besides C, O, and Ca elements.

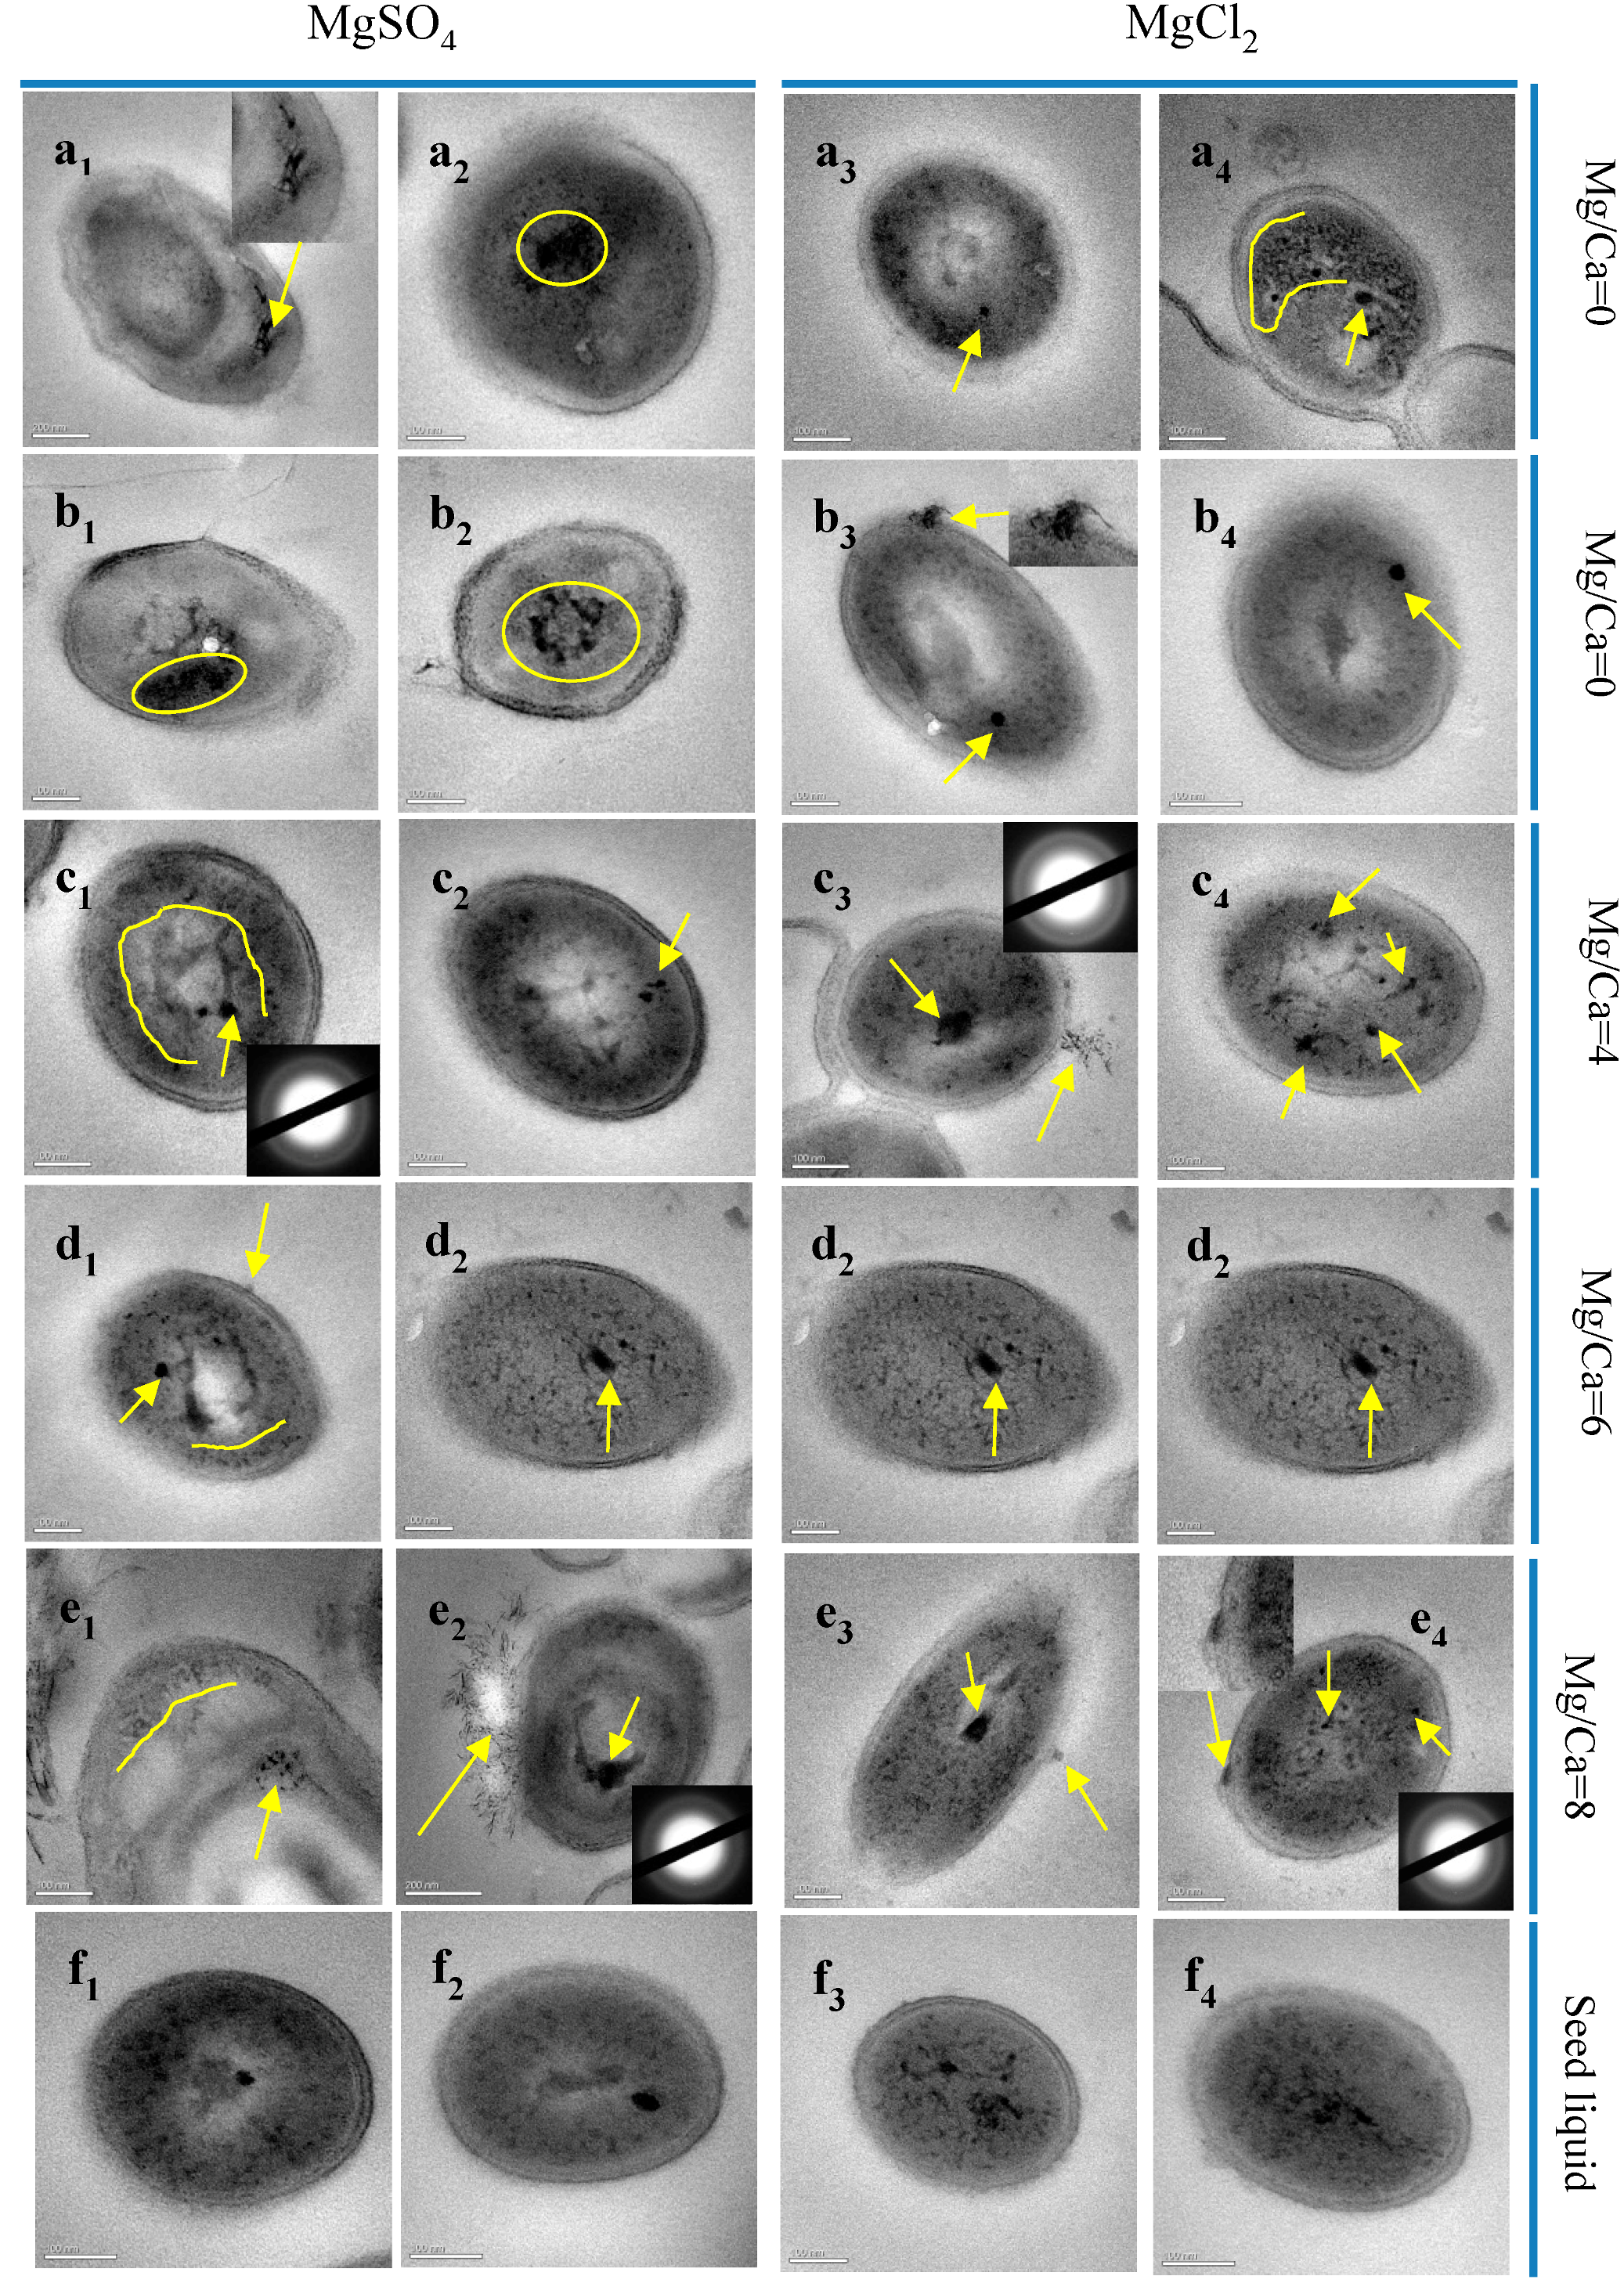
3.9. HRTEM and SAED Analyses of S. epidermidis Y2 Bacterial Superthin Slices

In order to investigate the intracellular biomineralization, super-thin slices of S. epidermidis Y2 bacteria cultured in the MgSO4 medium and MgCl2 medium were analyzed by HRTEM and SAED, respectively. Figure 8 shows that S. epidermidis Y2 bacteria were in a shape of a grape, and they had a layered epidermal structure with a lower electron density than inside the cell. The high electron density is related to the thickness of the sample and the metal ions contained. In both the MgSO4 medium and MgCl2 medium, the electron densities in cells were higher, indicating that there were a large number of metal ions inside the cells. In view of the characteristics of potassium uptake and sodium rejection by halophilic bacteria in the culture medium rich in NaCl, the higher electron densities may indicate the existence of K+ inside the cell. However, no potassium was present in the culture medium. Therefore, the higher electron densities may be due to the presence of Na+ ions inside the cell. Thus, super-thin slices of S. epidermidis Y2 bacteria cultivated in the culture medium without any Mg2+ and Ca2+ ions were also investigated, and the result shows that even without Mg2+ and Ca2+ ions in the culture medium, some regions with a higher electron density are still present inside the cells (Figure 8f1–f4). It can be concluded that Na+ can enter the cell to adjust osmosis, resulting in a higher tolerance of S. epidermidis Y2 bacteria to salt stress, because S. epidermidis Y2 bacteria belong to moderate halophile. At different Mg/Ca molar ratios, a higher electron density inside the cell can be observed in both the MgSO4 medium and MgCl2 medium. SAED results showed that there were no diffraction spots and diffraction rings (inset in Figure 8c1,c3,e2,e4), indicating that the crystal structure in the higher electron density areas inside the cell were amorphous at Mg/Ca molar ratios of 4 and 8. However, whether Ca and Mg could be contained in these higher electron density areas, and whether Mg2+ and Ca2+ ions could enter the cell is still a question that needs further exploration. Therefore, the elemental composition of higher electron-density areas was also analyzed by STEM, which is reported in Section 3.10. As is well known, EPS are nucleation sites for mineral formation; this was also demonstrated in our results of ultrathin slices of bacteria analyzed by HRTEM. It can be seen from Figure 8a2,b2,b3,c3,e1–e4,f4 that some granules with a size of 30 nanometers were present on/within the EPS of S. epidermidis. The results of SEM analyses also showed some nanocrystals with a regular geometry morphology that were present on/within S. epidermidis bacterial EPS (Figure 6c2). Thus, it can be concluded that the EPS of S. epidermidis are one of the nucleation sites.
Among these cells, one that had a crumpled surface was particularly striking, as shown in Figure 9a–c. The shrinking cells could be found in both the MgSO4 medium and MgCl2 medium; they could be due to the loss of EPS or ageing and death. Han et al. [27] reported that EPS around Synechocystis sp. PCC6803 cells can protect the shape of the bacteria, and the cells can become shrunken and deformed after the EPS has been stripped out from the cell under high-speed centrifugation. The number of shrinking cells in the MgSO4 medium was higher than that in the MgCl2 medium. Figure 9a–c show that there were also some higher electron-density areas inside the shrinking cells; it may be that the higher electron density areas were already present inside the cell before they were deformed. Figure 9d–f show that the active cells had a smooth stratified surface without any folds. What is more, the higher electron-density area was distributed evenly (Figure 9d) inside the active cells, whereas only low electron-density areas were distributed unevenly inside the shrinking cells, indicating that the shrinking cells may be the result of mineralization inside the cell.

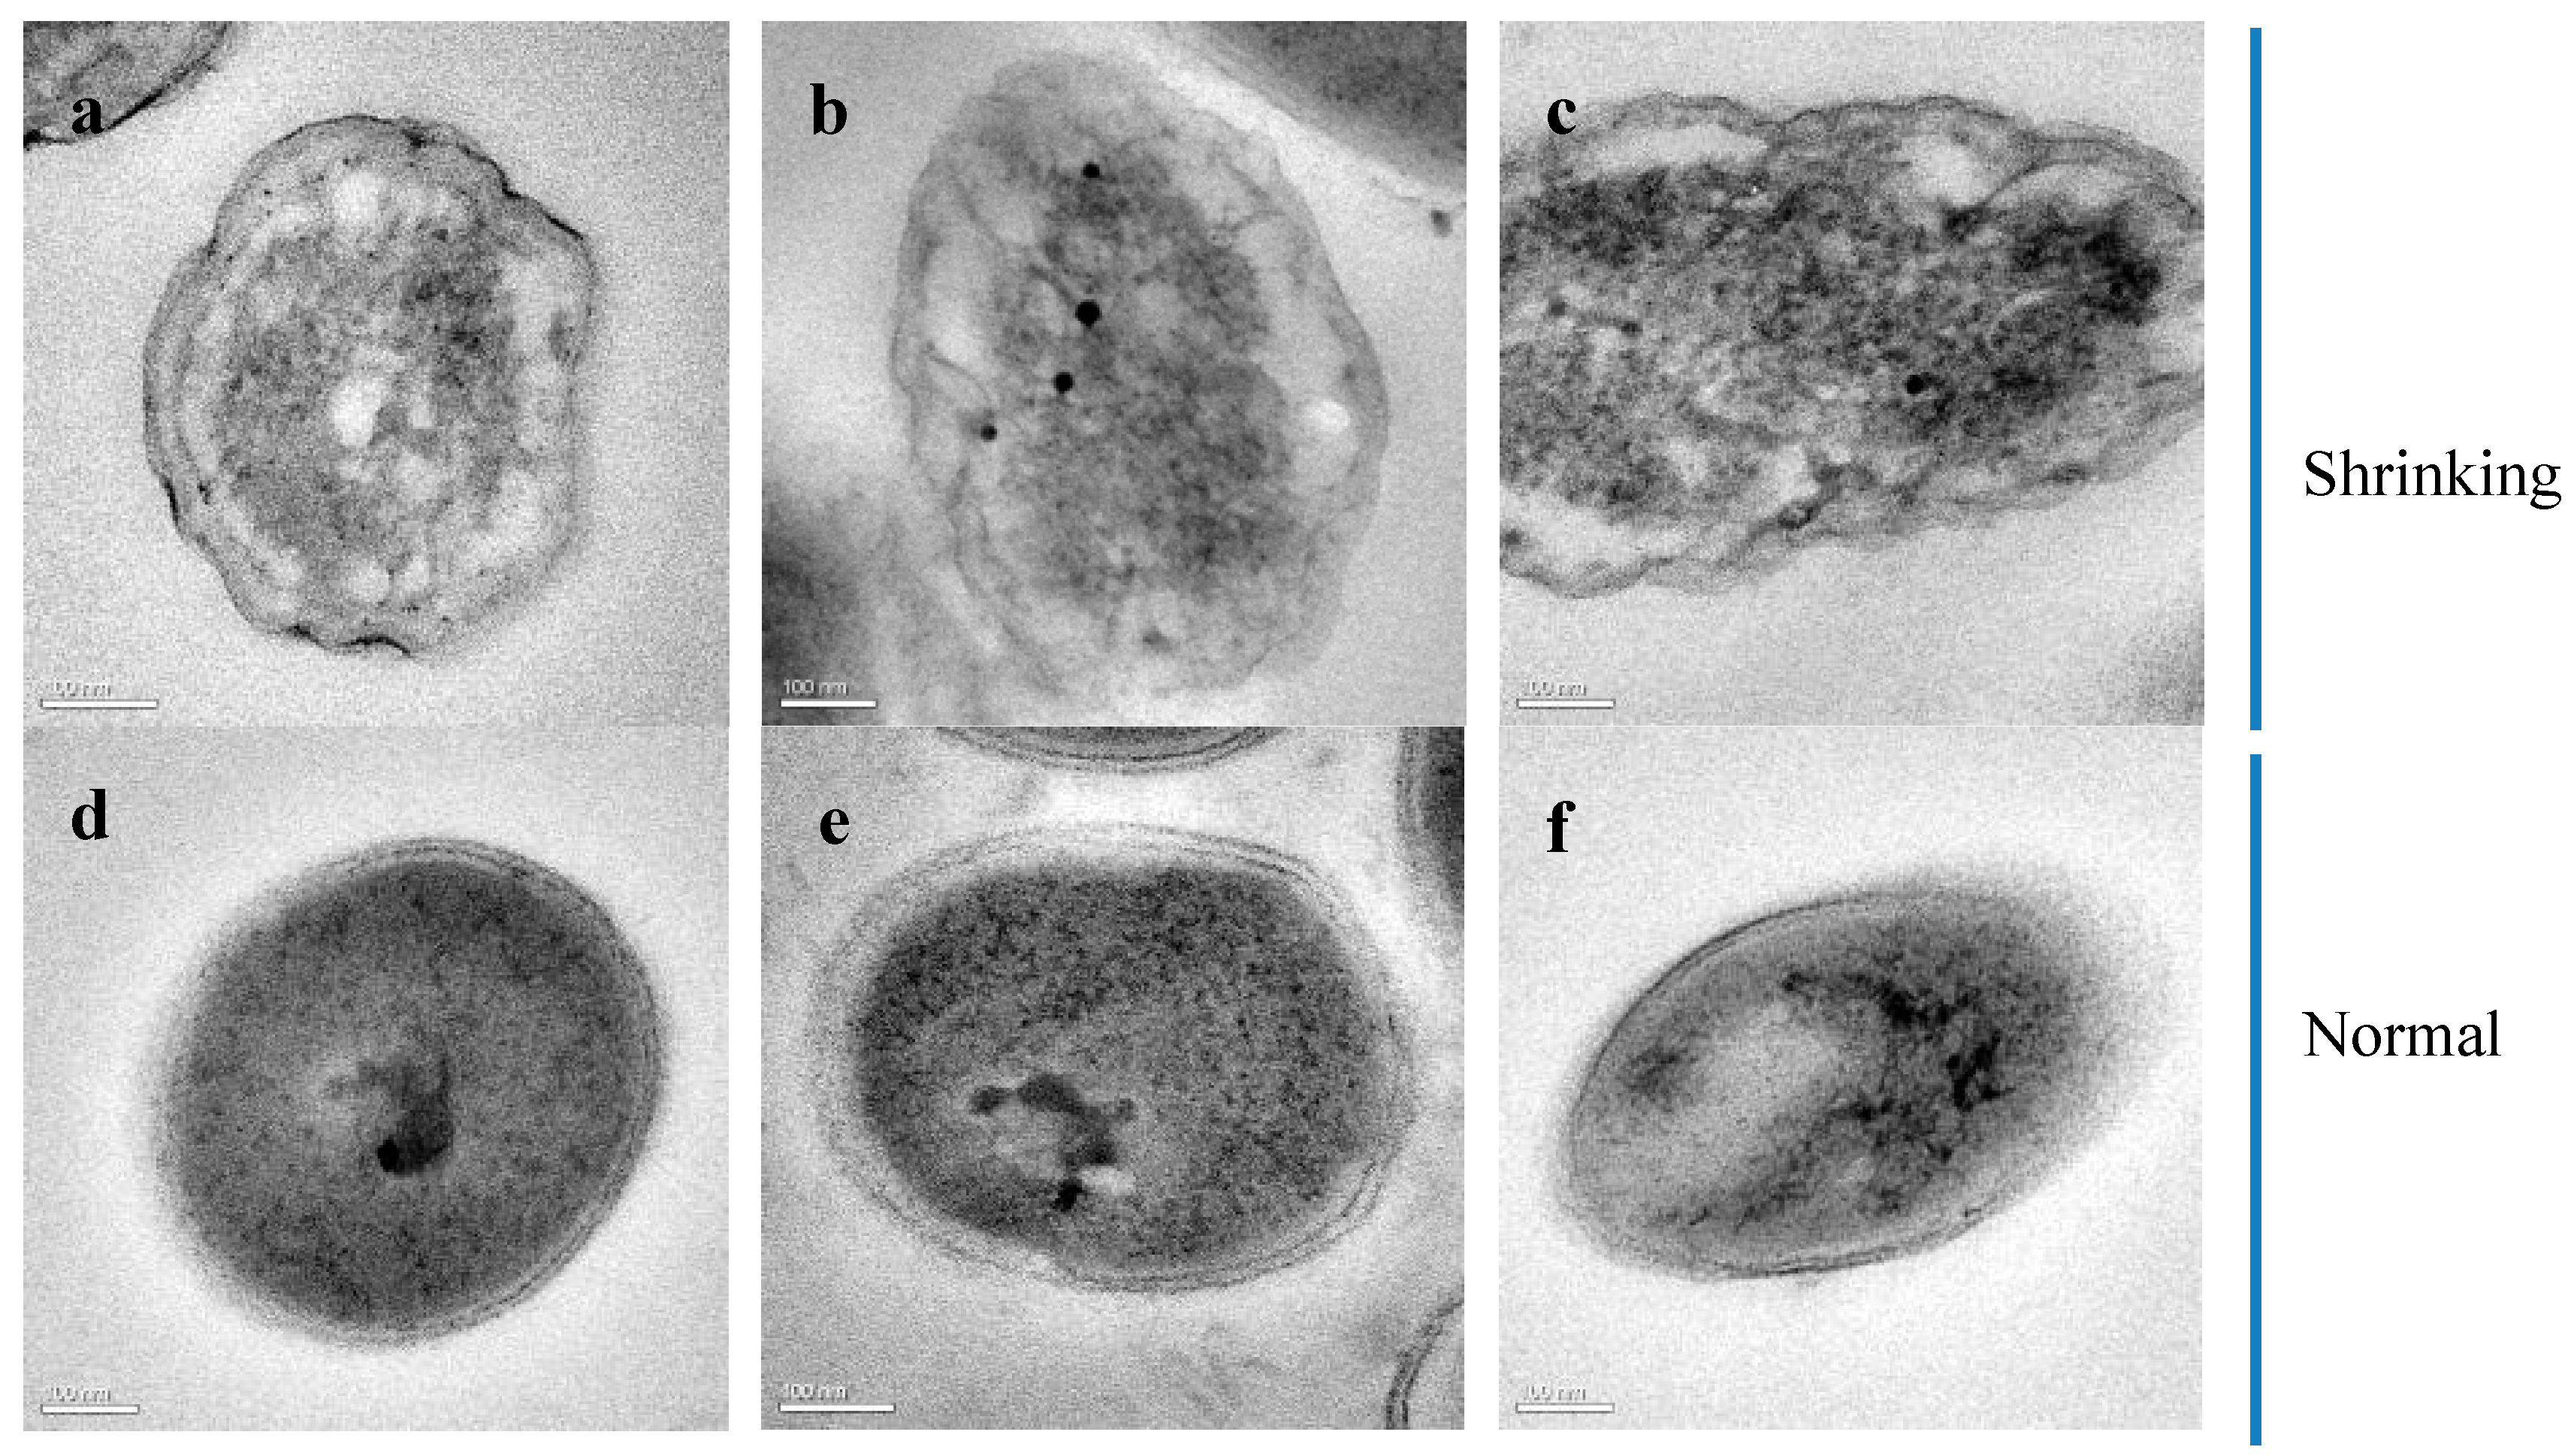
3.10. STEM and EDS Analyses of the Ultrathin Slices of S. epidermidis Y2

In order to further investigate what elements are present in the higher electron-density areas, STEM-EDS analyses were performed. Figure 10 shows that Ca was present in the higher electron-density area at a Mg/Ca molar ratio of 0, and both Ca and Mg were present at a Mg/Ca molar ratio of 4 and 8 in both the MgSO4 medium and MgCl2 medium. From the distribution of Ca and Mg elements, it can be observed from Figure 10 that both were more densely distributed inside cells than on the surface, indicating that the organelles or cytoplasm inside the cells were more conducive to adsorbing Ca2+ and Mg2+ ions; this could be due to the special structure of organelles or the abundant organic matter in the cytoplasm, or the fluid condition inside the cell. Thus, these results show that Ca2+ and Mg2+ ions can enter the cell. In general, however, bacteria have protection mechanisms to prevent themselves from being injured, e.g., they have a cell membrane that is composed of phospholipid bilayers, and this can prevent soluble micromolecules, such as Ca2+ and Mg2+ ions, from entering the cell. So—how did the Ca2+ and Mg2+ ions enter the cell? There are ion channels for Ca2+ and Mg2+ embedded in the cell membrane, through which these ions can be transferred from the outside to the inside of the cell by diffusion.

4. Discussion

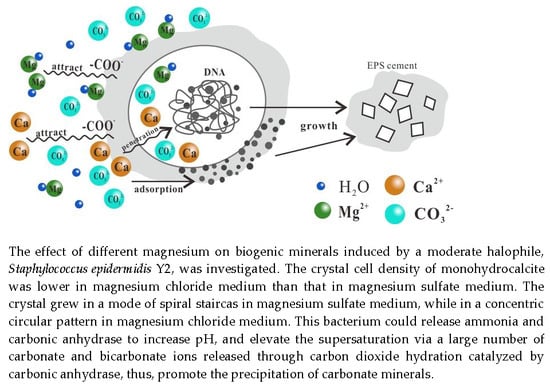
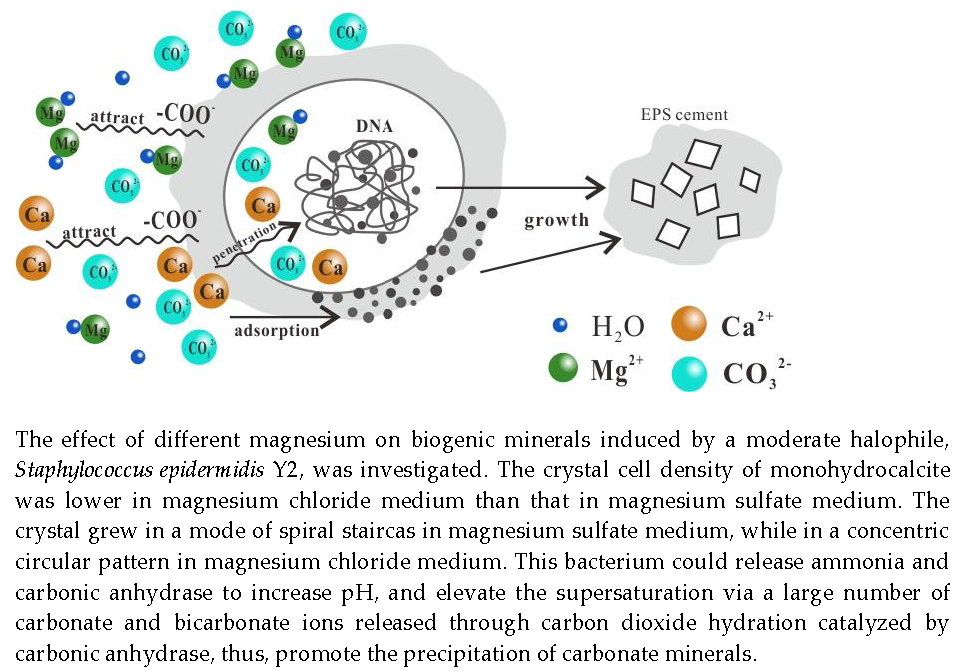
4.1. Mechanisms of Biomineralization Induced by S. epidermidis Y2 Bacteria

4.1.1. pH Increase

It has been reported by many researchers that the microenvironment around the bacterial cell can be changed by metabolic activities, leading to the microenvironment reaching a supersaturation for some minerals, and so promoting mineral precipitation [71]. Among the changeable parameters in the environment, the pH value is an important factor for influencing biomineralization, and this has been investigated in many studies [4,15]. Thus, whether the activities of S. epidermidis Y2 bacteria could result in a pH increase was also tested in this study. The pH of the experimental group inoculated with S. epidermidis Y2 bacteria showed an increase from 7.0 to about 8.7, while the pH in the control group without the inoculation of S. epidermidis Y2 bacteria remained almost unchanged. This result reveals that the presence of S. epidermidis Y2 bacteria can make the pH of the liquid culture medium increase. It has puzzled many researchers as to why the pH increases so highly; the consensus is that ammonia that is released by microorganisms is the main cause [17,35,36]. The NH2 group of amino acids, which are components of the culture medium, can be transferred from one molecule of an amino acid to a keto acid by transamination to form a new amino acid, and they can also be removed from an amino acid to form ammonia by deamination. Ammonia can dissolve in water to release ammonium and hydroxyl ions, thus promoting a pH increase in the culture medium. The equation is as follows (1).
In this study, the ammonia test result was positive, indicating that the released ammonia played an important role in the pH increase. In fact, the alkaline environment facilitates the formation of bicarbonate and bicarbonate ions. Microorganisms can increase the utilization efficiency of carbon dioxide through the carbon dioxide enrichment mechanism [72]. The carbon dioxide produced by bacterial metabolism and enriched in this manner exists in the form of carbonate and bicarbonate ions under alkaline conditions. The equations are as follows (2)–(4):
CO 2 + H 2 O H 2 CO 3
H 2 CO 3 + OH HCO 3 + H 2 O
HCO 3 + OH CO 3 2 + H 2 O
Therefore, a large number of OH, CO32−, and HCO3 ions can react with Ca2+ to form calcium carbonate precipitates when reaching a sufficiently high level of supersaturation in the liquid culture medium. The equation is as follows (5):
OH + CO 3 2 + HCO 3 + 2 Ca 2 + 2 CaCO 3   +   H 2 O

4.1.2. CA Activity

CA, a kind of metal enzyme, widely exists in animals, plants, and prokaryotes, and it can catalyze the reversible hydration of carbon dioxide [73]. Carbon dioxide hydrates very slowly in its natural state [74], but the rate increases with the involvement of CA [42,75,76,77,78]. In this study, CA catalyzed the hydration reaction of carbon dioxide, coming from the air, bacterial metabolism, and the carbon dioxide enrichment mechanism, to release carbonate and bicarbonate ions to elevate the supersaturation in the microenvironment around the cell. The equation is as follows (6):
CO 2   +   H 2 O   CA H 2 CO 3   +   OH HCO 3   +   CO 3 2
From Figure 3d, carbonate ions increase, consistent with the result shown in Equation (6). According to the concentration of carbonate ions, another pH curve can be obtained (Figure 3b). The pH curve based on carbonate ion concentration reveals that due to the presence of carbonate ions, pH values were far beyond those in the experimental group. Therefore, the carbonate ions released by CA catalysis also played an important role in the pH increase. Zhuang et al. [37] have also investigated the role of CA played in pH increase, and it is believed that both CA and ammonia play significant roles in pH increase, and not only ammonia. From this study, we agree with that opinion. Thus, there are two roles played by CA: one is to increase pH, and the other is to catalyze the hydration of carbon dioxide to produce carbonate ions and bicarbonate ions. In view of the high efficiency of enzyme catalysis, CA can quickly catalyze the hydration of carbon dioxide to release bicarbonate and carbonate ions, and then promote the precipitation of carbonate minerals. In this process, CA plays an important role. Liu et al. [79] reported that CA can be used to accelerate an aqueous processing route to carbonate formation. Sundaram et al. [80] proved that calcite formation is successful by using Bacillus sp. with its enhanced activity of CA, producing a much higher rate of CaCO3 precipitation. Similar results have been documented by Mirjafari et al. [81], Srivastava et al. [82], and Ramanan et al. [83].

4.2. The Role of Mg2+ Ions on Monohydrocalcite

In this study, calcite was the mineral that was produced when the ratio of magnesium to calcium was zero, and monohydrocalcite at other Mg/Ca molar ratios. Other studies have also shown that magnesium ions play an important role in the formation of monohydrocalcite [84]. According to XRD analysis, monohydrocalcite appeared in both the MgSO4 medium and MgCl2 medium. With increased Mg/Ca ratio, the mineral phase did not change.
By comparison with calcite and aragonite, monohydrocalcite is thermodynamically unstable under the temperature and pressure of the Earth’s surface, which determines the low abundance of this mineral phase [84]. However, monohydrocalcite can be found in a variety of natural environments, such as saline springs [85], caves [86], and deep lake sediments [87]. Besides this, monohydrocalcite is also a product of biomineralization; it can be formed by some molluscs [88], flatworms [89], vertebrates [90], guinea pigs [91], Saguaro cacti [92,93], algae [94], and halo bacilli [95]. Although the distribution of monohydrocalcite is relatively extensive, its formation mechanism is still not very clear.
Many researchers have reported that Mg is almost always present in all natural and synthetic monohydrocalcite crystals [93,96]. The Mg content of the liquid culture medium in the experiments reported here, which was used to form monohydrocalcite, played a significant role in its formation. It has been shown that a higher Mg/Ca molar ratio in the precipitating solution is a prerequisite for the formation of both natural and biogenic monohydrocalcites [97]. In aqueous solutions without magnesium ions, monohydrocalcite is converted to calcite [94,98]. Some researchers have suggested that the growth rate of calcite is closely related to Mg2+ ions, and always inversely proportional to the Mg concentration [99]. The presence of magnesium ions can inhibit the formation of calcite and keep monohydrocalcite stable. The inhibition of Mg on other Ca–Mg carbonates has also been reported [100]. The crystallinity and particle size of formed monohydrocalcite can decrease with Mg content, which also shows that Mg is a key component in monohydrocalcite [96].
In this study, calcium ions could easily combine with carbonate ions to form calcium carbonate, while Mg–carbonate minerals could not be obtained, even though the Mg2+ ion concentration was eight times the Ca2+ ion concentration. The reason has been explored by many researchers, but it is generally accepted that the stronger hydration shell of Mg with respect to Ca results in Mg–carbonate minerals being difficult to form [101]. The energy that is needed to dehydrate before Mg incorporation into a carbonate crystal is much higher than that for Ca [32,34], which controls the kinetics of crystal growth [102]. Thus, monohydrocalcite precipitation has been favored in the experiments of this study.

4.3. Effects of Different Sources of Mg2+ on Monohydrocalcite Crystal Formation

During the mineral precipitation induced by S. epidermidis reported here, the crystal structure and growth mode of minerals in the MgSO4 medium are significantly different from those in MgCl2 medium. In this study, the crystal density of monohydrocalcite in the MgSO4 medium was higher than that in MgCl2 medium, indicating that different sources of Mg2+, namely the different anions present, did affect the crystal structure and make the cell structure more compact. Besides the hydration membrane covering the surface of the Mg2+ ions, SO42− ions can also adsorb Mg2+ to form ion pairs in the liquid culture medium; thus, this may be the reason that the reaction of Mg2+ ions to displace Ca2+ ions in the mineral lattice was inhibited, and that the effect of Mg2+ on monohydrocalcite in the MgSO4 medium was minor. XRD analysis also shows that the crystallinity of monohydrocalcite in the MgSO4 medium was also higher than that in the MgCl2 medium, which further indicates that Mg2+ ions were able to enter the monohydrocalcite crystal more easily, and so it could affect the crystal cell structure more intensely than in the MgCl2 medium. Fukushi et al. [103] have reported the detailed mechanism of the monohydrocalcite crystal structure becoming looser, due to the displacement by Mg2+ ions in MgCl2 solution. In the structure of monohydrocalcite, Ca atoms are surrounded by two H2O molecules and four CO32−, that is to say, they are surrounded by eight oxygen atoms, including one oxygen atom from two CO32−, two oxygen atoms from two CO32−, and one oxygen atom from two H2O molecules (Figure 11a). If Ca was replaced by a Mg atom in the monohydrocalcite lattice, the arrangement of CO32- and H2O molecules around the Mg2+ would be changed. After the replacement, the crystal structure would be changed from CaO8 polyhedra (Figure 11a) to MgO6 polyhedra (Figure 11b), due to the fact that the rotation and movement of the two CO32− groups, which provided two oxygen atoms for the CaO8 polyhedra [103]. In the MgO6 octahedron, the Mg–O bond lengths (between Mg and O of CO3) are 2.058–2.186 Å, and 2.296–2.411 Å (between Mg and O of H2O), which are significantly smaller than those of Ca–O [103]. In this case, the unit cell of monohydrocalcite was slightly deformed.
The growth mode of crystals also revealed the significant role that was played by different sources of Mg2+. In the MgSO4 solution, the mineral grew in a spiral staircase pattern, while in the MgCl2 solution the mineral grew in a concentric circular pattern. The theory of classical crystallization proposed by Bettina et al. [104] can be applied to the growth mode in this study, and the change of free energy could be the main reason for the crystal spiral growth mode. Growth rates can also influence mineral morphology [105,106]. In this study, the mineral with a shape of concentric circular ring shown in Figure 7c1 was likely formed through the different growth rate in the MgCl2 solution. The inner mineral grew at a quicker rate than the outer mineral, therefore, the inner mineral was composed of a large number of minute crystals without a regular shape, and the outer mineral was aggregated by larger crystals with a rhombohedral shape. EPS composition analysis showed that there were a large number of amino acids. Under alkaline conditions, the cell surface had a large number of negative charges. Therefore, the concentration of Ca2+ ions may be higher on the periphery of the cell aggregation, while being lower away from the cells. The concentration grade of Ca2+ ions may lead to different growth rates of mineral crystals, leading to the formation of concentric circular minerals. There are only a few studies on the growth mode of minerals obtained from different sources of magnesium, and further studies are needed.

5. Conclusions

Different sources of magnesium significantly affected the crystal cell structure in the process of carbonate biomineralization induced by S. epidermidis Y2 bacteria. S. epidermidis Y2 bacteria produced ammonia and CA to increase the pH, and the bicarbonate and carbonate ions released by carbon dioxide hydration catalyzed by CA elevated the supersaturation of minerals to promote the precipitation of carbonates. Calcite was formed in the medium without magnesium. Monohydrocalcite could be precipitated in the MgSO4 medium and the MgCl2 medium at Mg/Ca molar ratios of 2, 4, 6, and 8. The crystal cell density of monohydrocalcite was lower in a MgCl2 medium than that in a MgSO4 medium. The presence of MgSO4 could make monohydrocalcite much denser. The minerals in the MgSO4 medium had a higher crystallinity than those in the MgCl2 group. The crystals grew in the mode of a spiral staircase in the MgSO4 medium, whereas they grew in a concentric circular pattern in the MgCl2 medium. This study may be helpful to further understand biomineralization mechanisms, and may also provide some inferences for the reconstruction of ancient environments.

Author Contributions

Z.H. and H.Y. conceived and designed the experiments; W.Y. and H.Z. performed the experiments; H.Z. and H.Y. analyzed the results of all the experiments; Y.Z. was in charge of calculation; W.Y. and H.Z. wrote the paper. H.Y. and M.E.T. revised the manuscript. All authors read and approved the manuscript.

Funding

This work was supported by the National Natural Science Foundation of China (41772095, U1663201, 41702131), Taishan Scholar Talent Team Support Plan for Advanced & Unique Discipline Areas, Major Scientific and Technological Innovation Projects of Shandong Province (2017CXGC1602, 2017CXGC1603), SDUST Research Fund (2015TDJH101), Natural Science Foundation of Shandong Province (ZR2017BD001), the China Postdoctoral Science Foundation founded project (2016M600548, 2017T100502), Qingdao Postdoctoral Applied Research Project (2015199), the Scientific and Technological Innovation Project financially supported by Qingdao National Laboratory for Marine Science and Technology (No. 2016ASKJ13), Open Fund of the Key Laboratory of Marine Geology and Environment, Chinese Academy of Sciences (No. MGE2016KG10), Postgraduate Science and Technology Innovation Project of Shandong University of Science and Technology (SDKDYC180105, SDKDYC180211).

Conflicts of Interest

The authors declare no conflicts of interest.

References

  1. Bakhshi:, E.; Torab, F.M. Determining Wettability of Fractured Carbonate Reservoirs. Nat. Resour. Res. 2016, 25, 211–225. [Google Scholar] [CrossRef]
  2. Correia, M.G.; Maschio, C.; Schiozer, D.J. Integration of multiscale carbonate reservoir heterogeneities in reservoir simulation. J. Petrol. Sci. Eng. 2015, 131, 34–50. [Google Scholar] [CrossRef]
  3. Chen, J.T.; Van Loon, A.; Han, Z.Z.; Chough, S.K. Funnel-shaped, breccia-filled clastic dykes in the Late Cambrian Chaomidian Formation (Shandong Province, China). Sediment. Geol. 2009, 221, 1–6. [Google Scholar] [CrossRef]
  4. Han, Z.Z.; Meng, R.R.; Yan, H.X.; Zhao, H.; Han, M.; Zhao, Y.Y.; Sun, B.; Sun, Y.B.; Wang, J.; Zhuang, D.X. Calcium carbonate precipitation by Synechocystis sp. PCC6803 at different Mg/Ca molar ratios under the laboratory condition. Carbonates Evaporites 2016, 32, 561–575. [Google Scholar] [CrossRef]
  5. Bose, S.; Chakrabarti, G.; Shome, D. Evolution of Palaeo-Mesoproterozoic open coast ramp-clues from stromatolite-bearing carbonate facies of Vempalle Formation, Cuddapah Basin, India. Arab. J. Geosci. 2017, 10. [Google Scholar] [CrossRef]
  6. Siahi, M.; Hofmann, A.; Hegner, E.; Master, S. Sedimentology and facies analysis of Mesoarchaean stromatolitic carbonate rocks of the Pongola Supergroup, South Africa. Precambrian Res. 2016, 10, 244–264. [Google Scholar] [CrossRef]
  7. Bull, A.T. Microbial Diversity & Bioprospecting; ASM Press: Washington, DC, USA, 2004. [Google Scholar]
  8. Banfield, J.F.; Cervini-Silva, J.; Nealson, K.H. Molecular Geomicrobiology; Mineralogical Society of America: Chantilly, VA, USA, 2005. [Google Scholar]
  9. Dong, H.L. Mineral-microbe interactions: A review. Front. Earth Sci. China 2010, 4, 127–147. [Google Scholar] [CrossRef]
  10. Cassarino, G.; Olzi, E.; Rizzo, R. Bacterially induced mineralization of calcium carbonate in terrestrial environments: The role of exopolysaccharides and amino acids. J. Sediment. Res. 2003, 73, 485–490. [Google Scholar] [CrossRef]
  11. Yoshimura, T.; Tamenori, Y.; Suzuki, A.; Kawahata, H.; Iwasaki, N.; Hasegawa, H.; Luan, T.N.; Kuroyanagi, A.; Yamazaki, T.; Kuroda, J. Altervalent substitution of sodium for calcium in biogenic calcite and aragonite. Geochim. Cosmochim. Acta 2017, 202, 21–38. [Google Scholar] [CrossRef]
  12. Menadakis, M.; Maroulis, G.; Koutsoukos, P.G. Incorporation of Mg2+, Sr2+, Ba2+ and Zn2+ into aragonite and comparison with calcite. J. Math. Chem. 2009, 46, 484–491. [Google Scholar] [CrossRef]
  13. Weiner, S. On Biomineralization; Oxford University Press: Oxford, UK, 1989; pp. 119–130. [Google Scholar]
  14. Han, Z.Z.; Zhuang, D.X.; Yan, H.X.; Zhao, H.; Sun, B.; Li, D.; Sun, Y.W.; Hu, W.Y.; Xuan, Q.Z.; Chen, J.A. Thermogravimetric and kinetic analysis of thermal decomposition characteristics of microbial calcites induced by cyanobacteria Synechocystis sp. PCC6803. J. Therm. Anal. Calorim. 2017, 2017, 1–9. [Google Scholar] [CrossRef]
  15. Benzerara, K.; Skouripanet, F.; Li, J.; Férard, C.; Gugger, M.; Laurent, T.; Couradeau, E.; Ragon, M.; Cosmidis, J.; Menguy, N. Intracellular Ca-carbonate biomineralization is widespread in cyanobacteria. Proc. Natl. Acad. Sci. USA 2014, 111, 10933–10938. [Google Scholar] [CrossRef] [PubMed] [Green Version]
  16. Zhao, H. Biomineralization of Carbonate Minerals Induced by the Halophilic Chromohalobacter israelensis under High Salt Concentrations: Implications for Natural Environments. Minerals 2017, 7. [Google Scholar] [CrossRef]
  17. Sánchez-Román, M.; Rivadeneyra, M.A.; Vasconcelos, C.; McKenzie, J.A. Biomineralization of carbonate and phosphate by moderately halophilic bacteria. FEMS Microbiol. Ecol. 2007, 61, 273–284. [Google Scholar] [CrossRef] [PubMed] [Green Version]
  18. Zhang, F.F.; Xu, H.F.; Shelobolina, E.S.; Converse, B.; Converse, B.; Shen, Z.Z.; Roden, E.E. The catalytic effect of bound extracellular polymeric substances excreted by anaerobic microorganisms on Ca-Mg carbonate precipitation: Implications for the “dolomite problem”. Am. Mineral. 2015, 100, 483–494. [Google Scholar] [CrossRef]
  19. Han, Z.Z.; Zhao, Y.Y.; Yan, H.X.; Zhao, H.; Han, M.; Sun, B.; Sun, X.Y.; Hou, F.F.; Sun, H.; Han, L. Struvite Precipitation Induced by a Novel Sulfate-Reducing Bacterium Acinetobacter calcoaceticus SRB4 Isolated from River Sediment. Geomicrobiol. J. 2015, 32, 868–877. [Google Scholar] [CrossRef]
  20. Kenward, P.A.; Goldstein, R.H.; González, L.A.; Roberts, J.A. Precipitation of low-temperature dolomite from an anaerobic microbial consortium: The role of methanogenic Archaea. Geobiology 2009, 7, 556–565. [Google Scholar] [CrossRef] [PubMed]
  21. Barnes, R.; Goldberg, E. Methane production and consumption in anoxic marine sediments. Geology 1976, 4, 297–300. [Google Scholar] [CrossRef]
  22. Douglas, S.; Yang, H.X. Mineral biosignatures in evaporites: Presence of rosickyite in an endoevaporitic microbial community from Death Valley, California. Geology 2002, 30, 1075–1078. [Google Scholar] [CrossRef]
  23. Knauth, L.P. Salinity history of the Earth’s early ocean. Nature 1998, 395, 554–555. [Google Scholar] [CrossRef]
  24. Chen, J.T.; Chough, S.K.; Lee, J.H.; Han, Z.Z. Sequence-stratigraphic comparison of the upper Cambrian Series 3 to Furongian succession between the Shandong region, China and the Taebaek area, Korea: High variability of bounding surfaces in an epeiric platform. Geosci. J. 2012, 16, 357–379. [Google Scholar] [CrossRef]
  25. Han, Z.Z.; Zhang, X.L.; Chi, N.J.; Han, M.; Woo, J.; Lee, H.S.; Chen, J.T. Cambrian oncoids and other microbial-related grains on the North China Platform. Carbonates Evaporites 2015, 30, 373–386. [Google Scholar] [CrossRef]
  26. Han, Z.Z.; Yan, H.X.; Zhou, S.X.; Zhao, H.; Zhang, Y.; Zhang, N.N.; Yao, C.K.; Zhao, L.; Han, C.Y. Precipitation of calcite induced by Synechocystis sp. PCC6803. World J. Microbiol. Biotechnol. 2013, 29, 1801–1811. [Google Scholar] [CrossRef] [PubMed]
  27. Han, Z.Z.; Yan, H.X.; Zhao, H.; Zhou, S.X.; Han, M.; Meng, X.Q. Bio-precipitation of Calcite with Preferential Orientation Induced by sp. PCC6803. Geomicrobiol. J. 2014, 31, 884–899. [Google Scholar] [CrossRef]
  28. Rivadeneyra, M.A.; Delgado, G.; Soriano, M.; Ramos-Cormenzana, A.; Delgado, R. Precipitation of carbonates by Nesterenkonia halobia in liquid media. Chemosphere 2000, 41, 617–624. [Google Scholar] [CrossRef] [Green Version]
  29. Rivadeneyra, M.A.; Delgado, R.; Moral, A.D.; Ferrer, M.R.; Ramos-Cormenzana, A. Precipatation of calcium carbonate by Vibrio spp. from an inland saltern. FEMS Microbiol. Ecol. 1994, 13, 197–204. [Google Scholar] [CrossRef]
  30. Parraga, J.; Rivadeneyra, M.A.; Delgado, R.; Iniguez, J.; Soriano, M.; Delgado, G. Study of biomineral formation by bacteria from soil solution equilibria. React. Funct. Polym. 1998, 36, 265–271. [Google Scholar] [CrossRef]
  31. Ferrer, M.R.; Quevedo-Sarmiento, J.; Bejar, V.; Delgado, R.; Ramos-Cormenzana, A.; Rivadeneyra, M.A. Calcium carbonate formation by Deleya halophila: Effect of salt concentration and incubation temperature. Geomicrobiol. J. 1988, 6, 49–57. [Google Scholar] [CrossRef]
  32. Qiu, X.; Wang, H.M.; Yao, Y.C.; Duan, Y. High salinity facilitates dolomite precipitation mediated by Haloferax volcanii DS52. Earth Planet. Sci. Lett. 2017, 472, 197–205. [Google Scholar] [CrossRef]
  33. Qiu, X.; Yao, Y.C.; Wang, H.M.; Duan, Y. Live microbial cells adsorb Mg2+ more effectively than lifeless organic matter. Front. Earth Sci. 2018, 12, 160–169. [Google Scholar] [CrossRef]
  34. Deng, S.C.; Dong, H.L.; Lv, G.; Jiang, H.C.; Yu, B.S.; Bishop, M.E. Microbial dolomite precipitation using sulfate reducing and halophilic bacteria: Results from Qinghai Lake, Tibetan Plateau, NW China. Chem. Geol. 2010, 278, 151–159. [Google Scholar] [CrossRef]
  35. Grasby, S. Naturally precipitating vaterite (μ-CaCO3) spheres: Unusual carbonates formed in an extreme environment. Geochim. Cosmochim. Acta 2003, 67, 1659–1666. [Google Scholar] [CrossRef]
  36. Wei, S.P.; Cui, H.P.; Jiang, Z.L.; Liu, H.; He, H.; Fang, N.Q. Biomineralization processes of calcite induced by bacteria isolated from marine sediments. Braz. J. Microbiol. 2015, 46, 455–464. [Google Scholar] [CrossRef] [PubMed] [Green Version]
  37. Zhuang, D.X.; Yan, H.X.; Tucker, M.E.; Zhao, H.; Han, Z.Z.; Zhao, Y.H.; Sun, B.; Li, D.; Pan, J.T.; Zhao, Y.Y.; et al. Calcite precipitation induced by Bacillus cereus MRR2 cultured at different Ca2+ concentrations: Further insights into biotic and abiotic calcite. Chem. Geol. 2018. [Google Scholar] [CrossRef]
  38. Han, Z.Z.; Zhao, Y.Y.; Yan, H.X.; Zhao, H.; Han, M.; Sun, B.; Meng, R.R.; Zhuang, D.X.; Li, D.; Gao, W.J. The Characterization of Intracellular and Extracellular Biomineralization Induced by Synechocystis sp. PCC6803 Cultured under Low Mg/Ca Ratios Conditions. Geomicrobiol. J. 2017, 34, 362–373. [Google Scholar] [CrossRef]
  39. Thatcher, B.; Doherty, A.; Orvisky, E.; Martin, B.; Henkin, R. Gustin from human parotid saliva is carbonic anhydrase VI. Biochem. Biophys. Res. Commun. 1998, 250, 635–641. [Google Scholar] [CrossRef]
  40. Lindskog, S. Structure and mechanism of carbonic anhydrase. Pharmacol. Ther. 1997, 74, 1–20. [Google Scholar] [CrossRef]
  41. Li, W.; Liu, L.P.; Chen, W.S.; Yu, L.J.; Li, W.B.; Yu, H.Z. Calcium carbonate precipitation and crystal morphology induced by microbial carbonic anhydrase and other biological factors. Process Biochem. 2010, 45, 1017–1021. [Google Scholar] [CrossRef]
  42. Favre, N.; Christ, M.L.; Pierre, A.C. Biocatalytic capture of CO2 with carbonic anhydrase and its transformation to solid carbonate. J. Mol. Catal. B-Enzym. 2009, 60, 163–170. [Google Scholar] [CrossRef]
  43. Sánchez-Román, M.; Romanek, C.S.; Fernández-Remolar, D.C.; Sánchez-Navas, A.; Mckenzie, J.A.; Pibernat, R.A.; Vasconcelos, C. Aerobic biomineralization of Mg-rich carbonates: Implications for natural environments. Chem. Geol. 2011, 281, 143–150. [Google Scholar] [CrossRef] [Green Version]
  44. Perri, E.; Tucker, M.E.; Słowakiewicz, M.; Whitaker, F.; Bowen, L.; Perrotta, I.D. Carbonate and silicate biomineralization in a hypersaline microbial mat (Mesaieed sabkha, Qatar): Roles of bacteria, extracellular polymeric substances and viruses. Sedimentology 2018, 65, 1213–1245. [Google Scholar] [CrossRef]
  45. Morgan, J.W.; Forster, C.F.; Evison, L. A comparative study of the nature of biopolymers extracted from anaerobic and activated sludges. Water Res. 1990, 24, 743–750. [Google Scholar] [CrossRef]
  46. Chen, Y.; Niu, M.; Yuan, S.; Teng, H. Durable antimicrobial finishing of cellulose with QSA silicone by supercritical adsorption. Appl. Surf. Sci. 2013, 264, 171–175. [Google Scholar] [CrossRef]
  47. Liu, Q.Y.; Zhu, J.Q.; Sun, T.; Zhou, H.Y.; Shao, Q.; Li, G.J.; Liu, X.D.; Yin, Y.S. Porphyrin nanotubes composed of highly ordered molecular arrays prepared by anodic aluminum template method. RSC Adv. 2013, 3, 2765–2769. [Google Scholar] [CrossRef]
  48. Zhou, S.X.; Chen, H.P.; Ding, C.; Niu, H.L.; Zhang, T.H.; Wang, N.F.; Zhang, Q.Q.; Liu, D.; Han, S.N.; Yu, H.G. Effectiveness of crystallitic carbon from coal as milling aid and for hydrogen storage during milling with magnesium. Fuel 2013, 109, 68–75. [Google Scholar] [CrossRef]
  49. Zhou, S.X.; Chen, H.P.; Ran, W.X.; Wang, N.F.; Han, Z.Y.; Zhang, Q.Q.; Zhang, X.L.; Niu, H.L.; Yu, H.; Liu, D. Effect of carbon from anthracite coal on decomposition kinetics of magnesium hydride. J. Alloys Compd. 2014, 592, 231–237. [Google Scholar] [CrossRef]
  50. Chen, Y.; Meng, Q.S.; Wu, M.Y.; Wang, S.G.; Xu, P.F.; Chen, H.R.; Li, Y.R.; Zhang, L.X.; Wang, L.X.; Shi, J.L. Hollow mesoporous organosilica nanoparticles: A generic intelligent framework-hybridization approach for biomedicine. J. Am. Chem. Soc. 2014, 136, 16326–16334. [Google Scholar] [CrossRef] [PubMed]
  51. Huang, Y.Q.; Zhao, Q.; Wang, Y.H.; Ge, S.S.; Shao, Q. A New Layered Six-Connected Network Based on Tetranuclear Copper(II) Cores. J. Chem. Crystallogr. 2012, 42, 706–710. [Google Scholar] [CrossRef]
  52. Zhao, B.Q.; Shao, Q.; Hao, L.H. Yeast-template synthesized Fe-doped cerium oxide hollow microspheres for visible photodegradation of acid orange 7. J. Colloid Interface Sci. 2018, 511, 39–47. [Google Scholar] [CrossRef] [PubMed]
  53. Huang, J.N.; Cao, Y.H.; Shao, Q.; Peng, X.F.; Guo, Z.H. Magnetic Nanocarbon Adsorbents with Enhanced Hexavalent Chromium Removal: Morphology Dependence of Fibrillar vs Particulate Structures. Ind. Eng. Chem. Res. 2017, 56, 10689–10701. [Google Scholar] [CrossRef]
  54. Wu, Z.J.; Gao, S.; Chen, L.; Jiang, D.W.; Shao, Q.; Zhang, B.; Zhai, Z.H.; Wang, C.; Zhao, M.; Ma, Y.Y. Electrically Insulated Epoxy Nanocomposites Reinforced with Synergistic Core–Shell SiO2@MWCNTs and Montmorillonite Bifillers. Macromol. Chem. Phys. 2017, 218, 1700357. [Google Scholar] [CrossRef]
  55. Chen, Y.; Han, Q.X.; Wang, Y.L.; Zhang, Q.; Qiao, X.X. Synthesis of pyridinium polysiloxane for antibacterial coating in supercritical carbon dioxide. J. Appl. Polym. Sci. 2015, 132. [Google Scholar] [CrossRef]
  56. Zhao, J.k.; Ge, S.S.; Liu, L.R.; Shao, Q.; Mai, X.M.; Zhao, C.X.; Hao, L.H.; Wu, T.T.; Yu, Z.P.; Guo, Z.H. Microwave Solvothermal Fabrication of Zirconia Hollow Microspheres with Different Morphologies Using Pollen Templates and Their Dye Adsorption Removal. Ind. Eng. Chem. Res. 2018, 57, 231–241. [Google Scholar] [CrossRef]
  57. Wu, T.M.; Lin, Y.W. Doped polyaniline/multi-walled carbon nanotube composites: Preparation, characterization and properties. Polymer 2006, 47, 3576–3582. [Google Scholar] [CrossRef]
  58. Liu, Q.; Zhao, Q.; Li, Y.; Wang, X. CdCl2 center dot H2O nanorods oriented parallel on the Langmuir film of (phthalocyaninato) [tetrakis(4-pyridyl)porphyrinato] cerium complex. CrystEngComm 2012, 14, 1105–1110. [Google Scholar] [CrossRef]
  59. Ge, S.S.; Yang, X.K.; Shao, Q.; Liu, Q.Y.; Wang, T.J.; Wang, L.Y.; Wang, X.J. Self-assembled flower-like antimony trioxide microstructures with high infrared reflectance performance. J. Solid State Chem. 2013, 200, 136–142. [Google Scholar] [CrossRef]
  60. Liu, X.; Shao, X.Y.; Fang, G.B.; He, H.F.; Wan, Z.G. Preparation and properties of chemically reduced graphene oxide/copolymer-polyamide nanocomposites. E-Polymers 2017, 17, 3–14. [Google Scholar] [CrossRef]
  61. Tian, J.Y.; Shao, Q.; Dong, X.J.; Zheng, J.L.; Pan, D.; Zhang, X.Y.; Cao, H.L.; Hao, L.H.; Liu, J.R.; Mai, X.M.; et al. Bio-template synthesized NiO/C hollow microspheres with enhanced Li-ion battery electrochemical performance. Electrochim. Acta 2018, 261, 236–245. [Google Scholar] [CrossRef]
  62. He, M.S.; Jin, H.; Zhang, L.L.; Jiang, H.; Yang, T.; Cui, H.Z.; Fossard, F.; Wagner, J.B.; Karppinen, M.; Kauppinen, E.I.; et al. Environmental transmission electron microscopy investigations of Pt-Fe2O3 nanoparticles for nucleating carbon nanotubes. Carbon 2016, 110, 243–248. [Google Scholar] [CrossRef]
  63. Liu, Q.Y.; Yang, Y.T.; Li, H.; Zhu, R.R.; Shao, Q.; Yang, S.G.; Xu, J.J. NiO nanoparticles modified with 5,10,15,20-tetrakis(4-carboxyl pheyl)-porphyrin: Promising peroxidase mimetics for H2O2 and glucose detection. Biosens. Bioelectron. 2015, 64, 147–153. [Google Scholar] [CrossRef]
  64. Liu, Q.Y.; Zhu, J.Q.; Shao, Q.; Fan, J.F.; Wang, D.M.; Yina, Y.S. Highly ordered arrangement of -tetrakis (4-aminophenyl) porphyrin in self-assembled nanoaggregates hydrogen bonding. Chin. Chem. Lett. 2014, 25, 752–756. [Google Scholar] [CrossRef]
  65. Wu, T.H.; Shao, Q.; Ge, S.S. The facile preparation of novel magnetic zirconia composites with the aid of carboxymethyl chitosan and their efficient removal of dye. RSC Adv. 2016, 6, 58020–58027. [Google Scholar] [CrossRef]
  66. Ge, S.S.; Zhu, W.X.; Shao, Q. Fabrication and Characterization of Hollow Zirconia Microspheres Using Calcium Carbonate as Template. Z. Phys. Chem. 2016, 230, 1617–1628. [Google Scholar] [CrossRef]
  67. Wang, D.M.; Cao, W.B.; Fan, J. Synthesis and luminescence properties of the europium quaternary complexes nanoparticles. Sci. China Chem. 2014, 57, 791–796. [Google Scholar] [CrossRef]
  68. Han, Z.Z.; Sun, B.; Zhao, H.; Yan, H.X.; Han, M.; Zhao, Y.Y.; Meng, R.R.; Zhuang, D.X.; Li, D.; Ma, Y.T. Isolation of Leclercia adcarboxglata Strain JLS1 from Dolostone Sample and Characterization of its Induced Struvite Minerals. Geomicrobiology 2016, 34, 500–510. [Google Scholar] [CrossRef]
  69. Dhami, N.K.; Reddy, M.S.; Mukherjee, A. Synergistic role of bacterial urease and carbonic anhydrase in carbonate mineralization. Appl. Biochem. Biotechnol. 2014, 172, 2552–2561. [Google Scholar] [CrossRef] [PubMed]
  70. Margesin, R.; Schinner, F. Potential of halotolerant and halophilic microorganisms for biotechnology. Extremophiles 2001, 5, 73–83. [Google Scholar] [CrossRef] [PubMed]
  71. Schultzelam, S.; Harauz, G.; Beveridge, T.J. Participation of a cyanobacterial S layer in fine-grain mineral formation. J. Bacteriol. 1992, 174, 7971–7981. [Google Scholar] [CrossRef]
  72. Badger, M.R.; Price, G.D. CO2 concentrating mechanisms in cyanobacteria: Molecular components, their diversity and evolution. J. Exp. Bot. 2003, 54, 609–622. [Google Scholar] [CrossRef]
  73. Smith, K.S.; Ferry, J.G. Prokaryotic carbonic carbonic anhydrases. FEMS Microbiol. Rev. 2000, 24, 335–366. [Google Scholar] [CrossRef]
  74. Faridi, S.; Satyanarayana, T. Characteristics of recombinant α-carbonic anhydrase of polyextremophilic bacterium Bacillus halodurans TSLV1. Int. J. Biol. Macromol. 2016, 89, 659–668. [Google Scholar] [CrossRef]
  75. Dreybrodt, W.; Eisenlohr, L.; Madry, B.; Ringer, S. Precipitation kinetics of calcite in the system CaCO3–H2O–CO2: The conversion to CO2 by the slow process H++HCO3 → CO2+H2O as a rate limiting step. Geochim. Cosmochim. Acta 1997, 61, 3897–3904. [Google Scholar] [CrossRef]
  76. Liu, N.; Bond, G.M.; Abel, A.; Mcpherson, B.J.; Stringer, J. Biomimetic sequestration of CO2 in carbonate form: Role of produced waters and other brines. Fuel Process. Technol. 2005, 86, 1615–1625. [Google Scholar] [CrossRef]
  77. Li, W.; Chen, W.S.; Zhou, P.P.; Cao, L.; Yu, L.J. Influence of initial pH on the precipitation and crystal morphology of calcium carbonate induced by microbial carbonic anhydrase. Colloids Surf. B. 2013, 102, 281–287. [Google Scholar] [CrossRef]
  78. Kim, I.G.; Jo, B.H.; Kang, D.G.; Kim, C.S.; Choi, Y.S.; Cha, H.J. Biomineralization-based conversion of carbon dioxide to calcium carbonate using recombinant carbonic anhydrase. Chemosphere 2012, 87, 1091–1096. [Google Scholar] [CrossRef]
  79. Bond, G.M.; Liu, N. Biomimetic Sequestration of CO2 in Carbonate Form:Role of Produced Waters and Other Brines. Prepr. Symp. Am. Chem. Soc. Div. Fuel Chem. 2004, 49, 420–421. [Google Scholar]
  80. Sundaram, S.; Thakur, I.S. Induction of calcite precipitation through heightened production of extracellular carbonic anhydrase by CO2 sequestering bacteria. Bioresour. Technol. 2018, 253, 368–371. [Google Scholar] [CrossRef] [PubMed]
  81. Mirjafari, P.; Asghari, K.; Mahinpey, N. Investigating the Application of Enzyme Carbonic Anhydrase for CO2 Sequestration Purposes. Ind. Eng. Chem. Res. 2007, 46, 921–926. [Google Scholar] [CrossRef]
  82. Srivastava, S.; Bharti, R.K.; Verma, P.K.; Thakur, I.S. Cloning and expression of gamma carbonic anhydrase from Serratia sp. ISTD04 for sequestration of carbon dioxide and formation of calcite. Bioresour. Technol. 2015, 188, 209–213. [Google Scholar] [CrossRef]
  83. Ramanan, R.; Kannan, K.; Vinayagamoorthy, N.; Ramkumar, K.M.; Sivanesan, S.D.; Chakrabarti, T. Purification and characterization of a novel plant-type carbonic anhydrase from Bacillus subtilis. Biotechnol. Bioprocess Eng. 2009, 14, 32–37. [Google Scholar] [CrossRef]
  84. Rodriguez-Blanco, J.D.; Diego, J.; Shaw, S.; Bots, P.; Roncal-Herrero, T.; Benning, L.G. The role of Mg in the crystallization of monohydrocalcite. Geochim. Cosmochim. Acta 2014, 127, 204–220. [Google Scholar] [CrossRef] [Green Version]
  85. Ito, T. The occurrence of monohydrocalcite from calcareous sinter of cold spring of Shiowakka, Asyoro, Hokkaido. J. Mineral. Petrol. Econ. Geol. 1993, 88, 485–491. [Google Scholar] [CrossRef]
  86. Onac, B. Mineralogical studies and Uranium-series dating of speleothems from Scåri¿oara Glacier Cave (Bihor Mountains, Romania). Theor. Appliedkarstol. 2001, 13–14, 33–38. [Google Scholar]
  87. Solotchina, E.P.; Prokopenko, A.A.; Kuzmin, M.I.; Solotchin, P.A.; Zhdanova, A.N. Climate signals in sediment mineralogy of Lake Baikal and Lake Hovsgol during the LGM-Holocene transition and the 1-Ma carbonate record from the HDP-04 drill core. Quat. Int. 2009, 205, 38–52. [Google Scholar] [CrossRef]
  88. Lowenstam, H.A. Minerals formed by organisms. Science 1981, 211, 1126–1131. [Google Scholar] [CrossRef] [PubMed]
  89. Señorale-Pose, M.; Chalar, C.; Dauphin, Y.; Massard, P.; Pradel, P.; Marín, M. Monohydrocalcite in calcareous corpuscles of Mesocestoides corti. Exp. Parasitol. 2008, 118, 54–58. [Google Scholar] [CrossRef] [PubMed]
  90. Carlström, D. A crystallographic study of vertebrate otoliths. Biol. Bull. 1963, 125, 441–463. [Google Scholar] [CrossRef]
  91. Catherine, H.; Skinner, W.; Osbaldiston, G.W.; Wilner, A.N. Monohydrocalcite in a guinea pig bladder stone, a novel occurrence. Am. Mineral. 1977, 62, 273–277. [Google Scholar]
  92. Garvie, L.A.J. Decay of cacti and carbon cycling. Naturwissenschaften 2006, 93, 114–118. [Google Scholar] [CrossRef]
  93. Garvie, L.A.J. Decay-induced biomineralization of the saguaro cactus (Carnegiea gigantea). Am. Mineral. 2003, 88, 1879–1888. [Google Scholar] [CrossRef]
  94. Taylor, G.F. The occurrence of monohydrocalcite in two small lakes in the South-East of South Australia. Am. Mineral. 1975, 60, 690–697. [Google Scholar]
  95. Rivadeneyra, M.A.; Párraga, J.; Delgado, R.; Ramos-Cormenzana1, A.; Delgado, G. Biomineralization of carbonates by Halobacillus trueperi in solid and liquid media with different salinities. FEMS Microbiol. Ecol. 2004, 48, 39–46. [Google Scholar] [CrossRef] [PubMed] [Green Version]
  96. Nishiyama, R.; Munemoto, T.; Fukushi, K. Formation condition of monohydrocalcite from CaCl2 –MgCl2 –Na2CO3 solutions. Geochim. Cosmochim. Acta 2013, 100, 217–231. [Google Scholar] [CrossRef]
  97. Last, F.M.; Last, W.M.; Halden, N.M. Carbonate microbialites and hardgrounds from Manito Lake, an alkaline, hypersaline lake in the northern Great Plains of Canada. Sediment. Geol. 2010, 225, 34–49. [Google Scholar] [CrossRef]
  98. Stoffers, P.; Fischbeck, R. Monohydrocalcite in the sediments of Lake Kivu (East Africa). Sedimentology 1974, 21, 163–170. [Google Scholar] [CrossRef]
  99. Zhang, Y.; Dawe, R.A. Influence of Mg2+ on the kinetics of calcite precipitation and calcite crystal morphology. Chem. Geol. 2000, 163, 129–138. [Google Scholar] [CrossRef]
  100. Davis, K.; Dove, P.; De Yoreo, J. The role of Mg2+ as an impurity in calcite growth. Science 2000, 290, 1134–1137. [Google Scholar] [CrossRef]
  101. Moomaw, A.S. The unique nature of Mg2+ channels. Physiology 2008, 23, 275–285. [Google Scholar] [CrossRef]
  102. Mucci, A.; Morse, J.W. The incorporation of Mg2+ and Sr2+ into calcite overgrowths: Influences of growth rate and solution composition. Geochim. Cosmochim. Acta 1983, 47, 217–233. [Google Scholar] [CrossRef]
  103. Fukushi, K.; Suzuki, Y.; Kawano, J.; Ohno, T.; Ogawa, M.; Yaji, T.; Takahashi, Y. Speciation of magnesium in monohydrocalcite: XANES, ab initio and geochemical modeling. Geochim. Cosmochim. Acta 2017, 213, 457–474. [Google Scholar] [CrossRef]
  104. Ludi, B.; Niederberger, M. Zinc oxide nanoparticles: Chemical mechanisms and classical and non-classical crystallization. Dalton Trans. 2013, 42, 12554–12568. [Google Scholar] [CrossRef] [PubMed]
  105. Morse, J.W.; Given, R.K.; Wilkinson, B.H. Kinetic control of morphology, composition, and mineralogy of abiotic sedimentary carbonates; discussion and reply. Science 1985, 55, 109–119. [Google Scholar] [CrossRef]
  106. Fernández-Díaz, L.; Putnis, A.; Prieto, M.; Putnis, C.V. The role of magnesium in the crystallization of calcite and aragonite in a porous medium. J. Intercul. Stud. 1996, 15, 73–84. [Google Scholar]
Figure 1. Phylogenetic tree of S. epidermidis Y2 based on the sequence alignment.
Minerals 08 00594 g001
Figure 2. The colony morphology and the ammonia test of the S. epidermidis Y2 strain: (a) the colony morphology of S. epidermidis Y2; (b) the color before adding Nessler’s reagent; (c) the color after adding Nessler’s reagent. Dark yellow or brown shows the ammonia test result is positive. Light yellow shows the color of Nessler’s reagent. The ammonia test shows that ammonia has been released by S. epidermidis Y2 strain.
Minerals 08 00594 g002
Figure 3. Physiological and biochemical characteristics of S. epidermidis Y2 bacteria. (a) Growth curve of S. epidermidis Y2 bacteria at different sodium chloride concentrations after being cultivated for 24 h; (b) Growth curve and pH curve; (c) carbonic anhydrase (CA) activity; (d) Carbonate and bicarbonate ion concentrations in the culture medium.
Minerals 08 00594 g003aMinerals 08 00594 g003b
Figure 4. Amino acid composition of extracellular polymers (EPS) from S. epidermidis Y2.
Minerals 08 00594 g004
Figure 5. X-ray powder diffraction (XRD) images of minerals in the experimental groups. (a) the minerals in the MgSO4 medium; (b) the minerals in the MgCl2 group.
Minerals 08 00594 g005
Figure 6. SEM and EDS analyses of minerals in the MgSO4 medium at different Mg/Ca ratios. (a1,a2) Mg/Ca ratio of 0; (b1b4) Mg/Ca ratio of 2; (c1c4) Mg/Ca ratio of 4; (d1,d2) Mg/Ca ratio of 6; (e1e3) Mg/Ca ratio of 8.
Minerals 08 00594 g006
Figure 7. SEM and EDS analyses of minerals in MgCl2 medium at different Mg/Ca ratios. (a1a3) Mg/Ca ratio of 0; (b1b3) Mg/Ca ratio of 2; (c1c3) Mg/Ca ratio of 4; (d1d4) Mg/Ca ratio of 6; (e1e5) Mg/Ca ratio of 8.
Minerals 08 00594 g007aMinerals 08 00594 g007b
Figure 8. HRTEM and SAED analyses of S. epidermidis Y2 bacterial super-thin slices. (a1a4) Mg/Ca ratio of 0; (b1,b2) Mg/Ca ratio of 2 in the MgSO4 medium; (c1,c2) Mg/Ca ratio of 4 in the MgSO4 medium; (d1,d2) Mg/Ca ratio of 6 in the MgSO4 medium; (e1,e2) Mg/Ca ratio of 8 in the MgSO4 medium; (b3,b4) Mg/Ca ratio of 2 in the MgCl2 medium; (c3,c4) Mg/Ca ratio of 4 in the MgCl2 medium; (d3,d4) Mg/Ca ratio of 6 in the MgCl2 medium; (e3,e4) Mg/Ca ratio of 8 in the MgCl2 medium; (f1f4) Seed liquid.
Minerals 08 00594 g008
Figure 9. Shrinking and normal S. epidermidis Y2 cells as analyzed by HRTEM. (ac) Shrinking cells of S. epidermidis Y2; (df) Normal cells of S. epidermidis Y2.
Minerals 08 00594 g009
Figure 10. STEM and EDS analyses of the ultrathin slices of S. epidermidis Y2. The intracellular light area marked by a red circle is the research target. (a1) TEM of S. epidermidis Y2; (a2) STEM at Mg/Ca ratio of 0; (a3) EDS of Ca at Mg/Ca ratio of 0; (b1) STEM of S. epidermidis Y2 at Mg/Ca ratio of 4 in the MgSO4 medium; (b2,b3) EDS of Ca and Mg at Mg/Ca ratio of 4 in the MgSO4 medium, respectively; (c1) STEM of S. epidermidis Y2 at Mg/Ca ratio of 8 in the MgSO4 medium; (c2,c3) EDS of Ca and Mg at Mg/Ca ratio of 8 in the MgSO4 medium, respectively; (d1) STEM of S. epidermidis Y2 at Mg/Ca ratio of 4 in the MgCl2 medium; (d2,d3) EDS of Ca and Mg at Mg/Ca ratio of 4 in the MgCl2 medium, respectively; (e1) STEM of S. epidermidis Y2 at Mg/Ca ratio of 8 in the MgCl2 medium; (e2,e3) EDS of Ca and Mg at Mg/Ca ratio of 8 in the MgCl2 medium, respectively.
Minerals 08 00594 g010
Figure 11. Local arrangements of monohydrocalcite provided by Fukushi et al. (2017). (a) The standard crystal structure of monohydrocalcite, CaO8 polyhedron; (b) the changed crystal structure after replacement by a Mg atom, a MgO6 polyhedron. The red spheres represent O, gray spheres denote C, white denotes H from H2O, yellow denotes Ca, and blue denotes Mg.
Minerals 08 00594 g011
Table 1. pH of the Na2CO3 solution from 72 h to 120 h.
Time (h)CO32− (mol/L)Na2CO3 (g/100 mL)pH
720.00350.037110.80
870.0080.084811.01
920.0120.127211.08
1110.0220.233211.20
1200.02550.270311.22

